2.1. Features of Gold Supported on Zirconia and Sulfated Zirconia
Zirconia and sulfated zirconia [
5] were used as supports for gold-based catalysts. We choose zirconia because it is of particular interest in a large field of applications, as it possesses desirable characteristics such as tunable surface acidity/basicity, redox properties, porosity, and surface area. In particular, sulfating zirconia causes not only modifications of the acid properties, but also affects surface features: sulfates retard crystallization, stabilize the tetragonal phase, improve surface area and pores size [
6]. Au/ZrO
2 materials are of significant interest as catalysts for CO oxidation [
7], butadiene hydrogenation [
8], epoxidation of styrene [
9], low-temperature water–gas shift (LT-WGS) reaction [
10,
11,
12]. Supports and gold samples were analyzed by physisorption analyses and ion exchange chromatography, and the results are reported in
Table 1. As already known, the effect of sulfate addition on zirconium oxide is to increase its surface area and reduce the mean pore size, shifting crystallization processes towards higher temperatures during calcination treatment [
13]. Surface area and porosity are very similar for the supports and the corresponding catalysts, proving that they are not modified by the gold DP technique.
As regards the amount of sulfates on the supports, it is due to the maximum value of anions that the oxide can keep under the calcination conditions [
14]. In fact, it is known that the elimination of sulfates occurs during the calcination step, and that the SO
42− amount that remains at the end of this process is strictly connected with both the initial charged SO
42− amount and the calcination conditions. Conversely, the final catalysts no longer contain sulfates [
15,
16]. This is not unexpected, since the methodology of gold DP on the support has been carried out at a basic pH, and the detachment of sulfate groups has occurred. Such SO
42− dissolution had been previously demonstrated by quantitative IC analyses [
17].
However, we have previously demonstrated [
16] that sulfate addition to zirconia means a twofold advantage: (i) higher surface area; (ii) higher gold dispersion due to the positive role of SO
4= groups that address the deposition of Au in the form of highly dispersed clusters in close contact with the support.
Table 1.
Textural properties of the supports.
Table 1.
Textural properties of the supports.
| Sample | Nominal SO42− (wt%) | Found SO42− (wt%) | Surface area (m2/g) | Pore diameter (nm) |
|---|
| Z | 0 | 0 | 40 | 21 |
| SZ1 | 1 | 1.0 | 79 | 11 |
| SZ2 | 2 | 2.0 | 93 | 8.9 |
| SZ4 | 4 | 3.6 | 115 | 7.0 |
| SZ8 | 8 | 4.0 | 119 | 6.7 |
2.2. Stability of the Catalysts under Storage Conditions
Conditions of storage are critical for gold-based catalysts, as has been already discussed [
18,
19,
20,
21]. Two predominant effects have been identified: (i) the effect of light, which during storage as well as during synthesis can cause photodecomposition of cationic gold to Au
0; (ii) the effect of temperature, which can cause a slow aggregation of precursor species, giving large particles of Au
0 when reduction occurs. Therefore it is well known that storage in the dark and in a refrigerator is recommended for gold-based samples. In our work we have always used these devices. We have furthermore investigated the effect of calcination on stability under storage condition. HRTEM analysis was performed on both calcined at 453 K and not calcined 1AuSZ2 samples, as reported in
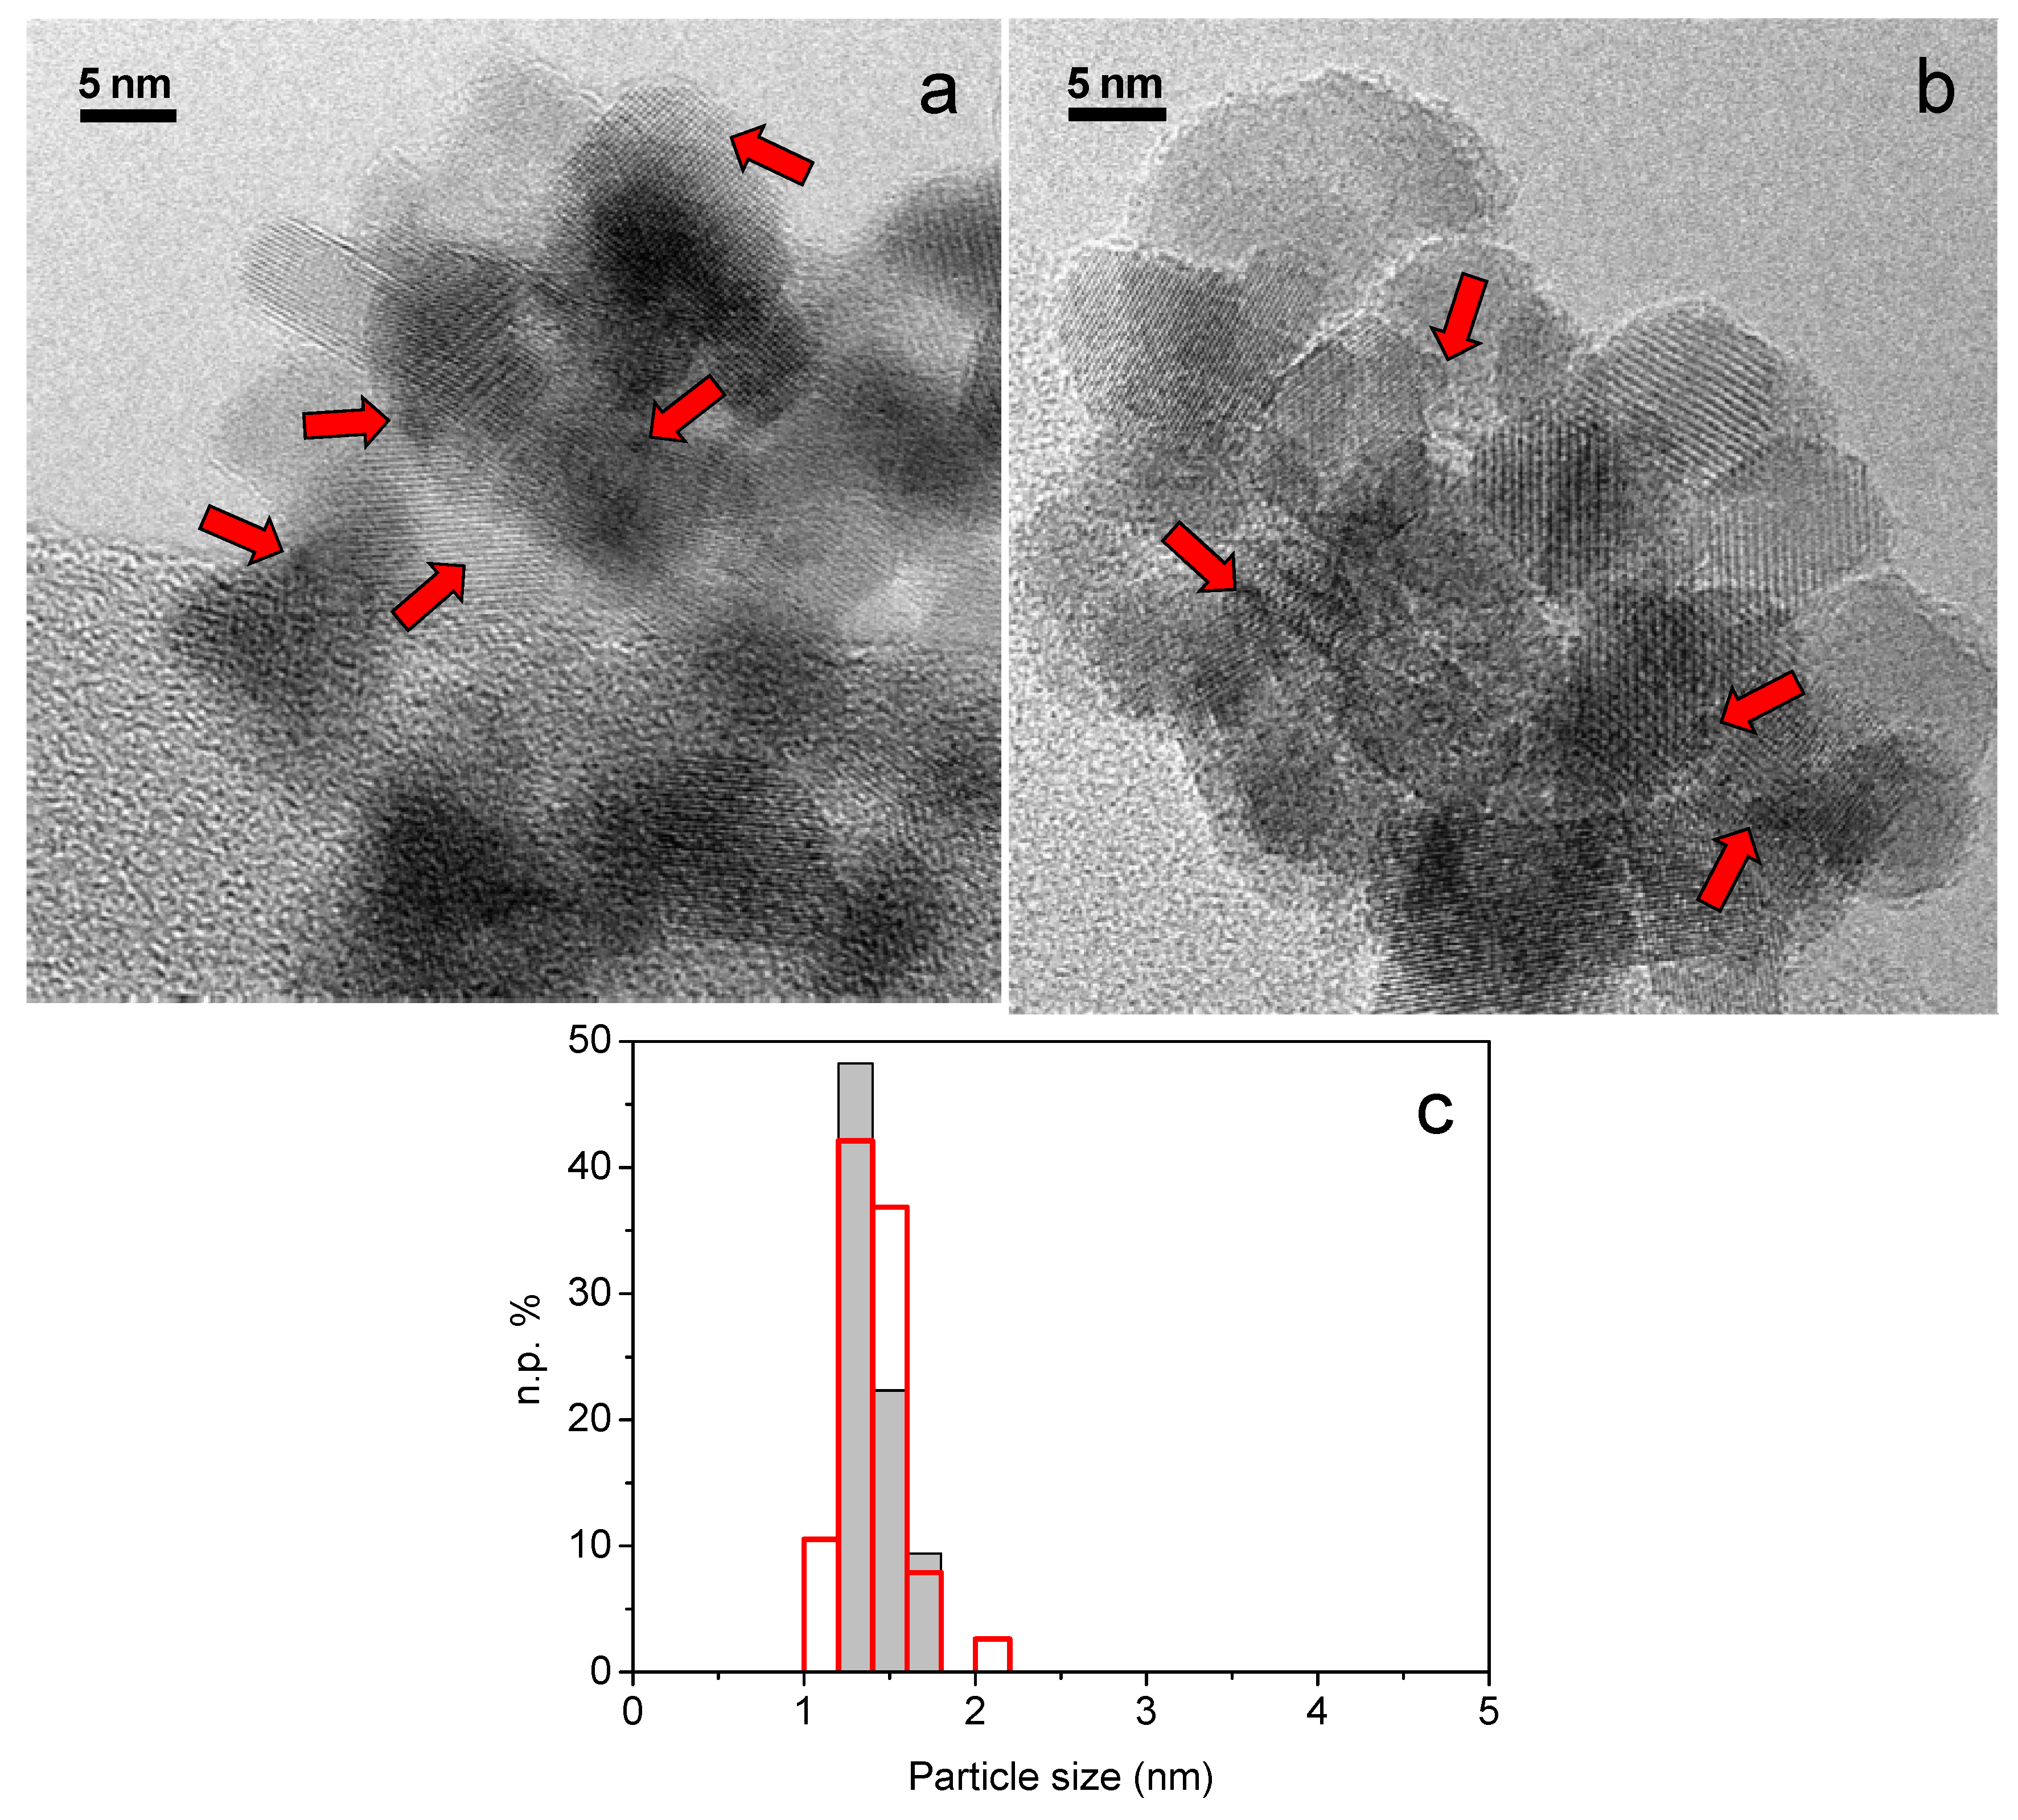
Figure 1a,b, by collecting a representative total number of images (45 and 46 images, respectively) in order to describe accurately the morphology of the samples. More precisely, the measurements revealed that, due to the very high dispersion, Au particles were not easily recognized, especially in the case of non-calcined 1AuSZ2. However, small roundish gold nanoparticles, whose presence is highlighted by red harrows in
Figure 1, have been observed in both cases and, quite interestingly, these particles are stable under the electron beam maintaining a high dispersion during the whole measurement on both samples. As shown in
Figure 1c, the particle size distribution obtained for calcined 1AuSZ2 is narrower than that of the not calcined sample, despite a similar mean gold particle size (1.3 nm and 1.4 nm, respectively), pointing out an effect of the calcination pretreatment on gold dispersion after four months.
Figure 1.
HRTEM representative images of calcined (a) and not calcined (b) 1AuSZ2 sample. Gold particles size distribution (c) obtained by HRTEM measurements performed on calcined (grey histogram) and not calcined (red histogram) 1AuSZ2 sample after 4 months. Both images have been taken at an original instrumental magnification of 400,000×.
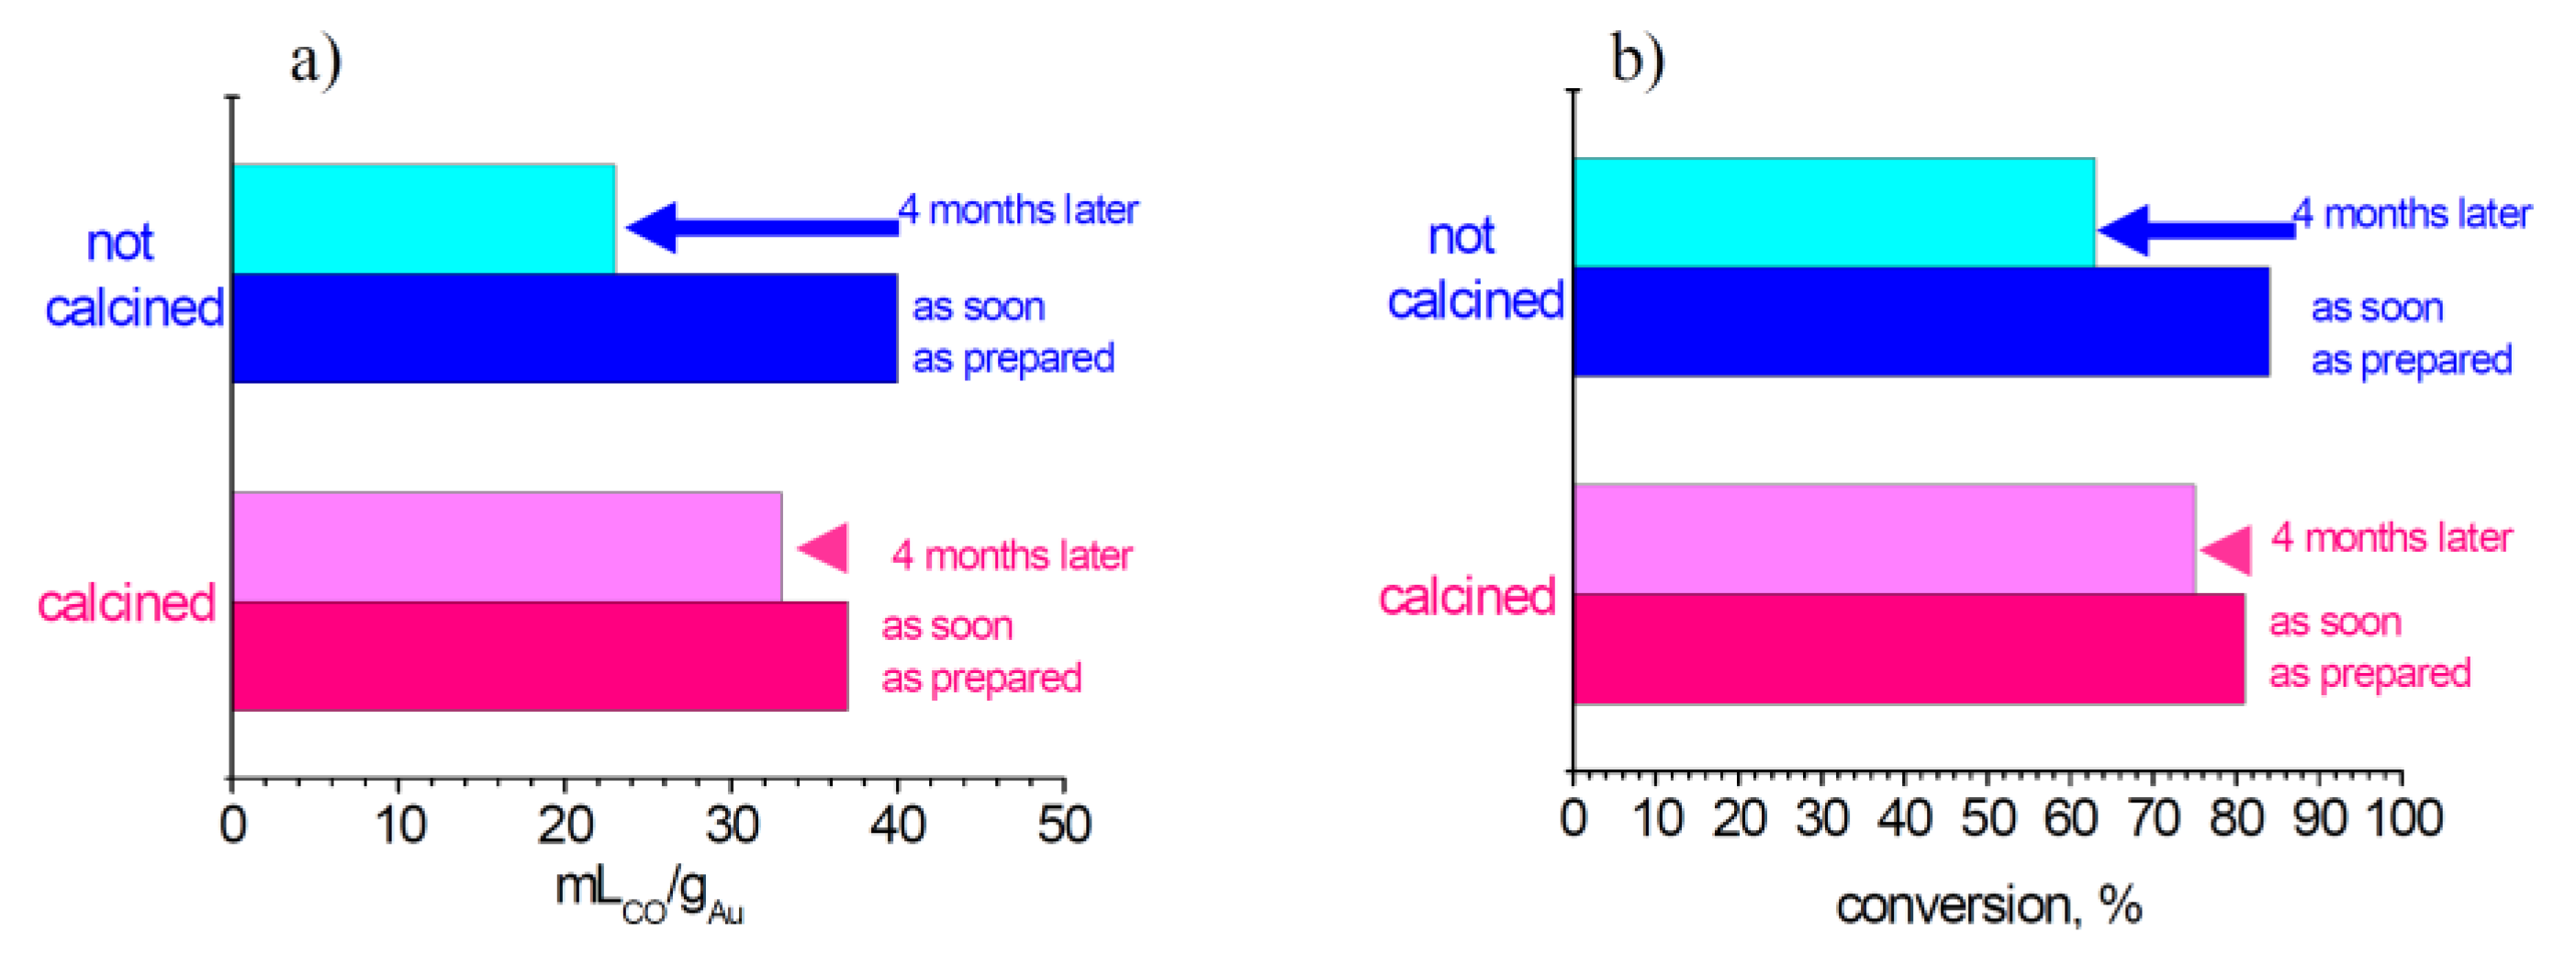
However, the presence of gold species even more dispersed that escape from HRTEM detection has been demonstrated by CO chemisorption (
Figure 2a). The results of the as-soon-as-prepared samples indicate that calcination leads to a small decrease of metal surface area. This is reasonably compatible with the heat treatment. However, an opposite trend is observed after four months: in fact the calcined catalyst preserves a higher dispersion than the not calcined one. This is rationally due to the exceptional gold dispersion of the not calcined sample, which leads to an outstanding gold mobility. On the contrary, calcination induces a stronger interaction among the gold nanoparticles and the zirconia support, therefore arresting gold mobility. Hence, the calcination procedure guarantees the stabilization of gold nanoparticles.
Moreover, these data have been compared with those deriving from the activity in the LT-WGS reaction. The WGS reaction:
is one of the oldest catalytic processes employed in the chemical industry, since it provides an economical route to hydrogen production. It usually proceeds in two distinct steps with two types of catalyst: a high temperature (HT) stage over an iron oxide promoted with chromium oxide catalyst, and a low temperature (LT) stage, on a catalyst composed of copper, zinc oxide, and alumina. Recently, there has been a renewed interest in this reaction because it is one of the key steps in important applications such as pure H
2 production for fuel-cell power systems and in the automobile exhaust processes, since the hydrogen produced is a very effective reductant for NO
x removal. However, in these applications heterogeneous catalysts with high activity as well as good structural stability in air and in cyclic operation are required, but this target is not met by the commercially available LT-WGS catalysts. The catalysis of this reaction by gold nanoparticles supported over metal oxides has been the subject of numerous investigations [
22,
23]. Recently, it has been found that zirconia [
10] and sulfated zirconia [
11] are very efficient supports of gold-based catalyst for the LT-WGS reaction.
As reported in
Figure 2b, it is evident that the calcination led to an enhancement of the stability of catalytic activity, and there is a good correlation between chemisorption and conversion data. These results put in evidence that the calcination procedure allowed the stabilization of highly dispersed gold, possibly by a strong interaction between the gold species and the zirconia support, blocking gold mobility on the support and therefore allowing the preservation of very high metal dispersion. As a consequence, the catalytic performances decrease to a lesser extent. In conclusion, for optimal storage conditions, particular attention must be paid to avoid the exposition to the solar light and to keep the samples already calcined at a proper temperature in the refrigerator.
Figure 2.
Trends of chemisorption (a) and conversion in LT-WGS reaction; (b) for 1AuSZ2 catalyst.
Figure 2.
Trends of chemisorption (a) and conversion in LT-WGS reaction; (b) for 1AuSZ2 catalyst.
2.3. Stability of the Catalysts with Time on Stream in a Gas Phase Reaction (LT-WGSR)
In this paragraph, we will discuss the stability of gold nanoparticles with time on stream for a gas phase reaction,
i.e., the LT-WGS reaction. We have previously demonstrated [
4] that the CO molecule is adsorbed on the very small clusters on Au supported over zirconia, in intimate contact with the oxide. On these surface sites, a close contact between the activated water and the CO probe can be realized. Moreover, we have found [
15] that the catalyst prepared on sulfated zirconia is more stable than that supported on plain zirconia under LT-WGSR conditions. On sulfated zirconia, gold sintering is inhibited in some extent as a consequence of the surface structural disorder left after sulfate removal, allowing a lower mobility of gold atoms on the zirconia surface [
15]. As discussed and illustrated in [
16], an active role of sulfates is played during the gold deposition, producing highly dispersed gold species grafted to zirconia. Afterwards, we investigated the effect of both gold and sulfates on the catalytic performances. Conversions are reported in
Figure 3, while
Table 2 reports catalytic results normalized for the dispersion data.
Figure 3.
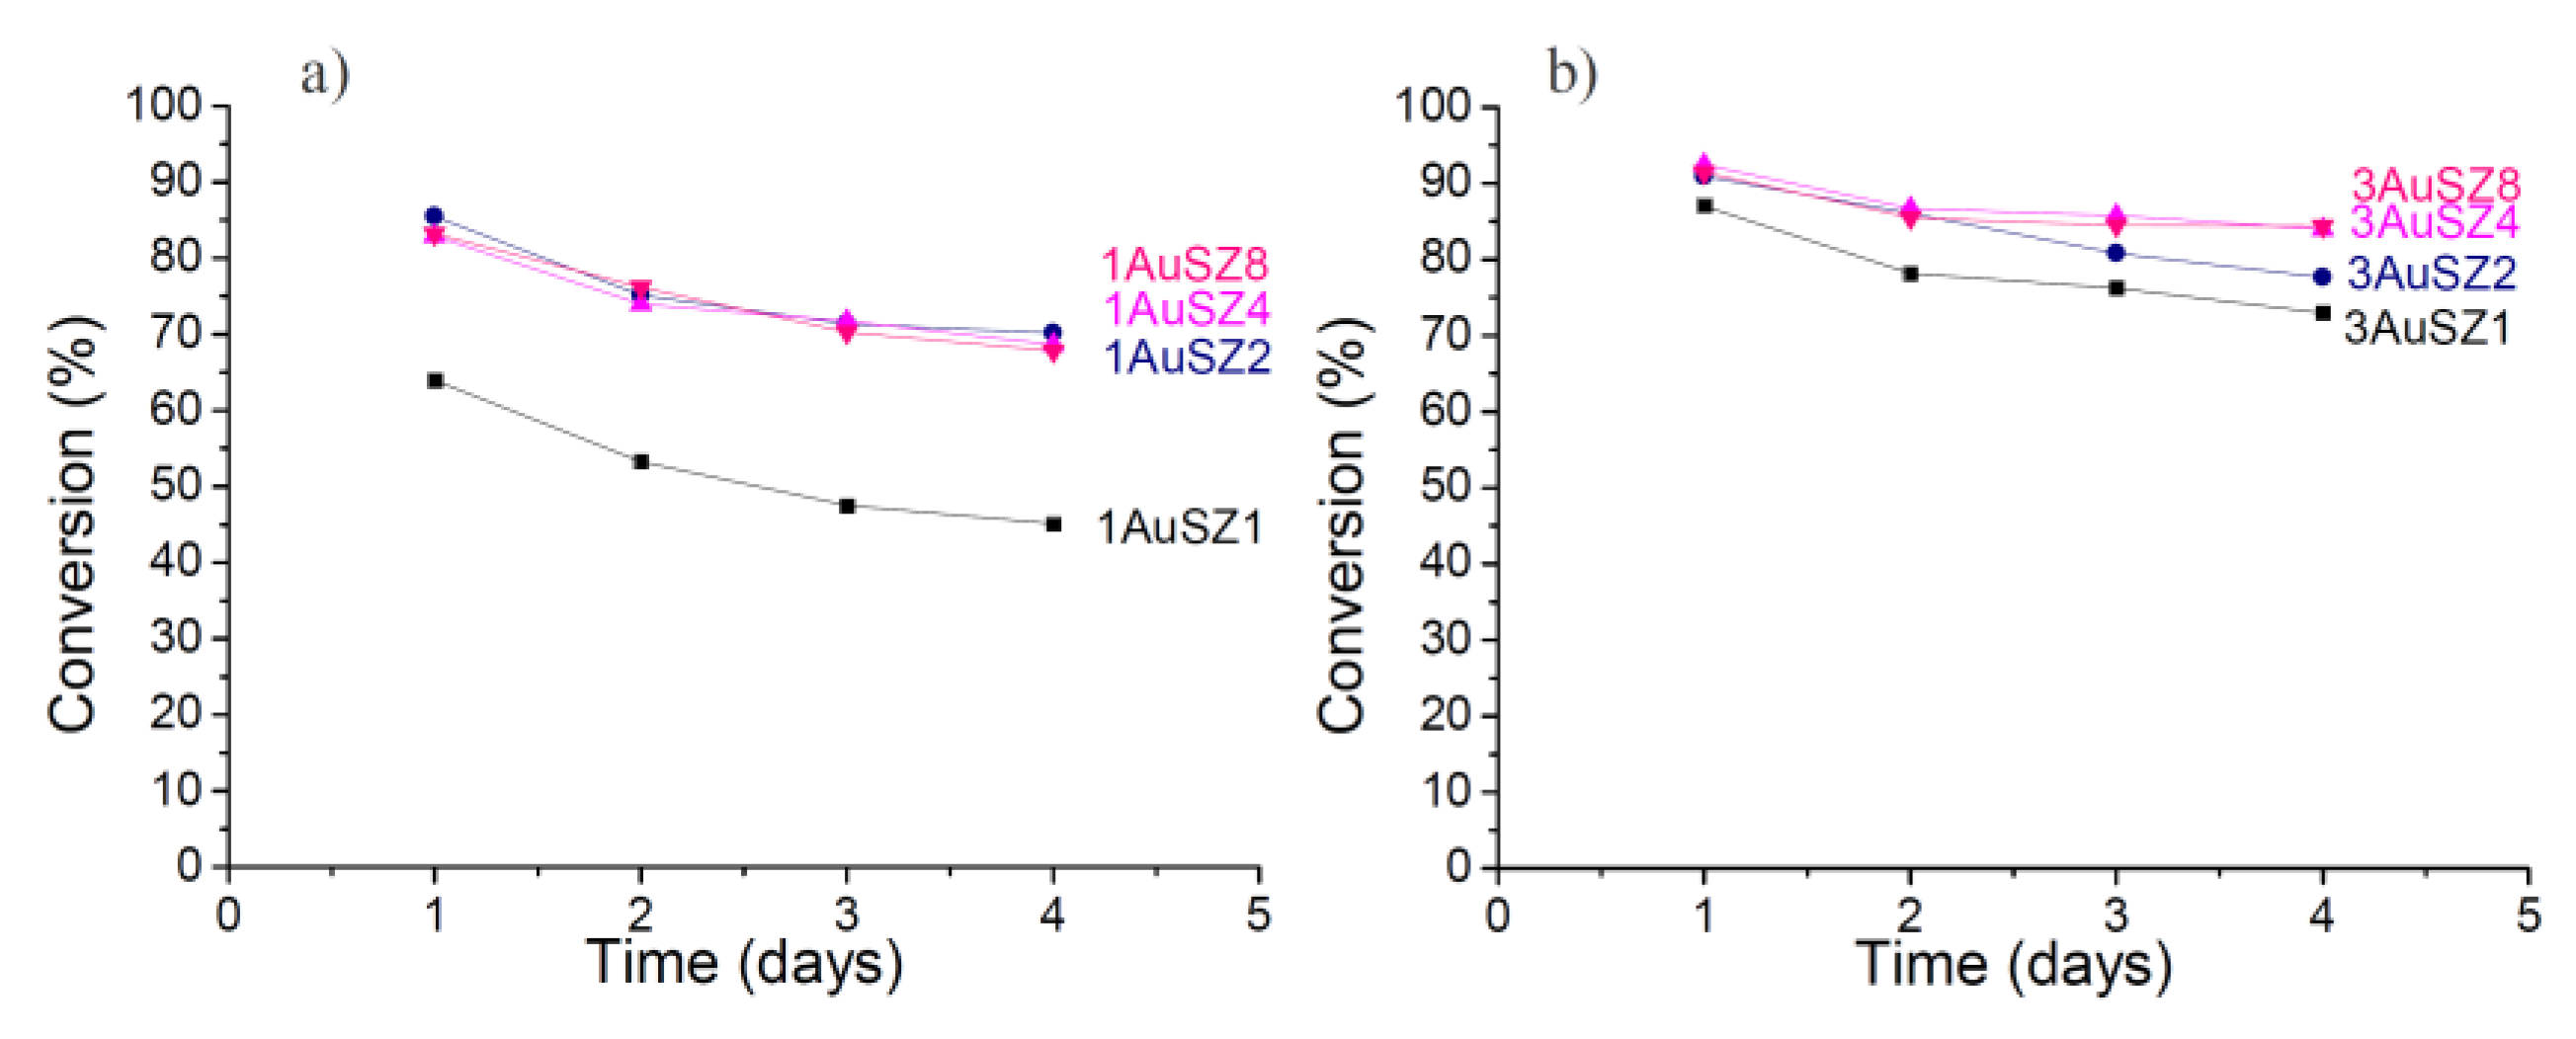
Conversion obtained for the LT-WGS reaction at 453 K for the 1 wt%Au (a) and 3 wt% Au (b).
Figure 3.
Conversion obtained for the LT-WGS reaction at 453 K for the 1 wt%Au (a) and 3 wt% Au (b).
Table 2.
Catalytic performances after 24 h.
Table 2.
Catalytic performances after 24 h.
| Sample | 103 * Converted molCO/h chemisorption data * | Sample | 103 * Converted molCO/h chemisorption data * |
|---|
| 1AuSZ1 | 15 | 3AuSZ1 | 16 |
| 1AuSZ2 | 16 | 3AuSZ2 | 19 |
| 1AuSZ4 | 14 | 3AuSZ4 | 18 |
| 1AuSZ8 | 15 | 3AuSZ8 | 17 |
Firstly, an effect of the gold loading is evident if contrasting the results coming from the samples with 1 wt% to those containing 3 wt% Au: an increase of the quantity of the active species implies an increase of the catalytic activity. However, the expected increase of catalytic performance by enhancing the gold loading from 1 wt% up to 3 wt% Au does not occur and the activity observed on the two series of samples is comparable. This apparently contradictory result is due to the fact that in our experimental conditions it was not possible to maintain the same gold dispersion by increasing the gold loading. In fact, some Au agglomeration occurs when increasing the Au content, as demonstrated by the particle size distributions of the fresh samples reported in
Figure 4 that will be discussed later on.
Both catalysts supported on SZ1 perform worst, indicating that a 1 wt% amount of sulfates is not enough to keep the gold active phase dispersed and it negatively affects catalytic performances. In regards to stability, the curves referring to catalysts with 1 wt% Au denote a very similar profile: the conversion decrease is more noticeable during the first 24 h, while at a later stage the profiles tend to get flat. SZ2 results to have an adequate amount of sulfates to achieve good catalytic results for the 1 wt% Au catalysts.
The curves related to the samples with 3 wt% Au follow a similar trend than those of samples containing 1 wt%, but the conversion values for 3AuSZ4 and 3AuSZ8 are almost coincident and higher than 3AuSZ2. For the 3 wt% Au samples a further increase in the sulfates amount (from 4 wt% to 8 wt%) has no evident effect on the activity and stability of the catalysts.
Moreover, it is interesting to note that for the 3 wt% Au catalysts, the loss of activity in 72 h is substantially smaller than for the series with 1 wt% Au, indicating that 3 wt% Au > 1 wt% Au, as for gold stability, too.
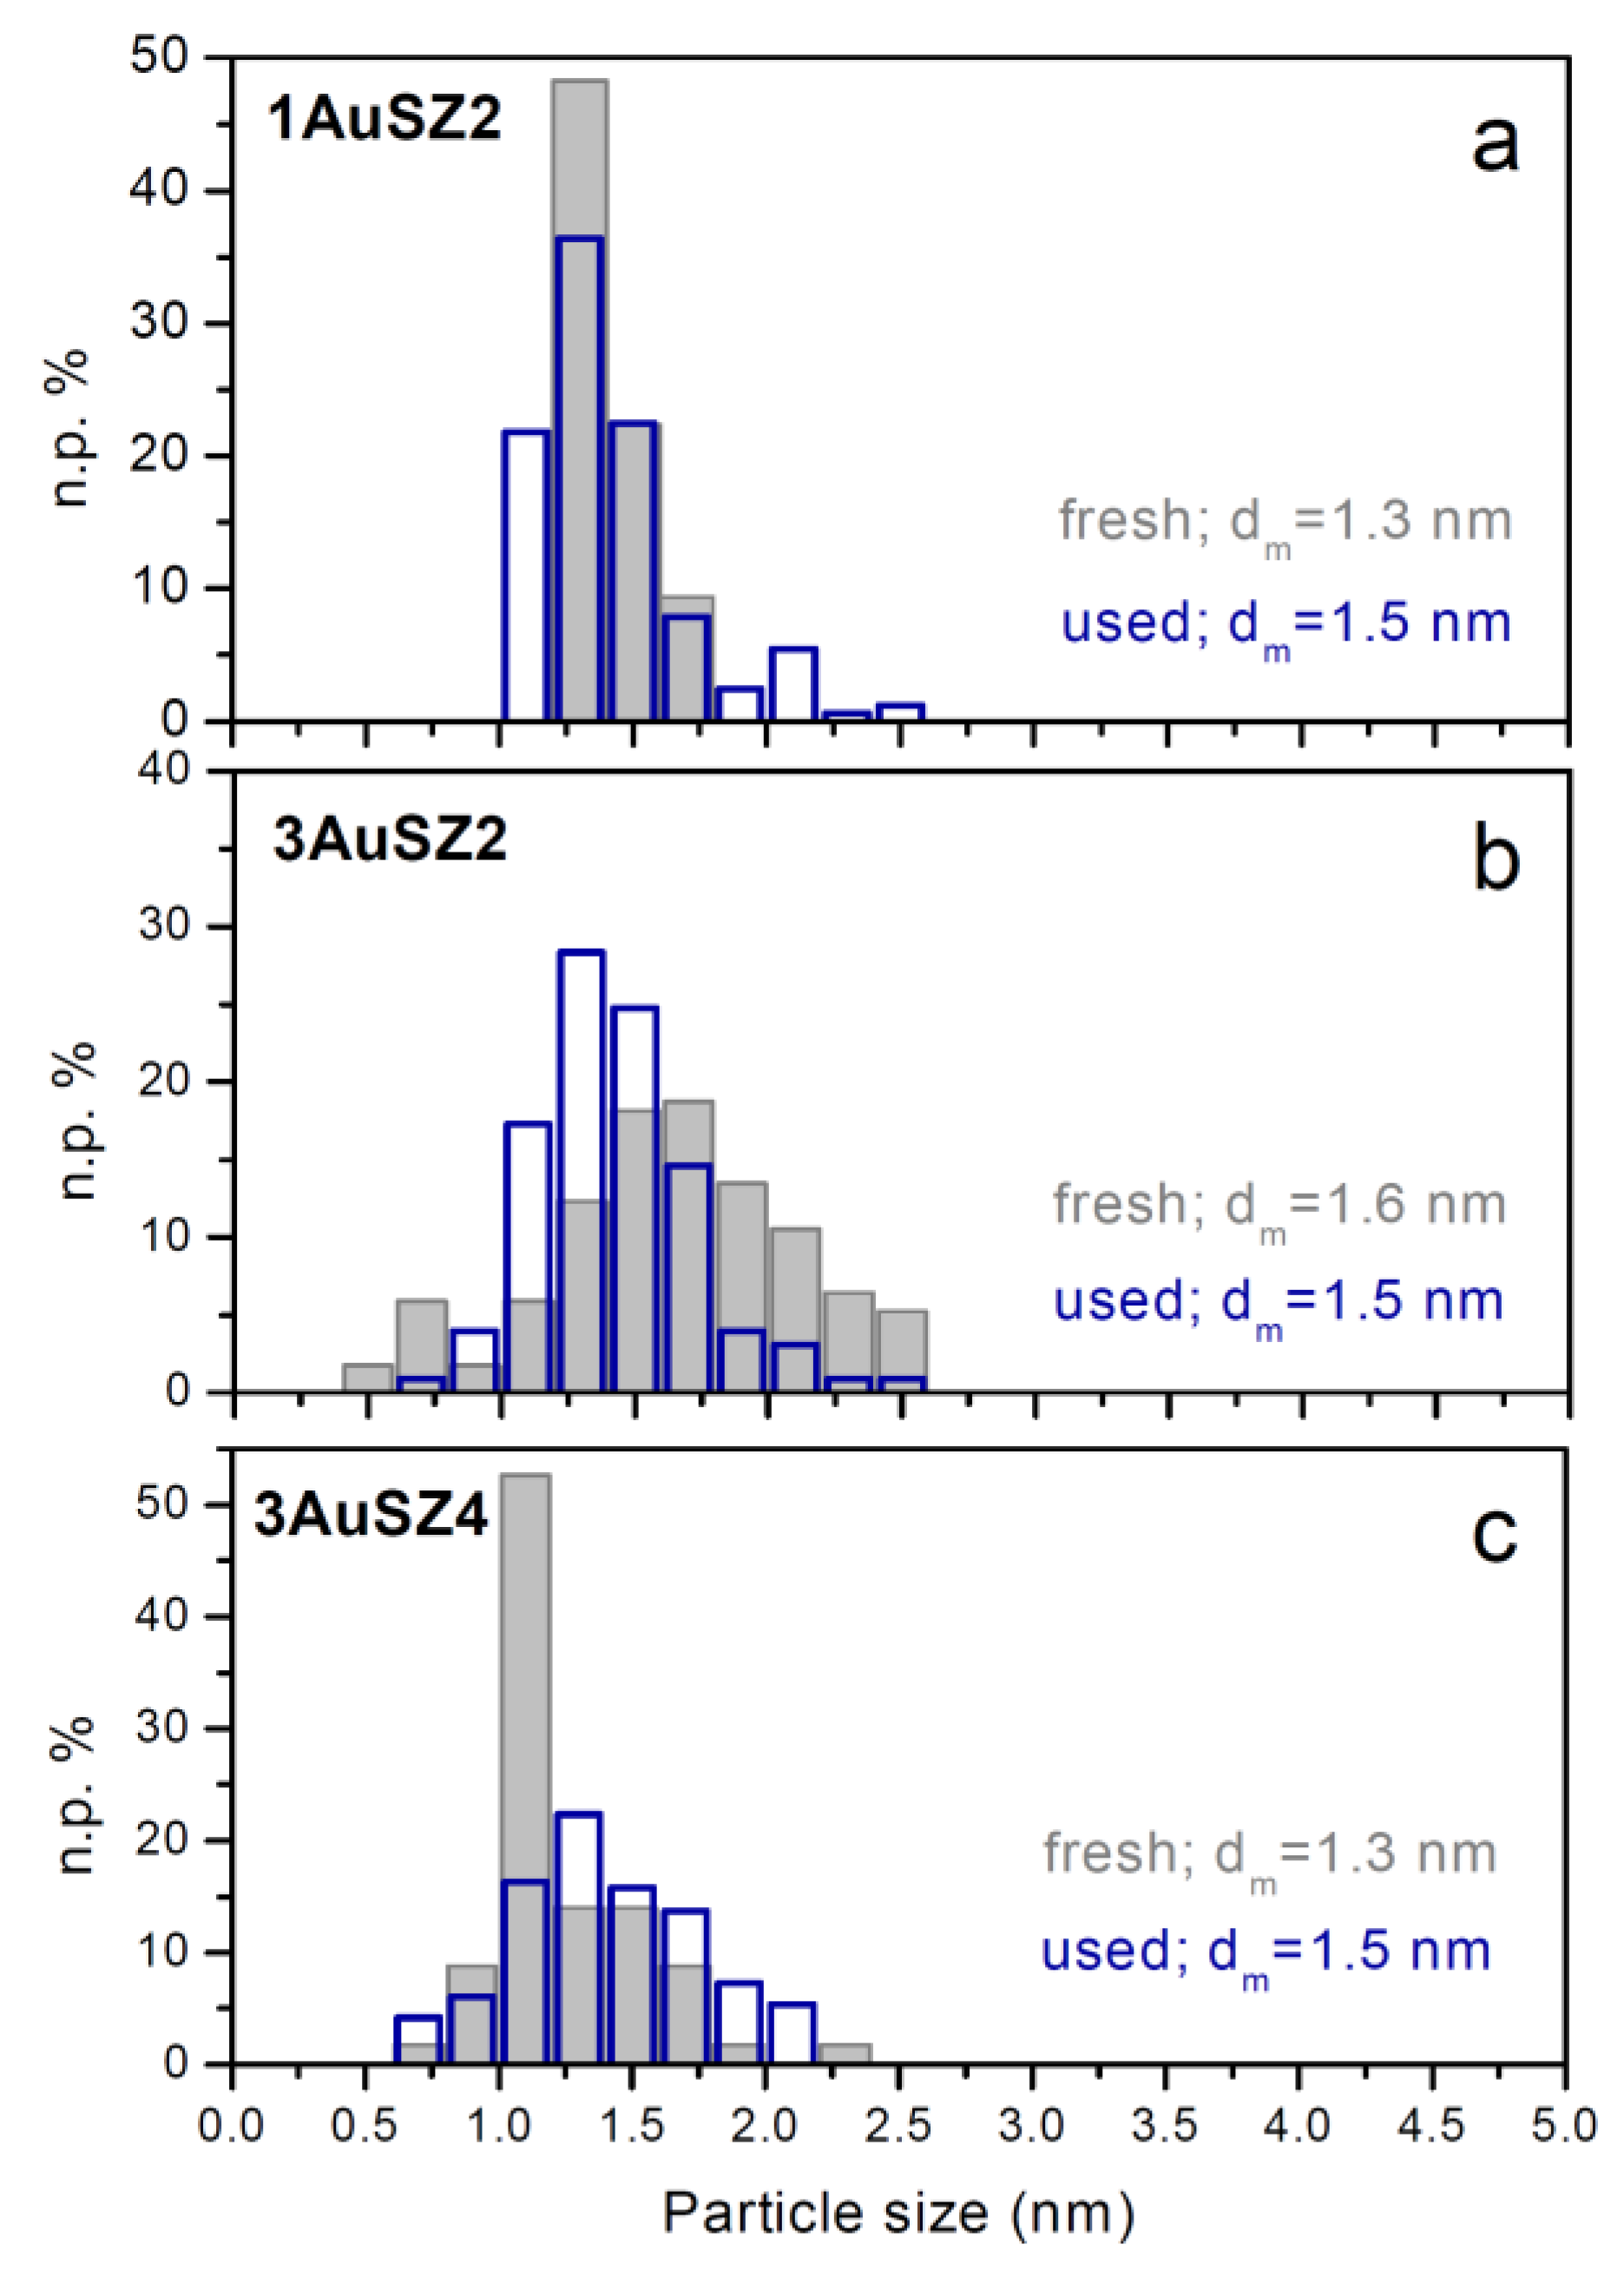
This feature can be related to the lower gold sintering observed in the samples with the higher percentage of Au, as confirmed by comparing the particles size distributions of the fresh (grey histograms) and used (blue histograms) 1AuSZ2 and 3AuSZ2 samples reported in section a and b of
Figure 4. Gold particles with diameter >2 nm are present after reaction in the distribution of 1AuSZ2 (blue histogram), whilst the particle size distribution of the gold particles present on the 3AuSZ2 is slightly shifted towards higher sizes after reaction, and the average size is almost identical before and after the catalytic tests. On the other hand, the distribution of the used 3AuSZ4 catalyst (blue histogram in
Figure 4c) is fixed in the same range of sizes of the distribution related to the fresh sample. In agreement with the trends displayed by the 3 wt % catalysts and shown in
Figure 3, gold nanoparticles present on 3AuSZ4 seem more stable than those on 3AuSZ2, indicating that the sulfate amount has to be modulated depending on the Au content to obtain samples with the optimal metal dispersion.
Figure 4.
Gold particle size distributions of 1AuSZ2 (a); 3AuSZ2 (b) and 3AuSZ4 (c) fresh (grey histograms) and used (blue histograms) catalysts.
Figure 4.
Gold particle size distributions of 1AuSZ2 (a); 3AuSZ2 (b) and 3AuSZ4 (c) fresh (grey histograms) and used (blue histograms) catalysts.
Figure 5.
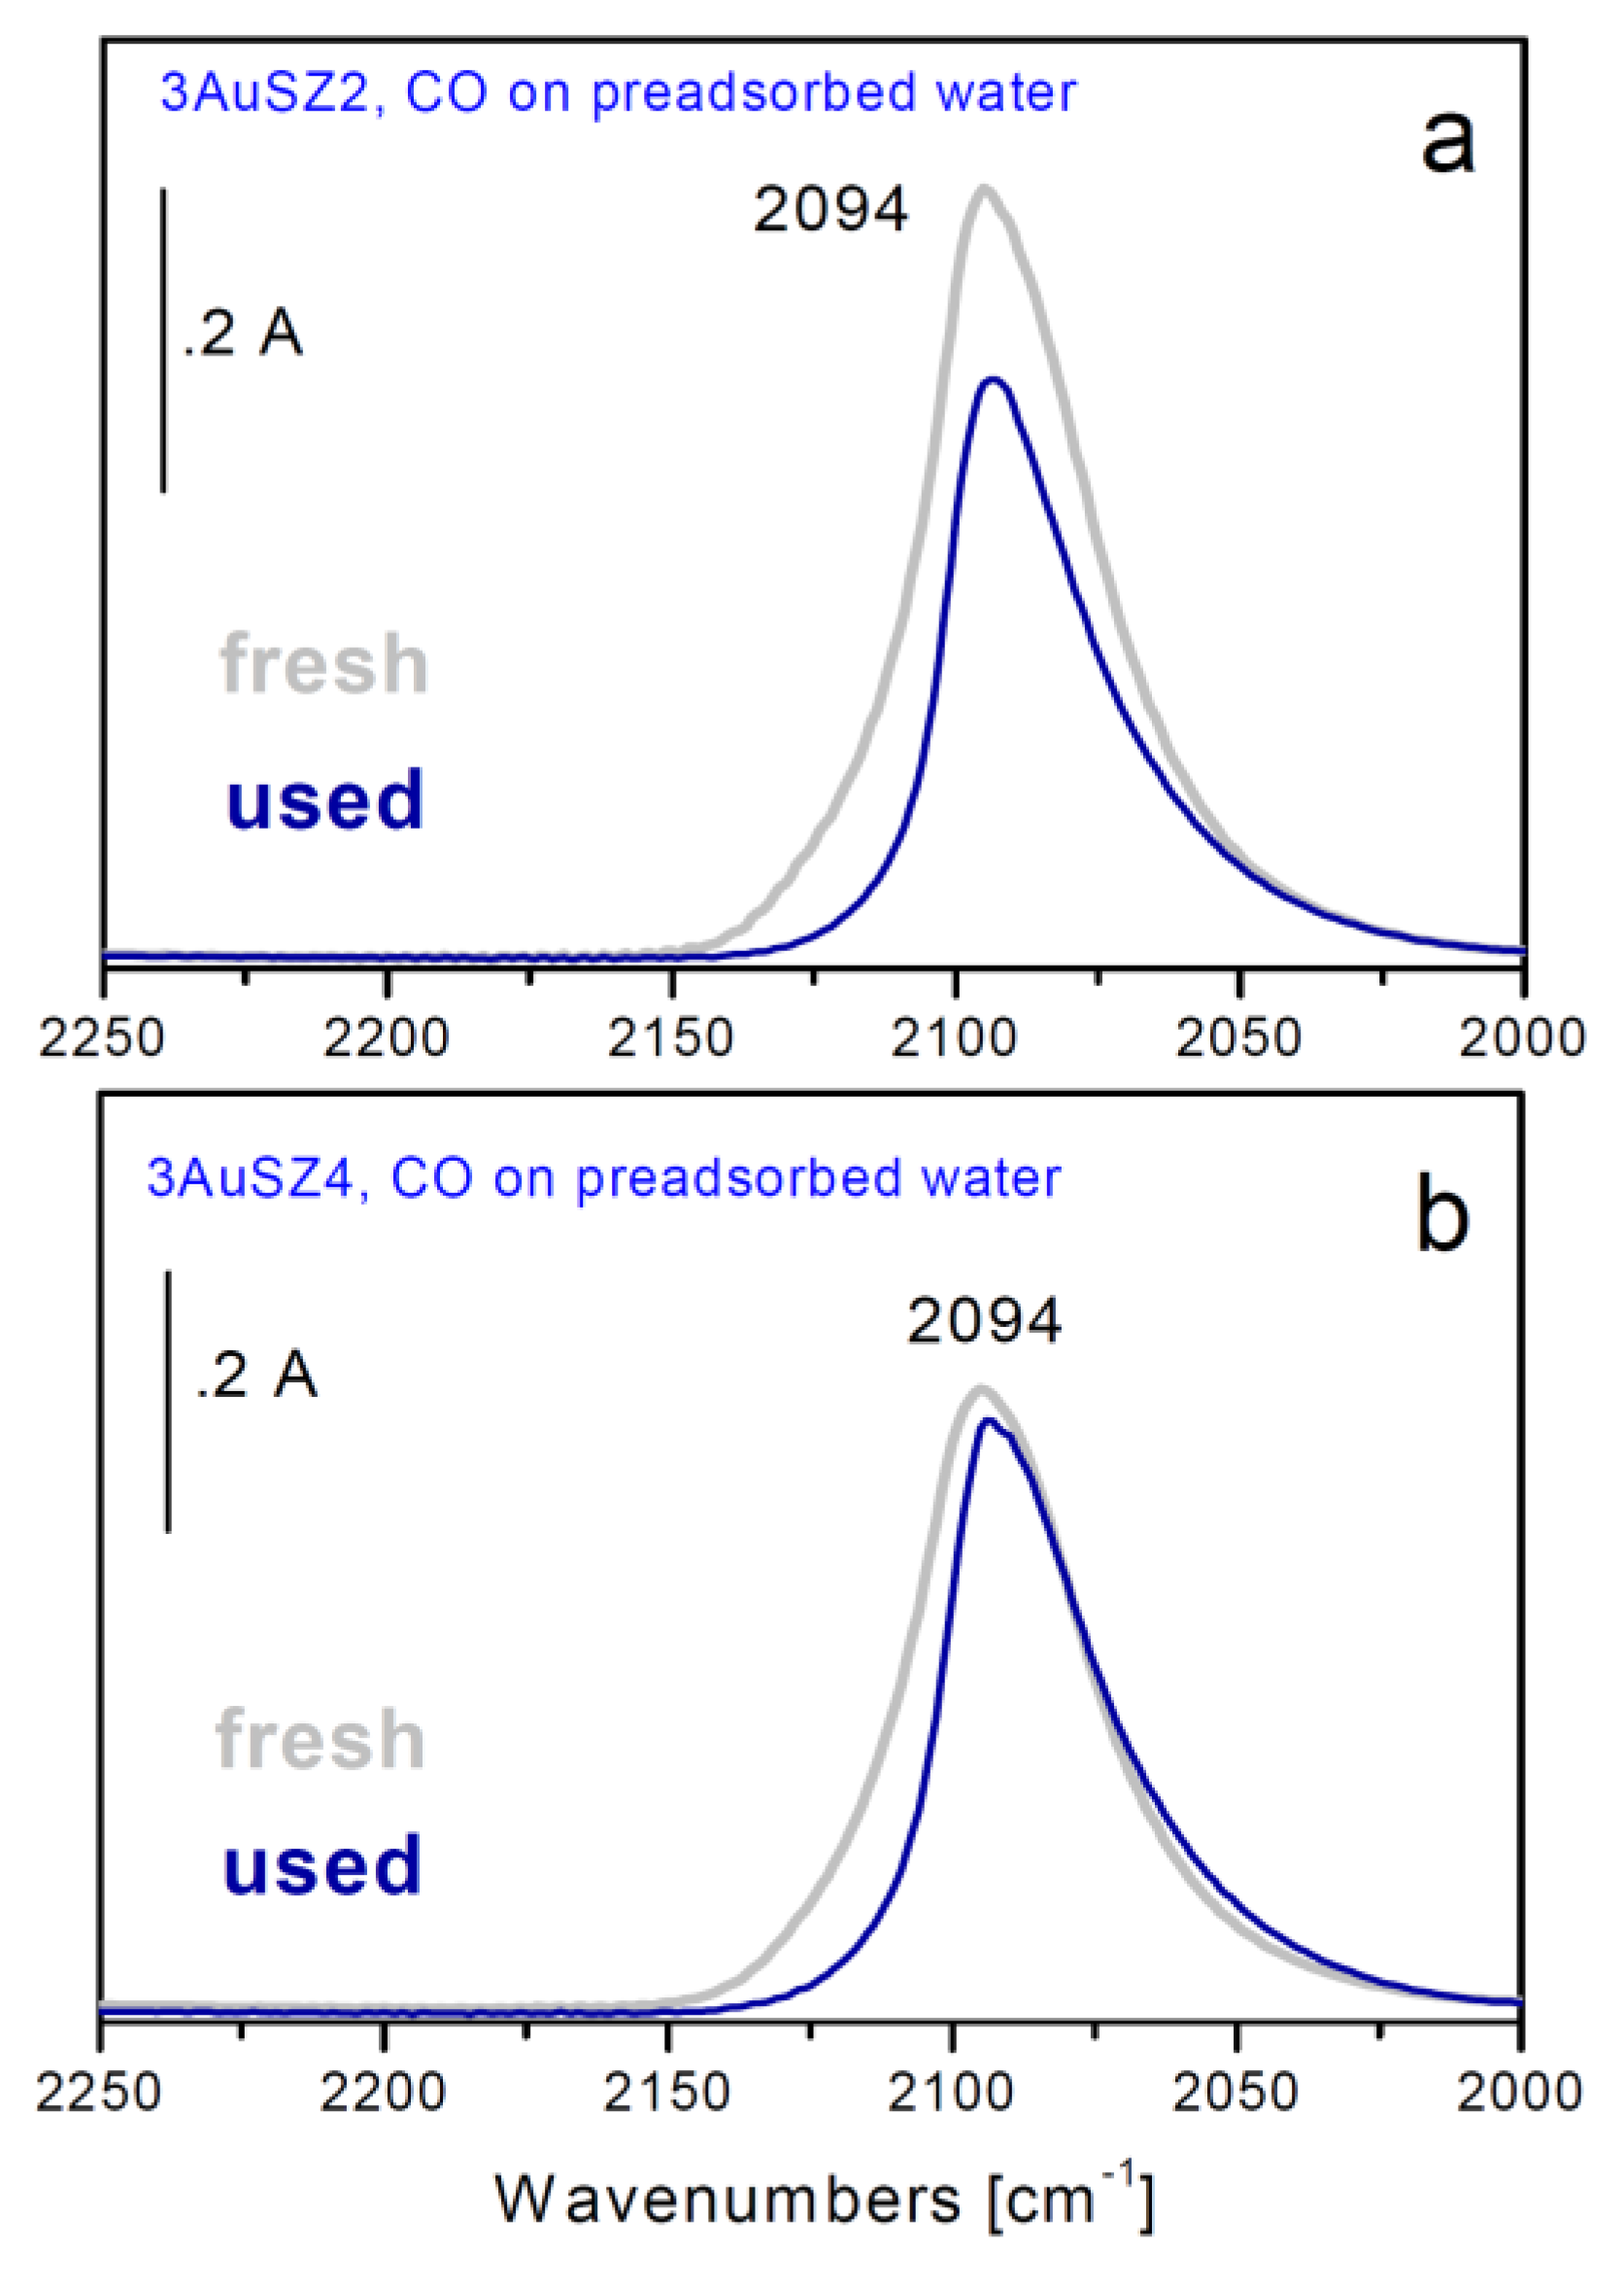
FTIR difference spectra of CO adsorbed at 157 K on fresh (grey curves) and used (blue curves) 3AuSZ2 (a) and 3AuSZ4 (b) catalysts precovered previously by water.
Figure 5.
FTIR difference spectra of CO adsorbed at 157 K on fresh (grey curves) and used (blue curves) 3AuSZ2 (a) and 3AuSZ4 (b) catalysts precovered previously by water.
In order to investigate more deeply this point, FTIR spectroscopic measurements of adsorbed CO have been carried out at low temperature either on the fresh samples or on the used ones (
Figure 5). In fact, all gold exposed sites, also the highly dispersed ones thatescape from the HRTEM detection, can be monitored by employing this technique.
An intense band centered at 2,094 cm
−1 whose position is close to that typically observed for metallic Au nanoparticles, but broader and more symmetrical in shape, is present on both samples (sections a and b, grey curves). Looking at the behavior observed during outgassing at 157 K and/or upon heating at r.t., as well as at the different absorption coefficient, 1.8 cm
−1 mol
−1 (×10
4)
vs. 3.2 cm
−1 mol
−1 (×10
4) determined for Au nanoparticles, this band is due to the presence of mutually interacting Au corner sites exposed at the surface of non metallic neutral clusters [
15,
24]. In these clusters a large fraction of the gold atoms is uncoordinated and exposed at the surface, where almost all Au atoms are in corner or interface positions.
After use, the band at 2094 cm
−1 displays a less symmetric shape (
Figure 5a,b, blue curves). In particular, the component at about 2115 cm
−1 is almost totally depleted, indicating that a partial sintering process occurred during reaction.
Sintering is well evident on 3AuSZ2, in fact the CO band related to the used sample is less intense than that associated to the fresh one. On the contrary, the highly dispersed gold clusters present on 3AuSZ4 undergo only minor sintering, as demonstrated by the small change in shape of the band as well as by the fact that it has the same intensity if compared to the band related to the fresh sample. These data are in agreement with HRTEM findings and further confirm our hypotheses on the effect of an opportune sulfate amount ruling the gold dispersion and stability.
2.4. Stability of the Catalysts with Time on Stream in a Liquid Phase Reaction (Furfural Oxidative Esterification)
The stability with time on stream for a liquid phase reaction,
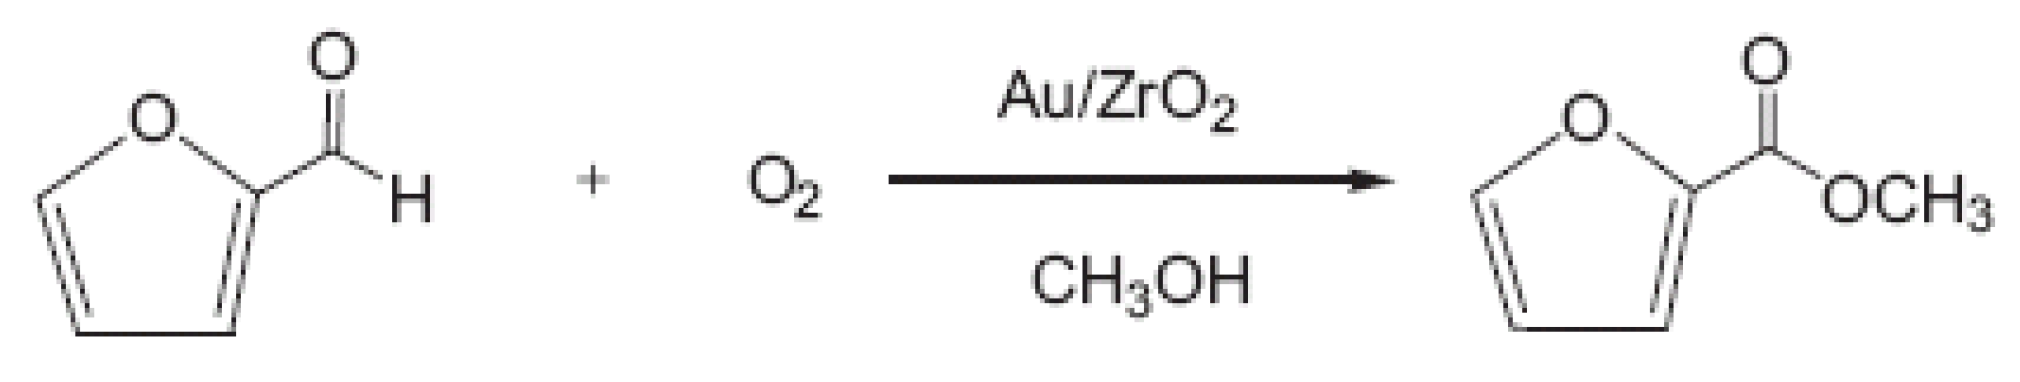
i.e., the furfural oxidative esterification to methyl furoate, will be discussed in this section. In
Scheme 1 is reported the reaction of the furfural oxidative esterification to methyl furoate.
Scheme 1.
Furfural oxidative esterification to methyl furoate.
Scheme 1.
Furfural oxidative esterification to methyl furoate.
The catalytic tests have been performed at 393 K in methanol under pressure and stirring at 1000 rpm for many hours. Very recently, we have found [
25,
26] good catalytic performances of highly dispersed Au/ZrO
2 samples, due to the presence of highly dispersed Au clusters able to produce atomic oxygen by reaction with the oxygen molecule. Unfortunately the catalysts, after the first catalytic run, filtration and washing in methanol, did not restore starting performances [
26]: selectivity collapses from 98% to 29%. Firstly, we investigated if gold leaching occurred during tests in the liquid phase. In fact, metal leaching can never be excluded for a reaction working in solvent medium for many hours. Exhausted samples were disaggregated and chemical analysis by atomic absorption of gold was carried out. Catalysts that have been discharged after three hours of reaction in methanol and stirred at 1000 rpm have shown the same Au content of the as-prepared samples (1.5 wt%
vs. 1.5 wt%).
Another reason for the selectivity decrease of Au/ZrO
2 catalysts can be associated with the sintering of gold clusters during the reaction [
26]. Therefore, the increase in size of the Au nanoparticles was investigated by HRTEM. The mean Au particle size is the same before and after the catalytic test (2.8 nm
vs. 2.7 nm). From these findings, gold sintering problems throughout the reaction time can be excluded. This is plausible, as we have previously shown that calcination at a proper temperature results in stable gold nanoparticles. Moreover, the reaction was performed at only 393 K, a temperature which is quite lower than the calcination temperature (773 K).
Figure 6.
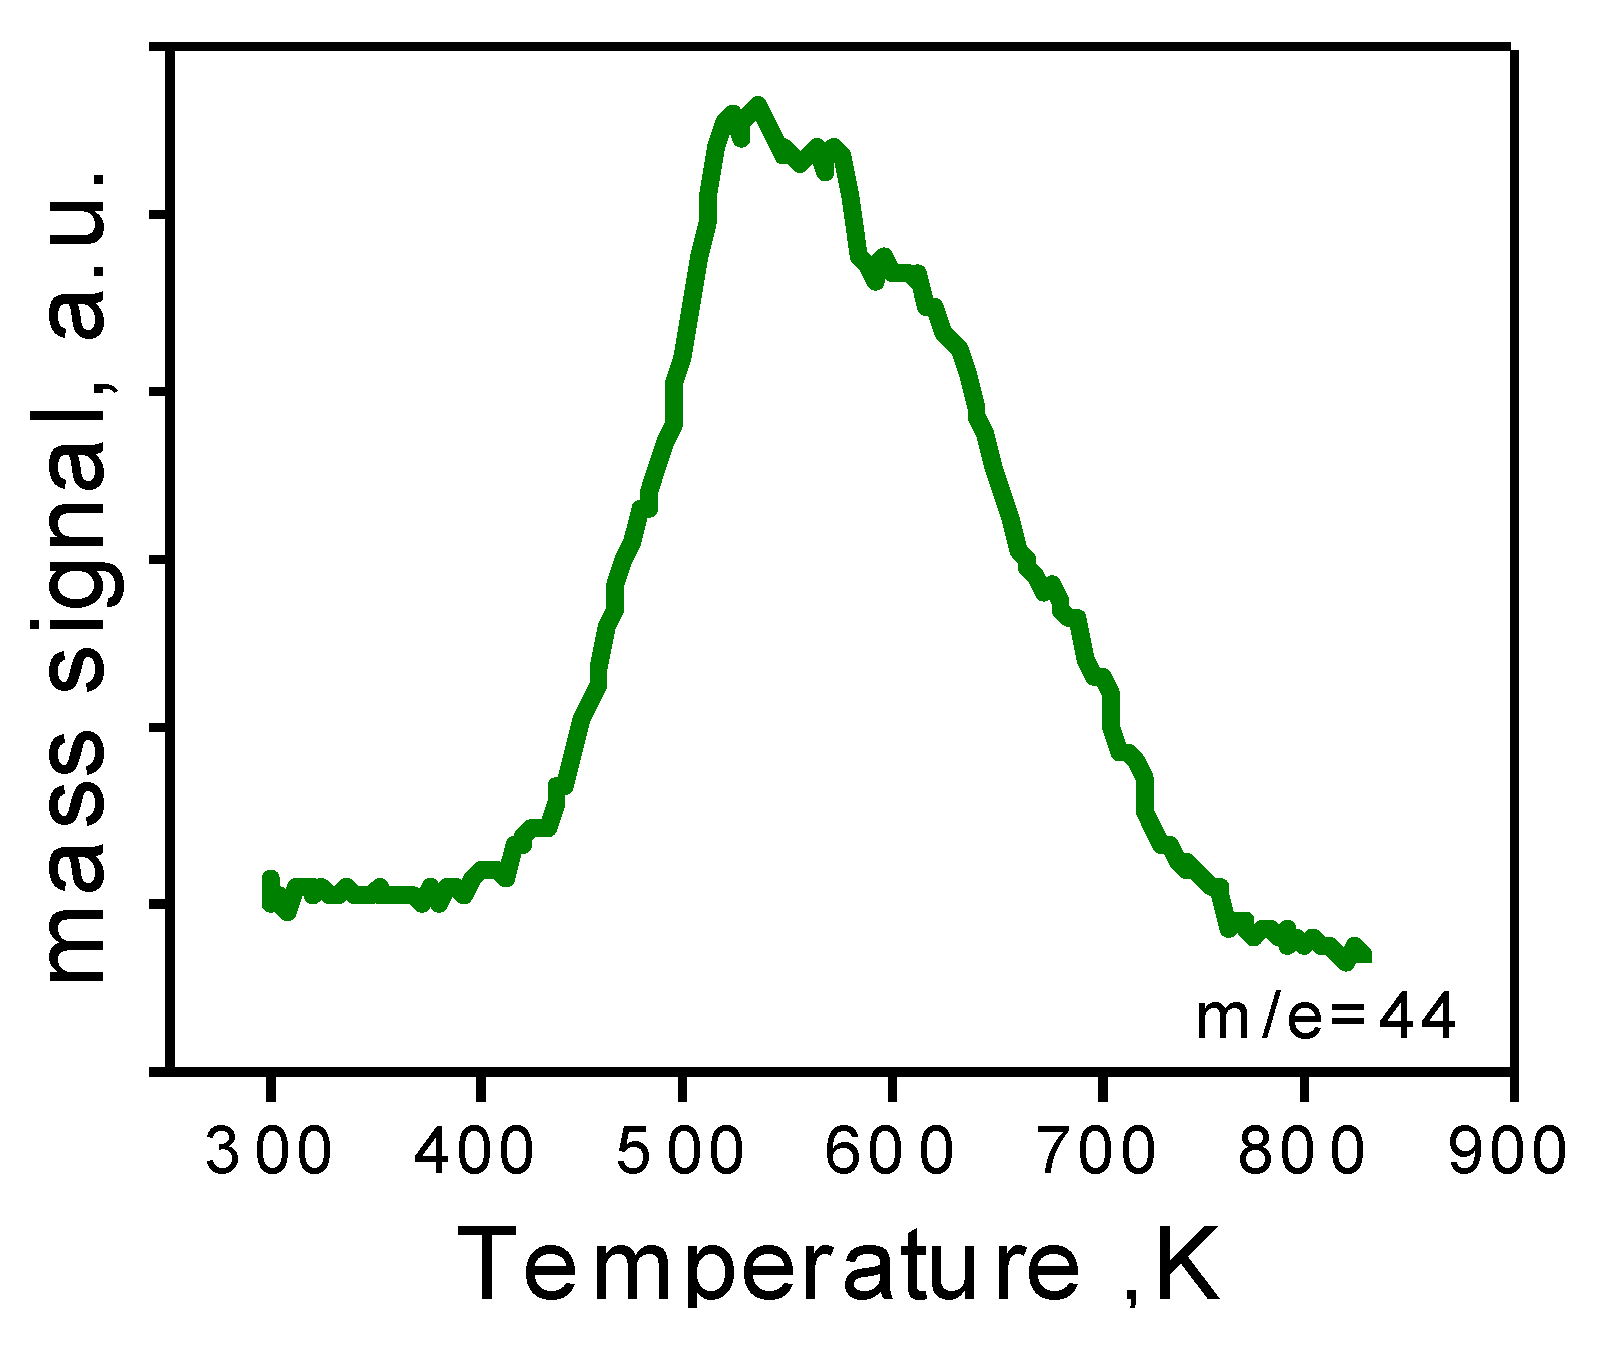
TPO of the 1.5AuSZ2 sample after reaction.
Figure 6.
TPO of the 1.5AuSZ2 sample after reaction.
After ruling out both Au leaching and sintering, we investigated fouling of the active sites [
26]. In order to verify the presence of any carbon-based residues, the catalysts were subjected to temperature programmed oxidation (TPO). The profile of the as-prepared catalyst does not present CO
2 evolution, indicating the absence of organic residues in the material. On the contrary, as shown in
Figure 6, the TPO profile of the sample after reaction, presents one broad band due to CO
2 evolution.
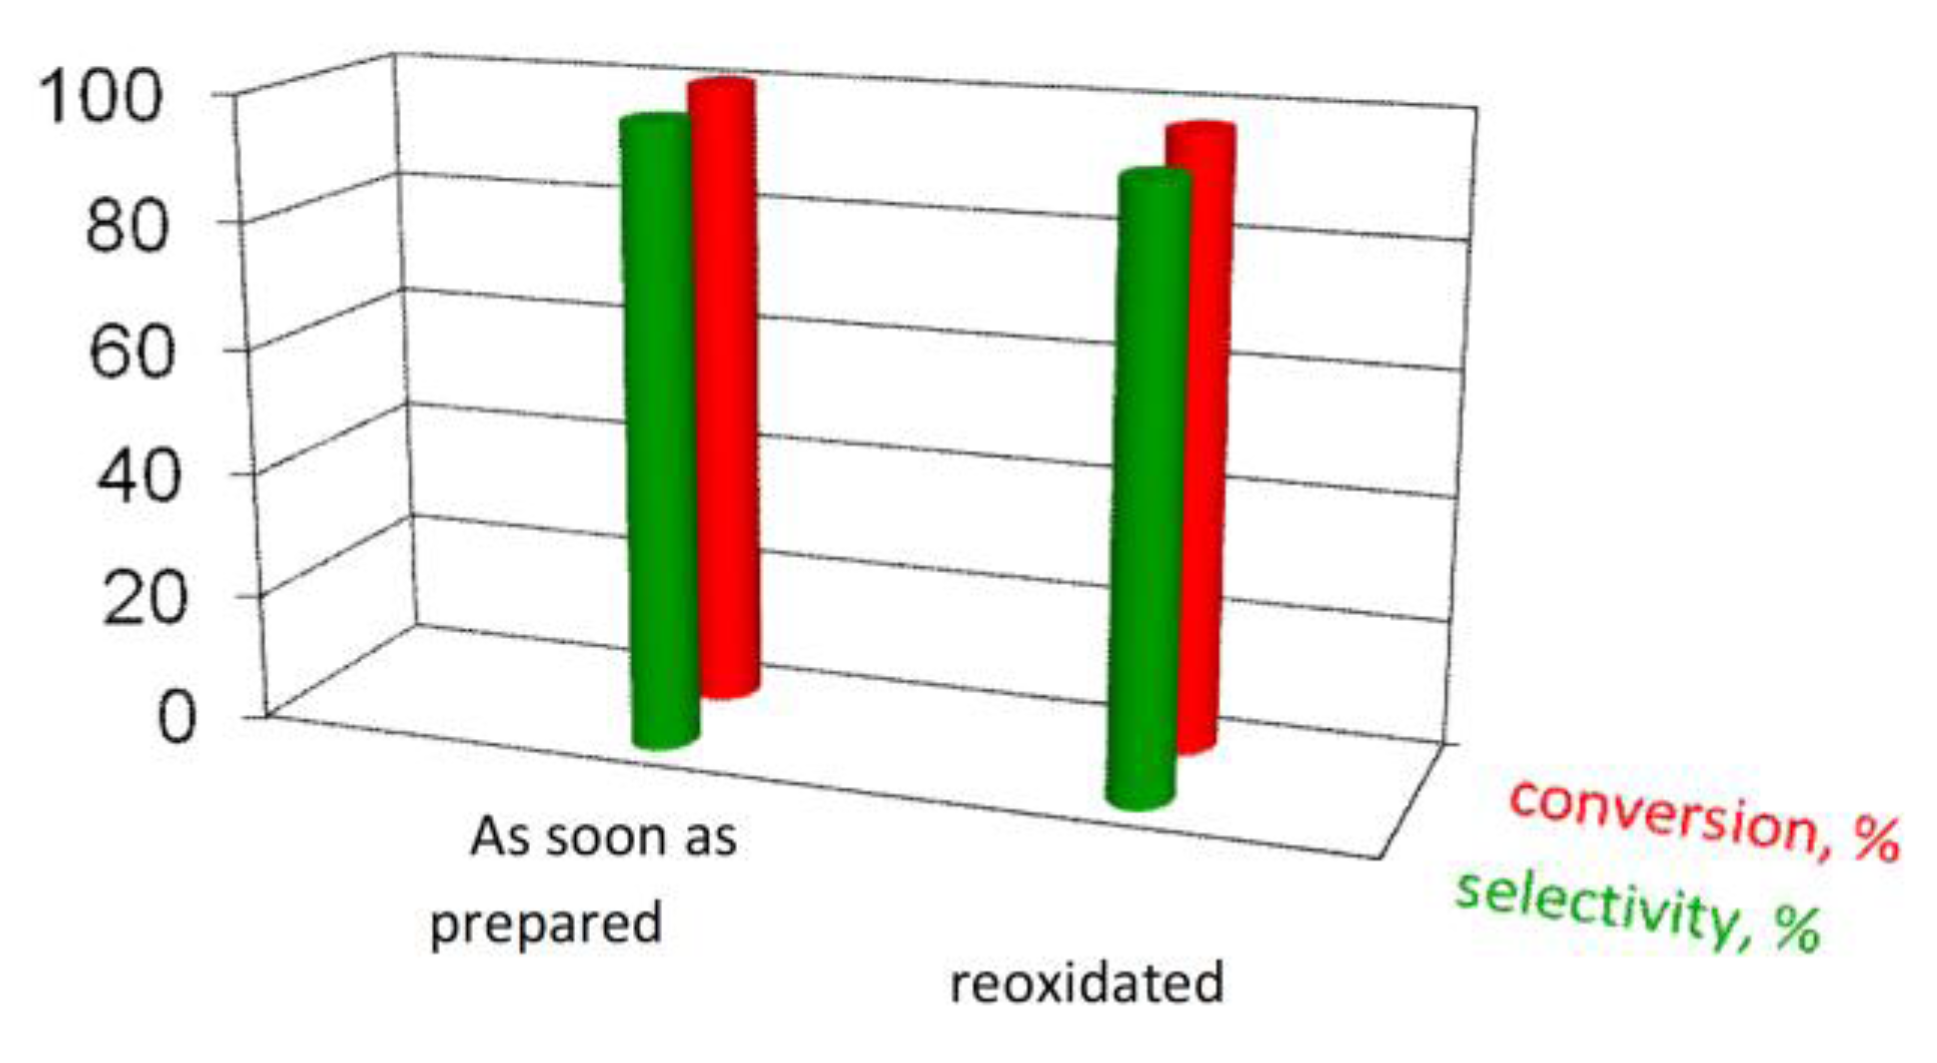
Therefore, the catalyst has been reoxidated at 723 K in order to completely remove the carbon residue. Moreover, the TPO profile of the reoxidated sample is flat, meaning the complete elimination of carbon species on the material.
Hence, we further performed catalytic reaction on the reoxidized catalyst. As reported in
Figure 7, it is possible to restore the initial conversion and almost fully the selectivity [
26].
Figure 7.
Comparison of activity data of the 1.5AuSZ2 sample.
Figure 7.
Comparison of activity data of the 1.5AuSZ2 sample.

 ,
, 


