1. Introduction
Organic dyes are major water pollutants, widely used in textiles, paper, food, and pharmaceuticals [
1]. Industries such as the pharmaceutical and textile industries discharge untreated wastewater, which leads to severe water pollution. Environmental pollution represents a critical challenge for both developing and industrialized nations [
2]. This ecological burden stems primarily from anthropogenic activities, which increasingly compromise the integrity of marine and freshwater systems. In many respects, human impact is straining oceans, rivers, and inland waterways to such an extent that their water quality has been significantly degraded.
Numerous studies have shown that nanoparticles possess high adsorption capacity for arsenic, cadmium, chromium, and uranium, and surpass other known pollutants, including organic compounds and phosphates, in terms of their high capacity and selectivity [
3].
Nanomaterials, including nanoparticles and metal–organic frameworks (MOFs), are utilized not only for the removal of organic dyes from water but also for the degradation of pesticides, often via adsorption or catalytic processes [
4]. They also demonstrate promising performance in the capture and storage of gases such as carbon monoxide and hydrogen, although efficiency strongly depends on material composition and operating conditions [
5].
Dyes are carcinogenic, toxic, cause mutation, and deplete dissolved oxygen [
6]. Methylene blue (MB), a thiazine dye, is particularly hazardous, causing damage to the nervous system and eyes upon ingestion [
7]. Advanced oxidation processes such as sonocatalysis, ozonolysis, photoFenton, photocatalysis, and photoelectro-Fenton are widely applied for dye removal [
8]. Among these methods, photocatalytic degradation is effective in converting stable dye molecules into nontoxic and smaller species via redox reactions [
9].
Owing to its energy-level separation, zinc sulfide (ZnS) is used in biomedical imaging, sensors, and optoelectronic devices to provide photoluminescence across a broad spectrum of colors [
10]. ZnS quantum dots possess a higher specific surface area, more active sites, and enhanced surface reactivity. Therefore, ZnS nanoparticles could serve as an efficient photocatalyst. When exposed to ultraviolet (UV) radiation, ZnS quantum dots effectively photocatalytically degrade organic pollutants, such as dyes and antibiotics in wastewater [
11]. This zinc sulfide-based nanomaterial is non-toxic, more chemically stable than other semiconductors, and is characterized by a wide bandgap of ~3.7 eV. These properties offer promising potential for various applications such as ultraviolet sensors, efficient UV light-emitting diodes (LEDs), optoelectronic devices, and electroluminescent devices. Photoemission wavelength, bandgap, and lattice parameters of ZnS are strongly influenced by grain size.
The paper [
12] demonstrates that the efficiency of pollutant degradation and photocatalytic processes is determined by the band gap, which influences light absorption and the generation of electron-hole pairs. A high specific surface area and porous structure contribute to improved adsorption and an increased number of active sites. Furthermore, efficient charge separation and transport play a key role in enhancing the overall catalytic activity of the materials.
Multiple synthesis routes exist for producing ZnS nanomaterials, such as microwave irradiation, sol–gel electrochemical deposition, sonochemical, hydrothermal, and low-temperature microemulsion methods [
13,
14]. In recent years, green synthesis has gained attention for its environmentally sustainable approach, employing natural or biological solvents and reactors to minimize chemical waste and energy consumption [
15,
16]. The coprecipitation method offers simplicity and low cost but often produces broad particle size distributions and surface defects, which can impair optical performance [
17].
To enhance photocatalytic performance, ZnS has been combined with nanocarbons, such as carbon nanotubes (CNT), fullerenes, and graphene [
18,
19,
20]. ZnS quantum dots and nanorods can be grown directly on CNT shells without a catalyst, with morphology influencing CNT properties. Certain ZnS nanostructures form heterojunctions with CNT, which can be used in optical or optoelectronic applications [
21]. Multiwalled carbon nanotubes (MWCNT) provide high electron conductivity, facilitating interfacial electron transfer conductivity, facilitating interfacial transfer from ZnS surfaces to MWCNT, which reduces the electron-hole recombination and photocorrosion, thereby enhancing photocatalytic activity [
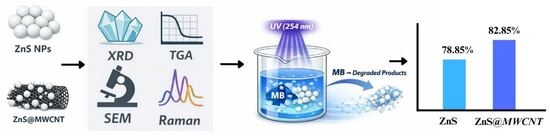
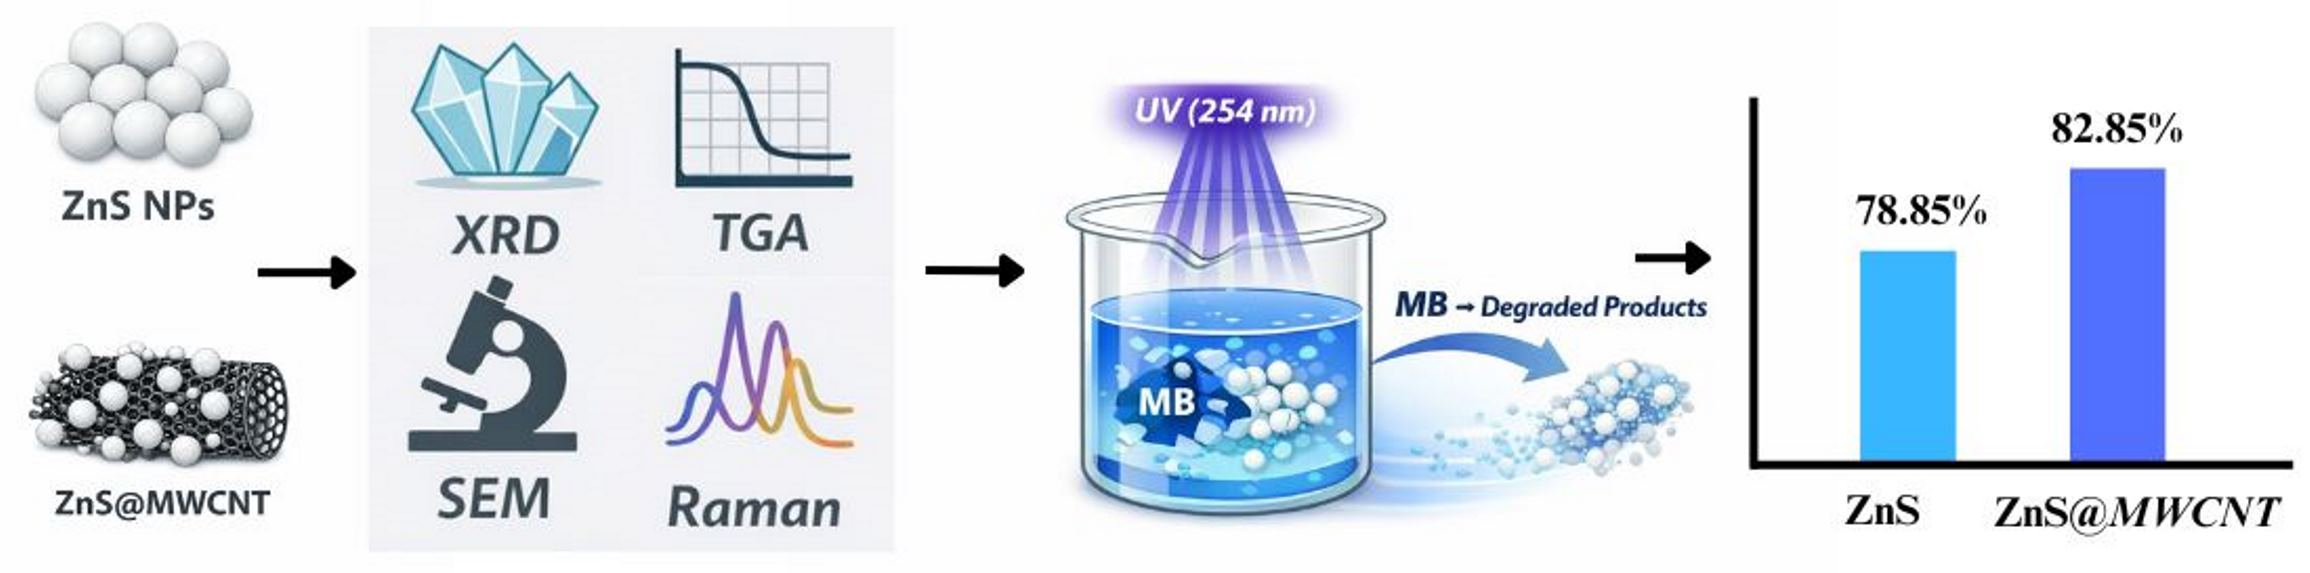
22]. The present work studied the synthesis of ZnS particles and hybrid ZnS@MWCNT composites, followed by their confirmation of crystal structure, morphology, and lattice vibration using X-ray diffraction, scanning, Raman, and EDX spectroscopy, as well as the study and comparative evaluation of their photocatalytic degradation activity in methylene blue under UV light irradiation.
2. Results
2.1. Energy-Dispersive X-Ray (EDX) Spectroscopy Analysis of ZnS Particles and ZnS@MWCNT Composites
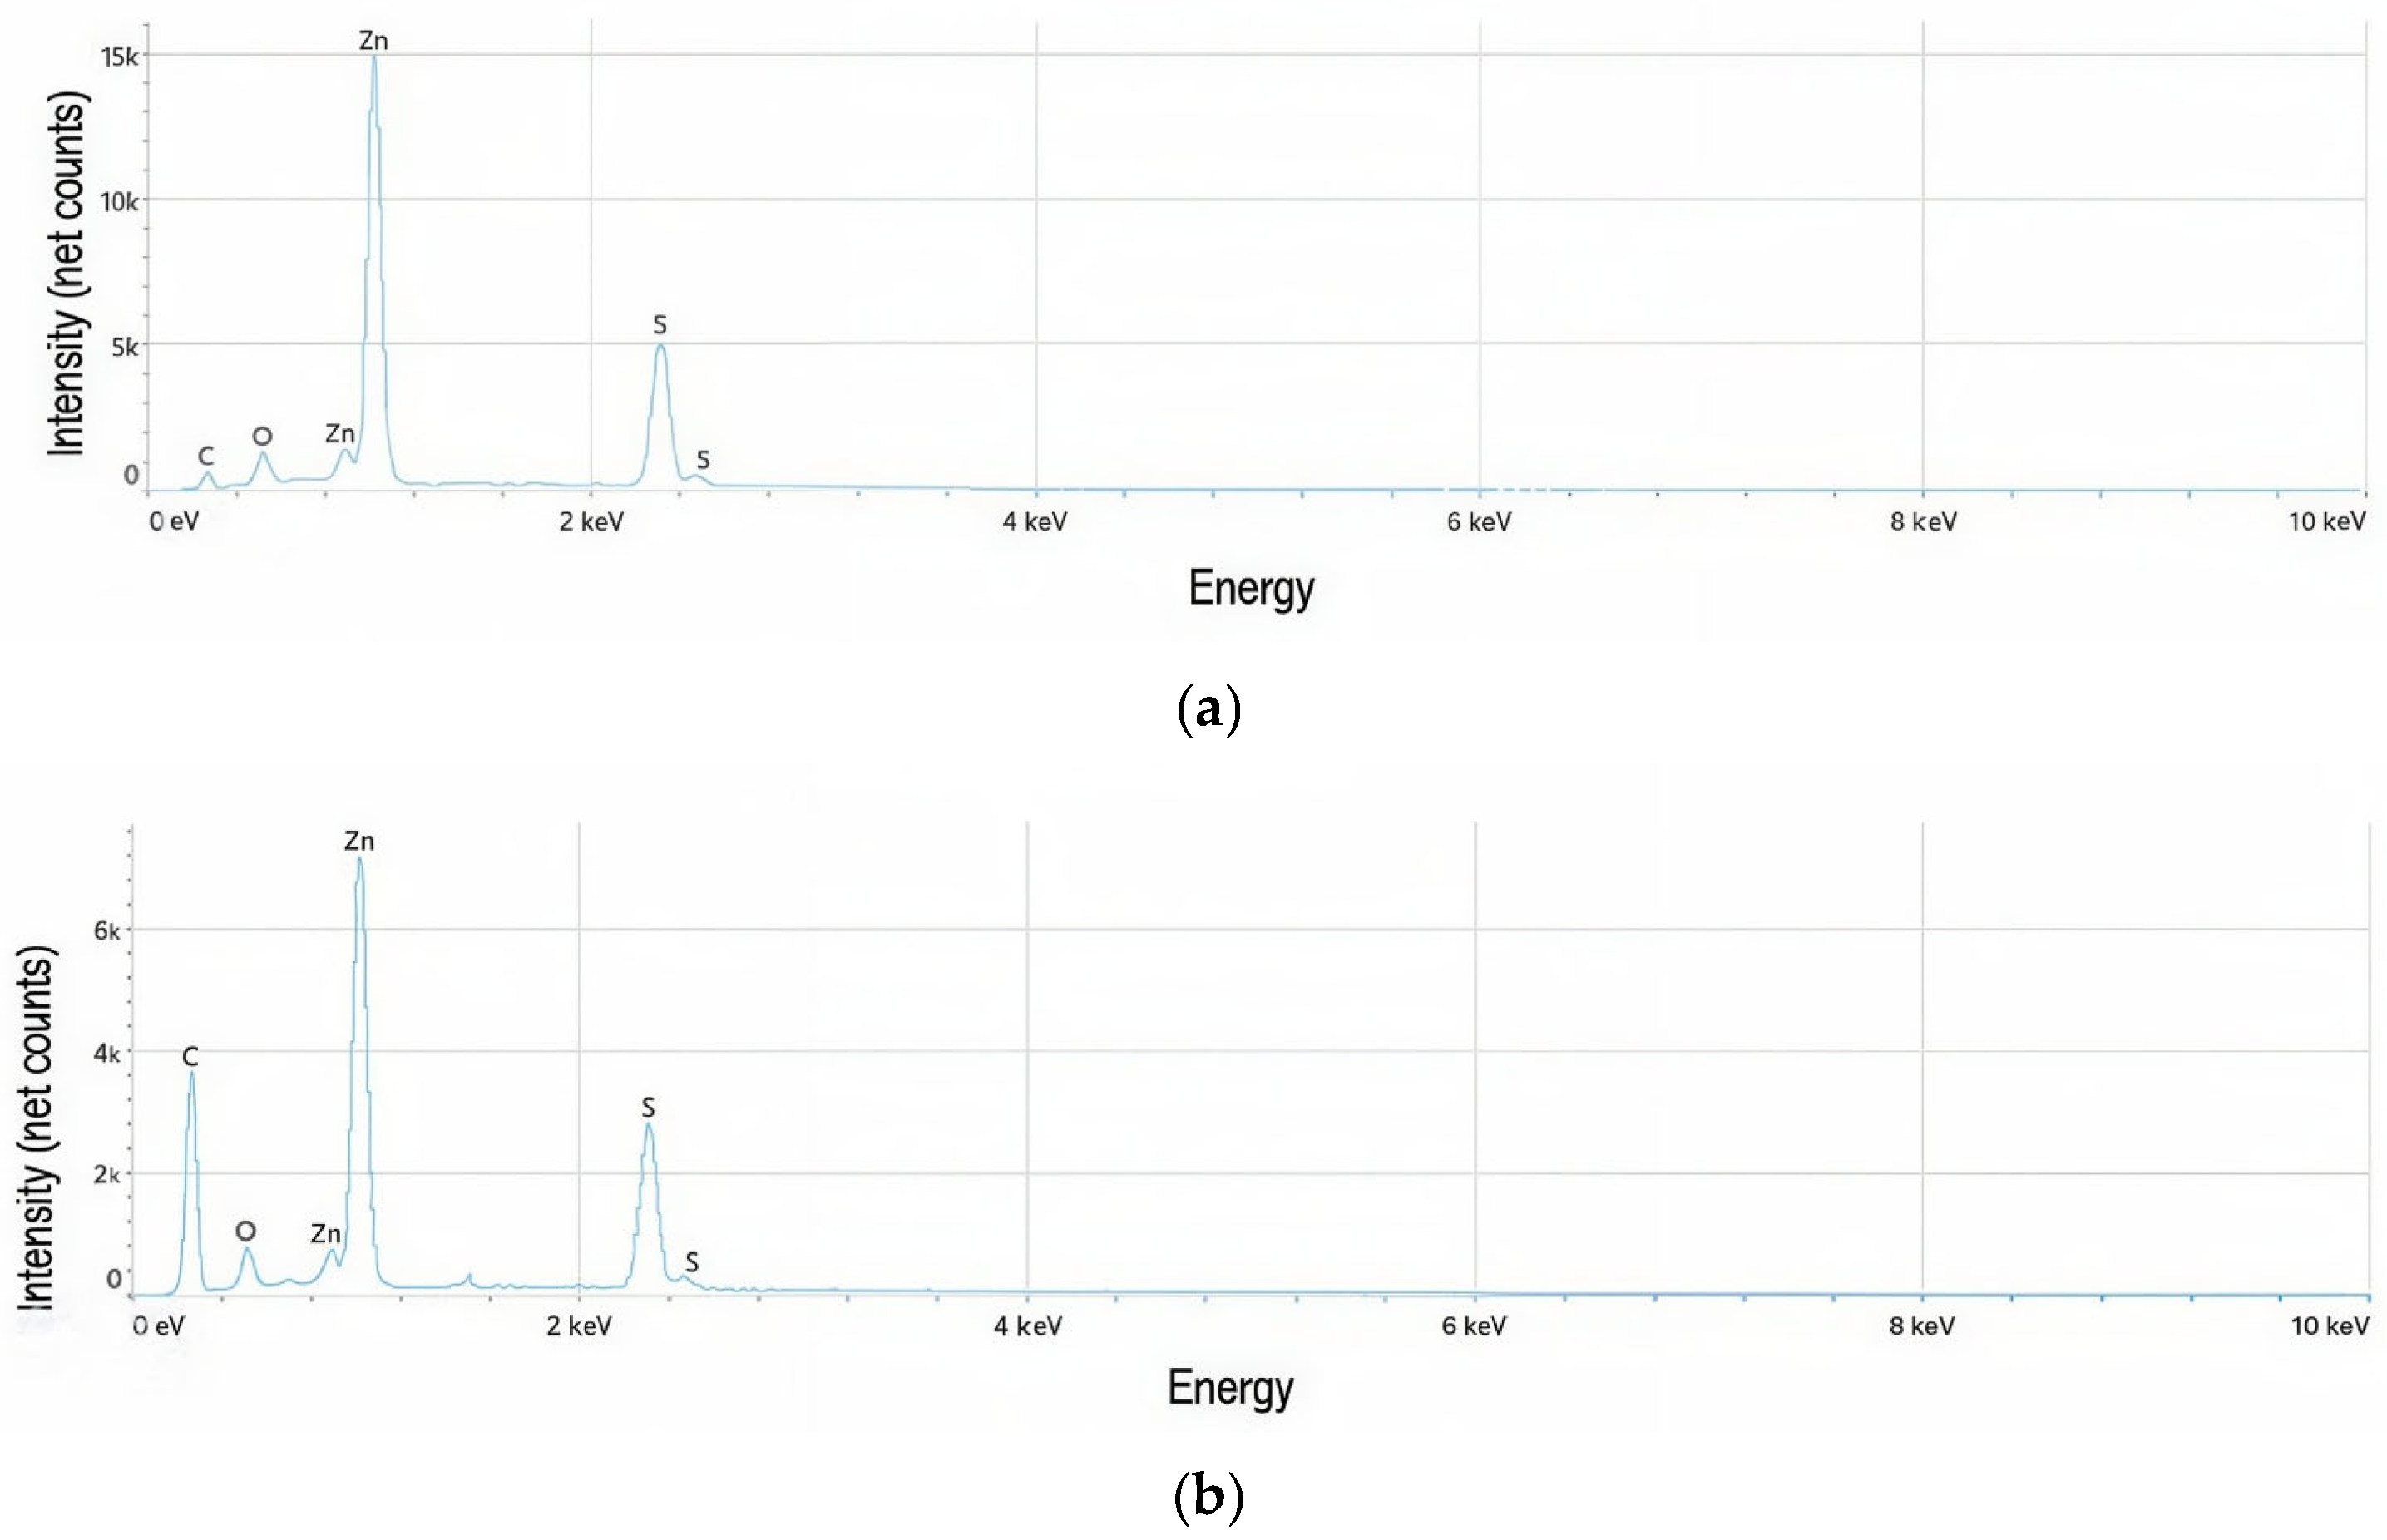
Figure 1 shows the EDX spectra of ZnS particles and ZnS@MWCNT composites for the elemental analysis. The presence of zinc, sulfur, oxygen, and carbon in the samples was confirmed.
EDX analysis results (
Table 1) revealed that the elemental composition of ZnS and ZnS@MWCNT in mass percent is: zinc—64.5 and 47.2%, sulfur—26.3 and 20.0%, carbon—3.6 and 27.5%, and oxygen—5.6 and 5.3%, respectively. The increased carbon content in the composite is due to the presence of carbon nanotubes.
2.2. X-Ray Diffraction (XRD) Results of ZnS Particles and ZnS@MWCNT Composites
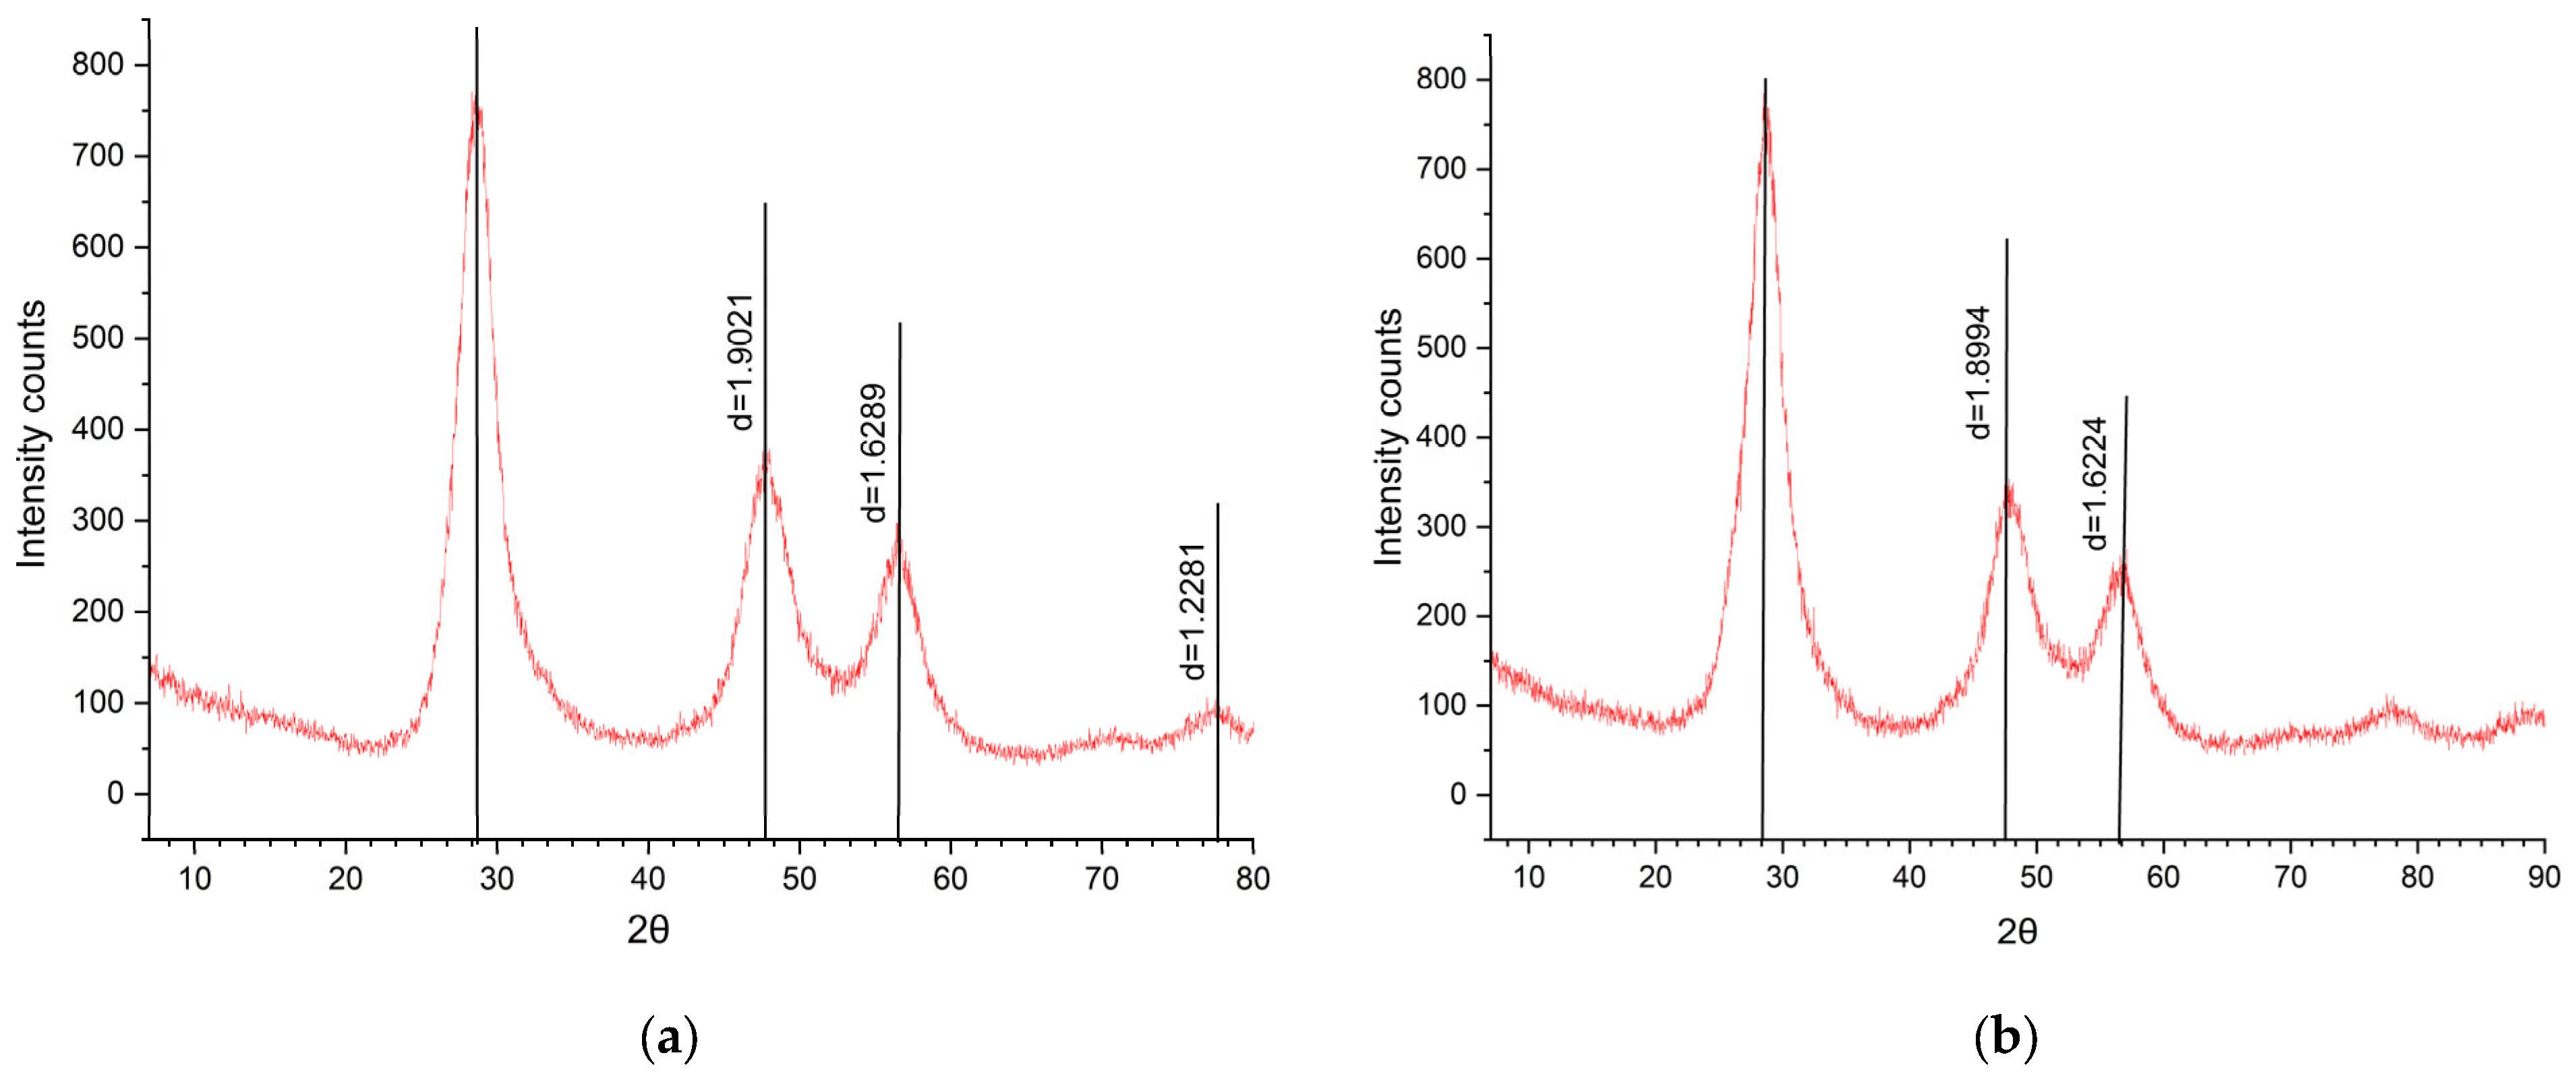
XRD analysis confirmed the presence of the zinc sulfide phase. The XRD pattern (
Figure 2a) revealed characteristic peaks at 2θ = 28.6°, 47.8°, and 56.6°. The XRD data revealed the presence of a ZnS single phase. The characteristic peaks corresponded to the (111), (220), and (311) planes. The obtained data are in good agreement with the standard reference data from the JCPDS database (PDF No. 05-0566), confirming the formation of a crystalline phase of ZnS and the absence of impurity phases within the sensitivity of the method. The average ZnS crystallite size was calculated using the Debye–Scherrer equation applied to the dominant (111) signal in the diffraction patterns:
where
D is the average crystallite diameter,
k is the shape factor (
k = 0.94),
λ is the wavelength (0.15 nm), and
β is the full width at half maximum (FWHM) of the selected peak. The full width at half maximum (FWHM = 0.04887 rad) was obtained for the ZnS diffraction peaks. Crystallite size calculated using the Scherrer formula of ZnS was 2.92 nm and 2.58 nm for the ZnS@MWCNT composites.
In the ZnS@MWCNT composites (
Figure 2b), the characteristic (002) reflection of carbon nanotubes typically appears around 2θ = 26°. In this specific plot, this peak may overlap with the base of the intense (111) ZnS peak or is significantly lower in intensity relative to the inorganic phase, which is common when the ZnS loading is high. The sharp intensity of the ZnS peaks compared to the background suggests that the MWCNTs are effectively coated or embedded with ZnS crystals. The hybrid nature likely combines the high surface area and conductivity of the nanotubes with the semiconducting properties of the ZnS.
Diffraction peak broadening was analyzed using the Williamson–Hall method. The dependences of βcosθ on 4sinθ are linear, indicating the combined contribution of crystallite size and microstrain to the overall peak broadening. The magnitude of microstrain ε was estimated based on the slope of the approximating straight lines. It was found that for the ZnS sample, the ε value is approximately 5.5 × 10⁻⁴, while for the ZnS@MWCNT composite, the microstrain increases to 1.2 × 10⁻³. Thus, the introduction of multi-walled carbon nanotubes leads to a nearly twofold increase in microstrain.
The increase in microstrain indicates an increased density of defects and lattice distortions, which may be due to the interfacial interaction of ZnS with carbon nanotubes, as well as limited crystallite growth. Consequently, the broadening of the diffraction peaks in the ZnS@MWCNT sample is largely due to the contribution of strain, and not just the size effect.
2.3. SEM Images of ZnS Particles and ZnS@MWCNT Composites
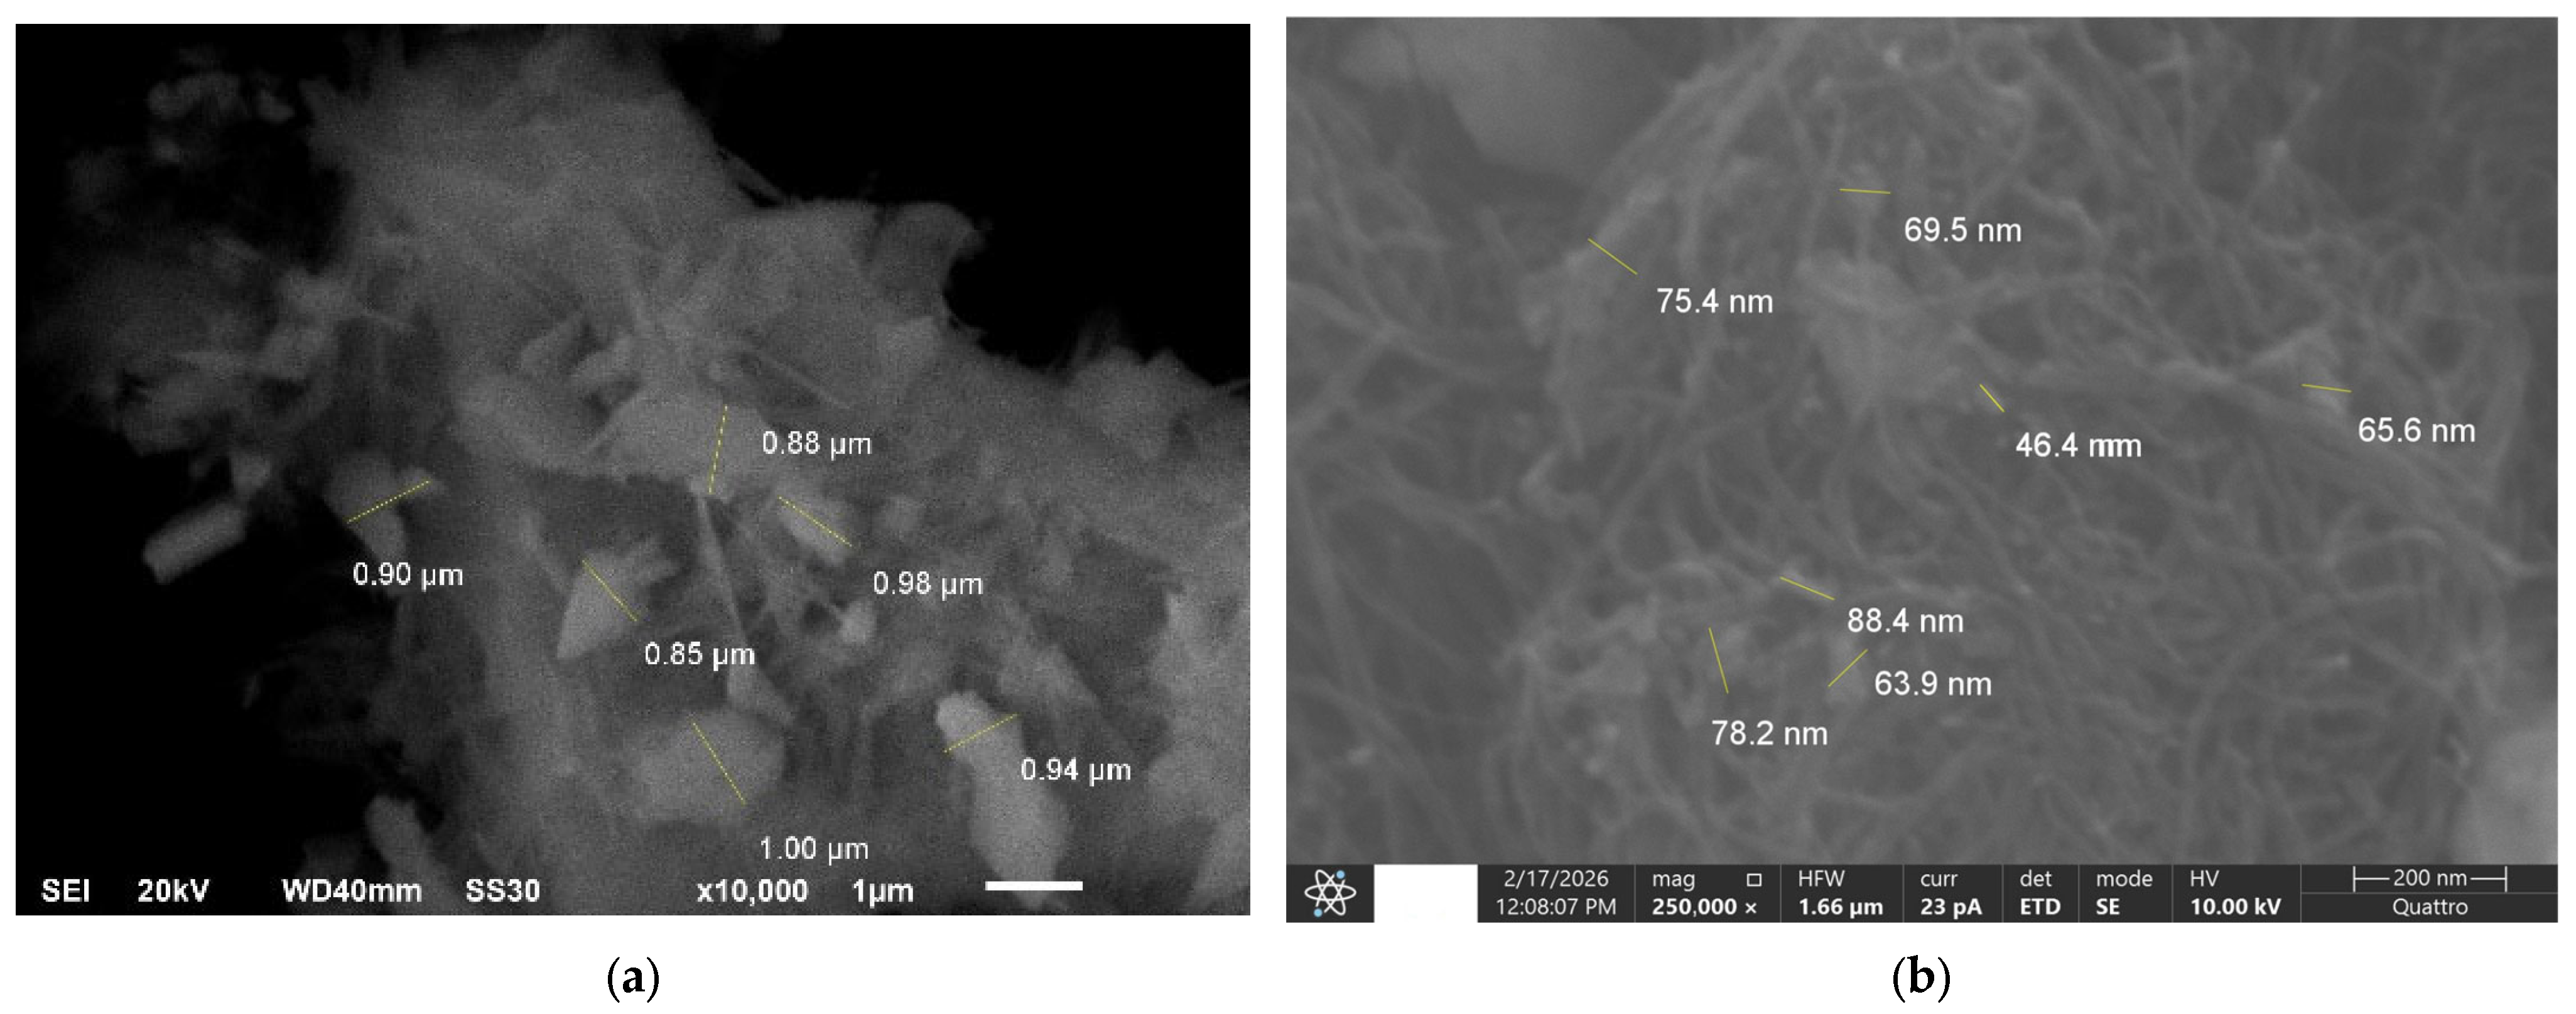
Figure 3 shows the SEM analysis results, where (a) represents the ZnS particles and (b) represents the ZnS@MWCNT composites.
In
Figure 3a, the SEM images show that the zinc sulfide particles have a lamellar morphology. Particle sizes range from 0.8 μm to 1 μm. The image shows pronounced particle agglomeration, with ZnS platelets overlapping and forming a structure.
Figure 3b of the ZnS@MWCNT composites clearly shows that the fine-fibered MWCNTs are intertwined with the ZnS nanoparticles, forming a network-like structure.
Figure 2b shows that the ZnS particle sizes range from 30 to 90 nm.
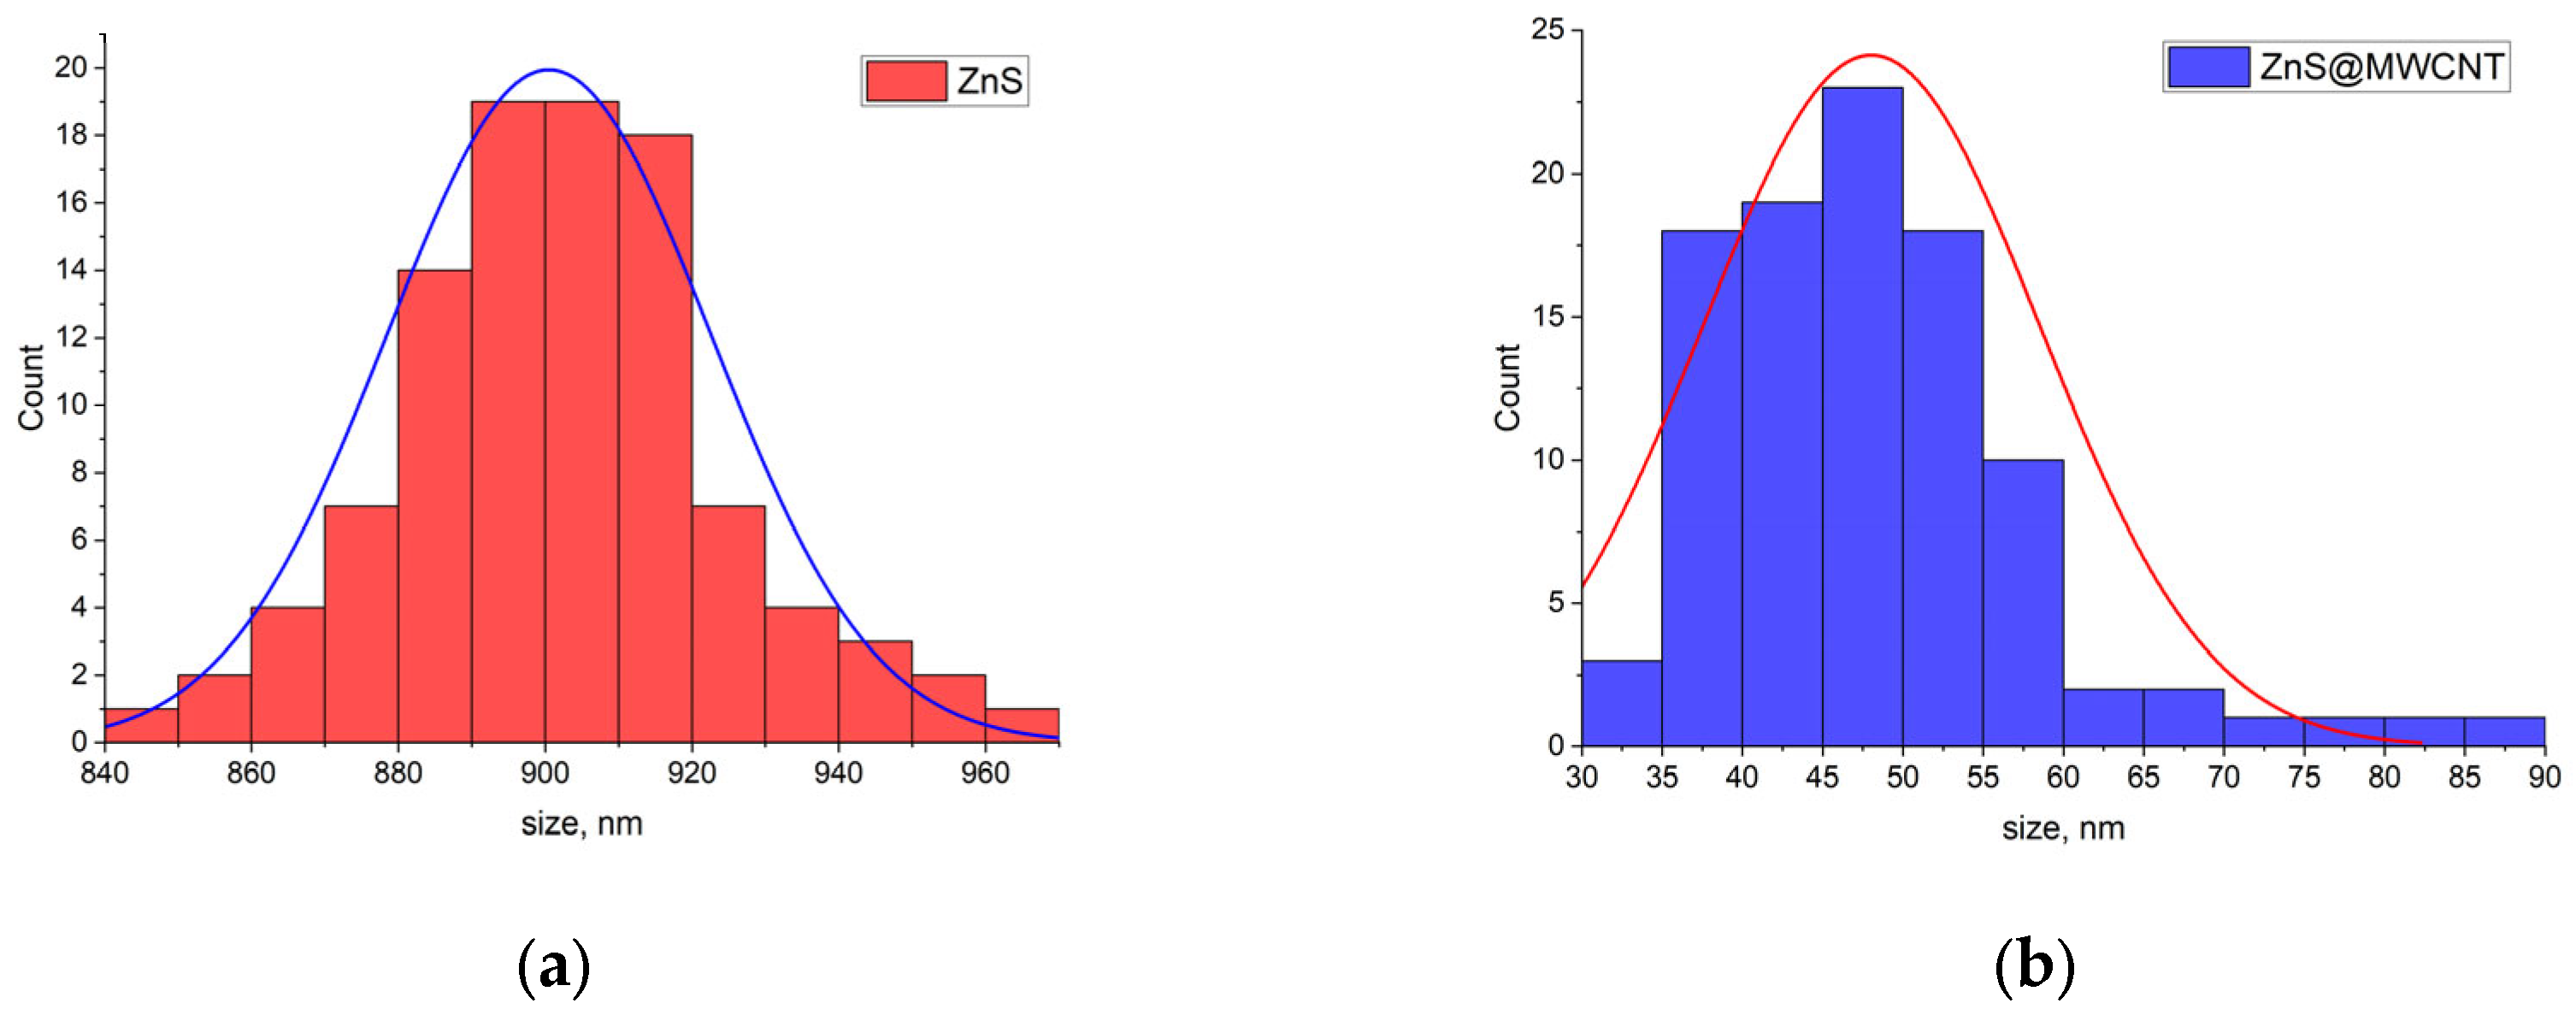
Figure 4 shows histograms of the particle size distribution for the ZnS and ZnS@MWCNT samples. The distributions have a nearly normal (Gaussian) shape, indicating a relatively uniform nanoparticle formation. For the ZnS sample, a distribution with a maximum in the region of larger particle sizes is observed, indicating a tendency toward aggregation and crystallite coarsening. The width of the distribution indicates moderate dispersion of the system. For the ZnS@MWCNT composites sample, the distribution is shifted toward smaller particle sizes and is characterized by a slightly wider width. This may be due to the fact that multiwalled carbon nanotubes (MWCNT) act as a matrix, limiting the growth of ZnS nanoparticles and promoting their more uniform distribution.
The observed reduction in the average particle size in the ZnS@MWCNT composite compared to pure ZnS indicates the influence of the matrix on nucleation and growth processes. Thus, the introduction of MWCNT contributes to a reduction in the average particle size and an increase in the dispersion of the system, which may positively impact the functional properties of the material.
2.4. Raman Spectroscopy Analysis of ZnS Particles and ZnS@MWCNT Composites
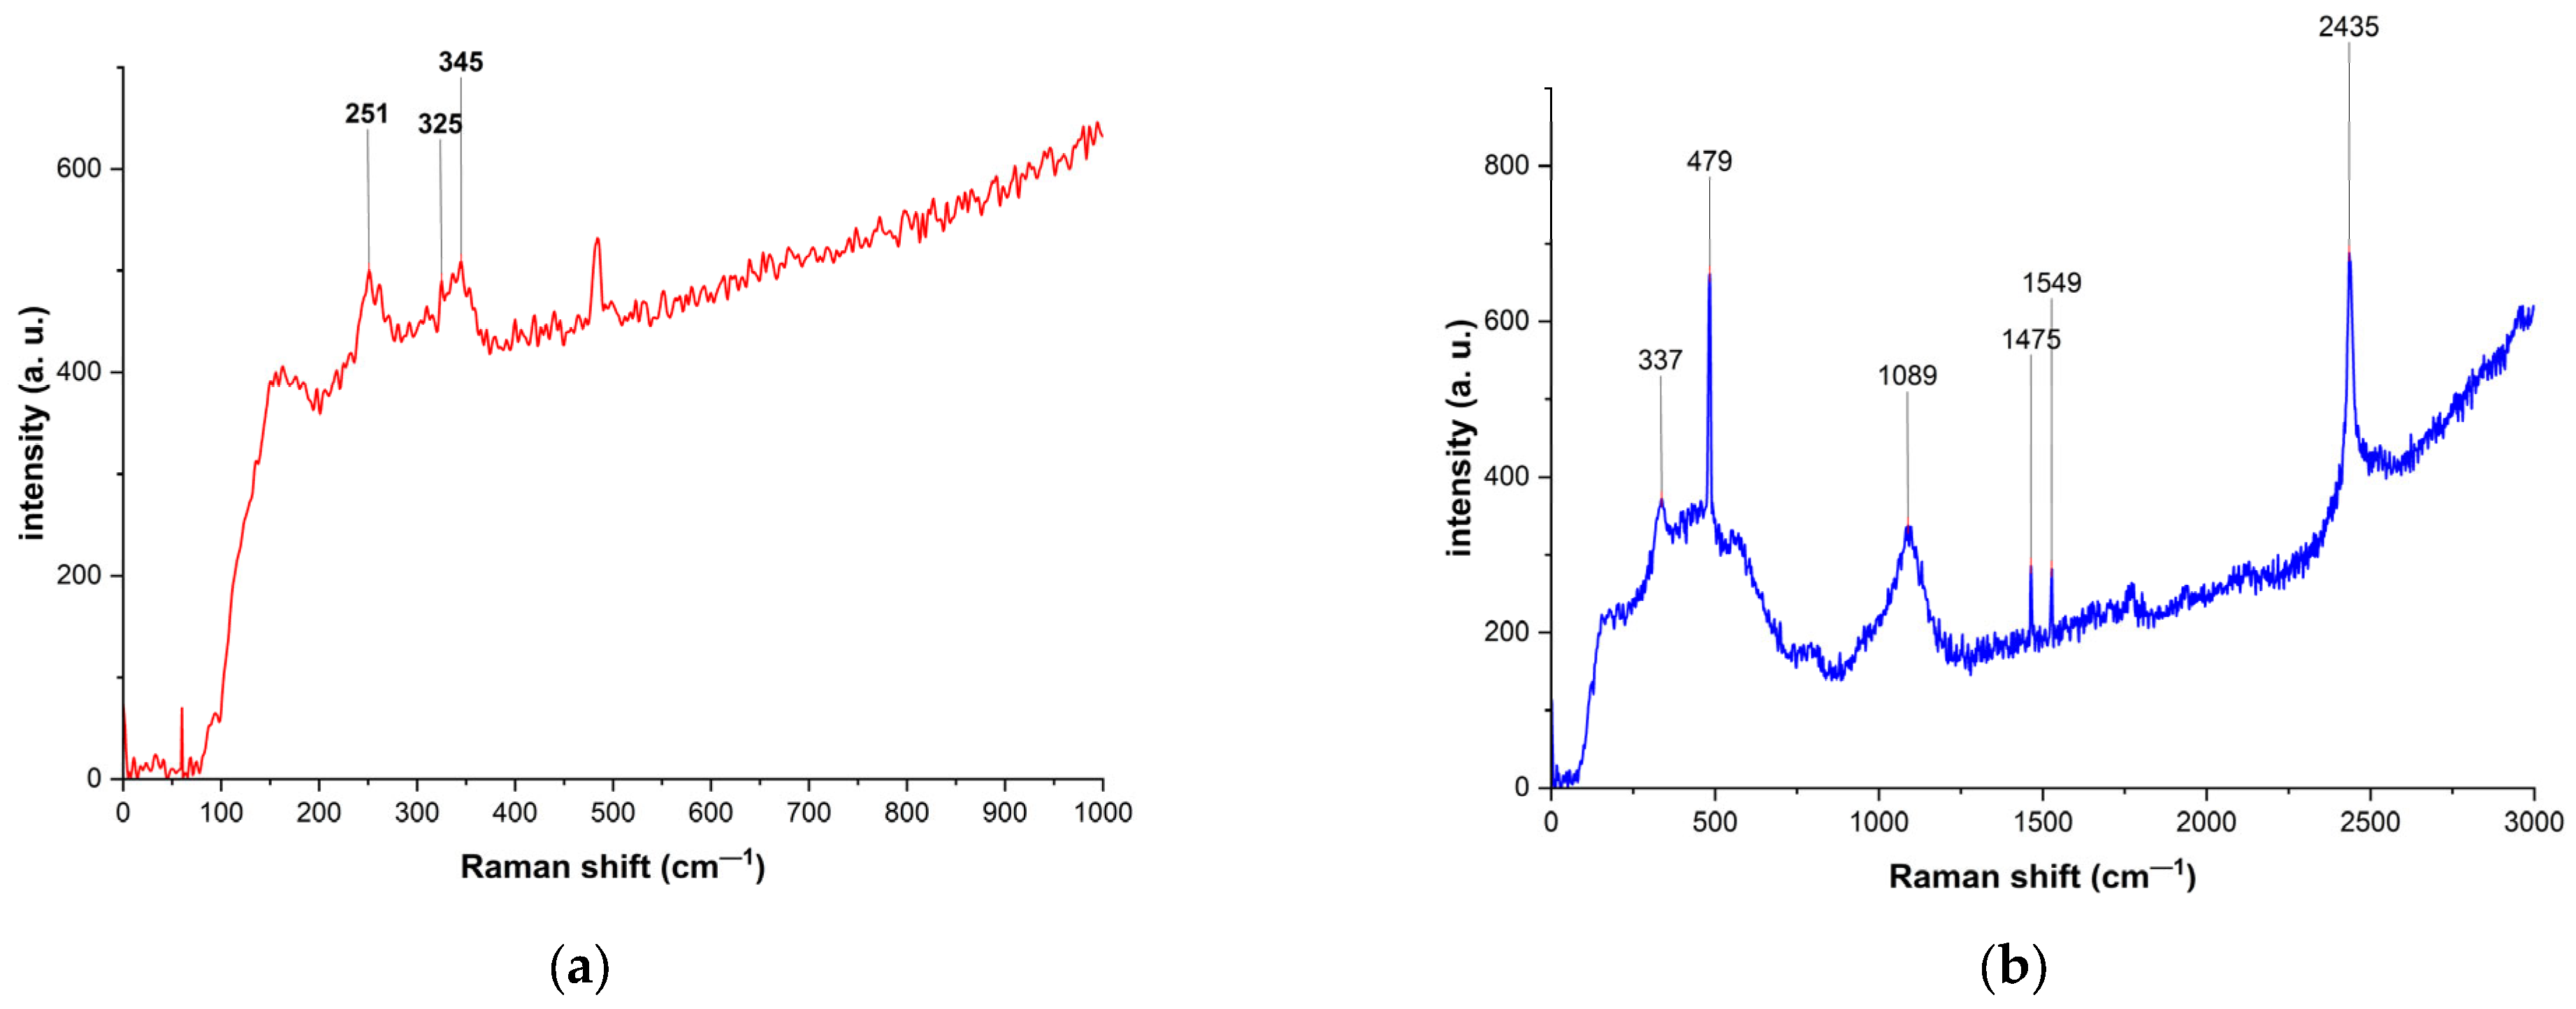
Figure 5 shows the Raman spectra of ZnS particles and the ZnS@MWCNT composites. The Raman shifts in the ZnS particle peaks located at 251 cm
−1 and 345 cm
−1 correspond to transverse (TO) and longitudinal (LO) optical phonons of cubic ZnS. Raman spectroscopy of the resulting hybrid ZnS@MWCNT revealed that the peak at 337 cm
−1 corresponds to the surface phonon mode, while the peak at 479 cm
−1 possibly corresponds to the longitudinal and transverse phonon modes of zinc sulfide. The spectra show characteristic peaks for MWCNT, and the peaks at 1475 and 1549 cm
−1 correspond to the D-band and G-band, respectively; the mixing of the peaks is explained by the zinc sulfide particles. The intensity ratio of the D-band and G-band peaks remains relatively small [
18].
2.5. Thermogravimetric Analysis of ZnS Particles and ZnS@MWCNT Composites
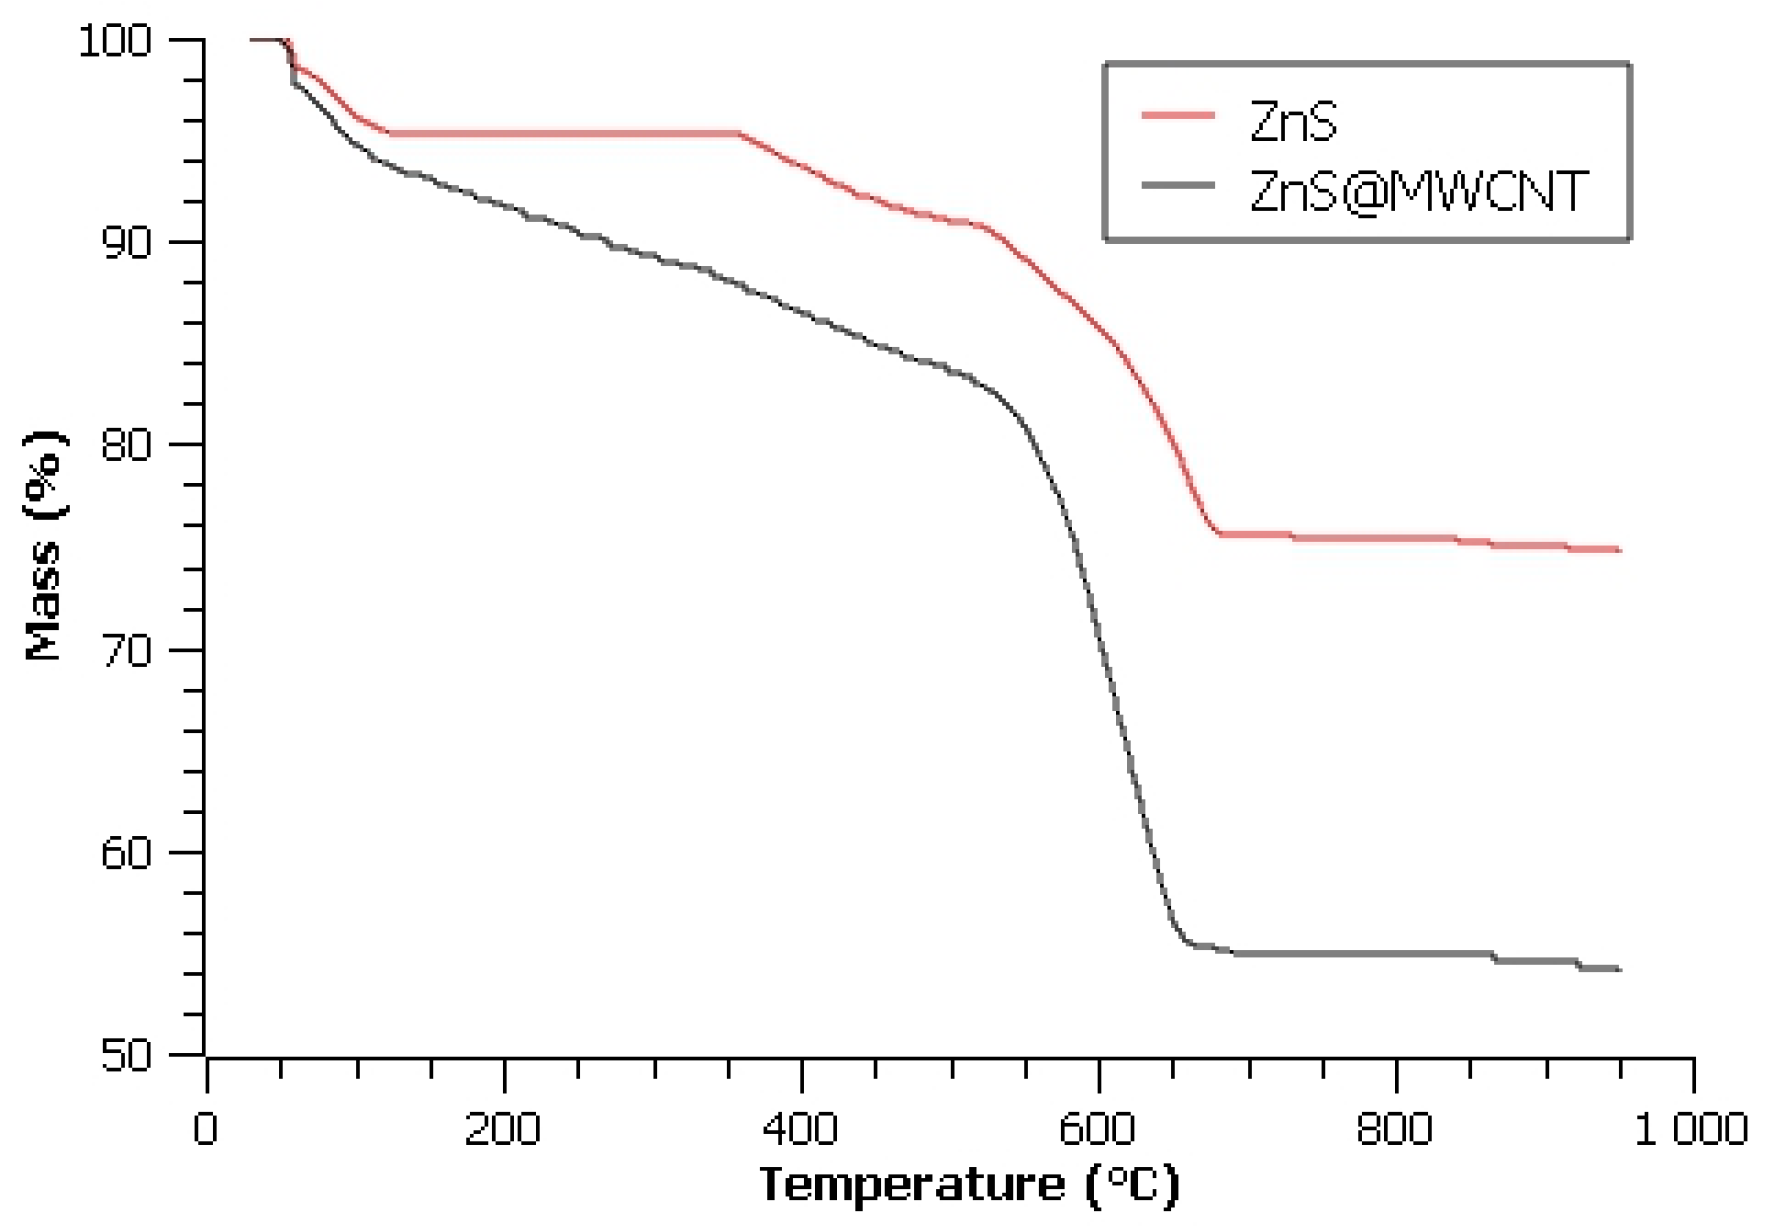
Thermogravimetric analysis revealed a 4.72% mass loss for ZnS particles up to 175 °C, attributed to the removal of adsorbed moisture (
Figure 6). The total mass loss at temperatures up to 650 °C was 19.68%, and remained stable up to 1000 °C, possibly indicating the thermal stability of the ZnS@MWCNT composites. The thermal stability of the ZnS@MWCNT composites is shown in
Figure 6. The total mass loss at temperatures up to 650 °C was 26.40%, which was significantly higher than that of ZnS particles, reflecting the composite’s distinct composition.
2.6. Study of Photocatalytic Activity of ZnS Particles and ZnS@MWCNT Composites
The photocatalytic performance of ZnS particles and ZnS@MWCNT composites was evaluated through degradation under UV irradiation at 254 nm. The degree of methylene blue (MB) photocatalytic degradation efficiency was calculated using:
where
C0 is the initial concentration after 60 min of adsorption, and
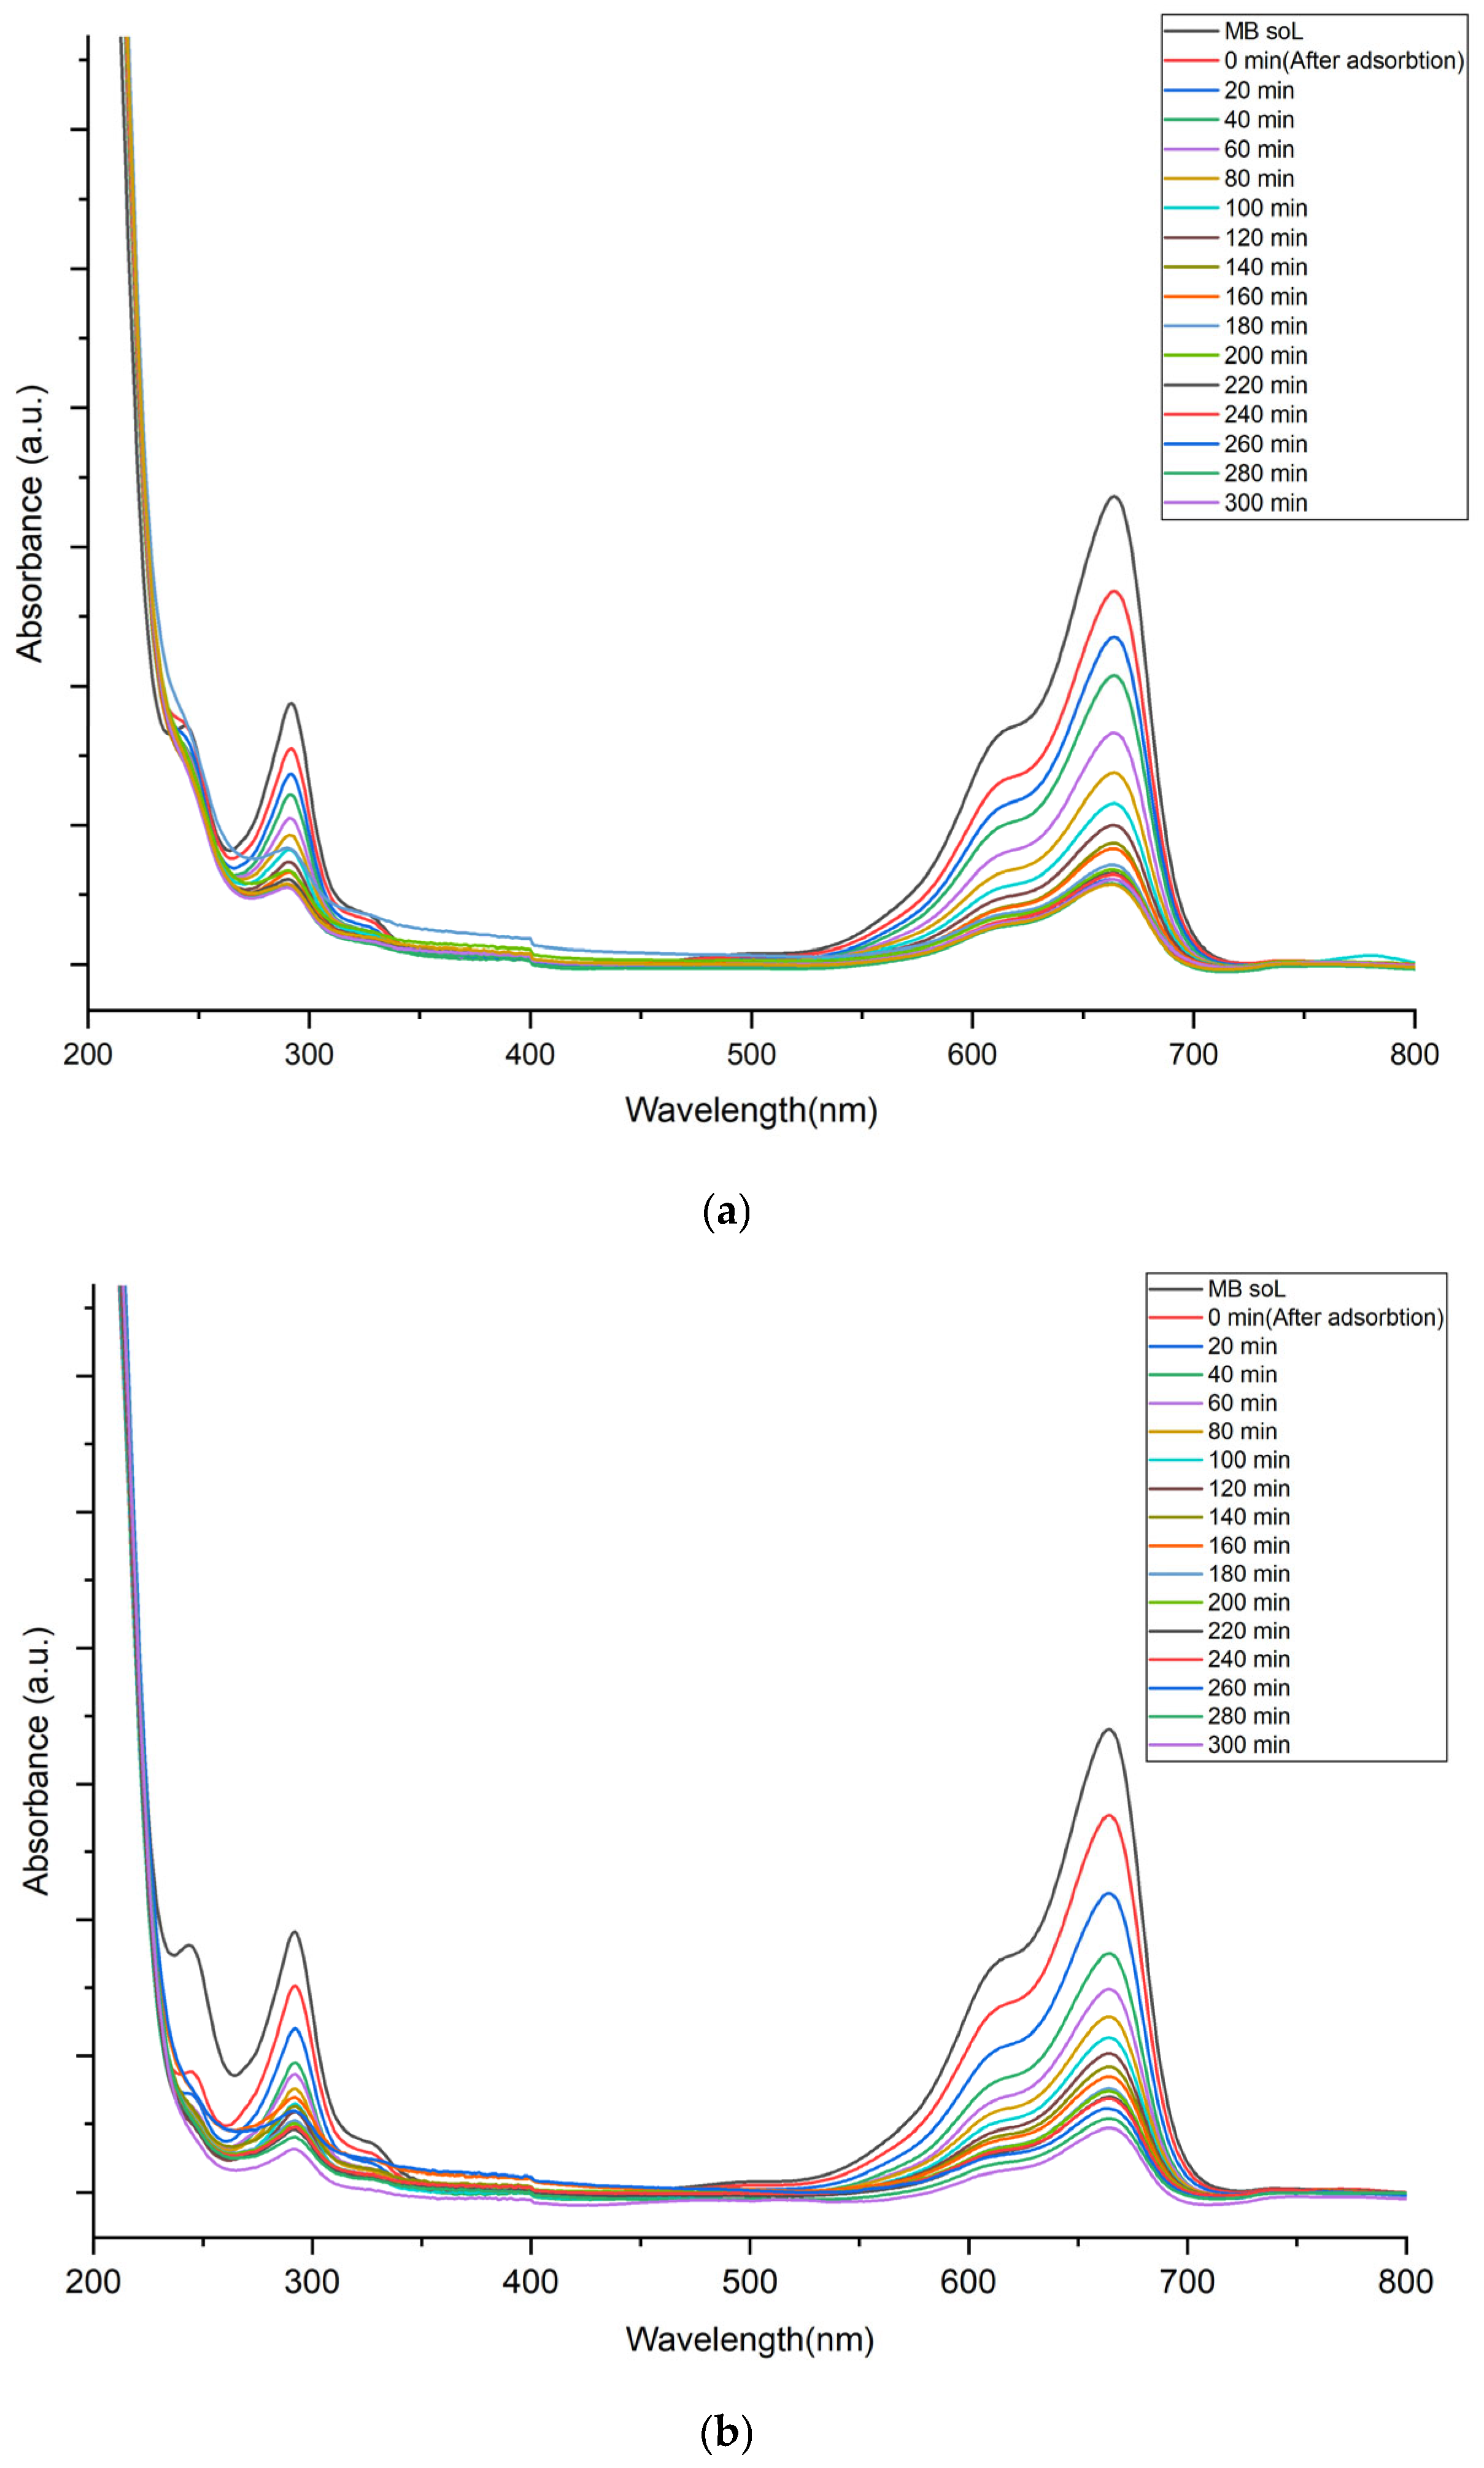
C is the concentration at a given time. All concentrations were obtained based on the maximum concentration at 664 nm using a UV-Vis spectrophotometer.
Figure 7 shows the UV-Vis spectra of MB degradation on ZnS and ZnS@MWCNT under UV irradiation at 254 nm. The degree of MB photocatalytic degradation removal is listed in
Table 2.
Table 2 presents the changes in MB concentration and photocatalytic degradation efficiency over time for ZnS and ZnS@MWCNT composites. In both cases, a characteristic dependence was observed, including a rapid initial stage, followed by a slowdown.
For ZnS, the initial MB concentration was 0.402. Within 60 min, the concentration of MB is 0.206, corresponding to 48.76% removal percentage of photocatalytic degradation. After 120 min, 180 min, 240 min, and 300 min, the concentration of MB is 0.130, 0.102, 0.091, and 0.085, corresponding to 67.66%, 74.62%, 77.36%, 78.85% removal percentage of photocatalytic degradation.
For the ZnS@MWCNT, the initial MB concentration was 0.414. After 60 min, the concentration of MB is 0.223, corresponding to 46.13% removal percentage of photocatalytic degradation. After 120 min, 180 min, 240 min, and 300 min, the concentration of MB is 0.152, 0.113, 0.099, and 0.071, corresponding to 63.28%, 72.70%, 76.08%, 82.85% removal percentage of photocatalytic degradation.
The removal of methylene blue without UV radiation due to adsorption for ZnS was 14.7%, and for ZnS@MWCNT composites, it was 32.0%.
Overall, both series were characterized by a high MB removal rate at the initial stage because of the presence of a large number of free active sites on ZnS@MWCNT composites. In the later stages, the process slows owing to surface saturation and diffusion limitations. The obtained data are consistent with the kinetic analysis in ln(C/C0) coordinates, confirming that the MB removal process is well described by a first-order pseudokinetic model.
3. Discussion
Scanning electron microscopy revealed that ZnS consisted of agglomerated, irregular microparticles ranging from 0.8 to 1.0 μm. The particles exhibited non-uniform, layered, and fragmented surfaces, indicative of defects and crystallite boundaries. Despite the potentially active surface area, pronounced particle agglomeration can limit the access of light and reaction substrates and promote the recombination of photogenerated electron-hole pairs, which reduces the photocatalytic efficiency of pure ZnS.
At higher magnification (×250,000), the SEM image revealed a uniform three-dimensional network of carbon nanotubes with a diameter of ~30–90 nm, with ZnS particles anchored on the tube surfaces and within intertube spaces. Carbon nanotubes effectively prevented ZnS aggregation, ensuring high dispersion of the semiconductor phase. The formation of such a hierarchical nanostructure increases the specific surface area and the number of accessible active sites.
Slight peak shifts and broadening relative to pure MWCNT suggest interaction between ZnS and carbon nanotubes in the hybrid nanocomposite. The D/G band intensity ratio (ID/IG) remains relatively small, indicating a moderate degree of imperfection in the carbon structure.
Ultrasonic treatment can break down large ZnS agglomerates. Ultrasonic dispersion creates cavitation bubbles in a liquid medium, which, upon collapse, generate localized shock waves and microjets that disrupt interparticle bonds in the agglomerates and reduce their size to primary particles/small agglomerates. In this study, ultrasonic treatment was used to break down aggregates and produce a more homogeneous suspension of ZnS particles. This is confirmed, in particular, by a reduction in aggregate size according to SEM data and increased dispersion stability after treatment.
The kinetics of MB removal using ZnS and ZnS@MWCNT composite materials were studied based on the changes in pollutant concentration and removal rate over time.
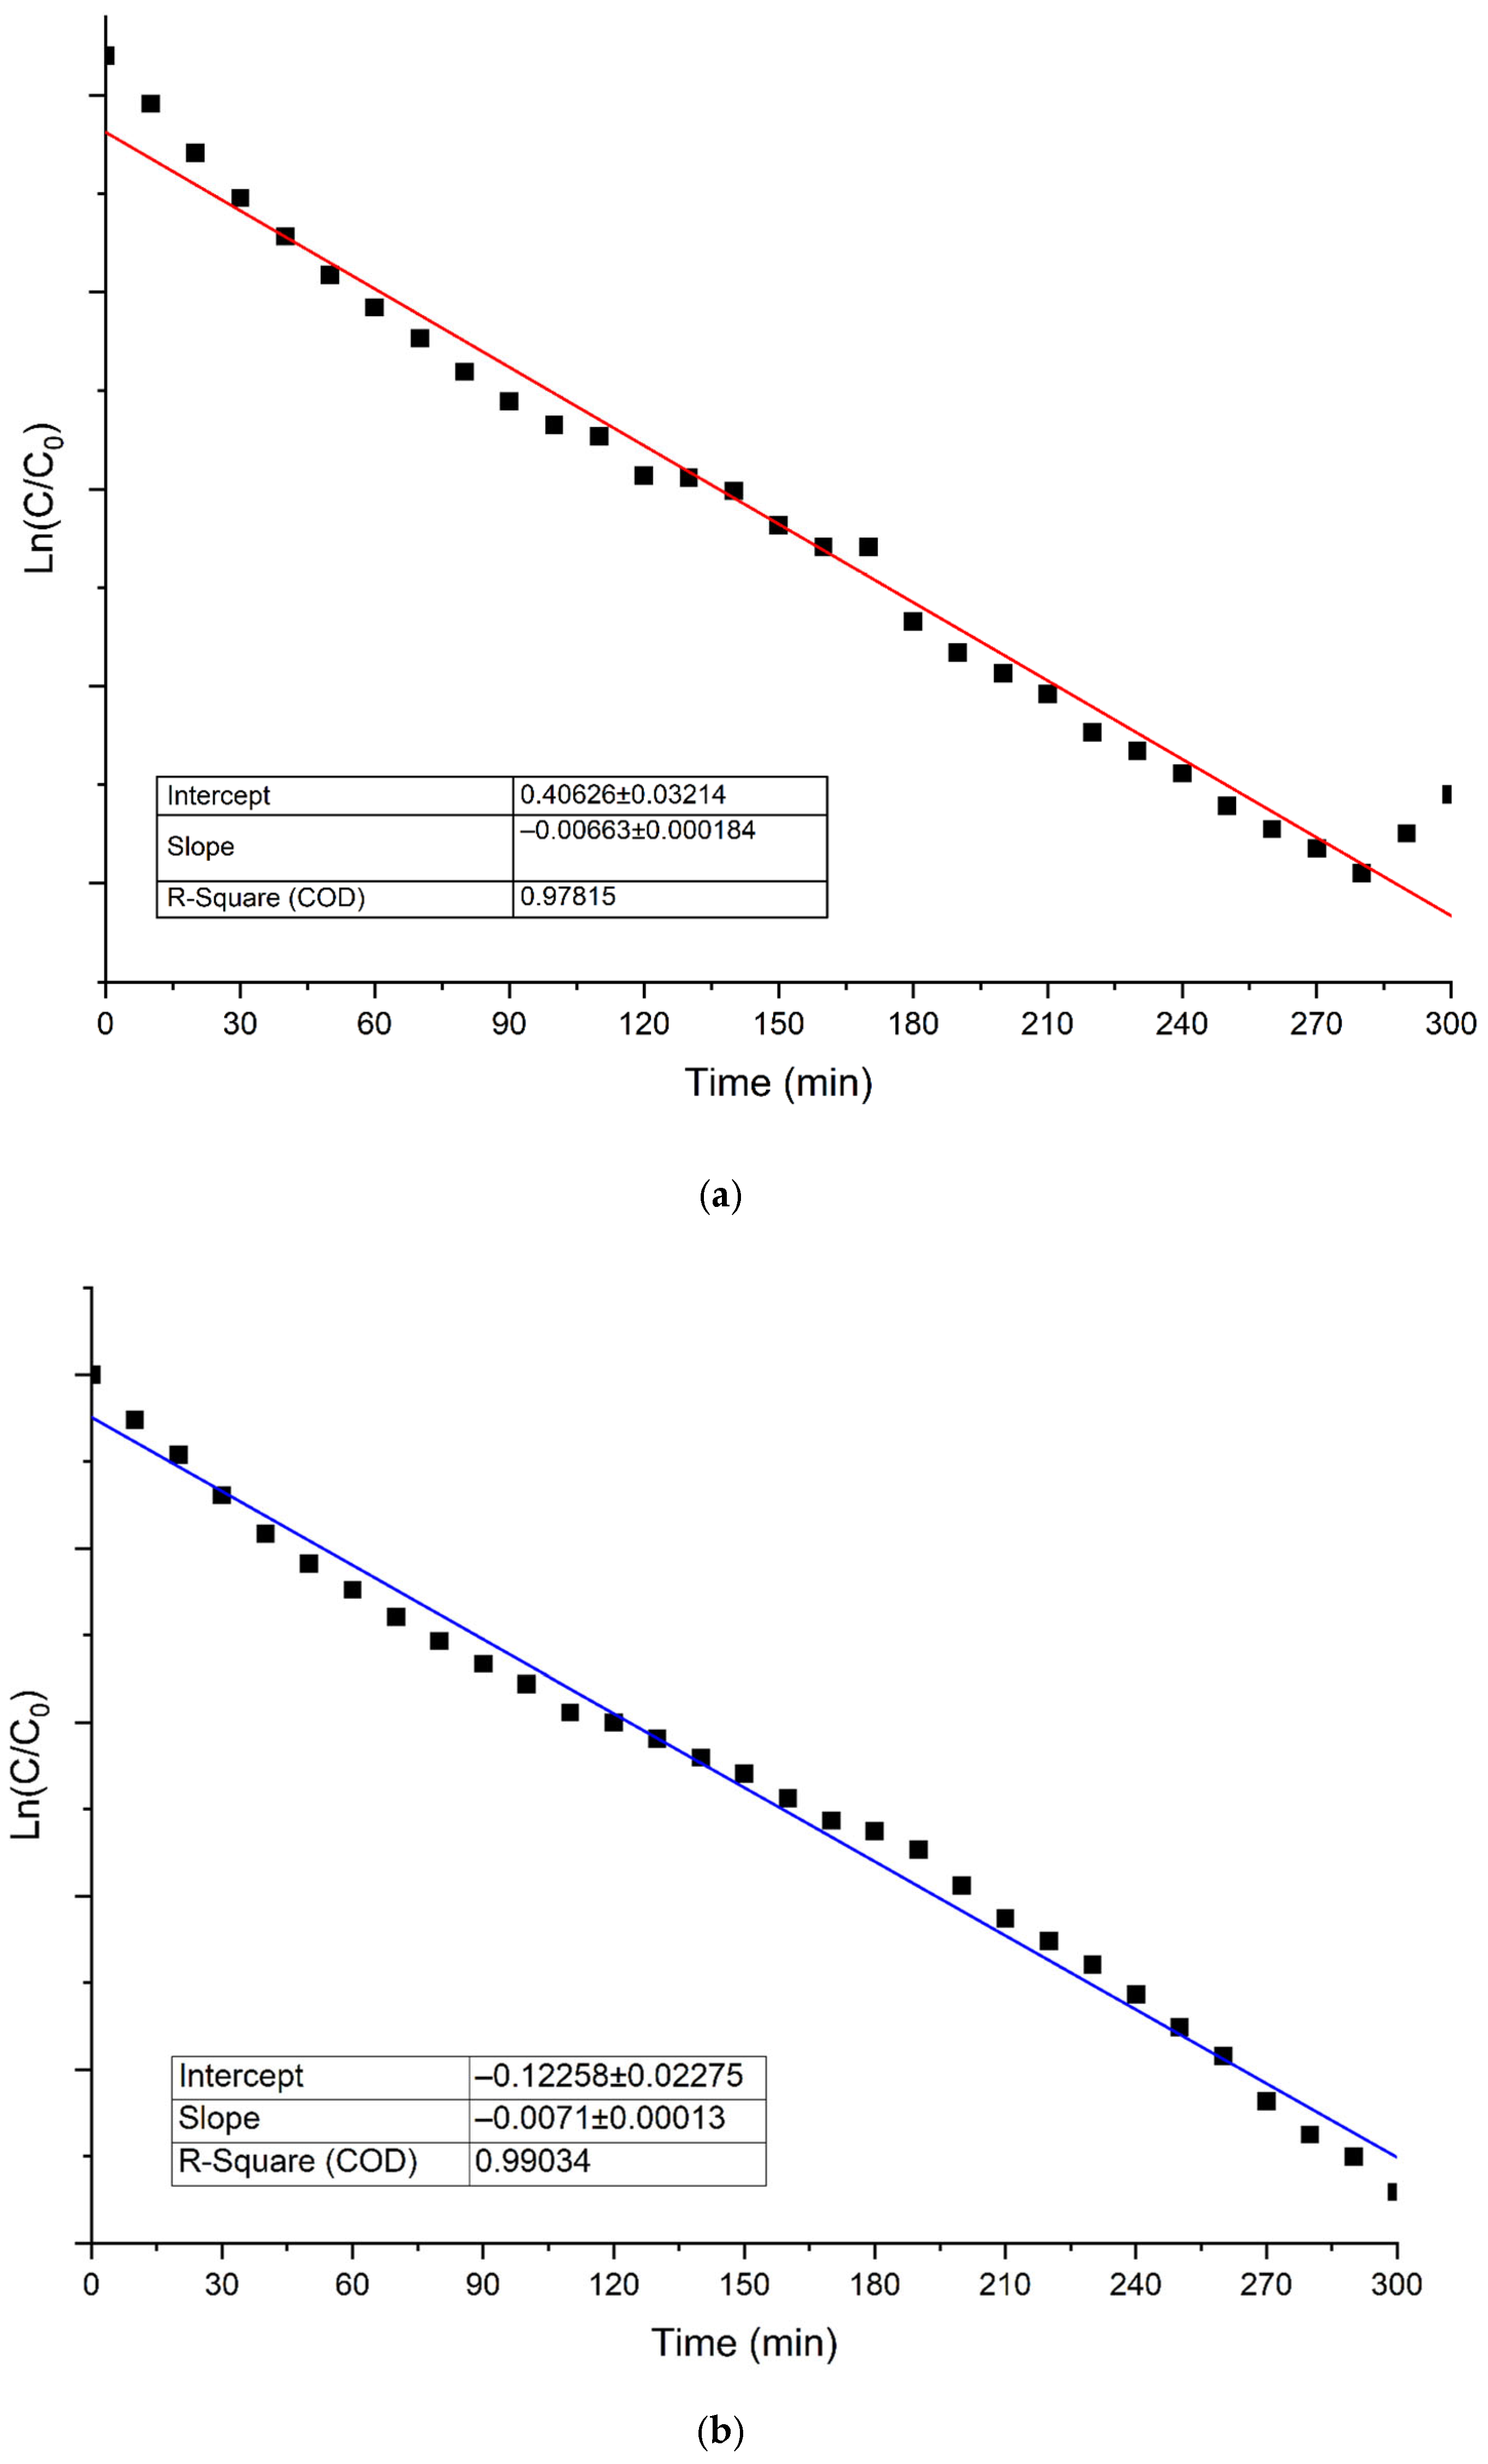
Figure 8 presents the results of a study on the kinetics of photocatalytic MB degradation using ZnS and ZnS@MWCNT composites under UV irradiation at 254 nm. The slope of the pseudo-first-order reaction rate was calculated as
where k is the rate constant, C
0 is the initial concentration, and C is the concentration at time t, b is the intercept. The rate constants (k) and coefficients of determination (R
2) of the pseudo-first-order reaction were calculated from the slope in
Figure 8.
Figure 8a,b show the kinetic curves for MB removal using ZnS and ZnS@MWCNT in ln(C/C
0)—time (min) coordinates, corresponding to different initial solution concentrations. In both cases, a pronounced linear dependence of ln(C/C
0) on time is observed, indicating that the process conforms to a pseudo-first-order kinetic model. For ZnS (
Figure 8a), the slope is 0.00663 min
−1 with a high coefficient of determination (R
2 = 0.97815), while for ZnS@MWCNT composites (
Figure 8b), the rate constant increases to 0.0071 min
−1 with R
2 = 0.99034.
The higher rate constant in
Figure 8b indicates more efficient MB removal, likely due to enhanced pollutant interaction and greater utilization of active sites on the ZnS@MWCNT composites’ surface. Negative intercept values in both cases reflect a rapid initial stage, driven by the high accessibility of adsorption sites.
The integration of ZnS with carbon nanotubes promotes improved light absorption owing to multiple scattering in the MWCNT matrix, efficient transfer of photogenerated electrons from ZnS to the MWCNT, which acts as an electron acceptor, and electron-hole pair recombination, and increases photocatalyst stability under repeated irradiation cycles.
The kinetics of photocatalytic degradation of methylene blue were analyzed using a pseudo-first-order model, which is widely used for heterogeneous photocatalytic processes at low concentrations of organic pollutants. Under these conditions, the concentration of active catalyst sites and reactive species (such as hydroxyl radicals •OH and superoxide anion radicals •O2−) remains virtually constant, allowing the process to be described by a simplified kinetic equation.
Under UV radiation, ZnS generates electron-hole pairs (e
−/h
+), which participate in the formation of reactive radicals:
The resulting radicals are the primary oxidizing agents responsible for the degradation of dye molecules. In the ZnS@MWCNT composites, carbon nanotubes act as electron acceptors, reducing the rate of electron-hole pair recombination and thereby increasing the efficiency of reactive oxygen species generation.
Linearization of the experimental data in ln(C0/C) coordinates versus time revealed high values of the coefficient of determination (R2 > 0.98), confirming the applicability of the pseudo-first-order model. Alternative kinetic models, such as pseudo-second order, demonstrate a poorer approximation of the experimental data.
Thus, the choice of the pseudo-first-order model is justified both by the specific features of the photocatalytic reaction mechanism (the participation of reactive radicals at a quasi-steady-state concentration) and by its high agreement with the experimental data.
The increased photocatalytic activity of the ZnS@MWCNT composites compared to pure ZnS is likely due to more efficient separation and transfer of photoinduced charges. Carbon nanotubes can act as a conductive matrix, facilitating electron transfer and reducing the probability of electron-hole pair recombination.
Indirect evidence for this behavior is provided by EDX and Raman spectroscopy, X-ray diffraction data, which indicate the formation of a composite structure and interaction between ZnS and MWCNT. This interaction presumably contributes to improved charge transfer.
A quantitative assessment of the reduction in electron–hole recombination in the ZnS@MWCNT composites can be indirectly determined using the rate constants for the photocatalytic degradation of methylene blue. It was found that the reaction rate constant for ZnS@MWCNT composites (k1) is higher than that for pure ZnS (k0), indicating more efficient utilization of photoinduced charge carriers.
The degree of recombination suppression can be estimated using the ratio of rate constants (k1/k0). An increase in this parameter indicates increased charge separation efficiency and a reduced probability of charge recombination.
4. Materials and Methods
Zinc nitrate hexahydrate (Zn(NO3)2·6H2O), polyvinylpyrrolidone (PVP, molecular weight ∼10,000), sodium sulfide nonahydrate (Na2S·9H2O), methylene blue (C16H18ClN3S), and multiwalled carbon nanotubes (MWCNT) were obtained from Sigma-Aldrich (St. Louis, MO, USA).
The MWCNT had a purity of more than 90% of the carbon base, a diameter of 110–170 nm, a length of 5–9 μm, and no surface treatment.
The elemental composition of the photocatalysts was determined using energy-dispersive X-ray (EDX) spectroscopy with a QUANTA 3D 200i (FEI, Long Island, NY, USA) at an accelerating voltage of 20 kV.
X-ray powder diffraction (DW-27 Mini, Dandong, Dongfang, 128 Dandong, China) (XRD) was used to study the crystal structure of the samples. CuKα radiation was applied at 40 kV and 40 mA in the 2θ range from 5 to 90° with a scan rate of 0.2 s/step.
Raman spectroscopy (B&W Tek i-Raman Plus, BWS465-532S, Spectra Research Corporation, Mississauga, ON, Canada) was used to study the lattice vibrations of the samples excited by a 40 mW Nd: YAG laser with a wavelength of 532 nm.
The surfaces of the samples were examined using a scanning electron microscope JSM-6510 (JEOL Ltd., Tokyo, Japan) at a magnification of 10,000~25,000× and an accelerating voltage of 10–30 kV.
Thermogravimetric analysis of the samples was carried out using a TGA 101 thermogravimetric analyzer (Guangdong Newgoer Instrument Co., Ltd., Guangdong, China) in a nitrogen atmosphere.
UV spectrophotometry Lambda 35 (PerkinElmer Company, Springfield, IL, USA) of the synthesized ZnS particles and ZnS@MWCNT composites was used to evaluate the photocatalytic activity and degradation kinetics of methylene blue under the influence of UV light with a wavelength of 254 nm. A UV lamp (Vilber Lourmat, Marne La Valle, France) 6 W, 254 nm was used for irradiation.
4.1. Synthesis of ZnS Particles and ZnS@MWCNT Composites
A solution of 80 mL of deionized water containing 0.9520 g of zinc nitrate hexahydrate [Zn(NO
3)
2·6H
2O] and 0.64 g of polyvinylpyrrolidone (final PVP concentration 0.10 mM) was prepared under constant magnetic stirring until complete dissolution of precursors. Under vigorous stirring, 80 mL of an aqueous solution containing 0.4181 g of sodium sulfide nonahydrate (Na
2S·9H
2O) was added dropwise to the Zn(NO
3)
2–PVP solution. The solution gradually turned turbid white, indicating the nucleation and growth of ZnS particles. Then, the reaction was left to react for 30 min. The synthesis was repeated with reduced PVP (0.32 g, 0.05 mM) and without PVP to assess the stabilizer’s role in particle formation. The resulting suspension was washed several times via centrifugation at 22,673×
g to remove excess polymers and byproducts. In the final centrifugation step, the supernatant was removed, and the precipitate containing ZnS was collected [
23]. The precipitate was dried at 90 °C for 12 h, then finely ground using a ceramic mortar and pestle to yield ZnS powder, stored in an airtight container for further use.
To prepare ZnS@MWCNT composites, 10 mg of MWCNT was added under ultrasonic conditions. Ultrasonic irradiation of the sample was carried out in continuous mode using an ultrasonic processor VCX-750 (Sonics & Materials Inc., Newtown, CA, USA) with a frequency of 20 kHz and nominal power of 750 W for 30 min. The ultrasonic processor was a horn-type system with a 13 mm horn tip. The ZnS@MWCNT composites were prepared with a carbon nanotube content of 0.5 wt% relative to the total mass of solid precursors.
4.2. Study of the Photocatalytic Activity of ZnS Particles and the ZnS@MWCNT Composites in the Degradation of Methylene Blue
Zinc sulfide particles and ZnS@MWCNT composites were used to degrade an MB dye solution. The methylene blue solution was prepared by dissolving 5 mg of the dye in 100 mL of water (50 mg/L). After preparing the methylene blue storage solution, aliquot 0.23 mL from the solution and dilute it with 9.77 mL of distilled water. For UV spectroscopic analysis, the optical density of the solution was adjusted to 0.5, which corresponds to the optimal measurement range. Further measurements were performed without changing the initial solution concentration.
In the absence of light, the solution was stirred for 60 min to achieve an adsorption–desorption equilibrium, firstly, between the MB molecules and ZnS particles, secondly, between the MB molecules and hybrid ZnS@MWCNT composites.
Catalyst dosage was 0,1 mg/mL, stirring of the solution for 30 min, distance from the UV light source was 5 cm.



 ,
,