Article

Nafion-Treated Nickel Oxide/Graphene (Nafion-NiOx/GP) Electrocatalysts for Dopamine Detection

by
Georgia Balkourani
1,
Carmelo Lo Vecchio
2,
Vincenzo Baglio
2,
Angeliki Brouzgou
3,* and
Panagiotis Tsiakaras
1,*
1
Laboratory of Alternative Energy Conversion Systems, Department of Mechanical Engineering, School of Engineering, University of Thessaly, Pedion Areos, 38834 Volos, Greece
2
Institute of Advanced Energy Technologies “Nicola Giordano”, Consiglio Nazionale delle Ricerche, Via Salita Santa Lucia Sopra Contesse, 5, 98126 Messina, Italy
3
Laboratory of Hydrogen and Fuel Cell Nanotechnology, Department of Energy Systems, School of Technology, University of Thessaly, Geopolis, Regional Road Trikala-Larisa, 41500 Larisa, Greece
*
Authors to whom correspondence should be addressed.
Catalysts 2026, 16(3), 217; https://doi.org/10.3390/catal16030217
Submission received: 5 December 2025 / Revised: 17 January 2026 / Accepted: 27 January 2026 / Published: 1 March 2026
(This article belongs to the Special Issue 15th Anniversary of Catalysts: Feature Papers in Electrocatalysis)

Abstract

Herein, (Nafion-treated) (30 wt%) NiOx/graphene (GP) were prepared at 250 °C and 450 °C and investigated as materials for dopamine electrochemical detection. Initially, characterization of the samples was performed using high-resolution transmission electron microscopy (HRTEM), X-ray diffraction (XRD), and X-ray photoelectron spectroscopy (XPS) techniques. Subsequently, they underwent electrochemical evaluation using cyclic voltammetry, linear sweep voltammetry (LSV), differential pulse voltammetry (DPV), and chronoamperometry (CA) techniques. All electrochemical measurements of the dopamine oxidation reaction (DOR) were performed in a 0.1 M phosphate buffer solution (PBS) at pH of 7.00 and at temperature of 36.6 °C. It was found that Nafion addition to the electrocatalysts surface facilitates access of the cationic dopamine molecule to their active centers being attributed to Nafion cation permeability. Nafion-NiO250/GP exhibited higher activity towards the DOR reaction. The limit of detection (LOD) for the lower linear range of 0.5–10 μM was calculated to be 0.8 μM, with a sensitivity of 3.086 μA μM−1cm−2. Furthermore, the Nafion NiO250/GP/GC electrode exhibited high selectivity towards DA, as well as good repeatability and reproducibility with an acceptable level of deviation, and excellent storage stability. The six electrodes produced from the Nafion-NiO250/GP showed 8.28% reproducibility (RSD), indicating adequate behavior, while the same electrode after six measurements over a 30-day period showed an RSD of 5.50%, indicating a reliable electrode.

1. Introduction

Dopamine (DA) is a nitrogen-containing organic compound involved in nerve impulse transmission in our body. As an important catecholamine neurotransmitter, it has several important roles in the brain and body, regulating the proper functioning of the renal, hormonal, central nervous, and cardiovascular systems. Deviations from normal DA levels can cause neurological disorders such as Parkinson’s disease, restless legs syndrome, schizophrenia, drug addiction, and attention deficit hyperactivity disorder [1,2].
Current dopamine sensing methods are restricted by: (i) poor selectivity mainly due to the ascorbic and uric acid interferences, (ii) instability, (iii) the need for sample prep, high-cost equipment, and time-consuming as well as complex preparation method of the sample analysis. Thus, real-time, sensitive, and practical solutions for clinical use should be provided [3].
Compared to enzyme-based sensing, non-enzymatic electrochemical sensing offers longer stability and durability since there is no limitation of enzyme degradation. It is also lower in cost, simpler to fabricate and enables rapid detection. However, challenges regarding selectivity, low detection limits and reproducibility still need to be overcome. Therefore, the design of advanced nanomaterials that can accurately monitor dopamine levels is still under investigation [4].
Nickel-based nanomaterials and their oxides (NiOx) have attracted significant attention for sensing applications, especially for the electrochemical detection of biomolecules, including DA molecules, due to their high electrocatalytic activity and selectivity [5]. Moreover, nickel oxides have good chemical stability and biological compatibility, both of which are important factors that an electrode in a biosensor should fulfill [6]. Furthermore, the abundance and low cost of nickel make nickel-based electrodes an even more attractive choice.
It has been reported that NiOx is a more appropriate electrocatalyst than metallic nickel for the oxidation of hydroxyl compounds, hence it is more suitable for DA, which owns hydroxyl groups [7,8,9,10,11]. In literature, it has been proven [5] that Ni(II)/Ni(III) and Ni(III)/Ni(IV) redox couples on the surface of the NiOx-based electrocatalysts favor the electrooxidation of biomolecules such as DA.
Electrochemical sensors for biomolecule detection require supporting materials and substrates with high electrical conductivity [1]. Graphene is among the most reliable supports due to its unique properties: (i) large surface area (∼2630 m2/g), (ii) high electronic conductivity, (iii) enhanced mechanical strength, (iv) remarkable thermal conductivity, (v) chemical stability, (vi) ability to operate in a wide potential window, and (vii) biocompatibility [12]. For those reasons, graphene is broadly investigated and used also in sensor technology as nanomaterials substrate [13]. Thus, also in the case of electrochemical dopamine sensors, it has been shown that graphene enhances electrical conduction channels, improving the kinetics of dopamine oxidation reaction (DOR). Specifically, it lowers the internal resistance of the electrode [1,12], facilitating DOR through the formation of Ni(II)/Ni(III) and Ni(III)/Ni(IV) redox pair peaks [5].
Joseph et al. [14] fabricated a nickel oxide/reduced graphene oxide (NiO/RGO) composite which modified a carbon paste electrode (MCPE) and used it as an electrochemical sensor for DA. As reported, the NiO/RGO composite showed a great surface area and improved performance towards DA. The authors observed a quasi-reversible behavior of DA at bare and modified electrodes, without any further comment regarding the DA oxidation mechanism over the electrode surface. Additionally, NiO/RGO-MCPE showed excellent stability and reproducibility, while the detection limit of DA was determined to be 8.3 nM.
Mondal et al. [7] chose an oxygen-deficient nickel oxide (NiOx) to combine with partially reduced graphene oxide (p-rGO) for dopamine electrochemical sensing. An in-situ electrochemical technique was used to deposit the thin film of NiOx/p-rGO nanocomposite on a fluorine-doped tin oxide-coated glass substrate. As the authors denoted, the constructed sensing platform delivered a sensitivity of 24.76 µAµM−1cm−2, with a very low limit of detection of 22.0 nM and a fast response time of 30 ms. The developed sensing platform was found to be robust in both structural properties and sensing performance. The partially reduced graphene oxide (p-rGO) could immobilize dopamine molecules due to the presence of oxygenated functional groups and could promote electron transfer due to the presence of retrieved 2D graphitic planes, leading to facile electrooxidation of dopamine to dopamine quinone. Analysis of real samples yielded a recovery factor of 98–100% and a low relative standard deviation of 0.15–0.53 showing suitability for real-life applications.
Althagafi et al. [11] constructed a nickel oxide nanoparticle that modified a pre-oxidized glassy carbon electrode (GCox/nano-NiOx) to electrochemically detect DA in the presence of high concentrations of AA. As reported, the oxidation current of DA was twice as large as that of AA even though the concentration of AA was approximately five times greater than that of DA. The authors suggested nickel oxide catalyzes the oxidation of hydroxyl compounds of the DA molecule. In the present case, the DA oxidation over the electrode surface was suggested as a mixed-controlled process mainly governed by adsorption. The limits of detection and quantification for DA were calculated 0.69 mM and 2.3 mM, respectively.
Roychoudhury et al. [15] constructed nickel oxide with reduced graphene oxide (rGO-NiO) nanocomposites for the electrochemical co-detection of DA and epinephrine. According to the authors, the NiO nanoparticles incorporation into the rGO substrate gave improved sensing characteristics. In detail, the as-prepared sensor showed good sensitivity for a wide linear range, a good peak-separation ability of 380 mV between the DA and epinephrine biomolecules, and a high interference ability. This was attributed to the rGO sheet’s enhanced electron mobility and the NiO’s high catalytic activity.
Aryal et al. [10] synthesized a reduced graphene oxide (rGO) decorated with nickel metal nanoparticles nanocomposite, deposited on oxidized carbon nanofiber (oxCNF). The Ni/rGO-oxCNF electrode successfully detected DA at 0.21 (V vs. SCE) by the differential pulse voltammetry (DPV) method. The physicochemical characterizations showed a high amount of nickel-oxide on the electrode surface. According to the authors, the Ni/rGO-oxCNF electrode exhibited two times higher oxidation peak for DA compared to that of rGO-oxCNF, and that is attributed to the synergistic effect of the conducting-high surface carbon substrate and the nickel and nickel oxide nanoparticles. The as-constructed electrode showed high selectivity in ascorbic and uric acid presence with good peak-separation potential.
Gao et al. [9] developed an electrochemical sensor that utilizes electrodeposited NiO nanoparticles on GO as the working electrode for the simultaneous detection of UA, DA, and AA. According to their electrochemical tests, the as-suggested electrode demonstrated excellent electrocatalytic activity towards AA, DA, and UA. The linear amperometric detection was achieved for the 2.0–120.0, 2.0–60.0 and 40.0–700.0 μM concentration ranges, with LODs of 0.14, 0.10, and 5.50 μM for UA, DA, and AA, respectively. Furthermore, the electrochemical reactions of three analytes on NiO/GO/GCE were presumed to be surface-controlled processes. The authors stated that the very good sensor characteristics could be attributed to a synergistic effect between the GO-functional groups, such as carboxyl and hydroxyl, and the NiO nanoparticles.
Muhammad et al. [8] demonstrated a nonenzymatic electrochemical sensor based upon a vanadium-doped nickel and graphitic carbon nitride nanocomposite. According to the authors, the experimental results in 0.2 M KOH, in the presence of AA and DA, showed good electrochemical biosensing ability with LOD of 1.16 μM and 0.16 μM, respectively. The electrode also offered good selectivity, reproducibility, and long-term stability. The resulting performance was attributed to the combined effect of NiO and g-C3N4. Moreover, the vanadium addition to the nickel oxide made it more stable and electroactive toward biomolecule interaction. As the authors reported, the variable valences of vanadium enhance its electrochemical properties, making it a suitable material for detecting biomolecules.
In summary, hybrid NiOx nanomaterials are very efficient for non-enzymatic electrochemical dopamine sensing. The modifications that take place to the NiOx structure and the presence of the Ni(ΙΙ)/Ni(ΙΙΙ) redox couple strongly enhance the non-enzymatic sensing performance for the DA molecule [16]. However, depending on the nickel oxide morphology and preparation method, a high intrinsic resistance may exist, which lowers the sensing ability [6], therefore, further investigation is necessary.
In the pH range of 5.2 to 8.8, where human body fluids and also the electrolyte of phosphate buffer solution (PBS) belong, DA is in cationic form (pKb = 8.87) [1]. Nafion is a polymeric substrate with high cation permeability and is recognized as an effective proton conductor. It can improve the ability of sensors to detect cationic molecules, such as dopamine (DA) [17]. Additionally, it can inhibit the interaction of anionic molecules, like AA and UA, with the electrode surface. In the human body, various interfering substances disrupt DA sensing due to their similar oxidation potential. For example, AA in vivo is at 102 to 103 times higher concentration than DA, so its prohibition to reach catalytic sites is considered very challenging [17,18].
Nafion is a polymer substrate with excellent antifouling ability, chemical inertness, and high cation permeability. Thus, a common method to enhance electrode selectivity to the DA molecule is to enhance the catalytic ink by mixing it with Nafion [19,20]. Kim et al. [21] observed that mixing activated graphene with Nafion to modify the glassy carbon electrode (GCE) resulted in enhanced current for DA electrochemical detection. In contrast, Sabar et al. [22] reported that while the Nafion-modified MXenes/carbon cloth electrode presented improved selectivity and interaction with the DA molecule, there was no increase in current signal after the Nafion treatment.
Herein, the fabrication of a hybrid Nafion-treated NiOx/GP electrode for non-enzymatic electrochemical detection is proposed. Specifically, we prepared NiOx (30 wt%)-GP at two different temperatures, 450 and 250 °C, in order to investigate how the calcination temperature affects the active sites. Then, in our study, Nafion was added on top of the dried-on air catalytic ink, without being mixed with the catalytic ink. According to our knowledge, there is no similar work in literature. Specifically, when Nafion is added, we observe a significant increase in the current signal, a fact that indicates that Nafion improves the performance characteristics of the as-suggested electrode.

2. Materials and Methods

2.1. Materials and Reagents

Nickel(II) chloride (NiCl2, Sigma-Aldrich, St. Louis, MO, USA), sodium carbonate (Na2CO3, Honeywell, Waltham, MA, USA), sodium bisulfite (NaHSO3), sulfuric acid (H2SO4, concentrated), sodium hydroxide (NaOH, 20 wt%), hydrogen peroxide (H2O2, 35 wt%), ethanol (EtOH), and graphene powder (GP) were used as received from Sigma-Aldrich, St. Louis, MO, USA, without further purification. Deionized water was used throughout all experiments.
Disodium hydrogen phosphate anhydrous (Na2HPO4, ≥99%), sodium dihydrogen phosphate anhydrous (NaH2PO4, >99%), Nafion perfluorinated resin solution 5%, iso-propanol (99.8%), D-glucose monohydrate (99.89%), L-ascorbic acid (99%), uric acid (≥99%), and dopamine hydrochloride were purchased from the Sigma-Aldrich Company (Saint Louis, MO, USA). The chemicals used in this investigation were only for research and development (R&D) and were used without further purification. Distilled water was utilized.

2.2. Physicochemical Characterizations

X-ray diffraction (XRD) measurements were acquired by a Bruker D8 Advance spectrometer (Bruker Italia srl, Milano, Italy) on the 30% NiOx/GP powders employing a Cu-K source operating at 40 kV and 40 mA. Using Bragg–Brentano optical geometry, the crystallographic orientation was analyzed in the 10–70 degrees range. The catalyst’s morphology was examined using a Jeol JEM-F200 electron microscope (Jeol Italia S.p.A., Milano, Italy).

2.3. Electrochemical Characterizations

The electrocatalytic behavior of the as-fabricated electrode was tested by cyclic voltammetry (CV), linear sweep voltammetry (LSV), electrochemical impedance spectroscopy (EIS), differential pulse voltammetry (DPV), and chronoamperometry (CA) electrochemical techniques. Electrochemical measurements were performed using the PalmSens4 potentiostat/galvanostat controlled by the PSTrace5 software (5.11.1006.19013), in a conventional 3-electrode electrochemical cell (AMEL Electrochemistry, Milan, Italy). At the same time, Ag/AgCl (3 M KCl) served as the reference electrode (RE) and a graphite rod as the counter electrode (CE).
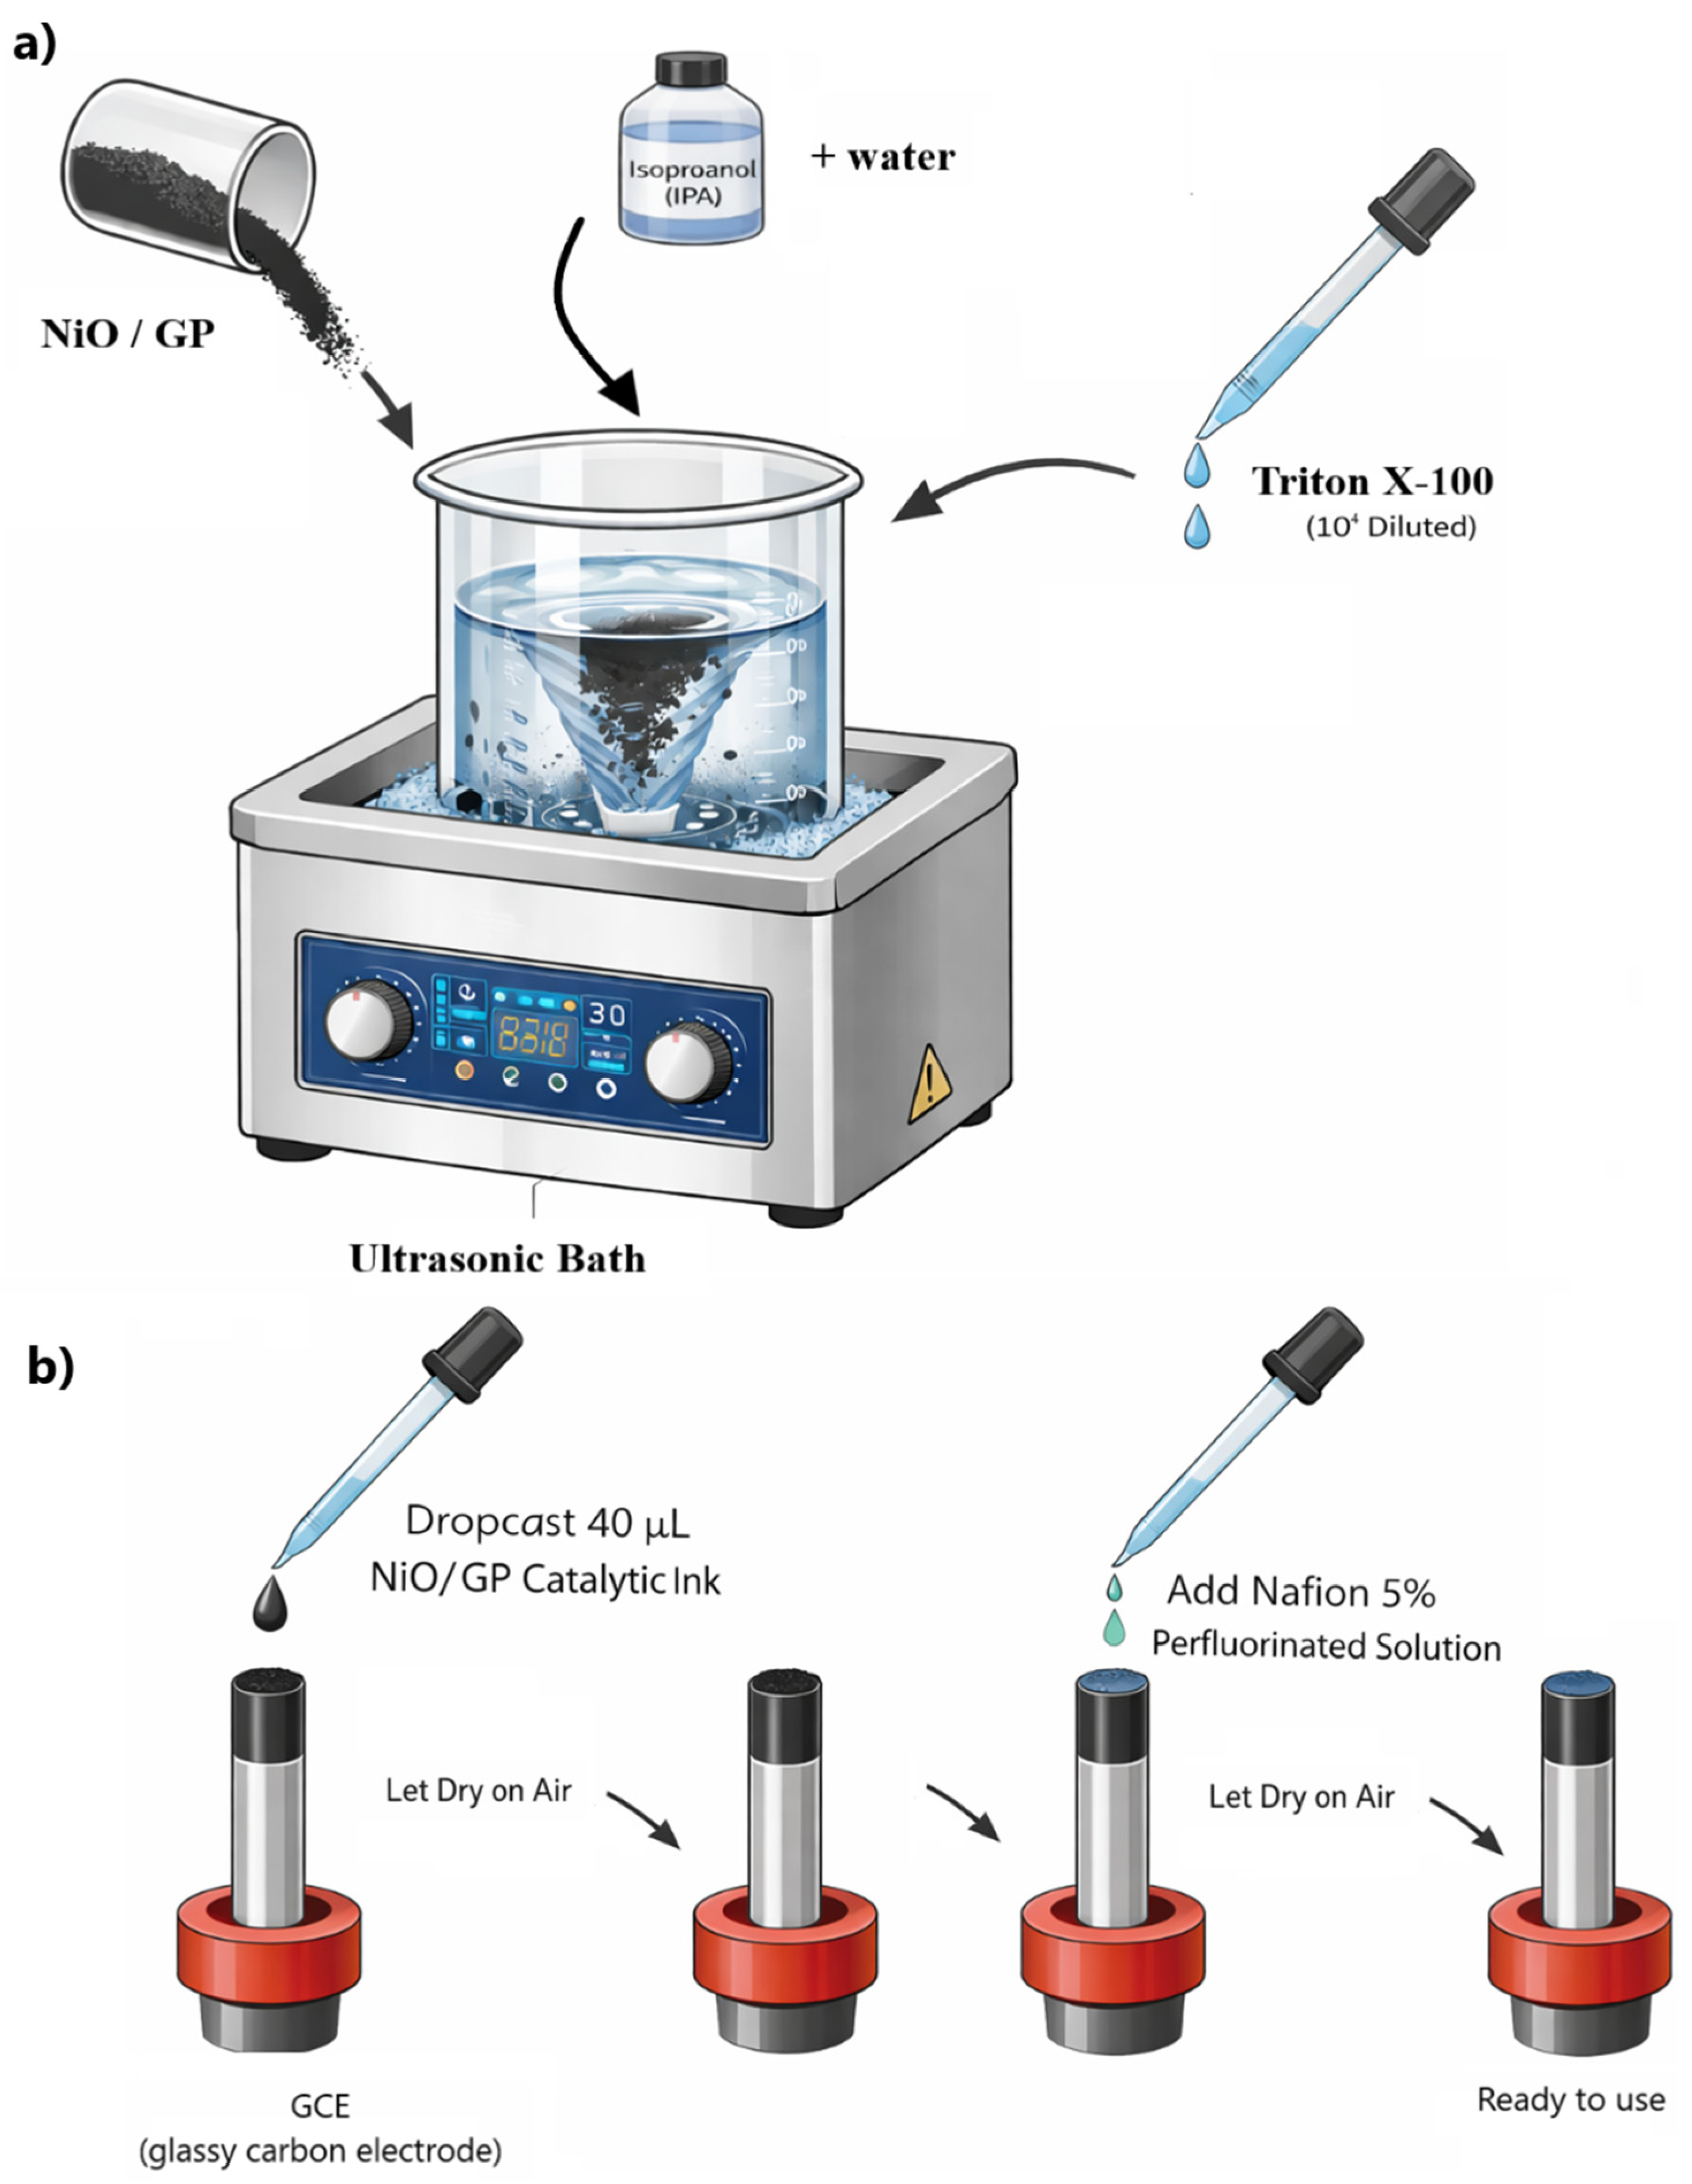
The electrocatalytic ink was deposited onto a glassy carbon electrode of geometric area A = 0.07 cm2. To prepare the catalytic ink, 2 mg of catalyst (30 wt% NiO), 1.7 mL of isopropanol, and 1.0 mL of water were sonicated for 30 min to dissolve. Then, 4 μL of 104-diluted Triton X-100 was added as a binder, and the resulting ink was ultrasonicated for a further 30 min (see Scheme 1a). Then, 40 μL of the ink was deposited onto the surface of the working electrode and left to dry in the air. Once dry, a drop of 5% Nafion perfluorinated resin solution was added to the electrode surface (Scheme 1b). Metal loading on the electrode surface, calculated from Equation (1) below:
M e t a l   l o a d i n g ( μ g c m 2 ) = m e t a l % × c a t a l y s t   m a s s × c a t a l y t i c   i n k   v o l u m e c a t a l y t i c   i n k   l i q u i d   v o l u m e × e l e c t r o d e   g e o m e t r i c   a r e a
The 40 μL catalytic ink results in 126.97 μg/cm2 metal loading on the electrode surface.
The electrochemical measurements of dopamine electrooxidation were performed in 0.1 M phosphate buffer solution (PBS) at pH = 7.0, and the temperature was maintained at 36.6 °C with the help of a recirculation thermostat (WiseCircu® WCB-22, TechnoLab, Tbilisi, GA, USA). To estimate the pH of PBS, the Henderson-Hasselbalch equation (Equation (2)) was used [23]:
p H = p K a + l o g ( A H A )
where [A] and [HA] refer to the base and acid concentrations.
Before each measurement, the solution was purged with N2 gas, and the working electrode was electrochemically conditioned from −0.20 to 0.80 V at a scan rate of 100 mV/s until stable cycles were achieved. CV measurements were performed from −0.20 to 0.80 V at different scan rates. LSV was conducted from 0.0 to 0.6 V at a 10 mV/s scan rate assisted by a rotating disk electrode (RDE), at rotation rates from 100 rpm to 2000 rpm. Resistance with and without analyte was measured by electrochemical impedance spectroscopy (EIS), at frequencies from 105 Hz to 10−2 Hz, at OCV (open circuit voltage) and 0.2 V. DPV experiments were recorded from 0.0 to 0.50 V, with a scan rate of 5 mV/s. CA was performed at a potential of 0.2 V, close to the DA oxidation potential. All the experiments were performed with continuous stirring at 50 rpm, strong enough to enhance the diffusion of analyte and other additives, but not to generate noise.
Scheme 1. (a) Catalytic ink preparation. (b) Working electrode step-by-step preparation.
Catalysts 16 00217 sch001

3. Results and Discussion

3.1. Synthesis of 30 wt% NiOx/GP Samples

First, Ni sulfite was prepared by mixing Ni chloride with NaHSO3 at 75 °C. Then, the carbonaceous graphene compound (labeled GP) was dissolved in a 3:1 (v:v) H2O:ethanol solution, whereas Ni sulfite was dissolved in H2O with 30% of the metal concentration on carbon. Dropwise, a molar excess of 35 wt% H2O2 was added, and the pH was subsequently increased to 5.4. The solution was stirred for 30 min at a temperature of 70 °C before being vacuum filtered. After abundant water washing, the solid was left to dry overnight at 80 °C (NiOx/GP). Lastly, one portion of the sample was heated for two hours at 250 °C with a He flow, whereas another portion was treated at 450 °C for 2 h in the He atmosphere. To indicate the different treatment temperatures, the composed electrocatalysts are referred to as NiO250/GP and NiO450/GP. To calculate the carbon percentage, 50 mg of samples were burned at 550 °C in air for 2 h and 15 mg were weight after cooling confirming the 30 wt% of NiOx/GP.

3.2. Morphology and Surface Characterization

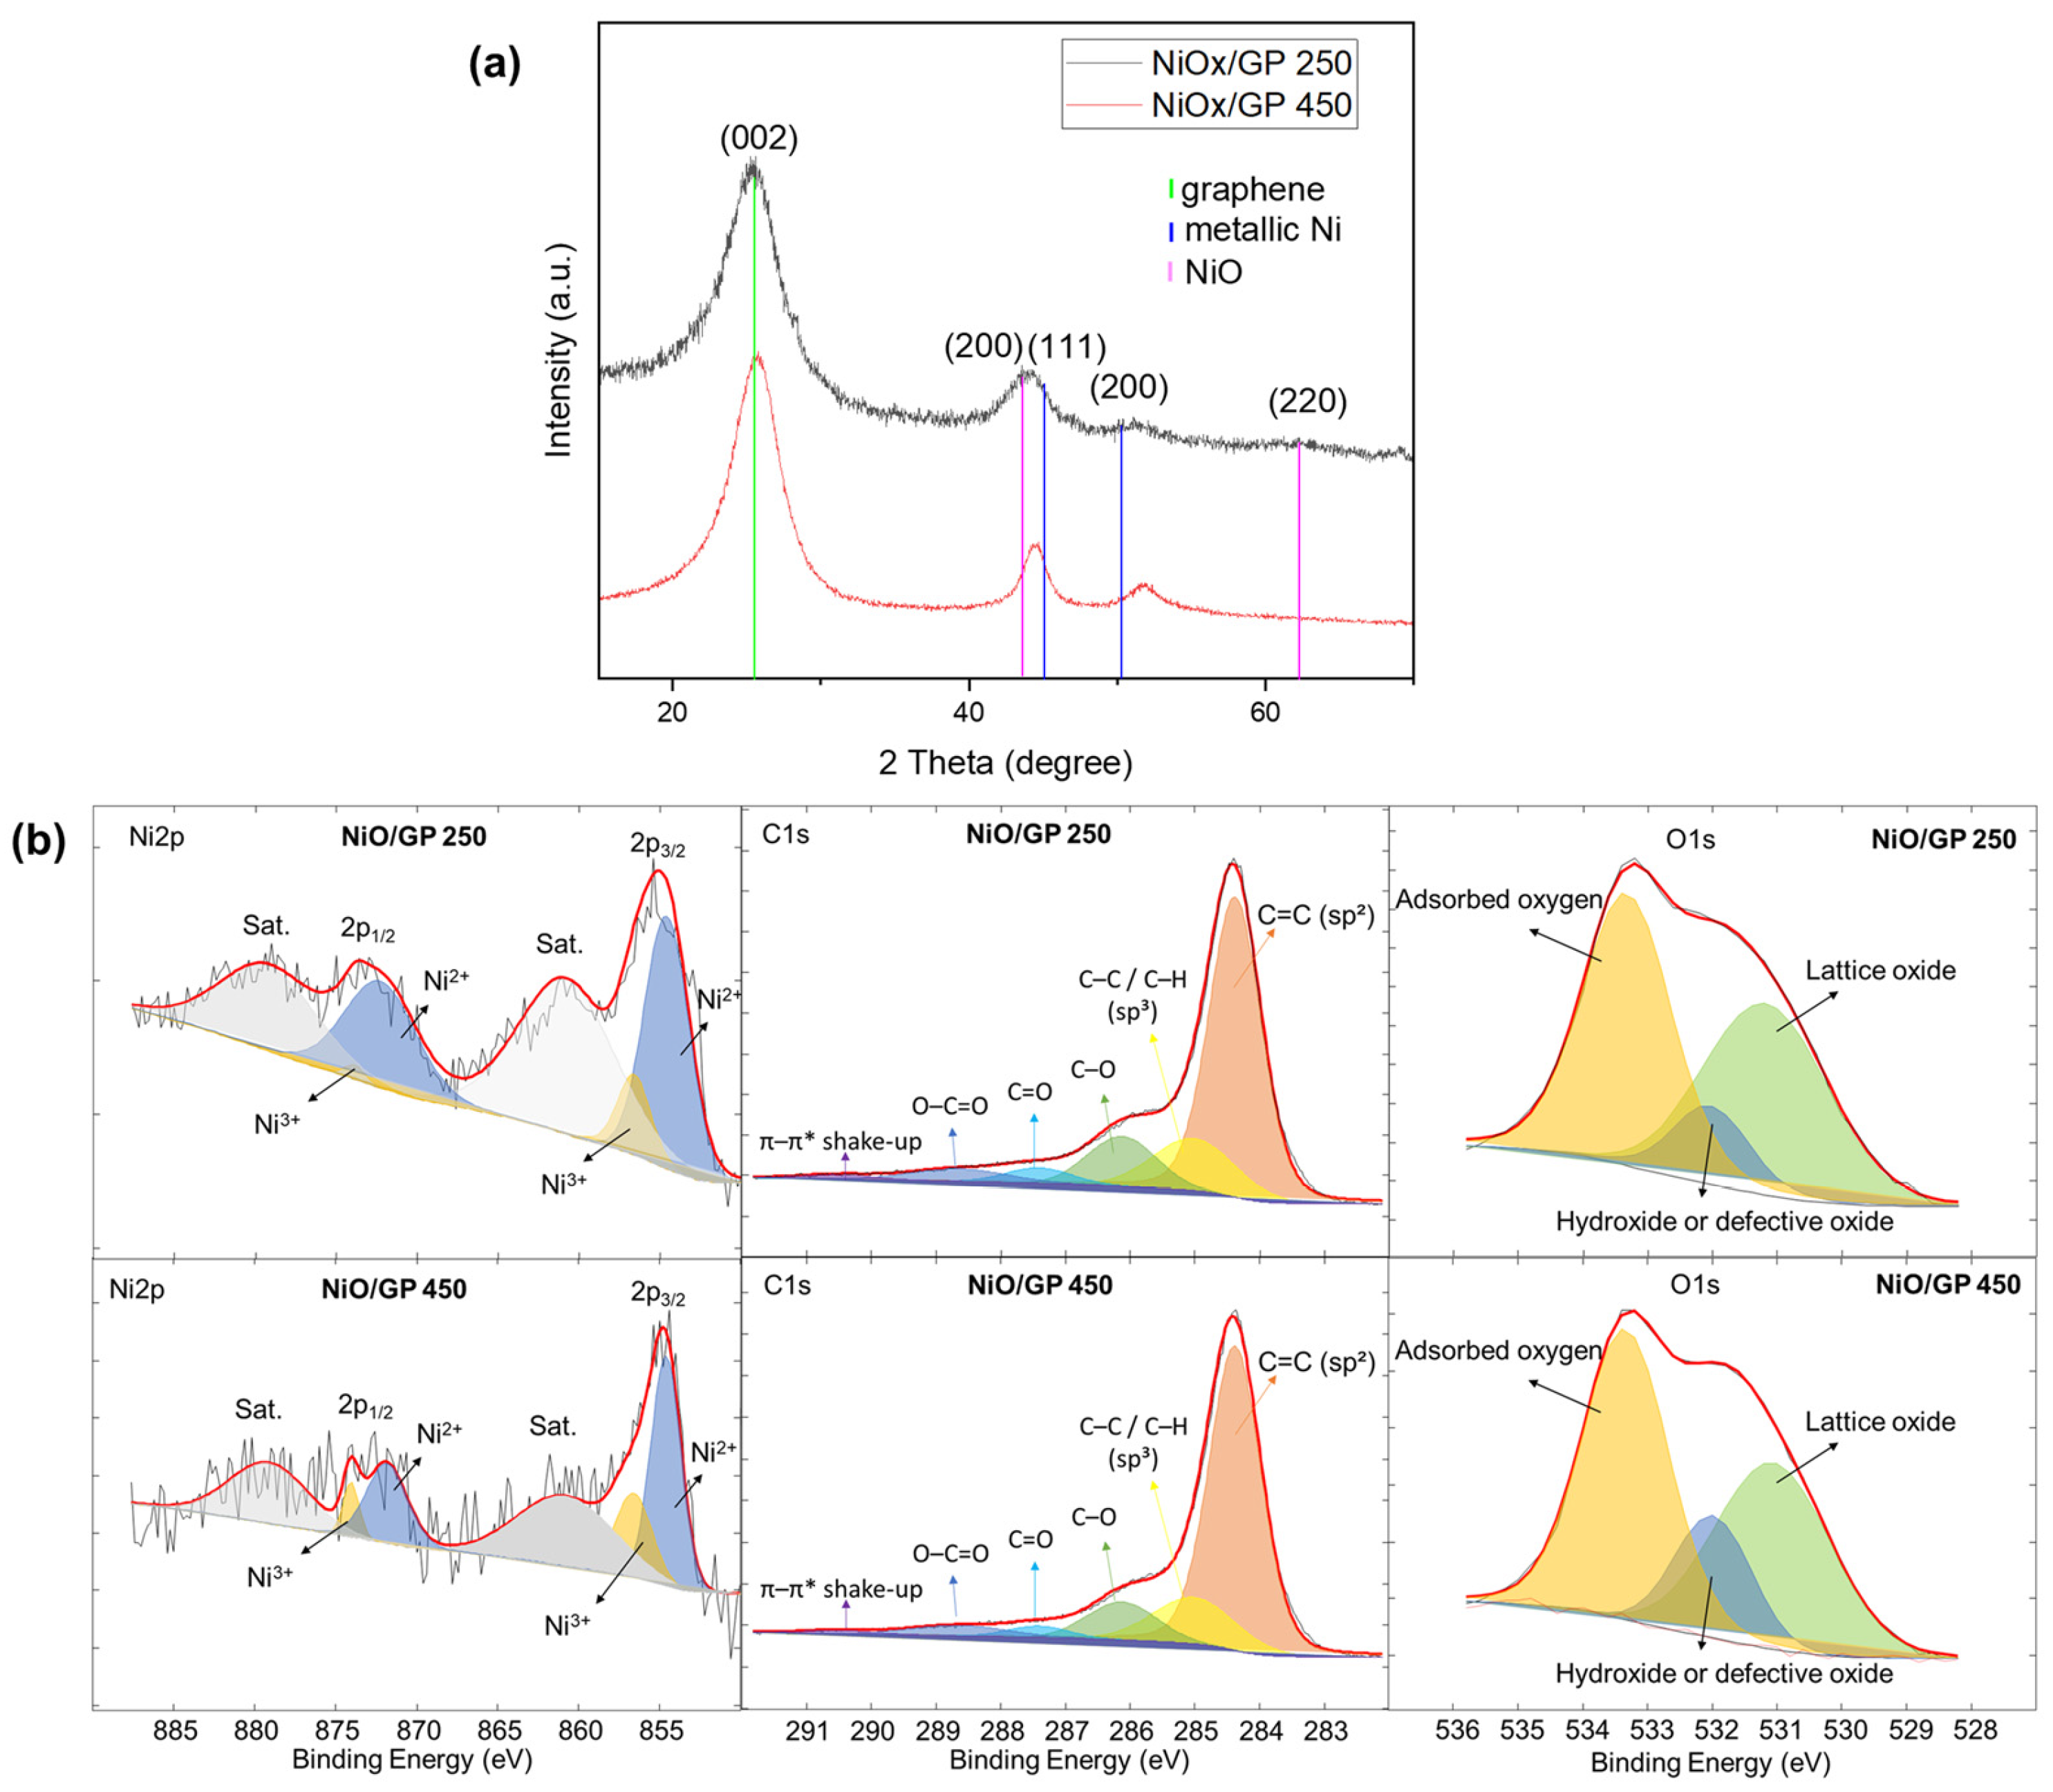
X-ray diffraction (XRD) was used to investigate the 30 wt% NiOx/GP, which was prepared by burning the carbon in the air at 450 °C for two hours. As illustrated in Figure 1a, NiO and metallic Ni nanoparticles exhibit face-centered cubic (fcc) shapes in the samples. The hexagonal carbon graphite peak, located at 24.8°, corresponds to the (002) crystal plane of graphene. The peaks around 45.0° and 50.0° correspond to the (111) and (200) planes of metallic nickel. Furthermore, the 42.9° and 62.3° peaks correspond to (200) and (220) diffraction planes of NiO.
Contrary to the NiO/GP treated at 450 °C, the sample treated at 250 °C in the He environment shows wider peaks, suggesting a high likelihood of a mixed phase including Ni and NiO nanostructures. Because of this, the Debye-Sherrer equation’s calculation of the crystallite size yields a range of values, from 7 to 11 nm. The Ni2p emission spectra allowed for the characterization of the Ni2+ and Ni3+ oxidation states, as shown in Figure 1b. Ni2+ is associated with the fitting peaks at 855.1 eV and 872.7 eV. Ni3+ is accountable for the peaks at 856.6 eV and 874.4 eV. Furthermore, two satellite peaks (identified as “Sat.” in the Figure 1) were also detected at 861.2 and 879.7 eV, proving the existence of NiO.
The Ni3+/Ni2+ ratio exists in both samples. However, the Ni2p spectrum of NiO250/GP in Figure 1b shows a slightly lower proportion of Ni3+ (yellow peaks) in the Ni3+/Ni2+ ratio compared to the NiO450/GP catalyst. The same trend seems to be followed with the Ni2+ (blue peaks). It can be assumed that raising the treatment temperature caused some of the Ni3+ to be oxidized to Ni2+, and some of the Ni2+ to be oxidized to metallic nickel in the NiO450/GP catalyst. This is consistent with the literature [24]. Thus, changing the treatment temperature contributes to changes in the amount of divalent and trivalent nickel, resulting in a shift in the Ni3+/Ni2+ ratio.
High-resolution XPS spectra of NiO/GP 250 and NiO/GP 450 were further analysed for carbon and oxygen species. The C1s spectra show dominant sp2 C (284.4 eV), confirming the graphitic nature, with its fraction increasing from 62.5% at 250 °C to 67.2% at 450 °C, indicating partial reduction of oxygen groups and improved graphene ordering. The sp3 C–C/C–H component (~15% at 285.0 eV) remains constant, preserving defect sites for NiO anchoring. Oxygenated groups (C–O at 286.1 eV, C=O at 287.4 eV, O–C=O at 288.6 eV) decrease with temperature, while the π-π* satellite (290.5 eV) persists, confirming preserved π-conjugation.
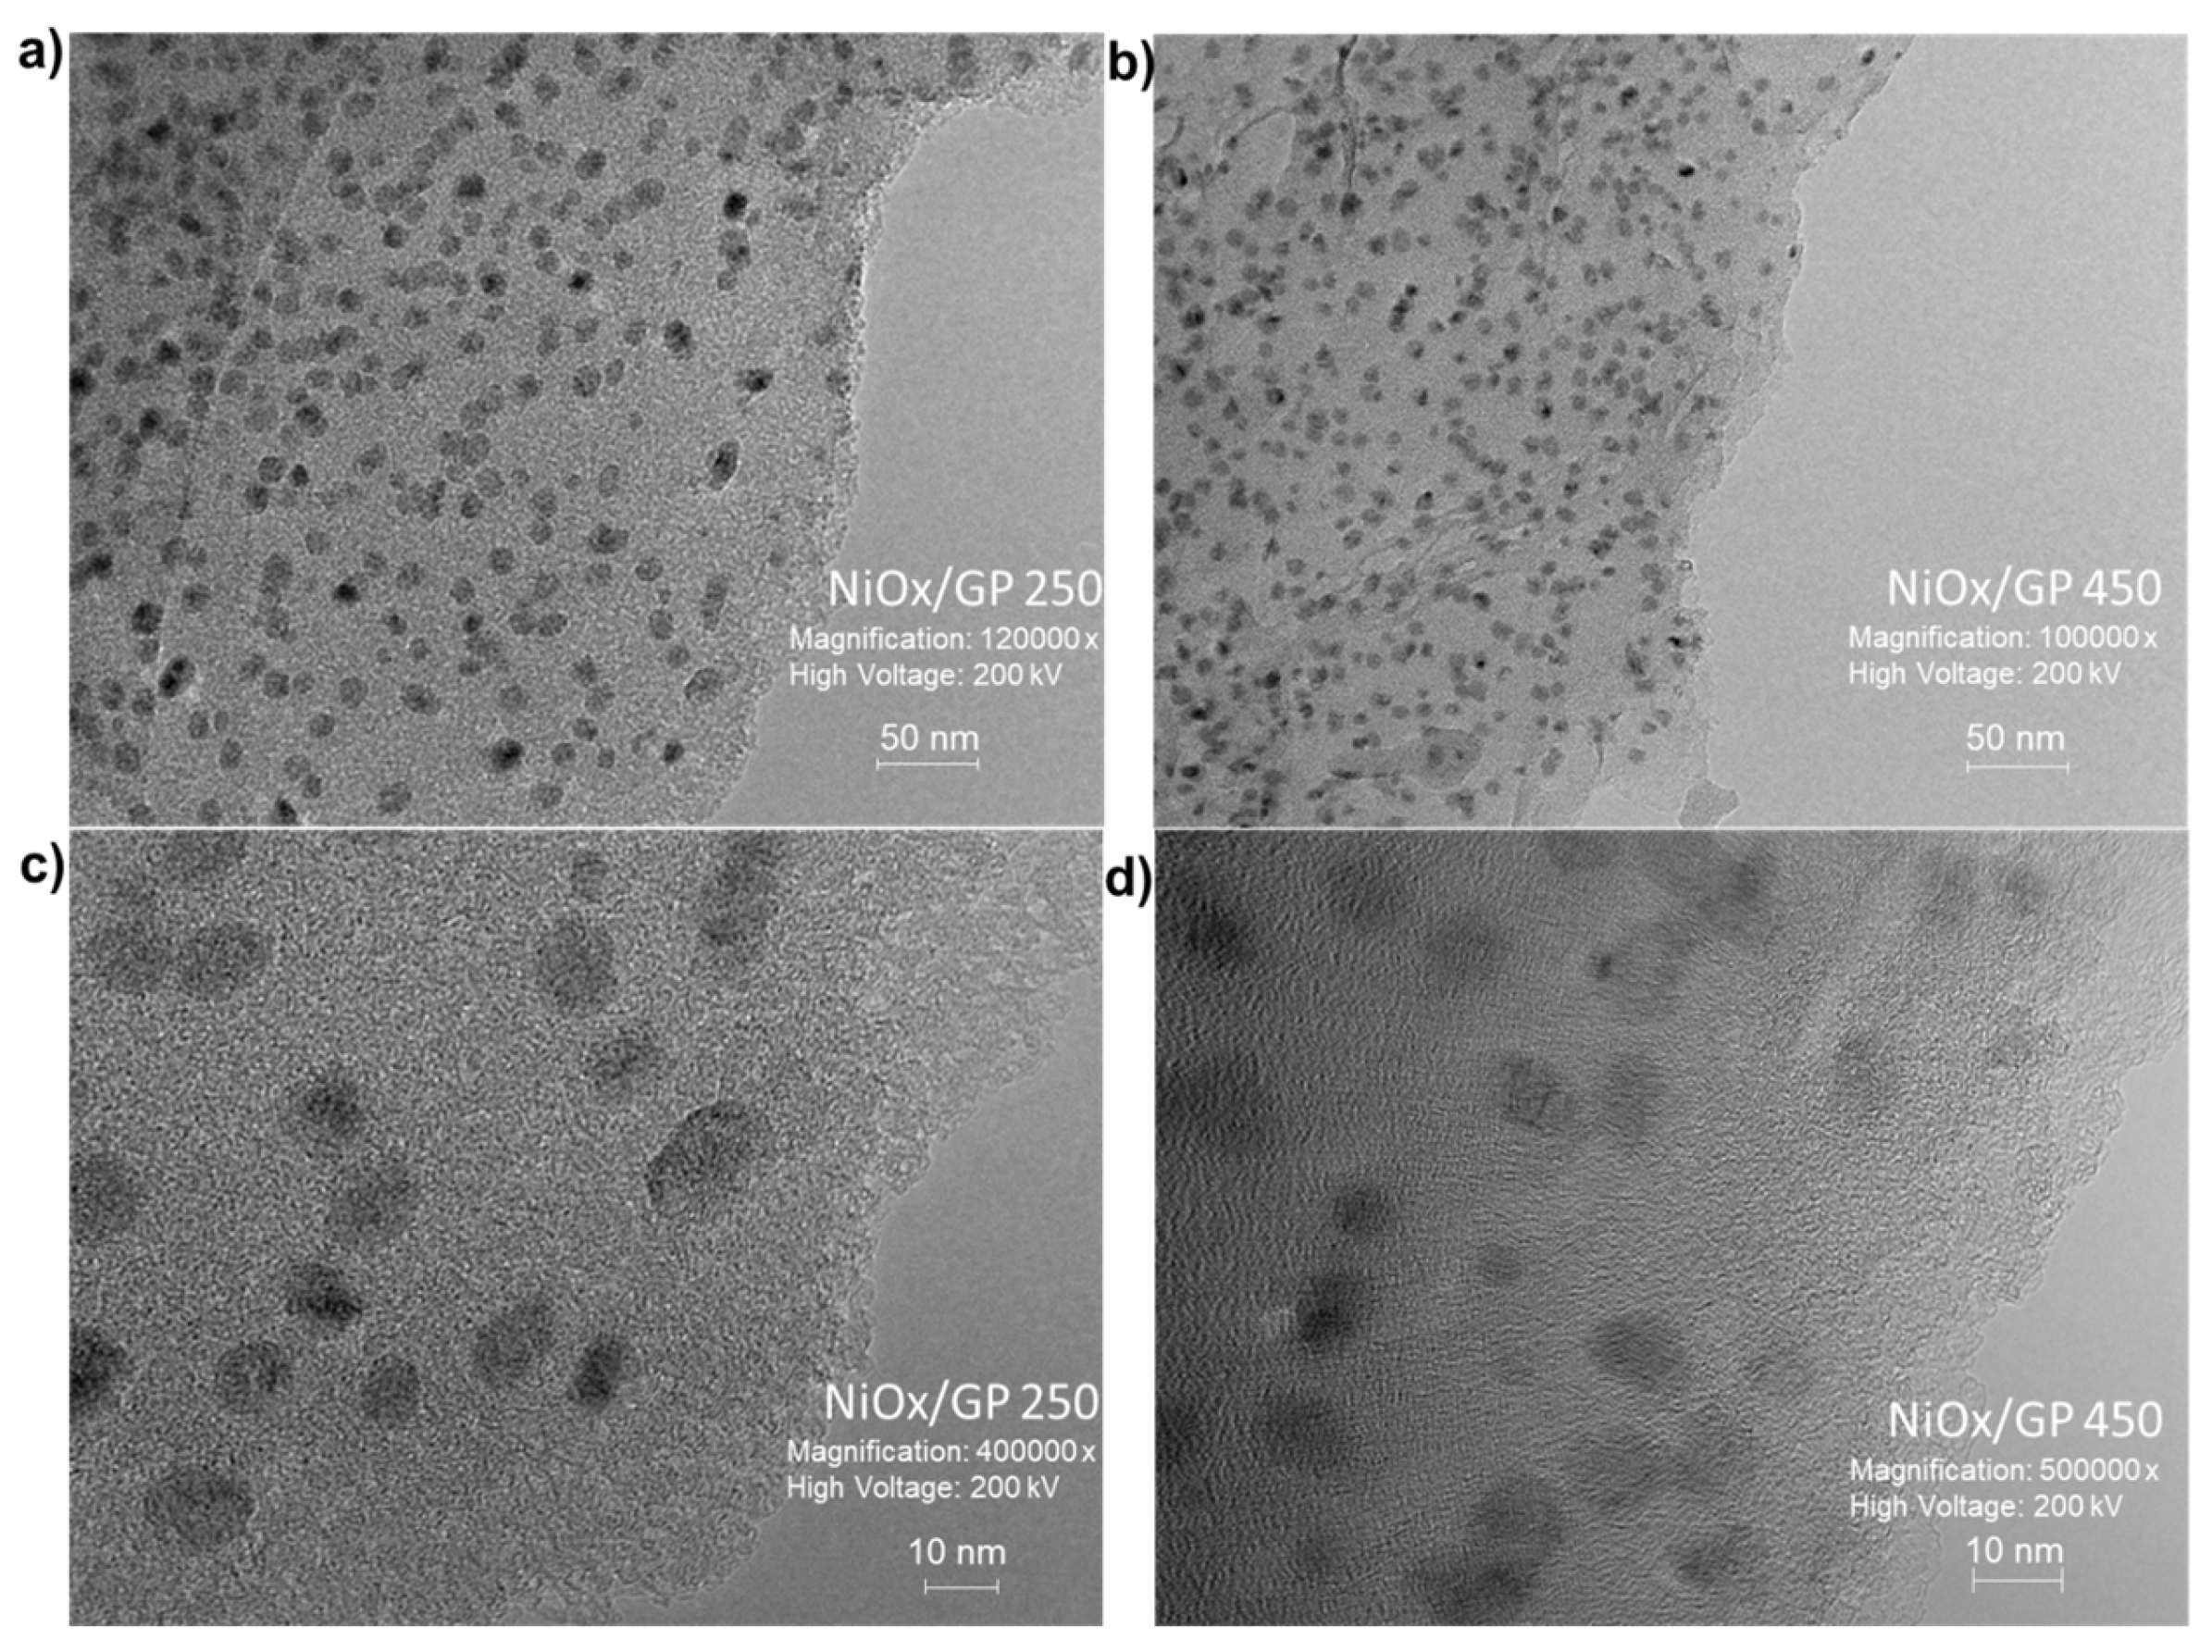
O1s spectra reveal lattice O in NiO (~531.1 eV) decreasing from 41.7% to 37.0%, defect-related oxygen (~532 eV) increasing from 11.5% to 16.3%, and surface −OH (~533.3 eV) remaining stable (~46.8%). These changes indicate a more defective, electronically active NiO phase on a partially reduced graphene support. Overall, the comparative O1s analysis reveals that increasing the treatment temperature from 250 to 450 °C promotes the formation of defect-related oxygen species and oxygen vacancies in NiO, while slightly reducing the contribution of lattice oxygen. The 30% NiO250/GP and 30% NiO450/GP (treated at 250 °C and 450 °C for 2 h in He) TEM images are shown in Figure 2. At lower magnification (Figure 2a,b), NiOx nanoparticles are uniformly distributed across the entire graphitic carbon surface. The quasi-spherical NiOx/GP nanoparticles in Figure 2c have a particle size of 6–9 nm, comparable to the crystallite size determined by XRD diffraction.
In Figure 2d, the nanoparticles range from 8 to 11 nm, which can be attributed to a more pronounced mixed-phase formation composed of metallic Ni and NiOx nanoparticles. The interatomic distances are around 0.21 nm, corresponding to the planes of the C graphitic structure for both samples.
Generally, higher temperatures promote the agglomeration of nickel oxide. As the temperature rises, the rate of sintering, driven by surface and grain boundary diffusion, also increases, leading to larger nickel particles [24].

3.3. Electrochemical Performance Investigation

Electrode calibration and calculation of ECSA. According to the literature, Nafion is a proton conductor known for its excellent ion permeability, which may enhance electrocatalytic activity when combined with conductive substrates, such as graphene [18,25]. To optimize the catalytic ink application on the electrode surface, we prepared and tested electrodes both with and without Nafion.
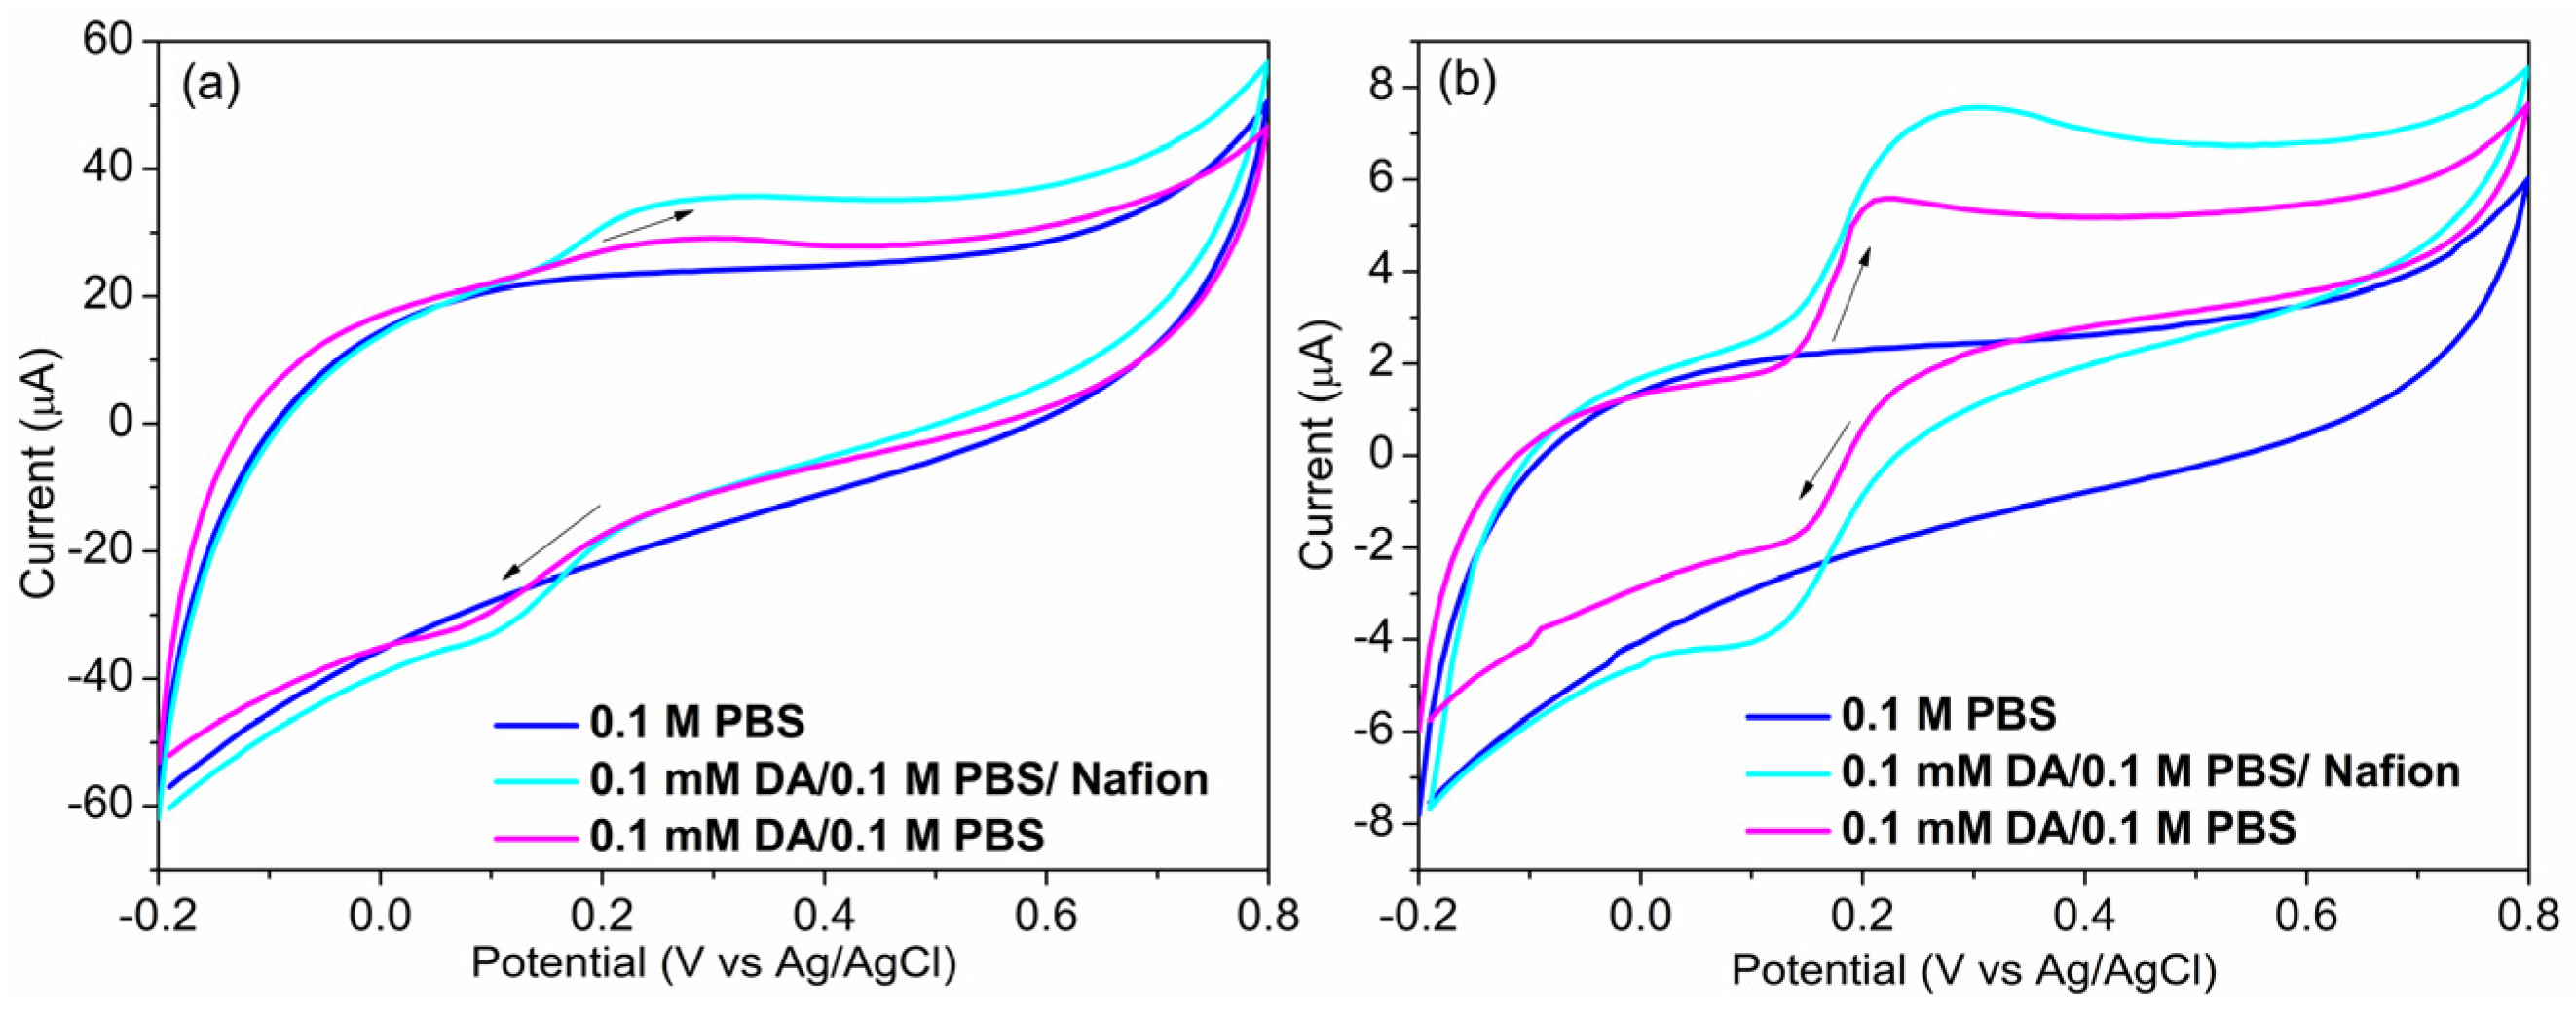
As can be seen in the cyclic voltammograms displayed in Figure 3, for both electrocatalysts tested, the presence of Nafion favors the DA oxidation, enhancing the redox peaks. As shown in Figure 3a, in the case of NiO250/GP/GCE, the DA oxidation current, after blank plot extraction (see Supplementary Materials, background current calculation) was calculated about 4.5 μA (pink line). In contrast, after Nafion addition it is calculated to be about 11 μA (turquoise line, detailed explanation of blind plot extraction in Figure 4), i.e., more than two times higher.
In the same way, as shown from the cyclic voltammograms (CVs) of NiO450/GP/GCE in Figure 3b, extracting the blind curve, the DA oxidation current is calculated to be at around 3.5 μA (pink line) and after the Nafion addition, at around 5.5 μA (turquoise line, detailed explanation in Figure 5d), i.e., almost 1.5 times higher. Nafion, with its large cation permeability, facilitates the cationic dopamine molecules’ access to the active sites of the electrocatalysts on the electrode surface. The results agree with the literature [18]. Therefore, Nafion was added to the electrode surfaces to study the dopamine oxidation reaction, and the two electrodes were denoted Nafion-NiO250/GP/GCE and Nafion-NiO450/GP/GCE, respectively.
Next, the optimum metal loading on the electrode surface was decided following a calibration procedure. Figure S1a shows the results for Nafion-NiO250/GP/GCE. From 20 up to 40 μL catalytic ink volume deposition, the double-layer capacitance increases, while at 50 μL the double-layer charge is reduced again. Therefore, all the Nafion-NiO250/GP/GC electrode experiments were carried out using the optimum catalytic ink volume (40 μL). In the case of Nafion-NiO450/GP/GCE calibration outcome (Figure S1b), the 50 μL catalytic ink loading presents almost the same double-layer charge as the 40 μL. So, 40 μL of catalytic ink loading was adopted for the rest of the experiments, in order to achieve a smaller thickness of the catalyst layer and thus lower resistance. Then, the two electrodes Nafion-NiO250/GP/GCE and Nafion-NiO450/GP/GCE were comparatively studied for their electrochemically active surface area (ECSA) and activity against the DA electrochemical reaction.
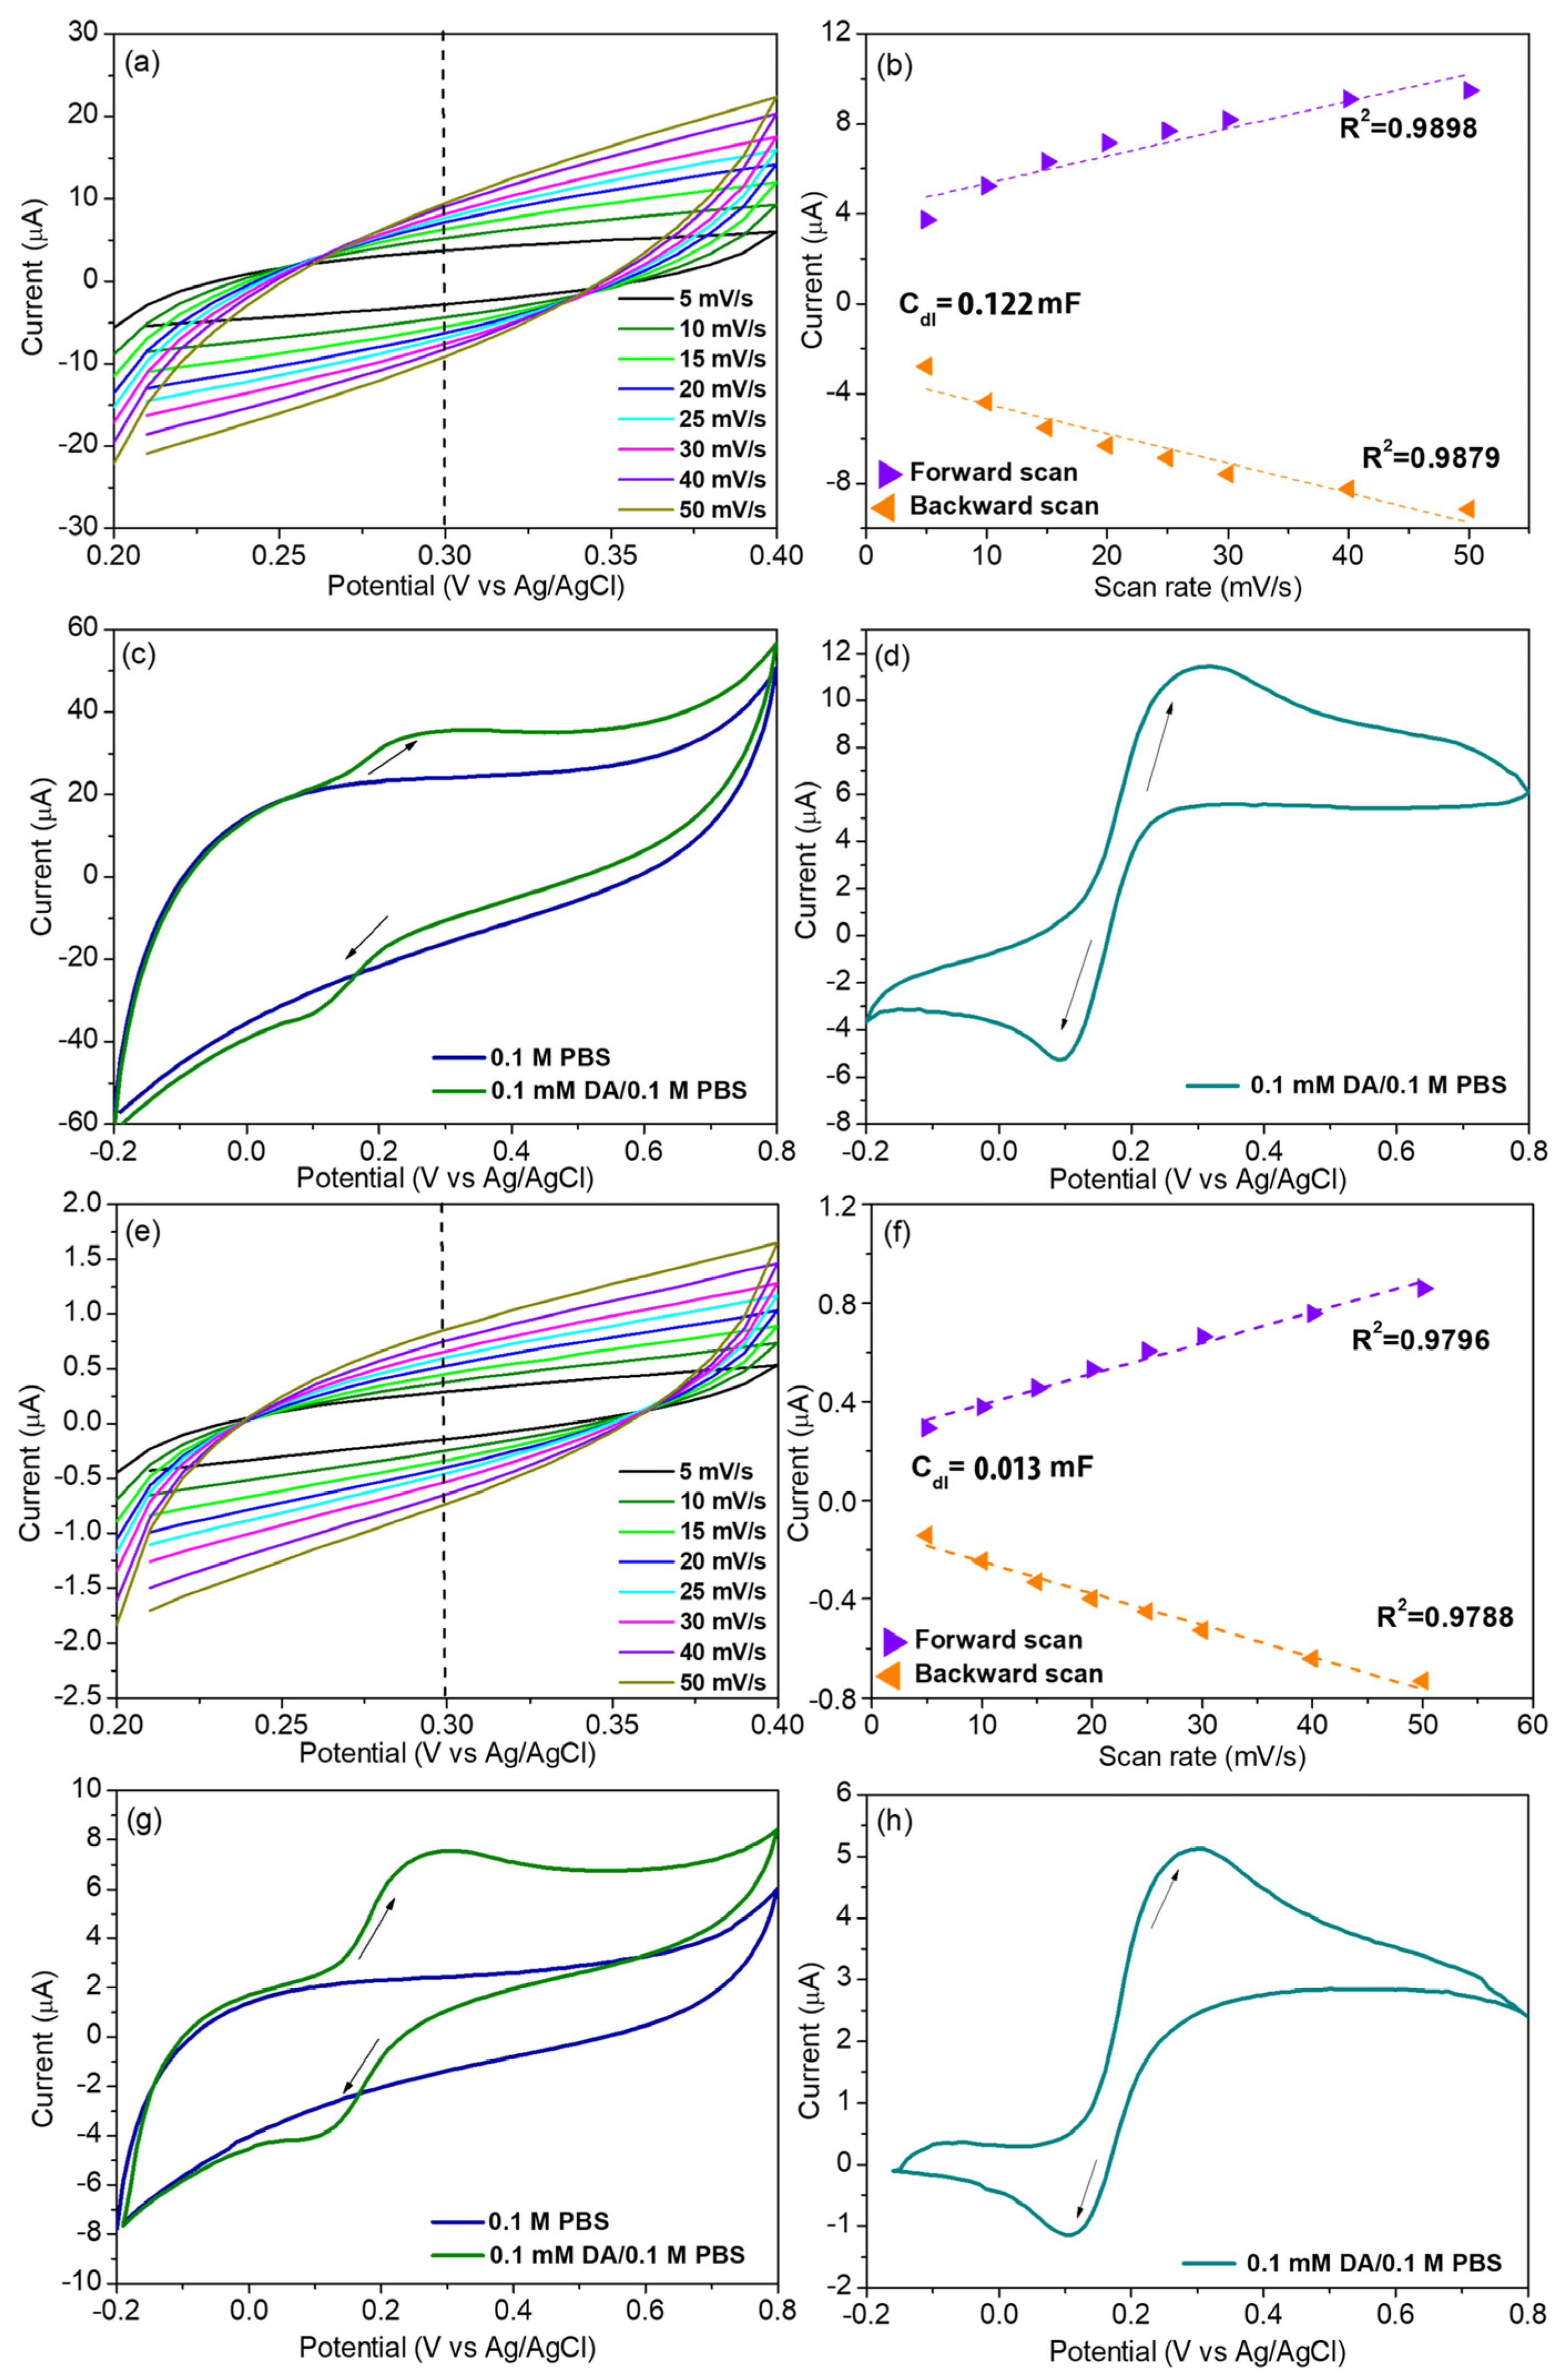
The electrochemically active surface area (ECSA) was calculated with cyclic voltammetry at various scan rates in 0.1 M PBS at 36.6 °C, into the non-Faradaic region, from 0.2 to 0.4 V for the NiO250/GP/GCE (Figure 4a).
ECSA was calculated from Equation (3) [26]:
E C S A = C C r e f
where C = CDL is the double-layer electrochemical capacitance and Cref = Cs = 40 μF/cm2 the specific capacitance of the material (or the capacitance of an atomically smooth planar surface of the material per unit area) [27,28]. CDL values were calculated using Equation (4) from the slope of the plot current vs. scan rate (Figure 4b) [28]:
i = d Q d t = ( d Q d E ) ( d E d t ) = C × v
The CDL value for the NiO250/GP/GCE was calculated at 0.122 mF, and the corresponding ECSA was estimated at 3.05 cm2.
Figure 4c depicts the CVs obtained without and with DA. When DA is added, a clear oxidation peak is observed in the anodic scan of the Nafion-NiO250/GP/GC electrode (green line, Figure 4c), at 0.25 V. In the CV of Figure 4d, the blind plot is extracted to observe the actual current produced when DA is added. Thus, for the NiO250/GP/GC electrode, a peak current of about 11 μA is observed at Ep,ox = 0.25 V. Respectively, in the cathodic scan, a reduction peak appears at Ep,red = 0.1 V.
For the NiO450/GP/GCE ECSA estimation was conducted via CV into the non-Faradaic region from 0.2 to 0.4 V, as depicted in Figure 4e. The CDL value was found to be 0.013 mF (Figure 4f), and the corresponding ECSA was 0.325 cm2.
Moreover, for the Nafion-NiO450/GP/GC electrode (green line, Figure 4g), DA is also oxidized at Ep,ox = 0.25 V, and from the voltammogram of Figure 4h, a peak current of 5.5 μA can be observed. In the cathodic scan, a reduction peak at Ep,red = 0.11 V also appears.
As can be seen from the results reported in Figure 4c,g, in the absence of DA (blue lines), the double-layer capacitance of the NiO250/GP/GCE is larger than that of NiO450/GP/GCE. More precisely, in the non-Faradaic region from 0.2 to 0.4 V (blue line in Figure 4c), the NiO250/GP electrocatalyst presents an area of about one order of magnitude greater compared to the NiO450/GP/GCE (blue line, Figure 4g). According to the literature, a larger ion diffusion coefficient and electrode electrical conductivity lead to larger electrochemical double-layer capacitance, which can offer a better charging performance [29].
Both electrocatalysts were able to successfully detect dopamine (DA). The XPS spectra in Figure 1b showed that the NiO250/GP catalyst contained a different Ni(II)Ni(III) ratio compared to the NiO450/GP. The HRTEM images of Figure 2 show more agglomerated nanoparticles in the case of NiO450/GP catalyst, possibly resulting from the higher treatment temperature in the He atmosphere. NiO250/GP catalyst had a greater electrochemically active surface area (ECSA) (Figure 4a) and thus more available active sites for DA to react. Moreover, the Nafion-NiO250/GP/GC electrode presented a 2-fold peak current for the same amount of DA, as shown in Figure 4d,h. Consequently, the NiO250/GP/GCE was chosen for further investigations for dopamine electrooxidation.

3.4. Dopamine Oxidation Reaction (DOR) Mechanism

The mechanism of DA electrooxidation on NiO250/GP/GCE was considered. DA electrooxidation often begins from its neutral structure [1]. However, the pH value significantly influences dopamine’s structure and oxidation pathway. In the pH range of 5.8–7.5, where the current and most studies are conducted, dopamine’s phenolic and amino groups are in protonated form, due to its cationic nature (pKa = 8.87) under these conditions (see Figure S2a) [2]. Therefore, for the electrode under investigation, the oxidation process of DA is considered to follow a 2e and 2H+ oxidation pathway, resulting in the formation of dopamine-quinone (DAQ) with a protonated amino group. Depending on the catalyst’s nature and its oxidation ability towards DA, DAQ can further undergo a ring-closure reaction to form leucodopaminechrome (LDAC) [30].
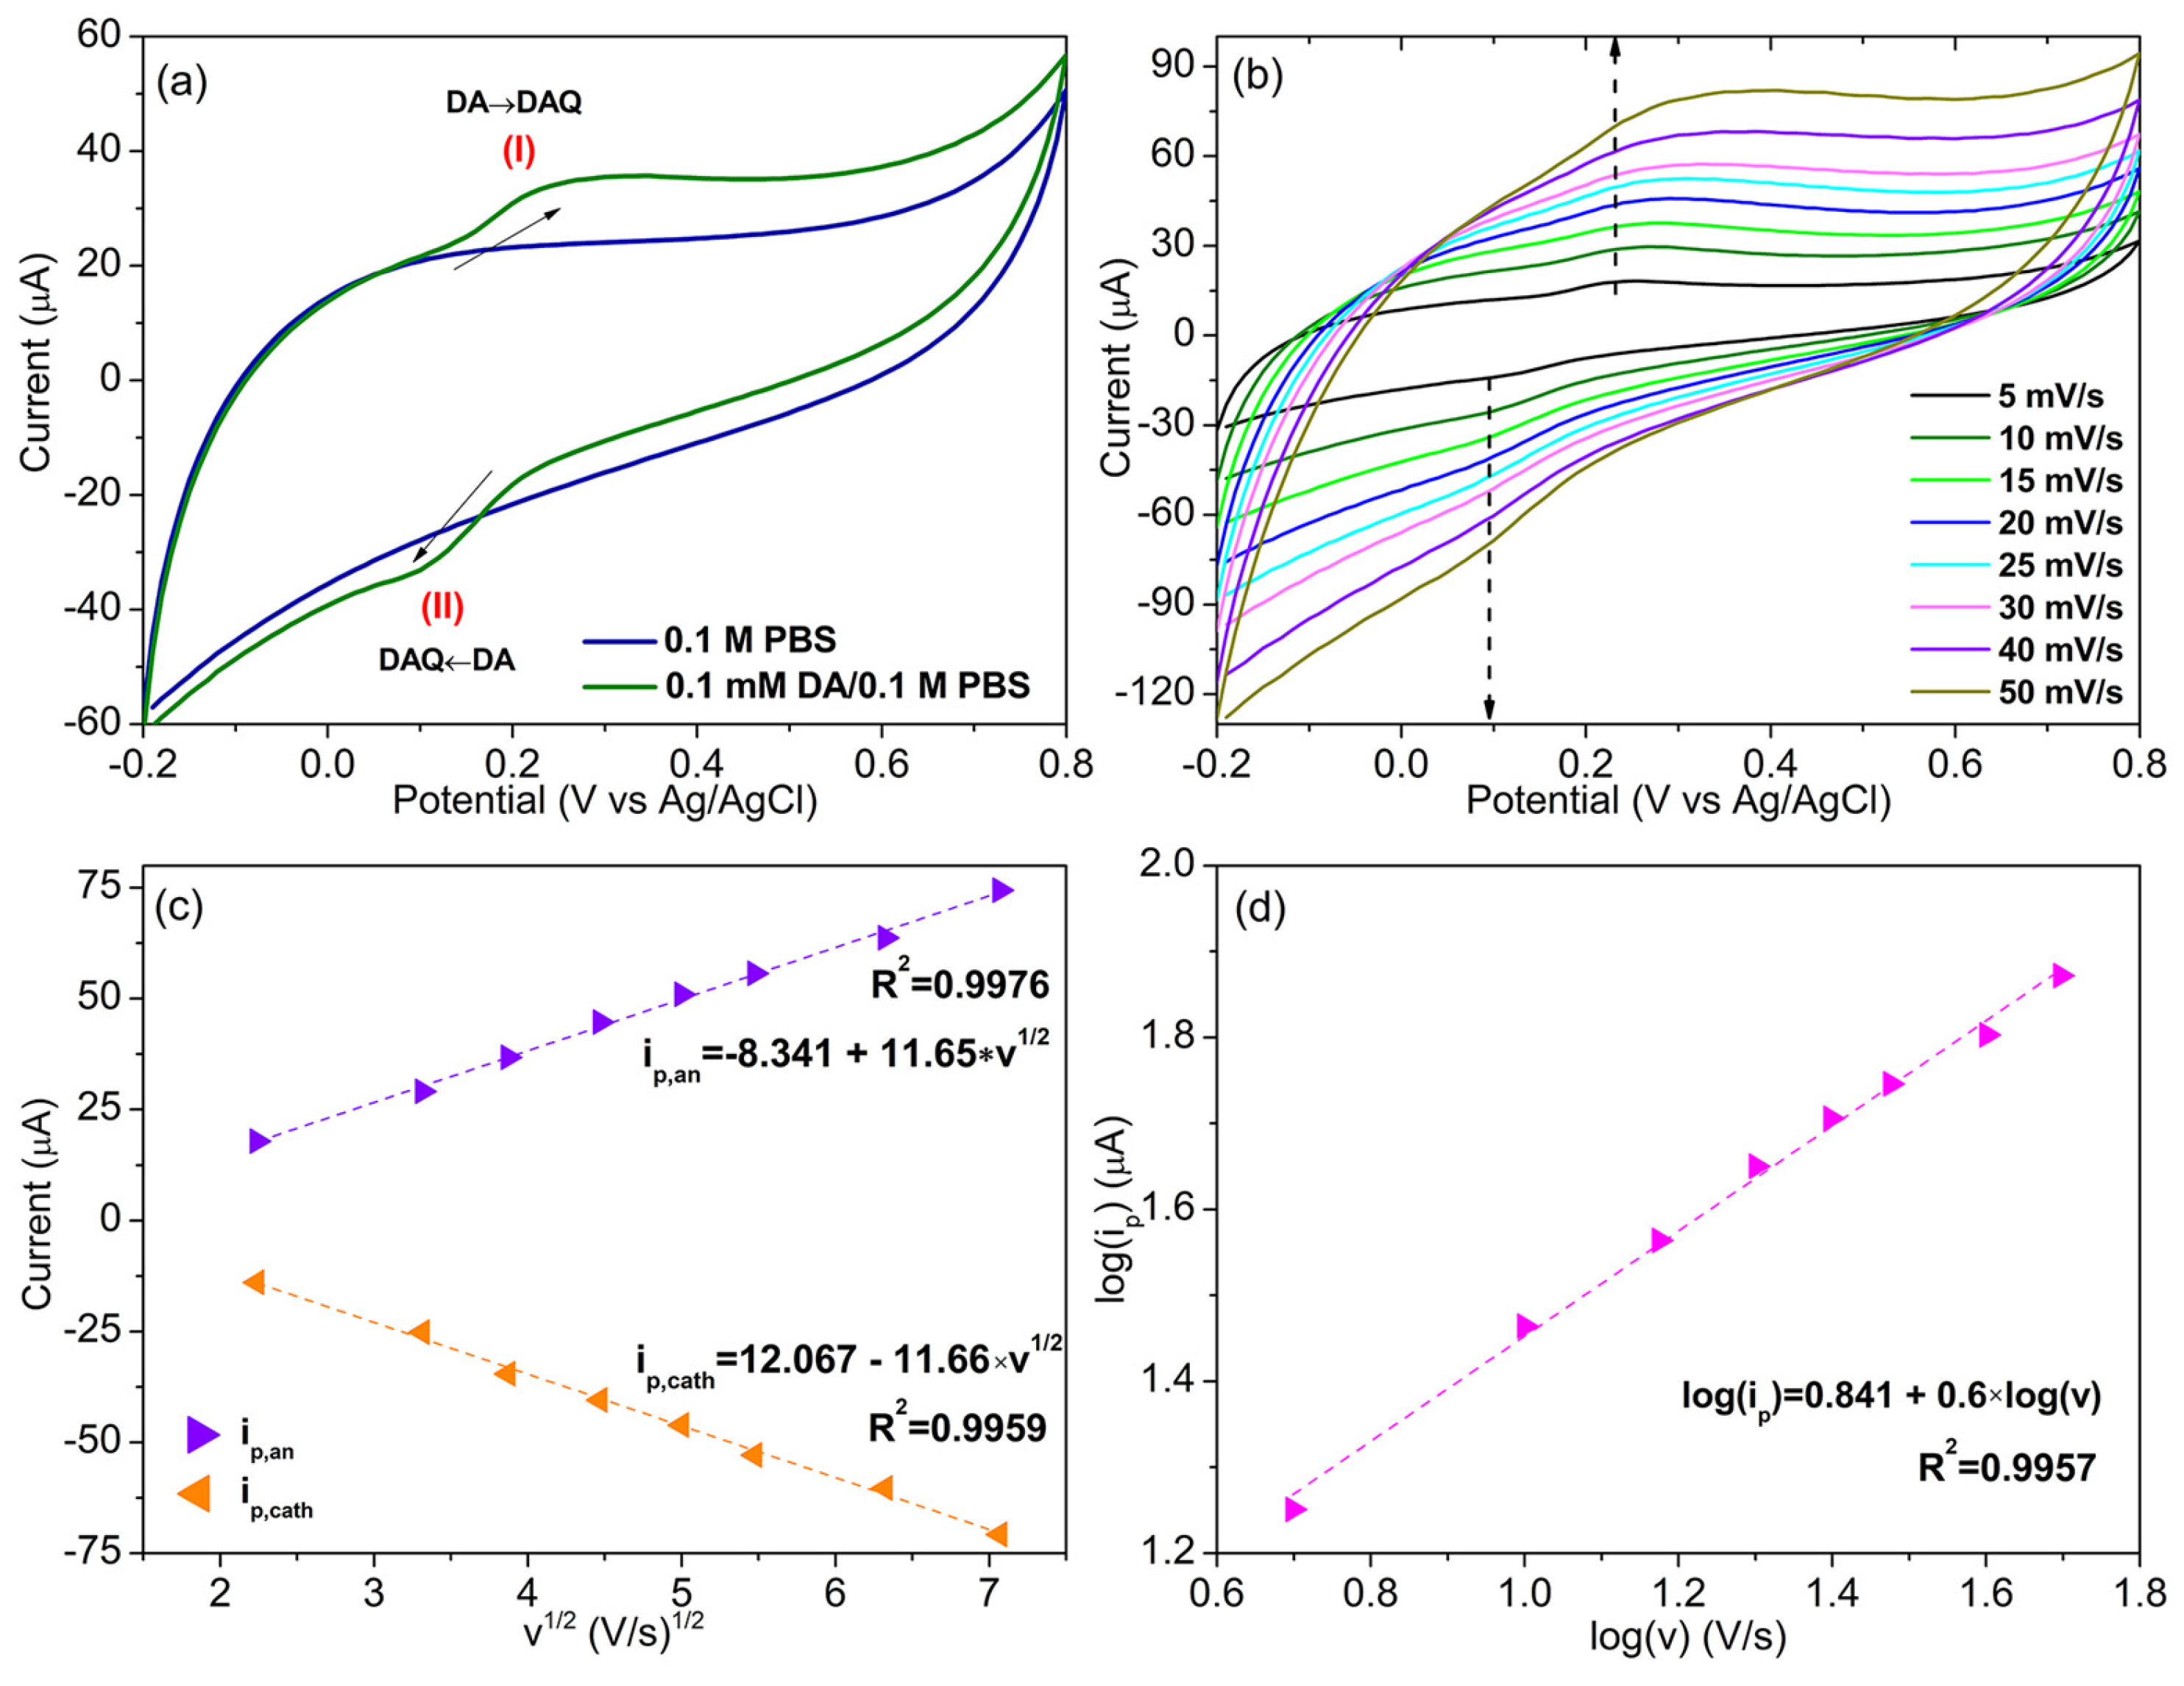
Cyclic voltammograms for the Nafion-NiO250/GP/GCE, conducted in the potential window of −0.2 to 0.8 V with a 20 mV/s scan rate, are depicted in Figure 5a. The blue line shows the CV in 0.1 M PBS electrolyte, where no redox peaks are observed on the electrode surface. After the 0.1 mM DA addition (green line), an oxidation peak is observed in the forward scan located around 0.22 V (Figure 5a, peak (I)). This peak corresponds to the oxidation of DA to DAQ via a 2e and 2H+ process, likely catalyzed by the Ni(II)/Ni(III) redox couple on the surface of the electrocatalyst. Some of the DAQ molecules, after disengaging from the electrode surface, undergo a ring-closure reaction to form leucodopaminechrome (LDAC). Moreover, during the backward scan, a reduction peak at 0.1 V is observed (Figure 5a, peak (II)), which is attributed to the reduction of DAQ on the electrode surface back to DA.
Based on several literature studies [7,11,17,31], NiO is a conductive transition metal oxide, and it is considered an attractive material for sensing applications because it has: (i) magnetic properties (p-type semiconductor), and (ii) a small size (also depends on the catalyst preparation method), which results in a large surface area [1]. According to the literature, it is justified to assume that mostly the Ni(II)/Ni(III) redox couple on the surface of the NiO250/GP/GCE possibly acts as the catalytically active ions on the oxidation of dopamine [32,33].
To further investigate the DOR mechanism on the Nafion-NiO250/GP/GC electrode, the effect of scan rate was examined as depicted in Figure 5b. As observed, the faster scan rates result in a reduction of the diffusion layer size, leading to higher observed currents. The Randles-Sevcik equation below (Equation (5)) describes the linear increase of the peak current ip,ox with the square root of the scan rate v1/2 [34].
i p = 0.446 n F A C 0 ( n F v D o R T ) 1 / 2
where R is the gas constant, and F is the Faraday constant, as given above, n is the number of electrons transferred, A is the electrode surface area (cm2), Do is the diffusion coefficient of the oxidized analyte (cm2/s), T is the temperature (K), and C0 is the concentration of the analyte in the bulk solution (mol/cm3) [35]. For freely diffusing redox species, the plot of Figure 5c should be linear. As shown, both the oxidation and reduction peaks, i.e., ip,ox, and ip,red, are linearly correlated with the square root of scan rate with R2 = 0.997 and R2 = 0.996, respectively. So, DA oxidation is a diffusion-controlled process on the surface of the Nafion-NiO250/GP/GCE.
To further examine the oxidation mechanism, the relationship between the decimal logarithms of anodic peak current and scan rate is depicted in Figure 5d. Equation (6) derives from the power law [26,36], and a and b are characteristic parameters.
l o g i p , o x = l o g a + b × l o g v
According to the literature, b values between 0.5 and 1 indicate a mixed-controlled process, while b values close to 1 are indicative of a predominantly adsorption process [36,37]. From Figure 5d, b is calculated to be 0.6. Thus, DA oxidation on the electrode surface is a mixed-controlled process, with diffusion being the rate-determining step in DOR mechanism and adsorption of DA molecules on the electrode surface being the least contributing process.

3.5. Temperature and pH Effect on Electrochemical Activity

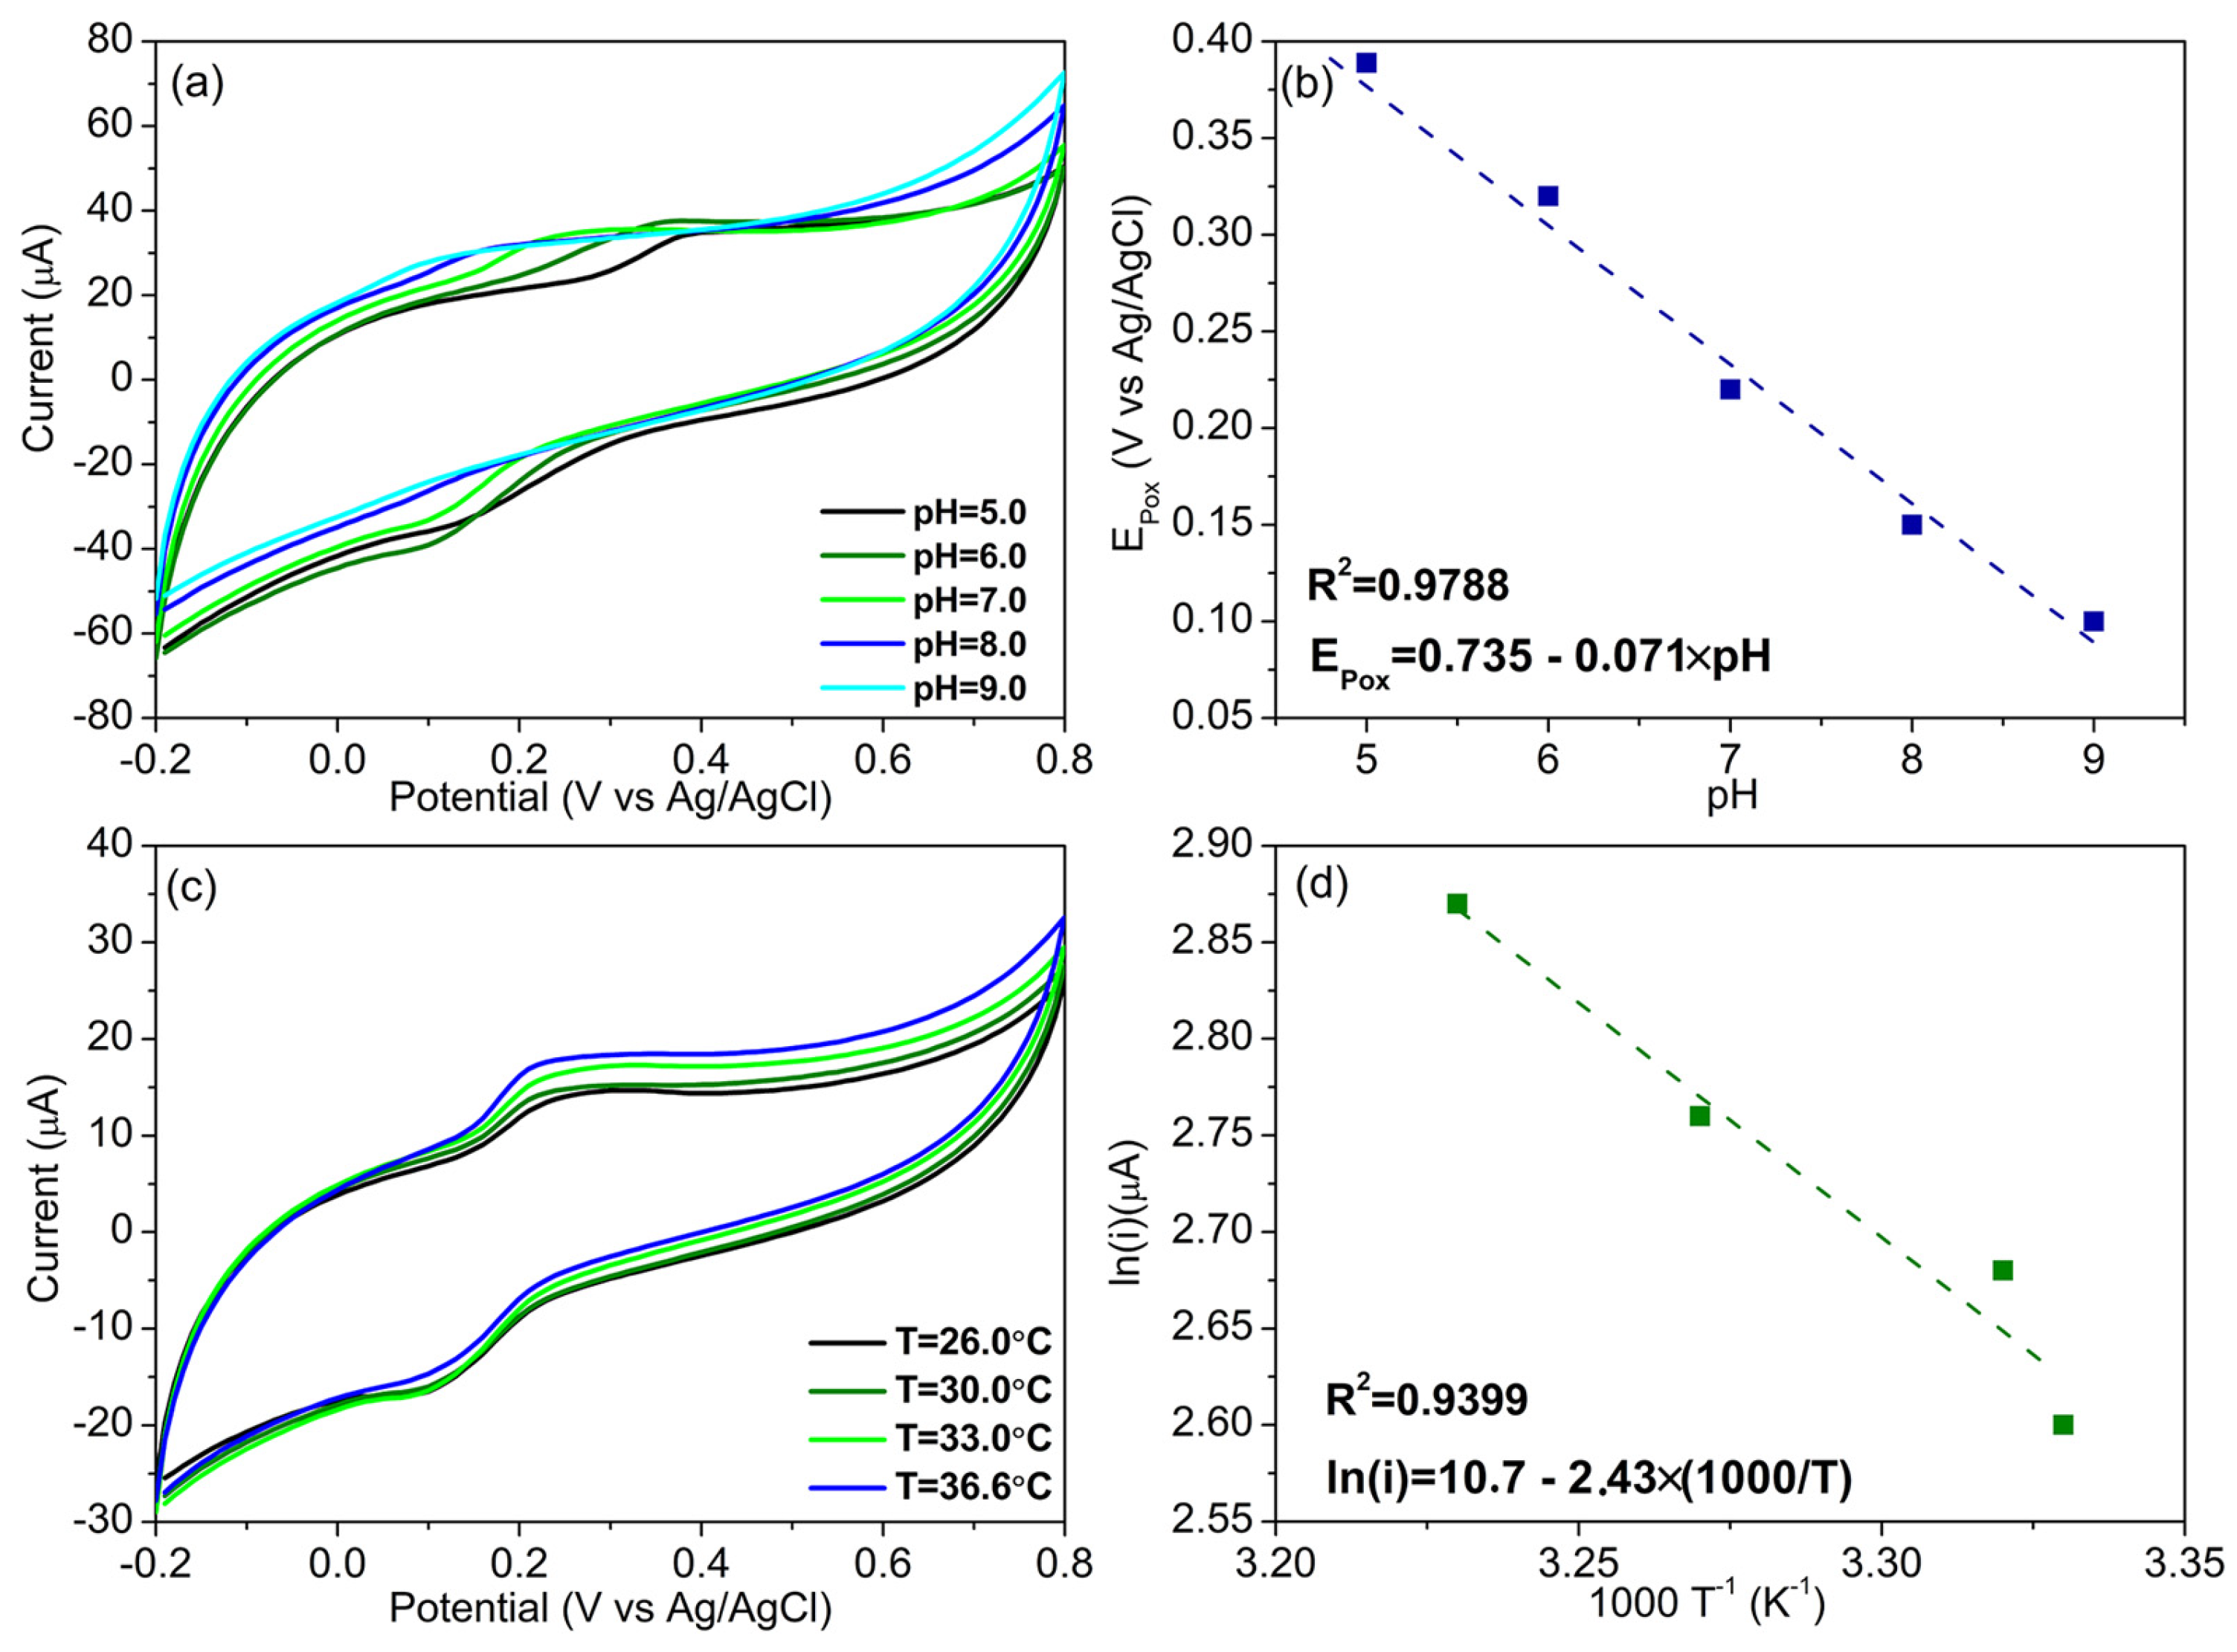
The effect of protons on the oxidation reaction of DA was explored by changing the pH value of the PBS electrolyte. The effect of solution pH on the Nafion-NiO250/GP/GCE electrocatalytic activity was investigated by the CV technique. As observed in Figure 6a, with the increase in solution pH from 5.0 to 9.0, the DA oxidation and the reduction peak potentials (Ep,ox and Ep,red) are negatively shifted, suggesting that this reaction process involves the participation of protons, which agrees with the mechanisms already proposed in the literature [38]. In detail, when pH increases, the oxidation peak potential (Ep,ox) is shifted from 0.4 V for pH = 5.0 to 0.08 V for pH = 9.0. More precisely, comparing peak potentials Ep,ox and Ep,red for pH 5.0, 6.0, and 7.0, a shift towards lower potentials is noticed for experiments at pH 7.0 for both the anodic oxidation and the cathodic reduction peaks.
The pH and oxidation peak-potential relation for Nafion-NiO250/GP/GCE is depicted in Figure 6b. The relation between measured potential Ep,ox, pH, and temperature is the Nernst equation in the modified version of Equation (7) below [39]:
E ( T ) = E 0 ( T ) R × T M × F p H
where E is the measured potential in mV, T the temperature in K, E0 the constant standard potential in mV, R the gas constant (8.314 J/mol K), M the factor to convert ln to log (2.303), F the Faraday constant (96,485 C/mol e), and n is the number of exchanged electrons [39].
The theoretical Nernstian slope for T = 36.6 °C = 309.75 K was calculated to be 61.49 mV/pH, using Equation (7). The experimental slope (Figure 6b) was calculated at 71 mV/pH, for pH values ranging from 5.0 to 9.0 at Ep,ox. The two prices are close enough, and this suggests that in the charge-transfer process near the electrode surface, the exchanged protons and electrons are almost equal, indicating an isoelectronic-isoproton process [40].
Furthermore, the effect of temperature on the DA oxidation reaction rate was studied using cyclic voltammetry and the Arrhenius equation below (Equation (8)). The temperature varied from 26.0 °C to 36.6 °C, and the CV measurements were performed in 0.1 M PBS with the addition of 0.1 mM DA. The resulting voltammograms are shown in Figure 6c.
l n ( i ) = l n ( i 0 ) E p , o x R T
According to Figure 6d and Equation (8) [41], when the temperature increases, the oxidation peak current also increases linearly, following the Arrhenius plot.

3.6. Koutecký–Levich Analysis

To acquire more detailed information about the kinetics of DA oxidation on the Nafion-NiO250/GP/GC electrode, LSV curves were obtained at various rotation rates. The LSV curves without analyte are shown in Figure S3. Since our working electrode allows the imposition of rotating movement for kinetic analysis, we apply the Koutecký–Levich theory. The Koutecký–Levich equation (Equation (9)) [41,42]:
1 i = 1 i k + 1 B ω 1 / 2
helps to distinguish between kinetic current, related to the reaction rate at the electrode surface, and diffusion-limited current, related to the mass transfer of the reactants to the electrode surface in a rotating disk electrode.
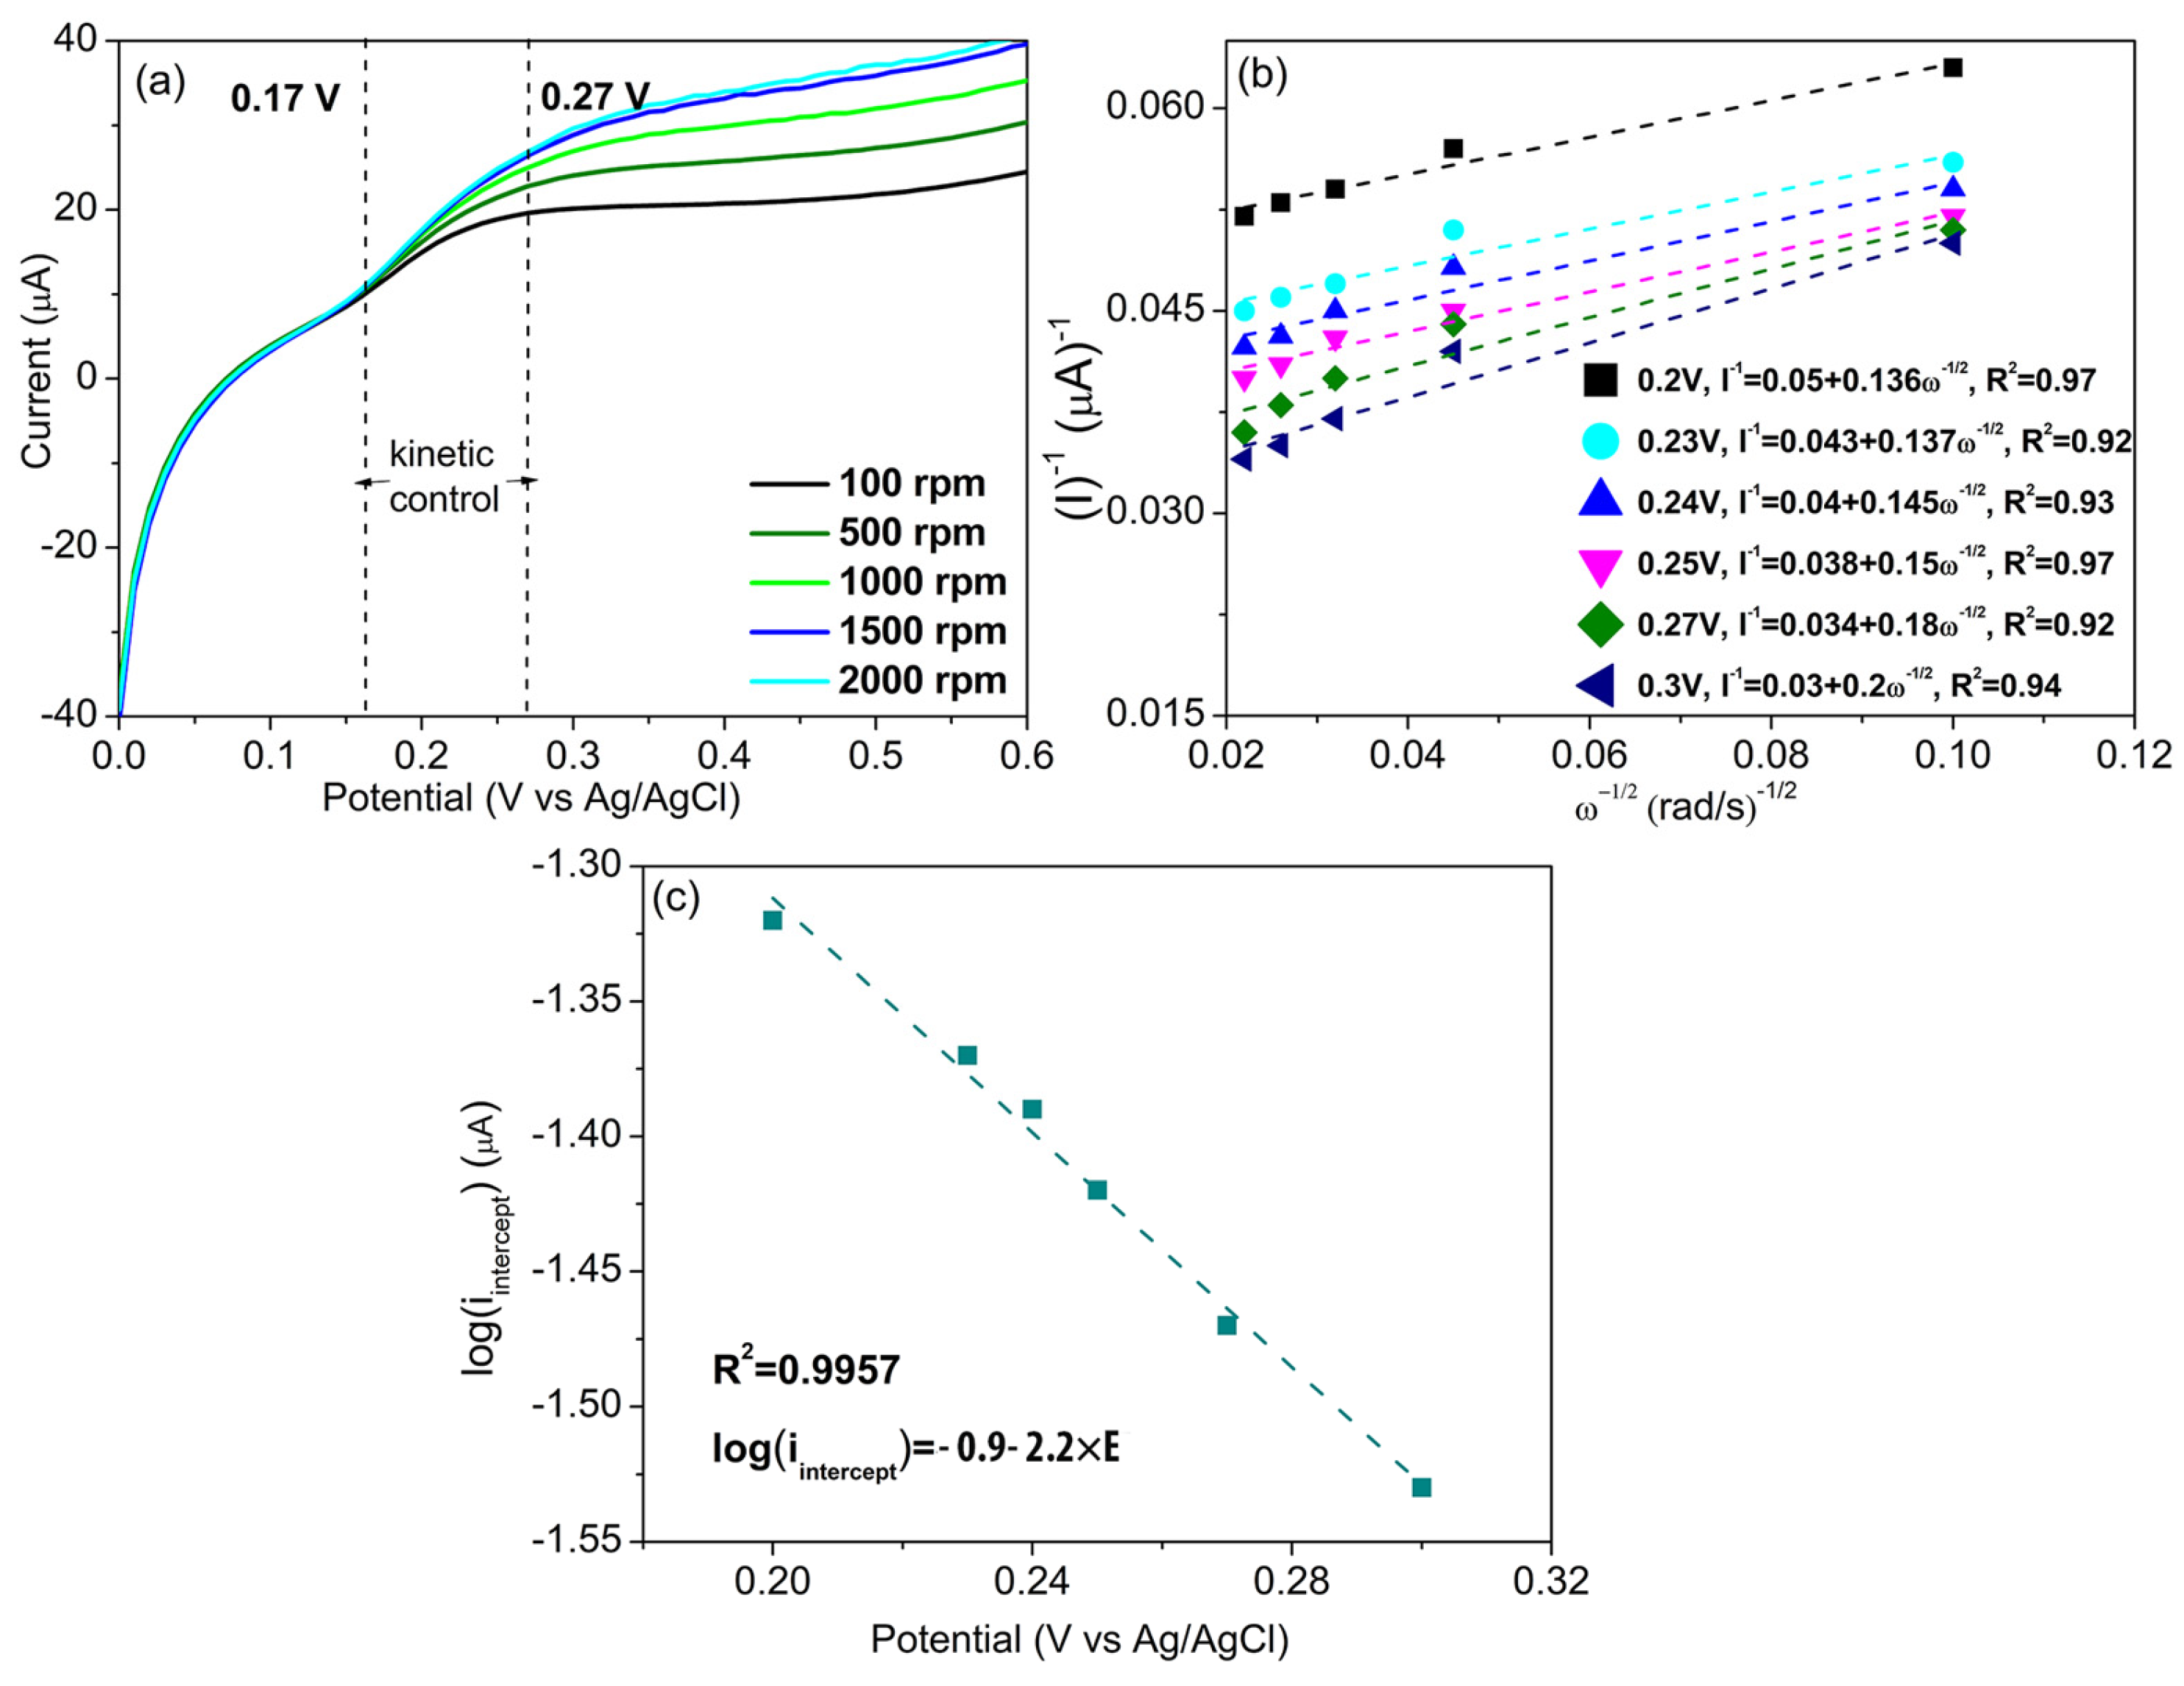
The kinetic-controlled region is observed between ca. 0.17 and 0.27 V, as seen in Figure 7a. The inverse of current is plotted as a function of the inverse of the square root of the rotation-speed to create a Koutecký–Levich plot, as shown in Figure 7b. The reciprocal of the Levich constant B, which is defined in Equation (10) below [42], corresponds to the slope of Figure 7b.
B = 0.62 n F A D 2 / 3 v 1 / 6 C
Within the kinetic region, the resulting slope is B = 0.15 μA−1/rpm−1/2.
The Koutecký–Levich intercepts derived from the curves in Figure 7b correspond to an infinitely fast rotation speed and the electron-transfer current. Using the aforementioned electron-transfer current values, the Tafel plot of Figure 7c is extracted.
The slope of the curve of Figure 7c represents the symmetry factor αo (Equation (11)), which is calculated to be ao = 0.95. The high symmetry factor for the DA oxidation process reflects the proportion of the total electric energy supplied that is needed to overcome the barrier of the oxidation charge transfer reaction [41]. This confirms that the oxidation of DA over the electrode surface follows a diffusion-limited mechanism.
p T a = a o n F R T l n 10
l o g ( i i n t e r c e p t ) = l o g ( n F k 0 R b u l k )
The current value at E = E° = 0.08 V, where i = 0 (Figure 7a), represents the standard kinetic constant k° (Equation (12)), which is calculated to be k0 = 6.2 × 10⁻⁵ cm/s. The small price of the kinetic constant k0 confirms that DA oxidation over the Nafion-NiO250/GP/GCE is diffusion-controlled and the electron transfer is slow, since reactions with k0 ≤ several 10−2 cm/s have sluggish kinetics, and thus the Koutecký–Levich method can be applied [41,42].

3.7. Sensitivity, Selectivity, and Stability Evaluation

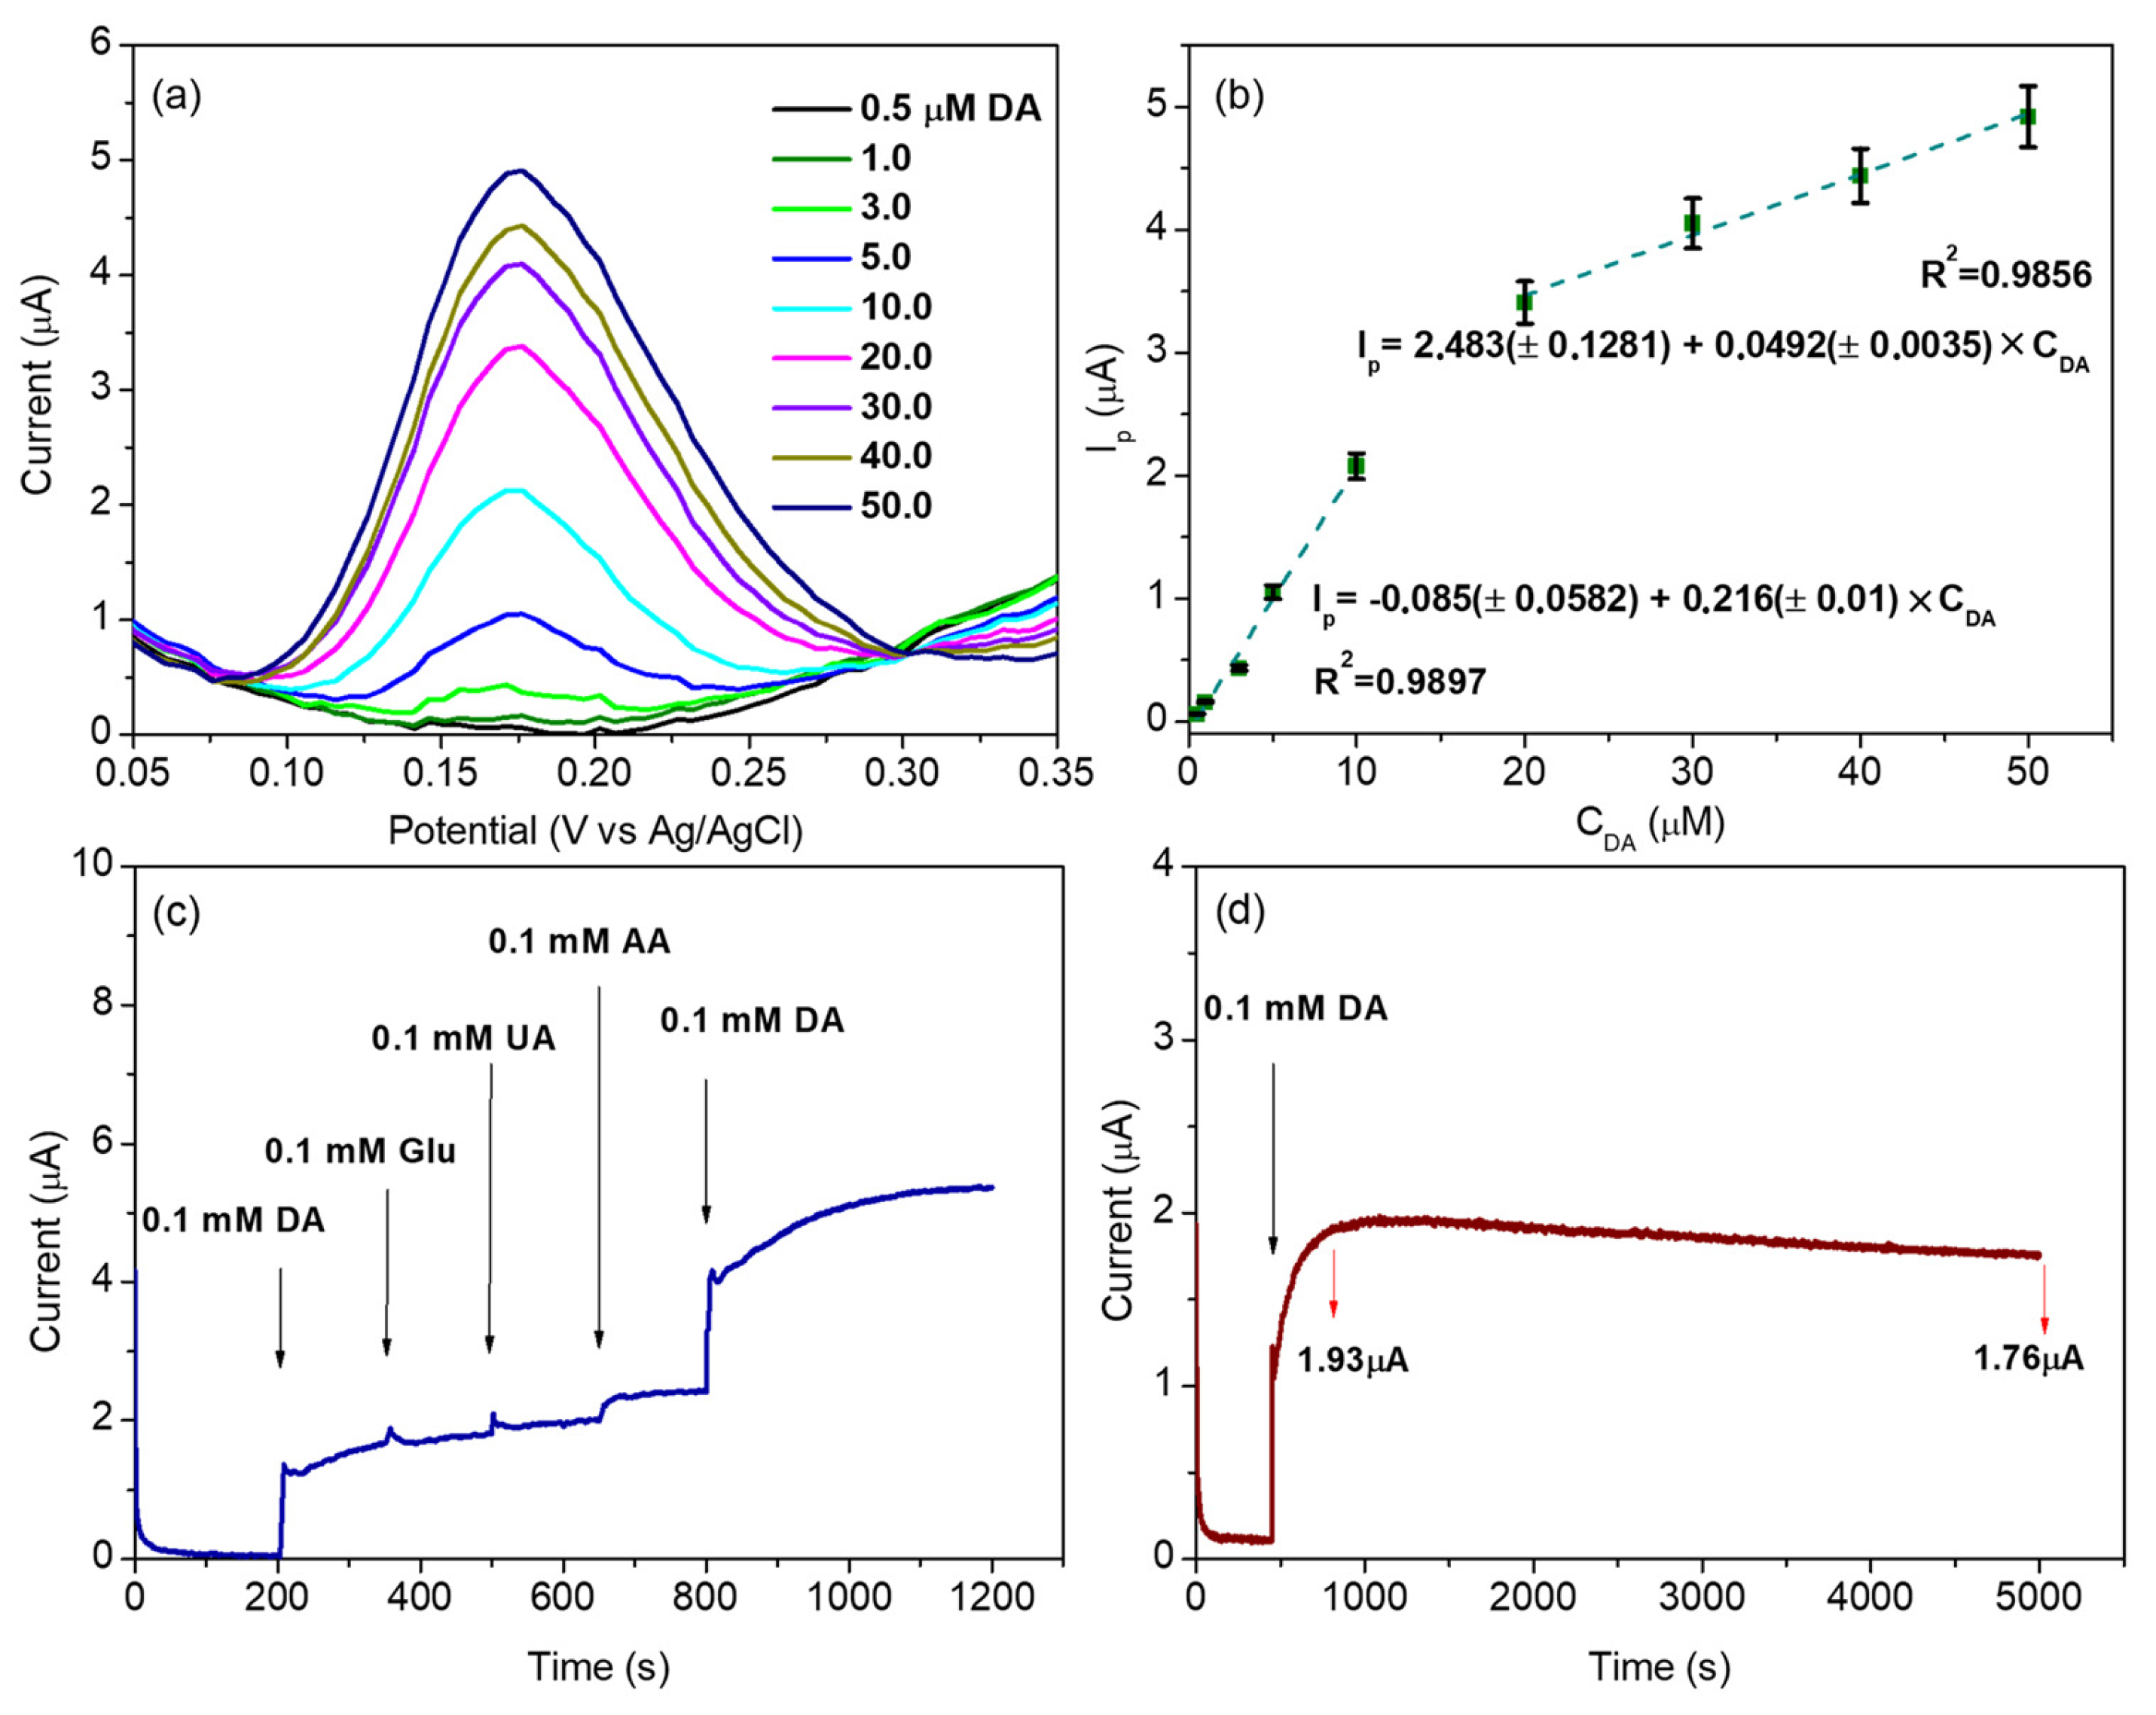
To assess the sensitivity of the prepared working electrode to dopamine molecules and determine its linear operating range and lower limit of dopamine detection (LOD), differential pulse voltammetry (DPV) measurements were performed. The tested concentration range varied from 0.5 µM to 50 µM (Figure 8a). As observed, the respective calibration curves depicted in Figure 8b show two linear regions for dopamine detection, one from 0.5 to 10 µM and the other from 20 to 50 µM, with squared correlation coefficients (R2) of 0.990 and 0.985, respectively. According to the literature, two linear ranges often occur in DA electrochemical detection due to electrochemical mechanism changes, electrode surface saturation, or diffusion limitations. The first range exhibits high sensitivity to low concentrations owing to the abundance of active sites. In contrast, the second range exhibits lower sensitivity to higher concentrations as the active sites become saturated. This often reflects diffusion-controlled processes or different reaction pathways. These ranges can be achieved using electrode materials with high electrocatalytic activity, a large surface area, or unique nanostructures. This allows for DA detection across vastly different physiological and pathological levels [43].
Using Equation (13), the resulting sensitivity for the first linear region was calculated at 3.086 μAμM−1cm−2 and for the second linear region at 0.703 μAμM−1cm−2.
S e n s i t i v i t y = S A
where S1 = 0.216 μA/μM and S2 = 0.0492 μA/μM are the respective slopes of the two linear regions (Figure 8b). A = 0.07 cm2 is the geometric area of the working electrode.
The limit of detection (LOD) was calculated to be 0.8 μM, using Equation (14):
L O D = 3 × ( σ S )
where ~3 is the signal-to-noise ratio (S/N) [44], σ = 0.0582 μA is the standard error of the y-intercept [45], and S = S1 = 0.216 μA/μM is the slope of the lower concentration values, both graphically calculated from Figure 8b.
DA co-exists in the human body with different biomolecules with similar oxidation potentials that could interfere with its electrochemical detection. Some of these molecules were selected to test the interference ability of the Nafion-NiO250/GP/GC electrode, namely, uric acid (UA), ascorbic acid (AA), and glucose (Glu). The as-prepared electrode exhibited high selectivity against DA.
CA was performed at 0.2 V potential, close to the DA oxidation potential. Figure 8c shows that the current increases to 1.65 μA after 0.1 mM DA addition to the electrolyte solution. The addition of the same amounts of Glu and UA causes no amperometric response, whereas the addition of 0.1 mM AA causes a subtle response of 0.2 μA. Finally, as more DA is added to the solution, the current increases again. The good selectivity of the catalysts could be attributed mostly to the Ni(II)/Ni(III) surface redox couple and also the Nafion treatment, which offers electrostatic attraction of cationic DA molecules, facilitating their diffusion onto the electrode surface [1].
In addition, the long-term stability of the Nafion-NiO250/GP/GC electrode as a function of time was also evaluated using chronoamperometry at a constant potential of 0.2 V, for a period of t = 5000 s. As shown in Figure 8d, the electrode initially rests in 0.1 M PBS, and at t = 500 s, 0.1 mM DA is added, and the current response increases until a steady state is reached. After t = 5000 s of almost steady operation, the electrode retained 91.2% of its initial current response, proving its ability to operate stably.

3.8. Repeatability, Reproducibility, and Storage Stability

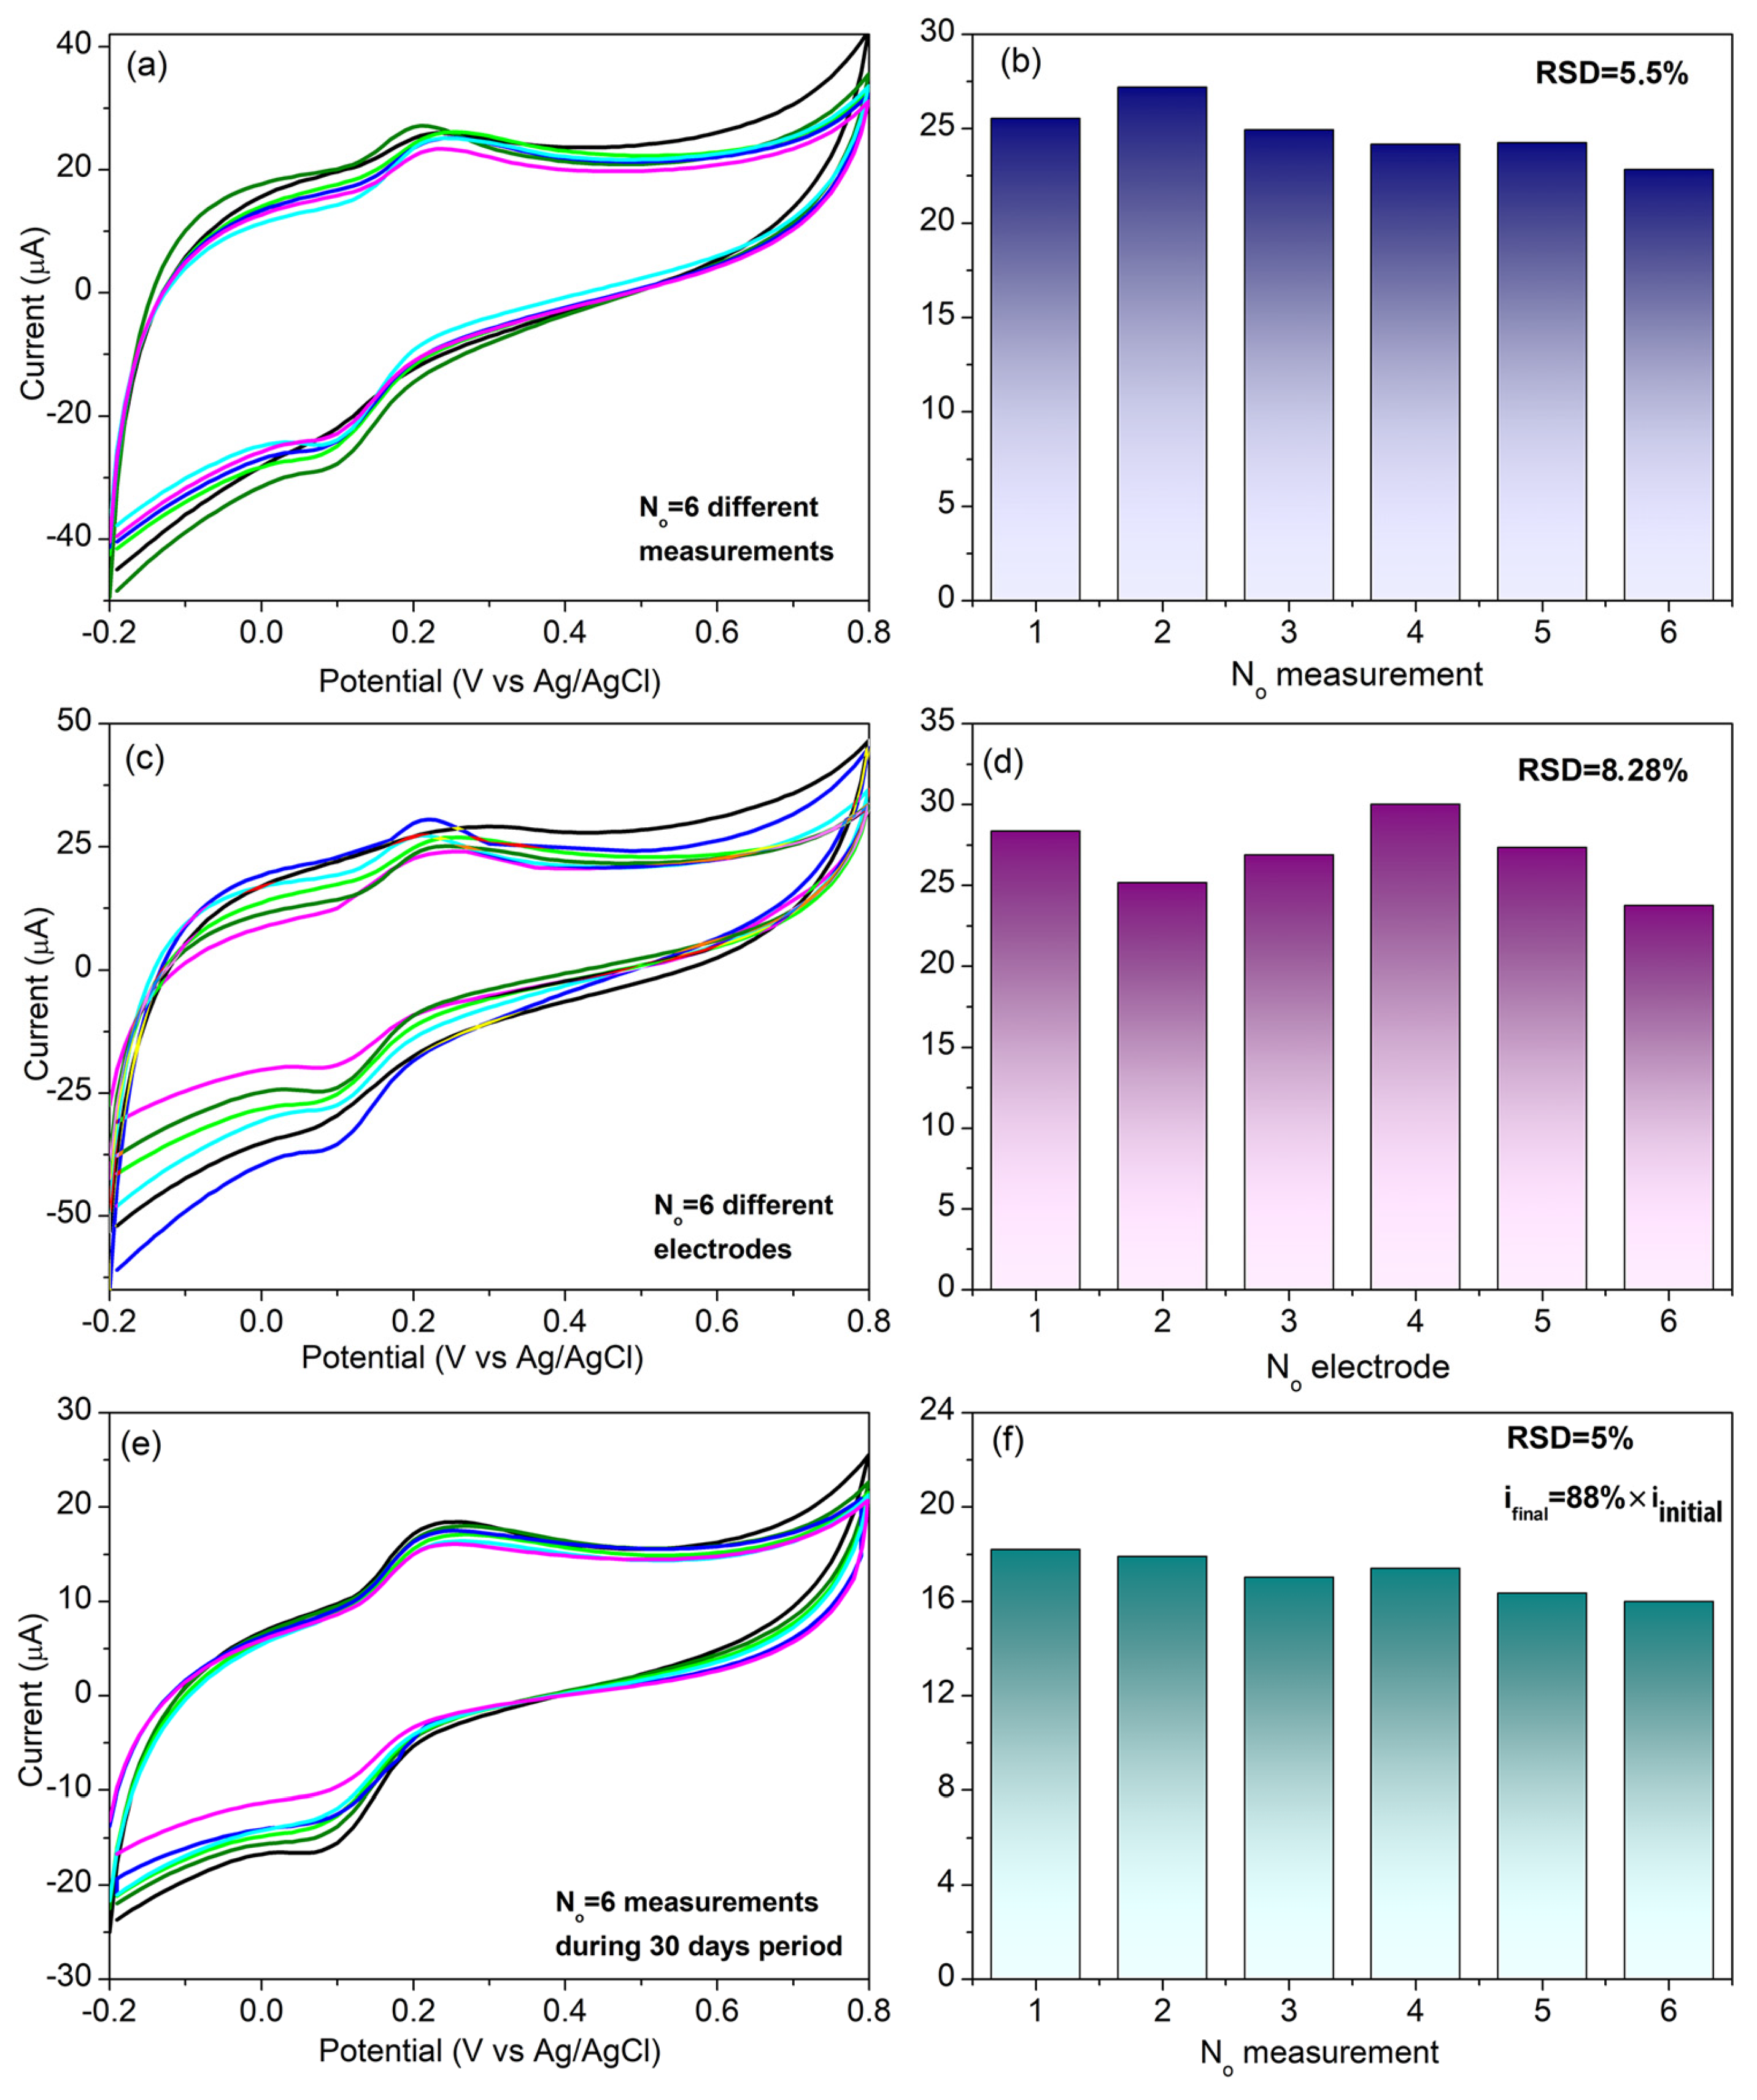
To test the Nafion-NiO250/GP/GCE repeatability, six successive CV measurements (on the same day and under the same conditions, n = 6) were conducted (Figure 9a), making a new ink deposition on the working electrode, for each measurement [45].
As Figure 9a depicts, the examined electrode gives the same results when tested using the same analytical method, under 50 rpm rotation speed, in the presence of 0.1 mM DA. Using the oxidation peak current responses (from Figure 9a), the sample’s relative standard deviation RSD% (see Supplementary Materials, relative standard deviation) is found to be 5.5%, as depicted in Figure 9b.
Reproducibility is an important characteristic to be considered in the case of non-disposable sensors [45]. The reproducibility of the as-tested electrode was examined by comparing the peak current densities of the cyclic voltammograms measurements of Figure 9c, under the same conditions, for six different electrodes (n = 6). Figure 9d shows the corresponding oxidation peak current for each electrode, and the RSD% is 8.28%. The reproducibility of the electrode can be further improved for future large-scale production of non-disposable sensors.
The storage stability of the Nafion-NiO250/GP/GCE was tested to investigate its ability to give the same results after prolonged storage. The electrode was stored in 0.1 M PBS in a refrigerator at 8 °C for 30 days [26,46]. Figure 9e shows the cyclic voltammograms obtained by measuring the current response of the sensor every five days, under the same conditions. As shown by the oxidation peak current bars in Figure 9f, the electrode retains 88% of its initial current response after 30 days of storage, and the relative standard deviation (RSD%) between the n = 6 measurements is about 5%. The above results confirm the acceptable storage stability of the electrode.

4. Conclusions

The performance characteristics of the Nafion-NiO250/GP electrocatalyst, including detection potential, LOD, linear range, sensitivity, and detection technique, are compared with some nickel and nickel oxide-based DA electrochemical sensors reported in the International Literature [9,10,11,12,15,47], and the summarized results are presented in Table S1 of the Supplementary File. The limit of detection (LOD) for the lower linear range of 0.5–10 μM was similar to that reported in international literature. The linear detection range was sufficiently wide compared to other NiOx-based electrodes for DA detection. In addition, the sensitivity of Nafion-NiO250/GP was among the highest reported in the Inter. Lit. This could be attributed to the uniform distribution of NiOx nanoparticles on the graphene substrate and, of course, to the Ni(II)/Ni(III) redox couple on the electrocatalyst surface that catalyze DA oxidation. Furthermore, the electrode showed high selectivity towards DA in the presence of AA, UA, and Glu as interferents. This was mainly attributed to the electrode surface modification with Nafion, which providedelectrostatic attraction for the cationic DA molecule and electrostatic repulsion for the anionic UA and AA molecules. In addition, the Nafion NiO250/GP/GC electrode showed good repeatability, and the resulting deviation was acceptable. Reproducibility was also examined by repeating the same measurement for six identically prepared electrodes, and it was found acceptable, however, further improvement would be beneficial. Finally, the storage stability of the Nafion NiO250/GP/GC electrode was tested and found to be excellent. The electrode was stored in a refrigerator at 8 °C for 30 days, immersed in 0.1 M electrolyte solution, and the same measurement was taken every five days. The variation between these measurements was acceptable, while on the 30th day, the electrode managed to retain 88% of its initial current response.

Supplementary Materials

The following supporting information can be downloaded at: https://www.mdpi.com/article/10.3390/catal16030217/s1: Figure S1: Cyclic voltammograms in 0.1 M PBS at 36.6 °C, with 50 rpm stirring, with different ink loadings at 20 mV/s scan rate for (a) Nafion-NiO250/GP/GC electrode and (b) Nafion-NiO450/GP/GC electrode.; Figure S2: Dopamine’s oxidation to form dopamine-quinone through a 2e and 2H+ pathway in both (a) neutral and (b) protonated forms [4]; Figure S3: LSV curves for the Nafion-NiO250/GP/GCE from 0 to 0.6 V, applying various rotation speeds in 0.1 M PBS electrolyte solution at 36.6 °C; Table S1: Comparison table of the constructed Nafion-NiO250/GP electrocatalyst with other Ni and NiO-based electrodes for DA electrochemical detection.

Author Contributions

Conceptualization, P.T.; methodology, A.B.; software, G.B. and C.L.V.; validation, A.B. and G.B.; formal analysis, C.L.V. and V.B.; investigation, G.B. and A.B.; resources, P.T.; data curation, G.B. and C.L.V.; writing—original draft preparation, G.B. and C.L.V.; writing—review and editing, A.B. and P.T.; supervision, P.T. and A.B. All authors have read and agreed to the published version of the manuscript.

Funding

G.B. thankfully acknowledges the funding of the Hellenic Foundation for Research and Innovation (H.F.R.I.) under the “3rd Call for H.F.R.I. Ph.D. Fellowships” (Fellowship Number: 05869), A.B. thankfully acknowledges the Research, Innovation, and Excellence Structure (DEKA) of the University of Thessaly for funding (5600.03.08.05).

Data Availability Statement

Data are contained within the article and Supplementary Files.

Conflicts of Interest

The authors declare no conflicts of interest.

References

  1. Balkourani, G.; Brouzgou, A.; Tsiakaras, P. A review on recent advancements in electrochemical detection of dopamine using carbonaceous nanomaterials. Carbon 2023, 213, 118281. [Google Scholar] [CrossRef]
  2. Schindler, S.; Bechtold, T. Mechanistic insights into the electrochemical oxidation of dopamine by cyclic voltammetry. J. Electroanal. Chem. 2019, 836, 94–101. [Google Scholar] [CrossRef]
  3. Lin, Z.-F.; Li, H.; Chen, Z.-C.; Han, G.-C.; Feng, X.-Z.; Kraatz, H.-B. Advances in dopamine electrochemical sensors: Properties and application prospects of different modified materials. Microchem. J. 2025, 212, 113535. [Google Scholar] [CrossRef]
  4. Lakshmanakumar, M.; Nesakumar, N.; Kulandaisamy, A.J.; Rayappan, J.B.B. Principles and recent developments in optical and electrochemical sensing of dopamine: A comprehensive review. Measurement 2021, 183, 109873. [Google Scholar] [CrossRef]
  5. Balkourani, G.; Damartzis, T.; Brouzgou, A.; Tsiakaras, P. Cost Effective Synthesis of Graphene Nanomaterials for Non-Enzymatic Electrochemical Sensors for Glucose: A Comprehensive Review. Sensors 2022, 22, 355. [Google Scholar] [CrossRef]
  6. Yue, H.Y.; Zhang, H.J.; Huang, S.; Gao, X.; Song, S.S.; Wang, Z.; Wang, W.Q.; Guan, E.H. A novel non-enzymatic dopamine sensors based on NiO-reduced graphene oxide hybrid nanosheets. J. Mater. Sci. Mater. Electron. 2019, 30, 5000–5007. [Google Scholar] [CrossRef]
  7. Mondal, R.; Ahmed, S.F.; Mukherjee, N. Highly sensitive, selective and rapid in-vitro electrochemical sensing of dopamine achieved on oxygen deficient nickel oxide/partially reduced graphene oxide (NiOx/p-rGO) nanocomposite platform. Inorg. Chem. Commun. 2025, 171, 113575. [Google Scholar] [CrossRef]
  8. Muhammad, B.; Rehman, Z.U.; Butt, F.K.; Jrar, J.A.; Yang, X.; Zheng, K.; Hussain, A.; Wang, C.; Hou, J. Vanadium doped nickel oxide/g-C3N4 composites for multifunctional biosensing of dopamine, ascorbic acid and H2O2. Ceram. Int. 2024, 50, 34091–34100. [Google Scholar] [CrossRef]
  9. Gao, J.; He, P.; Yang, T.; Zhou, L.; Wang, X.; Chen, S.; Lei, H.; Zhang, H.; Jia, B.; Liu, J. Electrodeposited NiO/graphene oxide nanocomposite: An enhanced voltammetric sensing platform for highly sensitive detection of uric acid, dopamine and ascorbic acid. J. Electroanal. Chem. 2019, 852, 113516. [Google Scholar] [CrossRef]
  10. Aryal, K.P.; Jeong, H.K. Nickel decorated graphite oxide and carbon nanofiber surface for electrochemical detection of dopamine. Chem. Phys. Lett. 2020, 761, 138088. [Google Scholar] [CrossRef]
  11. Althagafi, Z.T.; Althakafy, J.T.; Al Jahdaly, B.A.; Awad, M.I. Differential Electroanalysis of Dopamine in the Presence of a Large Excess of Ascorbic Acid at a Nickel Oxide Nanoparticle-Modified Glassy Carbon Electrode. J. Sens. 2020, 2020, 8873930. [Google Scholar] [CrossRef]
  12. Brouzgou, A. Graphene-Based Nanomaterials as Organocatalyst. In Graphene-Based Nanomaterial Catalysis; Singh, M., Rai, V.K., Rai, A., Eds.; Bentham Science Publishers: Sharjah, United Arab Emirates, 2022; p. 24. [Google Scholar]
  13. Islam, S.; Shaheen Shah, S.; Naher, S.; Ali Ehsan, M.; Aziz, M.A.; Ahammad, A.J.S. Graphene and Carbon Nanotube-Based Electrochemical Sensing Platforms for Dopamine. Chem. Asian J. 2021, 16, 3516–3543. [Google Scholar] [CrossRef] [PubMed]
  14. Joseph, T.; Sona, V.K.; Aiswarya, A.; Rasheed, F.A.; Thomas, N. Nickel oxide (NiO)/reduced graphene oxide (RGO) composite modified carbon paste electrode as an electrochemical sensor for the sensitive determination of dopamine. AIP Conf. Proc. 2019, 2162, 20148. [Google Scholar] [CrossRef]
  15. Roychoudhury, A.; Prateek, A.; Basu, S.; Jha, S.K. Preparation and characterization of reduced graphene oxide supported nickel oxide nanoparticle-based platform for sensor applications. J. Nanopart. Res. 2018, 20, 70. [Google Scholar] [CrossRef]
  16. Kumar, P.; Aslam, M.; Ali, S.; Hamdy, K.; Ahmad, K.; Danishuddin. Progress in NiO Based Materials for Electrochemical Sensing Applications. Biosensors 2025, 15, 678. [Google Scholar] [CrossRef]
  17. Priyanto, S.A.N.; Yulianti, E.S.; Zakiyuddin, A.; Rahman, S.F. Amperometric Biosensor Detecting Dopamine Based on Polypyrrole/Reduced Graphene Oxide/Nickel Oxide/Glassy Carbon Electrode. J. Electr. Comput. Eng. 2024, 2024, 7453474. [Google Scholar] [CrossRef]
  18. Venton, B.J.; Wightman, R.M. Psychoanalytical Electrochemistry: Dopamine and Behavior. Anal. Chem. 2003, 75, 414A–421A. [Google Scholar] [CrossRef]
  19. Pang, P.; Yan, F.; Li, H.; Li, H.; Zhang, Y.; Wang, H.; Wu, Z.; Yang, W. Graphene quantum dots and Nafion composite as an ultrasensitive electrochemical sensor for the detection of dopamine. Anal. Methods 2016, 8, 4912–4918. [Google Scholar] [CrossRef]
  20. Demuru, S.; Deligianni, H. Surface PEDOT: Nafion Coatings for Enhanced Dopamine, Serotonin and Adenosine Sensing. J. Electrochem. Soc. 2017, 164, G129. [Google Scholar] [CrossRef]
  21. Kim, D.; Lee, S.; Piao, Y. Electrochemical determination of dopamine and acetaminophen using activated graphene-Nafion modified glassy carbon electrode. J. Electroanal. Chem. 2017, 794, 221–228. [Google Scholar] [CrossRef]
  22. Sabar, M.; Faiza, F.; Nawaz, M.H.; Ullah, R.; Ibrahim, M.A.; Nishan, U.; Riaz, S. Enhanced electrochemical detection of dopamine using Nafion stabilized MXene coated carbon cloth Sensors. J. Dispers. Sci. Technol. 2025, 1–8. [Google Scholar] [CrossRef]
  23. Lucy, C.A. Is Your Henderson–Hasselbalch Calculation of Buffer pH Correct? J. Chem. Educ. 2023, 100, 2418–2422. [Google Scholar] [CrossRef]
  24. Alharshan, G.A.; Almohammedi, A.; Uosif, M.A.M.; Shaaban, E.R.; Emam-Ismail, M. Impact of Heat Treatment on the Structural, Optical, Magnetic and Photocatalytic Properties of Nickel Oxide Nanoparticles. Materials 2024, 17, 4146. [Google Scholar] [CrossRef] [PubMed]
  25. Lakard, S.; Pavel, I.-A.; Lakard, B. Electrochemical Biosensing of Dopamine Neurotransmitter: A Review. Biosensors 2021, 11, 179. [Google Scholar] [CrossRef] [PubMed]
  26. Balkourani, G.; Brouzgou, A.; Vecchio, C.L.; Aricò, A.S.; Baglio, V.; Tsiakaras, P. Selective electro-oxidation of dopamine on Co or Fe supported onto N-doped ketjenblack. Electrochim. Acta 2022, 409, 139943. [Google Scholar] [CrossRef]
  27. Oh, S.; Kim, H.; Kwon, Y.; Kim, M.; Cho, E.; Kwon, H. Porous Co–P foam as an efficient bifunctional electrocatalyst for hydrogen and oxygen evolution reactions. J. Mater. Chem. A 2016, 4, 18272–18277. [Google Scholar] [CrossRef]
  28. Cossar, E.; Houache, M.S.E.; Zhang, Z.; Baranova, E.A. Comparison of electrochemical active surface area methods for various nickel nanostructures. J. Electroanal. Chem. 2020, 870, 114246. [Google Scholar] [CrossRef]
  29. Wu, J. Understanding the Electric Double-Layer Structure, Capacitance, and Charging Dynamics. Chem. Rev. 2022, 122, 10821–10859. [Google Scholar] [CrossRef]
  30. Liu, X.; Liu, J. Biosensors and sensors for dopamine detection. View 2021, 2, 20200102. [Google Scholar] [CrossRef]
  31. Zhang, M.; Wang, Y.; You, B.; Qi, Z.; Wang, Y.; Zhang, Z. Nickel oxide decorated popcorn derived biochar as a non-invasive electrochemical sensor for sensitive detection of glucose in saliva. J. Alloys Compd. 2025, 1010, 177427. [Google Scholar] [CrossRef]
  32. Yang, S.; Li, G.; Liu, L.; Wang, G.; Wang, D.; Qu, L. Preparation of nickel oxide nanoparticles on N-doped reduced graphene oxide: A two-dimensional hybrid for electrocatalytic sensing of l-cysteine. J. Alloys Compd. 2017, 691, 834–840. [Google Scholar] [CrossRef]
  33. Roychoudhury, A.; Basu, S.; Jha, S.K. Dopamine biosensor based on surface functionalized nanostructured nickel oxide platform. Biosens. Bioelectron. 2016, 84, 72–81. [Google Scholar] [CrossRef] [PubMed]
  34. Elgrishi, N.; Rountree, K.J.; McCarthy, B.D.; Rountree, E.S.; Eisenhart, T.T.; Dempsey, J.L. A Practical Beginner’s Guide to Cyclic Voltammetry. J. Chem. Educ. 2018, 95, 197–206. [Google Scholar] [CrossRef]
  35. Bacil, R.P.; Chen, L.; Serrano, S.H.P.; Compton, R.G. Dopamine oxidation at gold electrodes: Mechanism and kinetics near neutral pH. Phys. Chem. Chem. Phys. 2020, 22, 607–614. [Google Scholar] [CrossRef]
  36. Gaolatlhe, L.; Barik, R.; Ray, S.C.; Ozoemena, K.I. Voltammetric responses of porous Co3O4 spinels supported on MOF-derived carbons: Effects of porous volume on dopamine diffusion processes. J. Electroanal. Chem. 2020, 872, 113863. [Google Scholar] [CrossRef]
  37. Nayak, D.S.; Shetti, N.P. A novel sensor for a food dye erythrosine at glucose modified electrode. Sens. Actuators B Chem. 2016, 230, 140–148. [Google Scholar] [CrossRef]
  38. Zhang, L.; Tang, J.; Li, J.; Li, Y.; Yang, P.; Zhao, P.; Fei, J.; Xie, Y. A novel dopamine electrochemical sensor based on 3D flake nickel oxide/ cobalt oxide @ porous carbon nanosheets/carbon nanotubes/electrochemical reduced of graphene oxide composites modified glassy carbon electrode. Colloids Surf. A Physicochem. Eng. Asp. 2023, 666, 131284. [Google Scholar] [CrossRef]
  39. Lower, S. 16.4: The Nernst Equation; OpenStax: Houston, TX, USA, 2024. [Google Scholar]
  40. Dorraji, P.S.; Jalali, F. Novel sensitive electrochemical sensor for simultaneous determination of epinephrine and uric acid by using a nanocomposite of MWCNTs–chitosan and gold nanoparticles attached to thioglycolic acid. Sens. Actuators B Chem. 2014, 200, 251–258. [Google Scholar] [CrossRef]
  41. Bard, A.J.; Faulkner, L.R.; White, H.S. Electrochemical Methods: Fundamentals and Applications; Wiley: Hoboken, NJ, USA, 2022. [Google Scholar]
  42. BioLogic. Application Note 56: Measurement of electrochemical reaction kinetics. In Levich and Koutecký-Levich Analysis Tools; BioLogic: Seyssinet-Pariset, France, 2020. [Google Scholar]
  43. Feng, J.; Li, Q.; Cai, J.; Yang, T.; Chen, J.; Hou, X. Electrochemical detection mechanism of dopamine and uric acid on titanium nitride-reduced graphene oxide composite with and without ascorbic acid. Sens. Actuators B Chem. 2019, 298, 126872. [Google Scholar] [CrossRef]
  44. Golrokh Amin, B.; De Silva, U.; Masud, J.; Nath, M. Ultrasensitive and Highly Selective Ni3Te2 as a Nonenzymatic Glucose Sensor at Extremely Low Working Potential. ACS Omega 2019, 4, 11152–11162. [Google Scholar] [CrossRef]
  45. Agency, E.M. ICH Q2(R2) Guideline on Validation of Analytical Procedures; European Medicines Agency: Amsterdam, The Netherlands, 2023. [Google Scholar]
  46. Tawab, M.A.H.A.; El-Moghny, M.G.A.; El Nashar, R.M. Computational design of molecularly imprinted polymer for electrochemical sensing and stability indicating study of sofosbuvir. Microchem. J. 2020, 158, 105180. [Google Scholar] [CrossRef]
  47. He, W.; Ding, Y.; Zhang, W.; Ji, L.; Zhang, X.; Yang, F. A highly sensitive sensor for simultaneous determination of ascorbic acid, dopamine and uric acid based on ultra-small Ni nanoparticles. J. Electroanal. Chem. 2016, 775, 205–211. [Google Scholar] [CrossRef]
Figure 1. (a) XRD for NiOx/GP treated at 250 °C and NiOx/GP treated at 450 °C. (b) XPS deconvolution of Ni2p, C1s and O1s peaks for 30% NiO250/GP and 30% NiO450/GP.
Catalysts 16 00217 g001
Figure 2. HRTEM images for the 30% NiO250/GP (treated at 250 °C) nanoparticles at different magnifications: (a) 50 nm, (c) 10 nm, and for the 30% NiO450/GP (treated at 450 °C) at (b) 50 nm, and (d) 10 nm.
Catalysts 16 00217 g002
Figure 3. Cyclic voltammograms (CVs) of (a) the NiO250/GP/GC and (b) NiO450/GP/GC electrodes and without Nafion, in 0.1 M PBS and in the presence of 0.1 mM DA, at 36.6 °C, with 50 rpm stirring and 20 mV/s scan rate. Arrows indicate the direction of the oxidation (upward arrow) and reduction processes (downward arrow).
Catalysts 16 00217 g003
Figure 4. Cyclic voltammograms for Nafion-NiO250/GP/GCE and Nafion-NiO450/GP/GCE in 0.1 M PBS at 36.6 °C, with 50 rpm stirring (a,e) with different scan rates in the non-Faradaic region, from 0.2 to 0.4 V, (b,f) the corresponding current vs. scan rate calibration plots at 0.3 V, (c,g) with and without 0.1 mM DA, (d,h) in the presence of 0.1 mM DA after the extraction of the blind curve, at 20 mV/s. Arrows indicate the direction of the oxidation (upward arrow) and reduction processes (downward arrow).
Catalysts 16 00217 g004
Figure 5. Cyclic voltammograms for Nafion-NiO250/GP/GC in 0.1 M PBS at 36.6 °C and 50 rpm stirring (a) with and without 0.1 mM DA, (b) at different scan rates with 0.1 mM DA. (dotted arrows indicate the potentials for extracting (c,d) sub-figures. The corresponding plots of (c) peak oxidation and reduction currents (Ip) versus the square root of the scan rate (v1/2) and (d) the decimal logarithm of peak current (log(ip)) versus the decimal logarithm of the scan rate (log(v)).
Catalysts 16 00217 g005
Figure 6. (a) Cyclic voltammograms at various pH values using 0.1 mM DA at 20 mV/s and 36.6 °C for the Nafion-NiO250/GP/GC electrode. (b) Oxidation peak currents are plotted against the pH of the solution. (c) Cyclic voltammograms at different temperatures at 20 mV/s scan rate and 0.1 mM DA in 0.1 M PBS electrolyte. (d) Arrhenius plot for the oxidation peak current for the Nafion-NiO250/GP/GC electrode @ 0.2 V.
Catalysts 16 00217 g006
Figure 7. Linear sweep voltammetry (LSV) curves for the Nafion-NiO250/GP/GC electrode, using a rotating disk electrode (RDE) at the potential window from 0 to 0.6 V in 0.1 mM DA in 0.1 M PBS, at 36.6 °C (a). Koutecký–Levich plots at various potentials close to the kinetic control region (b). Tafel plot for current values derived from Koutecký–Levich plots (c).
Catalysts 16 00217 g007
Figure 8. (a) Differential pulse voltammogram of the Nafion-NiO250/GP/GC electrode for different DA concentrations in 0.1 M PBS at 36.6 °C, and (b) the linear regression curves of the oxidation current at 0.175 V vs. DA concentrations. Amperometric response of Nafion-NiO250/GP/GC electrode, taken under stable potential of 0.2 V in 0.1 M PBS solution at 36.6 °C (c) with the successive addition of 0.1 mM of DA and 0.1 mM Glu, UA, and AA as interfering agents, and (d) in the presence of 0.1 mM DA for t = 5000 s.
Catalysts 16 00217 g008
Figure 9. Cyclic voltammograms are performed using RDE at 50 rpm, in the presence of 0.1 mM DA in 0.1 M PBS electrolyte at 36.6 °C. (a) Measurements conducted using a Nafion-NiO250/GP/GCE for six successive trials with small time intervals, (b) the corresponding oxidation peak currents bar graphs and RSD results. (c) The same measurements for six different Nafion-NiO250/GP/GCEs, (d) corresponding oxidation peak currents in bar graphs. (e) Six measurements with a time interval of 5 days for the Nafion-NiO250/GP/GCE, which is stored for 30 days at 8 °C, (f) the corresponding oxidation peak currents bar graphs and RSD results.
Catalysts 16 00217 g009
Disclaimer/Publisher’s Note: The statements, opinions and data contained in all publications are solely those of the individual author(s) and contributor(s) and not of MDPI and/or the editor(s). MDPI and/or the editor(s) disclaim responsibility for any injury to people or property resulting from any ideas, methods, instructions or products referred to in the content.