2.1. SO Photocatalytic Oxidation
To study the adsorption kinetics of the contaminant, a suspension containing 10 mg/L of SO and 0.4 mg/L of TiO2 was stirred magnetically in the dark at a temperature of 25 °C and pH 6 for 180 min. The SO concentration stabilized within 15 min and remained unchanged for the rest of the experiment. This indicates that adsorption-desorption equilibrium was rapidly reached under these conditions. The equilibrium uptake was low (0.0125 mg/g), which is consistent with the modest specific surface area of TiO2 P25 and the bulky, cationic nature of SO. Therefore, all photocatalytic experiments were preceded by a 30 min dark equilibration period. Kinetic analyses used the post-adsorption baseline to ensure that the reported degradation rates reflected photocatalytic degradation rather than ongoing adsorption.
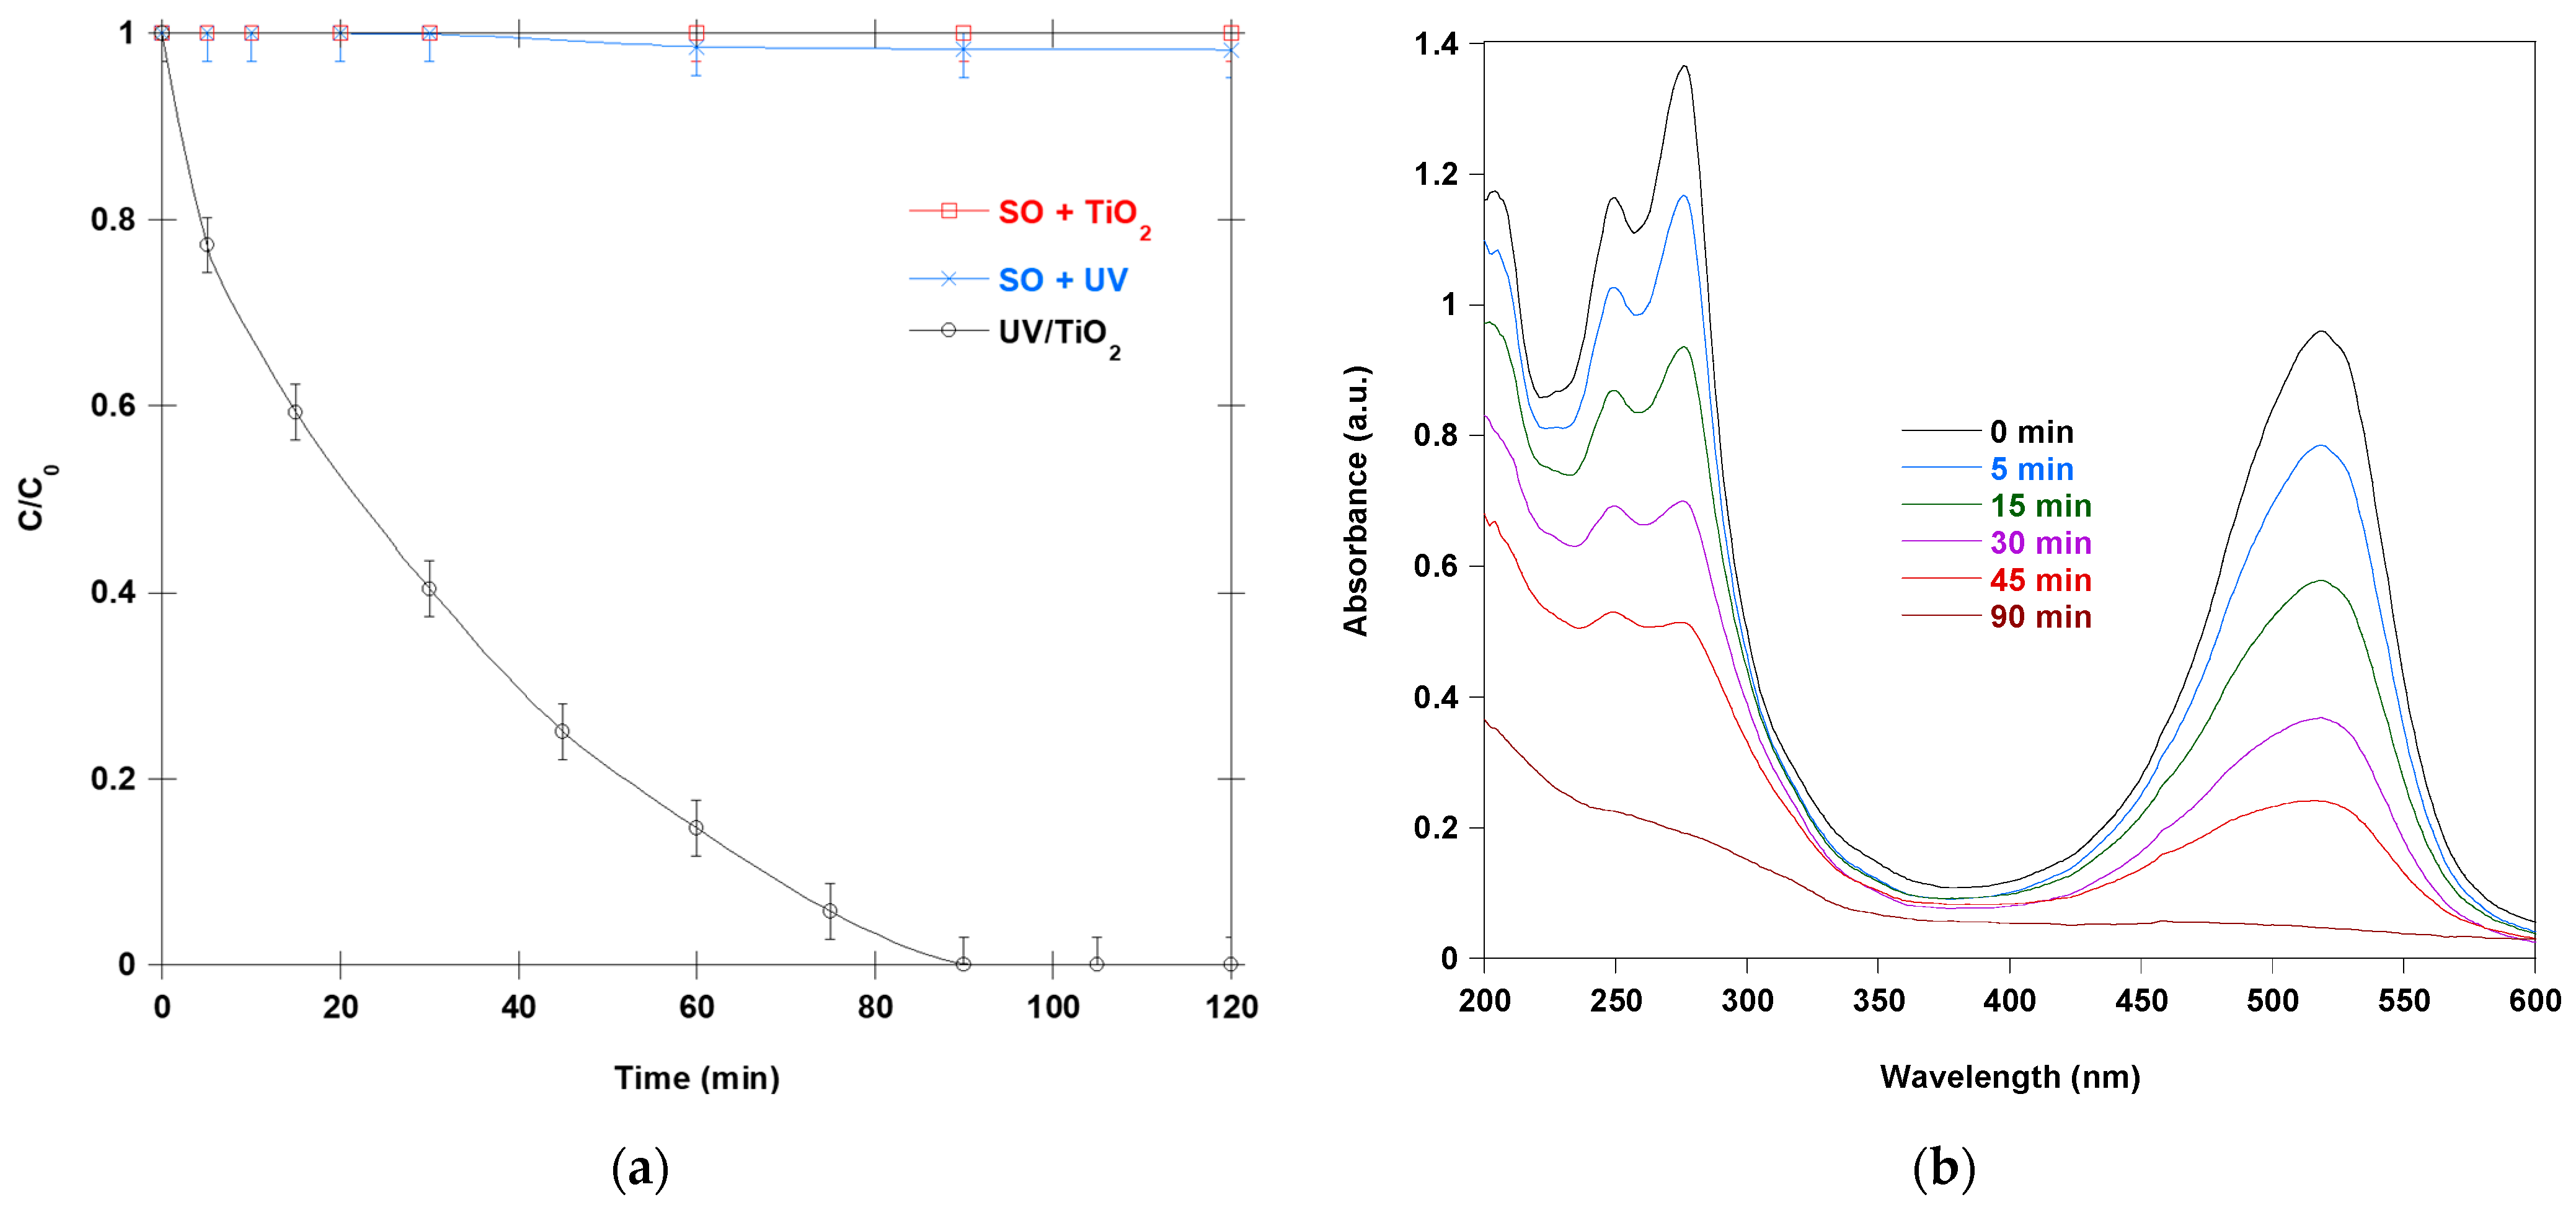
Figure 1a illustrates the changes in the concentration of SO in aqueous solutions over time under three experimental conditions: photolysis at 365 nm without a catalyst, dark adsorption in the presence of TiO
2, and TiO
2-assisted photocatalysis under 365 nm irradiation. The results demonstrate negligible SO removal via dark adsorption (SO + TiO
2 in the dark), modest photolysis (SO under UV light only), and rapid photocatalytic degradation. Photolysis alone at 365 nm results in minimal SO decomposition, with a concentration decrease of less than 2% after 120 min. This limited photolysis efficiency stems from the low quantum yield of direct SO photolysis. In the dark experiment with TiO
2, the SO concentration remains essentially constant, indicating negligible adsorption or surface-mediated transformation in the absence of photon energy. The lack of decay in the SO + TiO
2 trace after dark equilibration shows that adsorption alone is insufficient to deplete SO from the solution under these conditions (pH near neutral and TiO
2 P25). This is consistent with the point of zero charge (PZC) of P25 around pH 6–6.5 [
14,
15]. At pH 6, the surface charge is minimal, so the electrostatic attraction of a cationic dye, such as SO, is limited. Taken together, the controls validate that the rapid removal observed in the full experiments (UV + TiO
2) arises from semiconductor photocatalysis rather than photolysis or sorption artifacts.
Under 365 nm irradiation in the presence of TiO
2, a significant decrease in SO concentration was observed, with complete degradation achieved within 90 min. This process is driven by the photocatalytic activation of TiO
2, which has a mixed-phase composition of anatase (Eg ≈ 3.2 eV) and rutile (Eg ≈ 3.0 eV) [
16,
17]. This composition enables the absorption of UVA photons. Upon excitation, electron-hole pairs are generated. The photogenerated holes (h
+) in the valence band oxidize surface-adsorbed water or hydroxide ions to produce
•OH radicals. Conduction-band electrons (e
−) reduce dissolved oxygen to O
2•−, which can yield additional
•OH and H
2O
2. These reactive oxygen species, together with direct hole oxidation, nonselectively attack the conjugated structure of SO. This process initiates sequential deethylation, chromophore cleavage, and eventual mineralization to CO
2 and inorganic ions. This widely recognized mechanism requires the simultaneous presence of TiO
2, UV light, and dissolved oxygen, which explains the negligible SO removal observed in the photolysis and adsorption controls.
Figure 1b illustrates the changes in the UV–Vis spectrum of SO (10 mg/L) before and during the photocatalytic treatment process. The treatment was performed at 25 °C and pH 6, using 0.4 g/L of TiO
2. The initial SO spectrum exhibits two absorption bands: one in the visible region at 519 nm corresponding to the chromophoric group and one in the UV region at 275 nm associated with aromatic ring structures. The progressive decrease in absorbance at 519 nm indicates a steady loss of the dye chromophore during treatment. Within the first 15 min, the intensity of this band decreased by nearly 40%, suggesting rapid chromophore disruption. After 90 min, the peak had nearly disappeared, confirming complete decolorization. This trend reflects the cleavage of the conjugated phenazinium chromophore, which is the primary cause of the intense color of SO. In addition to the changes in the visible region, significant alterations are evident in the UV portion of the spectrum. Initially, well-defined absorption shoulders gradually diminish and broaden with irradiation time, indicating the formation of intermediate species with less organized electronic structures. The disappearance of sharp spectral features is typically associated with aromatic ring fragmentation and extended conjugation cleavage. These processes are initiated by hydroxyl radicals and other ROS generated at the photocatalyst surface. First, these highly oxidative species remove the ethyl substituents from the amino groups (deethylation). Then, they cleave the conjugated phenazinium skeleton. Finally, the intermediates oxidize into carboxylic acids, CO
2, and inorganic ions. The sequential loss of absorbance intensity across the visible and UV regions highlights the photocatalytic process’s efficiency. The continuous flattening of the baseline indicates that degradation occurs through actual molecular transformation rather than merely surface removal. Spectral evidence indicates that photocatalytic treatment effectively degrades the chromophoric structure of SO and promotes mineralization. The progressive attenuation of the visible absorption band, combined with the collapse of the UV features, illustrates the mechanistic pathway by which radical attack disrupts conjugation, fragments aromatic intermediates, and ultimately converts the dye into non-absorbing end products.
2.2. Impact of SO and TiO2 Concentration
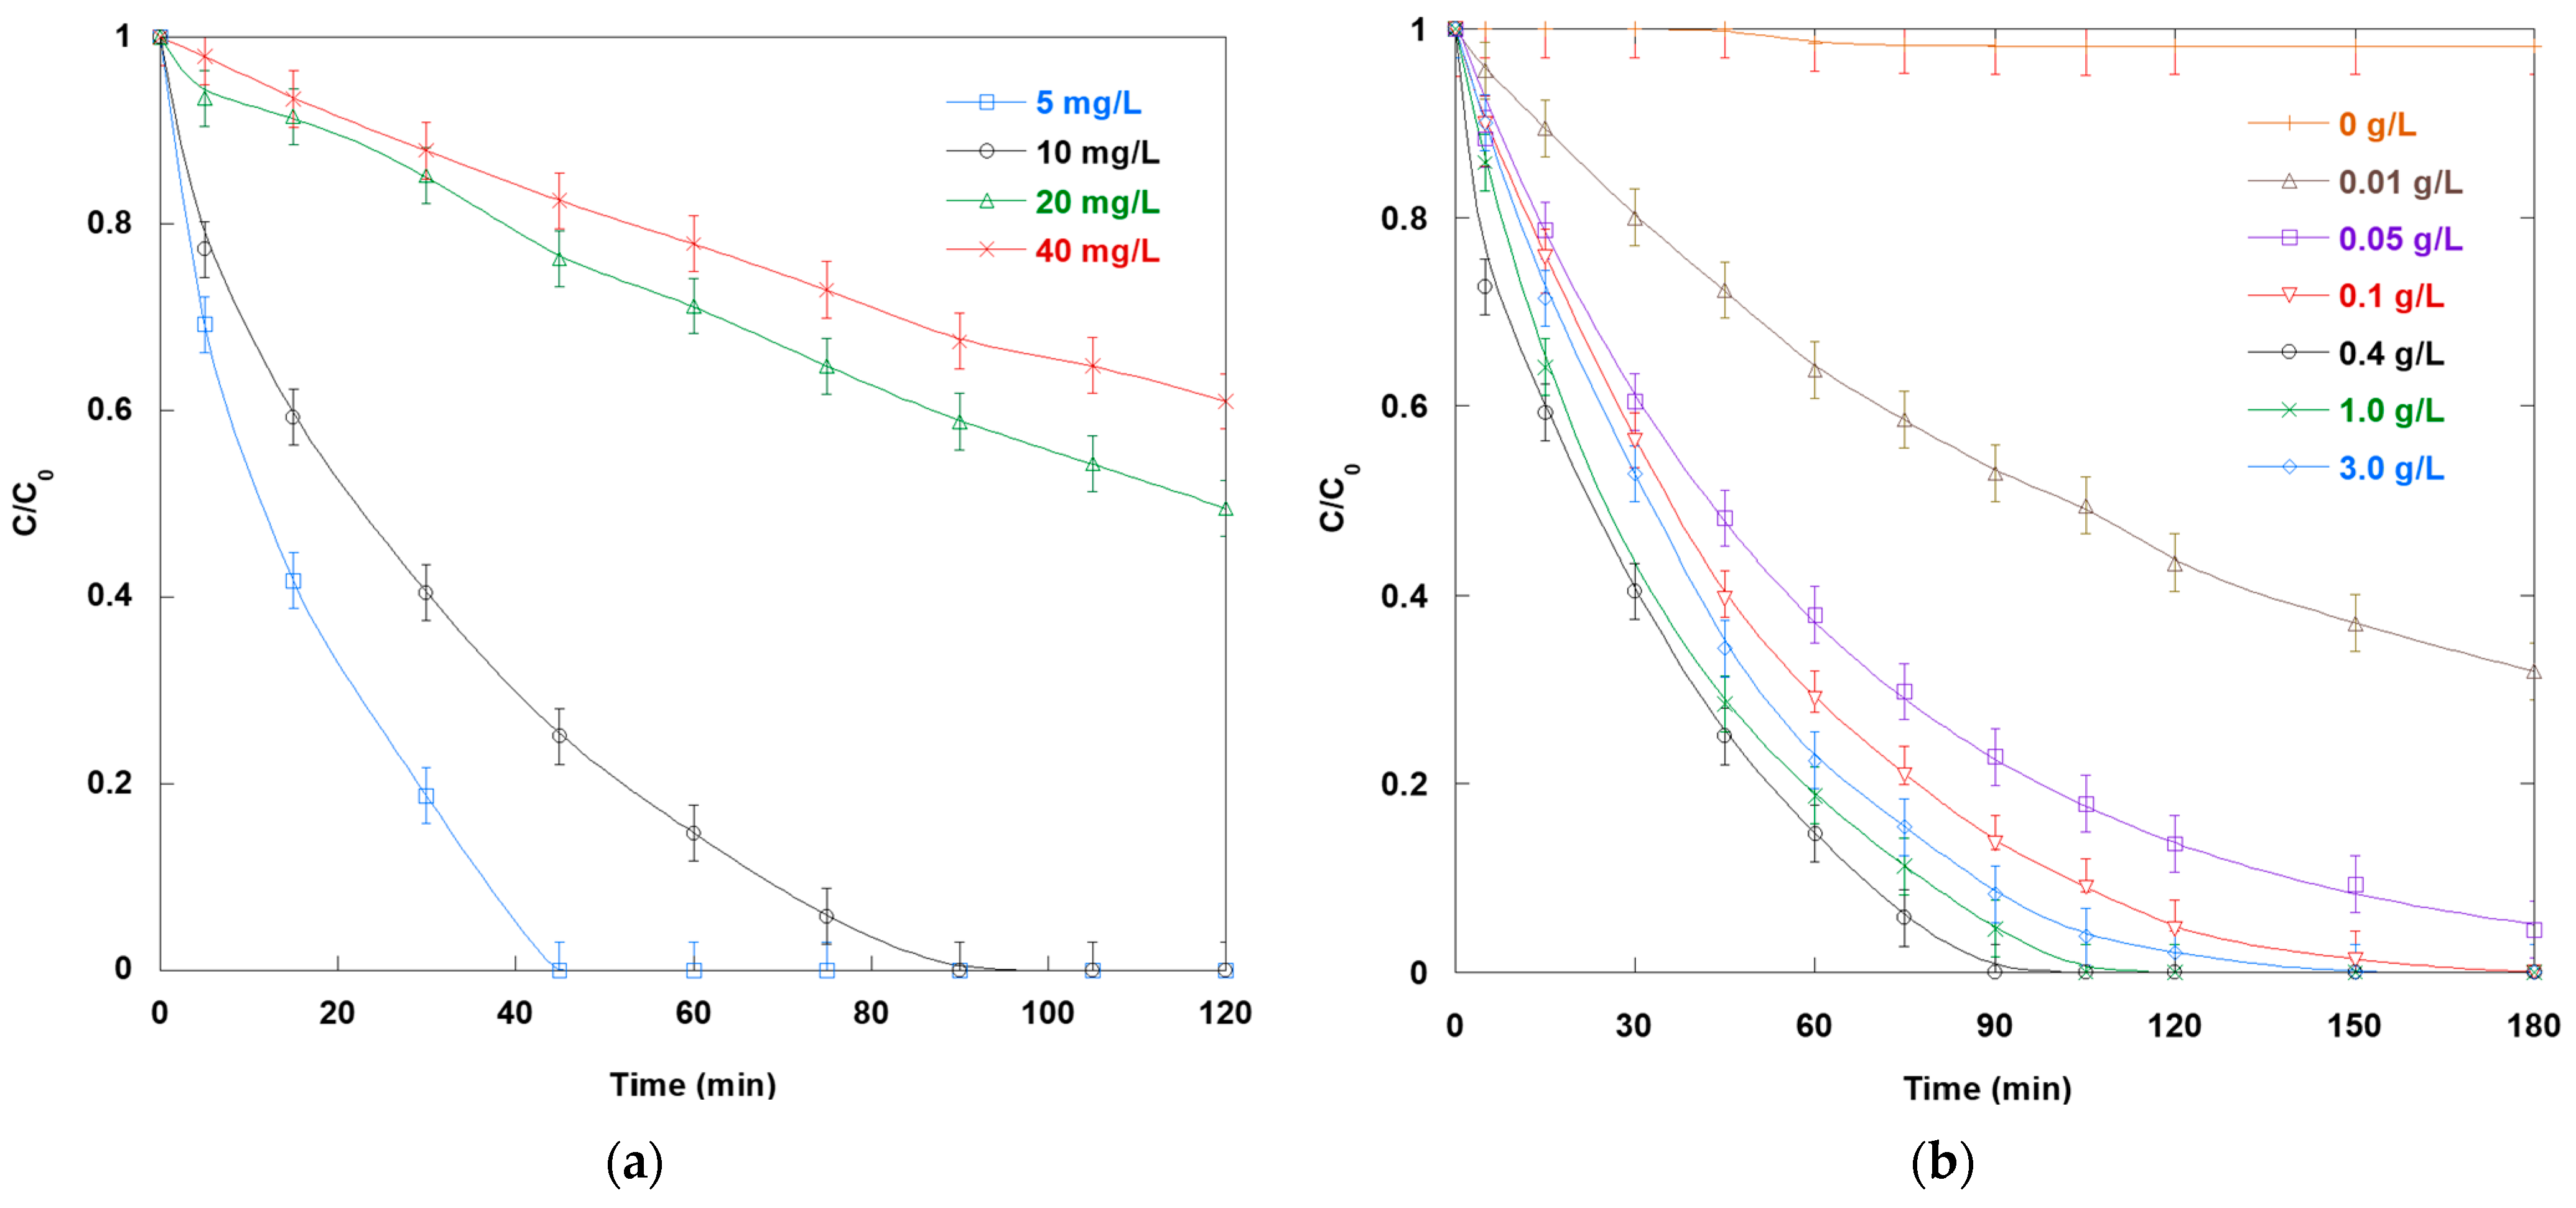
Figure 2a illustrates the impact of SO concentration on its photocatalytic degradation. The SO degradation profiles clearly demonstrate dependence on the initial concentration. The steepest decline in SO concentration occurs at the lowest initial concentration (5 mg/L), indicating high degradation efficiency and rapid kinetics. However, as the initial concentration increases to 20 and 40 mg/L, the degradation curves progressively flatten. This indicates slower rates and lower removal extents within the same timeframe. This occurs because dye molecules sparsely populate the TiO
2 surface at low SO concentrations, enabling each molecule to easily access photogenerated reactive species without significant competition. In contrast, at higher SO concentrations, more dye molecules compete for adsorption onto the photocatalyst surface’s limited active sites. This diminishes the interaction between the pollutant molecules and the reactive oxidants. Additionally, the solution becomes more intensely colored, which impairs light penetration and reduces the amount of photon flux that reaches the TiO
2 surface. This is an example of the inner filter effect. Ultimately, these processes reduce the generation of reactive species, such as
•OH radicals, and their interaction with target molecules. These findings emphasize that limitations imposed by high pollutant concentrations cannot be offset without parallel adjustments in catalyst dose or light intensity.
Figure 2b shows how TiO
2 loading affects SO degradation through photocatalysis. The degradation curves for various TiO
2 loadings exhibit a typical bell-shaped pattern: minimal SO removal in the absence of a catalyst, rapidly increasing degradation rates up to an optimal dosage, and declining efficiency at higher dosages. At 0.01 g/L, the removal of SO is slow due to the insufficient number of active sites required to generate sufficient
•OH and O
2•− radicals. As the TiO
2 concentration increases to 0.4 g/L, the decline in normalized concentration steepens, and complete decolorization is achieved in 90 min. However, adding more TiO
2 beyond the optimal dosage (i.e., 1.0 and 3.0 g/L) slows degradation, extending the time needed for complete SO elimination to over 120 min. The downturn in photocatalytic efficiency at high TiO
2 loadings primarily stems from light shielding and scattering by dense particle suspensions. Additionally, elevated dosages promote cluster formation through van der Waals forces and Brownian collisions. This reduces the available surface area for SO adsorption and water/hydroxide oxidation. TiO
2 loadings beyond the optimal amount induce agglomeration, which hinders the mass transfer of dye molecules and dissolved oxygen to reactive sites.
The dye concentration decays exponentially over time at various initial SO concentrations and TiO
2 loadings. Thus, the influence of initial SO concentration and TiO
2 loading on photocatalytic degradation performance using a pseudo-first-order kinetics model was quantitatively assessed. For each experimental condition, the apparent rate constant (k) was obtained from the slope of the linear regression of ln(C
0/C) versus irradiation time. This approach allows for direct comparisons of degradation kinetics across different pollutant loads and catalyst dosages. It provides insight into the interplay between light absorption, active site availability, and mass-transfer limitations. High correlation coefficients (R
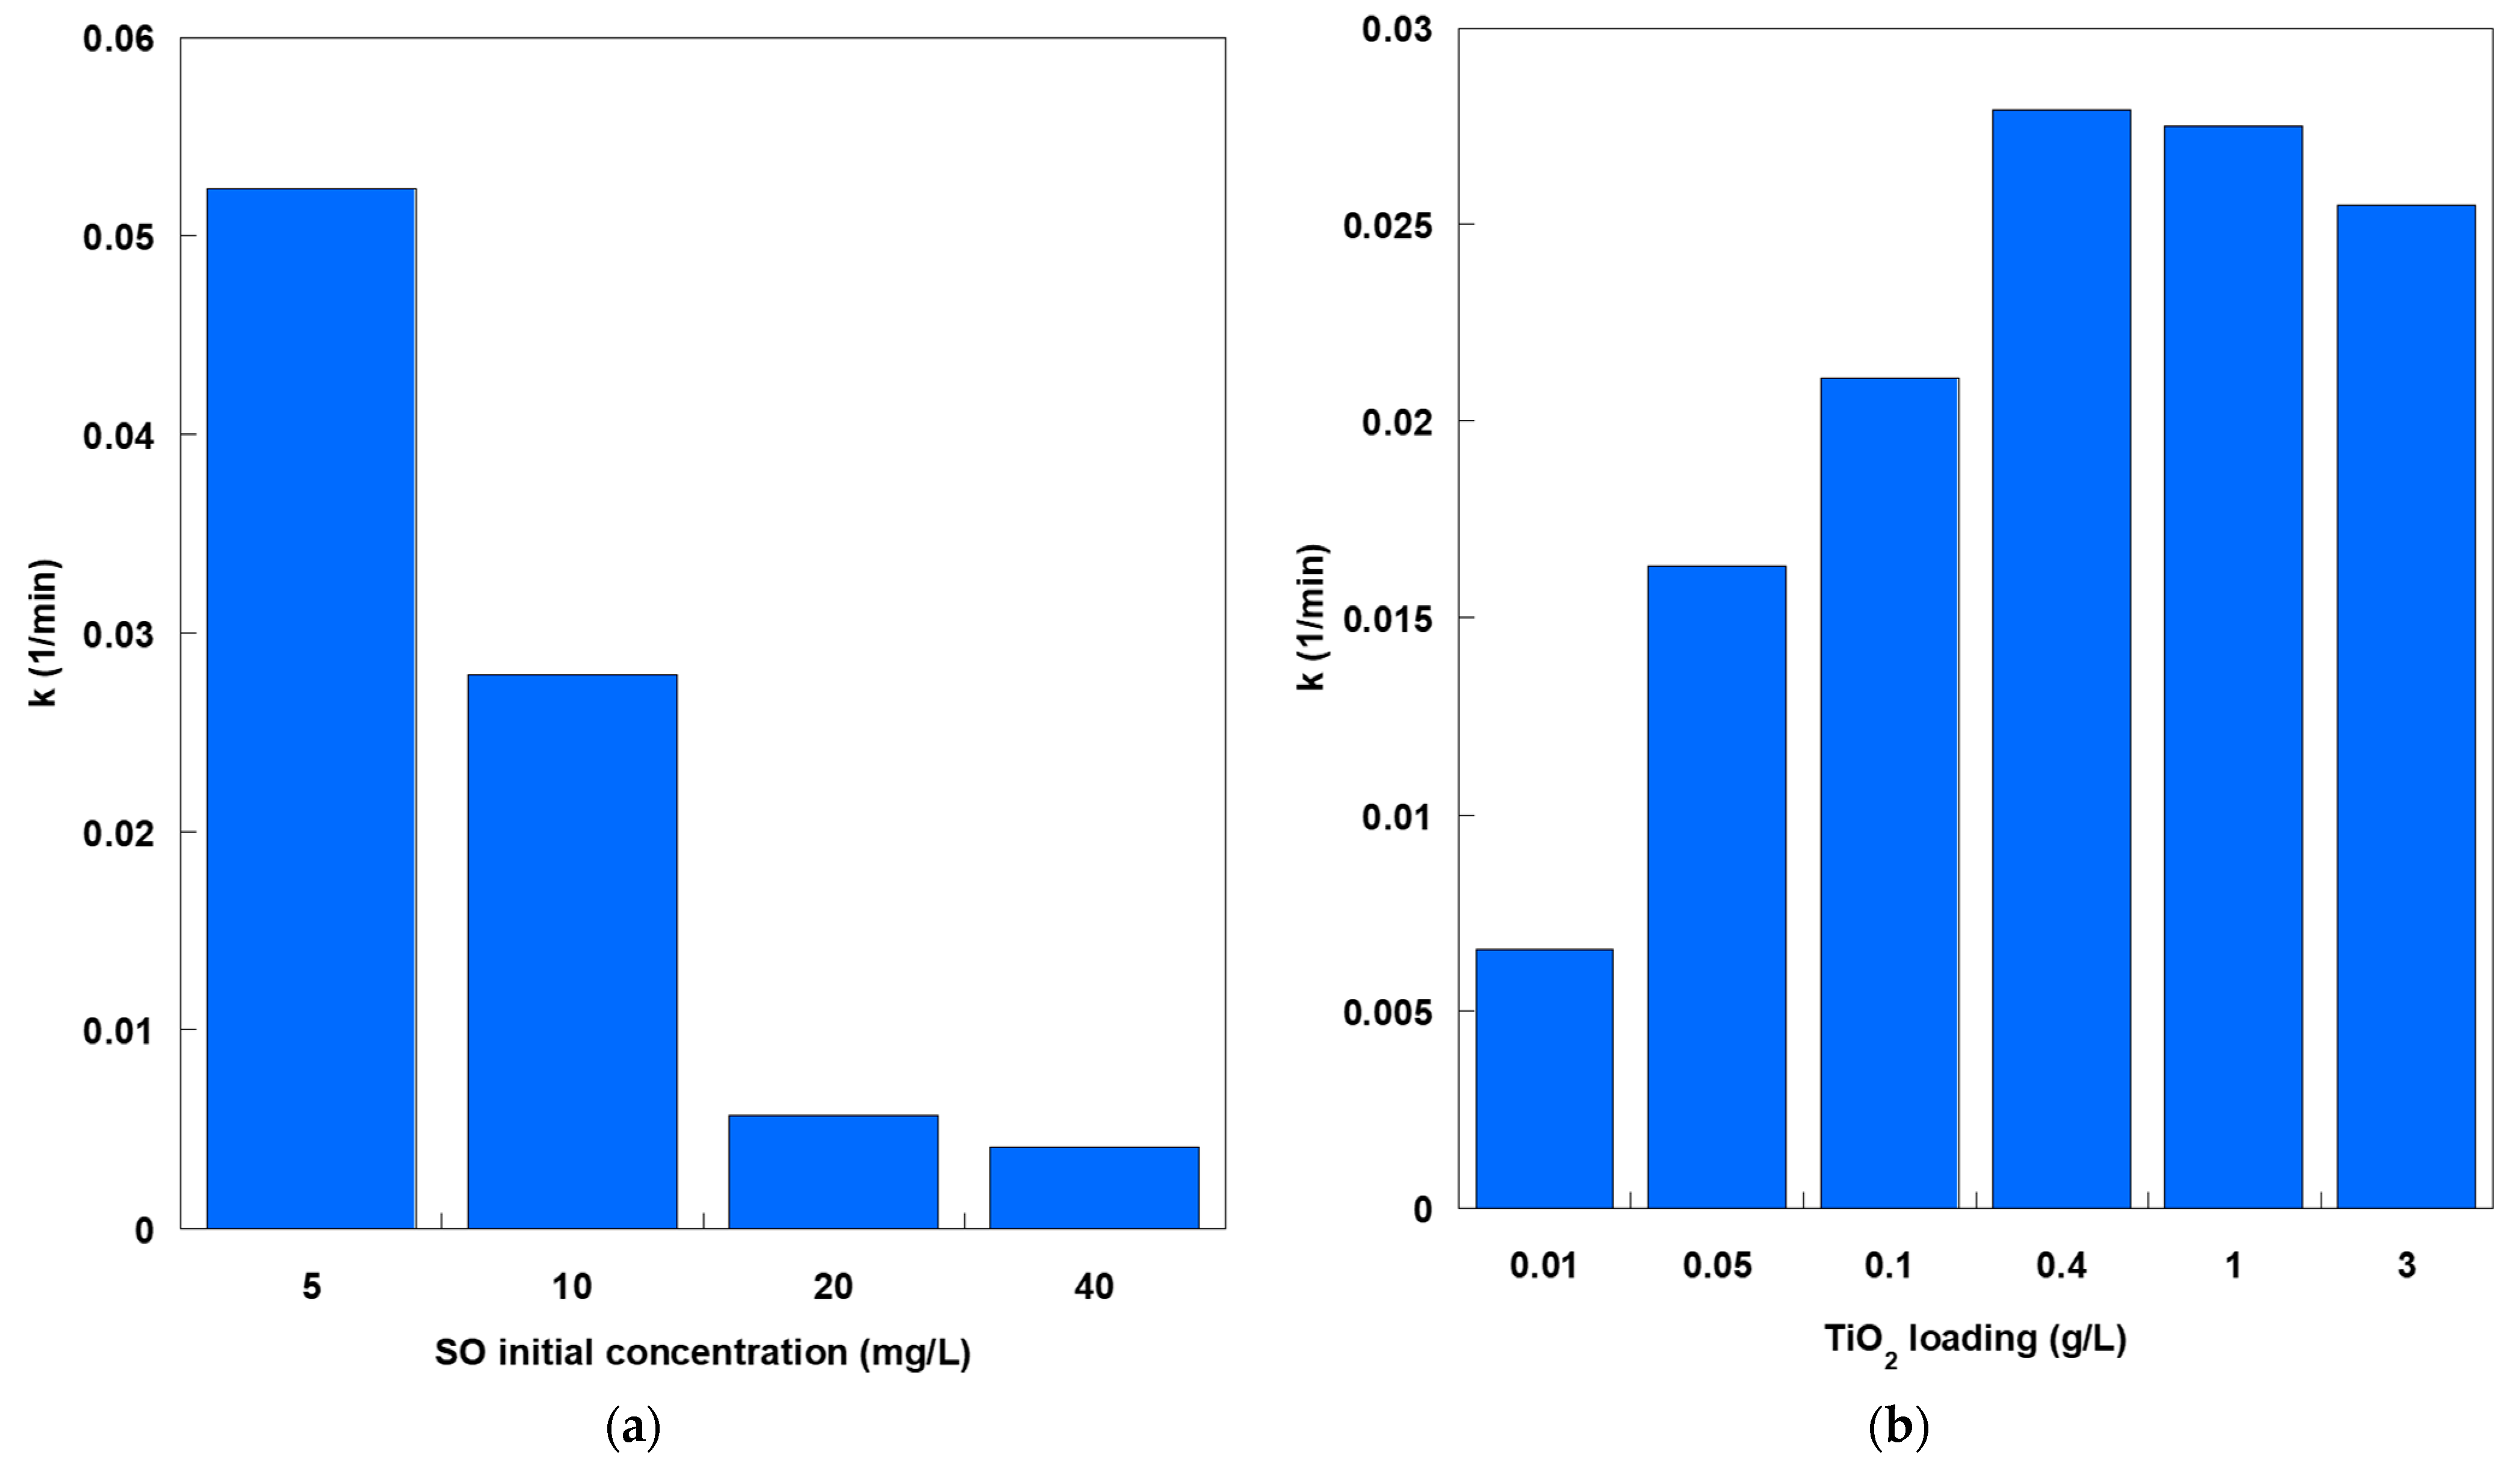
2 > 0.99) for all fits confirm the model’s suitability under the tested conditions. The resulting k values, presented in
Figure 3a,b, serve as robust metrics for evaluating the influence of increasing SO concentration on photon utilization efficiency and the effect of TiO
2 loading on balancing enhanced active site density with potential light-screening effects.
At a constant TiO
2 loading, k decreased markedly with increasing initial SO concentration (
Figure 3a). The highest rate constant (approximately 0.053 min
−1) was obtained at an SO concentration of 5 mg/L. Increases in SO concentration beyond 5 mg/L reduced k to 0.028, 0.006, and 0.004 min
−1 at concentrations of 10, 20, and 40 mg/L, respectively. This inverse relationship reflects two effects. First, the increased optical density of the solution at higher dye concentrations limits photon penetration, reducing the fraction of the catalyst surface that is irradiated. Second, excess dye molecules competitively adsorb onto a finite number of active sites. This leads to partial site saturation and slower turnover per site. Furthermore, at higher SO concentrations, the relative abundance of ROS per dye molecule decreases, further lowering the apparent degradation rate. In contrast, varying the TiO
2 loading at a fixed SO concentration produced a different trend (
Figure 3b). Increasing the catalyst dosage from 0.01 to 0.4 g/L increased k from approximately 0.007 to 0.028 min
−1 due to an increased number of available active sites and a higher probability of photon absorption events. However, increasing the dosage to 1 and 3 g/L decreased k to 0.027 and 0.025 min
−1, respectively. This decrease at high loadings is consistent with light screening and scattering effects. Excessive particle concentration reduces the effective penetration of UVA light into the suspension and increases inter-particle shielding. This reduces the fraction of the catalyst surface that is actively participating in the reaction.
To summarize, these results underscore the importance of optimizing contaminant concentration and catalyst loading to maximize photocatalytic efficiency. The observed trends highlight the importance of maximizing reaction rates by balancing light harvesting and active site accessibility. It is also crucial to minimize limitations resulting from mass transfer and light screening.
2.3. Impact of Solution Temperature and pH
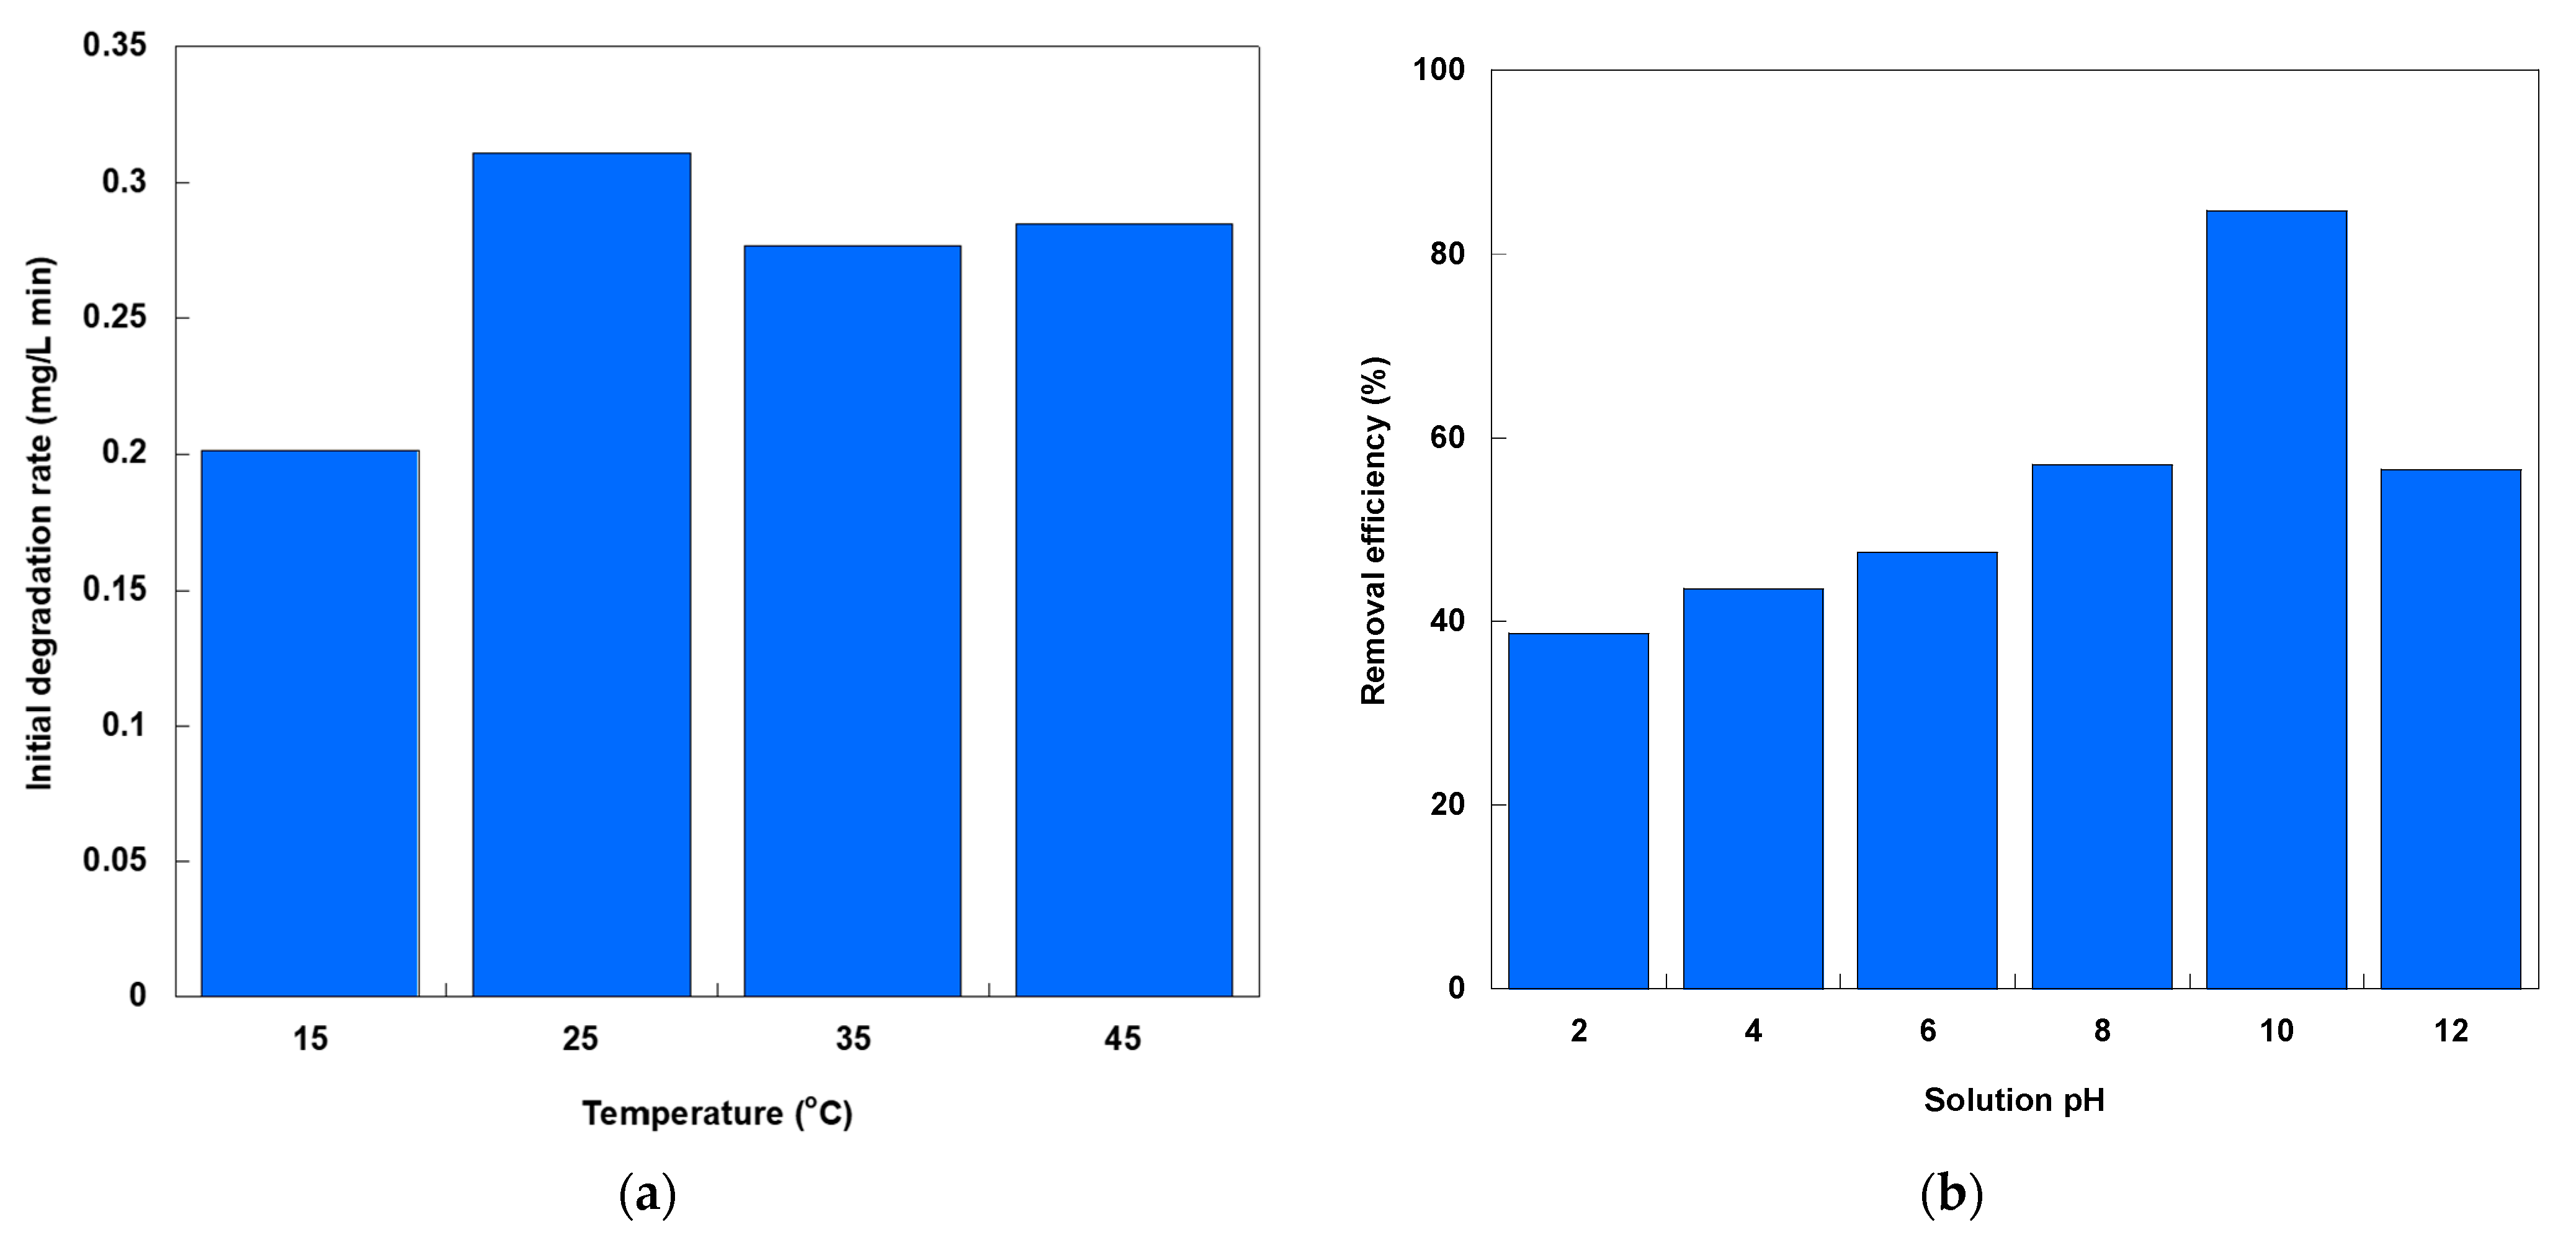
Figure 4a illustrates the change in the SO initial degradation rate via photocatalysis with solution temperature. The rate exhibits a non-monotonic trend, peaking at 25 °C, dipping at 35 °C, and rising slightly again at 45 °C. This behavior reflects the competing influences of thermal activation and charge-carrier dynamics. As the temperature increases from 15 to 25 °C, the kinetic energy of the SO molecules and reactive species increases. This accelerates the adsorption-desorption equilibria and interfacial electron-transfer rates. Beyond 25 °C, the slight decline at 35 °C indicates that increased thermal energy favors electron-hole recombination over productive radical generation. The slight rebound in the initial degradation rate at 45 °C suggests a secondary thermal activation regime, wherein increased molecular collisions and diffusion overcome recombination losses [
18,
19]. This rebound effect may be due to enhanced mass transfer and desorption of intermediates, which can restore radical-mediated oxidation rates [
20]. However, these rates never exceed those achieved at 25 °C. Taken together, the temperature dependence of SO degradation underscores the importance of maintaining reactors at an optimal thermal setpoint (i.e., 25 °C). Operating above this optimum risks increased recombination, while cooler conditions slow radical generation and mass transfer.
Figure 4b shows the change in SO photocatalytic removal efficiency over 20 min of treatment, depending on the initial solution pH. The results demonstrate a clear dependence on the initial solution pH. Efficiency increases from approximately 38.7% at pH 2 to nearly 84.7% at pH 10. However, it then declines to around 56.7% at pH 12. This highlights that the photocatalytic system operates optimally within a narrow pH range. Beyond this range, competing processes begin to degrade performance. This pH sensitivity stems from the interplay between the TiO
2 surface charge and the speciation of SO. The PZC of TiO
2 P25 is around pH 6–6.5 [
14,
15]. This means that at pH < PZC, the catalyst surface bears a net positive charge. This repels cationic SO and hinders adsorption. Above the PZC, the surface switches to a negative charge. This charge attracts SO ions electrostatically, increasing their concentration at the interface. This increased concentration is a prerequisite for efficient photocatalysis. Beyond adsorption, the increased availability of OH
− ions at elevated pH levels enhances the production of
•OH, the primary oxidative species in TiO
2-UV systems. Surface-bound OH
− are oxidized by photogenerated h
+ to yield
•OH. Meanwhile, bulk OH
− can scavenge conduction-band electrons, reducing e
−/h
+ recombination and boosting radical yield. However, at pH 12, excessively high OH
− concentrations initiate radical scavenging and secondary equilibria that undermine performance. Excess OH
− can react with
•OH to form less reactive species, such as atomic oxygen radical anion (O
•−) and hydroperoxyl radical anion (HO
2•−) [
21]. Additionally, elevated ionic strength and surface crowding can impede photon penetration and active-site accessibility. These effects lower the net oxidative flux, which explains the drop in SO removal at pH 12 despite continued strong dye adsorption. Radical quenching and mass-transfer limitations like these have been documented in multiple TiO
2 systems when the pH level exceeds the optimal range [
21,
22].
2.4. Impact of Dissolved Gases
Figure 5 illustrates the kinetics of SO photocatalytic degradation at various gas saturations. The kinetic profiles reveal a clear hierarchy of photocatalytic efficiency. Air-saturated suspensions are the most efficient, followed by non-saturated suspensions, and then N
2- and Ar-saturated systems. Air saturation accelerates SO removal, reducing the normalized concentration to zero within 60 min. Under the same conditions, N
2 saturation yields a normalized concentration of about 0.56, while Ar saturation lags behind with a normalized concentration of approximately 0.77. The non-saturation curve lies between the air and N
2 curves, reflecting ambient O
2 levels. This ordering underscores the pivotal role of dissolved gases, particularly O
2, in governing radical formation and overall photocatalytic rates. Molecular oxygen is the primary electron acceptor in TiO
2 photocatalysis because it captures conduction-band electrons to form O
2•− radicals. These O
2•− species can undergo further reactions, either via protonation to HO
2•− radicals or dismutation to H
2O
2, with each step ultimately yielding
•OH radicals [
23,
24]. Air saturation maximizes the concentration of dissolved oxygen, ensuring efficient e
−/h
+ separation and prolific
•OH generation. Conversely, in oxygen-limited environments, e
−−h
+ recombination increases, reducing radical flux and slowing degradation kinetics. Under N
2 saturation, most of the dissolved O
2 is removed. However, trace amounts of residual oxygen and water molecules can support limited production of O
2•− and
•OH via water oxidation by valence-band holes. This yields moderate SO removal, which is faster than in completely inert argon but slower than air-saturated rates. Due to its higher density, argon is more effective at displacing O
2 and reducing electron-acceptor availability to nearly zero. In this case, photocatalysis proceeds only through direct, hole-mediated oxidations of adsorbed SO and minimal self-sensitized pathways. Consequently, the decay of normalized concentration is the slowest. The no-saturation case, where the reactor is neither degassed nor aerated, reflects intermediate dissolved oxygen levels and rate constants. In practice, laboratory reactors that are not sealed against air permit ongoing O
2 diffusion from the headspace, sustaining moderate radical generation.
2.5. Impact of Natural Matrices
Figure 6 shows the kinetics of photocatalytic SO degradation in deionized water, mineral water, and seawater.
Table 1 shows the main characteristics of the water sources used in this study. Performance decreases as the water becomes more complex. Deionized water exhibits the fastest decay due to its lack of radical scavengers and competing adsorbates. In simple media, photoexcited TiO
2 efficiently transfers holes and electrons to water and oxygen, generating ROSs that attack the dye’s conjugated structure. However, the ionic matrix in mineral water slows the degradation process. After 60 min, 30.7% of the SO remains, despite the similarity in UV intensity and catalyst loading. In seawater, with its high salinity and ionic strength, over 47.4% of the SO remains under the same conditions. This ranking (i.e., deionized water > mineral water > seawater) illustrates how dissolved salts and ionic strength can reduce photocatalytic efficiency by altering radical formation, surface interactions, and light penetration.
The mineral water used in this study had a pH of 7.2 and a salinity of 561 mg/L. It was primarily composed of bicarbonate, calcium, and magnesium, with moderate levels of sulfate and chloride. Its near-neutral pH level is similar to the PZC of TiO
2 P25, resulting in a slightly negative surface charge that favors electrostatic attraction to cationic SO. The bicarbonate (HCO
3−, 265 mg/L) and sulfate (SO
42−, 68 mg/L) act as radical scavengers that compete with SO for
•OH radicals [
25]. HCO
3− quickly reacts with
•OH to form carbonate radicals (CO
3•−), which are longer-lived but far less oxidizing (E° = 1.6 V/SHE vs. 2.7–2.8 V/SHE for
•OH), thereby diverting oxidation away from SO and lowering the effective rate. This reduces the net oxidative flux at the TiO
2 interface. Similarly, SO
42− can convert to sulfate radicals (SO
4•−) under UV/TiO
2, but these species react more weakly with phenazine dyes than
•OH radicals. A sulfate concentration of 0.71 mM in mineral water does not significantly impact SO photocatalytic oxidation. Consequently, the presence of bicarbonate (4.34 mM) in mineral water diverts some reactive species away from SO, decelerating decolorization rates relative to deionized systems. This behavior was confirmed using this concentration in deionized water. Additionally, the presence of calcium and magnesium compresses the electrical double layer, promoting TiO
2 aggregation and reducing the effective surface area. Together, these effects explain the slower degradation kinetics observed in mineral water compared to deionized water.
The slowest kinetics in seawater follow from its high ionic strength and chloride (Cl−) load. Cl− in seawater exerts an even stronger inhibitory effect. At seawater levels (20 g/L), Cl− rapidly traps •OH to form chlorine radicals (Cl•) and dichloride radical anions (Cl2•−). These are less potent and more selective oxidants. Chloride-mediated radical pathways also regenerate Cl−, effectively cycling ROSs into nonproductive loops and lowering the steady-state concentration of •OH available for SO attack. Compared to deionized and mineral water systems, this results in a significant decrease in degradation efficiency, which highlights the critical role of Cl− in the photocatalytic performance of real water systems. The presence of divalent cations (Ca2+ and Mg2+) and the high ionic strength of seawater affect the surface charge and stability of TiO2 particles. Above the PZC (6–6.5), TiO2 becomes negatively charged and attracts cationic species. However, in high-salinity environments, Ca2+ and Mg2+ compress the electric double layer, screening surface charges and promoting TiO2 agglomeration. These agglomerates prematurely scatter and absorb UV light, reducing the accessible surface area and hindering the mass transfer of SO and dissolved O2 to photocatalytic sites.
The same experiments were repeated, this time with the initial pH of each natural matrix adjusted to either 5 or 7. A similar trend was observed in both cases, suggesting that pH is not responsible for these results. Therefore, it appears that the photocatalytic elimination of SO is affected by the presence of high concentrations of inorganic anions or natural organic matter in seawater. These anions compete with the dye for adsorption sites on the photocatalyst and trap free radicals, thereby reducing the degradation kinetics.
2.6. Impact of Scavengers
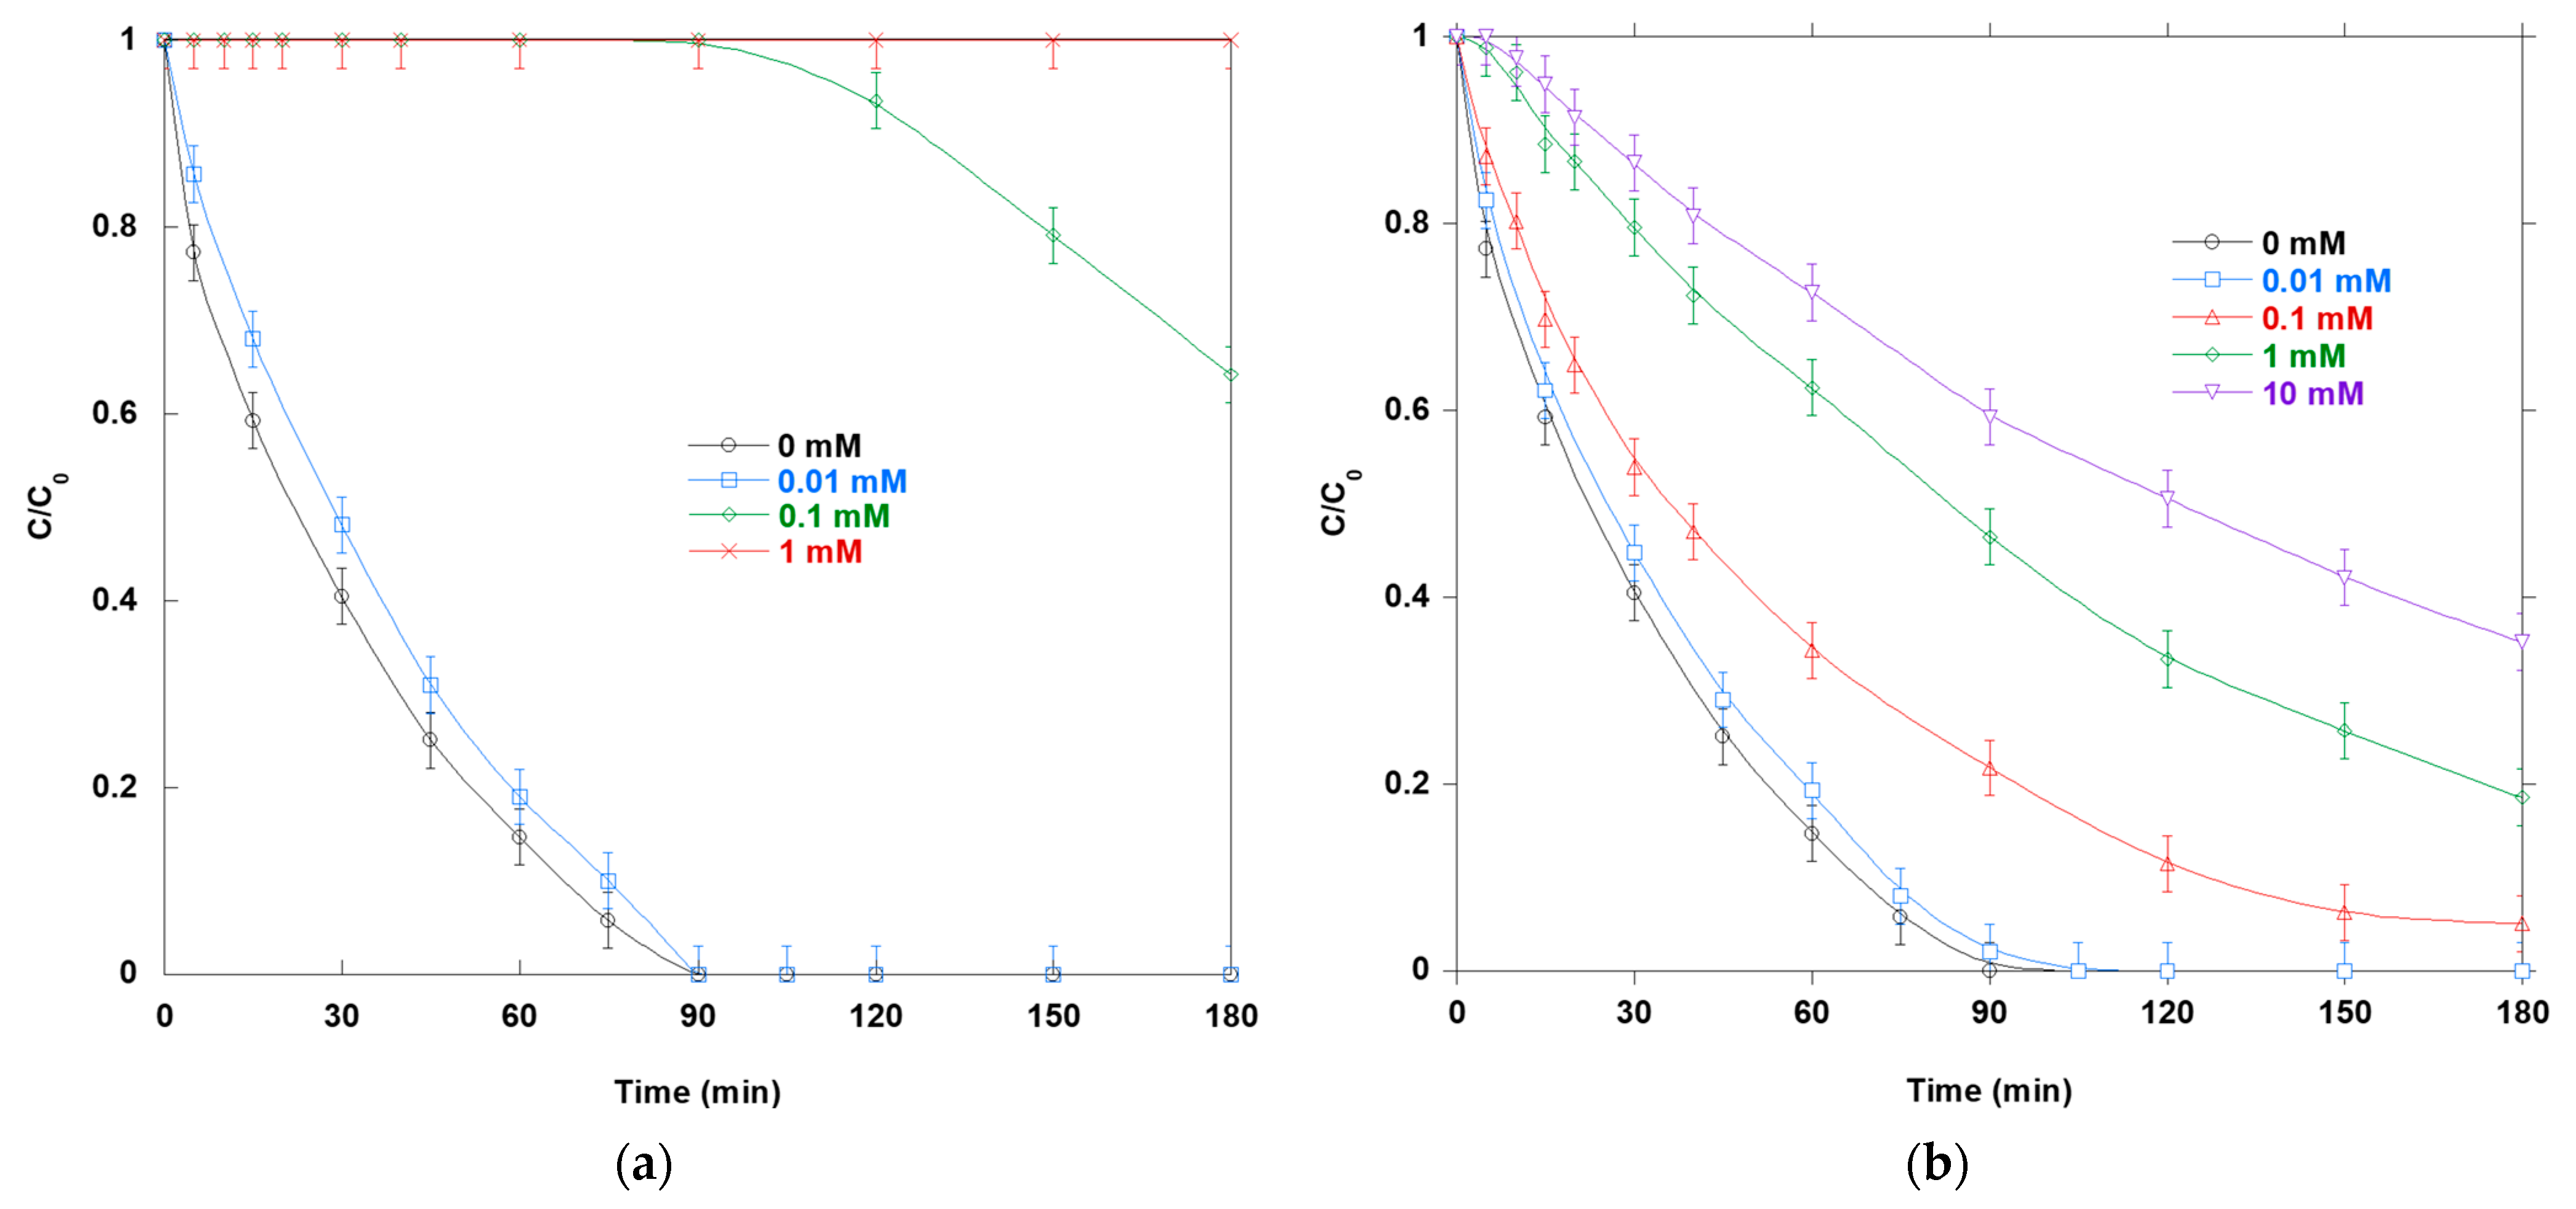
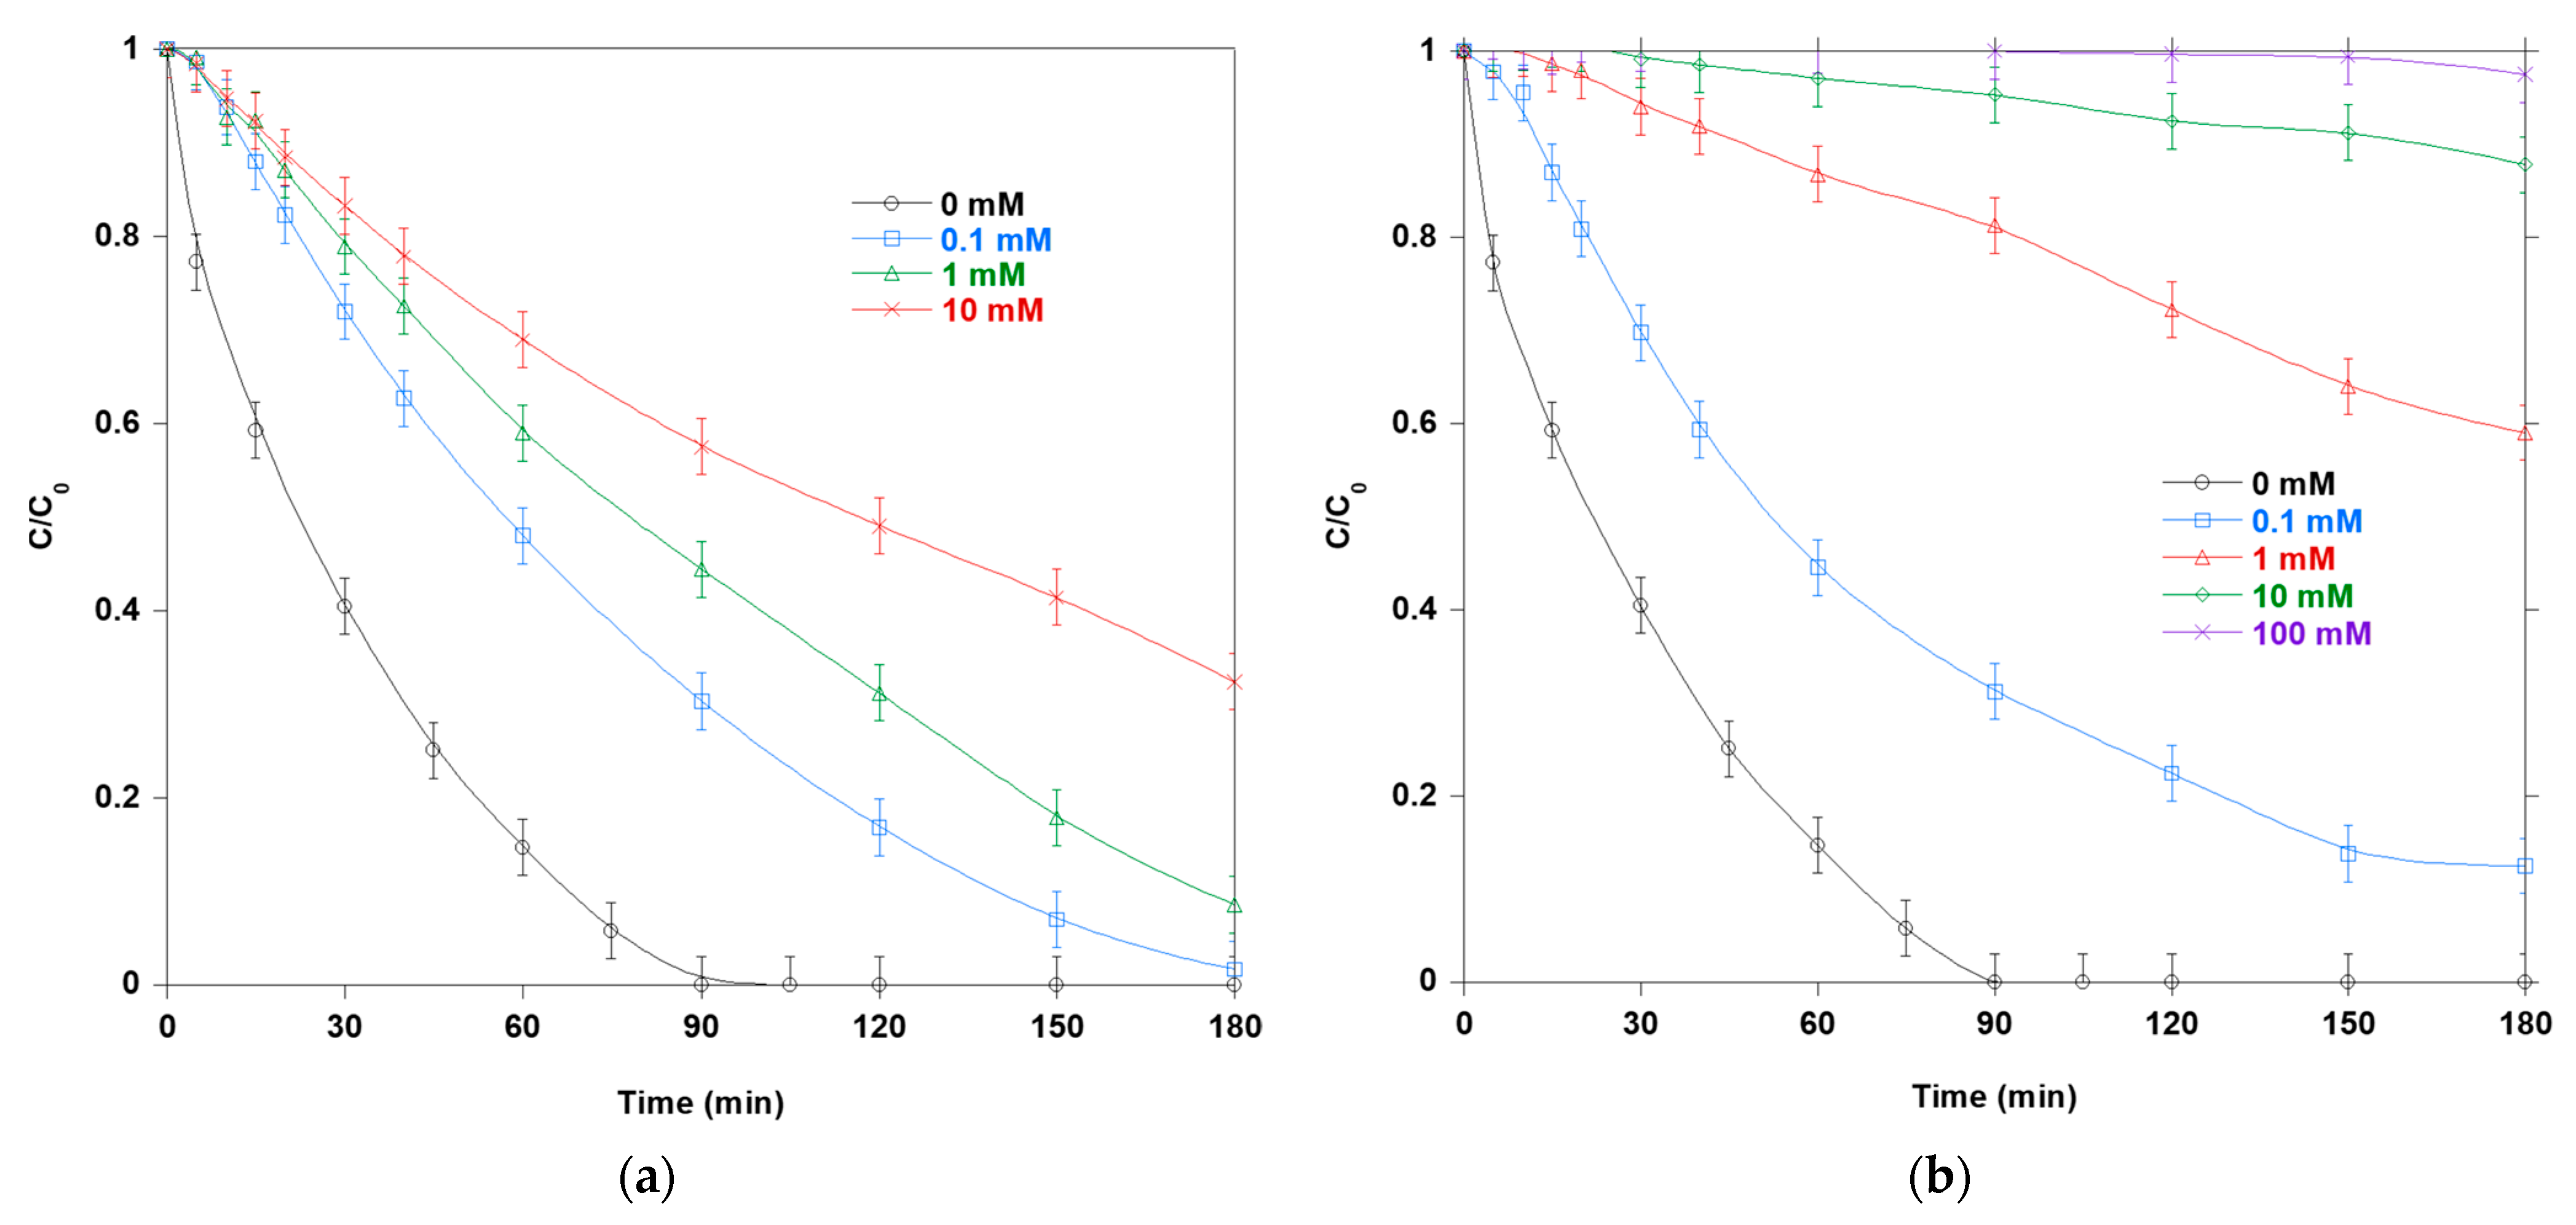
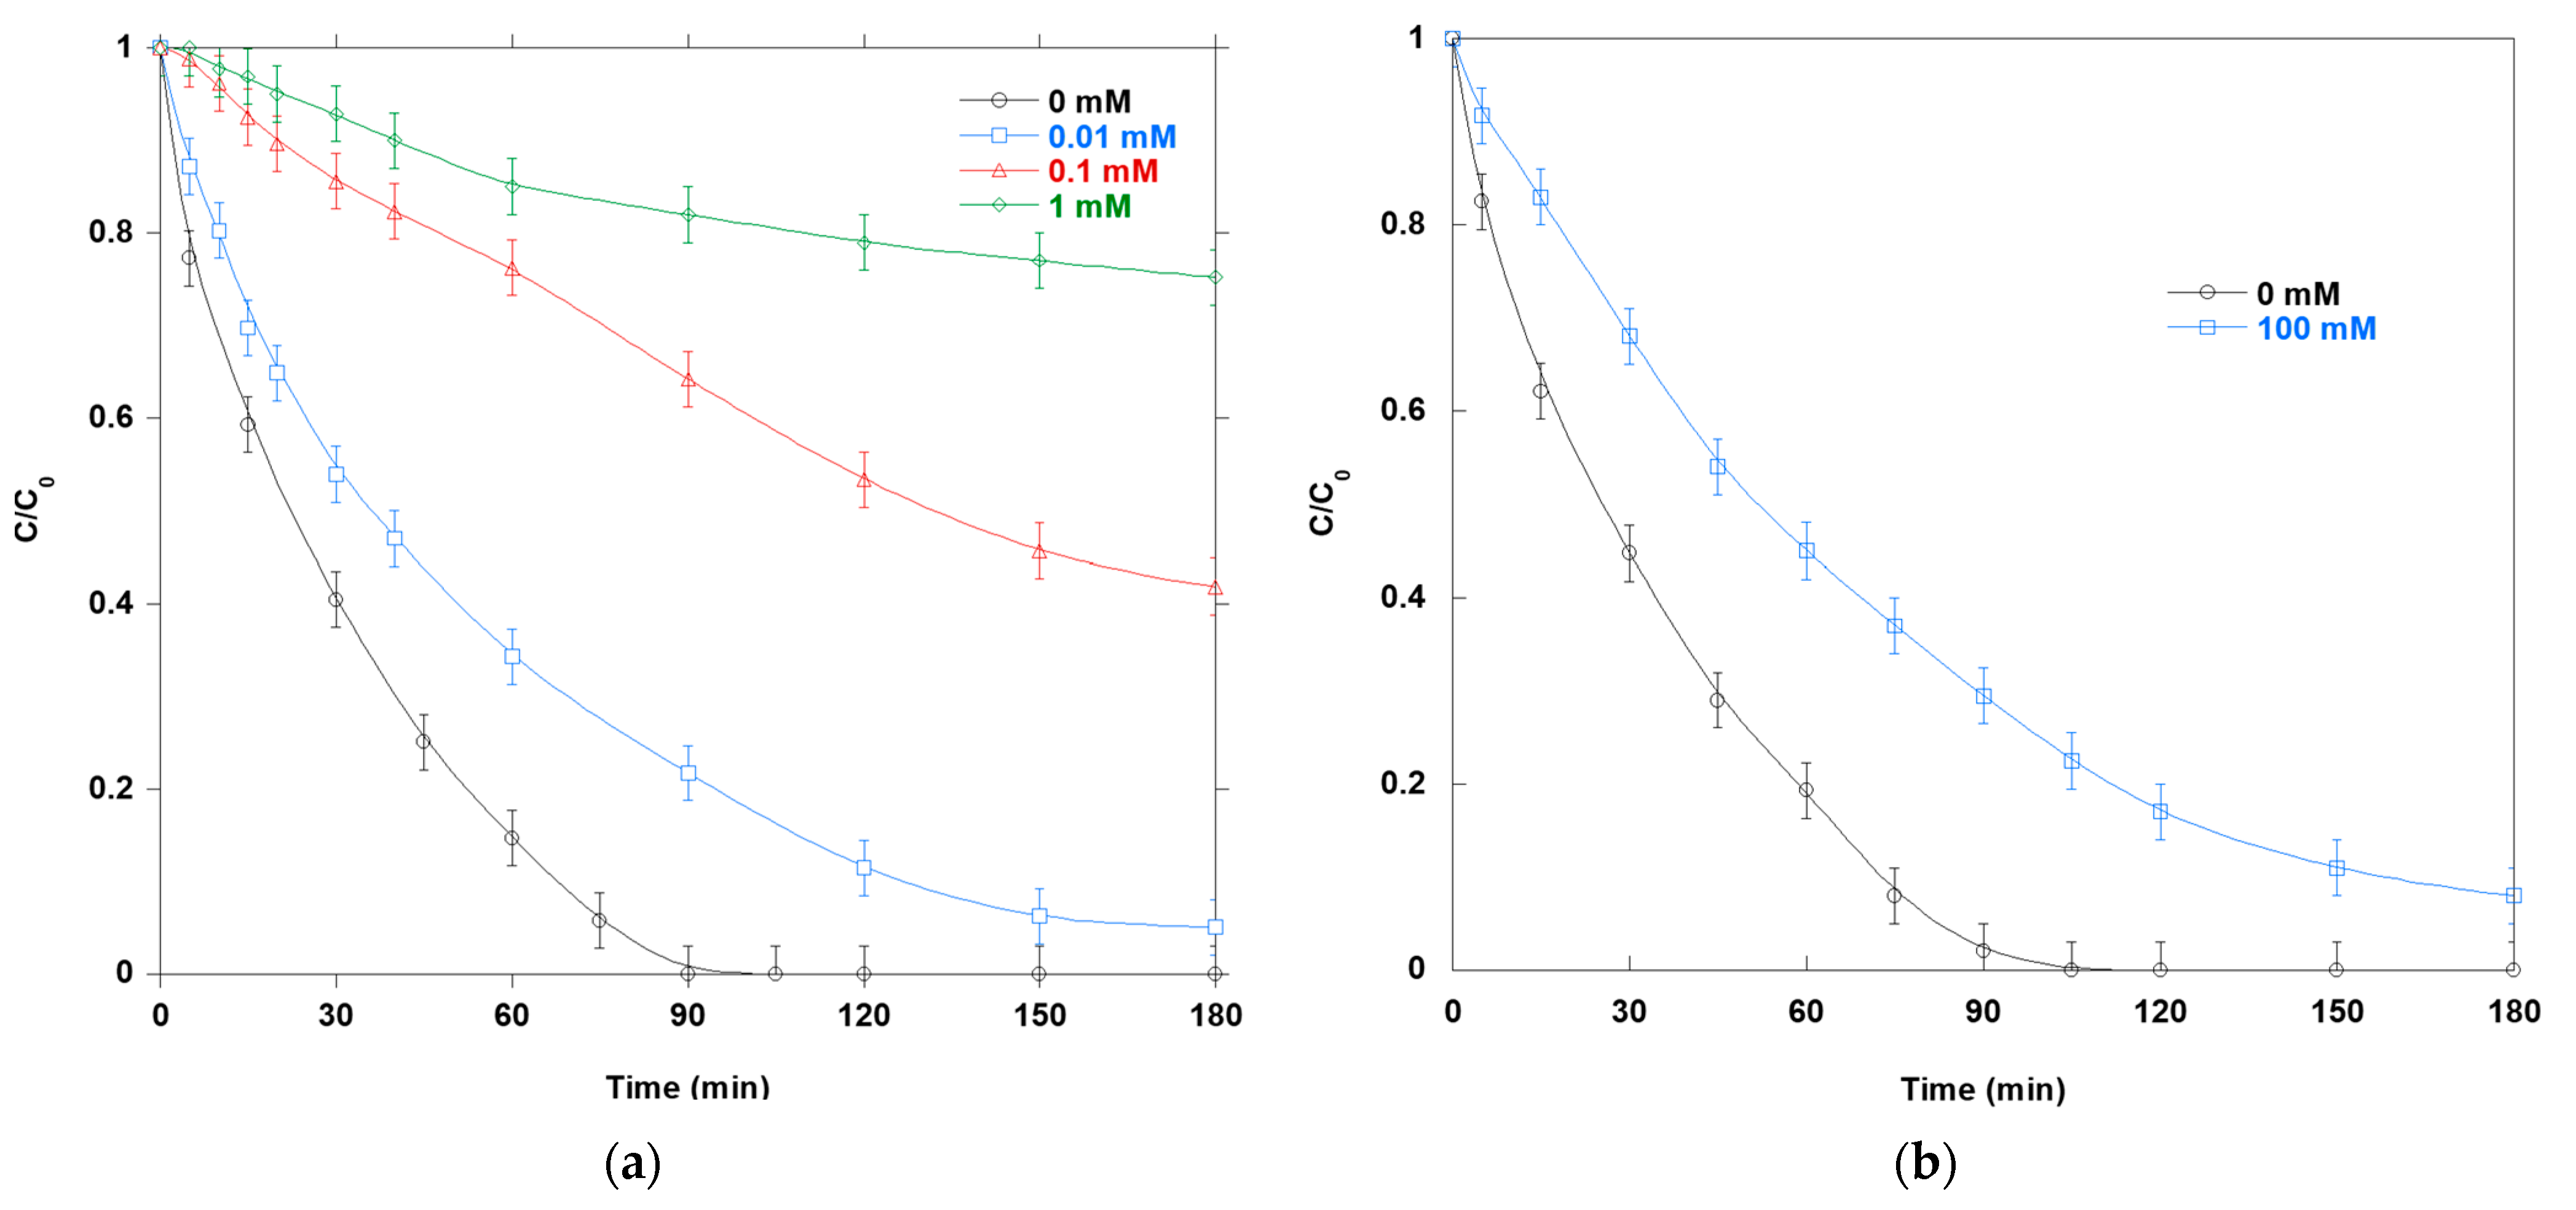
To identify the dominant oxidants in SO photocatalysis, we tested eight scavengers targeting specific pathways: ascorbic acid (AA), methanol (MeOH), sodium azide (NaN3), sodium nitrite (NaNO2), benzoquinone (BQ), sodium oxalate (OX), sucrose (SCR), and phenol (PH).
Figure 7a illustrates the impact of AA on the photocatalytic degradation of SO. Increases in AA progressively suppress SO degradation. A noticeable slowdown occurs at 0.01 mM, stronger inhibition occurs at 0.1 mM, and complete quenching occurs at 1 mM. In water, AA reacts with
•OH at near-diffusion-controlled rates (k ≈ 10
10 M
−1 s
−1 [
21]), efficiently outcompeting SO for radical attack. Furthermore, AA chemically quenches
1O
2 (k ≈ 10
7–10
8 M
−1 s
−1 [
26]) and reduces O
2•−/H
2O
2 (k ≈ 10
5 M
−1 s
−1 [
23]). Furthermore, AA can intercept valence-band holes at the surface (an extremely fast reaction). Thus, the steep concentration–response curve reflects the simultaneous inhibition of multiple oxidative pathways, with the
•OH pathway being the most strongly affected.
Figure 7b shows how adding MeOH impacts SO oxidation via photocatalysis. MeOH causes graded, concentration-dependent inhibition. Without MeOH, the solution fully decolorizes in 90 min. At 0.01 mM, the process slows slightly. At 0.1 mM, the initial rate decreases by ~44%, and complete decolorization occurs after 180 min. At 1 mM, the C/C
0 ratio is approximately 0.19 after 180 min. At 10 mM, degradation is the slowest and least complete. The C/C
0 ratio exceeds 0.36 after 180 min. This behavior is expected because MeOH rapidly scavenges
•OH radicals (9.7×10
8 M
−1 s
−1 [
21]) and traps holes, forming methyl hydroperoxide (
•CH
2OH) [
27]. This process diverts oxidative equivalents from O
2•−. At very low concentrations of MeOH, transient hole scavenging can extend electron lifetimes and temporarily increase O
2•−. However, beyond a certain threshold, radical quenching dominates.
Figure 8a illustrates the photocatalytic degradation of SO in the presence of sodium azide (NaN
3). N
3− causes incomplete, concentration-dependent inhibition across the tested range. Even at the highest dose, full quenching is not observed. N
3− efficiently deactivates
1O
2 (k ≈ 10
8–10
9 M
−1 s
−1 [
28]). Therefore, the modest level of inhibition suggests that
1O
2 is not the primary oxidant under these UV/TiO
2 system conditions. Additionally, N
3− reacts rapidly with
•OH (k ≈ 10
10 M
−1 s
−1 [
21]) to form N
3•, a weaker oxidant that causes slow residual decay. This explains why the curves never flatten completely. To summarize, while
1O
2 may be present, it contributes less than the
•OH/h
+ pathways to this system.
Figure 8b shows how adding NaNO
2 impacts SO photocatalysis. NO
2− produces strong, monotonic suppression. At concentrations of 10–100 mM, it can severely slow or nearly stop SO decay. Three factors contribute to this phenomenon: fast
•OH radical scavenging (
•OH + NO
2− → NO
2• + OH
−; k ≈ 10
10 M
−1 s
−1 [
21]), NO
2− consumption/oxidation at illuminated TiO
2, which often yields nitrate, and UV competition. Additionally, reactive nitrogen species form (e.g., NO
2•) that are less effective at destroying the dye than hydroxyl radicals. The steep dose–response curve indicates that hydroxyl radical-driven oxidation is the principal route.
Figure 9a illustrates the photocatalytic degradation of SO in the presence of BQ. BQ slows the removal of SO in a graded fashion: 0.01 mM > 0.1 mM > 1 mM. It competes with O
2 for photogenerated electrons and quickly reacts with O
2•− (k ≈ 0.9–1 × 10
9 M
−1 s
−1) to form semiquinone species [
29]. This curtails the formation of H
2O
2/
•OH from reduced oxygen species downstream. BQ can also react with
•OH (k ≈ 6.6 × 10
9 M
−1 s
−1 [
29]) and act as a redox mediator, and with conduction-band electrons (k ≈ 1.35 × 10
9 M
−1 s
−1 [
29]). Thus, at higher concentrations, BQ drains several channels simultaneously. Therefore, BQ inhibition confirms that the e
−/O
2•−-assisted steps are significant, though not exclusive [
29,
30]. In summary, e
−/O
2•− pathways increase oxidation (e.g., H
2O
2 →
•OH or other ROS). However, these pathways do not replace
•OH as the primary oxidant under UV/TiO
2 system conditions.
Figure 9b shows that adding 100 mM OX significantly reduces SO loss by consuming valence-band holes and forming oxalate-derived radicals. This indicates hole quenching. OX is a well-established sacrificial hole scavenger on TiO
2 because it adsorbs and reacts with valence-band holes, producing oxalate-derived radicals such as HC
2O
4• and C
2O
4•− [
31]. These radicals ultimately fragment into CO
2 and CO
2•− [
31]. By consuming h
+ at the surface, OX reduces
•OH formation from water/adsorbates and lengthens electron lifetimes. This slows oxidative dye degradation. However, OX does not eliminate activity entirely because CO
2•−, which is formed from OX oxidation, can reduce O
2 to O
2•− and promote H
2O
2 generation. This partially compensates for the loss of hole-initiated oxidation. This sacrificial-donor behavior can enhance reductive or dark-side reactions. However, for the oxidative destruction of SO chromophores, the net effect is usually inhibitory.
Figure 10a,b show how SCR and PH affect SO photocatalytic degradation. Both SCR and PH exhibit clear, dose-dependent inhibition at concentrations ranging from 0.01 to 1 mM. SCR, a representative carbohydrate, reacts with
•OH at ≈ 10
9 M
−1 s
−1 and reduces the amount available for SO attack. PH reacts with
•OH nearly at the diffusion limit (k ≈ 6–7 × 10
9 M
−1 s
−1 [
21]), effectively competing with SO for radical attack. This directly reduces the fraction of
•OH available to oxidize the dye. PH adsorbs onto TiO
2, competing with SO for surface sites and reducing the probability that photo-generated holes or reactive species will interact with the dye. However, neither compound completely stops degradation at the highest dose, which is consistent with the existence of a secondary, non-
•OH route (e.g., direct oxidation by valence-band holes or contributions from O
2•−).
The strongest and most consistent inhibition across eight probes comes from scavengers that quench
•OH (MeOH, SCR, PH, NO
2−, and AA) or intercept holes (OX and AA). Despite being an efficient
1O
2 quencher, N
3− only partially suppresses rates. BQ indicates the presence of e
−/O
2•−-mediated steps, though they are not dominant. Along with the concentration–response trends (e.g., near-total quenching by 1 mM AA and substantial yet incomplete inhibition at 10 mM MeOH), the data support a multi-oxidant regime. This regime is dominated by surface
•OH, which is generated via valence-band holes. O
2•−/H
2O
2 provides a measurable auxiliary route, while
1O
2 plays a minor role under these UV/TiO
2 system conditions.
Table 2 summarizes the impact of scavengers and mechanistic outcomes on SO photocatalytic degradation.
Synthesizing the above results, photocatalytic SO removal occurs in a multi-oxidant regime dominated by surface •OH generated from hole chemistry. e−/O2•− steps provide additional assistance, and 1O2 contributes minimally.
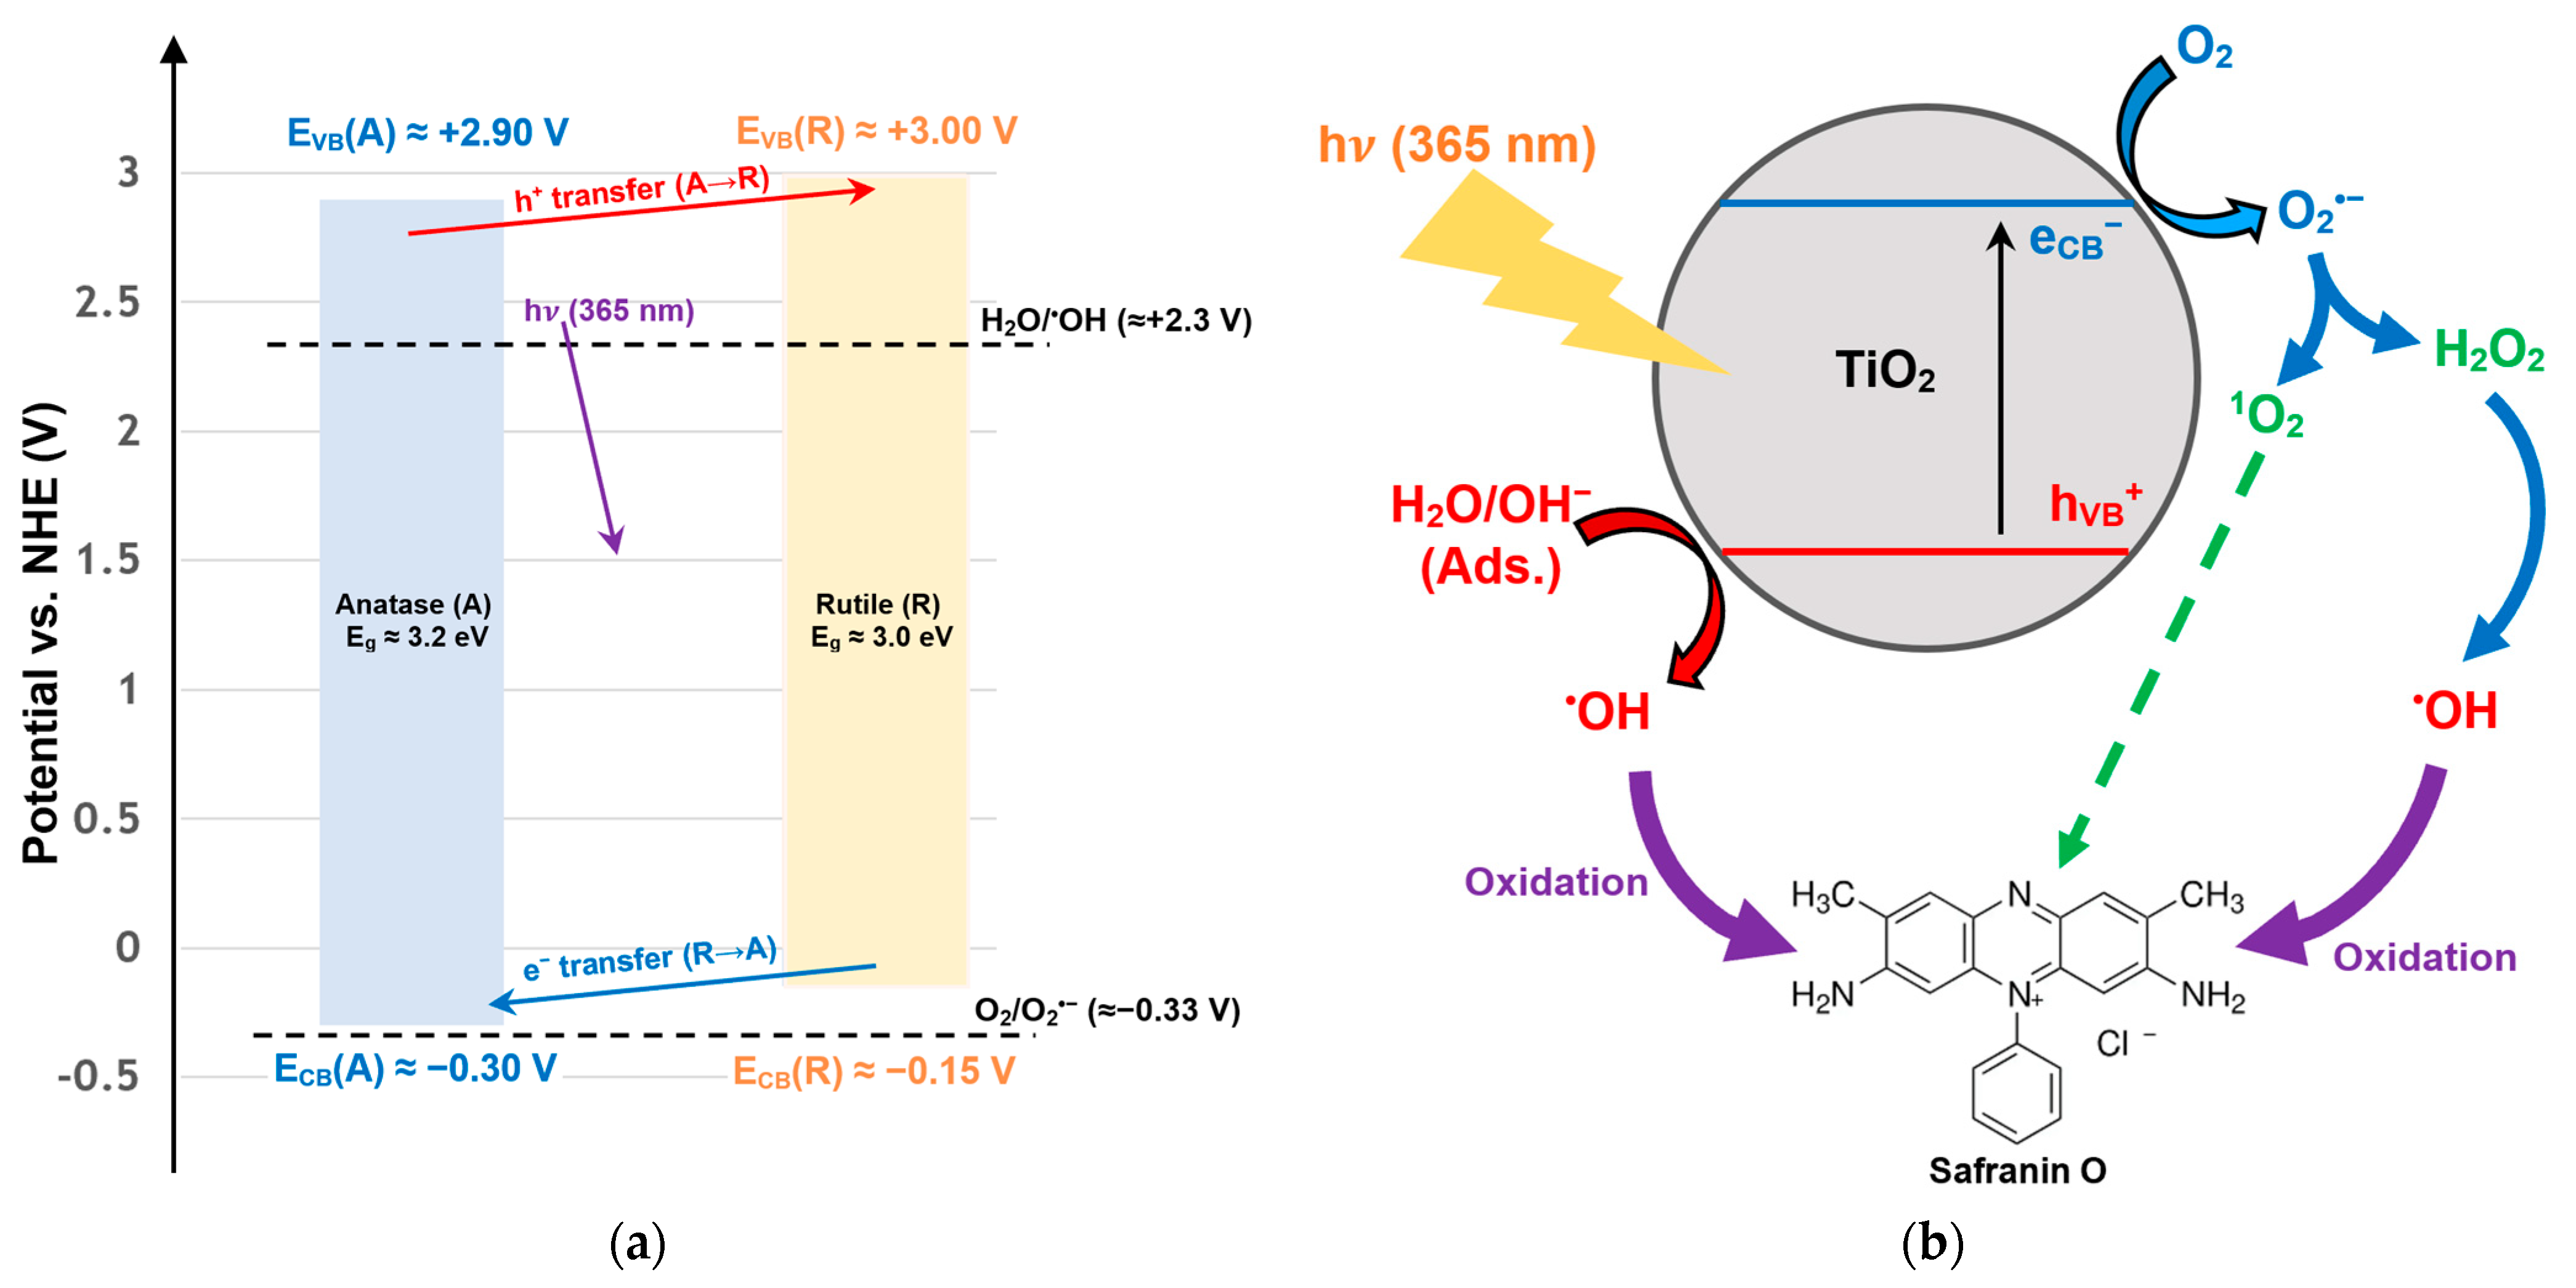
In order to better understand the results of the scavenger test, an examination of the energy band structure of TiO
2 P25 was conducted. The 80/20 anatase/rutile TiO
2 P25 composite promotes spatial charge separation when exposed to UVA light. During this process, electrons accumulate on the anatase side, while holes accumulate on the rutile side. This facilitates interfacial redox chemistry. At pH ≈ 7, the anatase band edges are estimated to be near the E
CB at −0.2 to −0.4 V and the E
VB at +2.7 to +3.1 V vs. NHE. These values shift by ~−59 mV/pH. Meanwhile, rutile is slightly less reducing at the CB and slightly more oxidizing at the VB. These energetics straddle the aqueous O
2/O
2•− couple (−0.33 V at pH 7) and the H
2O/
•OH (or OH
−/
•OH) boundary (+2.3 V at neutral pH). Consequently, photoexcited CB electrons can reduce O
2 to O
2•−, H
2O
2, or
•OH, and VB holes can oxidize adsorbed H
2O or OH
− to
•OH. These processes provide a mechanistic basis for the scavenger trends observed in this study (dominant
•OH with contributory O
2•−/H
2O
2). A schematic (
Figure 11) depicts the following four steps:
hν absorption and e−/h+ separation;
e− → O2 → O2•− → H2O2 → •OH;
h+ + H2O/OH− → •OH;
O2•− → 1O2 (an optional minor route).
This framework aligns with canonical TiO2 photocatalysis maps and modern ROS reviews. It is also consistent with recent operando studies showing that the working environment (pH, dissolved oxygen, and matrix ions) alters the contributions of •OH, O2•−, 1O2, and h+.
