Article

Maximally Exploiting the Fe2+ at the Interface of Micro and Nano Bubbles in the Fenton-Coupled Micro and Nano Bubble System for Organic Pollutant Degradation

1
State Key Laboratory of Coking Coal Resources Green Exploitation, China University of Mining and Technology, Xuzhou 221116, China
2
School of Chemical Engineering and Technology, China University of Mining and Technology, Xuzhou 221008, China
*
Authors to whom correspondence should be addressed.
Catalysts 2025, 15(9), 888; https://doi.org/10.3390/catal15090888
Submission received: 25 August 2025 / Revised: 10 September 2025 / Accepted: 15 September 2025 / Published: 16 September 2025
(This article belongs to the Section Catalytic Reaction Engineering)

Abstract

Heterocyclic compounds in high-salinity wastewater are highly resistant to degradation, posing significant treatment challenges. A hybrid micro-nano bubble Fenton system (FT-MNBs) was developed to enhance Fe2+ activation via interfacial effects. The FT-MNBs achieved a significantly higher indole degradation rate (0.0380 min−1) compared with micro and nano bubbles (MNBs) alone (0.0046 min−1) and conventional Fenton (0.01008 min−1). In real coking wastewater with a total dissolved solid (TDS) content of 3.266 g/L, FT-MNBs achieved COD removal efficiencies of 93.42% (initial COD 200 mg/L) and 72.54% (initial COD 10,000 mg/L), demonstrating excellent adaptability and efficiency in treating refractory high-salt organic wastewater. Electron spin resonance confirmed •OH as the main reactive species. Molecular simulations revealed that the MNB interface enhances the adsorption energy of Fe and H2O2, alters the Fe 3d orbital to better overlap with the O–O 2p orbital, and increases electron density—thus promoting O–O bond cleavage and free radical generation. The FT-MNBs not only enhances reaction kinetics but also offer scalability and energy efficiency, showing great potential for advanced industrial wastewater treatment.

1. Introduction

Heterocyclic compounds are widely used in the chemical industry as raw materials or intermediates, and the wastewater from this industry is resistant to degradation. Advanced oxidation processes (AOPs) have been proved to be efficient for the mineralization of heterocyclic compounds, and the Fenton reaction is one of the most popular methods in AOPs because of its powerful oxidation ability of the hydroxyl radical (•OH). The acidic working pH range (2–4) in the Fenton reaction poses several challenges: (1) the degradation system demands stringent corrosion-resistant materials, (2) the treated effluent requires a pH readjustment to neutral before discharge to meet regulatory standards, and (3) the neutralization process generates additional salts, thereby increasing downstream desalination costs. Therefore, improving efficiency and expanding the pH range of the Fenton process is always an important issue to be concerned about for researchers and the industry.
In recent years, micro and nano bubbles (MNBs) have attracted many researchers’ attention for their excellent performance including high surface areas, high reactivity, no secondary pollution, and so on. Nano bubble technologies offer opportunities to improve water treatment [1,2]. The combination of MNBs and AOPs provides a new chance for the wider application of AOPs and the reduction in the cost of operation [3,4]. From the perspective of MNBs, the reasons for enhanced degradation effect of pollutants may come from the following aspects: (1) the generation of reactive oxygen species [5,6,7]. (2) the ability of MNBs to strengthen mass transfer due to their high surface area and special interfacial properties, which increase the exposure opportunities for pollutants and oxides [8], (3) the oxygen in the nano bubbles that can provide part of the oxidant of the oxidation reaction [4], and (4) the energy provided by cavitation which could enhance this reaction [9]. Notably, recent studies have highlighted that the interfacial reactions of MNBs are the core driver for enhancing AOP efficiency, as MNB interfaces can regulate the adsorption and reaction behavior of reactants (e.g., oxidants, catalysts), thereby promoting free radical generation [10]. However, previous studies only reported the promotion of MNBs on organics degradation, yet the understanding of the molecular mechanism of the hybrid nano bubble–Fenton reaction remains insufficient. For instance, our previous work has confirmed that MNBs coupled with Fenton can effectively degrade Congo red (a typical refractory dye), achieving a higher degradation rate than conventional Fenton [3]; however, the role of MNB interfaces in regulating Fe2+ activity and H2O2 decomposition—especially for heterocyclic compounds (the main pollutants in coking wastewater)—has not been clarified. Molecular dynamics simulations were used to understand the mechanism of shockwave-induced nano bubble collapse [10,11], and found the mechanical nature of long-chain pollutant degradation. The distribution of H2O2 and Fe on the gas–liquid interface of bubbles, charge density variation in reactants, and reaction mechanism are all obscure.
In this study, the combination of MNBs and AOPs was used in coal chemical wastewater treatment. The high degradation efficiency of pollutants was obtained, and the working pH range was widened. The mechanism of the reinforcement of AOPs at the gas–liquid interface of micro-nano bubbles was first explained by DFT in this study.

2. Results and Discussion

2.1. MNBs Properties

After the adsorbate solution had passed through the MNB generator, three methods were combined to obtain the size distribution of micro bubbles and nano bubbles. From the 3D microscopy (Figure 1a), all bubbles were very evenly distributed in the solution, and micron and submicron bubbles could be seen clearly. Detailed morphology of MNBs, including single bubble and multi-magnification observations, is provided in Figure S1 (Supplementary Materials), further confirming the uniform dispersion of bubbles. From the DLS results (Figure 1b), microbubbles were distributed in the range of 0–120 μm and peaked at 4, 19, and 34 μm. When the cumulative particle-size distribution percentage reached 50%, the corresponding particle size (d50) was 20.43 ± 0.26 μm. Size distributions of microbubbles under 0.4, 0.5 and 0.6 MPa are detailed in Figure S2, showing consistent peak positions with Figure 1b. The particle size of detected nano bubbles was in the range of 0–300 nm and peaked at 81 nm (Figure 1c). Quantitative data of nano bubble concentration and average diameter at different cavitation times are listed in Table S1, and corresponding distribution maps are presented in Figure S3. Variation in dissolved oxygen content (DO) with the working time of the MNB generator under different inlet pressures is shown in Figure 1d. The DO of the water was 8.45 mg/L, and increased in the first 2 min. The temperature of the water was 19 °C, and the saturated DO was 9.27 mg/L. The DO was supersaturated from 30 s, and reached the peak at 2 min. And then, the DO decreased, which might be due to the decrease in microbubble concentration and the increase in the solution temperature, but still kept stayed supersaturated. For different inlet pressures, the DO at inlet pressure of 0.5 MPa was always the highest and peaked at 13.18 mg/L at 2 min.

2.2. Degradation of Indole by Fenton Combined MNBs

2.2.1. The Degradation Kinetics of Indole by FT-MNBs Methods

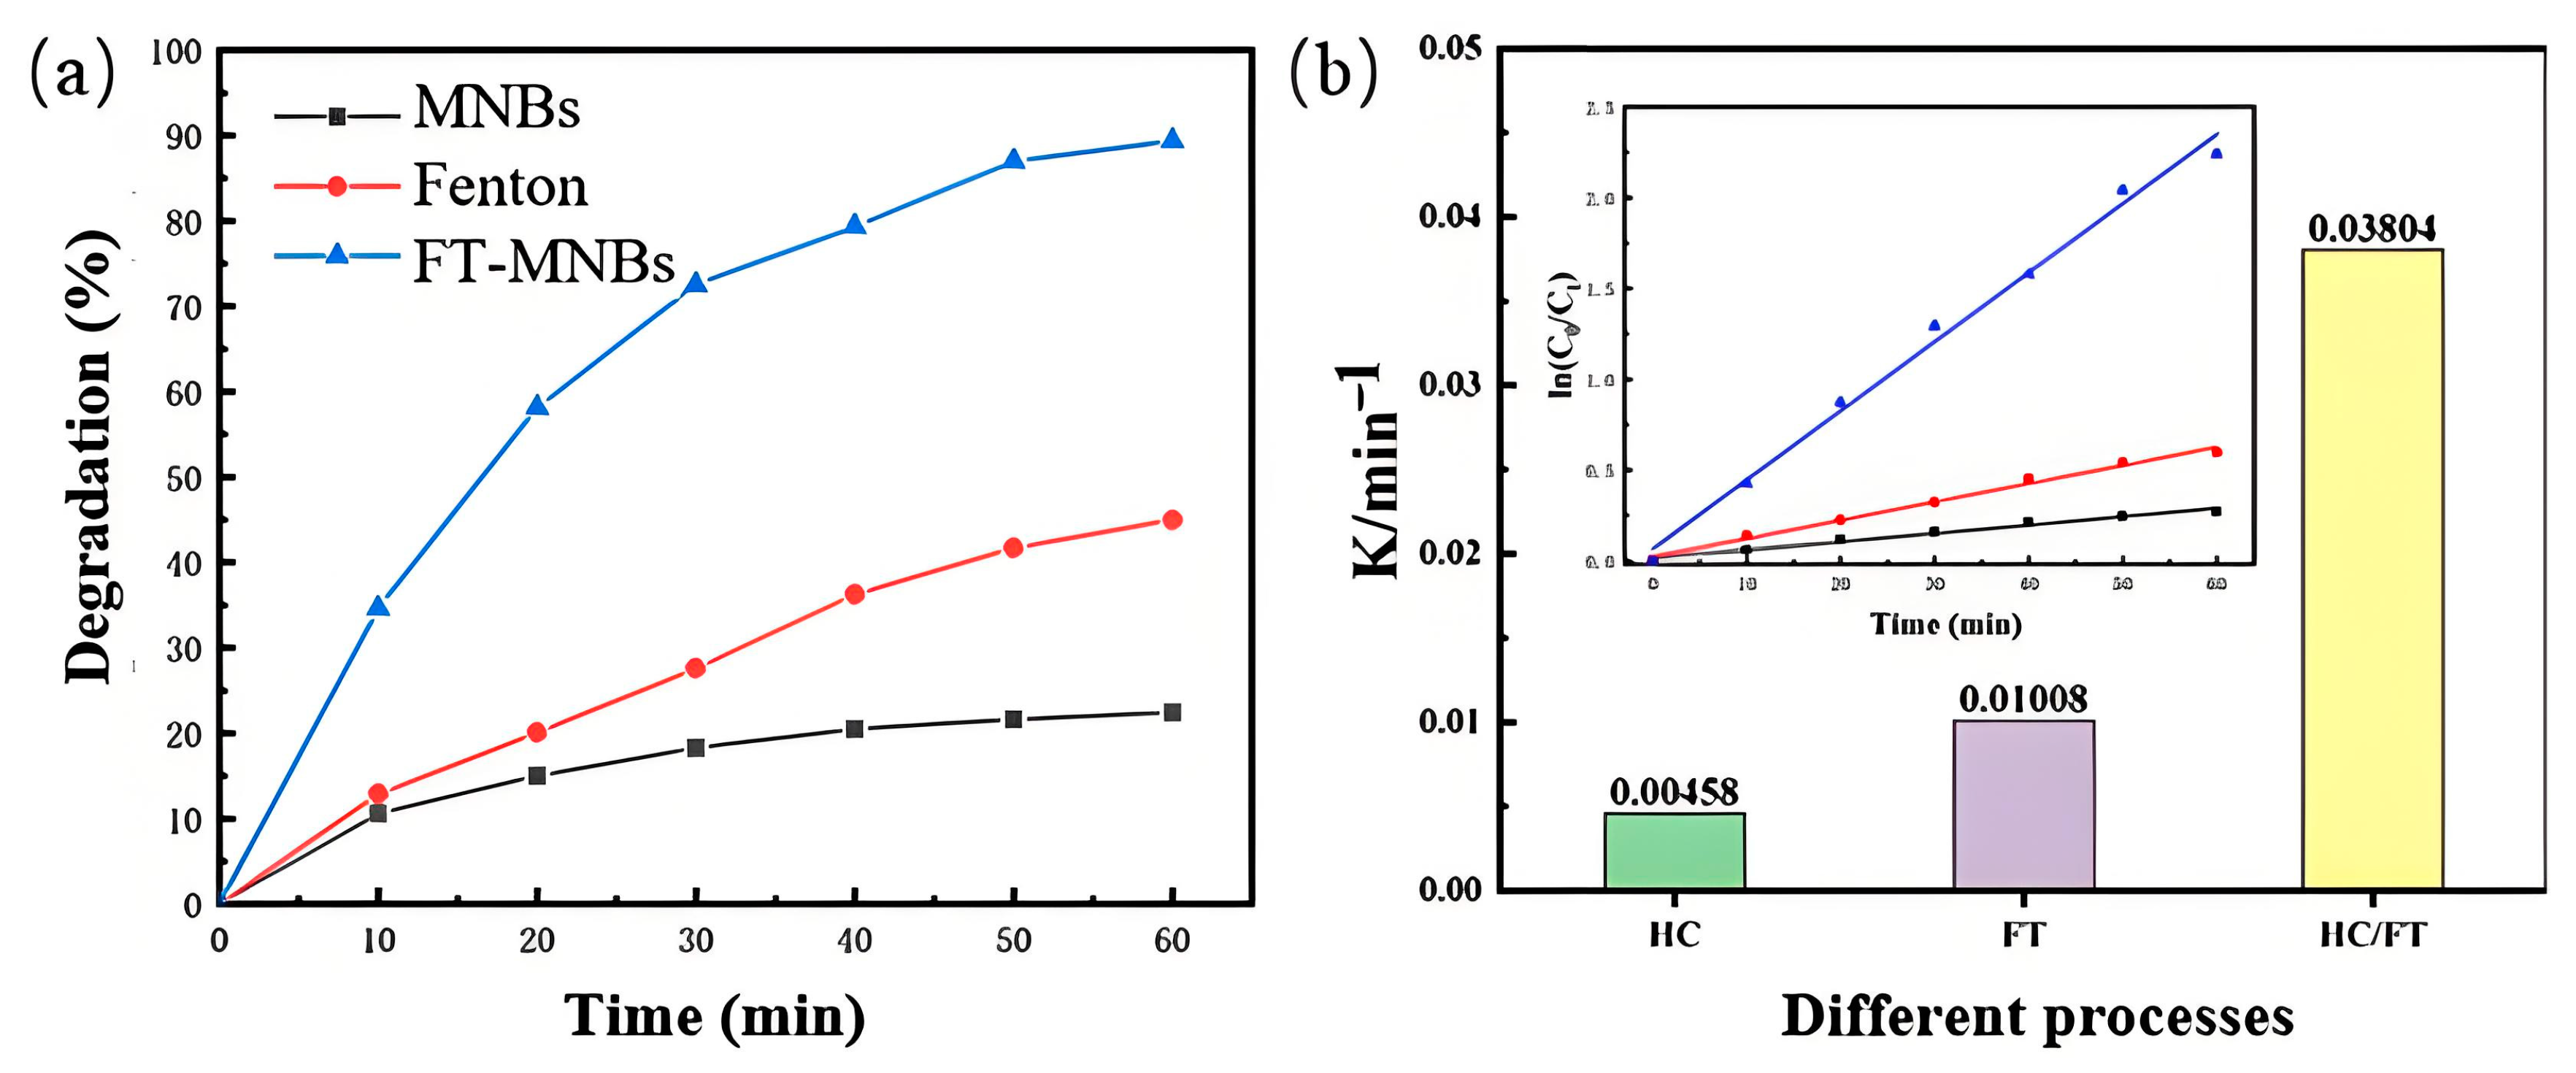
The degradation of indole by MNBs, FT-MNBs, and conventional Fenton is shown in Figure 2. The initial indole concentration was 100 mg/L with a pH of 3, and the H2O2 and FeSO4 dosage was 6 and 1.2 mmol/L. The air intake was 30 mL/min and inlet pressure was 0.5 MPa. The indole was degraded under the action of the MNBs, but the removal efficiency was only 22.43% in 60 min. The indole removal efficiency by conventional Fenton was 45.01% in 60 min. The indole removal efficiency of FT-MNBs was 89.35%, much higher than that of MNBs and conventional Fenton with the same amount of reagents dosage. The removal efficiency of indole by the three methods with time was fitted with pseudo-first-order kinetics with the relative coefficient R2 in the range of 0.984–0.991 to obtain the reaction rate constant (K), shown in Figure 2b. And the K of FT-MNBs was 0.0380 min−1, much higher than that of 0.0046 min−1 for MNBs and 0.01008 min−1 for conventional Fenton. Therefore, FT-MNBs have a significant synergistic effect on indole removal, with the degradation rate of FT-MNBs 8.31 and 3.77 times that of MNBs and conventional Fenton. Zhang and his coworkers fabricated Fe (II) functionalized colloidal micro bubbles with a frother, which could reduce the Fe (II) dosage of Fenton, but unfortunately it was difficult to distinguish whether it was the effect of the air flotation process or the improvement in the efficiency of iron ions on the surface of microbubbles, because the removal of pollutants was within 0.5 min, and air flotation might have played a significant role [12].

2.2.2. Influence of Experimental Parameters on Indole Degradation

The influences of inlet pressure on degradation are shown in Figure 3a. The removal efficiency increased with the inlet pressure (in the range of 0.3–0.5 MPa), and the removal efficiency was up to 89.35% at 60 min under the inlet pressure of 0.5 MPa, and the removal efficiency decreased if the inlet pressure increased to 0.6 MPa. Therefore, the inlet pressure was set at 0.5 MPa in the following experiments. The influences of dosage of H2O2 on degradation are shown in Figure 3b, as the H2O2 dosage increased from 2 to 8 mmol/L, the removal efficiency increased from 39.98% to 93.26%. When the H2O2 dosage increased to 10 mmol/L, the removal efficiency decreased to 75.86%, which might have been due to excess H2O2 quenching the hydroxyl radicals as in Equations (4) and (5), which might have led to an ineffective reaction of the free radicals. When the dosage of H2O2 was 6 and 8 mmol/L, the removal efficiency of indole only increased by 3.91%. From an economical point of view, the dosage of H2O2 in the following study was set at 6 mmol/L.
H2O2 + Fe2+ → Fe3+ + OH +·OH
H2O2 + OH → HO2 + H2O
OH + OH → H2O2
Fe2+ + OH → Fe3+ + OH
The influences of pH on the indole degradation awere shown in Figure 3c. pH had strong effect on the indole degradation, and the indole removal efficiency at a pH of 3 was 89.35%, and with the pH increase, the removal efficiency decreased to 36.87% at a pH of 9. The bulk nano bubbles demonstrated superior stability in alkaline solutions compared with acidic environment [13], but it seemed to have no effect on improving the degradation effect. In a high pH environment, Fe2+ is prone to precipitation substances such as hydroxides, thereby losing catalytic performance. The influences on indole degradation of dosage of Fe2+ are shown in Figure 3d. Insufficient or too high concentration of Fe2+ would weaken the degradation effect; when the molar ratio of H2O2 to Fe2+ (n(H2O2/Fe2+)) was 5, the indole removal efficiency was highest. When n(H2O2/Fe2+) was 9 or 7, the dosage of Fe2+ was too small to fully catalyze H2O2, so that the number of free radicals generated by decomposition was seriously insufficient, resulting in the inability of rapid and effective degradation of pollutants. While n(H2O2/Fe2+) was 3, the excess Fe2+ could also react with •OH (Equation (4)), resulting in a decrease in the concentration of •OH and weakening the degradation effect.

2.3. Degradation Mechanism

2.3.1. The Detection of Free Radicals

The signal of free radicals from ESR is shown in Figure 4. The peaks with an intensity ratio of 1:2:2:1 were found in the ESR spectra, which was the signal of the spin adduct of •OH with a spin trap DMPO, demonstrating that radical •OH was the predominant active species. From Figure 4a, the signal of •OH of the MNB solution was much higher than that of the water. From Figure 4b, the intensity of the peak of FT-MNBs was much higher than that of Hydrodynamic Cavitation (HC) and FT, and it was even higher than that of the sum of the two systems (HC and FT). Therefore, the concentration of •OH in FT-MNBs was higher than that of HC and FT, which was the reason for the higher indole degradation rate. The nano bubbles provided the micro-nano bubble interface and increased the decomposition rate of H2O2 in the presence of Fe2+.

2.3.2. Indole Degradation Products and Pathways

2-Indolinone, indole-2,3-dione, formanilide and acrylamide were detected by GC-MS, which were main intermediates of indole degradation by FT-MNBs. The possible pathway of indole degradation by FT-MNBs is shown in Figure 5. The vicinal carbon of nitrogen atom was attacked first to form a carbonyl group, and then the para carbon of the nitrogen atom was attacked to form a carbonyl group, followed by the opening of the pyrrole ring of indole. And then the benzene ring of the indole was also opened and acrylamide was detected as one of the intermediates [14]. In other studies, low-molecular-weight organic acids were detected during the degradation of indole [15], but no related intermediates were detected in this paper, which may be related to the faster reaction speed.

2.3.3. Indole Degradation Mechanism by Theoretical Calculation

The mechanism by which MNBs promotes Fenton degradation includes the following hypotheses: (1) The pollutants, H2O2 and Fe2+, are more likely to adsorb at the interface of MNBs due to hydrophobicity, heterogeneous charges, and other reasons, increasing the probability of reaction. (2) At the interface of MNBs, the reaction of H2O2 and Fe2+ is more likely to occur. Scholars believe that MNBs exhibits significant advantages through interface reactions in assisting AOPs [16]. (3) Oxygen might provide an oxidant of Fenton, and MNBs improve oxygen transfer efficiency significantly, and oxygen mass transfer is an important factor affecting the performance in the electro-Fenton process [17,18,19]. From the previous research, the promotion effect of nitrogen MNBs on the Fenton reaction is minimal. A molecular model of the MNB interface was constructed, and the reactivity of H2O2 and Fe was studied.
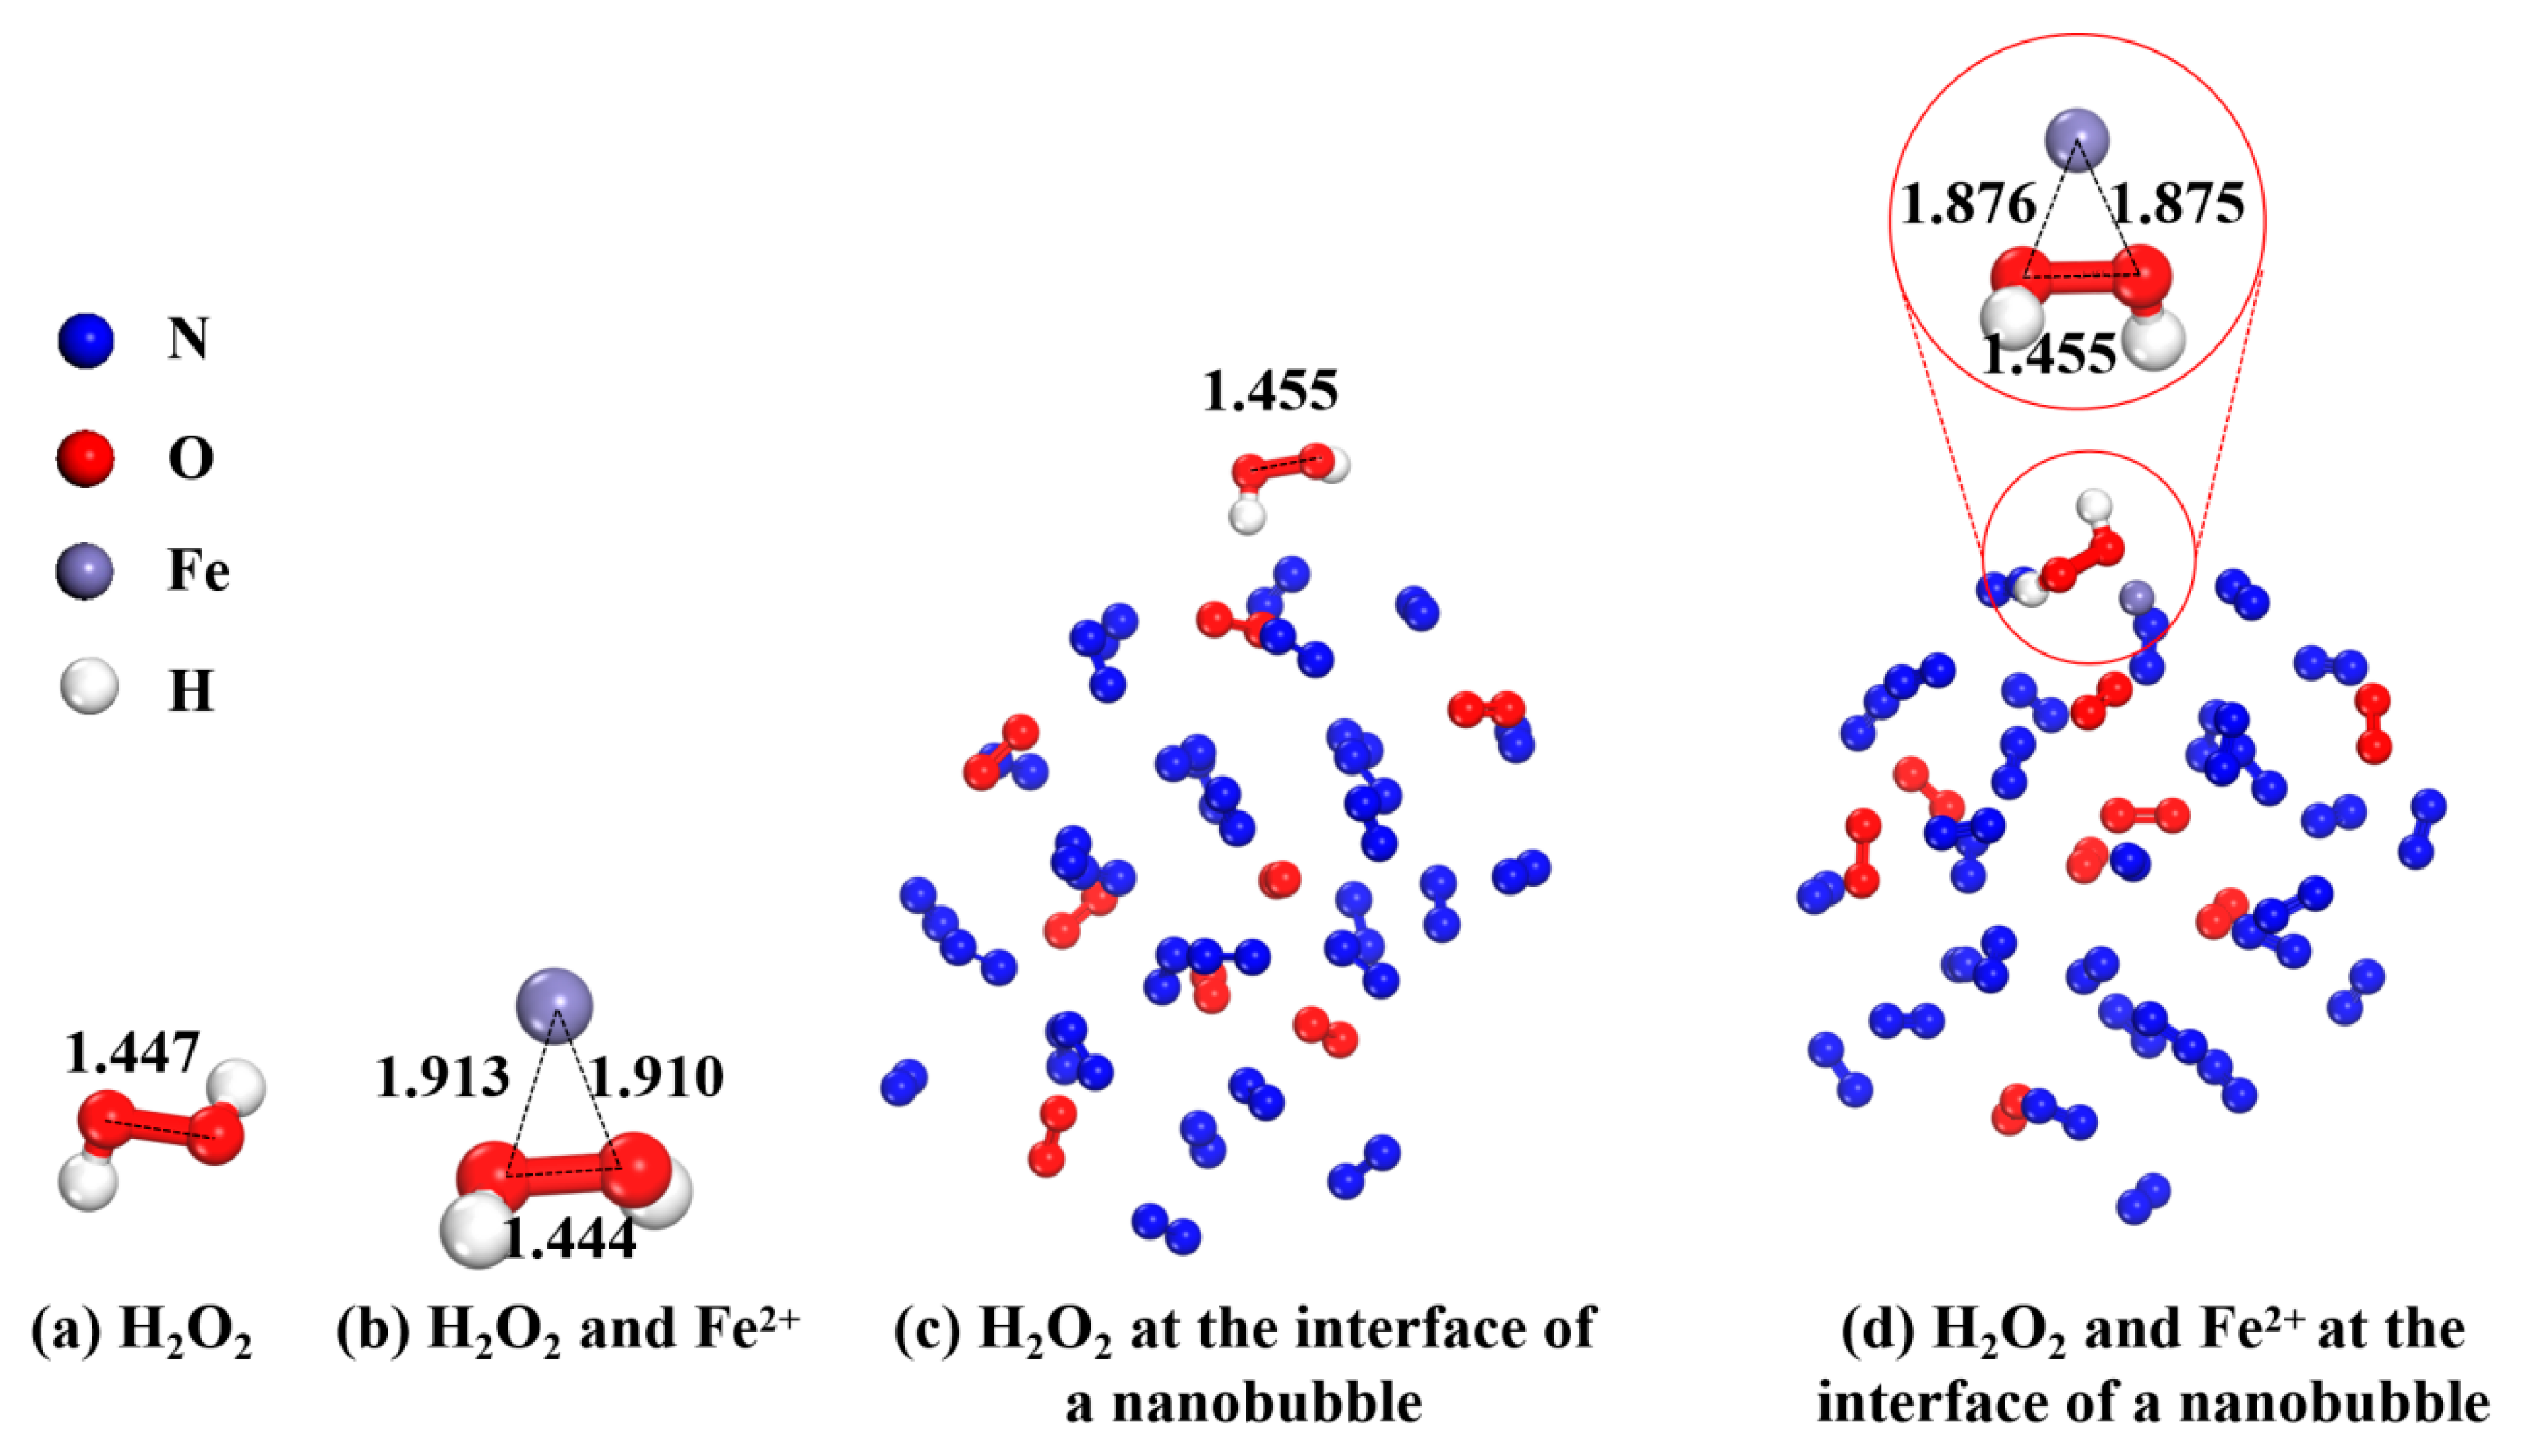
A cluster of 45 nitrogen molecules and 12 oxygen molecules was constructed as a nano bubble with a diameter of 2 nm, as shown in Figure 6. The distance between the two O atoms in the H2O2 molecule is 1.447 Å with an adsorption energy of −69.07 kcal/mol, as in Figure 6a. In the conventional Fenton process in Figure 6b, when the Fe was presented near the H2O2 molecule, the distance between the two O atoms in the H2O2 molecule decreased to 1.444 Å, and the bond length decreased due to the attraction of the Fe. From Figure 6c, where the H2O2 molecule was near the oxygen molecules at the interface of a nano bubble, the O-O distance increased to 1.455 Å, so the O-O was easier to break at the interface of a nano bubble, while the H2O2 molecule near the nitrogen molecules at the interface of a nano bubble may not have had such a significant decomposition promotion effect, which was consistent with the experimental results. And from Figure 6d, when the H2O2 molecule and Fe were at the interface of a nano bubble, the O-O distance was 1.455 Å, which was longer than that (1.444 Å) in the conventional Fenton process, causing H2O2 to decompose more easily to form •OH. The adsorption energy between Fe and H2O2 at the interface of a nano bubble was −73.93 kal/mol, higher than that in the conventional Fenton process, which meant that the affinity of Fe and H2O2 at the interface of nano bubble was higher.
In a traditional Fenton reaction, the O-O bond in H2O2 breaks by acquiring electrons from Fe2+ to generate •OH and OH. Differential charge density maps reveal that during the reaction between Fe atoms and H2O2 under conventional conditions (Figure 7a), the electron-acquiring capacity of the O-O bond in H2O2 is relatively weak, even exhibiting an electron loss state (approximately 0–1.11 e), which is not conducive to bond breaking. While at the MNB interface (Figure 7b), the electron-acquiring capacity of the O-O bond is significantly enhanced to an electron-rich state (approximately 2.74–3.28 e), facilitating electron-mediated bond breaking. From an electronic orbital perspective, the electronic effect of the MNB surface induces two critical modifications: First, they alter the 3d orbital configuration of Fe, transforming its isolated petal-shaped structure into an overlapping state with the 2p bonding orbitals of O-O, and thereby enhancing electron mediation between Fe and O. Second, the interactions among bubbles, Fe2+ and H2O2, increase the electron density of the Fe and O-O system, substantially strengthening the electron-acquiring capability of the O-O bond and effectively facilitating its breaking to generate free radicals.
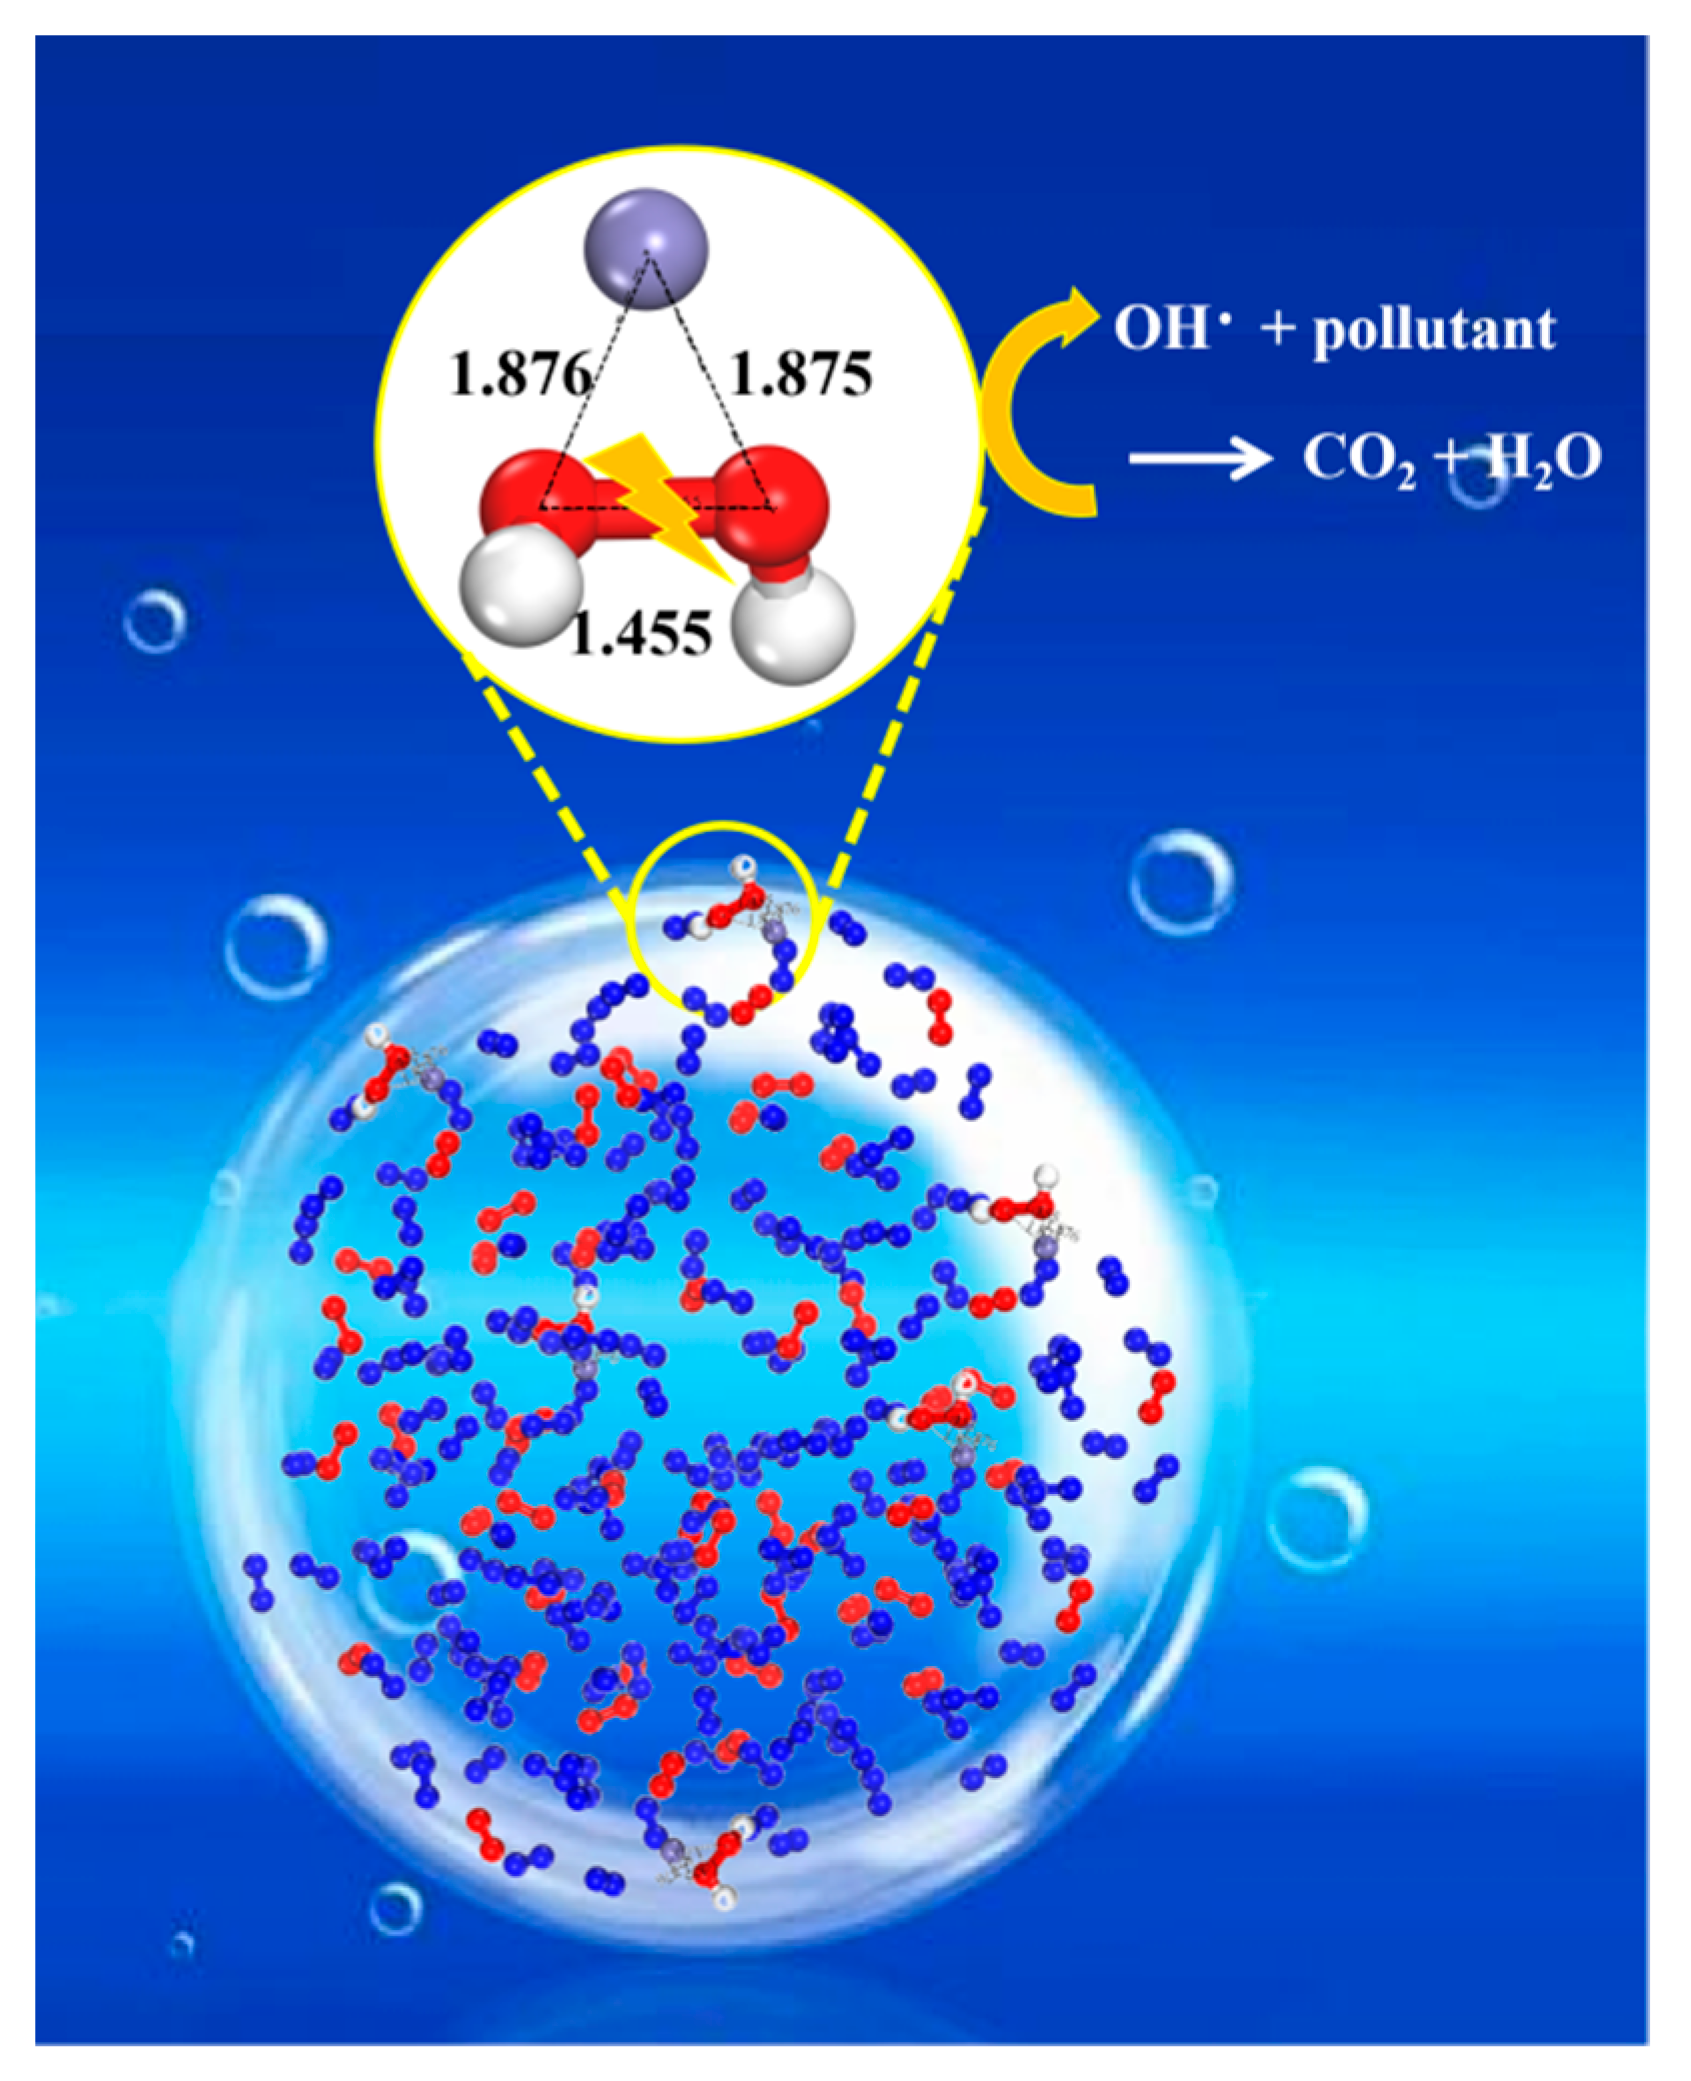
In conclusion, at the MNB interface, the electron-donating and electron-mediating abilities of Fe was improved, the O-O bond in H2O2 was elongated, and the electron donating ability of the O-O bond was significantly increased, tending to break and generate hydroxyl radicals, and then accelerated the degradation of pollutants, as shown in Figure 8.

2.4. Treatment of Industrial Coking Wastewater

The ion concentration in the wastewater was also very high with a total dissolved solid (TDS) content of 3.266 g/L, as shown in Table 1. The salts in wastewater were mainly sodium chloride and sodium sulfate, of which the Na+, Cl, and SO42− concentrations were 1698.23, 1043.04 and 397.34 mg/L.
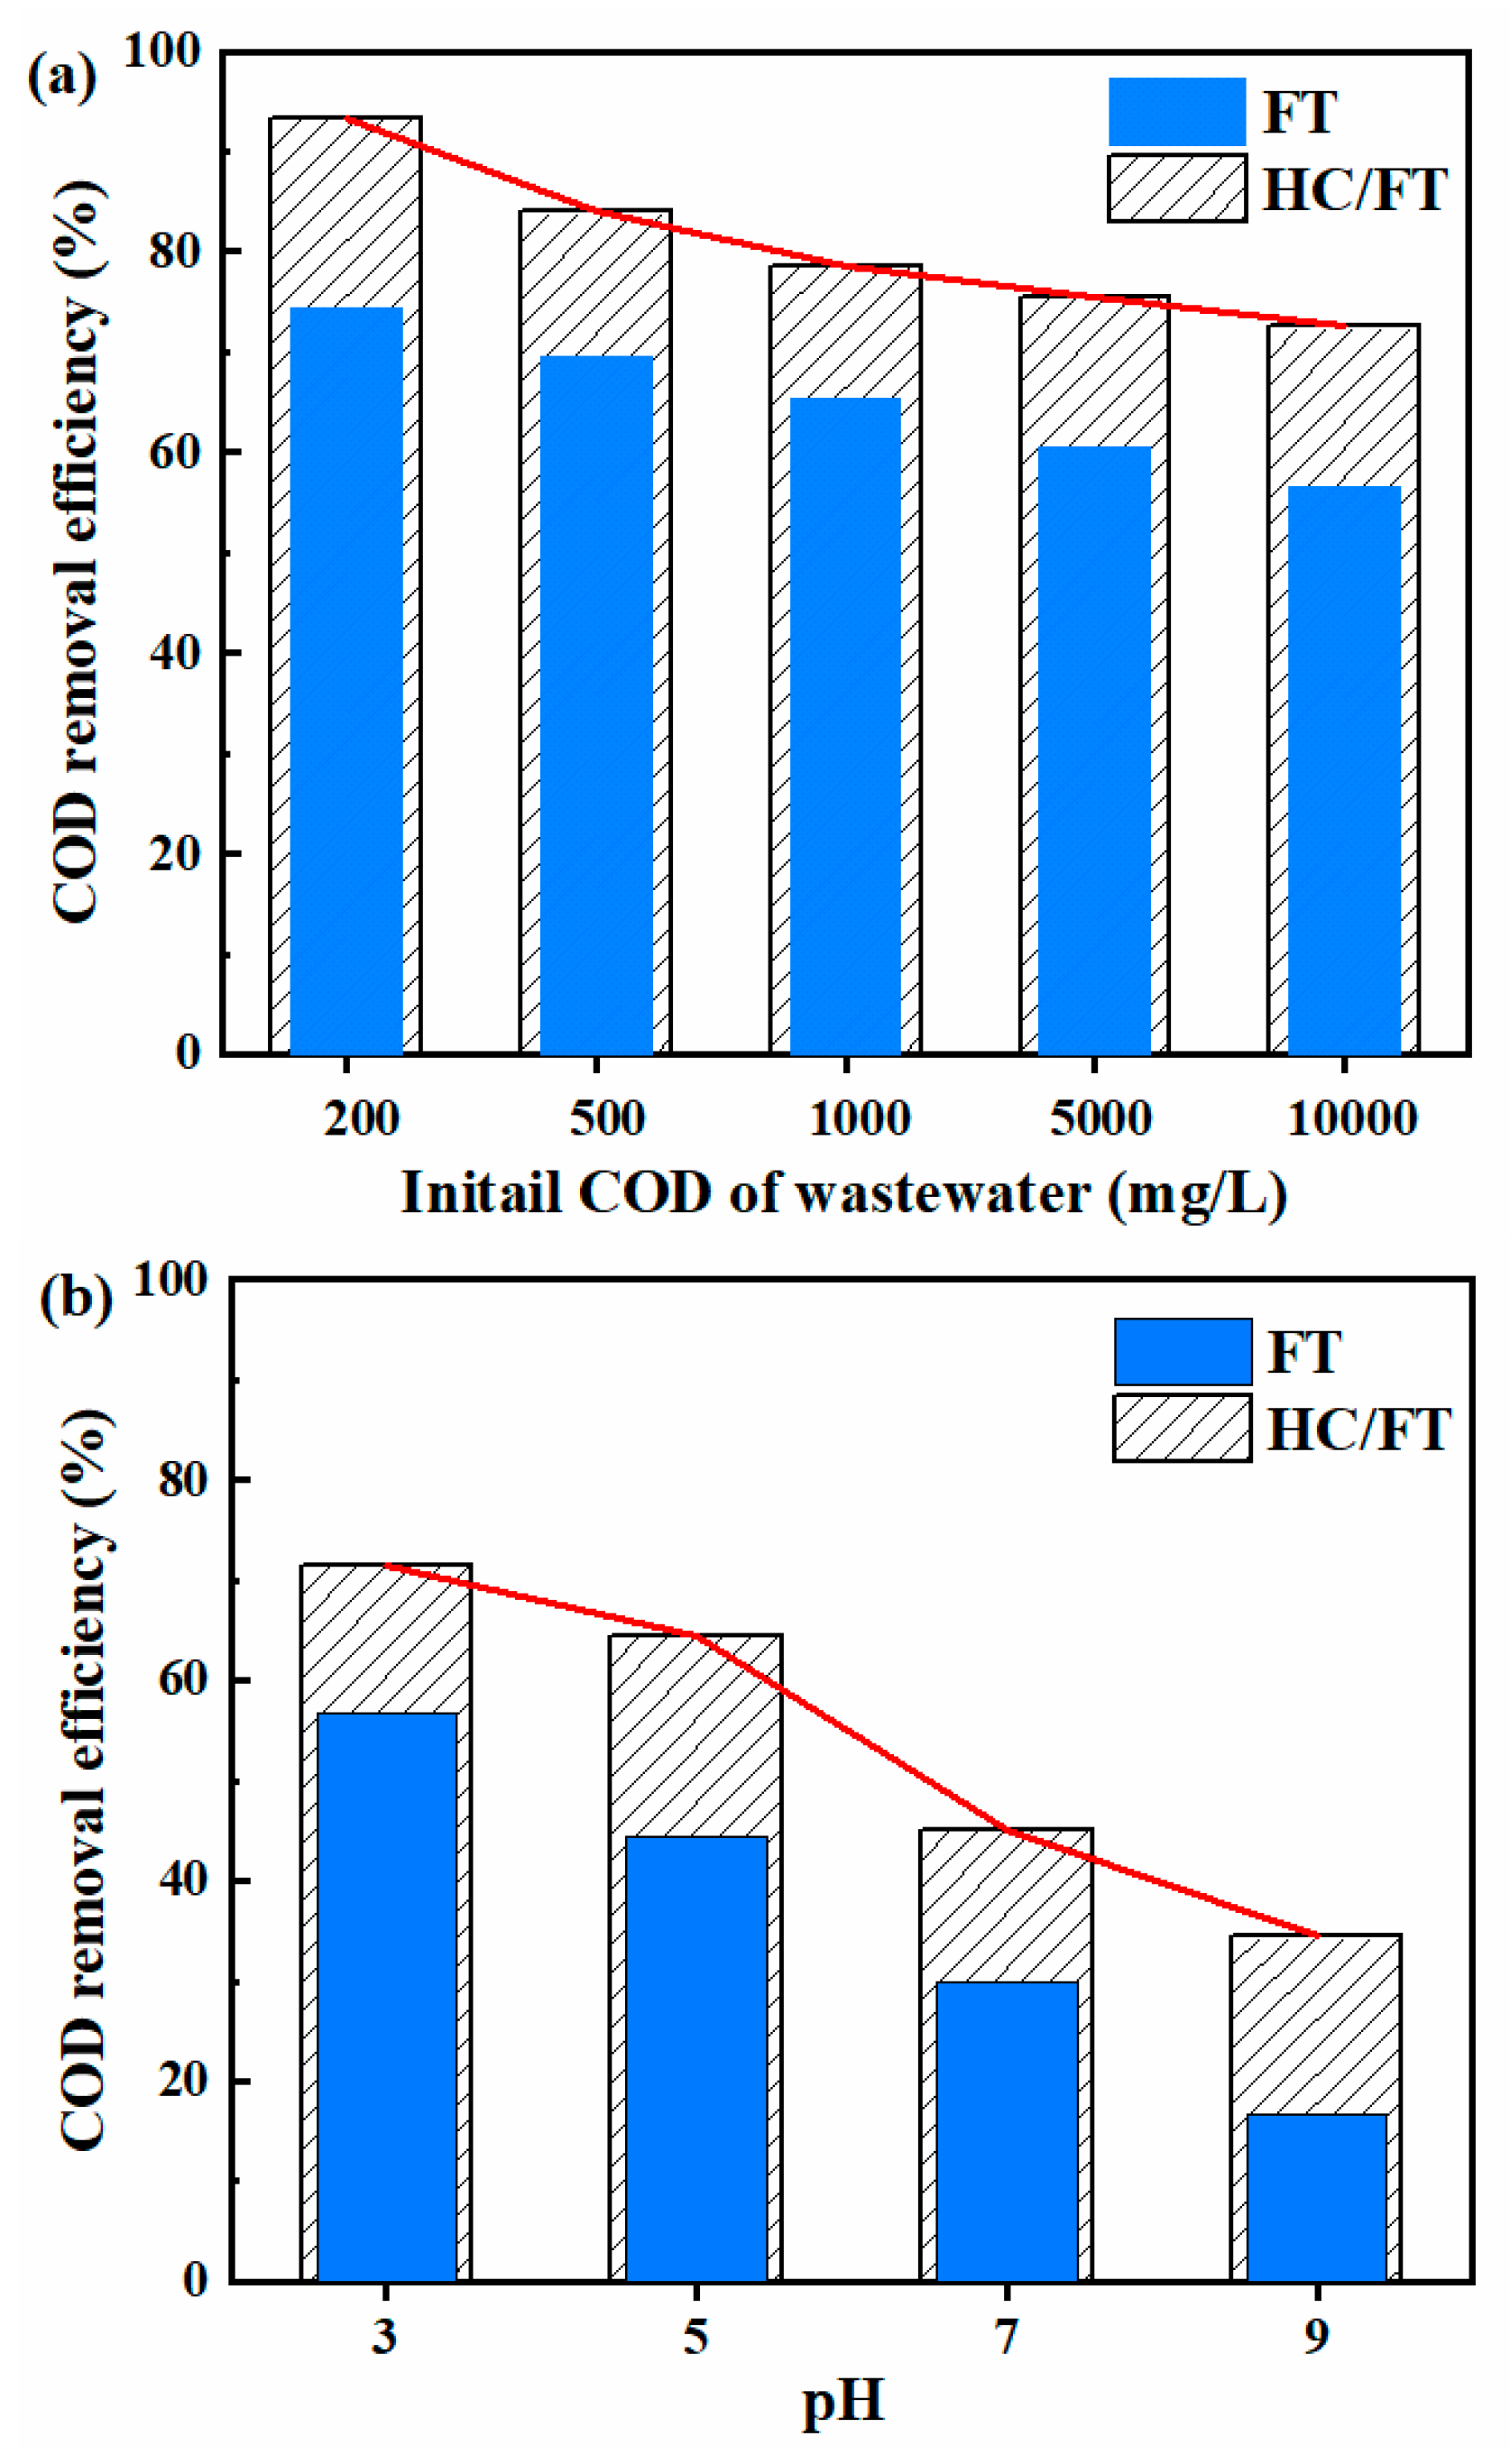
In industry, there are many types of coking wastewater treatment processes, resulting in differences in the COD of wastewater entering the AOPs (usually higher than 200 mg/L), which has a greater impact on the degradation effect. Therefore, wastewater of different initial concentration was degraded, shown in Figure 9a. The inlet pressure of MNBs was 0.5 MPa, n(H2O2/Fe2+) was 5, and the degradation time was 60 min. As the initial COD of wastewater increased, the dosage of Fenton reagents increased proportionally, and the ratio of initial COD to initial reagent concentration was the same. When the initial COD was 10,000 mg/L, the COD removal efficiency was 72.54%, higher than 56.72% of the conventional FT. With the decrease in the initial COD of wastewater, the COD removal efficiency increased. When the initial COD was 200 mg/L, despite the high salt content of this wastewater, the COD removal efficiency could be up to 93.42%, 20% higher than 74.42% of the conventional FT. In order to control treatment costs, in the industry, it is usually required that the initial COD of wastewater entering AOPs should be not higher than 200 mg/L. The COD of the treated wastewater by FT-MNBs was 13.16 mg/L and reached the industrial discharge standards and the reuse water standards of this plant. In conclusion, FT-MNBs can effectively remove refractory organics and can also achieve a high COD removal efficiency in actual refractory industrial wastewater containing high concentrations of salts and organics. The effect of H2O2 dosage on the COD removal of industrial wastewater is further illustrated in Figure S4 (Supplementary Materials), which confirms the optimal H2O2 dosage of 9 mL/L. The influence of pH on the COD removal efficiency of the raw wastewater is shown in Figure 9b. The COD removal efficiency of FT-MNBs was higher than that of FT in the pH range of 3–9. And at a pH of 5, the COD removal efficiency of FT-MNBs, was higher than that of FT at a pH of 3. Therefore, FT-MNBs could extend the pH range of the high-efficiency oxidation reaction and could also keep a high degradation rate under neutral condition, which streamlined the process of adjusting pH and reduced the anti-corrosion requirements of equipment.
MNB-assisted processes have the potential to reduce energy consumption and costs [20]. Comparisons of the cost of conventional FT and FT-MNBs system are listed in Table 2. The cost reduction in FT-MNBs was mainly due to the reduction in the amount of FT’s reagents, and the increase in the reaction pH from 3 to 5 of the conventional FT to 5–7 of FT-MNBs, which reduced the amount of pH adjuster (pH of the raw wastewater was 9.1–9.2 in Table 1). The energy consumption of the MNBs generator was also considered, and the cost of FT-MNBs was only 71.42% of that of FT to remove the organics of the same concentration. In addition, MNBs can also reduce the operational cost of the wastewater treatment system [21]. And the neutral degradation environment will also reduce the anti-corrosion requirements of equipment, thereby reducing the system construction cost and extending service life. Therefore, FT-MNBs have potential for the industrial application of actual coking wastewater.

3. Experimental Sections

3.1. Materials and Reagents

Indole, hydrogen peroxide, ferrous sulfate, sulfuric acid, sodium hydroxide and 5,5-dimethyl-1-pyrroline-n-oxide were purchased from Aladdin and Sinopharm Chemical Reagent Co., Ltd., Shanghai, China. All these reagents were of analytical grade (AR). The industrial wastewater was from a coking plant in Shandong Province, China, which was a kind of refractory high-salt organic wastewater. All these reagents were of analytical grade.

3.2. Production of Bulk Micro–Nano Bubbles and Size Measurements

An MNB generator (LF-1500, Shanghai Xingheng Technology Co., Ltd., Shanghai, China) was used to produce MNBs, and then micro bubbles were analyzed using a laser-diffraction particle-size analysis instrument (Microtrac S3500, MicrotracBEL, Osaka, Japan), and the dynamic light scattering signal of nano bubbles was captured by nanoparticle tracking analysis (NanoSight NTA 3.4 Build 3.4.003). The micro bubbles were analyzed twice, while the nano bubbles were analyzed three times. Super depth of field 3D microscopy (VHX-6000, Keyence Inc., Osaka, Japan) was also used to identify the bubble distribution. The free radicals were examined by electron spin resonance (ESR, JEOL JES-FA200, JEOL, Tokyo, Japan).

3.3. Experimental Procedures and Intermediate Product Analysis

In total, 500 mL of indole solution of 100 mg/L was used in every degradation experiment. In the MNB degradation experiment, the indole solution was with the air intake of 30 mL/min and inlet pressure of 0.3–0.6 MPa. In the conventional Fenton experiment, the H2O2 and FeSO4 dosage was 6 and 1.2 mmol/L, respectively, and the influences of initial pH (i.e., 3, 5, 7, and 9) and reaction time (i.e., 20, 30, 40, 50, 60 min) were investigated. The micro and nano bubble-coupled Fenton oxidation reaction was conducted with the same reagent dosage as Fenton. After Fenton reagents and a pH adjuster were added to the pollutant solution, the mixture was injected into the MNB generator for circulatory treatment for reaction time (i.e., 20, 30, 40, 50, and 60 min), and the repeated experiments were conducted, and the average results were calculated.
The concentration of treated indole was analyzed using high-performance liquid chromatography (HPLC, Ultimate 3000DGLC, Thermo Fisher Scientific, Inc., Waltham, MA, USA) with an Acclaim 120C18 5 μm (4.6 × 250 mm) analytical column. The column oven temperature was set at 30.0 ± 1.0 °C, and the mobile phase consisted of methanol: water (65: 35, v/v) with the flow rate of 1.0 mL/min. The detection was carried out at a wavelength of 275.00 nm, and the peak appeared at approximately 6.2 min. The pollutant degradation percentage was calculated using the following formula:
R % = C 0 C t C 0 × 100 %
where C0 and Ct are the initial concentration and residual concentration of the pollutant solution (mg/L) in the experiment.
The removal efficiency of indole by the three methods with time was fitted with pseudo-first-order kinetics to obtain the reaction rate constant (K). In order to evaluate the improvement efficiency of FT-MNBs for indole degradation compared with conventional Fenton and MNBs used alone, the reaction rate constants of MNBs and conventional Fenton are denoted as K1 and K2, and the reaction rate constant of FT-MNBs is denoted as K3, then the rate-based synergy coefficient (SC) formula is as Equation (6) [22].
S C = K 3 / ( K 1 + K 2 )

3.4. Analysis of Reactive Oxygen Species and Intermediate Product Analysis

Electron spin resonance (ESR, JEOL JES-FA200, JEOL, Tokyo, Japan) was used to analyze free radicals during the reaction process. The JES-FA200 was tested at X band at 9 GHz, with a microwave power of 0.998 mW and resonance frequency of 9038.864 MHz. The radical capturing agent commonly used in ESR was DMPO. DMPO can react with •OH and O2•− radicals to generate spin-adduct DMPO-OH and DMPO-OO. These products have different characteristic peaks in ESR spectra.
The intermediates were detected by gas chromatography–mass spectrometry (GC-MS). Indole-degraded samples for 5 and 20 min were used for the detection of intermediates, which were first extracted with dichloromethane, and anhydrous sodium sulfate was added to the extracted organic solution for dehydration, and then dissolved with chromatographic grade methanol after rotary evaporation for the use in GC-MS.

3.5. Simulation Details

The full geometry optimization of all structures was carried out at the DFT level of theory using the B3LYP functional with the help of the Gaussian-09 program package. We used the effective core potential (Lanl2) for the inner shells of Fe and the extended double-n basis (DZ) for the valence 3d, 4s, 4p orbitals. For the nitrogen, oxygen, and hydrogen atoms in the nano bubble model or H2O2-related molecules, we used the 6-31G * basis set. DFT-D3 corrections were taken into consideration for each calculation. The solution model was used in all calculations. The Multiwfn program was used during the data processing [23].

4. Conclusions

The Fenton coupled with a micro and nano bubble system was built to degrade organic pollutants. Firstly, the reaction rate constant of FT-MNBs was 0.0380 min−1, 8.31 and 3.77 times that of MNBs and conventional FT. Secondly, in actual refractory industrial wastewater containing high concentrations of salts and organics, the FT-MNBs could also achieve high COD removal efficiency. Thirdly, FT-MNBs could extend the pH range of the high-efficiency oxidation reaction and could also keep a high degradation rate under neutral conditions, which streamlined the process of adjusting pH and reduced the anti-corrosion requirements of the equipment, and then, it reduced the construction cost and chemical cost of the water treatment systems. The mechanism of FT-MNBs exploiting the Fe2+ at the interface of the nano bubbles showed that the electron-donating and electron-mediating abilities of Fe were improved, and the O-O bond in H2O2 was elongated and the electron donating ability of the O-O bond was significantly increased, tending to break and generate hydroxyl radicals, and then accelerating the degradation of pollutants.

Supplementary Materials

The following supporting information can be downloaded at: https://www.mdpi.com/article/10.3390/catal15090888/s1, Figure S1: (a) solution before and after cavitation, (b) single bubble, (c) and (d) bubble morphology of different multiples; Figure S2: (a) 0.4, (b) 0.5, (c) 0.6 MPa bubble distribution at the micron level; Figure S3: Distribution of nanoscale bubbles under cavitation time (a) 0, (b) 20, (c) 40, (d) 60 min; Table S1: Nanobubble concentration and size; Figure S4: Effect of dosage of H2O2 on COD removal effect of industrial wastewater.

Author Contributions

Q.H.: conceptualization, writing—original draft, review and editing, and funding acquisition. Z.S.: conceptualization and investigation. S.H.: methodology, software, and visualization. R.G.: conceptualization and investigation. C.H.: conceptualization, methodology, and investigation. Z.M.: supervision and funding acquisition. All authors have read and agreed to the published version of the manuscript.

Funding

National Key Research and Development Program of China (2021YFC2902604) and the National Natural Science Foundation of China (52374286).

Data Availability Statement

The data presented in this study are available on request from the corresponding author.

Acknowledgments

This research was supported by the National Key Research and Development Program of China (2021YFC2902604) and the National Natural Science Foundation of China (52374286), for which the authors express their appreciation.

Conflicts of Interest

The authors declare that they have no known competing financial interests or personal relationships that could have appeared to influence the work reported in this paper.

References

  1. Atkinson, A.J.; Apul, O.G.; Schneider, O.; Garcia-Segura, S.; Westerhoff, P. Nanobubble Technologies Offer Opportunities to Improve Water Treatment. Acc. Chem. Res. 2019, 52, 1196–1205. [Google Scholar] [CrossRef]
  2. Temesgen, T.; Bui, T.T.; Han, M.; Kim, T.-i.; Park, H. Micro and nanobubble technologies as a new horizon for water-treatment techniques: A review. Adv. Colloid Interface Sci. 2017, 246, 40–51. [Google Scholar] [CrossRef]
  3. Ma, P.; Han, C.; He, Q.; Miao, Z.; Gao, M.; Wan, K.; Xu, E. Oxidation of Congo red by Fenton coupled with micro and nanobubbles. Environ. Technol. 2023, 44, 2539–2548. [Google Scholar] [CrossRef]
  4. Wang, L.; Ali, J.; Wang, Z.; Oladoja, N.A.; Cheng, R.; Zhang, C.; Mailhot, G.; Pan, G. Oxygen nanobubbles enhanced photodegradation of oxytetracycline under visible light: Synergistic effect and mechanism. Chem. Eng. J. 2020, 388, 124227. [Google Scholar] [CrossRef]
  5. He, Q.; Cui, R.; Miao, Z.; Xing, Y.; Wan, K.; Gao, M.; Zhang, M. Improved removal of Congo Red from wastewater by low-rank coal using micro and nanobubbles. Fuel 2021, 291, 120090. [Google Scholar] [CrossRef]
  6. Lee, S.; Anwer, H.; Park, J.W. Oxidative power loss control in ozonation: Nanobubble and ultrasonic cavitation. J. Hazard. Mater. 2023, 455, 131530. [Google Scholar] [CrossRef]
  7. John, A.; Carra, I.; Jefferson, B.; Jodkowska, M.; Brookes, A.; Jarvis, P. Are microbubbles magic or just small? A direct comparison of hydroxyl radical generation between microbubble and conventional bubble ozonation under typical operational conditions. Chem. Eng. J. 2022, 435, 134854. [Google Scholar] [CrossRef]
  8. Xiang, P.; Ma, P.; He, Q.; Song, Z.; Miao, Z. Enhanced removal of phenol and chemical oxygen demand from coking wastewater using micro and nano bubbles: Microbial community and metabolic pathways. Bioresour. Technol. 2024, 394, 130207. [Google Scholar] [CrossRef] [PubMed]
  9. Yasui, K.; Tuziuti, T.; Kanematsu, W. Mechanism of OH radical production from ozone bubbles in water after stopping cavitation. Ultrason. Sonochem. 2019, 58, 104707. [Google Scholar] [CrossRef]
  10. Adhikari, U.; Goliaei, A.; Berkowitz, M.L. Mechanism of Membrane Poration by Shock Wave Induced Nanobubble Collapse: A Molecular Dynamics Study. J. Phys. Chem. B 2015, 119, 6225–6234. [Google Scholar] [CrossRef] [PubMed]
  11. Zhou, Y.B.; Cao, D.P.; Zhang, X.R. Degradation Mechanism of Micro-Nanobubble Technology for Organic Pollutants in Aqueous Solutions. Nanomaterials 2022, 12, 2654. [Google Scholar] [CrossRef]
  12. Zhang, M.; Liu, J.; Tang, L.; Hu, N.; Zhang, D.; Pan, X. Fenton micro-reactor on a bubble: A novel microbubble-triggered simultaneous capture and catalytic oxidation strategy for recalcitrant organic pollutant removal. Sci. Total Environ. 2022, 835, 155556. [Google Scholar] [CrossRef]
  13. Wang, X.; Li, P.; Ning, R.; Ratul, R.; Zhang, X.; Ma, J. Mechanisms on stability of bulk nanobubble and relevant applications: A review. J. Clean. Prod. 2023, 426, 139153. [Google Scholar] [CrossRef]
  14. Goyal, R.N.; Kumar, N. Oxidation chemistry and biochemistry of 5-hydroxyindole. Oxid. Commun. 2001, 24, 563–575. [Google Scholar]
  15. Zhang, B.; You, H.; Wang, F. Microwave-enhanced catalytic wet peroxide oxidation of quinoline: The influence of pH and H2O2 dosage and identification of reactive oxygen species. RSC Adv. 2017, 7, 14769–14775. [Google Scholar] [CrossRef]
  16. Ning, R.; Yu, S.; Li, L.; Snyder, S.A.; Li, P.; Liu, Y.; Togbah, C.F.; Gao, N. Micro and nanobubbles-assisted advanced oxidation processes for water decontamination: The importance of interface reactions. Water Res. 2024, 265, 122295. [Google Scholar] [CrossRef] [PubMed]
  17. Yu, F.; Chen, Y.; Pan, Y.; Yang, Y.; Ma, H. A cost-effective production of hydrogen peroxide via improved mass transfer of oxygen for electro-Fenton process using the vertical flow reactor. Sep. Purif. Technol. 2020, 241, 116695. [Google Scholar] [CrossRef]
  18. Qiu, S.; Tang, W.; Yang, S.; Xie, J.; Yu, D.; Garcia-Rodriguez, O.; Qu, J.; Bai, S.; Deng, F. A microbubble-assisted rotary tubular titanium cathode for boosting Fenton’s reagents in the electro-Fenton process. J. Hazard. Mater. 2022, 424, 127403. [Google Scholar] [CrossRef]
  19. He, S.; Zhao, S.; Chen, Z.; Li, X.; Ma, Y.; Ren, Y.; Duan, X. Enhanced in situ production of Fenton reagent’s by nanobubble aeration and sacrificial iron anodes in the electro-Fenton process. Electrochem. Commun. 2024, 158, 107640. [Google Scholar] [CrossRef]
  20. Jia, M.; Farid, M.U.; Kharraz, J.A.; Kumar, N.M.; Chopra, S.S.; Jang, A.; Chew, J.; Khanal, S.K.; Chen, G.; An, A.K. Nanobubbles in water and wastewater treatment systems: Small bubbles making big difference. Water Res. 2023, 245, 120613. [Google Scholar] [CrossRef]
  21. Lyu, T.; Wu, S.; Mortimer, R.J.G.; Pan, G. Nanobubble Technology in Environmental Engineering: Revolutionization Potential and Challenges. Environ. Sci. Technol. 2019, 53, 7175–7176. [Google Scholar] [CrossRef] [PubMed]
  22. Wang, X.; Jia, J.; Wang, Y. Combination of photocatalysis with hydrodynamic cavitation for degradation of tetracycline. Chem. Eng. J. 2017, 315, 274–282. [Google Scholar] [CrossRef]
  23. Lu, T.; Chen, F. Bond Order Analysis Based on the Laplacian of Electron Density in Fuzzy Overlap Space. J. Phys. Chem. A 2013, 117, 3100–3108. [Google Scholar] [CrossRef] [PubMed]
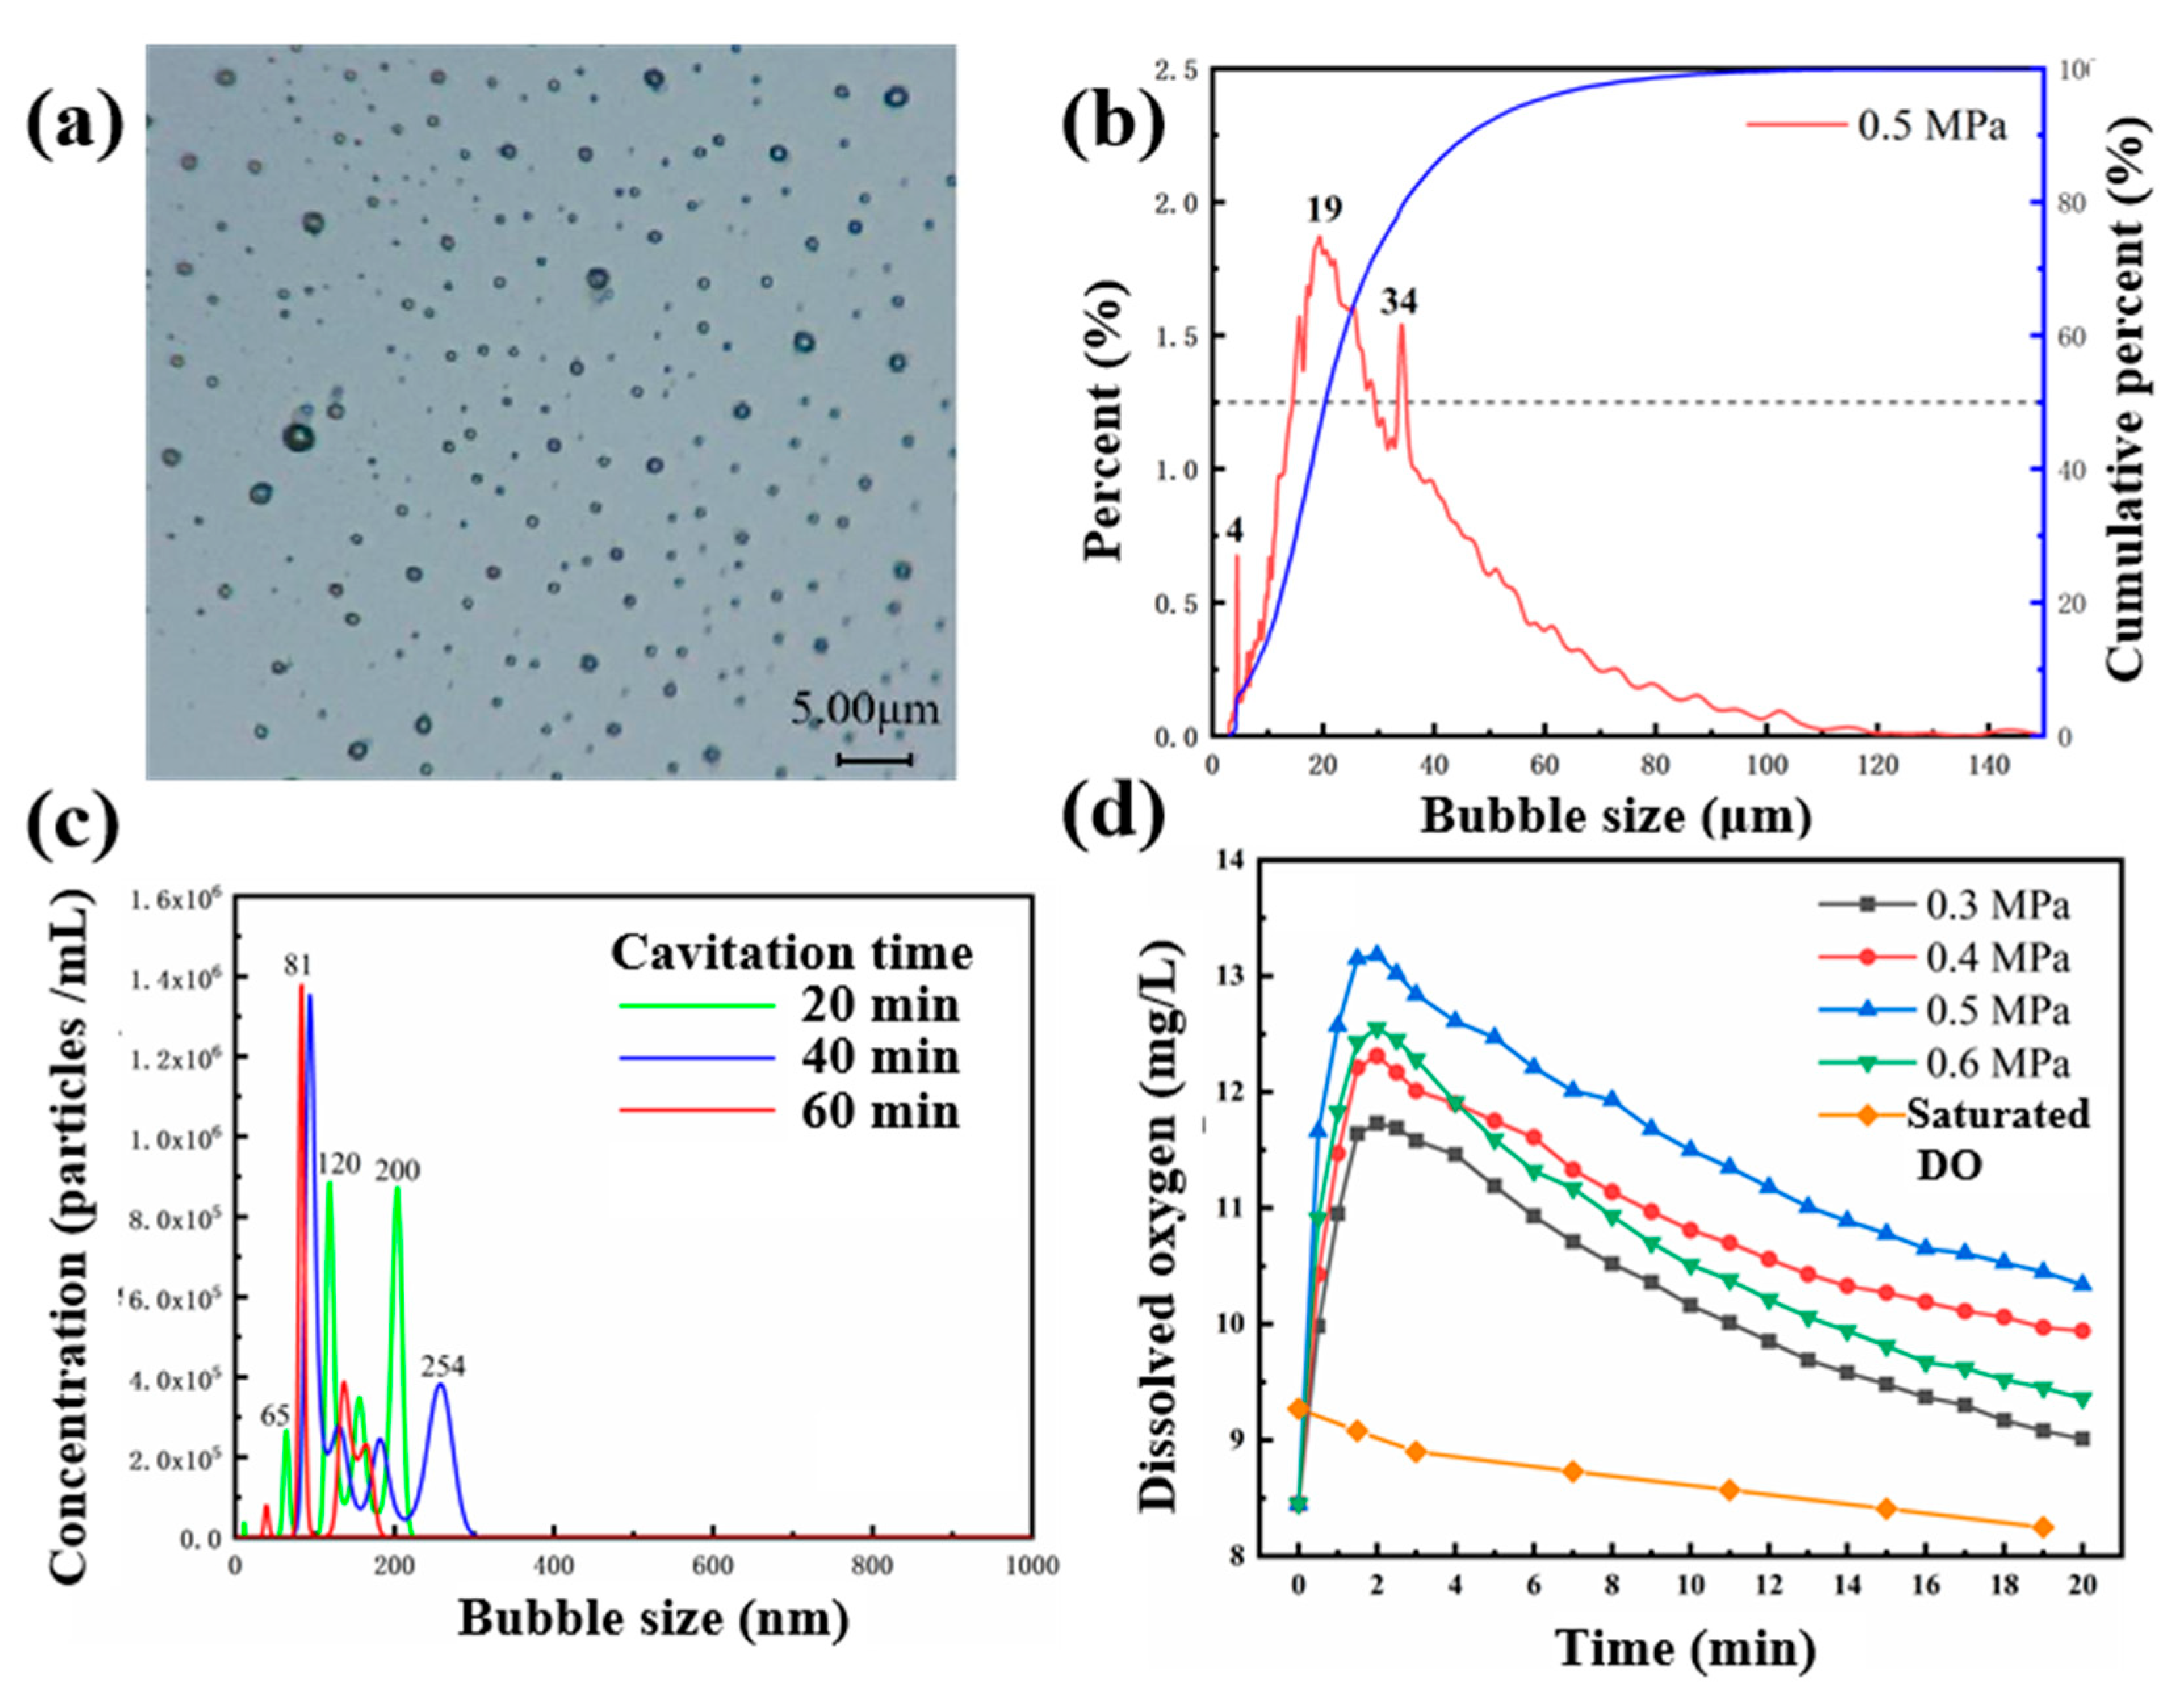
Figure 1. (a) Bubble distribution from the 3D microscopy, (b) size distribution of microbubbles, (c) size distribution and concentration of nano bubbles at different MNB generator cycle times, and (d) DO at different outlet pressures, the orange line was the saturated DO as a comparison.
Catalysts 15 00888 g001
Figure 2. (a) The removal efficiency of indole with time, and (b) the reaction rate constant of the conventional Fenton, MNBs, and the FT-MNB systems.
Catalysts 15 00888 g002
Figure 3. Effect of (a) inlet pressure of the MNB generator, (b) H2O2 dosage, (c) pH, and (d) Fenton molar ratio on the degradation of indole by FT-MNB systems.
Catalysts 15 00888 g003
Figure 4. ESR spectra in (a) pure water and the HC system, and (b) HC, conventional Fenton, and FT-MNBs.
Catalysts 15 00888 g004
Figure 5. Possible pathways of indole degradation by FT-MNBs.
Catalysts 15 00888 g005
Figure 6. The structure of (a) H2O2, (b) H2O2 and Fe in the conventional Fenton process, (c) H2O2 at the interface of a nano bubble, and (d) H2O2 and Fe at the interface of a nano bubble.
Catalysts 15 00888 g006
Figure 7. The differential charge density of (a) H2O2 and Fe in the conventional Fenton process and (b) H2O2 and Fe at the interface of a nano bubble.
Catalysts 15 00888 g007
Figure 8. Mechanism of pollutant degradation by FT-MNBs.
Catalysts 15 00888 g008
Figure 9. Effect of (a) the initial COD of the industrial coking wastewater and (b) pH on COD removal efficiency.
Catalysts 15 00888 g009
Table 1. Properties of industrial coking wastewater.
COD
(mg/L)
pHChromaK+
(mg/L)
NH4+
(mg/L)
Na+
(mg/L)
Ca2+
(mg/L)
F
(mg/L)
Cl
(mg/L)
SO42−
(mg/L)
10,020~10,760 9.105026.7753.731698.23100.26106.791043.04397.34
Table 2. Comparison of reagent costs of conventional Fenton and FT-MNB systems.
ReagentsPrice (¥/kg)Conventional FentonFT-MNBs
DosageCost (¥)DosageCost (¥)
H2O210.180.180.180.18
FeSO40.630.020.010.020.01
H2SO40.950.60.570.30.29
NaOH2.850.250.710.080.23
Energy (kWh)0.85000.40.34
Total 1.47 1.05
Disclaimer/Publisher’s Note: The statements, opinions and data contained in all publications are solely those of the individual author(s) and contributor(s) and not of MDPI and/or the editor(s). MDPI and/or the editor(s) disclaim responsibility for any injury to people or property resulting from any ideas, methods, instructions or products referred to in the content.