Article

Comparison of Quadratic vs. Langmuir–Hinshelwood Kinetics for Formic Acid Mineralization in a Photocatalytic Film

1
Department of Civil, Chemical, Environmental, and Materials Engineering, University of Bologna, Via Terracini 28, 40131 Bologna, Italy
2
Dipartimento di Ingegneria Industriale, University of Trento, Via Sommarive 9, 38123 Trento, Italy
3
Dipartimento di Ingegneria, University of Palermo, Viale Delle Scienze Ed. 6, 90128 Palermo, Italy
*
Author to whom correspondence should be addressed.
Catalysts 2025, 15(9), 887; https://doi.org/10.3390/catal15090887
Submission received: 31 July 2025 / Revised: 1 September 2025 / Accepted: 9 September 2025 / Published: 15 September 2025
(This article belongs to the Section Computational Catalysis)

Abstract

A plane reactor illuminated by LEDs was used to study the kinetics of the photocatalytic mineralization of formic acid in a TiO2 film. Two of the most widespread types of kinetics were considered to see if their popularity is deserved. More specifically, one-parameter quadratic-type and Langmuir–Hinshelwood-type kinetics were compared against the concentration–time experimental data at different levels of illumination. Closed-form solutions, which allow for the calculation of substrate concentration over time, were derived for the application of the integral method of kinetic analysis. The considered factors, which affect the reaction rate, were the substrate concentration and the rate of photon absorption (RPA) and were varied in order to investigate most of the possible kinetic regimes. The possible onset of limitations due to external and internal mass transfer and transport of the photons was analyzed and discussed. Thanks to the absence of such limitations in the system under examination, it was possible to appraise the “intrinsic” kinetics directly. Both the models were apt to fit the observed decrease in the substrate concentration with time, even if with different soundness. However, substantial differences between the two models were evidenced in the capabilities to reliably reproduce the effects of the RPA.

1. Introduction

Kinetics of photocatalytic reactions is a topic still being widely investigated and discussed [1,2,3,4,5,6,7,8,9,10,11], mainly because its knowledge is essential for the design and/or the analysis of the reactor, including the satisfactory utilization of the radiant energy or of the reactor space and the optimization of the photocatalyst amount; the evaluation of the photocatalytic activity; the comparison with other photocatalytic systems; and the possible validation of a reaction mechanism.
A large number of kinetic mechanisms have been proposed, including pseudo-zeroth-/first-/second-order, Eley–Rideal, Langmuir–Freundlich, Langmuir–Hinshelwood, quadratic models, power-law forms, etc. The characteristics and features of these mechanisms are presented and discussed in some articles and reviews on the subject (see e.g., [5,6,7,8]). Langmuir- and quadratic-type mechanisms have been the most successful so far [5], at least for their extensive utilization [5,6,7,8,9,10,11]. Among the different versions of the quadratic-type kinetic equations, the one developed by Minero and coworkers [12] sparked interest because, despite its simplicity (it has only one kinetic parameter), it offers the possibility to predict explicitly the effects of virtually all the relevant factors, such as the rate of photon absorption and the substrate concentration [13]. Therefore, in the present work, we chose to focus our attention on the “Minero Quadratic type”, MQT, and the “Langmuir–Hinshelwood type”, LHT, kinetic equations for the description of the degradation of formic acid, FA, in a photocatalytic film. It is worth noting that the utilization of photocatalytic films avoids the problematic and costly post-process recovery of the photocatalytic particles, which is the main drawback when working with slurries of fine photocatalytic powders. So, photocatalytic films represent probably the most promising system for practical applications of photocatalysis.
The objective of the work was to point out the differences, merits, and faults of the two kinetic models through the kinetic analysis carried out with both the kinetic models on the experimental data obtained in a plane reactor illuminated by UVA LEDs.
Particular attention was paid to avoiding errors that might undermine the analysis. For instance, it cannot be ignored that a correct kinetic analysis requires that the experimental data be obtained in systems free of mass transport limitations and limitations due to the uneven distribution of photons. As regards this latter type of limitations, it is observed that the interaction of the photons with matter adds complexity to any photoactivated reacting systems. The first law of photochemistry [14], which dates from the first half of the nineteenth century or earlier, asserts that light must be absorbed by a compound in order for a photochemical reaction to take place. So, photons, which in some way act as “immaterial reactants” [15,16,17,18], “materialize” and become usable by the reaction only when absorbed [19]. The second law of photochemistry, the Stark–Einstein law, is a photoequivalence law. It states that “every atom or molecule which takes part in a chemical reaction absorbs one quantum of the radiation which induces the reaction.”. This law implies that the reaction rate must depend on the “rate of photon absorption” with the quantum yield that indicates the effectiveness of the possible activation of the reaction [20]. As a consequence, the relevant kinetic factor in the kinetic equation must be an intensive variable, which measures the rate of photon absorption. The best choice for this intensive variable is the specific, i.e., per unit of photocatalyst mass, rate of photon absorption, SRPA or φ ^ . An alternative is the volumetric rate of photon absorption. The adoption of the radiation intensity, or worse, of the impinging intensity, in substitution of these intensive variables as a factor in the kinetic equation is a common practice, but obviously it is not accurate. In fact, it does not directly consider the phenomenon of photon absorption, and hence, it disregards to some extent the laws of photochemistry. So, the absorption of photons is certainly an essential step for the activation of the reaction, but it inevitably makes the radiation field non-uniform inside the reactor. Unfortunately, the local values of the rate of photon absorption cannot be measured, due not only to technical difficulties but also to the “observer effect”. As a consequence of the SRPA nonuniformity, the rate of reaction also varies even in the presence of a uniform substrate concentration, with the practical impossibility of experimentally measuring its distribution. At best, it is expected that just the average of the specific rate of photon absorption, φ ^ , and the average of the specific rate of reaction, R ^ , could be measured or “observed”, but the knowledge of R ^ vs. φ ^ does not generally give consistent information about the “intrinsic” kinetics unless certain rules are respected [21,22,23]. As previously mentioned, the possible internal and external mass transfer limitations [24,25,26,27], which are usually not present when operating with photocatalytic slurries, might also severely affect the observed rate of reaction in photocatalytic films. Unfortunately, many kinetic studies simply ignore these problems, in particular the effects of the SRPA nonuniformity, with the consequence that it is not possible to know the reliability of the results and conclusions. In the current work, it is shown how to verify that mass and photon transport limitations are negligible, so that the system becomes “kinetically observable”. The operating conditions adopted in the current work, which involve a relatively wide variation of the initial substrate concentration and of the level of illumination, allowed us to cover a significant part of the possible kinetic regimes without these limitations affecting the results. It was therefore possible to carry out a sound analysis and comprehensive comparison, based on the capabilities of the two kinetic models of not only fitting the experimental data but also respecting some well-established behaviors or rules of photocatalytic reactions.

2. Results and Discussion

In each experimental run, the FA concentration was measured at different times to obtain substrate concentration, C S , vs. time data that were processed with the integral method of kinetic analysis. In 26 runs, characterized by different combinations of the initial substrate concentration and of the level of illumination (see Figure S1 and Table S1 in the Supplementary Material), a total of 158 experimental C S vs. time data were obtained. The values of the initial substrate concentration and of the level of illumination were chosen to obtain thorough information about the effects of these two factors. In fact, in the 26 runs, the values of the dimensionless parameter S R P A * , which gives a measure of the level of illumination, span over two orders of magnitude (see Figure S2) and the values of the Damköhler number, Da, vary by an order of magnitude (see Figure S3).
As stated in the introduction, a correct kinetic analysis must take into account also all the intervening phenomena that are not directly related to the intrinsic kinetics but could affect the observed rate of disappearance of the substrate. For a photocatalytic reaction in a film, these phenomena are the internal and external mass transfer of the substrate and the transport of the photons into the film. Usually, in photocatalysis, it is rather complex and uncertain to quantify their weight on the observed rate, so it is preferable to operate in conditions such as to make their effects negligible.

2.1. Kinetic Models

Let R ^ = f C S , φ ^ be the constitutive equation (i.e., the kinetic equation) of R ^ , the intrinsic specific reaction rate, which in general depends on C S , the molar concentration of the substrate (FA in the current case), and on φ ^ , the specific rate of photon absorption (SRPA). The “intrinsic kinetics” is the rate that takes into account only the events occurring at a molecular level. It is invariant with respect to all the phenomena (such as internal and external mass transfer and radiant energy transport), which take place on a macroscopic scale in a real reactor and may mask the actual intrinsic rate.
As specified in the title, two different types of kinetics were taken into account to describe the experimental data obtained in the system under investigation. The first is a Langmuir–Hinshelwood-type, LHT, kinetics:
f C S , φ ^ = K max φ ^ K L φ ^ C S 1 + K L φ ^ C S   R ^ C S , φ ^ = K max φ ^ K L φ ^ C S 1 + K L φ ^ C S
or
R ^ C S , φ ^ = K max φ ^ C S K S φ ^ + C S   with   K S φ ^ = 1 / K L φ ^
where K max φ ^ , K L φ ^ , K S φ ^ are kinetic constants. It is now unanimously recognized that these kinetic constants should depend on φ ^ . It is worth noting that the mechanism, which can be associated with the LHT kinetics, is not necessarily the classic Langmuir–Hinshelwood mechanism, which is inaccurate in photocatalysis, and is not unique, since in photocatalysis, different mechanisms lead to the same final kinetic equation [28].
The second kinetics considered here is the quadratic-type kinetics, MQT, which was proposed by Minero and coworkers [12]:
f C S , φ ^ = k C S 1 + 2 φ ^ k C S 1   R ^ C S , φ ^ = k C S 1 + 2 φ ^ k C S 1
with k = k C O x , where k is a kinetic constant and C O x is the oxygen concentration. If, as usual, the oxygen concentration does not vary, k too is a constant. MQT equation can be considered a particular case of the more generic quadratic-type equation introduced by Gerisher [15]: R ^ C S , φ ^ = K 1 C S 1 + K 2 2 φ ^ C S 1 . The Gerisher equation and the MQT equation become the same when it is assumed that K 1 = k and K 2 = 1 / K 1 .
Looking at the formulation of the MQT and the LHT kinetic equations, it is apparent that they are really dissimilar. However, Figure 1 shows that, despite the formal differences, the effect of the substrate concentration on the reaction rate at constant φ ^ is almost the same.
As a consequence, the ability of the two kinetic models to fit R ^ vs. C S data is almost the same. Due to the similarity of the two curves in Figure 1, the differential method of kinetic analysis [29] cannot give a clear distinction between the two kinetic models and no advantage derives from its utilization. Conversely, the integral method of kinetic analysis is not affected by the amplification of experimental errors and noise in the derivatives of experimental data, which is typical of the differential method and offers the possibility to evaluate more accurately the kinetic parameters. However, the integral method would preferably require an analytical solution to the integration of the mass balance equation, which is not always viable. Weighing the pros and cons, the integral method appears much more suitable for the type of kinetics in question, in particular if the analytical solution is available; nonetheless, most kinetic studies still adopt the differential method [5]. The analytical solutions for both models will be shown later on. For these reasons, the integral method has been adopted in the present work. As is well known, it consists of assuming a given kinetic equation, integrating the mass balance of the substrate over time, and finally calculating the values of the fitting parameters, which best fit the equation obtained by the integration to the experimental C S vs. time data.
The effect of the SRPA on the rate of reaction is explicit in the MQT equation, which entails an apparent first-order behavior with the SRPA at low levels of illumination and a 0.5 apparent order behavior at high levels, as is experimentally observed in photocatalysis. On the contrary, the SRPA is not a kinetic factor that originally appeared explicitly in the LHT equation, but now it has been accepted that the LHT kinetic constants must depend on the SRPA. Concerning this aspect, various approaches and relationships have been proposed [5,30,31,32], some theoretical and others phenomenological, typically on the basis of the experimentally observed behavior, but none of these expressions clearly prevailed. So the values of LHT kinetic constants were derived here without assuming a priori any type of dependence of them on the SRPA.

2.2. Analysis of the Possible Limitations Due to External Mass Transfer

The mass transfer coefficient in the liquid solution can be evaluated using the relationship proposed by Vezzoli et al. [25] for a very similar geometry of the reactor with a photocatalytic film. As illustrated in Section S3 of the Supplementary Material, the mass transfer coefficient of FA turns out to be k m , FA = 5.66 × 10 5 m/s.
Of course, it is expected that the most important drop of the substrate (FA) concentration, Δ C S , from the bulk of the solution to the film–solution interface is reached at the highest value of the molar flux of FA, n ˙ F A , i , at the film–solution interface. Assuming the very likely approximation of pseudo-steady state conditions, this quantity can be estimated as n ˙ F A , i = n ˙ F A , g A i , where n ˙ F A , g = R ^ × w is the molar rate of disappearance of FA due to the photocatalytic reaction, w is the mass of the catalyst in the illuminated film, and A i is the superficial area of the interface (0.0167 m2).
The highest value of the rate of disappearance of FA (2.11 × 10⁻⁵ mmol/s) was measured at the highest values of the rate of photon absorption (≈2.6 × 10⁻⁸ einstein/s with an einstein that indicates one mole of photons, i.e., a number of photons equal to Avogadro’s number) and FA concentration (≈6 mM). In this case, n ˙ F A , i = 2.11 × 10 5 0.0167 = 1.26 × 10 3 mmol m 2 s .
So, Δ C S = n ˙ F A , i k m , F A = 1.26 × 10 3 5.66 × 10 5 = 22.3 m m o l / m 3 = 0.0223 m M , a value that represents just 0.37% of the bulk concentration (6 mM). It can be concluded that external mass transfer limitations are negligible and C S , * C S , b u l k , where C S , * is the FA concentration at the film–solution interface and C S , b u l k is the FA concentration in the bulk of the solution.
An experimental test was performed to confirm the absence of external mass transfer limitations. Two runs were carried out at different flow rates (1.125 L/min and 0.844 L/min), but at the same initial substrate concentration and level of illumination. The slope of the substrate concentration vs. time curve (see Figure S5 in the Supplementary Material) was virtually unmodified by the change of the flow rate, thus proving that external mass transfer is not limiting.

2.3. Analysis of the Possible Limitations Due to Internal Mass Transfer and Due to Transport of the Photons in the Film

The observed rate of reaction may also be affected by limitations due to internal mass transport and radiative transfer of the photons in the film. The transport of the photons and of the substrate inside the film may take place in the same direction (parallel flow, PF) or in opposite directions (counter flow, CF) [24]. PF is active in the present experimental runs, unless otherwise indicated. The MQT kinetics explicitly gives the dependence of the rate of reaction on the rate of photon absorption, and for this reason, the MQT model will be used for the present analysis. The approach for the evaluation of the average reaction rate in the film and of the effectiveness factor is the same adopted in [24] for a simplified kinetics. The procedure in the case of MQT kinetics and uniform illumination is illustrated in Section S4 of the Supplementary Material. Note that the illumination is uniform thanks to the diffusion of light granted by the sand-blasted surfaces of the glass window. It turns out that the observed rate of reaction and the effectiveness factor depend on three dimensionless parameters:
  • The optical thickness, τ , defined as τ = κ δ , where κ is the absorption coefficient of the radiation and δ is the geometrical thickness of the film. The optical thickness represents the ratio of the geometrical thickness to the mean depth of penetration of the photons into the film. Therefore, at relatively low values of τ , it is expected that the transport of photons is not limiting.
  • The Thiele modulus, ϕ , defined as ϕ = δ 2 R C S , * , φ ^ 0 D e f f C S , * , where R is the volumetric rate of reaction, C S , * is the substrate concentration at the film–solution interface, φ ^ 0 is the specific rate of photon absorption at the film–solution interface, and D e f f is the effective diffusion coefficient of the substrate inside the film. The Thiele modulus represents the square root of the ratio of the characteristic rate of reaction to the characteristic rate of diffusion, or, analogously to the optical thickness, it represents the ratio of the geometrical thickness to the mean depth of penetration of the substrate into the film (see Section S5 of the Supplementary Material and [23]). Therefore, at relatively low values of ϕ , it is expected that the internal transport of the substrate is not limiting.
  • The dimensionless parameter, φ ^ 0 * , defined as φ ^ 0 * = φ ^ 0 k C S , * . As previously observed, φ ^ 0 * measures the level of illumination (it represents also the reciprocal of the characteristic quantum yield).
The value of optical thickness was estimated by measurements of the fraction of light transmitted through the film. According to the Lambert–Beer law, which is a reasonable assumption to describe radiative transfer in a photocatalytic film [26], the optical thickness can be calculated as τ = ln q p , i n q p , T , where q p , i n is the entering photon flux and q p , T is the transmitted photon flux. At an electric power absorbed by LEDs of 2.54 W, the measured values of q p , i n and q p , T are 2.18 × 10⁻⁸ and 5.53 × 10⁻⁹ einstein/s, respectively, so that τ 0.7 , a relatively low value of the optical thickness.
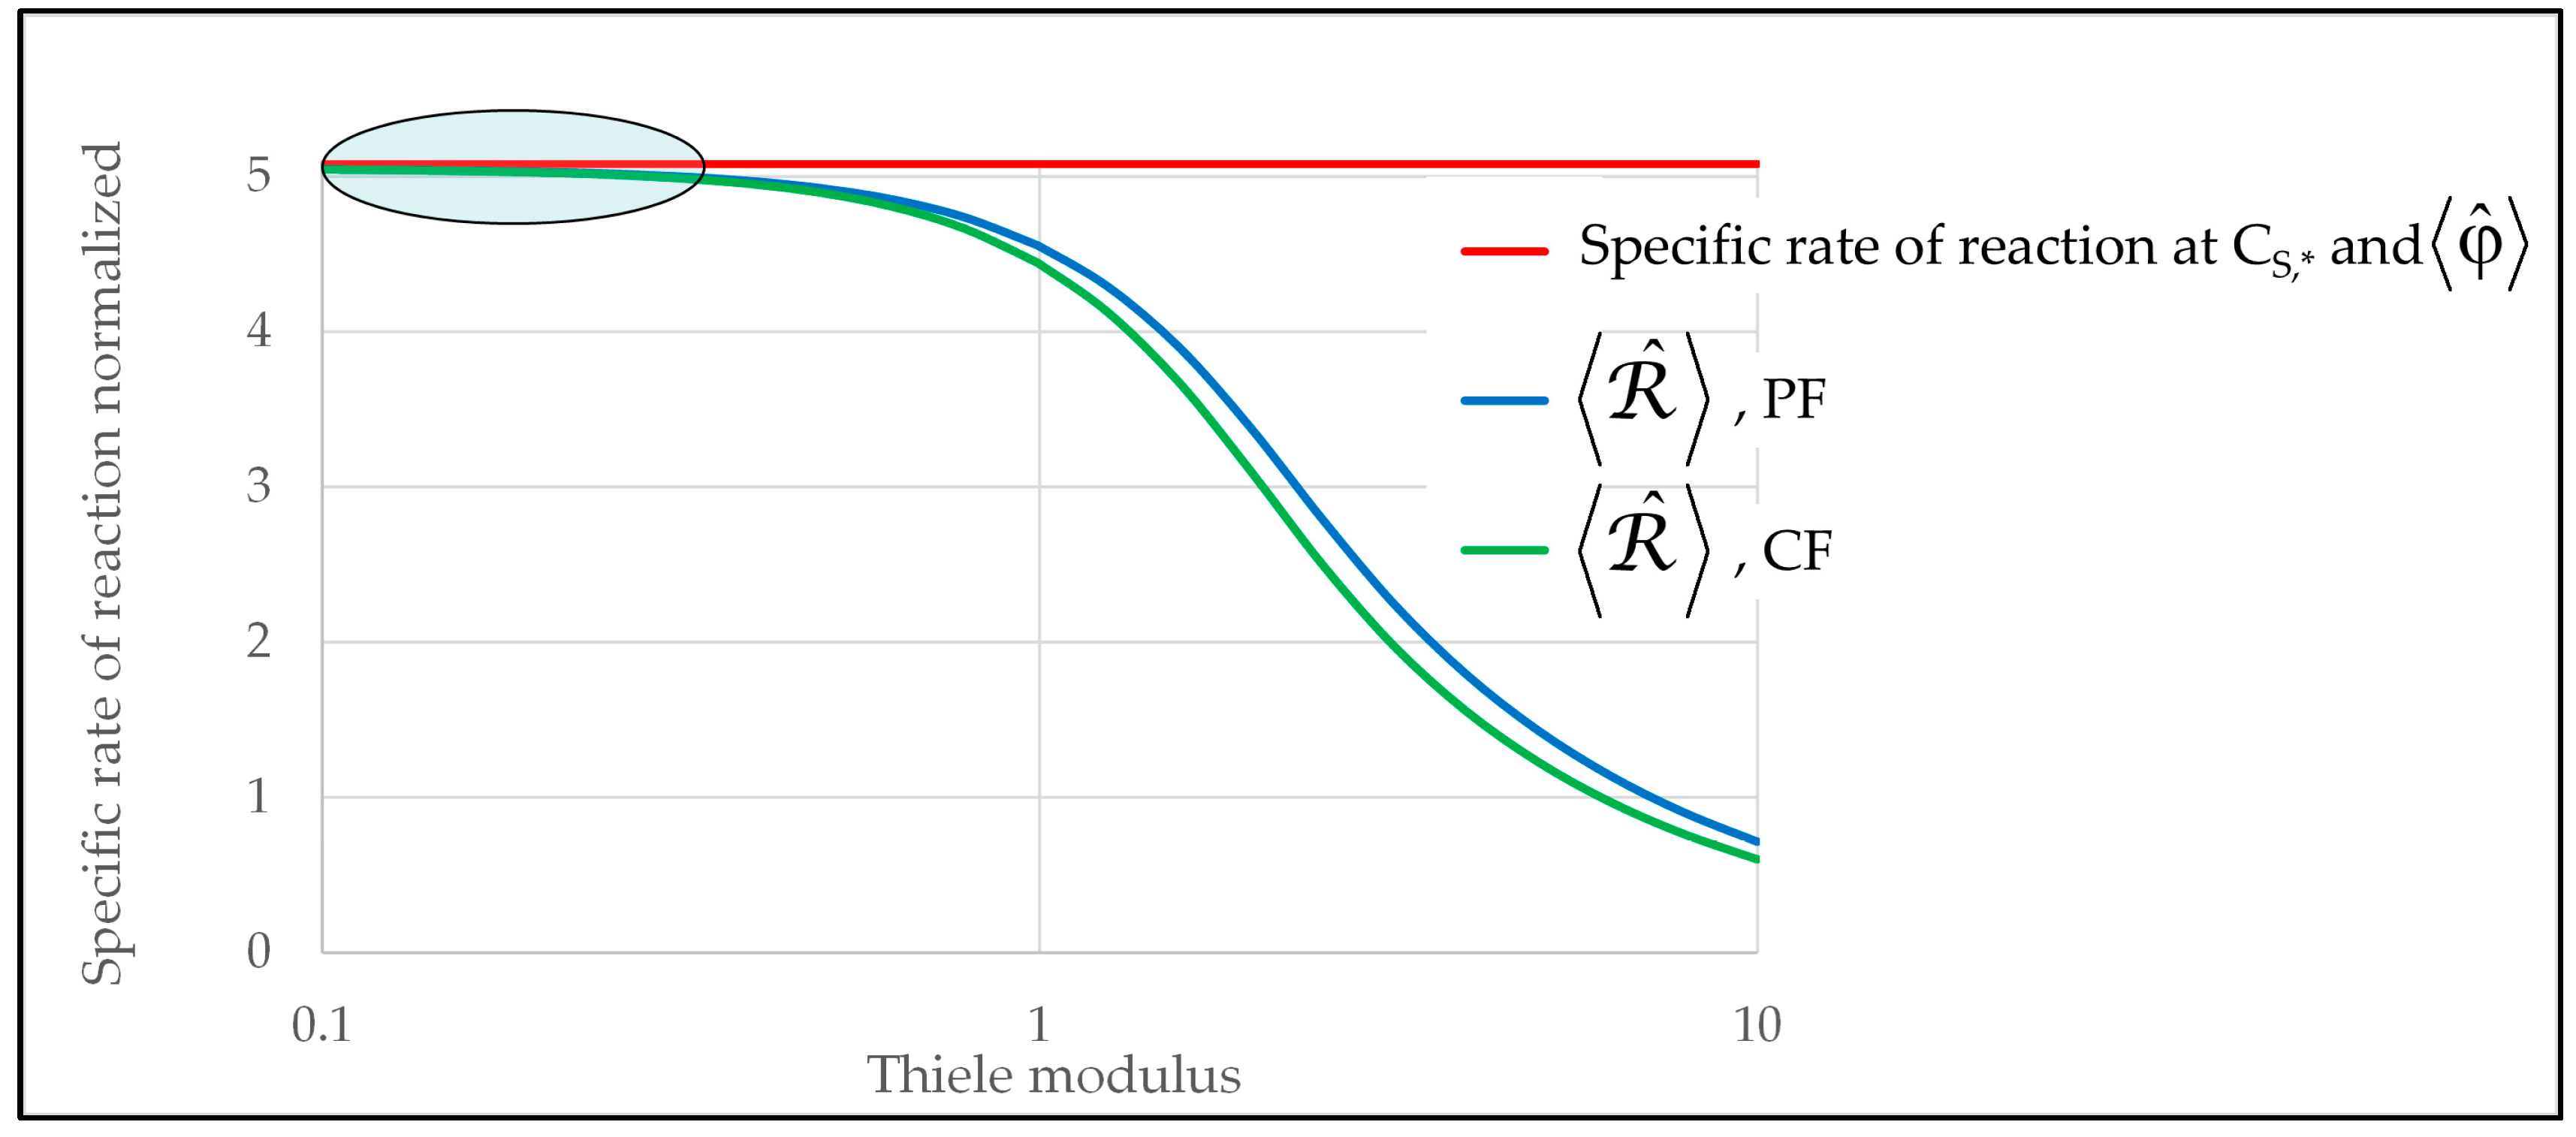
The most critical conditions for the internal mass transfer limitations are at high values of the reaction rate, that is, at high φ ^ 0 * . The highest value of φ ^ 0 * in the experimental runs is about 25, so the analysis is here carried out at φ ^ 0 * = 25. The results obtained for φ ^ 0 * = 25 and τ = 0.7 by solving the equations in Section S4 are shown in Figure 2.
The “specific rate of reaction at C S , * and φ ^ ” for the MQT kinetics is R ^ C S = C S , * , φ ^ = φ ^ = k C S , * 1 + 2 φ ^ k C S , * 1 , i.e., the rate of reaction evaluated by the expression of the intrinsic kinetics, assuming that C S = C S , * and φ ^ = φ ^ . Considering that in the present case it has been previously demonstrated that C S , * C S , bulk , it is also R ^ C S = C S , * C S , bulk , φ ^ = φ ^ k C S , bulk 1 + 2 φ ^ k C S , bulk 1 .
In Figure 2, it is apparent that, at the current relatively low value of τ ( τ = 0.7 < 1 ) and at values of ϕ less than about 0.3, the average rate of reaction in PF, the one in CF, and the “specific rate of reaction at C S , * and φ ^ ” are practically the same. It is worth pointing out that, when τ is larger than a given value (approximatively for τ > 1.5), the average rate of reaction in PF never approaches the value of the “specific rate of reaction at C S , * and φ ^ ” even as ϕ tends to 0, due to the resulting non-uniformity of the radiation field. Note that at τ = 1.5 , the absorbed radiant energy is a consistent fraction of the entering one (about 77.7%), whereas for a photocatalytic slurry [22], the limit is τ = 2.5 instead of τ = 1.5 , but with a lower fraction of absorbed radiant energy (59% for an annular reactor illuminated by a UVA fluorescent lamp and 30% for the same plane reactor here adopted illuminated by UVA LEDs).
The following values were assumed to evaluate ϕ : R ^ × w = 2.11 × 10 8 mol/s (the same critical value assumed previously for the rate of disappearance of FA), D e f f = D F A ε τ p where ε is the porosity of the film and τ p is the tortuosity of the pores; ε = 0.6 [27]; τ p = 3 [27]; D F A = 1.52 × 10 9 m 2 / s [33]; V f i l m = L × W × δ ; L, the length of the film, L = 23.4 × 10 2 m; W, the width of the film, W = 7.1 × 10 2 m; and C S , * = 6 m o l / m 3 . Due to the uncertainty in the evaluation of the film thickness, δ , conservative (i.e., relatively large) values for δ were assumed ranging from 10−9 to 10−8 m. The definition of ϕ = δ 2 R ^ × w V f i l m D e f f C S , * provides values of ϕ ranging from 0.02 to 0.06, which are anyhow largely below 0.3.
On the other hand, at φ ^ 0 * = 25, the values of R ^ experimentally measured in PF and in a run carried out operating in CF turned out to be the same, confirming that, in accordance with the curves in Figure 2, ϕ is less than 0.3.
In these conditions, it is therefore R ^ R ^ C S = C S , * = C S , bulk , φ ^ = φ ^ with R ^ C S = C S , * = C S , bulk , φ ^ = φ ^ = k C S , b u l k 1 + 2 φ ^ k C S , b u l k 1 for MQT kinetics.
In summary, the equation R ^ = f C S , b u l k , φ ^ , which is the expression of the intrinsic kinetics where just measurable quantities ( R ^ , C S , b u l k and φ ^ ) appear, is valid for every level of illumination only if (i) external mass transfer is not limiting, (ii) ϕ is sufficiently low (indicatively ϕ < 0.3 when τ = 0.7), (iii) the illumination is uniform, and (iv) τ is sufficiently low (indicatively τ < 1.5 if ϕ = 0.3). It is worth pointing out that the values of the limits reported inside the parentheses are valid for φ ^ 0 * = 25. In fact, all three dimensionless parameters affect the results, so the limit for a given dimensionless parameter normally depends on the values of the other two dimensionless parameters. By the way, at such low levels of illumination that the rate of reaction is first order with respect to φ ^ , the third and the fourth conditions are no longer necessary [21]. When all these conditions are met, as in the current case, the system is “kinetically observable”, because it is possible to carry out a simpler and reliable kinetic analysis just resorting to measurable quantities.

2.4. Application of the Integral Method of Kinetic Analysis

The first step is to consider the mass balance of the substrate in the recirculating system, which comprises the reactor, the pump, and the reservoir. Owing to the fact that the Damköhler number is largely less than 1 (see Figure S3), the conversion per passage through the reactor is very low, the reactor is differential, the substrate concentration is almost the same at any point of the recirculating solution, and the whole system behaves as perfectly mixed [23].
In this case, the mass balance is d n S d t = n ˙ S , g = R ^ × w , where n S is the number of moles of the substrate in the recirculating solution, t is the time, and n ˙ S , g is the rate of generation of S, which is negative for the disappearing substrate S. Introducing the substrate concentration, the mass balance becomes d C S d t = R ^ w V i , where C S is the molar concentration in the bulk (from this point on C S , bulk will be indicated simply as C S ), and V i is the volume of the solution for t i 1 < t < t i (i = 0 … N with N + 1 the total number of the withdrawn samples). Note that the first sampling occurs at time t = t 1 = 30 min (at this time the system is filled with the solution and is kept at dark), and the second sampling takes place at time t = t 0 = 0 (at this time the LEDs are turned on). In the time intervals between t i 1 and t i , no sampling occurs, and the volume V i remains constant. V i can be expressed as V i = V 1 Δ V × i + 1 , where V 1 (600 mL) is the volume of the solution at t = t 1 , just before the first sampling, and Δ V the volume of each withdrawn sample (4 mL).
Considering that, as seen in the previous section, R ^ R ^ C S , φ ^ , then the mass balance becomes
d C S d t = R ^ C S , φ ^ w V i   with
R ^ C S , φ ^ = k C S 1 + 2 φ ^ k C S 1   for   MQT   kinetics   and
R ^ C S , φ ^ = K max φ ^ C S K S φ ^ + C S   for   LHT   kinetics .

2.4.1. Integral Method for MQT Kinetics

By inserting the MQT kinetic equation (Equation (2)) into Equation (3), one gets
d C S d t = k C S 1 + 2 φ ^ k C S 1 w V i
or
d C S d t = R ^ w V i = k V 1 V i C S 1 + 2 φ k C S 1
where k = k × w V 1 and φ = φ ^ × w V 1 .
The solution obtained from the integration of Equation (6) from t i 1 to t i (i = 1 … N) with the proper initial condition ( C S = C S , i 1 at t i 1 ) is (for additional details, see Section S6 in the Supplementary Material):
C S , i = y 2 4 a + y
with y = a W 0 e b / a + 1 a 1 , a = 2 φ ^ / k = 2 φ / k , b = c + a ln c + a 4 φ V 1 V i t i t i 1 , c = 2 C S , i 1 a + C S , i 1 C S , i 1 + 1 and W0(x) the principal branch of the Lambert W function [34,35,36,37], also known as the product log function or the omega function.
The solution at any time within the generic time intervals t i 1 < t < t i (i = 1 … N) is obtained starting from the first (i = 1) time interval t 0 < t < t 1 with the initial condition C S = C S 0 at t = t 0 = 0 , calculating C S , 1 = C S t = t 1 , then using this last value as initial condition for the second interval and repeating these calculations for any successive time interval till the desired i-th time interval.
The fitting parameter is the product k × w , and the input parameters are the known values of the products φ ^ × w , which represent the rates of photon absorption in the film at the three different levels of illumination. Note that there is only one fitting parameter and it is not necessary to know independently the value of w.

2.4.2. Integral Method for LHT Kinetics

By inserting the LHT kinetic equation (Equation (1)) into Equation (3), one gets
d C S d t = K max φ ^ C S K S φ ^ + C S w V i
or
d C S d t = K 0 φ ^ V 0 V i C S K S φ ^ + C S
where K 0 φ ^ = K max φ ^ × w V 0 .
The solution obtained from the integration of Equation (8) from t i 1 to t i with the proper initial condition ( C S = C S , i 1 at t = t i 1 ) is (for additional details, see Section S7 in the Supplementary Material):
C S , i = K S φ ^ W 0 exp a K S φ ^ K 0 φ ^ K S φ ^ V 0 V i t i t i 1 K S φ ^
with a = K S φ ^ ln C S , i 1 + C S , i 1 and W0(x) being the principal branch of the Lambert W function.
This solution is also known as the Schnell–Mendoza equation [38], which was derived for Michaelis–Menten kinetics [37,38].
The presence of the Lambert W function in both the solutions of such different kinetic models represents an intriguing mathematical curiosity.
The fitting parameters are K S , φ ^ × w and the products K max , φ ^ × w × w at the three different levels of illumination, each one characterized by a given value of RPA = φ ^ × w (in total, six fitting parameters). Note that also for the LHT kinetics, it is not necessary to know independently the value of w.

2.5. Best Fitting, Assessment of the Kinetic Parameters, and Discussion

The non-linear least squares method with minimization of the sum of the squares of the errors, carried out by the generalized reduced gradient method [39], was used to calculate the values of the fitting parameters (the kinetic constants). The model equations for the fitting of the experimental C S vs. time experimental data were the two relationships, one for each kinetic model, obtained in Section 2.4.1 and Section 2.4.2 by the integration of the mass balance.
For the MQT, the fitting was applied to the whole set composed of the 158 C S vs. time data obtained in the 26 experimental runs to obtain the value of the single fitting parameter (the product k × w ).
It is known that in the LHT model, the two kinetic constants K max and K S depend on φ ^ , but there is no general agreement on which kind of dependence they have. Therefore, in absence of a well-established dependence, it was preferred to use the fitting procedure on the individual data set associated with each of the three levels of illumination. This approach allowed to evaluate the two fitting parameters K S , φ ^ × w and K max , φ ^ × w × w for every value of φ ^ × w .
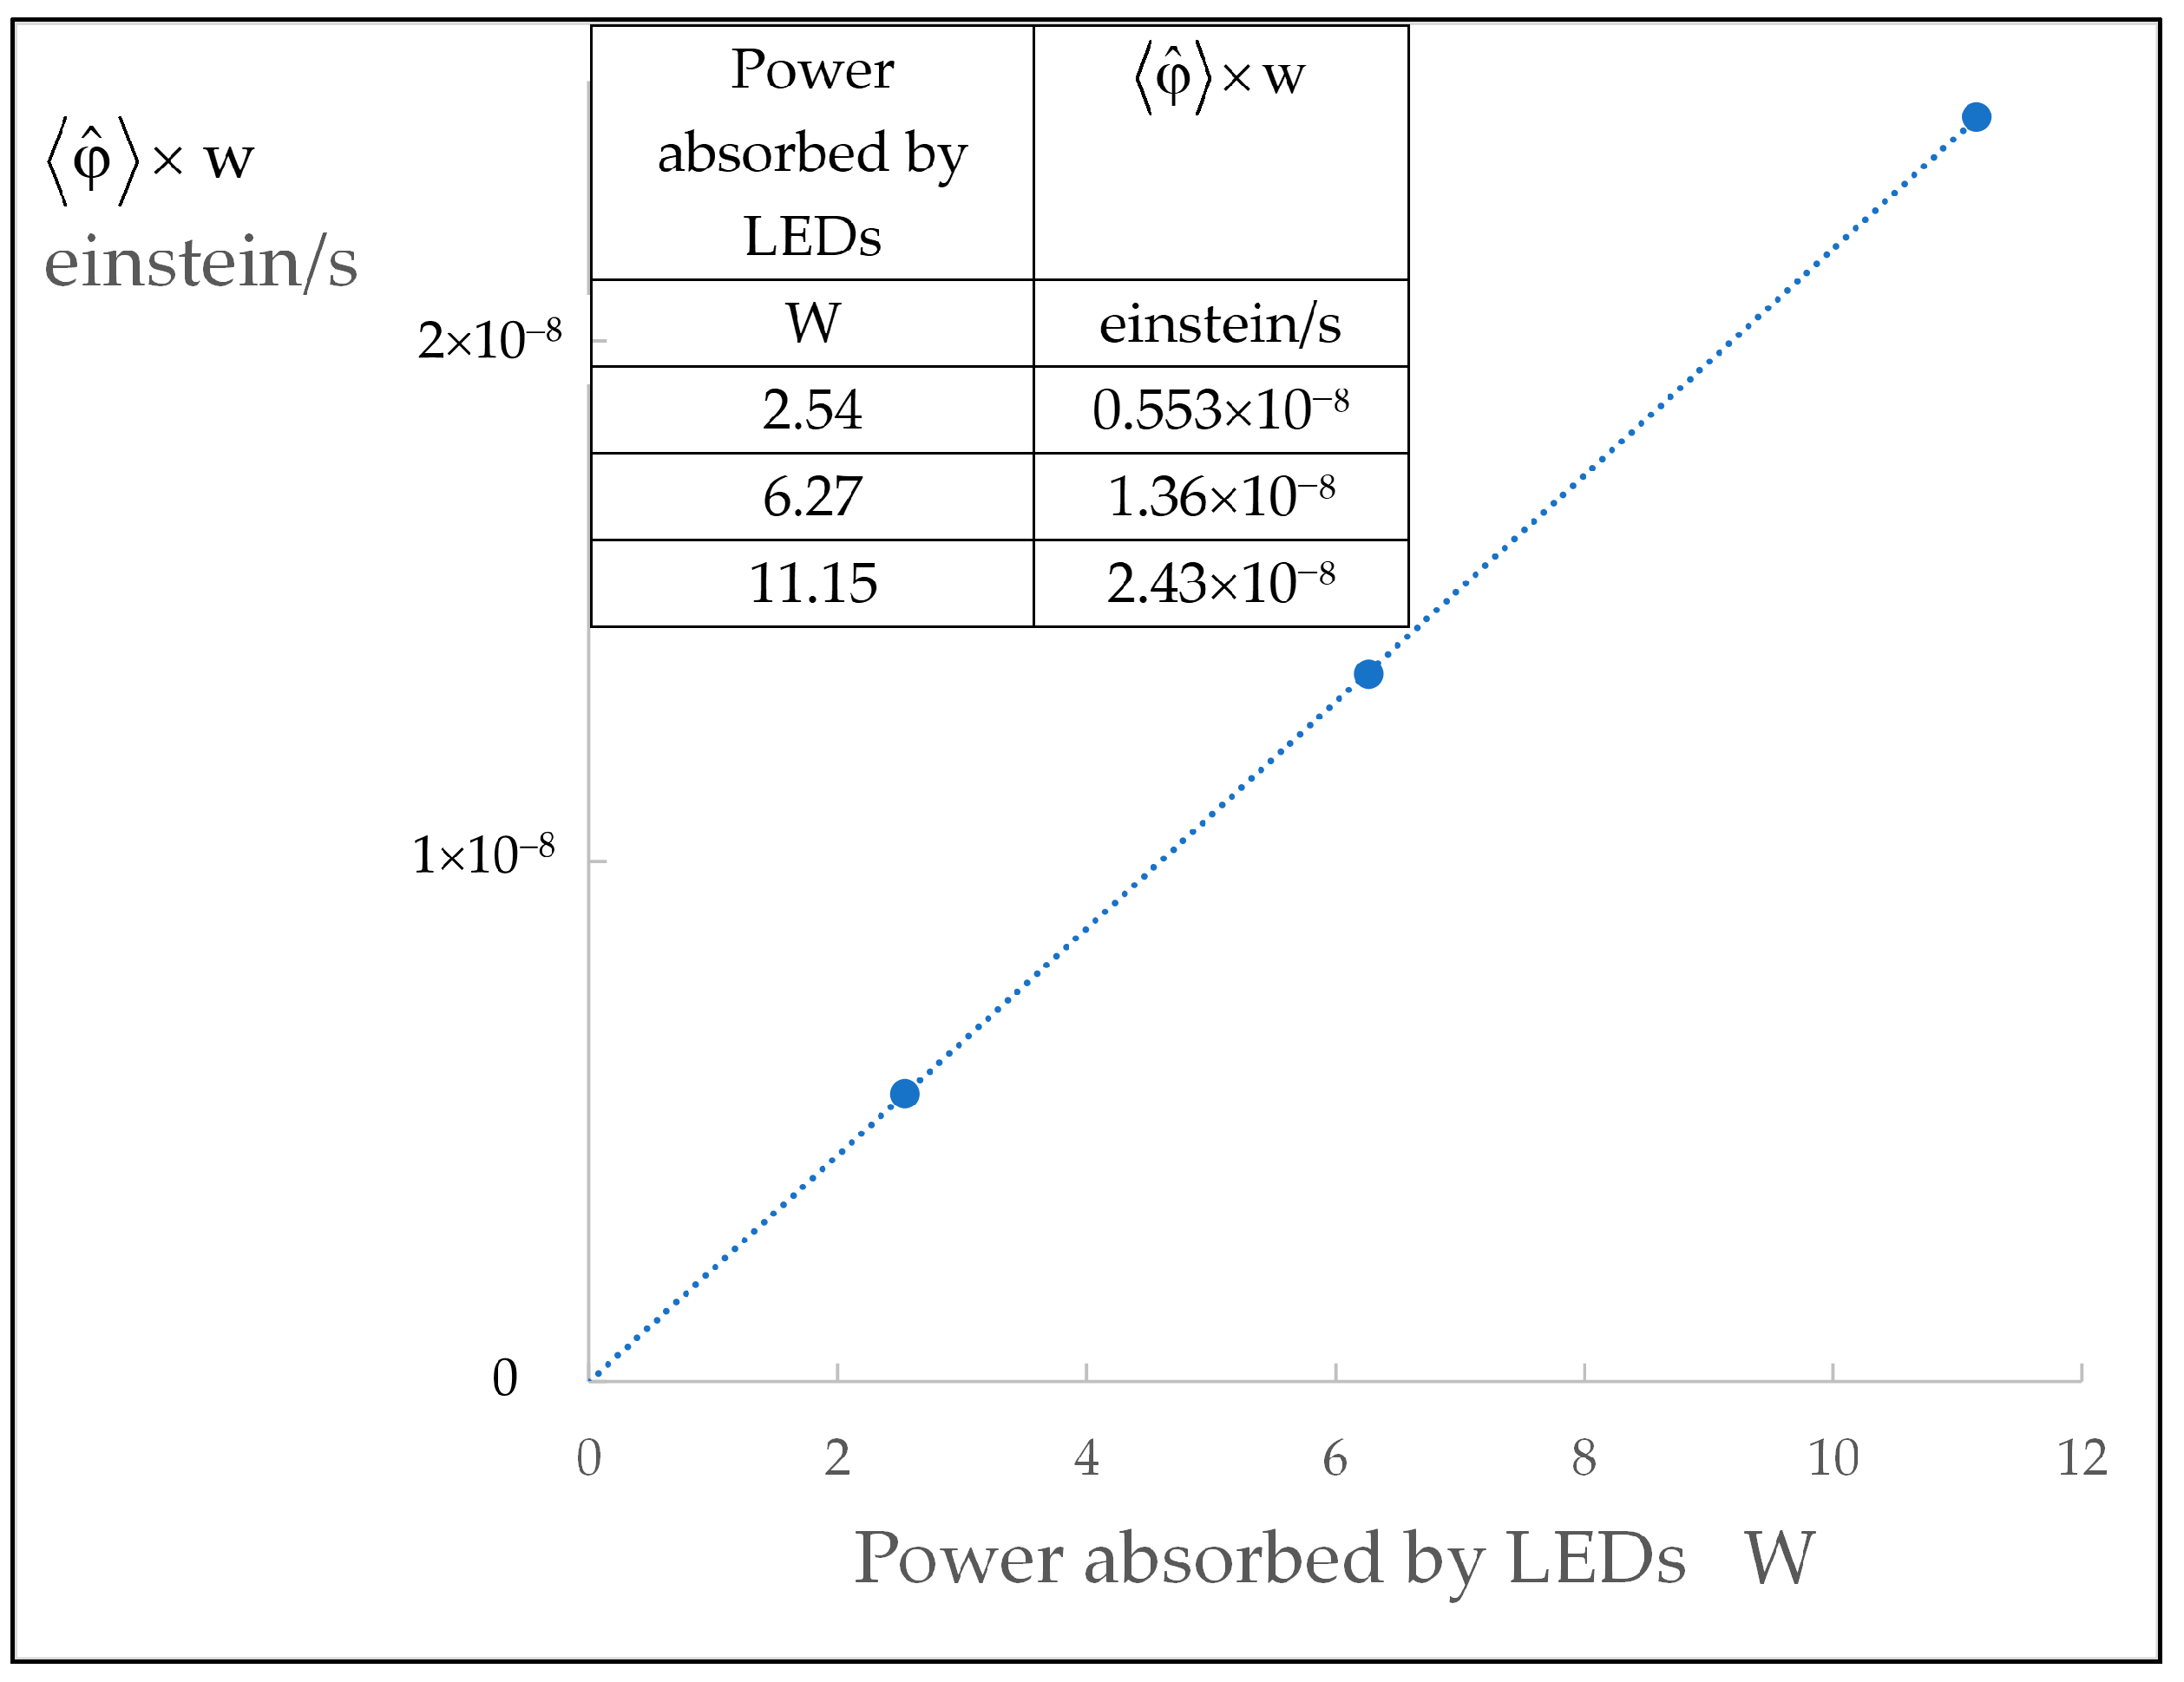
The three values of φ ^ × w (see Figure 3) were calculated from radiometric measurements as the difference between the photon rate entering the film and the photon rate transmitted through it.
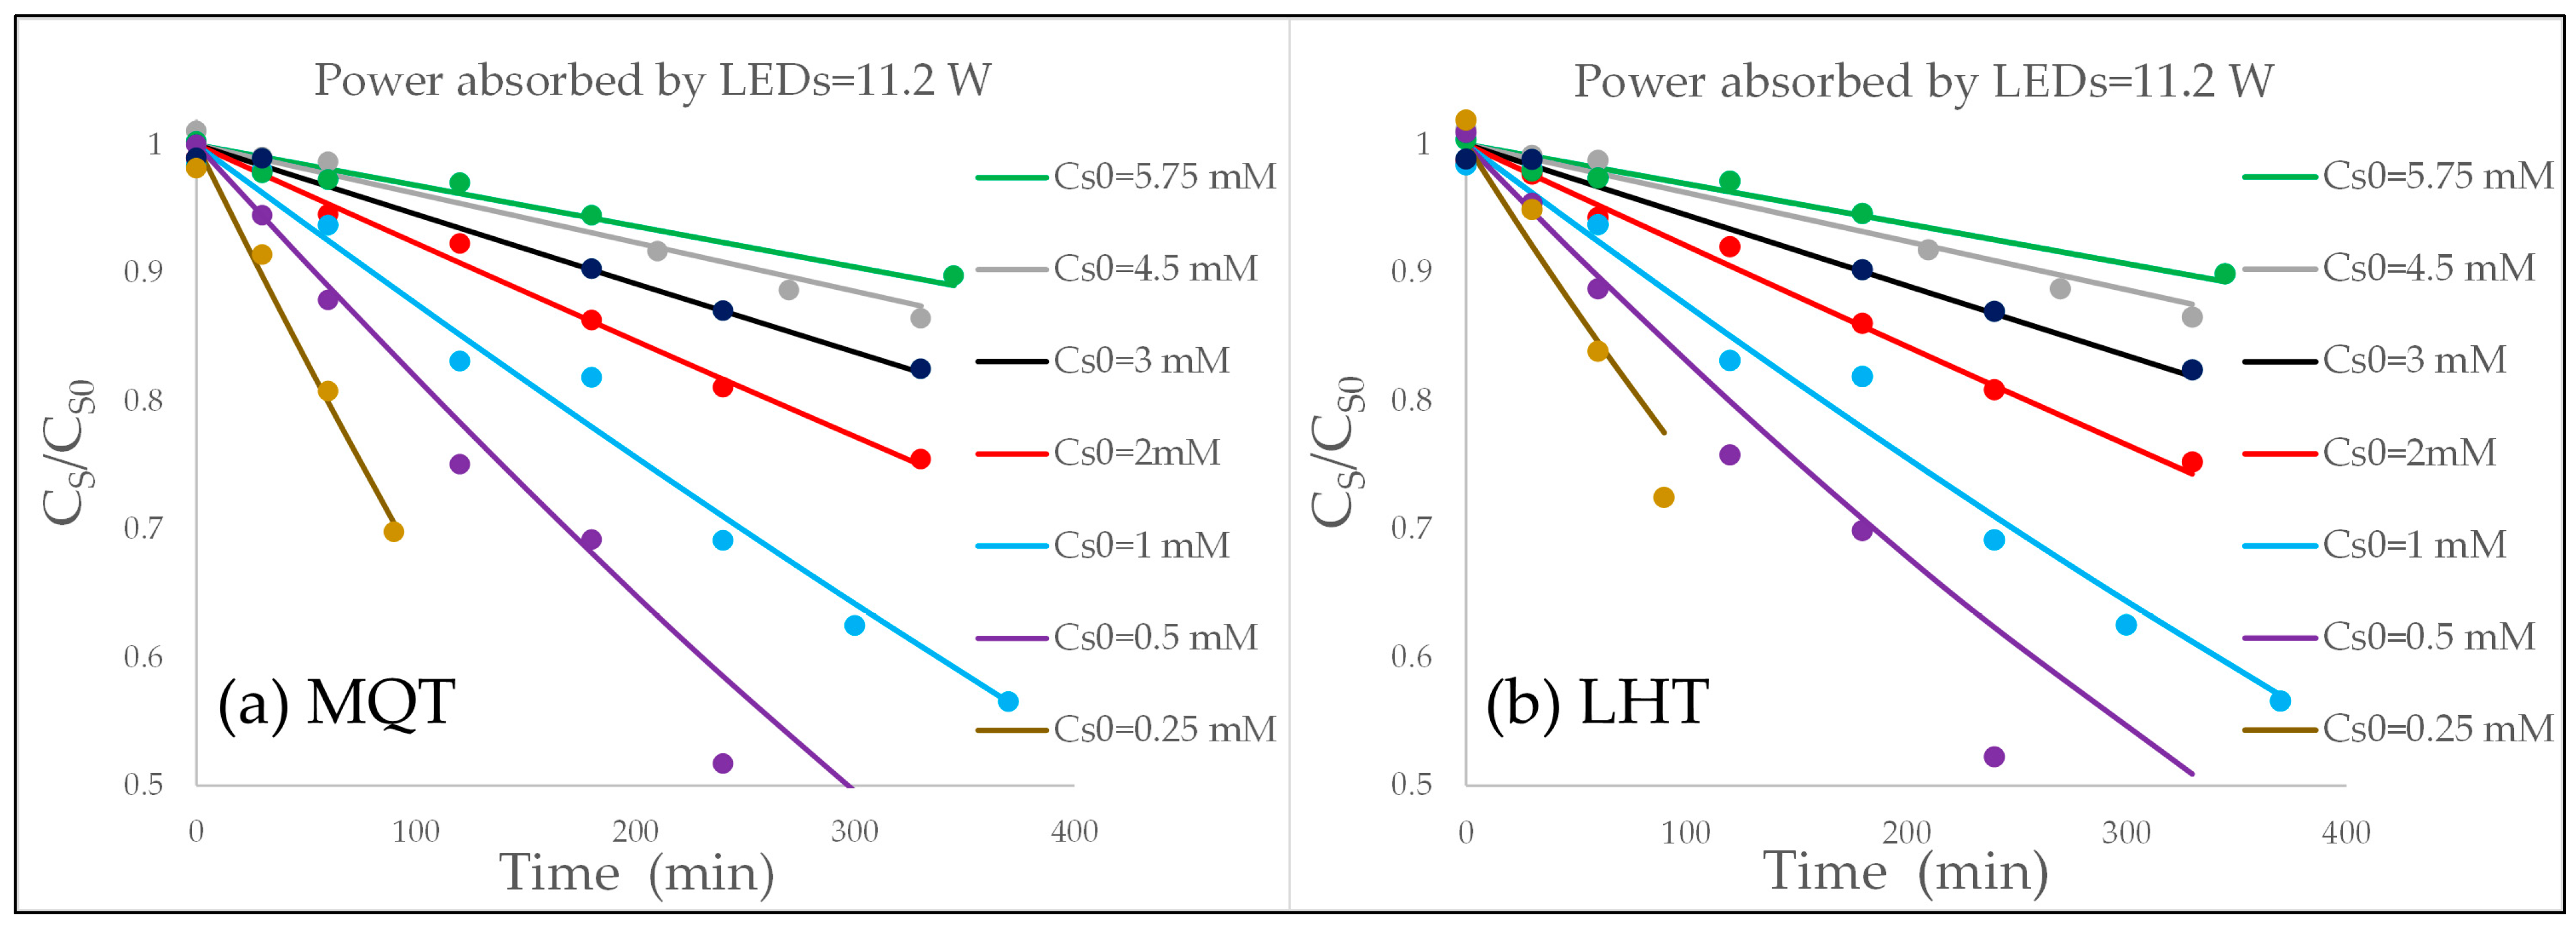
Some of the fitting curves thus obtained are shown together with the experimental points in Figure 4 and Figure 5. Other curves can be found in Section S8 of the Supplementary Material.
The values of the kinetic parameters obtained through the best fitting procedure are summarized in Table 1.
The coefficient of determination is practically the same (R2 = 0.966) for both the models. This result is not surprising in view of the similarity of the two curves in Figure 1. It is concluded that the goodness of fit is very satisfactory with both the kinetic models for all the various levels of concentration and illumination. This means that, if the objective is simply to have a tool that is capable of carefully reproducing the experimental behavior, both the models work fine, even if MQT is somehow simpler because only one kinetic parameter is needed and the dependence on the rate of photon absorption is “built-in” and reliable. After all, the capacity of the MQT model to fit the experimental data with just one fitting parameter is really remarkable. On the other hand, it is worth pointing out that the degree of freedom with LHT (six fitting parameters) is much larger than with MQT (only one fitting parameter). This aspect is relevant because in kinetic analysis, it is usually believed that, if a better fit is not obtained in spite of the increased complexity and/or the increased number of parameters, the usefulness of the more complex model might be questionable [40].
The values of the kinetics constant of the LHT kinetic equation vs. the rate of photon absorption (RPA = φ ^ × w ) are drawn in Figure 6a,b.
The kinetic constants increase with φ ^ according to the linear equations K max = b m φ ^ and K S = 1 / K L = a S + b S φ ^ = a S + b S / w × φ ^ × w with b m = 0.923, a S = 0.119 mol/m3 and b S / w = 2.99 × 10 7 s/m3. This linear trend essentially agrees with the results reported by Emeline et al. [32] and by Xu et al. [41] (see Section S9 in the Supplementary Material).
Substituting the linear relationships of K max and K S into the LHT kinetic equation, this latter becomes R ^ = b m φ ^ C S a s + b s φ ^ + C S . According to this kinetic equation, the apparent order of reaction, α φ ^ , LHT , with respect to φ ^ is α φ ^ , L H T = a s + C S a s + C S + b s φ ^ (for the derivation of the various apparent orders of reaction, see Sections S10–S13 in the Supplementary Material). This equation can be compared with the one for the apparent order of reaction, α φ ^ , M Q T , with respect to φ ^ in the case of MQT kinetics:
α φ ^ , M Q T = φ ^ R ^ C S , φ ^ 1 + 2 φ ^ k C S .
It follows that for the LHT model, it is lim φ ^ 0 α φ ^ , L H T = 1 and lim φ ^ α φ ^ , L H T = 0 . The first limit agrees with what is usually observed, but the second limit is in contrast with the experimental evidence, since a value of 0.5 is usually reported for α φ ^ at high levels of illumination. Conversely, the MQT kinetic model is in agreement with experiments, since it intrinsically predicts for α φ ^ the usual values of 1 and 0.5 at low and high levels of illumination, respectively. In practice, with the LHT model, the fitting of the current experimental data C S vs. time data is good only if the reaction rate is not in accordance with the appropriate dependence on the SRPA. Conversely, if the correct dependence of the reaction rate is imposed, the fitting of the current C S vs. time data with the LHT model would not be satisfactory at every level of illumination. Practically, LHT model experiences the too-short-blanket-problem; if you pull it up on one side, you expose the other side.
Note that for the experiments of the present work, the estimation of α φ ^ gives the values 0.61 < α φ ^ , M Q T < 0.96 and 0.15 < α φ ^ , L H T < 0.97, thus confirming the previous observations on the different possibilities of the two models of respecting the usual behavior of α φ ^ .
The capability of the MQT model to correctly interpret the effects of the SRPA is so satisfactory that it can be exploited also to evaluate the rate of photon absorption. The solution in φ ^ of the kinetic equation is
φ ^ = k C S 2 1 + R ^ k C S 2 1
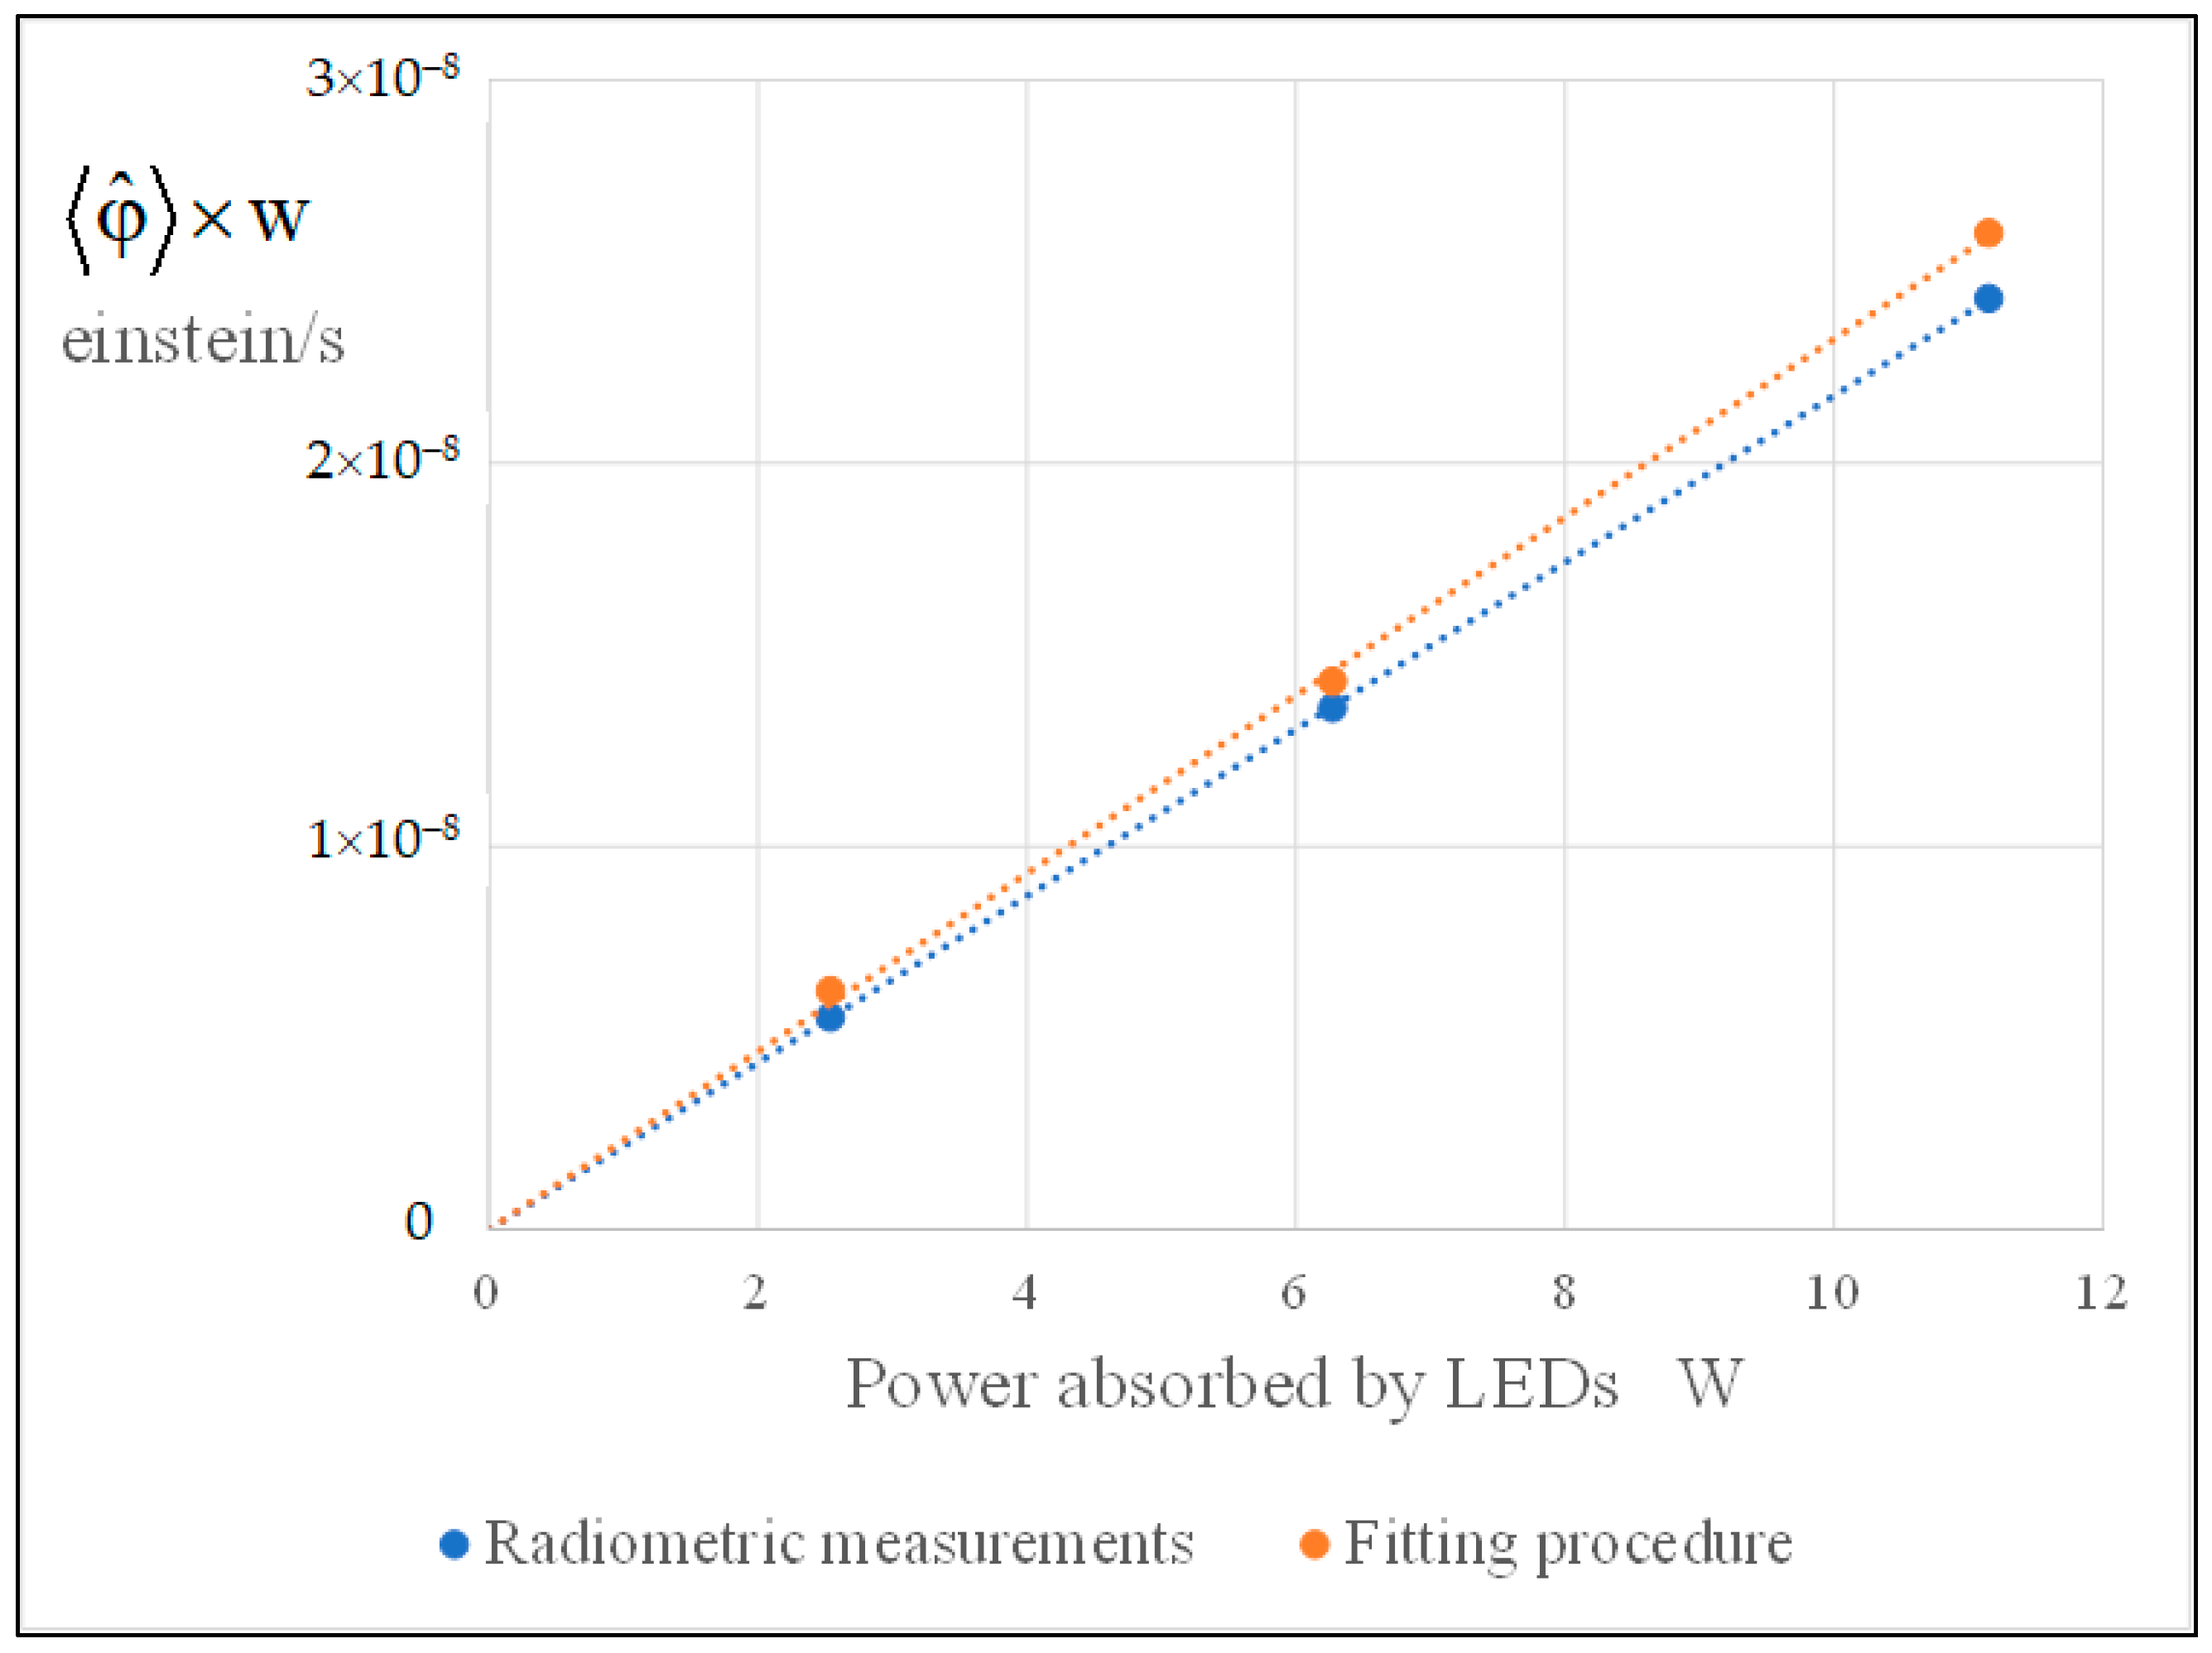
and it can be used if all the variables on the right-hand side have been measured or evaluated. Alternatively, it is possible to fit the experimental data by adopting the SRPA as fitting parameter. To test this latter approach, the integral method of kinetic analysis was utilized to fit the current experimental data with the MQT model and to obtain not only the kinetic parameter k × w , but also the values of the RPA at the three different levels of illumination. In Figure 7, the values obtained in this way are compared with those obtained by radiometric measurements. The consistency between the two sets of values proves that this can be a viable way to measure the rate of photon absorption in photocatalysis.
The equation for the evaluation of the apparent order of reaction with respect to CS is α C S , LHT = K S φ ^ K S φ ^ + C S . Therefore, the LHT model is of order 0 at high concentrations and tends to order 1 at low concentrations.
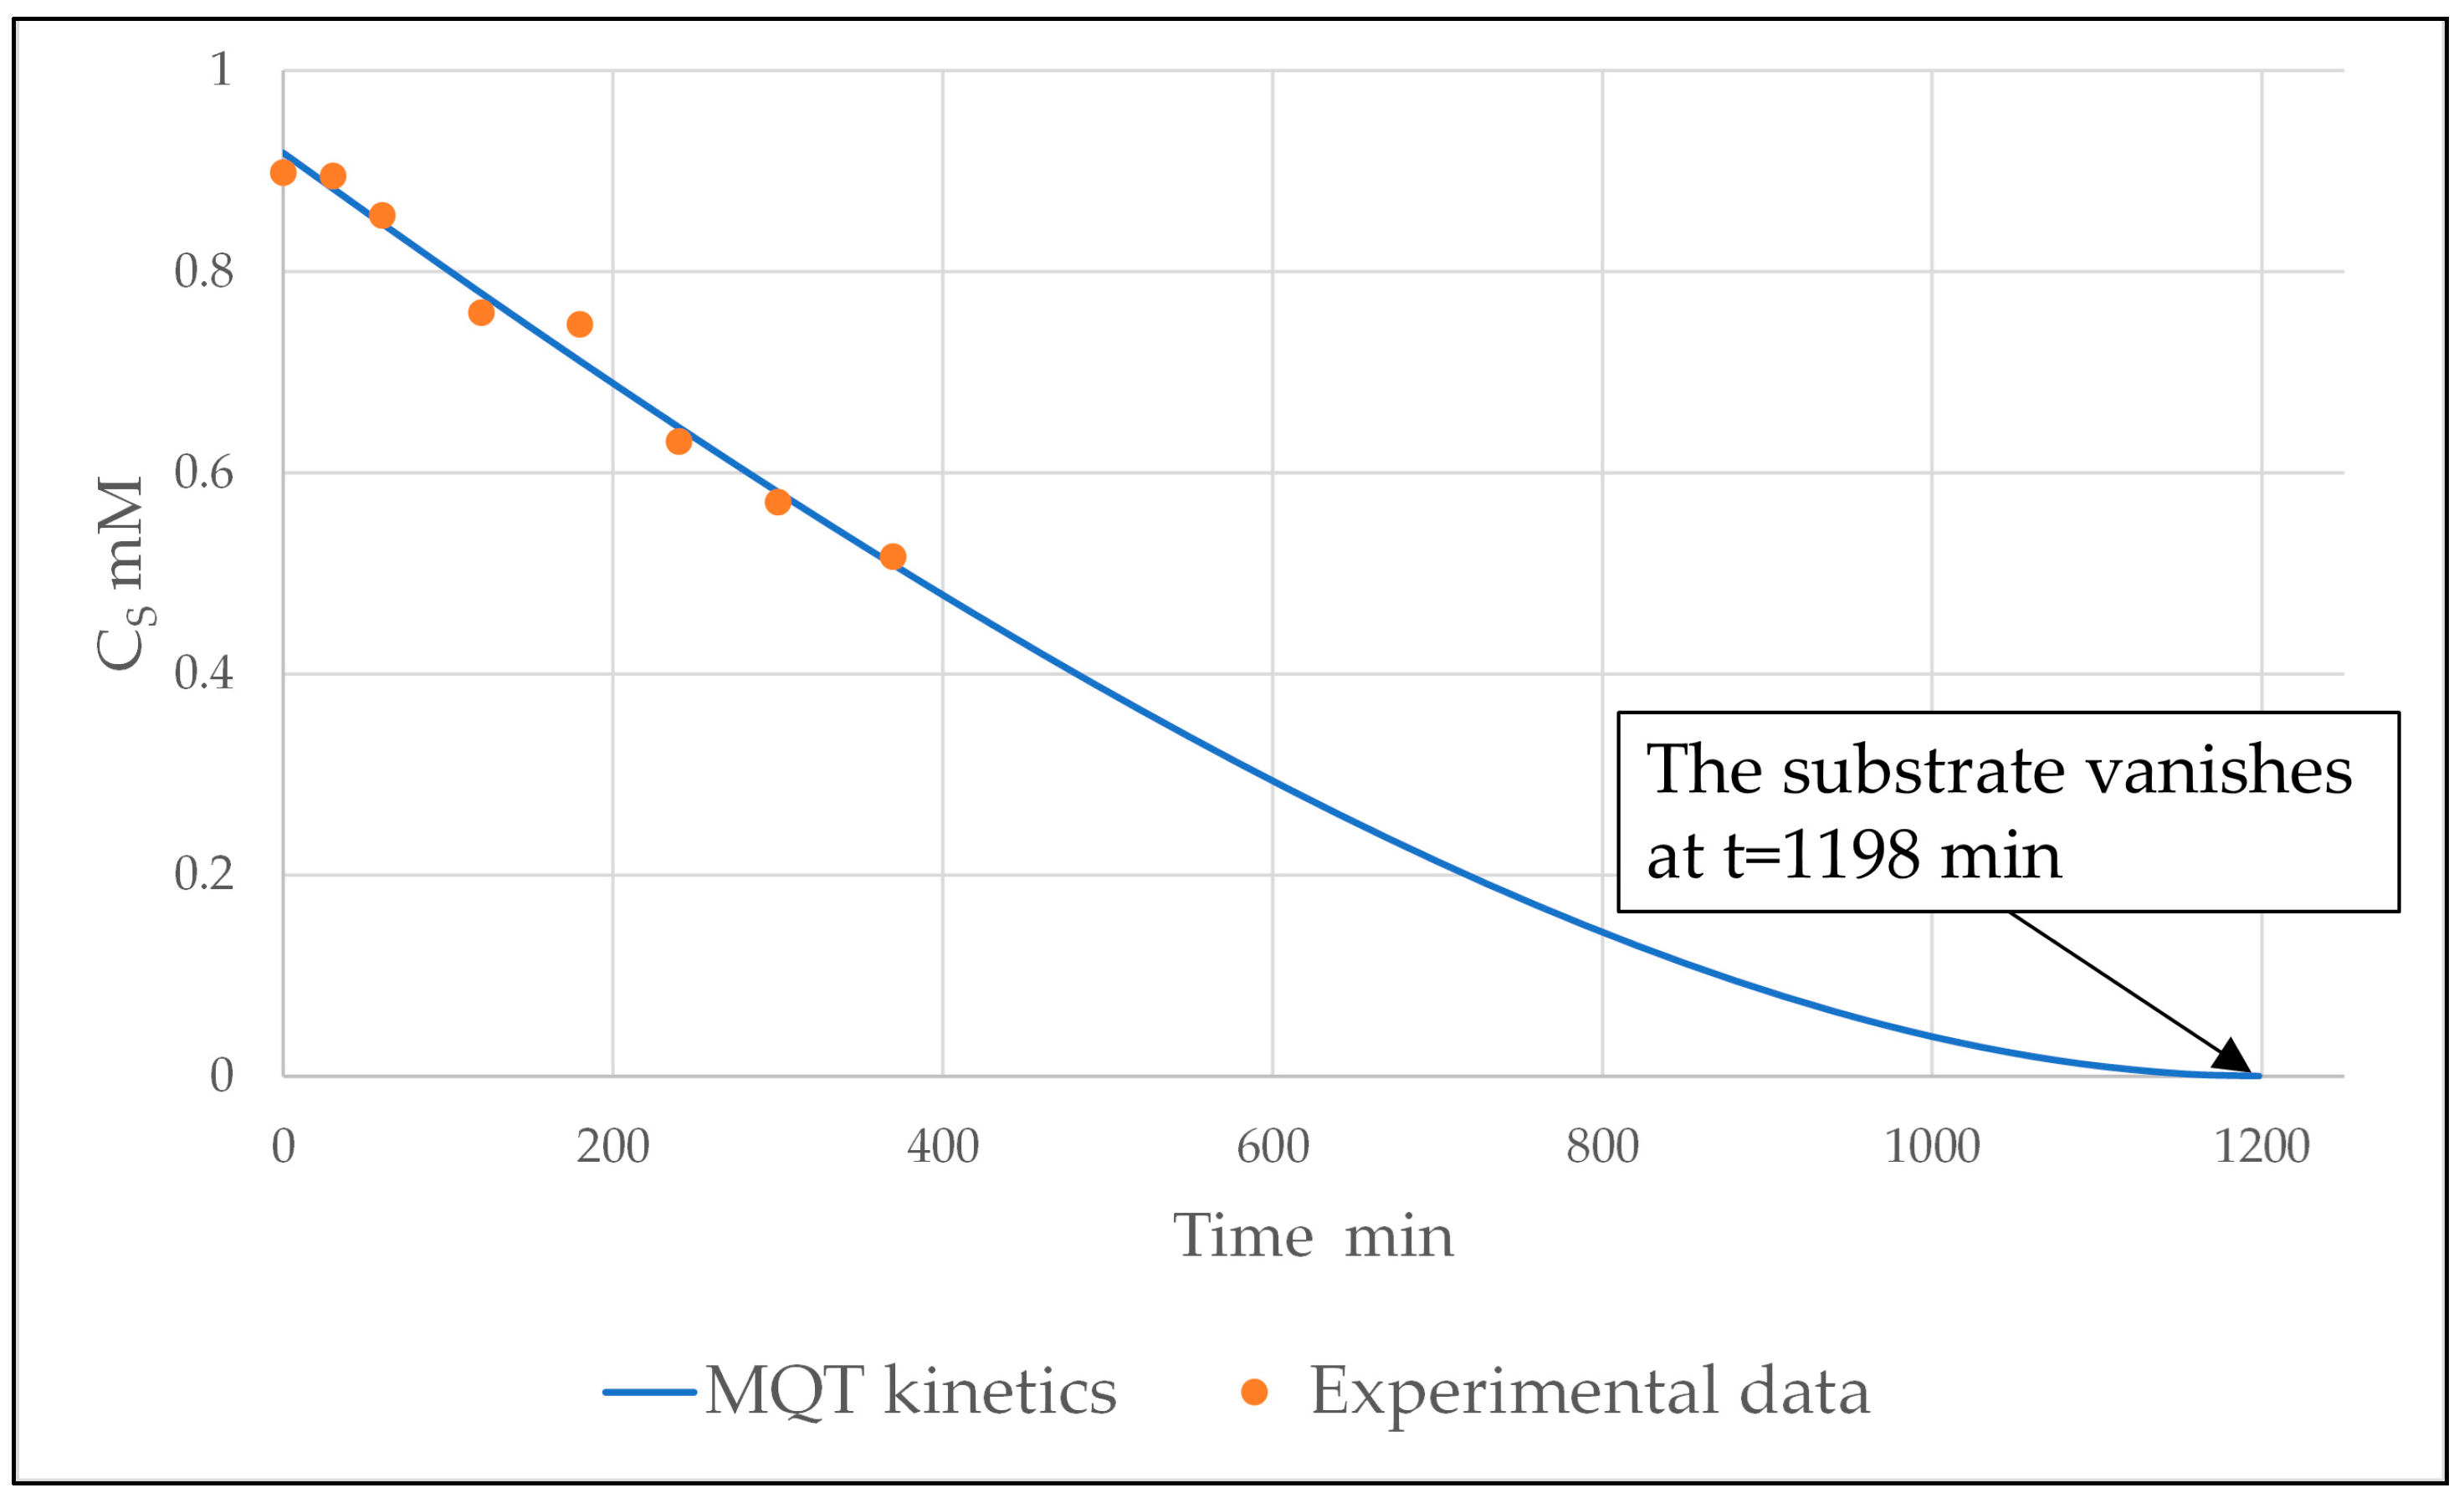
For the MQT model, it is α C S = a b a 2 b , where a = C S 1 + 2 b C S 1 and b = φ ^ × w k × w = φ ^ k . So, the reaction is again 0 order at high concentrations but tends to 0.5 order at low concentrations. It is worth observing that the behavior predicted by the MQT model at very low concentrations looks to be physically unrealistic; in fact, it implies that the substrate concentration vanishes after a finite time (see e.g., Figure 8). A reaction kinetics with order less than 1 can be accurate except at very low concentrations. Before the concentration becomes zero, the order of reaction must increase to at least 1 to avoid the substrate disappearing completely at a certain time.
Actually, the limit of substrate concentration for the validity of the MQT model is probably so low that it is of minor practical interest. For instance, it was observed by Camera-Roda et al. [22] that only at FA concentrations less than about 0.15 mM (a very low substrate concentration indeed), the MQT is no longer viable. It is likely that some minor phenomenon, which is not taken into account in the mechanism of the MQT kinetic law, may become not negligible only at very low substrate concentration.
The estimation of α C S for the experiments of the present work gives the ranges of values 0.04 < α C S , M Q T < 0.39 and 0.01 < α C S , L H T < 0.71, which are of course within the limits previously examined. It is worth noticing that the values of α C S , M Q T , α C S , L H T , α φ ^ , M Q T , and α φ ^ , L H T in the investigated experiments span over at least 70% of the difference between their individual theoretical minimum limit and maximum limit. This demonstrates that a significant variety of kinetic behaviors, each one characterized by a specific order of reaction, is represented in the current analysis.

3. Materials and Methods

Chemicals and Experimental Methodology

The photocatalytic degradation of formic acid (Fluka), FA, in aqueous solution prepared with deionized water (conductivity less than 5 × 10⁻⁶ µS/cm) has been investigated. FA is directly mineralized [27,42,43,44] without the formation of byproducts, whose presence otherwise could influence the rate of disappearance of the substrate.
A plane reactor with total recycle was used. Figure 9 shows the schematic of the system. In each experimental run, the system was initially filled with 600 mL of the FA aqueous solution, and the peristaltic pump (Cole-Parmer model 7554-95) delivered a constant flow rate of 0.844 L/min. After 30 min in the dark to attain adsorption equilibrium, the LEDs were switched on. It was noticed that the FA concentration during the 30 min dark phase remained almost constant. Also, in runs carried out in the dark, the FA concentration did not decrease over the typical time of an experimental run, thus demonstrating that the contribution of adsorption to the decline of FA concentration is negligible.
Four milliliters of the recirculating solution were withdrawn at regular time intervals to measure the concentration of FA by a Shimadzu TOC-5000 A analyzer.
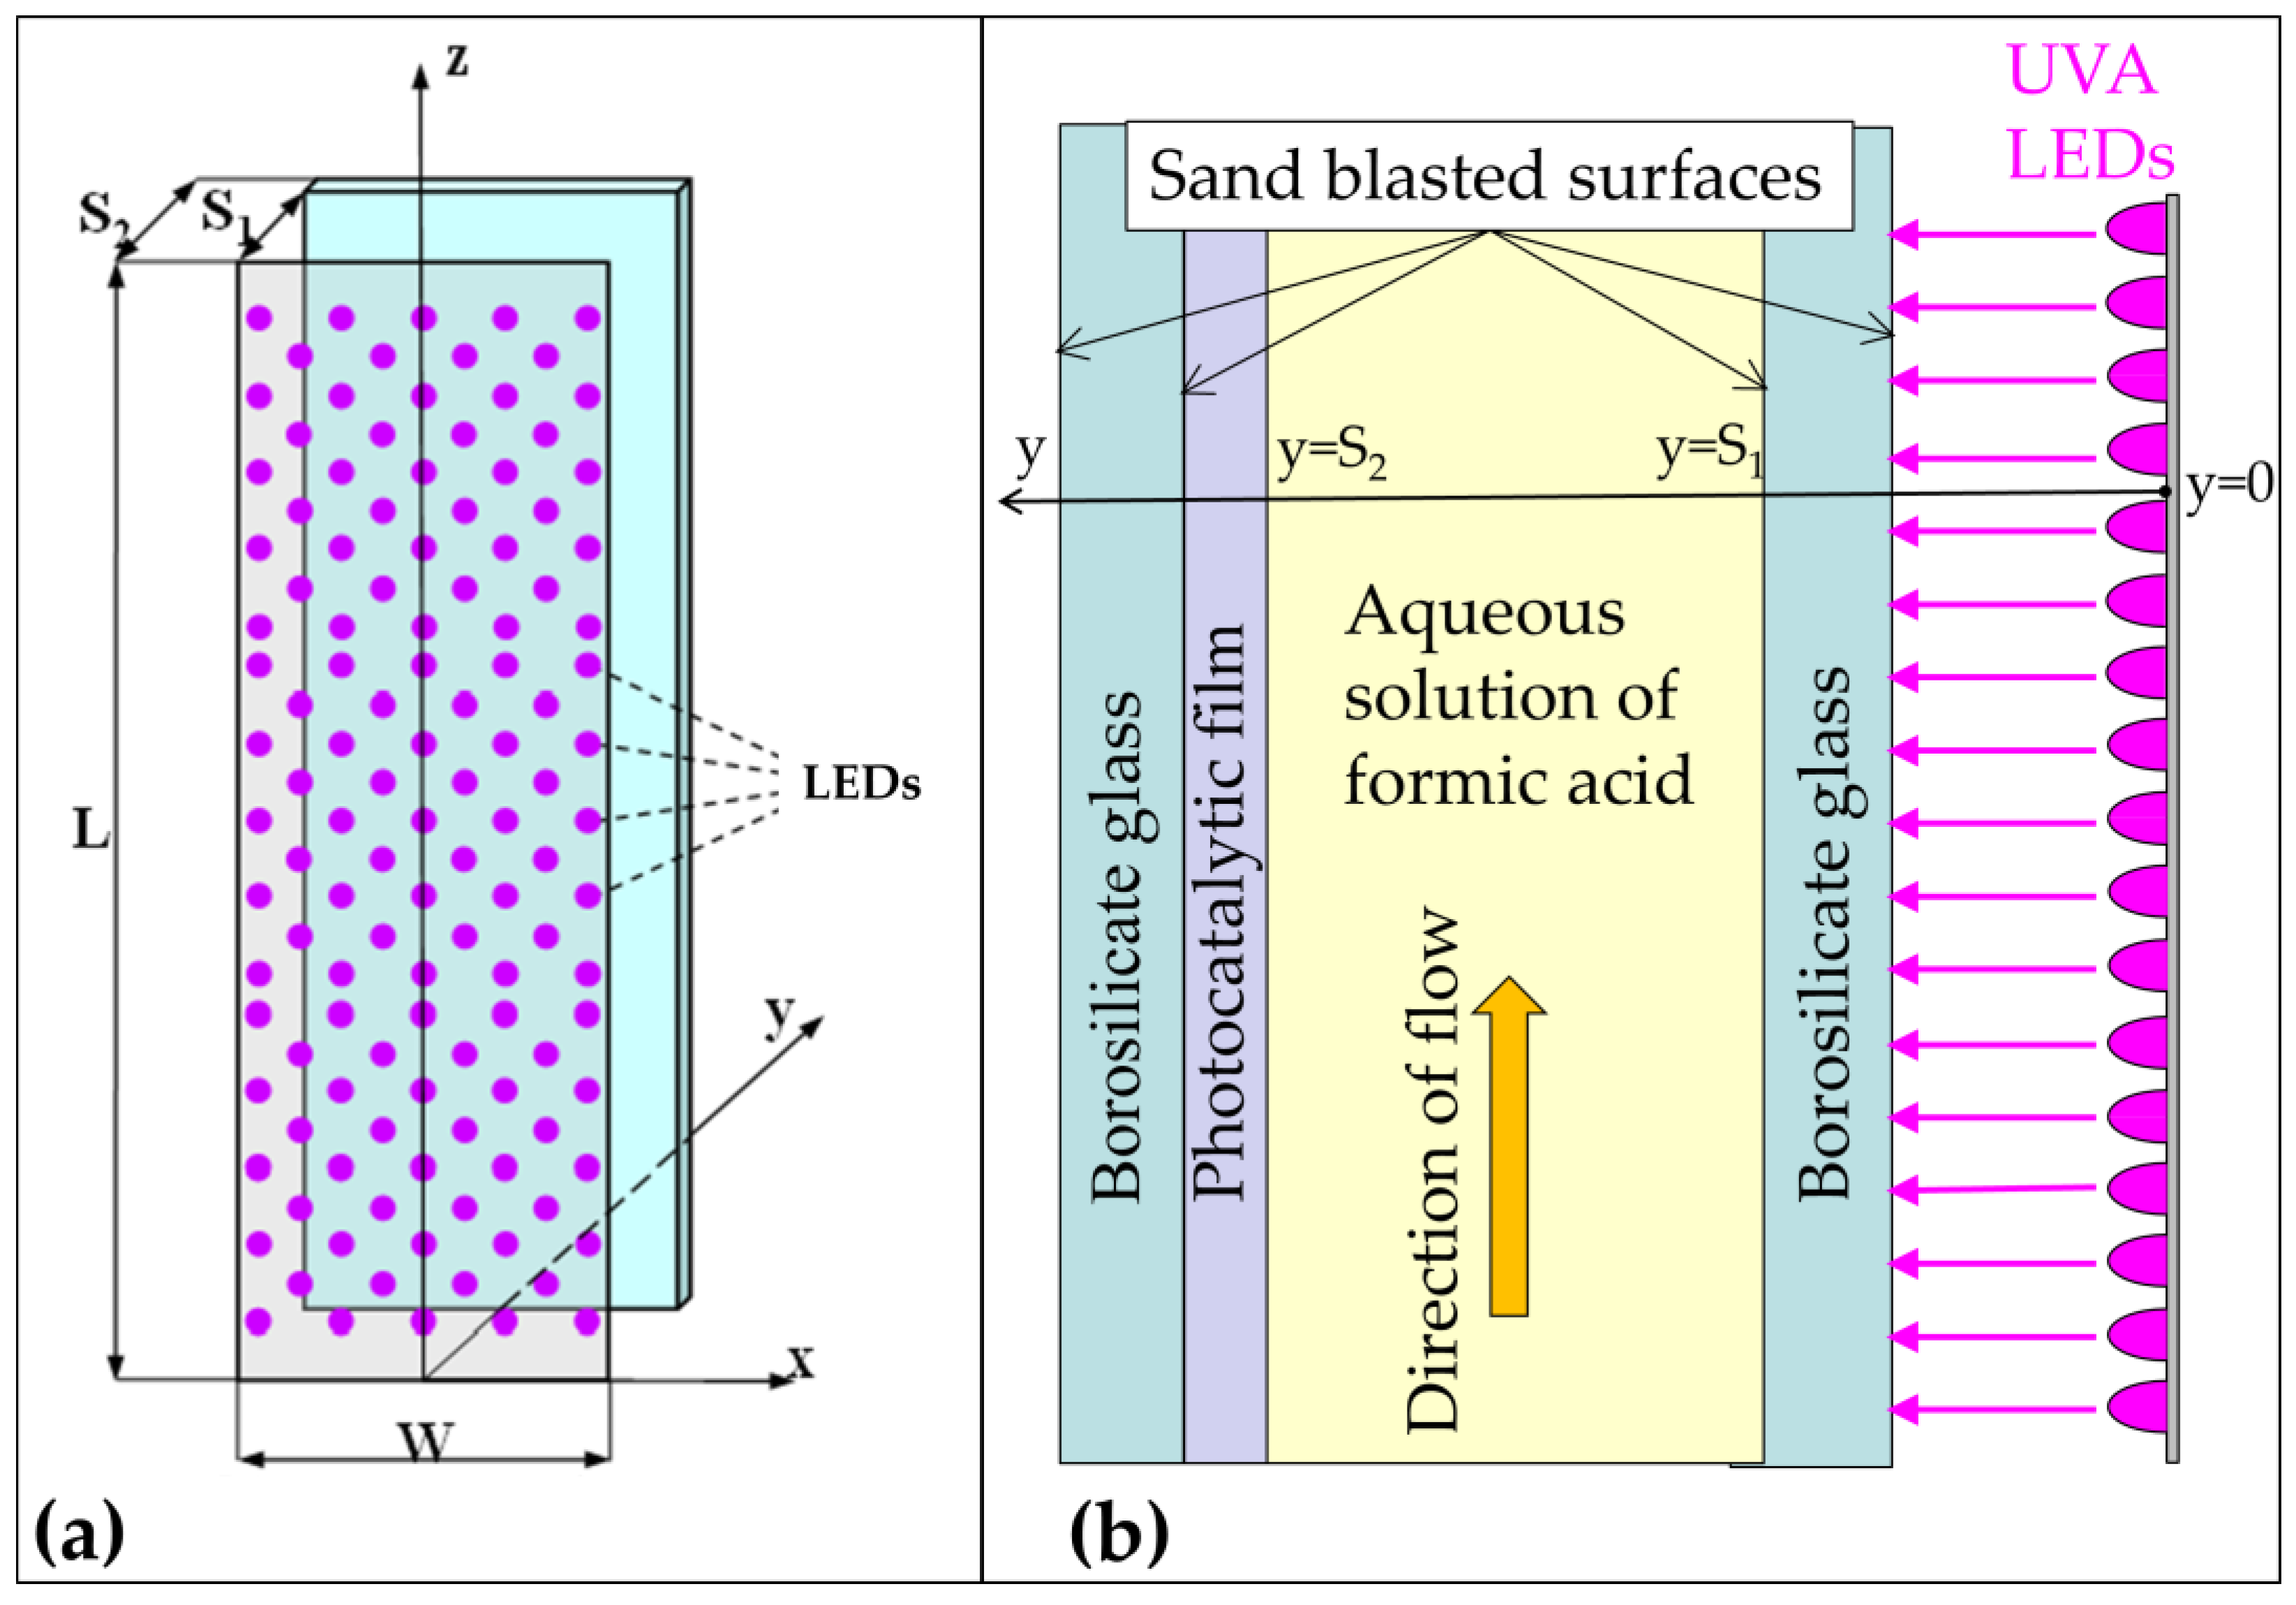
The geometry of the plane reactor illuminated by an array of 123 LEDs and the scheme of its cross-section are shown in Figure 10. The aqueous solution of FA flows (flow rate = 0.844 L/min) from z = 0 to z = L in the space between the borosilicate glass wall at y = S1 (illuminated front window) and the one at y = S2 (rear window). The dimensions of the reactor are L = 23.4 cm, W = 7.1 cm, S1 = 1.8 cm, S2 = 2.2 cm. At the entrance of the reactor, the solution enters a duct with 9 side parallel channels (3 mm diameter) evenly spaced along it to obtain a uniform distribution of the flow at the reactor entrance. The same configuration is used at the exit. The tank acts as a reservoir where mixing helps to homogenize the solution and to maintain the oxygen at the saturation concentration by gaseous exchange with the air through the free surface of the liquid solution.
The LEDs are dimmable. Therefore, the emitted power can be varied, but the emission spectrum (see Figure S18 in the Supplementary Material) does not change with the emitted power. The electric power absorbed by LEDs was measured by a digital multimeter (RCE PM 600). The radiometric measurements were taken by a Delta Ohm photo quantum meter (model HD9021) with an LP 9021 UVA sensor probe. Note that, in the present arrangement, photons and the substrate (FA) penetrate the porous film in parallel flow, PF [24].
The photocatalytic film was deposited on the surface of a borosilicate plane glass by a sol-gel technique as described below.
The glass of the rear window was previously sandblasted to favor the adhesion of the film. The borosilicate glass of the front window, which faces the film, was sandblasted on both sides to enhance the diffusion of the light and make as uniform as possible the illumination of the film.
The chemicals used in the preparation of the film were tetra (isopropyl) titanate (TTIP, 97%, Aldrich, St. Louis, MO, USA), isopropanol (2-PrOH, 99%, Riedel de Haen, Seelze, Germany), titanium dioxide powders (TiO2, P-25, Aeroxide, Rheinfelden, Germany), diethanolamine (DEA, 99% Riedel de Haen, Seelze, Germany), and deionized water.
The adopted procedure is similar to the one used in [45] and is described below.
A 270 g measure of DEA were added to 60 g of a mixture of TTIP and 2-PrOH (molar ratio 1:4) and thoroughly mixed for 2 h. Then water was added drop-by-drop till a final value of 2 for the molar ratio H2O to TTIP was obtained. The next step was the combination of the TiO2 powders to the solution in the quantity of 20 g per liter of the solution. After an additional 12 h of mixing, the sol was ready for utilization. The sol was poured into a tray on a pantograph lift. The glass was hung on a support and leveled horizontally. Then, its bottom side was dipped into the modified sol by slowly raising the pantograph lift. After a 1 min immersion, the glass was extracted from the sol by slowly lowering the pantograph lift. The solution in excess was drained carefully for 2 min. The glass was put into an oven at 150 °C for 30 min and moved into another oven at 550 °C, where the film remained for 4 h till the completion of calcination. Finally, the solidified film was gently rinsed with deionized water. This procedure was not repeated, so only one layer was deposited to form the film. In this way, the film was relatively thin and, as shown in the previous section, it was possible to avoid limitations due to internal mass and photon transport.

4. Conclusions

The application of the integral method of kinetics analysis to C S vs. time data has proven a useful tool for obtaining valuable information that can be utilized to identify the strengths and weaknesses of MQT and LHT kinetic models. Conversely, the differential method of kinetic analysis, even though very popular and easier to use, is not suggested for LHT and MQT kinetics, because it amplifies the experimental noise without being able to differentiate between the two different kinetics. On the other hand, the main difficulty in the application of the integral method (i.e., the need of an analytical solution to the mass balance equation) was overcome by the utilization of closed form solutions in terms of the Lambert W function, one of which is presented for the first time to the best of the authors’ knowledge.
The initial substrate concentration and the intensity of the radiation emitted by LEDs were varied with the aim of investigating a broad range of kinetic regimes. The kinetics was studied assuming that the system is “kinetically observable”, i.e., the average reaction rate can be expressed by the kinetic equation where measurable values of the concerned quantities (substrate concentration in the bulk of the solution and average value of the rate of photon absorption) are used directly as kinetic factors. This assumption, which can be expressed as R ^ R ^ C S = C S , bulk , φ ^ = φ ^ , where R ^ C S , φ ^ is the expression of the intrinsic kinetics, is fundamental to make the analysis viable and to obtain reliable information about the “intrinsic” kinetics. The conditions that must be satisfied for this hypothesis to be valid are (i) external mass transfer is not limiting; (ii) the Thiele modulus, ϕ , is sufficiently low ( ϕ < 0.3); (iii) the optical thickness, τ , is sufficiently low ( τ < 1.5); and (iv) the illumination is uniform. The fulfillment of all of these conditions has been verified for the experimental runs under study.
The following points of the comparison between the MQT and LHT kinetic models can be remarked.
  • The goodness of fit was very satisfactory and almost identical with both kinetic models, but the MQT model achieves this result with just one fitting parameter compared to six fitting parameters of the LHT model. So, even if in practice both models are able to predict the C S vs. time behavior, nonetheless, in terms of simplicity and robustness, the much lower number of fitting parameters is a plus for MQT model.
  • In regard to the dependence on the rate of photon absorption, the following conclusions were drawn. With the MQT model, the type of dependence is explicitly formulated in the model and was shown to be very apt to reproduce the experimental data at the different levels of illumination. It was shown that the MQT model with FA as substrate might even be used to measure the rate of photon absorption in a sort of photocatalytic actinometry. With the LHT model, the kinetics parameters K max and K S linearly increase with the rate of photon absorption to ensure the best fit of the experimental data. Other types of dependencies would not give the same goodness of fit. However, this linear increase implies that at high levels of illumination, the reaction is of zero order with respect to the rate of photon absorption, and this outcome is not consistent with the 0.5th order of reaction experimentally and commonly observed. Again, the MQT looks to be preferable.
  • The order of reaction, α C S , with respect to the substrate concentration varies continuously with C S , for both the models, but with different limits. The two models have the same limiting order (0) at a high concentration, but when the concentration tends to 0, the limit is 1 for LHT and 0.5 for MQT. If the order of reaction remains below the first order when the concentration diminishes, at some point, a deviation from the experimental evidence occurs. This is what happens with MQT, which works fine except at very low concentrations. This a problem of MQT that, however, only arises at concentrations so low as to be of little practical interest. With the LHT, the limit of the order of reaction is 1, so no inconvenience of this type occurs.
In summary, both kinetic models perform well in reproducing the experimental C S vs. time behavior, but, unlike MQT, LHT seems to present more characteristics of a purely phenomenological model than a mechanistic one. MQT looks to be more robust and simpler from several points of view. The only weakness of MQT is the inability to work correctly at very low concentrations, probably because the mechanism behind the model does not consider some phenomena that become non-negligible only under these extreme conditions, which nonetheless are of minor practical importance.
Finally, it is worth noting that the degradation of formic acid appeared particularly suitable for conducting kinetic studies in photocatalysis, thanks to the absence of by-products and the good reactivity.

Supplementary Materials

The following supporting information can be downloaded at https://www.mdpi.com/article/10.3390/catal15090887/s1. Figure S1: Overall view of the values of the initial substrate concentration and of the level of illumination utilized in the 26 experimental runs.; Figure S2: The value of the dimensionless parameter SRPA* for the 26 experimental runs; Figure S3: The value of the Damköhler number in the 26 experimental runs; Figure S4: Dimensionless rate of reaction according to the LHT and the MQT models vs. the dimensionless substrate concentration; Figure S5: CS/CS0 vs. time at fixed initial substrate concentration (CS0 ≈ 5 mM) and power absorbed by LEDs = 6.27 W, but at two different flow rates of the fluid through the reactor; Figure S6: Scheme of the system with the photocatalytic film. (a) Substrate and photons traveling in parallel flow. (b) Substrate and photons traveling in counter flow; Figure S7: Schematic representation of the discretization grid and control volumes; Figure S8: Geometry of a one-dimensional control volume with the grid points; Figure S9: The halved control volume at the interface x = 1; Figure S10: CS/CS0 vs. time at a given initial substrate concentration (CS0 = 0.5 mM) and different levels of illumination; Figure S11: CS/CS0 vs. time at a given initial substrate concentration (CS0 = 2 mM) and different levels of illumination; Figure S12: CS/CS0 vs. time at a given initial substrate concentration (CS0 = 5 mM) and different levels of illumination; Figure S13: CS/CS0 vs. time at a given level of illumination ( φ ^ × w = 2.43 × 10 8 einstein/s) and different initial substrate concentrations; Figure S14: CS/CS0 vs. time at a given level of illumination ( φ ^ × w = 1.36 × 10 8 einstein/s) and different initial substrate concentrations; Figure S15: CS/CS0 vs. time at a given level of illumination ( φ ^ × w = 0.553 × 10 8 einstein/s) and different initial substrate concentrations; Figure S16: The dependence of the LHT kinetic constants on φ ^ . Data in the figure are adapted from Emeline et al. [32]; Figure S17: The dependence of the LHT kinetic constants on φ ^ . Data in the figure are adapted from Xu and Langford [41]; Figure S18: The emission spectrum of the UVA LEDs. Table S1: Values of the initial substrate concentration, CS,0, and of the level of illumination utilized in the 26 experimental runs. References [46,47] are cited in the Supplementary Materials.

Author Contributions

Conceptualization, G.C.-R.; Methodology, G.C.-R., F.P. and V.L.; Validation, G.C.-R. and F.P.; Formal Analysis, G.C.-R. and V.L.; Investigation, M.P. and F.P.; Resources, G.C.-R. and L.P.; Data Curation, G.C.-R. and M.P.; Writing—Original Draft Preparation, G.C.-R.; Writing—Review and Editing, G.C.-R., M.P., F.P., V.L. and L.P.; Supervision, G.C.-R. and L.P. All authors have read and agreed to the published version of the manuscript.

Funding

This research received no external funding.

Data Availability Statement

The raw data supporting the conclusions of this article will be made available by the authors on request.

Conflicts of Interest

The authors declare no conflicts of interest.

Nomenclature

A i superficial area of the interface between the film and the solution
C O x oxygen concentration
C S substrate concentration
C S , * substrate concentration at the film-solution interface
C S , b u l k substrate concentration in the bulk of the solution
C S 0 initial substrate concentration
C S * = k C S / φ ^ dimensionless substrate concentration
Da Damköhler number, D a = R ^ C S 0 , φ ^ C S 0 V R V ˙
D e f f effective diffusivity of the substrate in the film
D F A diffusivity of the FA in the solution
Llength of the illuminated photocatalytic film
k kinetic constant of the MQT kinetic equation
k = k C O x kinetic constant of the MQT kinetic equation
K 1 , K 2 kinetic constants in the Gerisher equation
K max φ ^ , K L φ ^ , K S φ ^ kinetic constants of the LHT kinetic equations
K max , φ ^ × w value of the kinetic constant K max at RPA = φ ^ × w
K S , φ ^ × w value of the kinetic constant K S at RPA = φ ^ × w
k m , FA mass transfer coefficient of FA
(N + 1)total number of the withdrawn samples
n S number of moles of the substrate in the recirculating solution
n ˙ F A , i molar flux of FA at the solution fil interface
n ˙ F A , g the molar rate of disappearance of FA due to the photocatalytic reaction
n ˙ S , g rate of generation of the substrate (it is negative for the disappearing substrate)
q p , i n photon flux entering into the film
q p , T photon flux transmitted through the film
R volumetric rate of reaction
R ^ specific rate of reaction
R ^ MQT , asymptotic value of the reaction rate for MQT model as C S approaches infinity
SRPA * = φ ^ k C S dimensionless parameter
ttime
t i time of sampling number i + 2
t 1 time at which the system is filled with the solution and of the first sampling
t 0 time at which the LEDs are turned on and of the second sampling
V f i l m volume of the film
V i volume of the solution in the time interval t i 1 < t < t i
V R volume of the FA aqueous solution
V ˙ volumetric flow rate
Δ V volume of each withdrawn sample
wmass of the photocatalyst in the film
Wwidth of the illuminated photocatalytic film
W0(x)principal branch of the Lambert W function
Greek symbols
α φ ^ , LHT apparent order of reaction with respect to φ ^ for the LHT model
α φ ^ , M Q T apparent order of reaction with respect to φ ^ for the MQT model
α C S , LHT apparent order of reaction with respect to C S for the LHT model
α C S , M Q T apparent order of reaction with respect to C S for the MQT model
δ geometrical thickness of the film
ε porosity of the film
ϕ Thiele modulus, ϕ = δ 2 R C S , * , φ ^ 0 D e f f C S , *
φ ^ specific rate of photon absorption, SRPA
φ ^ 0 specific rate of photon absorption at the film-solution interface
φ ^ 0 * dimensionless rate of photon absorption, φ ^ 0 * = φ ^ 0 k C S , *
κ absorption coefficient of the radiation in the film
τ optical thickness, τ = κ δ
τ p tortuosity of the pores

Abbreviations

CF Counter Flow: the photons and the substrate are transported in opposite directions inside the film.
FAFormic Acid
LHTLangmuir–Hinshelwood Type
MQTMinero Quadratic Type
PF Parallel Flow: the photons and the substrate are transported in the same direction inside the film.
RPARate of Photon Absorption
SRPASpecific Rate of Photon Absorption
Brackets
denotes the volumetric average in the photocatalytic film

References

  1. Alfano, O.M.; Cabrera, M.I.; Cassano, A.E. Photocatalytic reactions involving hydroxyl radical attack. J. Catal. 1997, 172, 370–379. [Google Scholar] [CrossRef]
  2. Visan, A.; Rafieian, D.; Ogieglo, W.; Lammertink, R.G.H. Modeling intrinsic kinetics in immobilized photocatalytic microreactors. Appl. Catal. B Environ. 2014, 150–151, 93–100. [Google Scholar] [CrossRef]
  3. Ollis, D.F. Kinetics of photocatalyzed reactions: Five lessons learned. Front. Chem. 2018, 6, 378. [Google Scholar] [CrossRef] [PubMed]
  4. Visan, A.; van Ommen, J.R.; Kreutzer, M.T.; Lammertink, R.G.H. Photocatalytic reactor design: Guidelines for kinetic investigation. Ind. Eng. Chem. Res. 2019, 58, 5349–5357. [Google Scholar] [CrossRef]
  5. Mills, A.; O’Rourke, C.; Moore, K. Powder semiconductor photocatalysis in aqueous solution: An overview of kinetics-based reaction mechanisms. J. Photochem. Photobiol. A Chem. 2015, 310, 66–105. [Google Scholar] [CrossRef]
  6. Tran, H.D.; Nguyen, D.Q.; Do, P.T.; Tran, U.N.P. Kinetics of photocatalytic degradation of organic compounds: A mini-review and new approach. RSC Adv. 2023, 13, 16915–16925. [Google Scholar] [CrossRef]
  7. Zhang, L.; Mohamed, H.H.; Dillert, R.; Bahnemann, D. Kinetics mechanisms of charge transfer processes in photocatalytic systems: A review. J. Photochem. Photobiol. C Photochem. Rev. 2012, 13, 263–276. [Google Scholar] [CrossRef]
  8. Loddo, V.; Camera Roda, G.; Parrino, F. Chapter 7—Kinetic aspects of heterogeneous catalytic versus photocatalytic reactions. In Heterogeneous Photocatalysis; Marcì, G., Palmisano, L., Eds.; Elsevier: Amsterdam, The Netherlands, 2019; pp. 215–233. [Google Scholar]
  9. Muñoz-Batista, M.J.; Ballari, M.M.; Kubacka, A.; Alfano, O.M.; Fernández-García, M. Braiding kinetics and spectroscopy in photo-catalysis: The spectro-kinetic approach. Chem. Soc. Rev. 2019, 48, 637–682. [Google Scholar] [CrossRef]
  10. Bloh, J.Z. A holistic approach to model the kinetics of photocatalytic reactions. Front. Chem. 2019, 7, 128. [Google Scholar] [CrossRef]
  11. Rancaño, L.; Rivero, M.J.; Mueses, M.Á.; Ortiz, I. Comprehensive kinetics of the photocatalytic degradation of emerging pollutants in a LED-assisted photoreactor. S-Metolachlor as Case Study. Catalysts 2021, 11, 48. [Google Scholar] [CrossRef]
  12. Minero, C.; Vione, D. A quantitative evaluation of the photocatalytic performance of TiO2 slurries. Appl. Catal. B Environ. 2006, 67, 257–269. [Google Scholar] [CrossRef]
  13. Calza, P.; Minella, M.; Demarchis, L.; Sordello, F.; Minero, C. Photocatalytic rate dependence on light absorption properties of different TiO2 specimens. Catal. Today 2020, 340, 12–18. [Google Scholar] [CrossRef]
  14. Albini, A. Some remarks on the first law of photochemistry. Photochem. Photobiol. Sci. 2016, 15, 319–323. [Google Scholar] [CrossRef] [PubMed]
  15. Gerisher, H. Photocatalysis in aqueous solution with small TiO2 particles and the dependence of the quantum yield on particle size and light intensity. Electrochim. Acta 1995, 40, 1277–1281. [Google Scholar] [CrossRef]
  16. Camera-Roda, G.; Santarelli, F.; Martin, C.A. Design of photocatalytic reactors made easy by considering the photons as immaterial reactants. Sol. Energy 2005, 79, 343–352. [Google Scholar] [CrossRef]
  17. Balzani, V.; Bergamini, G.; Ceroni, P. Light: A very peculiar reactant and product. Angew. Chem. Int. Ed. 2015, 54, 11320–11337. [Google Scholar] [CrossRef]
  18. Chapman, B.; Loiselle, D. Perspective–life and death of a photon: An intuitive non-equilibrium thermodynamic distinction between photochemistry and thermochemistry. Photochem. Photobiol. Sci. 2020, 19, 1623–1629. [Google Scholar] [CrossRef]
  19. Egerton, T.A. UV-Absorption—The primary process in photocatalysis and some practical consequences. Molecules 2014, 19, 18192–18214. [Google Scholar] [CrossRef]
  20. Wex, B.; Neckers, D.C. The quantum yield: An historical perspective. Spectrum 2005, 18, 10–15. [Google Scholar]
  21. Camera-Roda, G.; Augugliaro, V.; Cardillo, A.G.; Loddo, V.; Palmisano, L.; Parrino, F.; Santarelli, F. A reaction engineering approach to kinetic analysis of photocatalyticreactions in slurry systems. Catal. Today 2015, 259, 87–96. [Google Scholar] [CrossRef]
  22. Camera-Roda, G.; Loddo, V.; Palmisano, L.; Parrino, F. Guidelines for the assessment of the rate law of slurry photocatalytic reactions. Catal. Today 2017, 281, 221–230. [Google Scholar] [CrossRef]
  23. Camera-Roda, G.; Loddo, V.; Palmisano, L.; Parrino, F. Chapter 6—Special needs and characteristic features of (photo)catalytic reactors with a review of the proposed solutions. In Heterogeneous Photocatalysis; Marcì, G., Palmisano, L., Eds.; Elsevier: Amsterdam, The Netherlands, 2019; pp. 177–213. [Google Scholar]
  24. Camera-Roda, G.; Santarelli, F. Optimization of the thickness of a photocatalytic film on the basis of the effectiveness factor. Catal. Today 2007, 129, 161–168. [Google Scholar] [CrossRef]
  25. Vezzoli, M.; Martens, W.N.; Bell, J.M. Investigation of phenol degradation: True reaction kinetics on fixed film titanium dioxide photocatalyst. Appl. Catal. A Gen. 2011, 404, 155–163. [Google Scholar] [CrossRef]
  26. Vezzoli, M.; Farrell, T.; Baker, A.; Psaltis, S.; Martens, W.N.; Bell, J.M. Optimal catalyst thickness in titanium dioxide fixed film reactors: Mathematical modelling experimental validation. Chem. Eng. J. 2013, 234, 57–65. [Google Scholar] [CrossRef]
  27. Dijkstra, M.F.J.; Panneman, H.J.; Winkelman, J.G.M.; Kelly, J.J.; Beenackers, A.A.C.M. Modeling the photocatalytic degradation of formic acid in a reactor with immobilized catalyst. Chem. Eng. Sci. 2002, 57, 4895–4907. [Google Scholar] [CrossRef]
  28. Turchi, C.S.; Ollis, D.F. Photocatalytic degradation of organic water contaminants: Mechanisms involving hydroxyl radical attack. J. Catal. 1990, 122, 178–192. [Google Scholar] [CrossRef]
  29. Smith, J.M. Chemical Reaction Engineering, 3rd ed.; McGraw-Hill Inc.: Columbus, OH, USA, 1981. [Google Scholar]
  30. Mills, A.; O’Rourke, C. Revised disrupted Langmuir-adsorption model of photocatalysis. J. Phys. Chem. C 2015, 119, 19941–19946. [Google Scholar] [CrossRef][Green Version]
  31. Nosaka, Y.; Nosaka, A. Langmuir-Hinshelwood light-intensity dependence analyses of photocatalytic oxidation rates by two-dimensional-ladder kinetic simulation. J. Phys. Chem. C 2018, 122, 28748–28756. [Google Scholar] [CrossRef]
  32. Emeline, A.V.; Ryabchuk, V.K.; Serpone, N. Factors affecting the efficiency of a photocatalyzed process in aqueous metal-oxide dispersions Prospect of distinguishing between two kinetic models. J. Photochem. Photobiol. A Chem. 2000, 133, 89–97. [Google Scholar] [CrossRef]
  33. Arts, A.; de Groot, M.T.; der Schaaf, J. Separating kinetics mass transfer in formic acid formate oxidation on boron doped diamond electrodes. J. Electroanal. Chem. 2020, 876, 114721. [Google Scholar] [CrossRef]
  34. Goličnik, M. On the Lambert Wfunction its utility in biochemical kinetics. Biochem. Eng. J. 2012, 63, 116–123. [Google Scholar] [CrossRef]
  35. Veberič, D. Lambert W function for applications in physics. Comput. Phys. Commun. 2012, 183, 2622–2628. [Google Scholar] [CrossRef]
  36. Mainardi, F.; Masina, E.; González-Santander, J.L. A Note on the Lambert W Function: Bernstein and Stieltjes Properties for a Creep Model in Linear Viscoelasticity. Symmetry 2023, 15, 1654. [Google Scholar] [CrossRef]
  37. Corless, R.M.; Gonnet, G.H.; Hare, D.E.G.; Jeffrey, D.J.; Knuth, D.E. On the Lambert W function. Adv. Comput. Math. 1996, 5, 329–359. [Google Scholar] [CrossRef]
  38. Schnell, S.; Mendoza, C. Closed form solution for time-dependent enzyme kinetics. J. Theor. Biol. 1997, 187, 207–212. [Google Scholar] [CrossRef]
  39. Lasdon, L.S.; Fox, R.L.; Ratner, M.W. Nonlinear optimization using the generalized reduced gradient method. RAIRO-Oper. Res. 1974, 3, 73–103. [Google Scholar] [CrossRef]
  40. Hawkins, D.M. The problem of overfitting. J. Chem. Inf. Comput. Sci. 2004, 44, 1–12. [Google Scholar] [CrossRef] [PubMed]
  41. Xu, Y.; Langford, C.H. Variation of Langmuir adsorption constant determined for TiO2-photocatalyzed degradation of aceto-phenone under different light intensity. J. Photochem. Photobiol. A Chem. 2000, 133, 67–71. [Google Scholar] [CrossRef]
  42. Emeline, A.V.; Ryabchuk, V.K.; Serpone, N. Dogmas misconceptions in heterogeneous photocatalysis Some enlightened reflections. J. Phys. Chem. B 2005, 109, 18515–18521. [Google Scholar] [CrossRef]
  43. Mrowetz, M.; Selli, E. H2O2 evolution during the photocatalytic degradation of organic molecules on fluorinated TiO2. New J. Chem. 2006, 30, 108–114. [Google Scholar] [CrossRef]
  44. Montoya, J.F.; Velásquez, J.A.; Salvador, P. The direct–indirect kinetic model in photocatalysis: A reanalysis of phenol and formic acid degradation rate dependence on photon flow and concentration in TiO2 aqueous dispersions. Appl. Catal. B Environ. 2009, 88, 50–58. [Google Scholar] [CrossRef]
  45. Camera-Roda, G.; Loddo, V.; Palmisano, L.; Parrino, F. Photocatalytic ozonation for a sustainable aquaculture: A long-term test in a seawater aquarium. Appl. Catal. B Environ. 2019, 253, 69–76. [Google Scholar] [CrossRef]
  46. Irandoust, S.; Andersson, B. Concentration–dependent diffusivity of benzoic acid in water and its influence on the liquid–solid mass transfer. Canad. J. Chem.l Eng. 1986, 64, 954–959. [Google Scholar] [CrossRef]
  47. Patankar, S.V. Numerical Heat Transfer and Fluid Flow, 1st ed.; Taylor & Francis: London, UK, 1980. [Google Scholar]
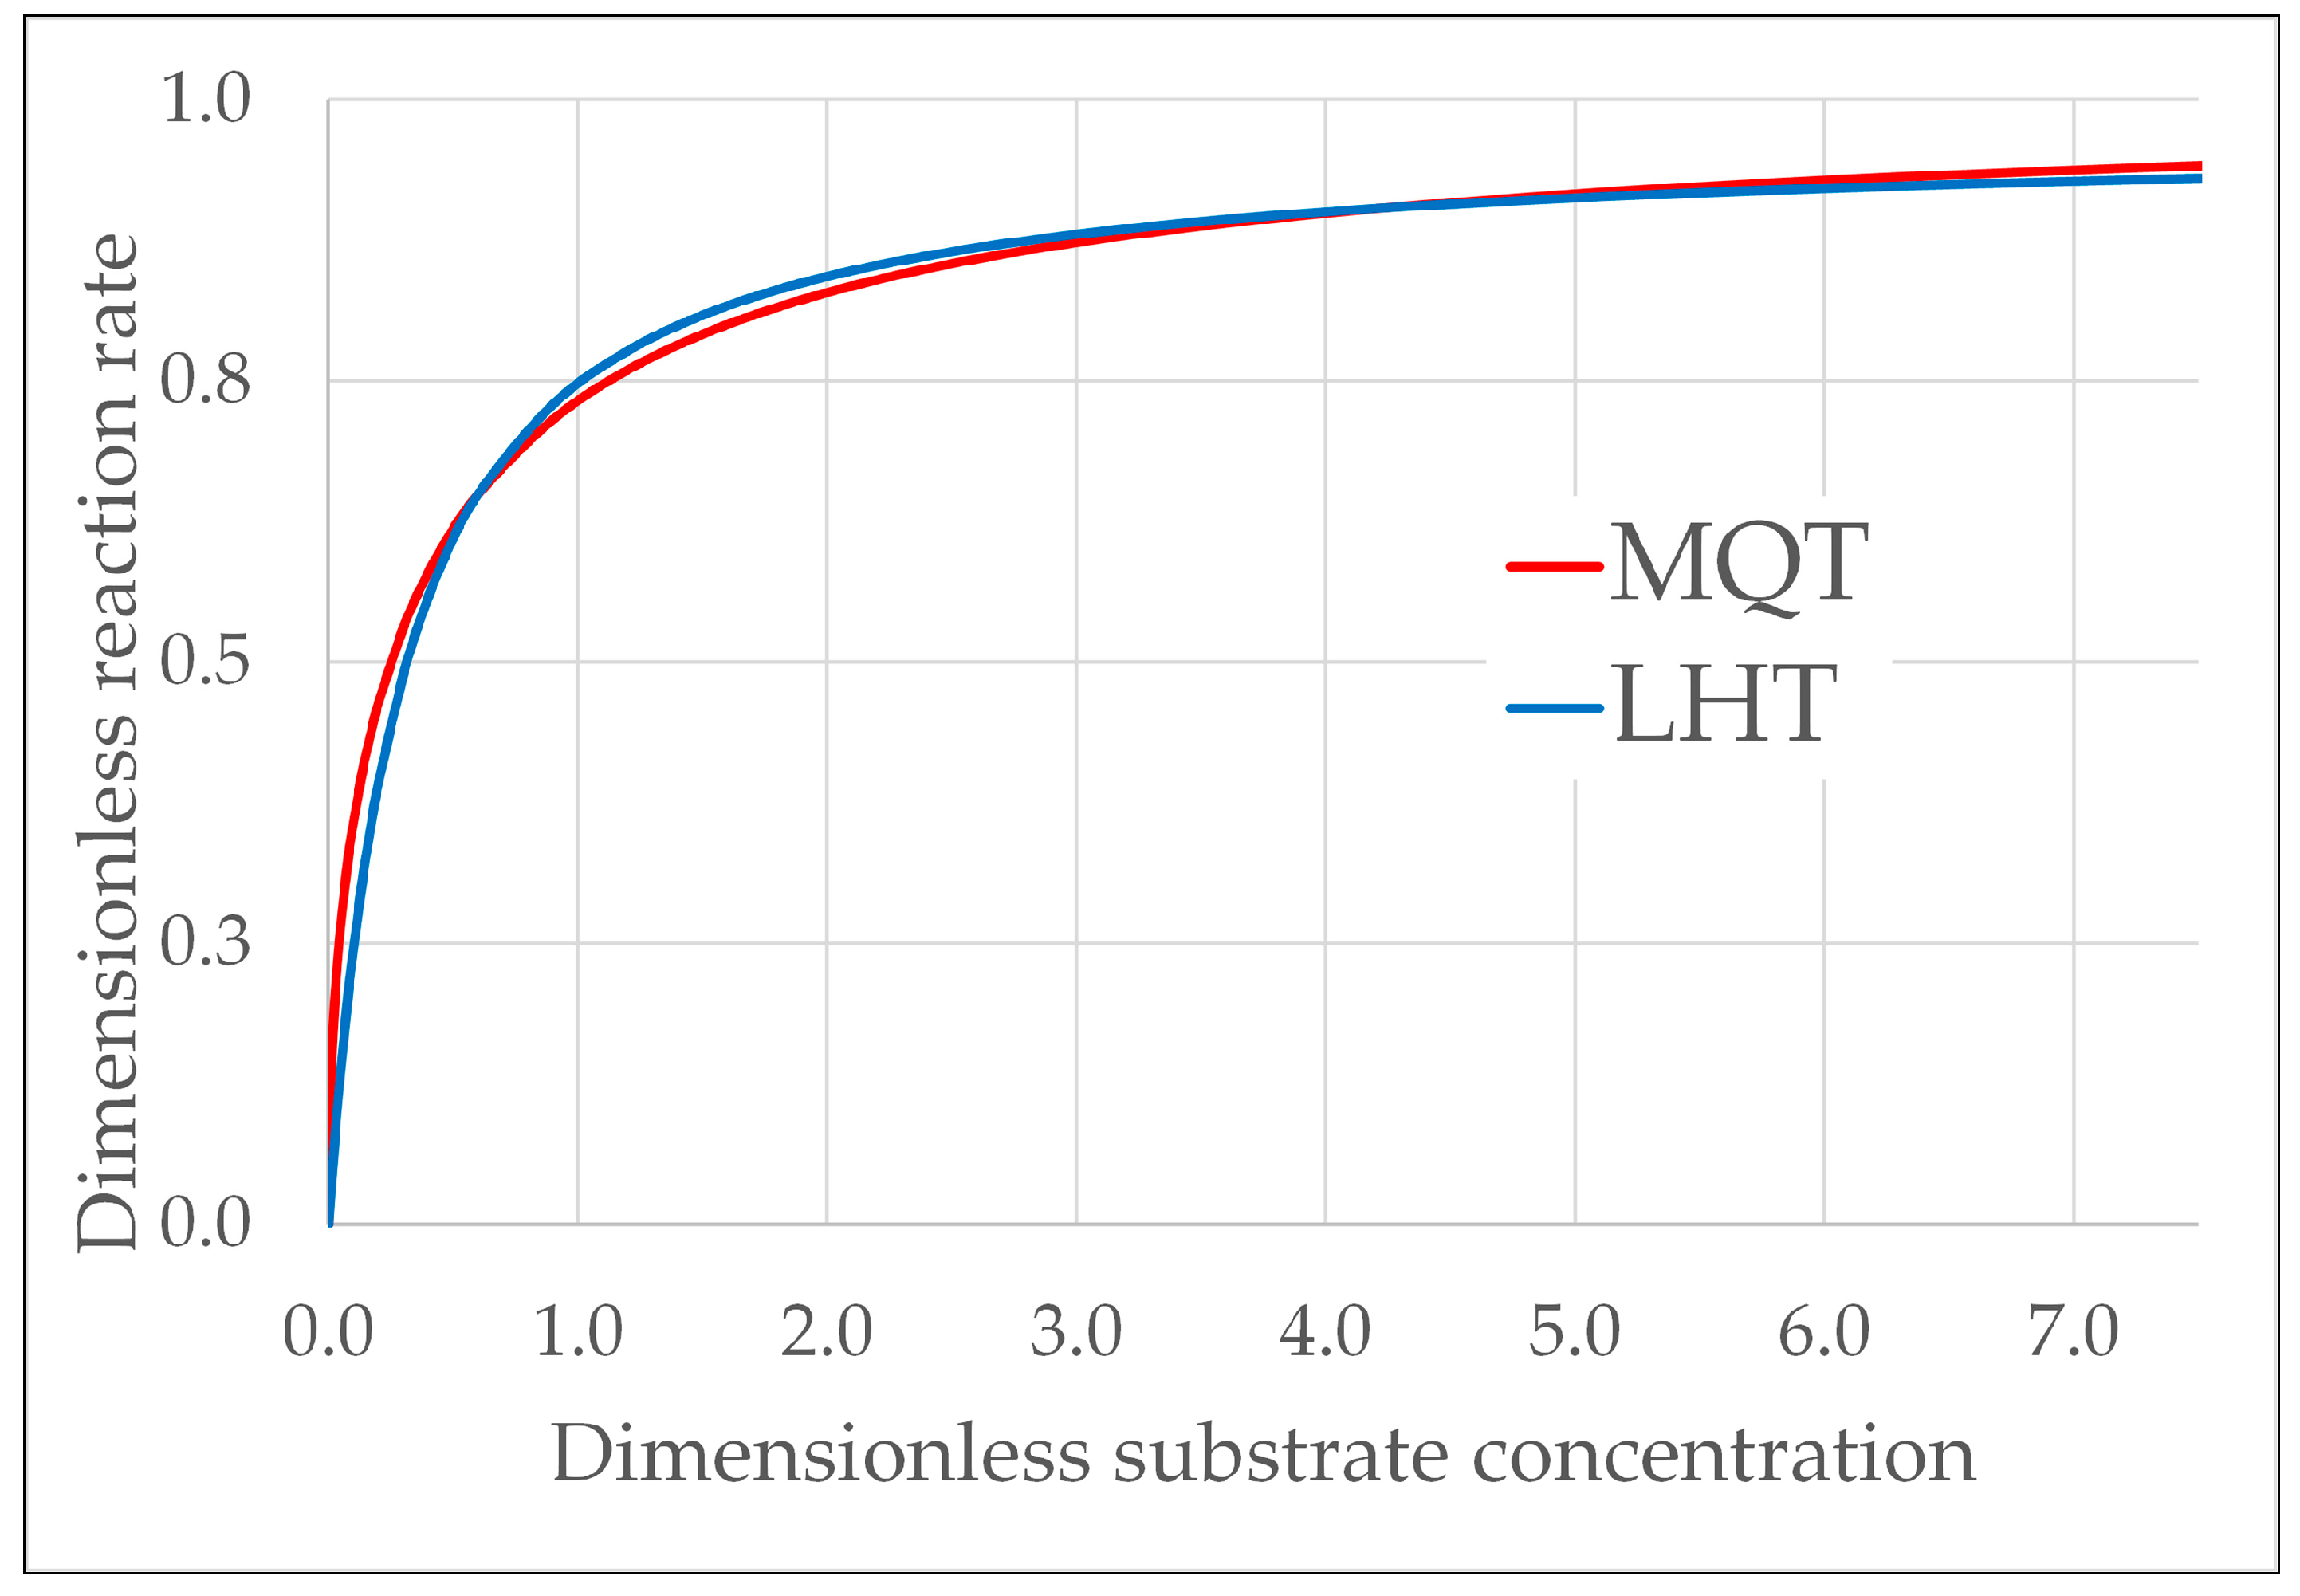
Figure 1. The dimensionless reaction rate, R * = R ^ / R ^ MQT , (where R ^ MQT , is the asymptotic value of the reaction rate for the MQT model as C S approaches infinity), according to the LHT and the MQT models vs. the dimensionless substrate concentration, C S * = k C S / φ ^ . The LHT curve is obtained by fitting with the LHT kinetic model 26 evenly spaced points in the range 0 ≤ C S * ≤ 7.5 of the MQT curve (for additional details, see Section S2 in the Supplementary Material).
Catalysts 15 00887 g001
Figure 2. Normalized reaction rates vs. the Thiele modulus at φ ^ 0 * = 25 and τ = 0.7 . The “specific rate of reaction at C S , * and φ ^ ” refers to the “intrinsic” specific rate of reaction evaluated with C S = C S , * and φ ^ = φ ^ in the kinetic equation. PF (parallel flow) refers to the case with photons and substrate that penetrate into the film from the same direction, and CF (counter flow) refers to the case with photons and substrate that penetrate into the film from opposite directions. In the shaded region (with ϕ < 0.3), R ^ is almost the same in PF and in CF. For the normalization, see Section S4 of the Supplementary Material.
Catalysts 15 00887 g002
Figure 3. The values of the RPA = φ ^ × w at different levels of illumination derived from radiometric measurements of the photon rates entering and exiting the film.
Catalysts 15 00887 g003
Figure 4. C S / C S 0 vs. time at a given initial substrate concentration ( C S 0 = 2 mM) and different levels of illumination. Dots represent experimental data; continuous curves represent the kinetic models. (a) MQT model; (b) LHT model.
Catalysts 15 00887 g004
Figure 5. C S / C S 0 vs. time at a given level of illumination (RPA = φ ^ × w = 2.43 × 10 8 einstein/s) and different initial substrate concentrations. Dots represent experimental data; continuous curves represent the kinetic models. (a) MQT model; (b) LHT model.
Catalysts 15 00887 g005
Figure 6. The kinetic constants of the LHT model vs. the rate of photon absorption (RPA = φ ^ × w ) in the film. (a) K max × w ; (b) K S .
Catalysts 15 00887 g006
Figure 7. Comparison between the values of the RPA = φ ^ × w at different levels of illumination obtained by the fitting procedure with the MQT model and by radiometric measurements.
Catalysts 15 00887 g007
Figure 8. C S vs. time. MQT kinetic model (continuous curve) and experimental data (dots) for C S t = 0 = C S 0 = 0.91 mM, φ ^ × w = 2.43 × 10⁻⁸ einstein/s, and k × w = 9.54 × 10⁻⁹ m3/s.
Catalysts 15 00887 g008
Figure 9. Representation of the experimental apparatus.
Catalysts 15 00887 g009
Figure 10. (a) Geometry of the reactor and (b) scheme of its cross section (the elements in (b) are not to scale).
Catalysts 15 00887 g010
Table 1. Values of the best fitting parameters for MQT and LHT kinetic models.
MQTLHT
k × w φ ^ × w from radiometric
measurements
K max × w K S
m3/seinstein/smol/sM
9.54 × 10−90.553 × 10−84.58 × 10−90.056 × 10−3
1.36 × 10−812.4 × 10−90.272 × 10−3
2.43 × 10−822.6 × 10−90.614 × 10−3
Disclaimer/Publisher’s Note: The statements, opinions and data contained in all publications are solely those of the individual author(s) and contributor(s) and not of MDPI and/or the editor(s). MDPI and/or the editor(s) disclaim responsibility for any injury to people or property resulting from any ideas, methods, instructions or products referred to in the content.