1. Introduction
Carbon dioxide (CO
2) gas is a primary greenhouse gas accountable for climate change by virtue of the catastrophic phenomenon of global warming [
1]. As a result, it is critical to identify a green, cost-effective, and efficient solution for its conversion and consumption. On the other hand, CO
2 is a thermodynamically stable carbon molecule, with a standard enthalpy of production of −393.5 kJ/mol and a bond energy of 803 kJ/mol (298.15 K) [
1]. As a result, the activation of CO
2 takes a significant amount of energy. To overcome the huge energy barrier, catalytic CO
2 activation approaches have been adopted, where a CO
2 molecule is dissociated by adopting a different pathway. Through a catalytic route, CO
2 has been converted to a variety of valuable products, such as methane and methanol. Amongst the various approaches, catalytic CO
2 transformation to methanol fuel has been acknowledged as the most economic route by Nobel laureate Professor Olah [
2]. The commercial importance of methanol could be understood by the fact that it is one of the top five chemicals supplied globally in the market. Furthermore, in the industrial sector, methanol is a valuable chemical and a main raw material that may be used directly as fuel or indirectly as an intermediary in the creation of other products with added value, such as biodiesel, acetic acid, and formaldehyde. On top of that, researchers have focused a great deal of attention on clean methanol fuels, as methanol has a high energy density of 6130 Wh/kg [
3]. In addition, methanol as a fuel has many other advantages, like accessible transportation and ease of storage under normal conditions. This will enable the usage of methanol as a fuel in the near future, giving methanol a great chance to displace conventional non-renewable fossil fuels. The need to expedite the defossilization of methanol production pathways and the growing demand for methanol in the chemical and energy sectors have resulted in mounting attention in the development of catalytic technologies for the synthesis of green methanol via CO
2 hydrogenation [
4,
5,
6]. Generally, methanol synthesis takes place through the famous syngas route of Cu-ZnO-Al
2O
3; however, selectivity and stability are two major issues with many such catalysts when it comes to pure CO
2 hydrogenation [
7,
8].
Since copper-based catalysts are inexpensive and somewhat efficient, they have been regarded as the most promising and cost-effective metal-based catalytic systems for the commercial production of methanol by hydrogenating carbon dioxide. Indeed, copper metal without any catalyst supports has a lower catalytic activity than supported copper compounds. Different kinds of catalyst promoters have been used to accelerate methanol synthesis via CO
2 hydrogenation Nickel (Ni) has an enriched catalyst-promoting profile, especially in hydrogenation reactions, where it facilitates hydrogen spillovers. The Ni-based catalysts are commonly used in CO
2 hydrogenation processes because of their extraordinary efficacy in dissociating carbon–oxygen bonds [
9,
10]. Doping Ni with other metals, such as Pt [
11], Mn [
12], and Co [
13], reduces the activation energy of the rate-determining phase, resulting in increased catalytic activity and product selectivity. Similarly, the RhNi/Al
2O
3 catalyst synthesized by the galvanic replacement approach was described by Wang et al. [
14]. Ni nanoparticles were stabilized by strong Rh-Ni interactions and encased in atomically thin RhOx layers. This arrangement increased the amount of active metal dispersion, which in turn increased the rate of methanation. Likewise, Liao et al. [
15] worked on the hydrogenation of furfural to furfuryl alcohol and cyclopentanone with high efficiency and selectivity using Cu-Ni bimetallic catalysts. The results indicated the formation of a Cu-Ni alloy, which affected the acceleration of CuO/NiO reduction, thereby improving the catalyst’s performance. Most recently, Zhang et al. [
16] worked for CO
2 hydrogenation to methanol by using Cu–Mn/ZrO
2 catalysts with varying Ni concentrations. The study concluded that the addition of Ni caused the catalyst to become more specific toward the COOH* route. Ren et al. [
17] investigated Ni’s promotion of Pt/Y-based catalysts for hydrogenation reactions. They concluded that Ni enhanced (Ni-Pt)/YA’s capacity for H
2 activation. The creation of active sites leading to the hydrogen spillover is one of the very common boosting factors in methanol synthesis by CO
2 reduction, maintaining the promoting role of Ni in the hydrogenation reaction. The present work intends to explore the role of Ni in Ni-Cu/Cr
2O
3 catalysts in liquid-phase, low-temperature methanol fuel formation via CO
2 reduction.
Extensive research has been performed on the structure and catalytic behavior of chromia catalysts in order to better understand how the characteristics of supported chromia affect the catalytic activity [
18]. For CO
2 hydrogenation processes, a range of oxide supports, including MgO, In
2O
3, TiO
2, CeO
2, ZrO
2, Ga
2O
3, as well as CNT and carbon nanofibers, have been utilized [
19,
20,
21,
22]. Despite extensive research regarding the application of various catalyst supports, no single catalyst support was found satisfactory for executing the hydrogenation of pure CO
2 to methanol. Keeping this scenario in mind, the versatile potential of chromia as a catalyst support motivated the design of the current work.
The objectives and goals of the existing work are easily deduced from the preceding considerations. The research concept that rekindled the current effort is grounded in the multipurpose nature of chromia as a catalyst support in terms of performance in a number of catalytic reactions. In addition to that, the Ni catalytic role, the current study aims to establish how it enhances methanol synthesis by reducing CO2 in a slurry reactor by utilizing a Ni-Cu/Cr2O3 catalyst.
2. Results and Discussions
2.1. ICP-OES and TGA
The results of inductively coupled plasma–optical emission spectrometry (ICP-OES) demonstrated a strong correlation between the intended concentration and the measured concentration of both Cu and Ni. These findings validated the effectiveness of the deposition precipitation method for depositing both active metals onto the Cr2O3 surface.
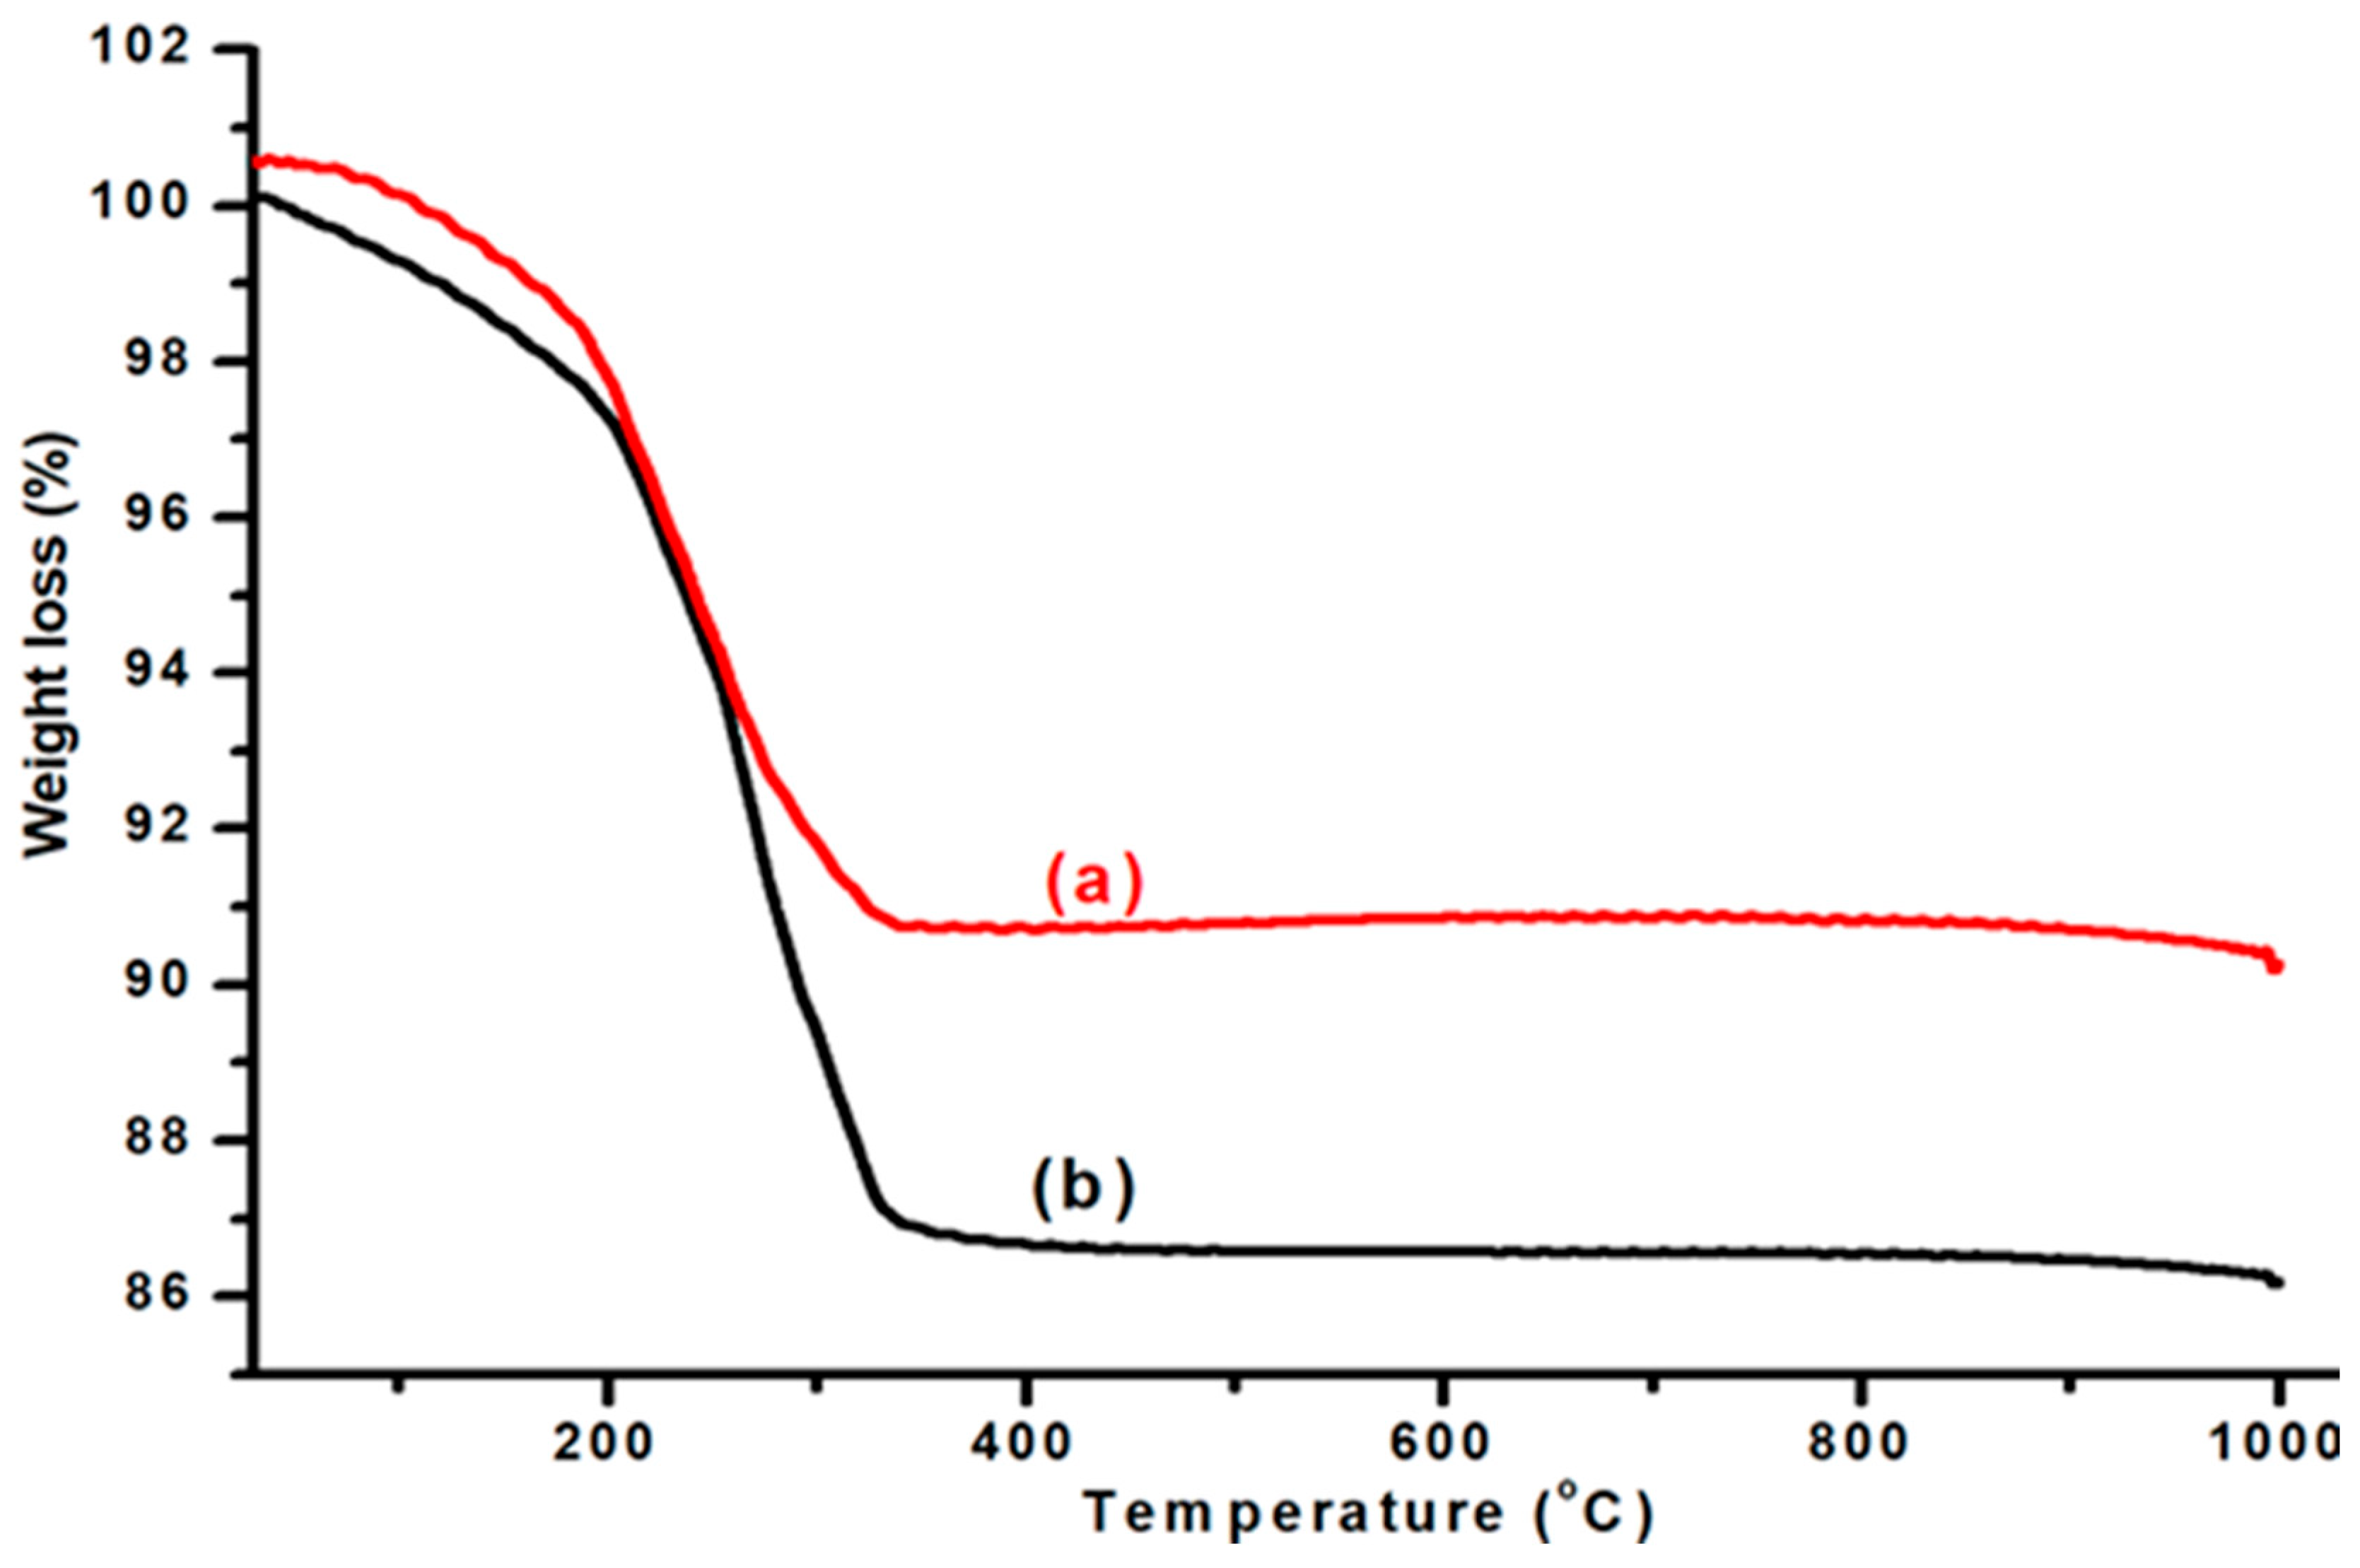
The thermogravimetric analysis (TGA) of Cr
2O
3 support and Ni-Cu/Cr
2O
3 is displayed in
Figure 1. A gradual weight loss was observed, starting from 100 °C with a tail at 340 °C. This weight loss is ascribed to the loss of surface water and absorbed water. A total weight loss of 9% was recorded, which indicates the thermal stability of the support. The TGA profile of Ni-Cu/Cr
2O
3 exhibited weight loss at two different regions. The first weight loss was observed up to a temperature range of 200 °C. This weight loss is due to the evaporation of water molecules from the surface of the Cr
2O
3 support. Beyond this temperature point, there is a sharp decline, which continues until 380 °C. This weight loss shows the decomposition of nitrates molecules used during the synthesis of catalysts, which amounts to only a 4% weight loss, with the total weight loss being 13%. Based on the TGA results, the dried catalysts were calcined at 380 °C to get rid of nitrate groups from the catalyst’s matrix.
2.2. Ni-Cu/Cr2O3 Catalyst Morphology
The morphology of Ni-Cu/Cr
2O
3 catalysts is demonstrated in the FESEM images given in
Figure 2. The FESEM images acquired from the catalysts’ surfaces revealed changes in morphology. The Cr2O3-based Ni-Cu catalysts showed the porosity of each catalyst, irrespective of the Ni-Cu metallic ratio. In addition, the FESEM images of Ni-Cu/Cr
2O
3 catalysts revealed a homogeneous morphology of each catalyst, with metal oxide particles widely distributed on the chromia support. More importantly, a slight agglomeration of catalyst particles was observed, which implies the accuracy of the synthesis method applied in the preparation of Ni-Cu/Cr
2O
3 catalysts.
2.3. FTIR Analysis of Ni-Cu/Cr2O3 Catalysts
FTIR transmittance spectra for both bare Cr
2O
3 and Ni-Cu/Cr
2O
3 catalysts are shown in
Figure 3 in the wavenumber range of 600 to 2100 cm
−1. The bare Cr
2O
3 was found to have a broad and powerful transmission band that spanned around 580–620 cm
−1. The asymmetric O–Cr–O vibration bonding was linked to this band, according to published data [
23,
24]. Interestingly, support was formed when metal oxides were placed on the Cr
2O
3 surface. Their FTIR spectra showed that each Ni-Cu/Cr
2O
3 catalyst had the same transmission band. This indicates the persistence of Cr
2O
3’s structural characteristics due to the addition of metal oxides. Furthermore, each spectrum of Ni-Cu/Cr
2O
3 catalysts showed a broad band with wavenumbers ranging from 900 to 1500 cm
−1, in addition to the basic Cr
2O
3 transmission band. This FTIR absorption band was ascribed to chromium oxide. On top of that, the inclusion of Cu- and Ni-mixed metal oxides, as reported in the literature, is confirmed by this extra transmission band [
25,
26,
27].
2.4. XRD Analysis
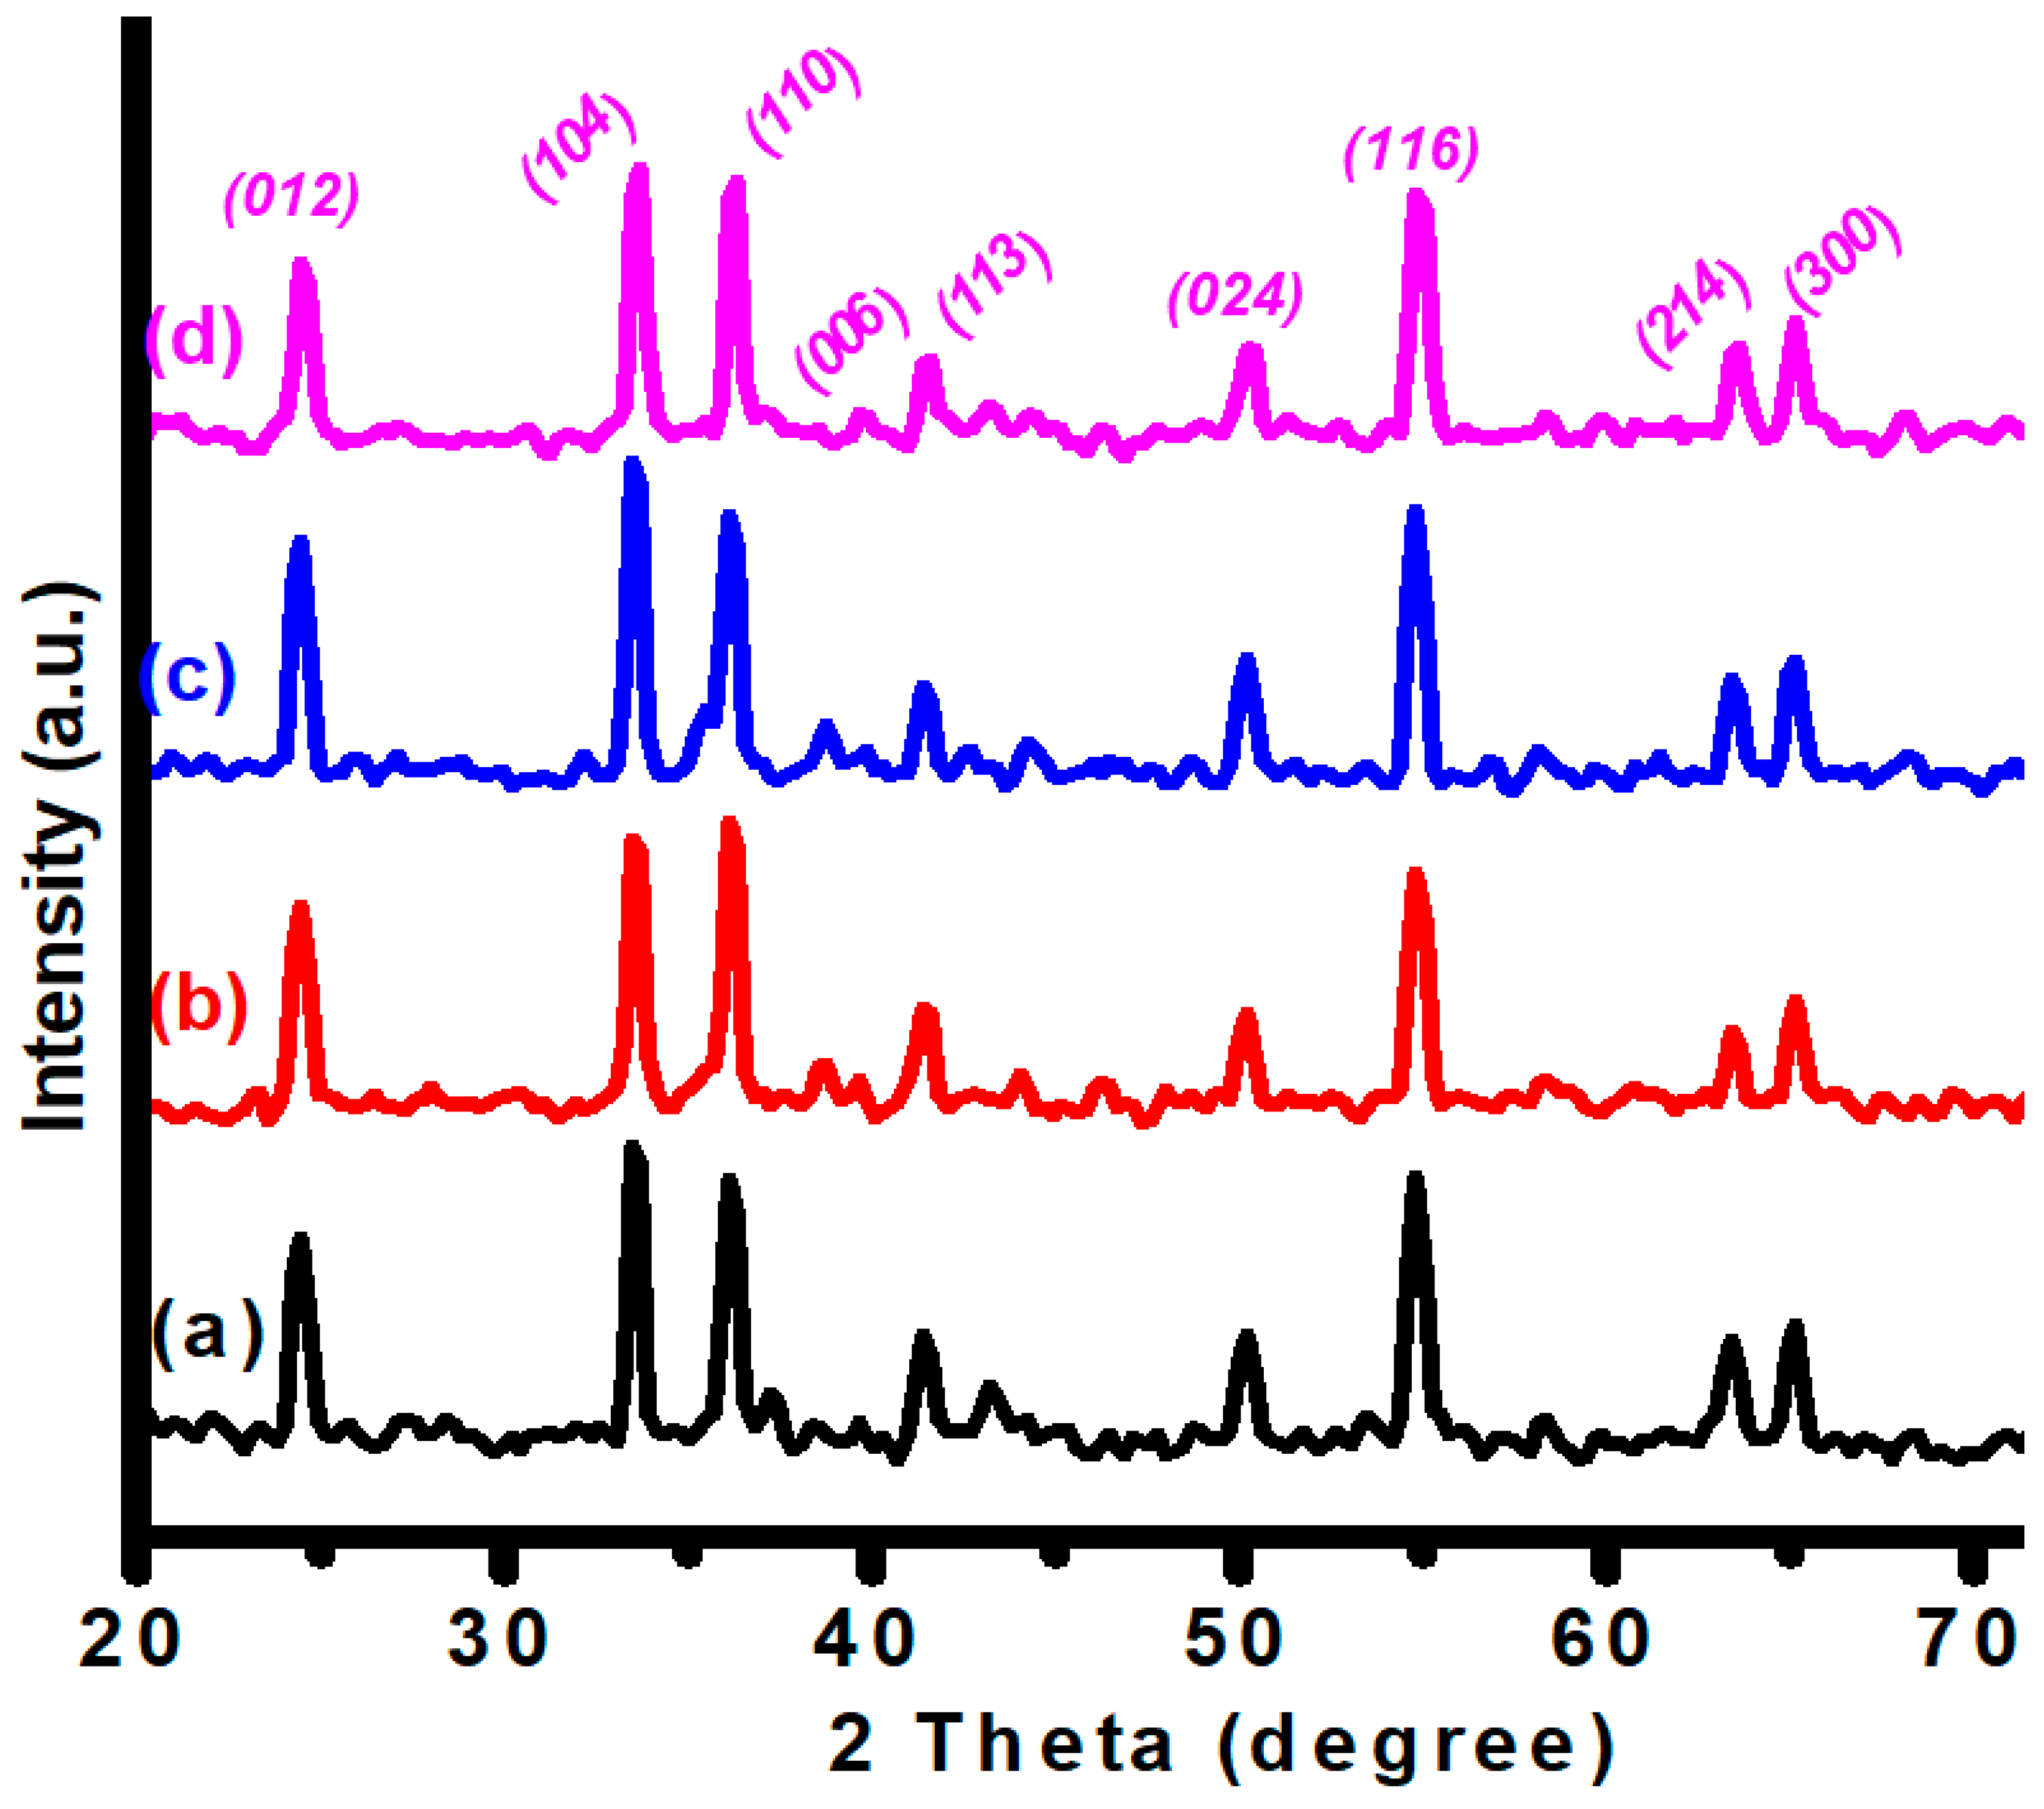
XRD was used to determine the samples’ crystal structure in the 2θ range of 20–70 while employing Cu-Ka radiation (k = 1.54 Å) running at 30 kV.
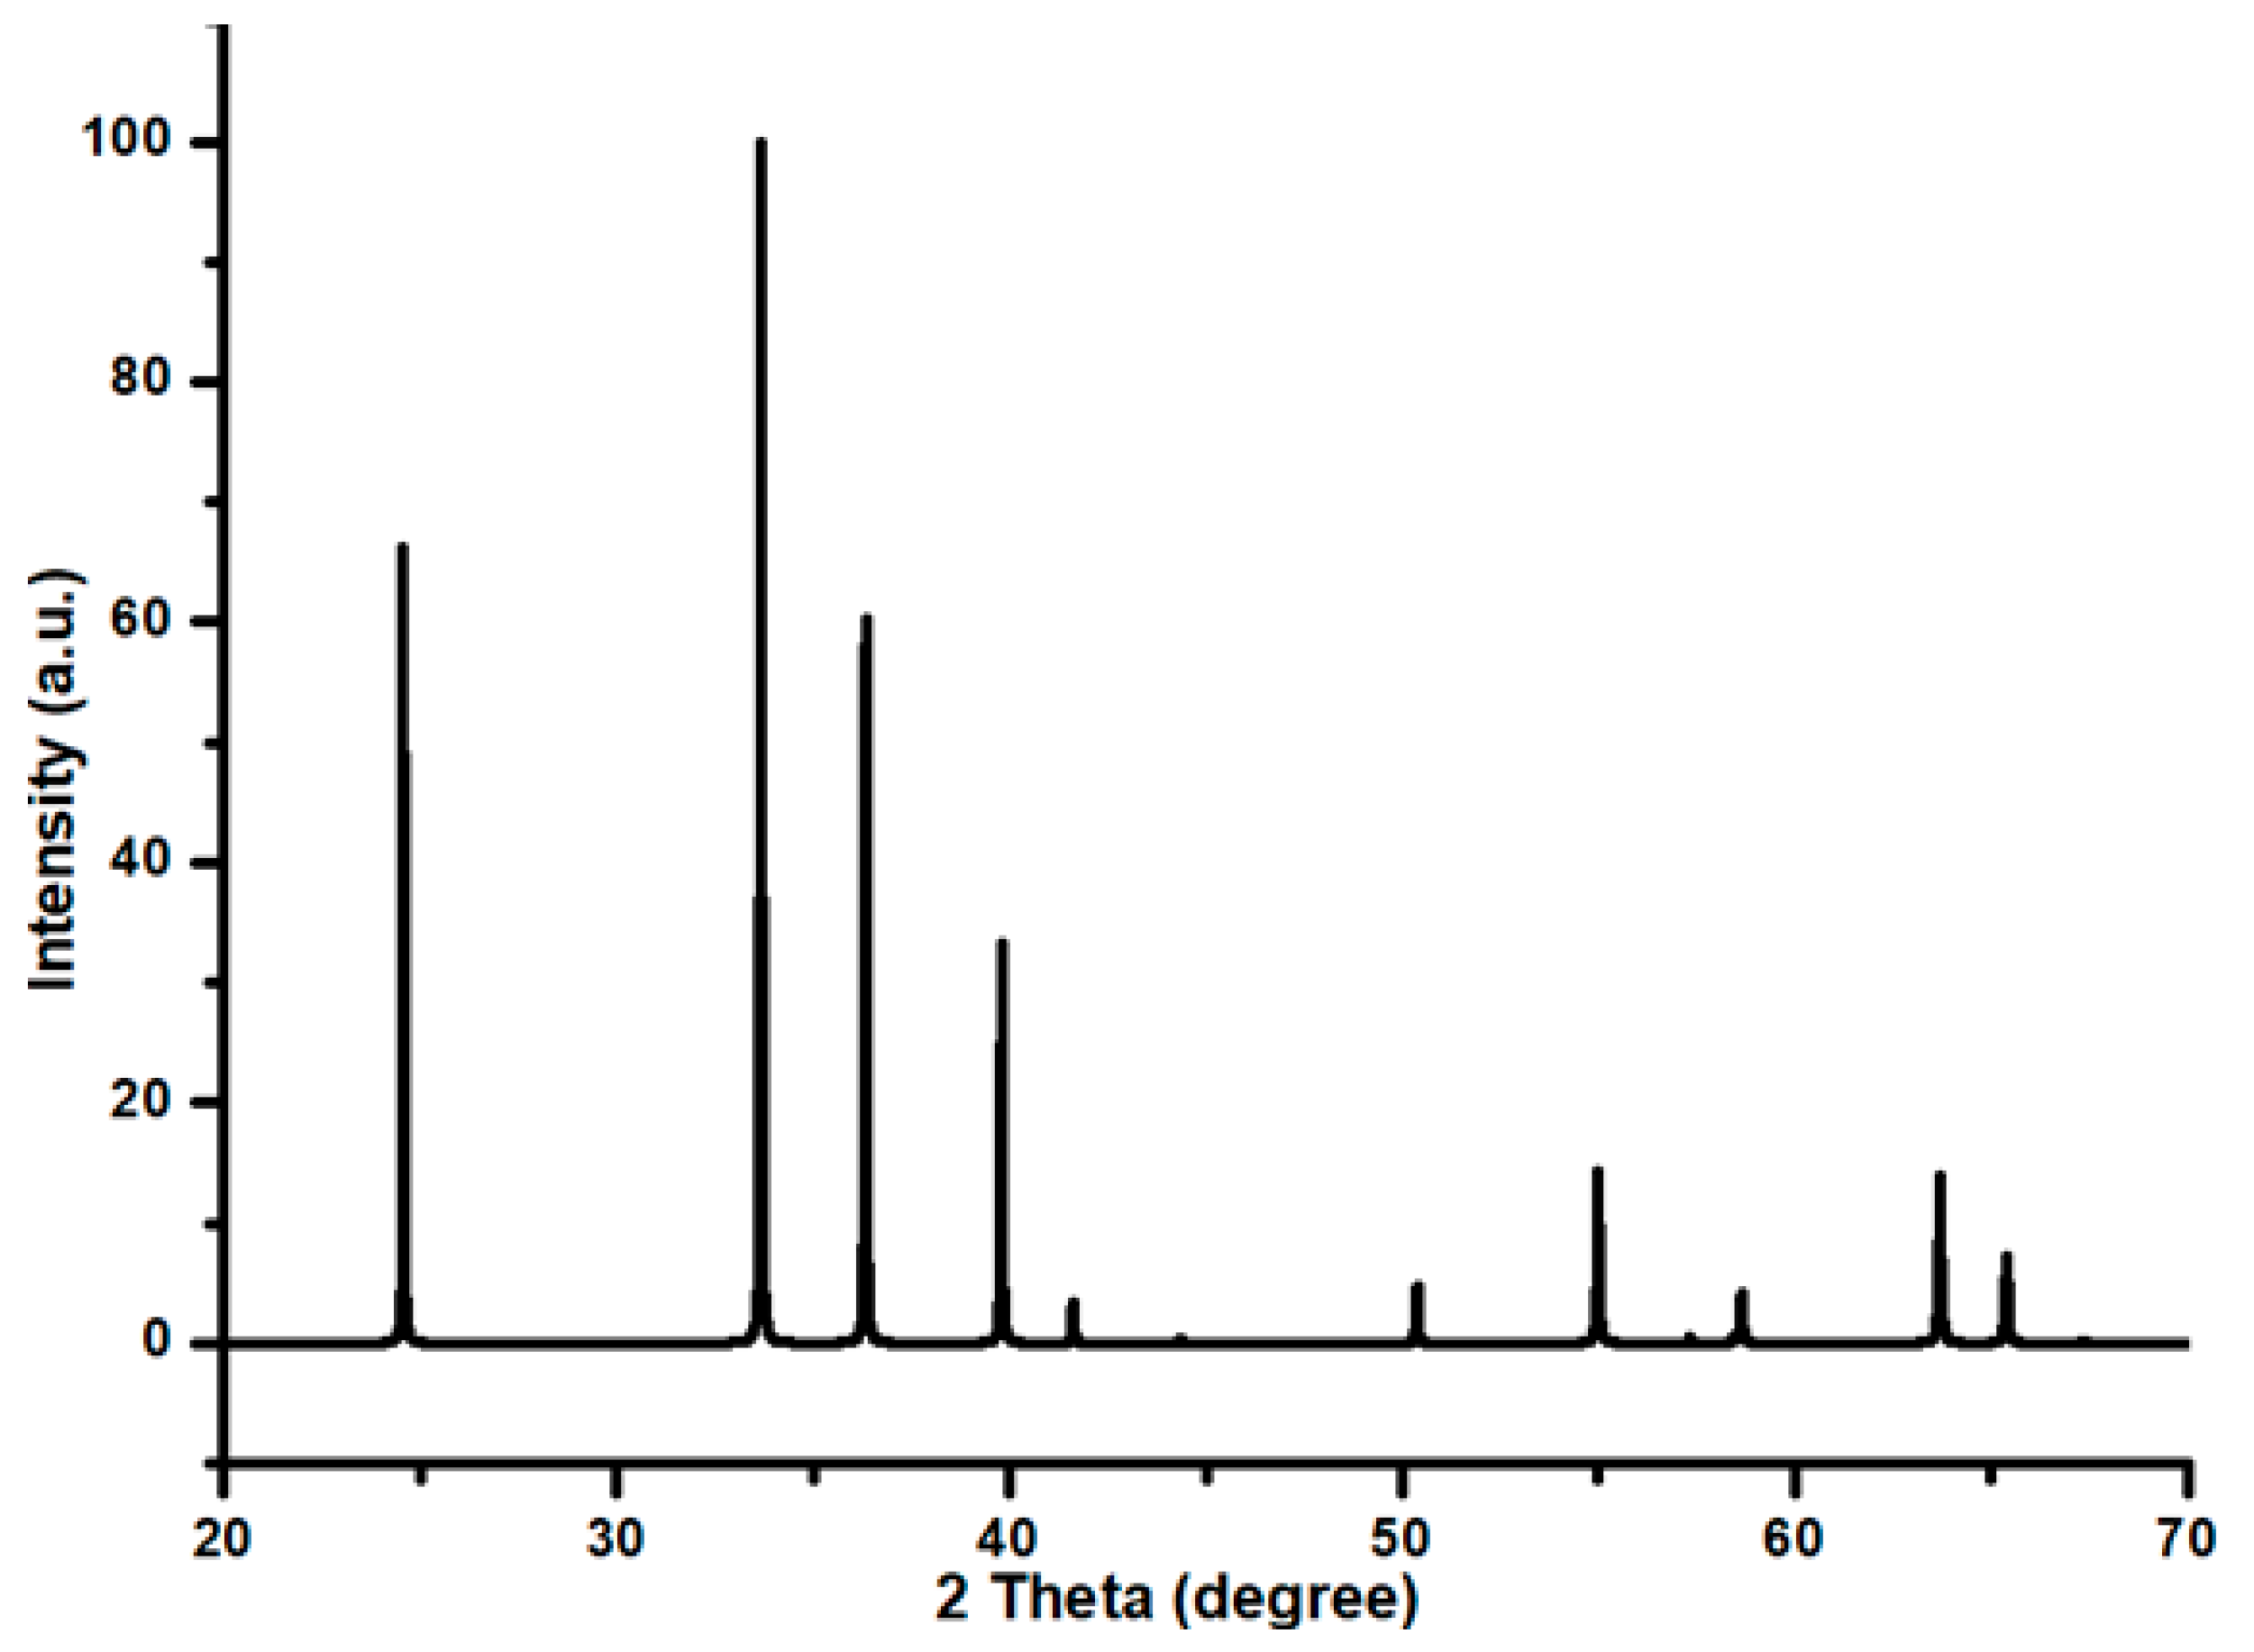
All of the diffracted peaks in the Cr
2O
3 XRD pattern, as seen in
Figure 4, correspond exactly to the space group R-3c rhombohedral crystal structure, as indicated by the peaks’ perfect match to the Cr
2O
3 characteristics reference pattern, ICSD file No. 00-038-1479. This is further confirmed by the simulated XRD pattern of Cr
2O
3, as given in
Figure A1. Such a diffraction pattern was also recorded by Afzal et al. [
28] for Cr
2O
3 while working on the magnetic and structural phase transition of Cr
2O
3 nanoparticles. There were no observable impurity peaks in the pattern. Similarly, no diffraction line was observed for Cu and Ni metal oxide. This is an indication that these metal oxides may be present in a well-dispersed form. The XRD findings confirmed the evidence revealed by the FESEM investigation, where a well-dispersed morphology was observed in each of the Ni-Cu/Cr
2O
3 catalysts. Thus, the resemblance in achieving the results by different analytical techniques for the same materials was well established. In other words, the results revealed by an analytical technique were supported by another analytical technique in terms of both the Cu and Ni metal distribution over the chromia support.
2.5. BET Analysis
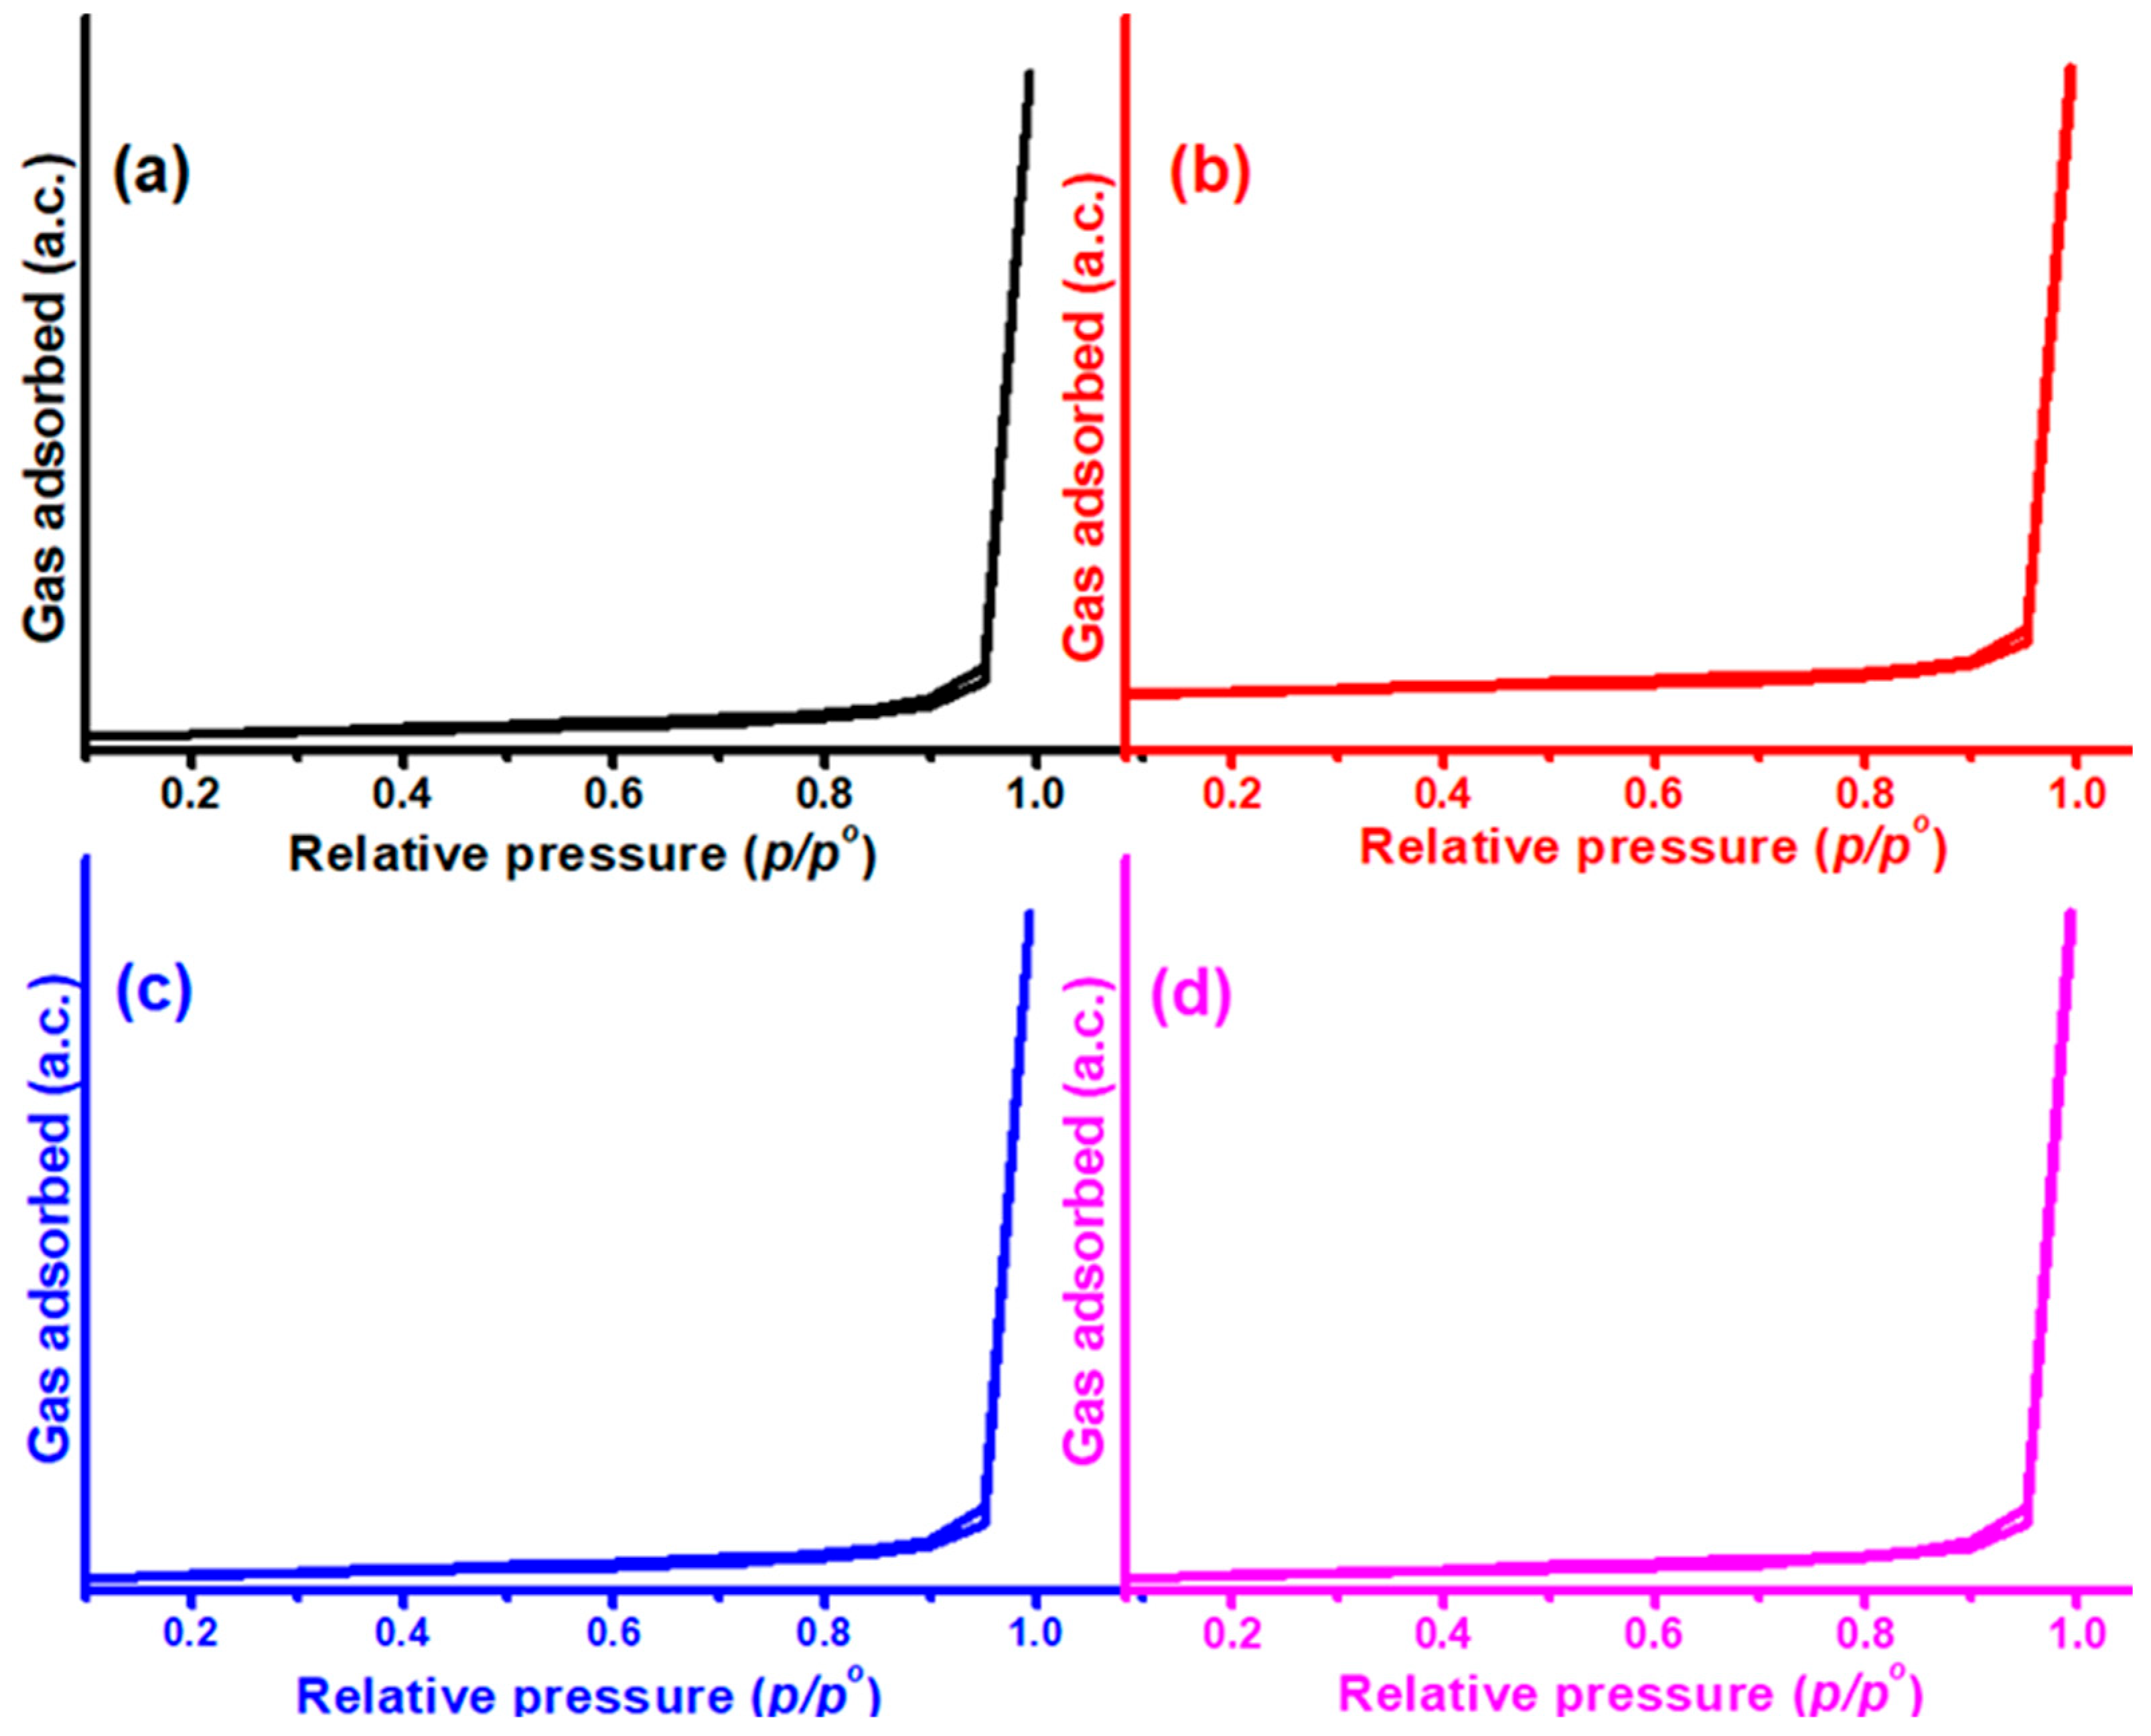
The porosity of Ni-Cu/Cr
2O
3 catalysts was investigated using N
2 adsorption–desorption isotherms. N
2 adsorption–desorption isotherms of the Cr
2O
3 support are shown in
Figure 5.
The typical nitrogen adsorption isotherms of the Cr
2O
3 support are shown in
Figure 5. It is evident that this material has mesoporous features. By displaying an IUPAC Type IV kind of adsorption isotherm associated with hysteresis loops, the isotherms demonstrate that Cr
2O
3-supported catalysts exhibited mesoporosity. Enhancing the Ni addition to the Ni-Cu/Cr
2O
3 catalysts enhanced the BET surface area from 12 to 38 m
2/g (
Table 1). This can also be an indication of the high dispersion of metal oxides with Ni addition.
The metal oxides were only deposited on the mesoporous Cr2O3’s exterior surface, not its interior, according to the BET data. This point was highlighted by the fact that the pore volume of Ni-Cu/Cr2O3 catalysts increased, whereas the pore size remained consistent, regardless of the Ni addition to the Ni-Cu/Cr2O3 catalysts. However, in the case of 6Ni-4Cu/Cr2O3 and 6Ni-4Cu/Cr2O3 catalysts, the pore size increases with an increase in the proportion of nickel. This indicates the deposition of nickel on the inner surface of the mesoporous chromium oxide.
2.6. XPS Investigations of Ni-Cu/Cr2O3 Catalysts
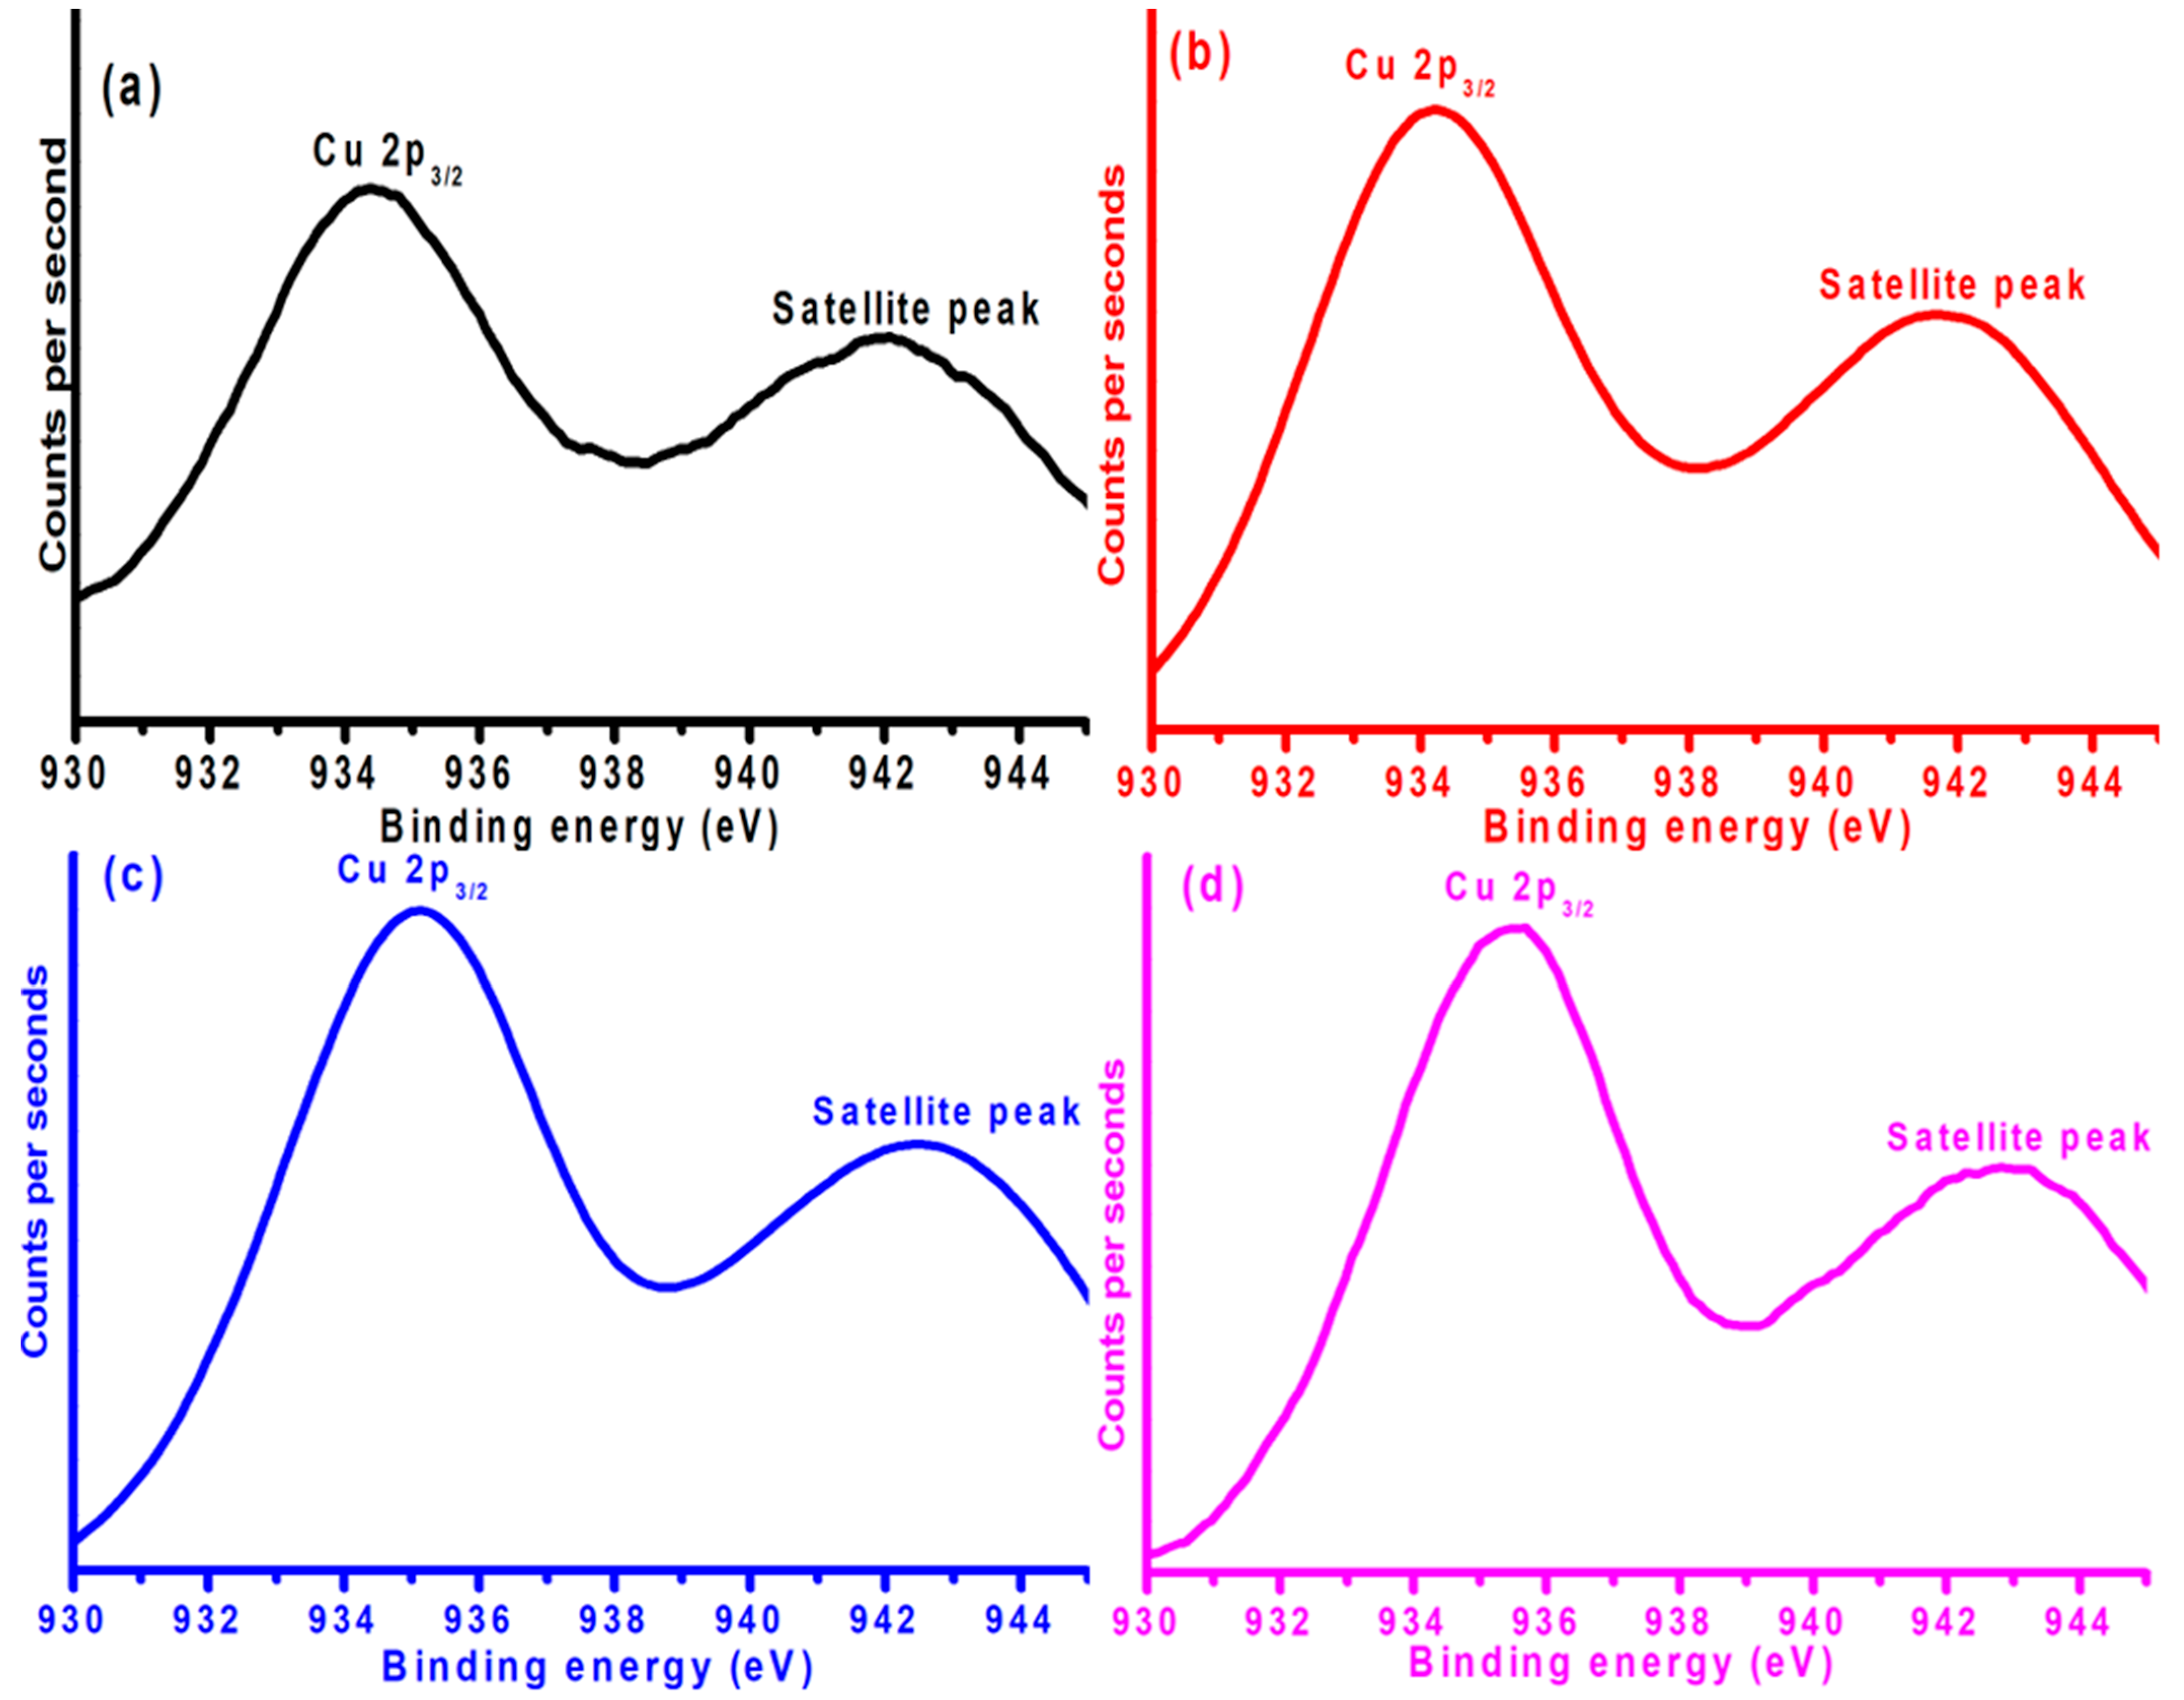
The XPS analysis revealed the surface chemistry of the catalyst components. As shown in
Figure 6, the copper metal was present in the form of CuO. This could be verified by the fact that Cu2p exhibited two XPS peaks. The first XPS peak was observed at around 934 eV; this XPS peak is due to the excitations of Cu2p’s core-level electrons. The second peak is a satellite peak observed around 943 eV. The generation of the satellite peak is the confirmation of the copper oxidation state as Cu
2+ in the form of CuO. Generally, Cu2p’s XPS peak was observed at a relatively lower binding energy region around 932 eV [
21]; however, in the current case, it was observed at a higher binding energy, which implies a greater metal–support interaction. In addition, another interesting observation regarding Cu2p’s XPS peak is the variation in the position of the Cu2p XPS peak with the addition of Ni. By a closer look at Cu2p’s XPS peak, it is evident that the position of the Cu2p XPS peak experienced a shift towards higher binding energy regions when the Ni content increased from 2 to 4% of the weight. More importantly, the same trend regarding the shifting of the Cu2p XPS peak position to a higher binding energy region continues with a further addition of Ni to the Ni-Cu/Cr
2O
3 catalysts. These results demonstrate the clear evidence of the metal–metal interaction between the Ni and Cu in the current work. More importantly, the ease of the reduction profile of Cu by Ni promotion indicates the synergism between the two metals, which resulted in accelerating the catalyst performance, as elaborated in a later section of this article.
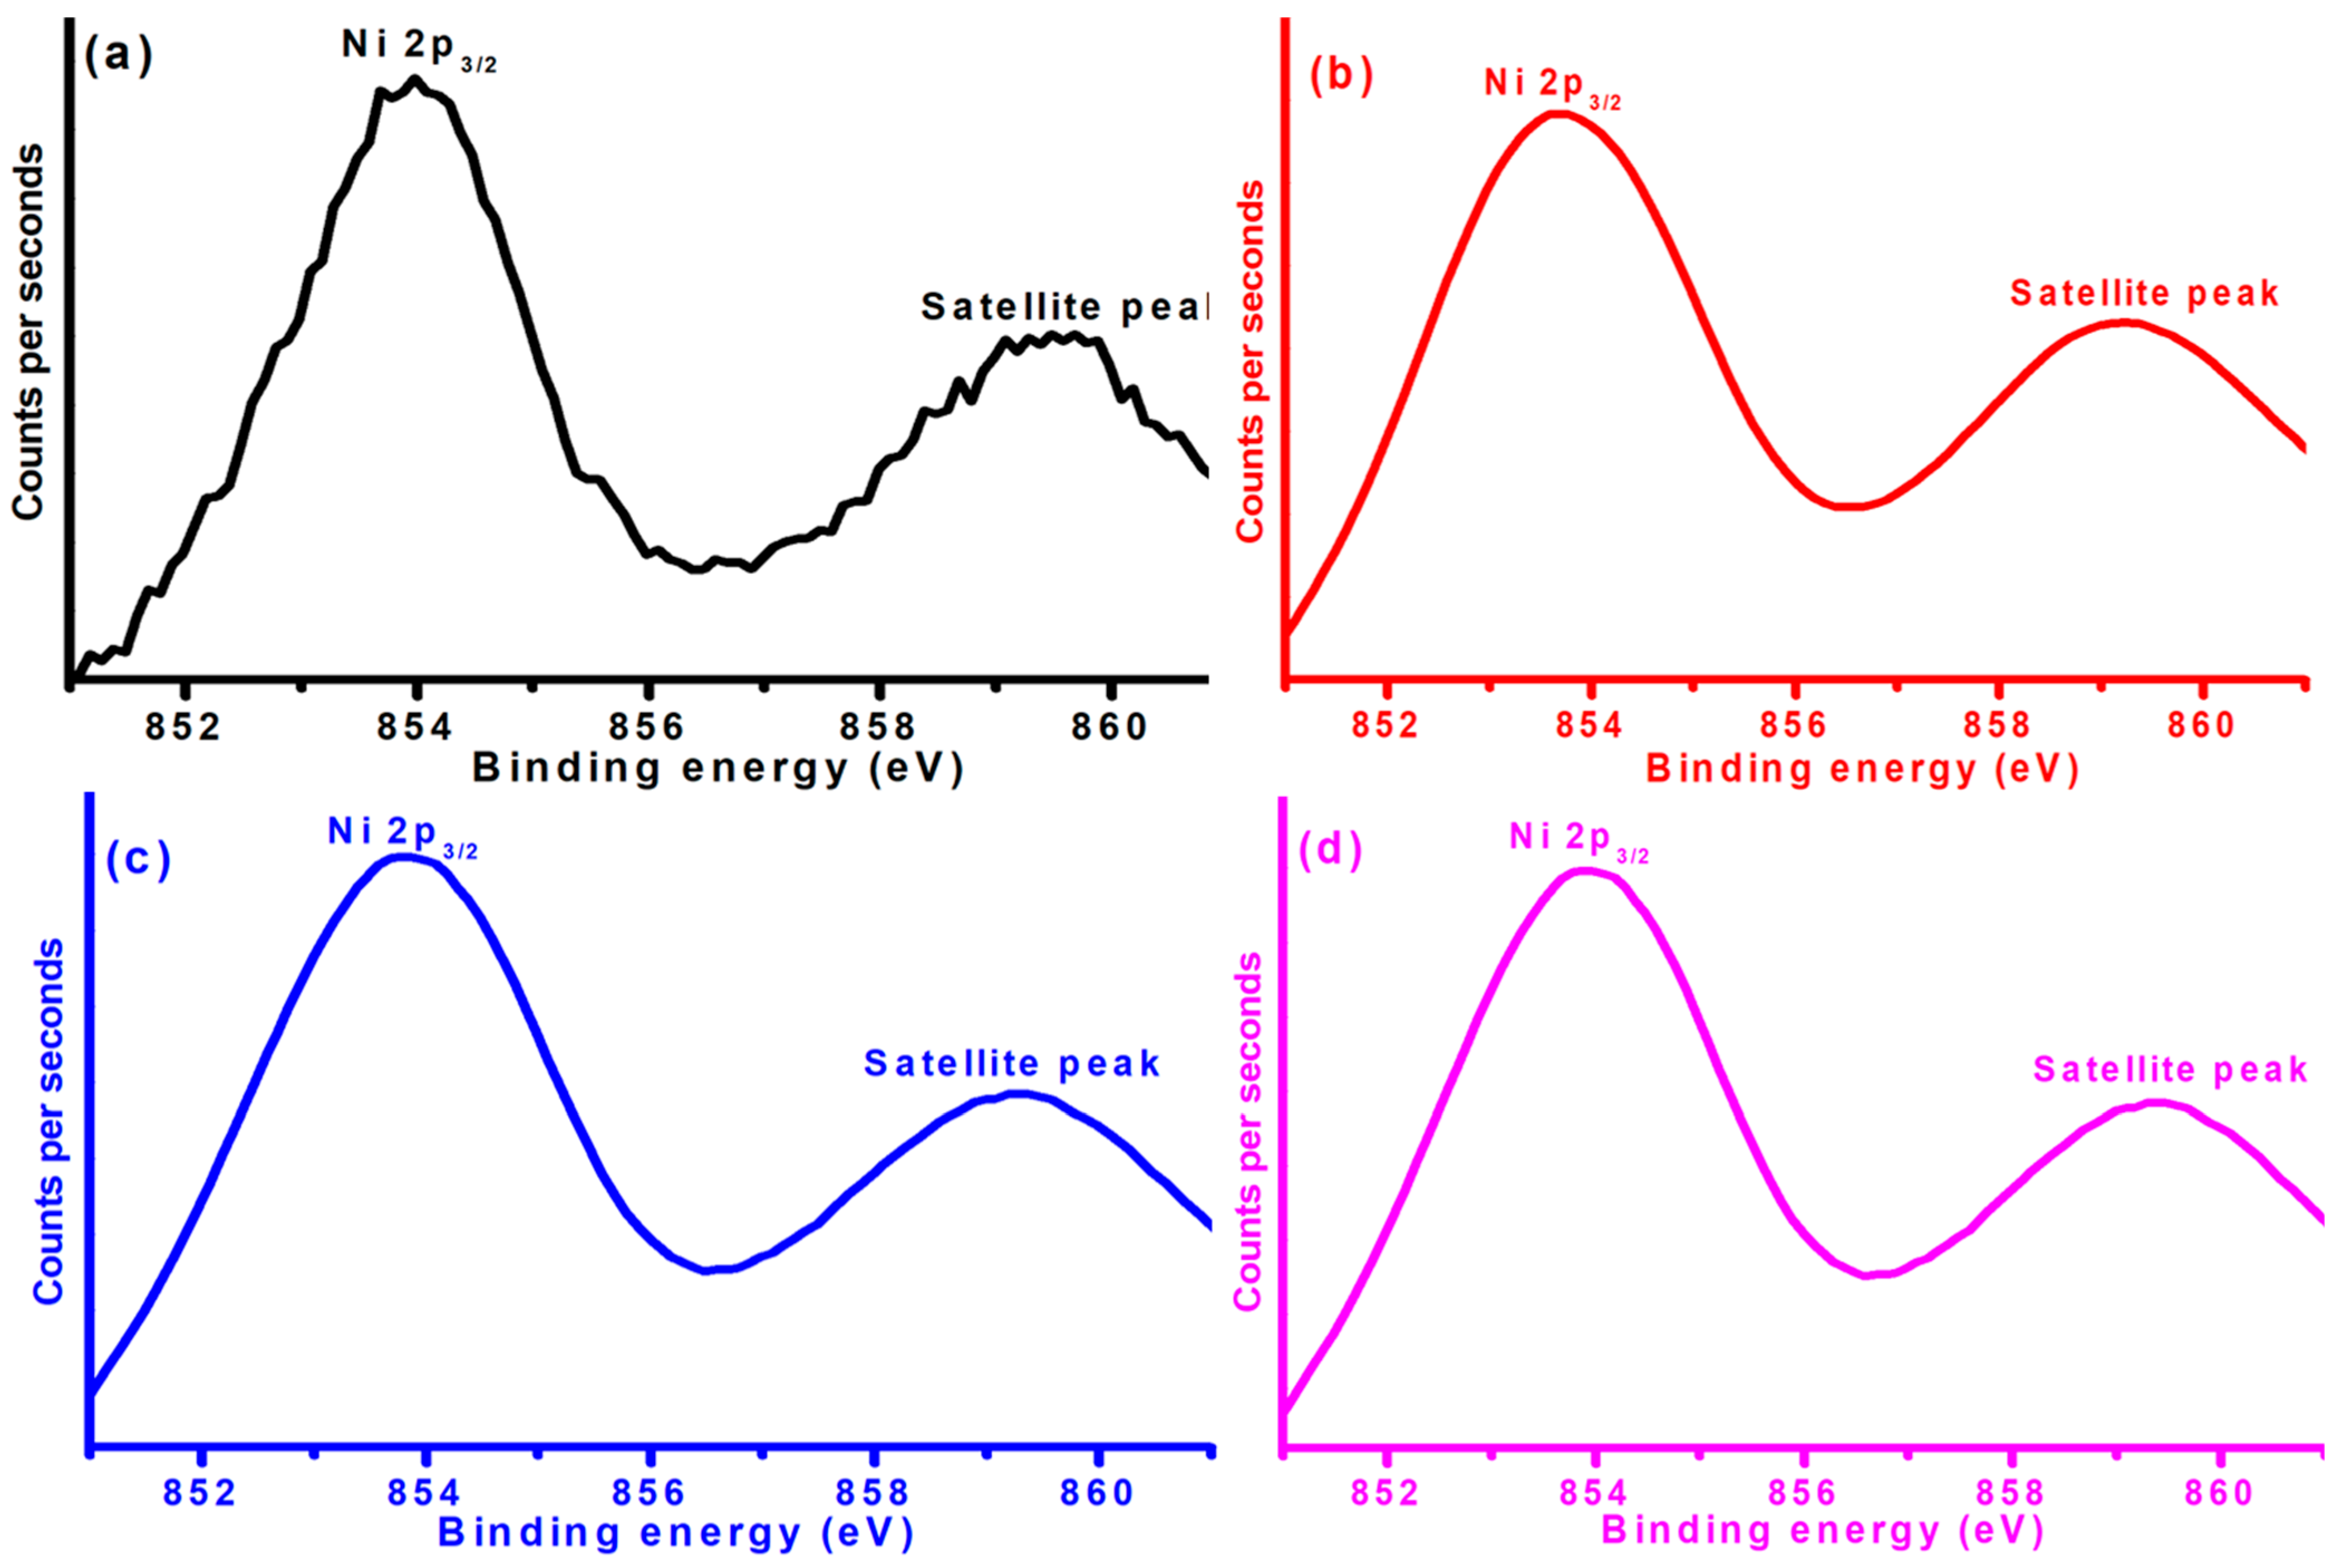
Figure 7 exhibits the XPS peak of Ni 2p in Ni-Cu/Cr
2O
3 catalysts with variation in both Ni and Cu metals. The Ni 2p peak around 854 eV clearly indicates the excitation of core shell electrons of nickel. In addition, this fundamental XPS peak was associated with a shape-up peak observed around 859.5 eV. Such observations were also recorded by Cheng et al. while studying the XPS investigations of nickel in NiCo
2O [
29]. The manifestation of these two XPS peaks confirms the existence of nickel in the form of Ni
2+. In other words, the XPS studies revealed the presence of nickel in the form of NiO.
By summarizing the XPS results, three main conclusions could be drawn, as discussed above, regarding the chemistry of Cu and Ni metals, their mutual interaction, and their interaction with the catalyst support. The XPS investigations confirmed the nature of the oxidation states of both Cu and Ni metals. In addition, the XPS studies also revealed the metal–support interaction. Indeed, the manifestation of the metal–support interaction by XPS investigations is an important finding, as this is believed to be one of the vital factors affecting the catalyst’s performance.
2.7. Reduction Profile of Ni-Cu/Cr2O3 Catalysts
The H
2-TPR of Ni-Cu/Cr
2O
3 catalysts is displayed in
Figure 8. Irrespective of the Ni-Cu metal ratio, three main reduction peaks were observed in the TPR profile of each Ni-Cu/Cr
2O
3 catalyst. A main low-temperature reduction peak (designated as α), which was followed by another adjacent peak (labeled as β), and the last higher-temperature reduction peak (represented by γ) were observed in all Ni-Cu/Cr
2O
3 catalysts.
The lower- and medium-temperature reduction peaks are attributed to the stepwise reduction of copper oxide. The higher-temperature TPR peak was attributed to the reduction of nickel oxide [
30,
31]. By evaluating the TPR profile of each catalyst, three reduction peaks (α, β, and γ) in the case of 2Ni-8Cu/Cr
2O
3 were observed at 227, 275, and 408 °C, respectively. Interestingly, by further intensification of the Ni content, Cu reduction peaks (α and β) experienced a shift towards lower temperatures. This trend in the Cu oxide reduction peaks towards lower temperatures implies the facilitation of the Cu oxide reduction. This trend in the facilitation of Cu by the addition of Ni points out the synergism between the two metals, as indicated earlier by the XPS investigations. Consequently, the increase in the Ni content facilitated the Cu oxide reduction that could potentially contribute to the higher activity of the Ni-Cu/Cr
2O
3 catalyst with a higher Ni content, as the reduced form of copper oxide has been considered a more active form for CO
2 conversion to methanol.
2.8. Results of Activity Studies
Activity of Ni-promoted Ni-Cu/Cr
2O
3 catalysts was conducted in a slurry phase tank reactor.
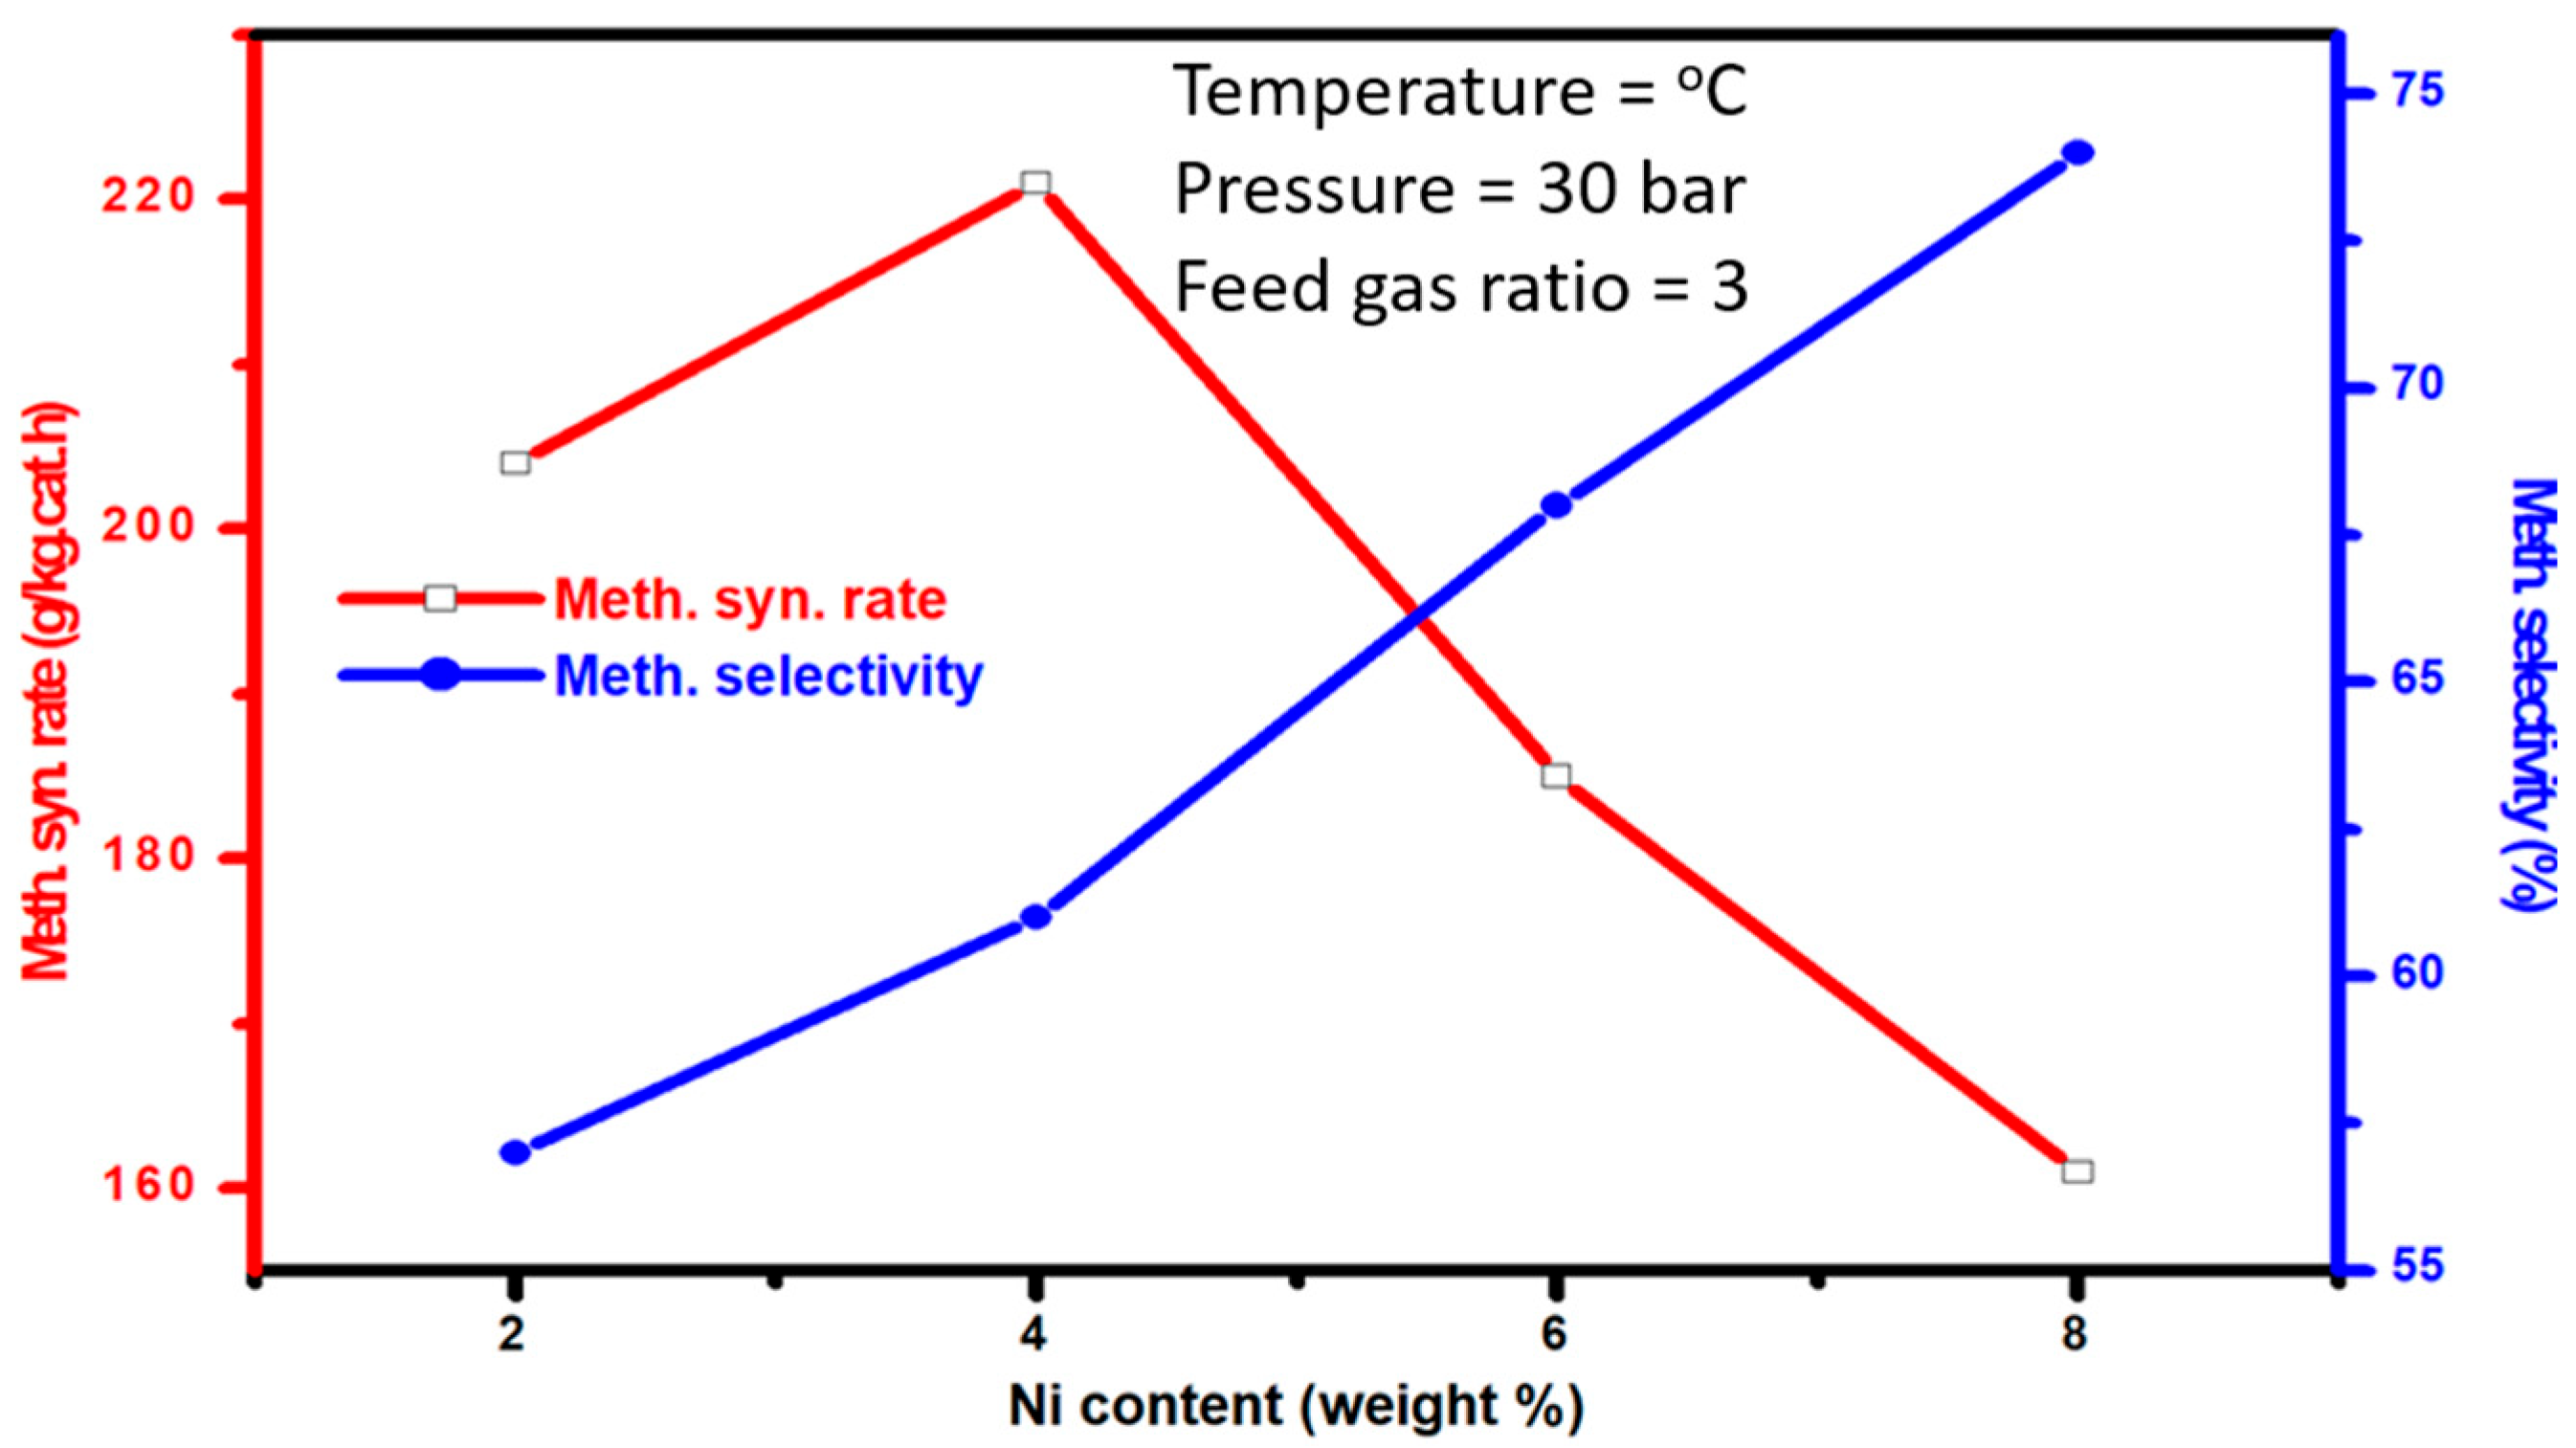
Figure 9 shows the synthesis rate as well as the methanol selectivity of Ni-promoted Ni-Cu/Cr
2O
3 catalysts. As evident from the figure, the methanol synthesis rate was remarkably increased when a Ni promoter was added to the Ni-Cu/Cr
2O
3 catalysts. Furthermore, at the same time that the Ni content was raised from a 2 to 4 weight percentage, an improvement in the rate of methanol synthesis was also observed. However, Ni boosting increased the rate of methanol production up to 4 weight percent; however, the further rise in the Ni content led to a decline in the methanol synthesis rate, as evident from the graph. The decline in the methanol synthesis rate via the further Ni promotion to Ni-Cu/Cr
2O
3 catalysts could be justified by the fact that the addition of Ni to Ni-Cu/Cr
2O
3 catalysts ultimately results in a decreasing concentration of Cu. Hence, with Cu being the active metal, the decline in its concentration will definitely lower the methanol synthesis catalysts. Nevertheless, in contrast to the methanol synthesis rate, methanol selectivity was progressively enhanced by Ni promotion, and the highest methanol selectivity was recorded by Ni-Cu/Cr
2O
3 catalysts with the highest Ni concentration. To sum up the activity investigations, the present investigation verified that the Ni promoter plays a key role in Ni-Cu/Cr
2O
3 catalysts for CO
2 conversion by taking into account the catalysts’ overall activity and their specific methanol selectivity.
In the literature, the role of Ni has been recorded to be promoting methanol synthesis via CO
2 hydrogenation in different ways. Zhu et al. [
32] investigated Ni–In catalysts for the hydrogenation of CO
2 to methanol and concluded that Ni promotes CH
3OH production from CO
2 primarily by low-barrier hydrogen dissociation on Ni surface materials, which facilitates the hydrogenation of adsorbed CO
2, thereby leading to the higher performance of the catalysts. Similarly, Ni-Ga catalysts have been claimed with the promising activity, selectivity, and stability for ambient-pressure CO
2 reduction. On top of that, it was observed that Ni-Ga catalysts outperformed the conventional Cu/ZnO/Al
2O
3 catalyst in terms of their capacity to suppress reverse water gas shift (RWGS) reaction activity in favor of methanol synthesis [
33]. Another work, by Tan et al. [
34], demonstrated that Ni and Cu have a synergistic effect, which promotes bimetallic Cu-Ni dispersion, the reducibility of catalysts, and the ease of the hydrogenation process. Furthermore, a substantial interaction was observed between the Cu-Ni alloy and worked as an active site for the methanol synthesis catalysts.
In line with the literature, the promoting role of Ni in the current work could also be justified by the facts observed during the study of different physicochemical characterization data. As demonstrated by the XPS investigations, the enrichment of Ni in Ni-Cu catalysts resulted in the metal–support interaction. This metal–support interaction is one of the vital factors promoting the performance of the catalysts. Hence, the promoting role of Ni in the current work could also be dependent on the metal–support interaction with Ni addition. Similarly, the metal–metal interaction, as observed in the case of Ni-Cu, could also be another driving force leading to the higher performance of Ni-Cu/Cr2O3 catalysts for CO2 hydrogenation to methanol. An easily reduced form of Cu is another parameter leading to higher activity in the methanol synthesis catalysts. The temperature program reduction studies of the current Ni-Cu/Cr2O3 catalysts revealed that increasing the Ni content in Ni-Cu/Cr2O3 catalysts facilitates the reduction of copper. This trend in aiding Cu reduction via Ni promotion also amplified the methanol synthesis rate, as displayed by the Ni-Cu/Cr2O3 catalysts’ activity data.
Comparative study data for methanol synthesis with other known slurry phase reactors are displayed in
Table 2. When compared to other published results for the same reaction under comparable conditions, it is clear that the present Ni-promoted Cu- Cu/Cr
2O
3 produced a decent methanol synthesis rate via slurry-phase CO
2 hydrogenation, even with the lower reaction temperature.
3. Experimental
3.1. Materials
In the current work, nickel(II) nitrate hexahydrate, having 99.99% purity and purchased from Merck (Darmstadt, Germany), and copper (II) nitrate hydrate with 99.99% purity and purchased from Sigma-Aldrich (St. Louis, MO, USA) were used. Ammonium hydroxide solution (NH4OH) with a concentration of 25% was used to form an alkaline medium for the preparation of Ni-Cu/Cr2O3 catalysts. The powdered chromium(III) oxide (Cr2O3) with 98% purity purchased from Sigma-Aldrich USA was utilized as a catalyst support to disperse the Ni and Cu metals uniformly.
3.2. Catalysts Synthesis
The co-precipitation method was employed for the manufacturing of Ni-promoted Ni-Cu/Cr2O3 catalysts. For the synthesis of a total of 2 g of 2Ni-8Cu/Cr2O3, after fully dissolving 0.47 g of the copper nitrate hydrate, 0.2 g of nickel nitrate hexahydrate was added to the solution. After two metal salts were entirely dissolved, the solution was given 1.8 g of Cr2O3 powder. Under simple circumstances, Ni-promoted Ni-Cu/Cr2O3 catalysts were synthesized using NH4OH. The temperature of the solution was raised to 85 °C and churned vigorously for an hour while keeping the pH at 8 throughout the synthesis process. The solid mass of catalysts was subsequently obtained by centrifugation for a duration of 15 min at a rate of 1800 rpm. Catalysts were oven-dried overnight. In order to remove nitrates from the catalysts, the dried Ni-promoted Ni-Cu/Cr2O3 catalysts were calcined in air flow for a duration of 4 h at 380 °C in a muffle furnace. The annealed Ni-Cu/Cr2O3 catalysts were made up of different weight percentages, 2;8, 4:6, 6:4, and 8:2, and labeled as 2Ni-8Cu/Cr2O3, 4Ni-6Cu/Cr2O3, 6Ni-4Cu/Cr2O3, and 8Ni-2Cu/Cr2O3 catalysts, respectively.
3.3. Characterization of Catalysts
All catalysts under study had their true Ni and Cu metal content determined using inductively coupled plasma–optical emission spectrometry (ICP-OES). The composition of metals was determined using a Thermo Scientific iCAP 7000 series ICP spectrometer, model 7400 made in Waltham, MA, USA. The thermal stability of Cr2O3 support and Ni-promoted Ni-Cu/Cr2O3 catalysts was gauged using the thermogravimetric analysis (TGA). The TGA of Ni-promoted Ni-Cu/Cr2O3 catalysts was performed using a USA made TGA 2950 apparatus (TA Instruments, New Castle, DE, USA) at a scan rate of 5 °C/min from ambient temperature to 1000 °C. Infrared spectroscopy was used to examine the structure of the Ni-promoted Ni-Cu/Cr2O3 catalysts. The Thermo Scientific model iD5 ATR was utilized in this instance. Using the nitrogen adsorption–desorption isotherms approach, the porosity of the Ni-promoted Ni-Cu/Cr2O3 catalysts was examined. The present work engaged a Germany made Quantachrome-made Autosorb IQ model ASIQA3 device (Quantachrome Instruments, Boynton Beach, FL, USA) for such assessments. Using a Philips X-ray diffractometer made in USA (Thermo Fisher Scientific, Waltham, MA, USA) equipped with CuK radiation (=0.15406 nm), Ni-promoted Ni-Cu/Cr2O3 catalysts were studied via powder X-ray diffraction (XRD) in order to identify each catalyst’s phase. The surface chemistry of both Cu and Ni was assessed by applying X-ray photoelectron spectroscopy (XPS). A monochromated and microfocused Al K-Alpha X-ray source with a Thermo Scientific X-ray Photoelectron Spectrometer K-ALPHA model was utilized for XPS analyses in the current investigation. Temperature-Programmed Reduction (TPR) was used to determine the metal–support interaction and catalyst reduction behavior. To do this, reduction studies were conducted using a TPDRO1100 MS fitted with a thermal conductivity detector (TCD) (GOW-MAC Instrument Company, Whitehall, OH, USA). TPR analysis was carried out using a heating rate of 10 °C min−1 and a temperature range of 30 to 600 °C. The samples were reduced in a 5 vol.% H2/N2 flow.
3.4. Activity Studies
Ni-promoted Ni-Cu/Cr2O3 catalysts were studied for their ability to hydrogenate CO2 to methanol in the Parr 5500 slurry reactor (Parr Instrument Company, Moline, IL, USA). A standard method involved adding 50 milliliters of ethanol as the reaction solvent to a reactor vessel with a 100 milliliter volume. In the reaction vessel, there was 0.5 g of a pre-reduced catalyst hanging. Using reactant gases in the form of a mixture of CO2/H2 having a molar ratio of 1:3, the reaction vessel containing the reaction mixture was closed and subsequently purged at room temperature to remove air and any other contaminant gases. Later, the reactor cell was pressurized to maintain 30 bar reaction pressure. This was followed by intensifying the reaction temperature to reach a desired 210 °C. Gas chromatography (GC) was used to analyze the products using an Agilent-made GC Model 7890B USA made (Agilent Technologies, Inc., Santa Clara, CA, USA). Methanol was only detectable in liquid form; hence, a flame ionization detector (FID) (Agilent Technologies, Inc., Santa Clara, CA, USA) was used. A flame ionization detector (FID) was used to measure the amount of methanol produced in liquid form. The GC column (DB-ALC1 model), which is 30 m long and has an internal diameter of 0.320 mm, is specifically made for alcohol separation. The carrier gas, helium, had a flow rate of 5 milliliters per minute.
The following formula was used to determine the rate of methanol synthesis:
The methanol selectivity was evaluated as follows:
