Article

Citrus aurantiifolia Peel-Facilitated Synthesis of Zinc Oxide, Interfaced with Biomass-Assisted Graphene Oxide for Enhanced Photocatalytic Degradation of Dye

1
School of Chemical Sciences, Universiti Sains Malaysia, Penang 11800, Malaysia
2
Department of Chemistry, Faculty of Science, University of Sabratha, Sabratha 00218, Libya
3
Interdisciplinary Research Center, Membranes and Water Security, King Fahd University of Petroleum and Minerals, Dhahran 31261, Saudi Arabia
4
Department of Botany, Aligarh Muslim University, Aligarh 202002, India
5
Department of Chemistry, Aligarh Muslim University, Aligarh 202002, India
*
Author to whom correspondence should be addressed.
Catalysts 2025, 15(9), 874; https://doi.org/10.3390/catal15090874
Submission received: 20 June 2025 / Revised: 8 September 2025 / Accepted: 9 September 2025 / Published: 12 September 2025

Abstract

This study synthesizes zinc oxide (ZnO) and graphene oxide (GO) nanomaterials using a green and sustainable method. ZnO nanoparticles were synthesized from lime peel extract, while GO was obtained utilizing oil palm empty fruit bunch (OPEFB) fibre. The resulting ZnO/GO nanocomposites were characterized using Fourier transform infrared (FTIR), photoluminescence (PL), X-ray diffraction (XRD), scanning electron microscopy (SEM), transmission electron microscopy (TEM), ultraviolet–visible diffuse reflectance spectroscopy (UVDRS), and Raman spectroscopy (RS), confirming their successful synthesis, reduced particle size, altered band gap, and enhanced charge separation properties. The photocatalytic activities of the ZnO/GO nanocomposites were evaluated for MB degradation under visible light. Notably, the ZnO/GO (7%) composite exhibited better degradation efficiency (87% in 90 min) compared to commercial and synthesized ZnO. The study also optimized key parameters including catalyst loading (1 g L−1), initial dye concentration (0.03 mM), and pH (pH 12 showed highest efficiency). The kinetic studies confirmed a pseudo-first-order reaction, with ZnO/GO (7%) showing the highest rate constant (0.0208 min−1). The scavenger tests identified hydroxyl radicals (OH) as the dominant reactive species. This research presents a sustainable and efficient approach for wastewater treatment, utilizing waste materials to produce high-performance photocatalysts for environmental remediation.

1. Introduction

Rapid industrialization, especially in the textile industry, has caused unprecedented global water pollution, with many compounds found to be carcinogens. Azo-dyes can release aromatic amines, which can have carcinogenic properties [1]. Untreated or partially treated effluents containing dyes like methylene blue (MB) may be responsible for many diseases such as jaundice, cyanosis, tissue necrosis, and, potentially, cancer. The paper, textile, wool, and silk industries use methylene blue and produce a huge amount of wastewater, which pollutes water resources. Beyond human health, this polluted water is also harmful to aquatic ecosystems [1]. Therefore, there is a need to remove these dyes to enable water reuse and reduce environmental discharge, fitting into a sustainability framework. Industrial dye effluents are complex, so conventional wastewater treatment methods often prove less effective. Traditional treatment processes reduce the biochemical oxygen demand and total suspended solids from textile effluents, but not colour, especially reactive dyes [2]. The difficulty in treating some reactive dyes highlights a technological gap in conventional wastewater treatment, emphasizing the need for novel, advanced approaches.
Advanced water purification oxidation process photocatalysis is a promising environmental remediation method. Photocatalysis can degrade dyes, pesticides, drugs, etc., in aqueous systems [3,4]. Though promising, photocatalysis has several inherent limitations and requires careful design for optimal performance. Zinc oxide (ZnO), which has a wide bandgap, requires UV light for activation. Since UV light contributes only 4% of the solar spectrum, this limits efficiency under natural sunlight. A major “bottleneck” for solar-powered applications is wide-bandgap semiconductors’ UV light dependence. This limitation has motivated researchers to work on visible light activity (VLA) enhancement methods like doping and heterojunction formation [5,6]. Zinc oxide (ZnO) is a promising n-type semiconductor photocatalyst, having a wide direct bandgap (3.37 eV), high excitation binding energy, and low toxicity. ZnO generates electron–hole pairs that oxidize organic molecules when exposed to light. Although promising, ZnO faces significant obstacles that limit its practical use. Its wide bandgap limits its light absorption to the UV region, which accounts for only 3–5% of solar spectral radiation, resulting in low photocatalytic efficiency under natural visible light (Supplementary Materials). The rapid recombination of photogenerated electrons and holes reduces efficiency and limits its practical use [7].
Green synthesis methods have gained attention and proven to be sustainable. Plant extracts have been used as reducing and capping agents for ZnO nanoparticle (ZnO NP) synthesis, reducing toxic chemicals [6,8,9]. Citrus peels from Citrus aurantium L. (bitter orange) and Citrus reticulata (mandarin orange/tangerine) are abundant agricultural wastes. The use of lime peel powder (implicitly Citrus aurantifolia or related species) and its phytochemical composition indicate a waste-to-resource transformation. This manages agricultural waste and provides a sustainable source for ZnO NPs, benefiting the environment. These phytochemicals, which include flavonoids (e.g., hesperidin, naringin, neohesperidin, eriocitrin, narirutin, hesperetin, naringenin), alkaloids (e.g., synephrine, N-methyltyramine, quinoline), tannins, amino acids, polyphenols, terpenoids, and carbohydrates (e.g., D-limonene, carotenoids), act as natural reducing and stabilizing agents during the ZnO NP synthesis process [10]. The citrus extracts contain high concentrations of reducing agents like polyphenols and flavonoids that participate in reduction, initiating the formation of nanoparticle nuclei. These biomolecules stabilize the nanoparticles and can lead to variations in surface texture and roughness. Beside reduction, these compounds can cover the newly formed nanoparticles, preventing them from aggregating. Furthermore, non-agglomerated nanoparticles lead to a greater total surface area available for interaction with molecules of pollutants, which is helpful for applications where surface contact is important, such as photocatalysis [8,9,10].
Furthermore, rapid electron–hole recombination limits ZnO-based photocatalyst efficiency [11,12]. By suppressing this recombination, graphene oxide (GO) boosts ZnO photocatalytic activity and efficiency. Graphene oxide (GO) contains oxygen-containing functional groups like hydroxyl, epoxy, and carboxyl. GO is hydrophilic and water-soluble, making it easier to disperse and interact with [3]. It accepts electrons to promote photogenerated charge carrier migration and suppress electron–hole recombination in composite photocatalysts. The charge separation mechanism is essential for semiconductor photocatalysis. GO is a highly effective electron acceptor and transporter due to its electronic properties and large π-conjugated structure. Photogenerated electrons from ZnO’s conduction band can efficiently transfer to GO sheets, preventing rapid hole recombination. This charge separation mechanism is essential for semiconductor photocatalysis. This “electron acceptor and transporter” role of GO suppresses electron–hole recombination and can be described as an “electron highway” [13].
Furthermore, graphene and its derivatives like graphene oxide and reduced graphene oxide were also prepared using biomass such as rice husk, paper cups, chitosan, corn stalk and powder, coconut shell, wheat straw, spruce bark, camphor leaves, banana peel and waste peanut shells, etc. [14]. For instance, a study reported the preparation of graphene oxide from lignin powder [15], while graphene quantum dots using oil palm waste have been reported by other studies [16]. Valorising oil palm empty fruit bunch (OPEFB) fibre for graphene oxide synthesis offers a sustainable material production opportunity. OPEFBs are a promising raw material for graphene oxide production and an affordable and sustainable alternative to commercial graphite. The modified Hummers’ method is used to synthesize GO from OPEFBs by carbonization and oxidation methods. Thus, the enhancement of charge separation and adsorption capacity by GO suggests that ZnO/GO nanocomposites offer a more comprehensive solution, leading to higher degradation efficiencies. Over the last twenty years, researchers have devoted significant efforts to the photo-oxidation of organic dyes utilizing nanocomposites consisting of graphene oxide (GO) and zinc oxide (ZnO). The conversion of palm oil empty fruit bunches to highly stable and fluorescent graphene oxide quantum dots using an eco-friendly approach was reported in the literature [16]. The fabrication of heterostructures such as ZnO/GO and ZnO-rGO seems to reduce the recombination rate of charge carriers and expand light absorption into the visible spectrum [17]. Posa et al. [18] successfully synthesized ZnO/GO nanocomposites utilizing the straightforward wet chemical method, enabling effective photo-mineralization while harvesting sunlight. Conversely, Qin et al. [19] produced ZnO/rGO microsphere nanocomposites through a straightforward solution-based approach, targeting the degradation of methylene blue under UV light. Additionally, Liu et al. developed ZnO/rGO nanocomposites by depositing well-dispersed ZnO nanocrystals onto rGO using a simple microwave-assisted method in an anhydrous environment [20]. The results showed a significant decrease in recombination procedures as a result of producing ZnO/rGO nanocomposites, which could substantially enhance the photocatalytic efficiency of dyes [21,22].
Hence, in the present work, we reported a green synthesis of zinc oxide (ZnO) using lime peel extract, while GO was obtained utilizing oil palm empty fruit bunch (OPEFB) fibre. The resulting ZnO/GO nanocomposites were thoroughly characterized using SEM, TEM, FTIR, UV-Vis DRS, XRD, PL, and Raman spectroscopy, and the photocatalytic performance was investigated by degrading dye.

2. Result and Discussion

2.1. Scanning Electron Microscopy/Energy-Dispersive X-Ray (EDX) Analysis of ZnO (Commercial, Synthesized) and ZnO/GO

In Figure 1A, the SEM image of commercial ZnO shows particles with irregular structures, while the particles of synthesized ZnO were found to have a somewhat uniform distribution, with distinct edges as compared to those of the commercial one, as shown in Figure 1B. It is pertinent to mention here that the particles are in a reasonably hexagonal shape for both cases. However, particles with a smaller size are present in the case of synthesized zinc oxide, which can be seen from the particle distribution graphs [23]. Further, the peaks of zinc and oxygen were observed in both samples, as presented in Figure 1G,H.
Figure 1C shows the elongated shape of ZnO particles embedded onto GO surfaces, which are provided by the functional groups present on GO, such as the hydroxyl or carbonyl group. Interestingly, some changes were also observed due to the interfacing of graphene oxide with ZnO/GO nanocomposite [24]. The peaks of respective elements such Zn, C, and O can be seen in Figure 1I, suggesting the synthesis of a zinc oxide/graphene oxide nanocomposite. Further, Figure 1D–F show the particle distributions of ZnO (commercial), ZnO (synthesized), and ZnO/GO, with average particle sizes of 98.00 nm, 79.53 nm, and 57.25 nm respectively. Kusiak-Nejman et al. found an average particle size of approximately 71 nm for ZnO [23], while Bharadwaj et al. reported 80 nm to 140 nm for ZnO/GO [25]. In another study, the average particle sizes for various composites of ZnO/@GO NCs were reported as 135 nm to 170 nm [26].

2.2. Transmission Electron Microscope (TEM) Analysis of ZnO (Commercial, Synthesized), and ZnO/GO

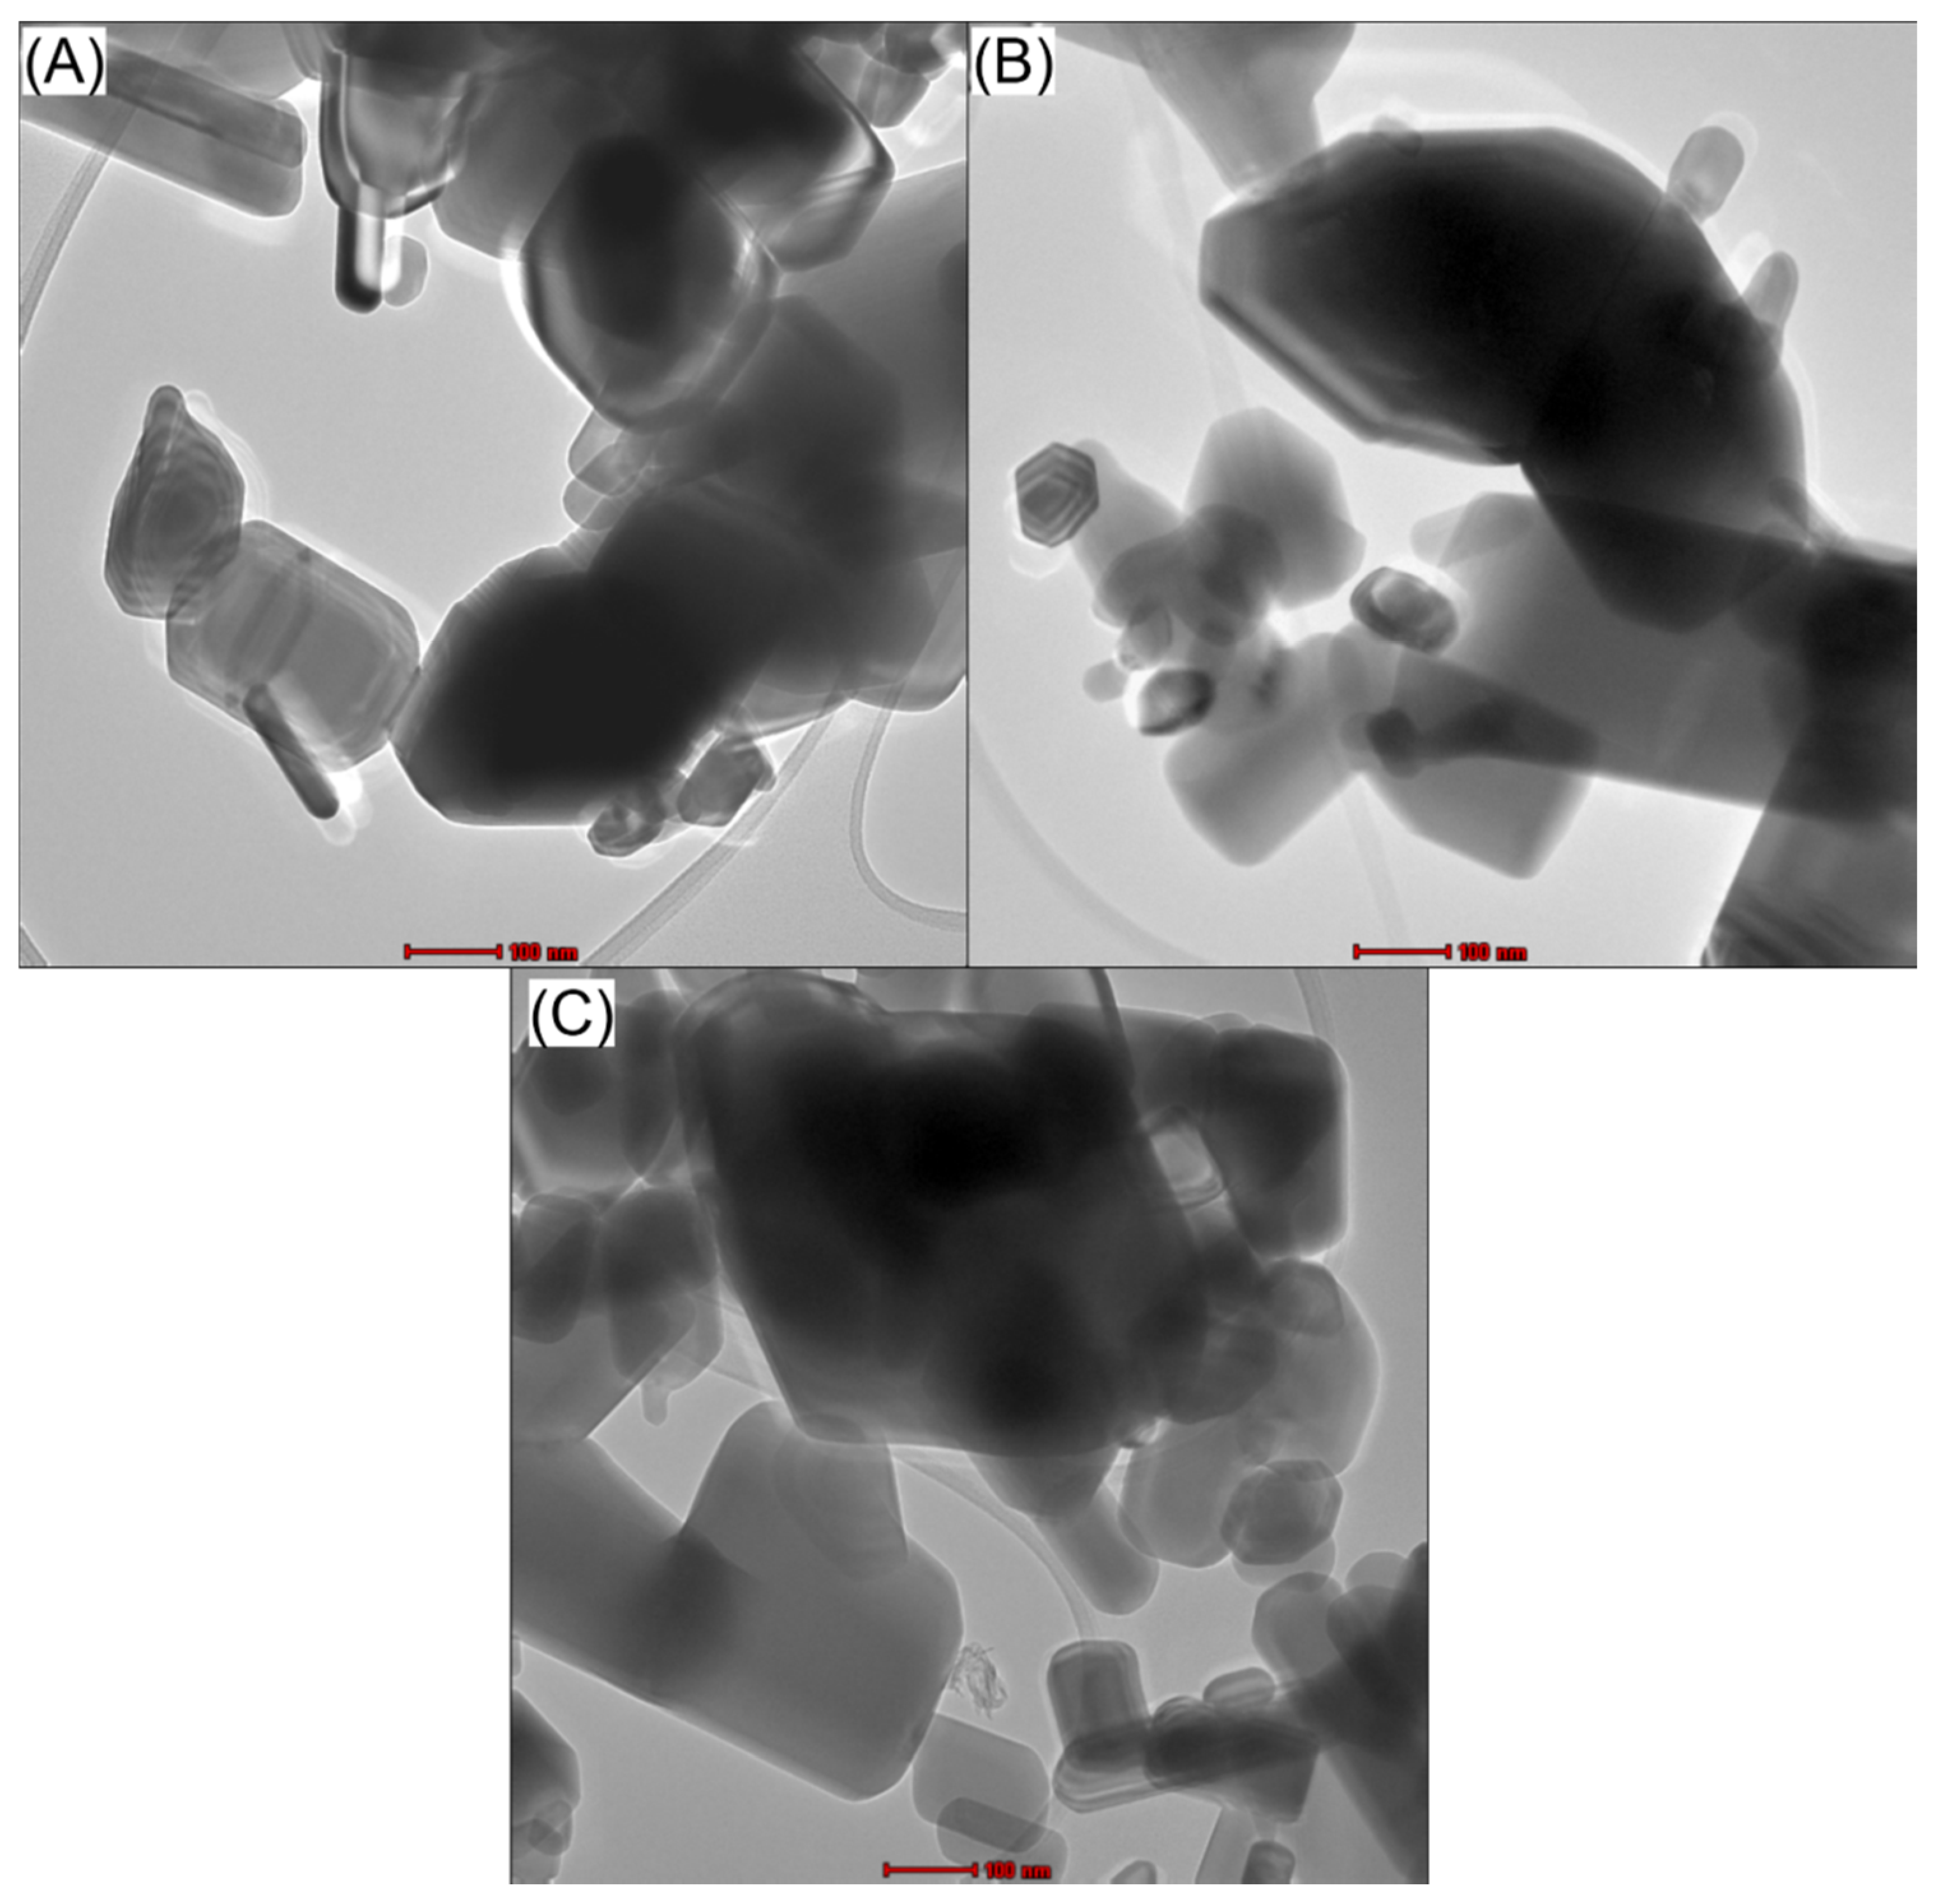
The TEM images of ZnO (commercial), ZnO (synthesized), and the ZnO/GO nanocomposite are presented in Figure 2A, Figure 2B and Figure 2C, respectively. Particles with different sizes were present in the case of zinc oxide. The particle size of ZnO/GO (7%) was found to be smaller compared to that of zinc oxide, which may also be helpful in enhancing photocatalytic activities for the degradation of methylene blue [25]. In the case of ZnO/GO (7%), the decoration of zinc oxide onto the GO surface is attributed to the effective growth and nucleation of GO, facilitated by the presence of functional groups (hydroxyl or carbonyl). The presence of these functional groups is also helpful in photocatalytic activities, trapping the molecules of pollutants [27].

2.3. Fourier Transform Infrared Spectroscopy (FTIR) Analysis of GO, ZnO (Commercial, Synthesized), and ZnO/GO

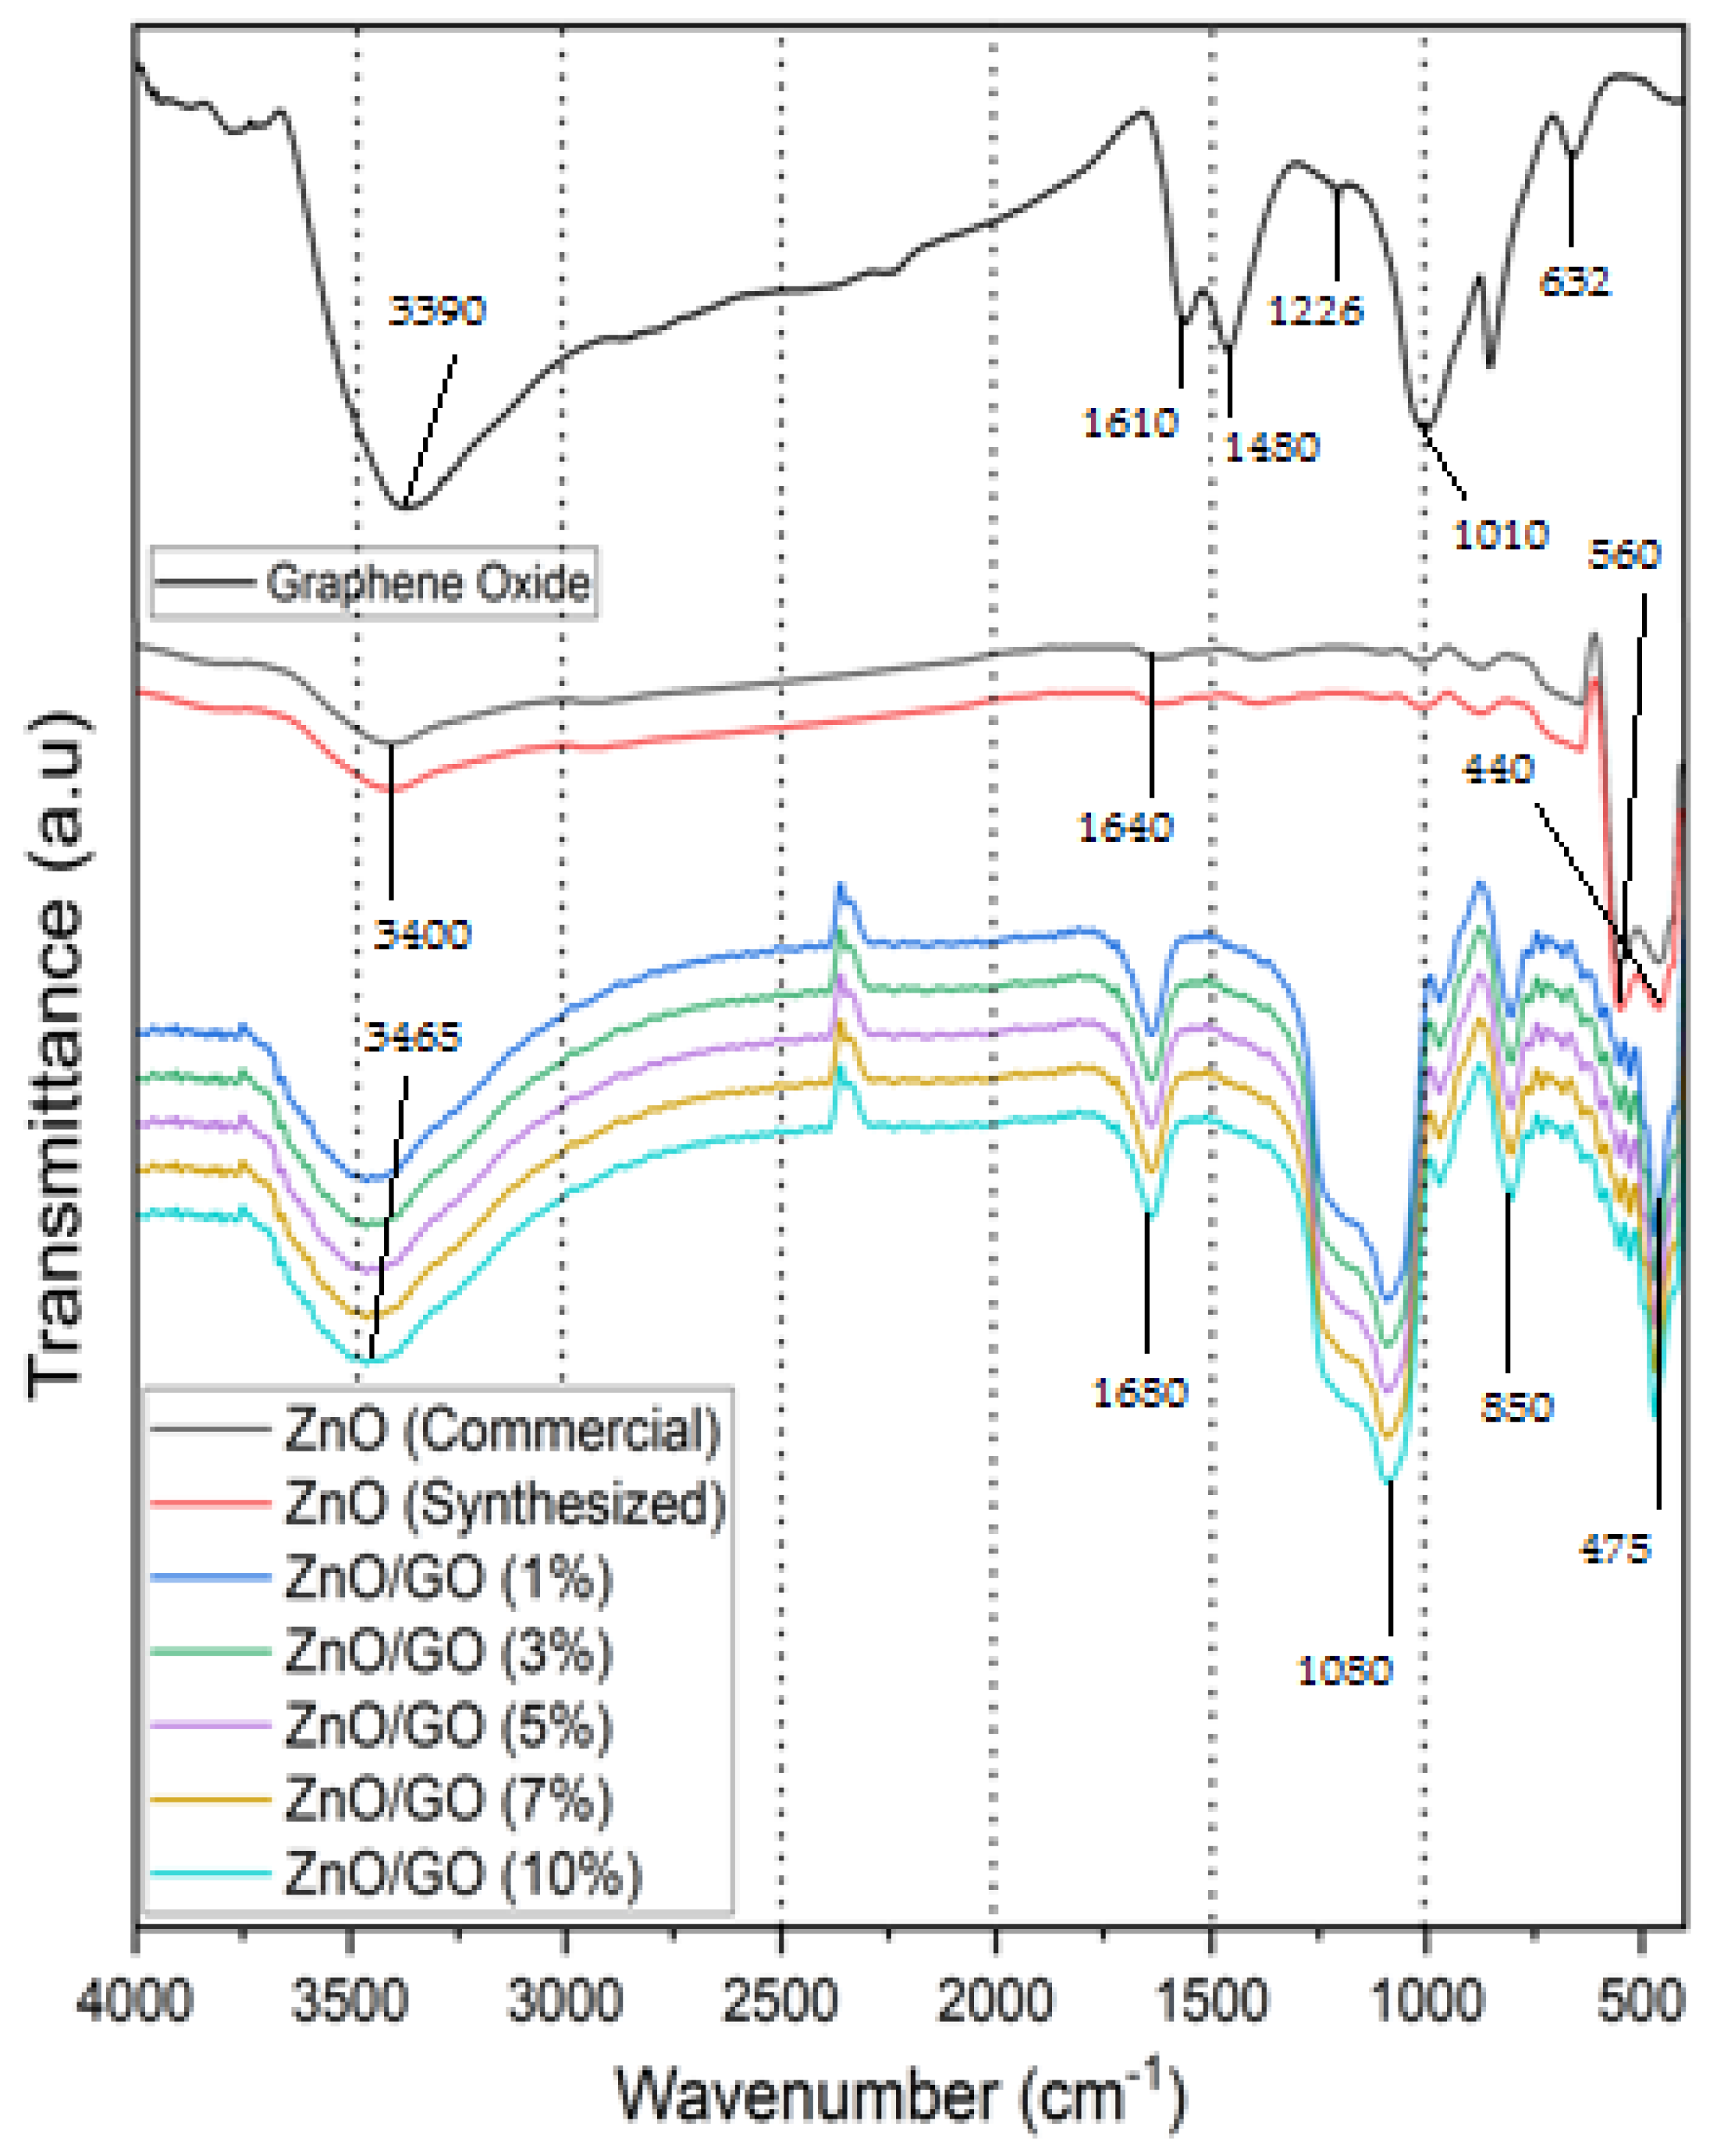
Fourier transform infrared spectroscopy proved a well-organized procedure to analyze the composition/functional groups of compounds. Graphene oxide’s Fourier transform infrared spectrum (Figure 3) shows oxygen-containing groups, with the O–H group stretching vibrations causing the primary absorption peak at 3390 cm−1 [28], while the peak at 632 cm−1 is associated with the bending vibration of the O-H group in hydroxyl groups [29]. A peak at 1480 cm−1 was observed, associated with aromatic ring vibrations and bending vibrations of -CH groups in aromatic rings. The absorption peak at 1610 cm−1 is due to the C=O expanding of carboxylic or carbonyl functional groups [28]. The two absorption peaks observed at about 1216 and 1010 cm−1 are ascribed to the C–O expanding vibrations. The oxygen-containing functional groups like C=O and C–O confirmed that graphite had oxidised to GO [30]. The C=O group in GO allows nanoparticles like ZnO nanoparticles to be linked via covalent or electrostatic bonding, making them useful in various applications. Figure 3 also shows the FTIR spectrum of commercial as well as synthesized ZnO. Based on the FTIR spectrum, the broad absorption band at 3400 cm−1 can be attributed to normal O–H stretching vibrations, which became broad and shifted to 3465 cm−1 in the ZnO/GO composite. In the FTIR spectra of pristine ZnO samples, the vibrational mode detected at 560 cm−1 is linked to the stretching vibration of ZnO [31]. Another distinct peak near 1640 cm−1 is ascribed to the bending vibration of H–O–H, indicating a small amount of H2O in the ZnO nanocrystals [32]. Additionally, the pure ZnO spectrum exhibits two absorption bands at approximately 560 and 440 cm−1, which correlate with the stretching mode frequencies of Zn–O [33]. The medium-to-weak signals observed at 560 cm−1 and 440 cm−1 are attributed to the stretching mode frequencies of Zn–O. This is evidenced by their transformation into a single sharp peak at 475 cm−1 upon the addition of graphene oxide.
The FTIR spectra of ZnO/GO nanocomposites display multiple absorption bands spanning from 400 to 4000 cm−1. The peaks detected at 475 and 850 cm−1 are attributed to the stretching vibration of Zn–O, thereby verifying the existence of ZnO within the nanocomposites [34]. Moreover, the peak identified at approximately 1080 cm−1 can be linked to the stretching vibration of C–O within GO as a result of composite formation [35]. The absorption peaks located at 1680 cm−1 are associated with the stretching vibrations of C=O [36]. The existence of the C=O collection group within GO enables the binding of nanoparticles like zinc oxide nanoparticles, as well as the pollutant molecules, through either covalent bonding or electrostatic interaction, offering an efficient photocatalytic efficiency. Simultaneously, the absorption band at around 3410 cm−1 originates from the stretching vibration of O–H. Notably, alterations in the position and intensity of peaks are evident in the ZnO/GO nanocomposites compared to pure materials, indicating the involvement of functional groups within the ZnO/GO composite [37].

2.4. UV–Visible Diffuse Reflectance Spectroscopy (UV–Vis DRS) Analysis of ZnO (Commercial, Synthesized) and ZnO/GO

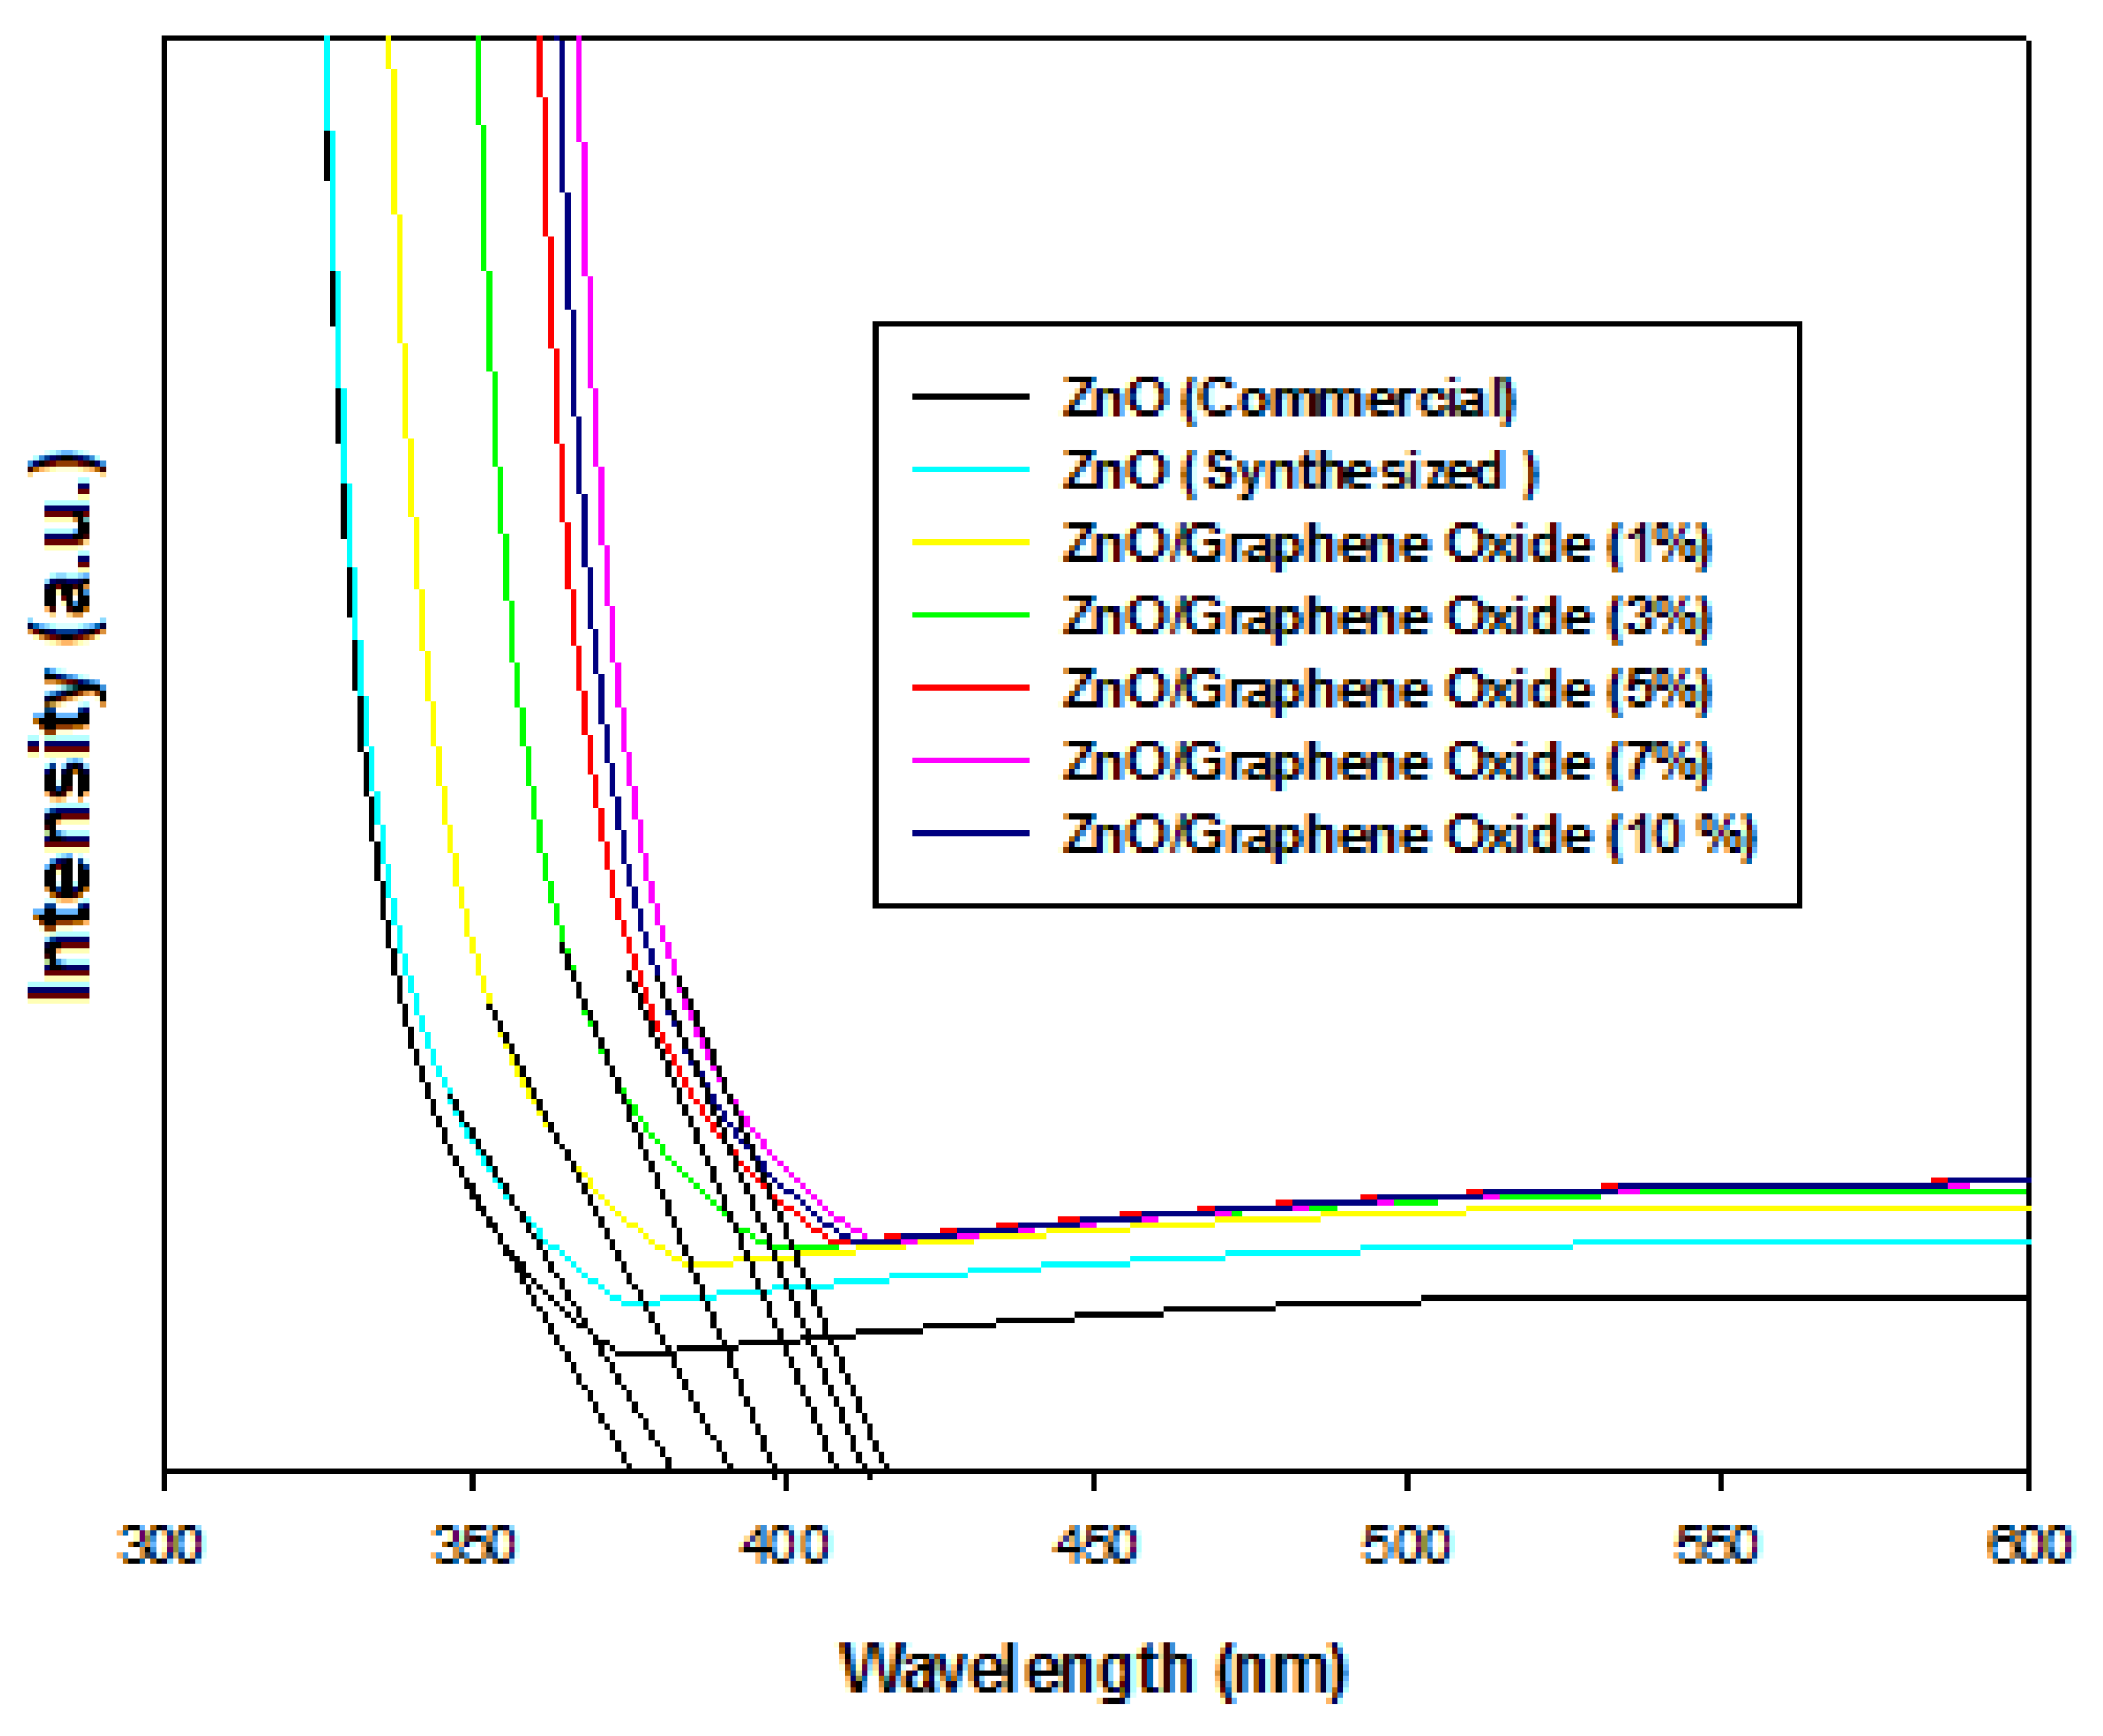
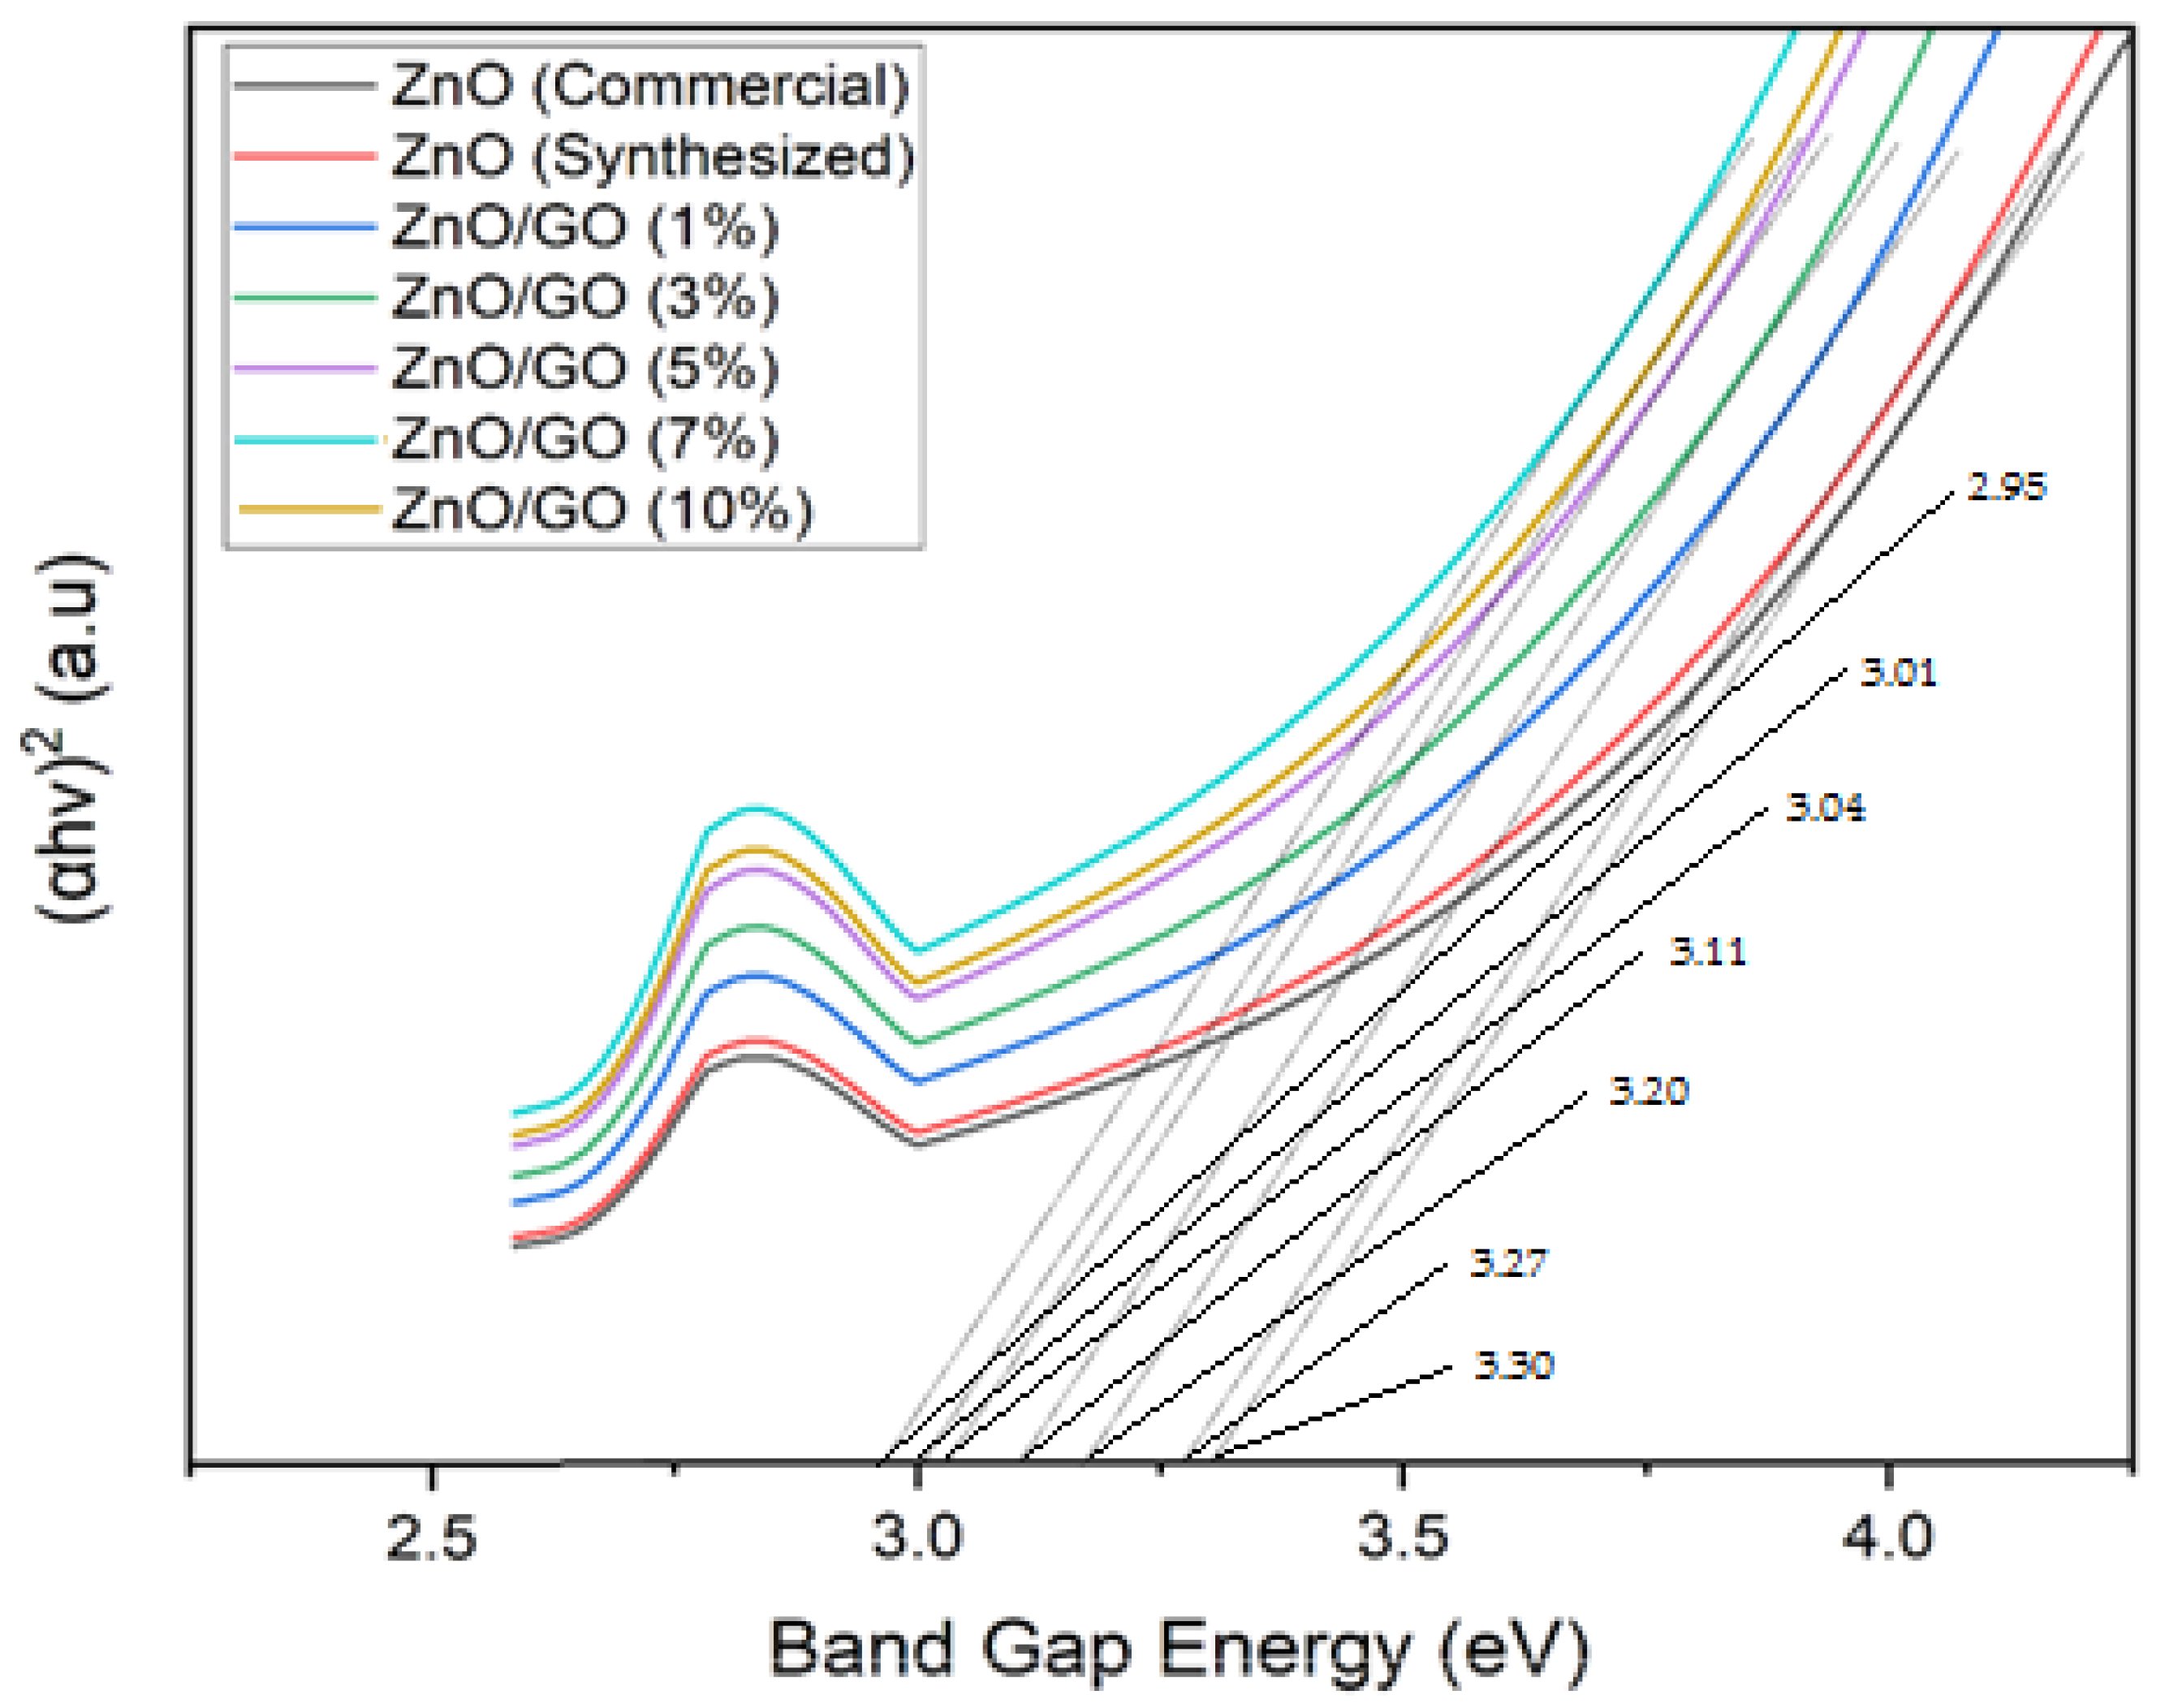
Figure 4 shows the UV–DRS absorption spectrum for commercial ZnO, synthesized ZnO, and ZnO with varying concentrations of graphene oxide. The interfacing of graphene oxide with ZnO occurred, causing a shift in the fundamental absorption edge towards longer wavelengths, which is responsible for the enhanced optical absorption. The bandgap energy value of samples was estimated by plotting a Tauc plot ((αhν)2 vs. (hν) curve) [38]. The optical bandgap energy (Eg) of the produced samples was determined using Equation (1). The bandgap may be determined by extrapolating the linear portion of plot of the graph (αhν)2 vs. (hν), as shown in Figure 5.
αhν = A (hν − Eg) n
The bandgap energy values are somewhat similar (3.30 eV for commercial and 3.27 eV for synthesized), which can be seen in Table 1. Further, the interfacing of graphene oxide with ZnO may lead to decreases in bandgap energy from 3.27 to 2.95 eV, which corresponds to the results demonstrating that all the aforementioned parameters significantly impacted the degradation efficiency. Interfacing ratio of graphene oxide, i.e., 7% [39]. The decrease in bandgap may stem from the relations between unpaired π electrons within graphene oxide structures and surface electrons of zinc oxide, which are excited from the conduction band to the valence band, potentially leading to a notable enhancement in photocatalytic activity within the visible spectrum. Furthermore, the bandgap energy further increases, in spite of decreasing, when the interfacing amount of graphene oxide is further increased, e.g., at a 10% ratio [40]. Moreover, a study decreasing the bandgap energy while interfacing graphene oxide with zinc oxide has been reported in the literature [41]. Another investigation noted a reduction in the bandgap of the ZnO/GO nanocomposite, ascribed to the inclusion of GO, enhancing the surface charge and electronic interaction between ZnO nanoparticles and graphene oxide [42]. The chemical bonding of GO with ZnO could have created defect energy levels, reducing the bandgap energy. Moreover, the optical properties also depend on the crystallinity of the synthesized samples and other disorders, such as structural, chemical, polar, and thermal, which could be present in the crystalline materials. For example, the band energies of ZnO (3.2 eV), ZnO (GO, 5%, 3.15 eV), ZnO (GO, 10%, 3.13 eV), ZnO (GO, 15%, 3.12 eV), and ZnO (GO, 20%, 3.09eV) have been reported in literature [43]. All the aforementioned studies verified that the decrease in bandgap improves the photocatalytic efficacy of the nanocomposite when exposed to visible light or sunlight. The incorporation of GO may initially increase the conjugation length due to the addition of sp2 carbon domains, which may be responsible for the reduction in the bandgap. However, at higher GO concentrations, other factors, like defect formation or changes in the overall structure, could dominate, which lead to increases in the bandgap. Furthermore, some specific bonding arrangements might lead to the observed bandgap changes, as functional groups and structural arrangements can alter the electronic band structure in the material and lead to changes in the bandgap.

2.5. X-Ray-Diffraction (XRD) Analysis of GO, ZnO (Commercial, Synthesized) and ZnO/GO

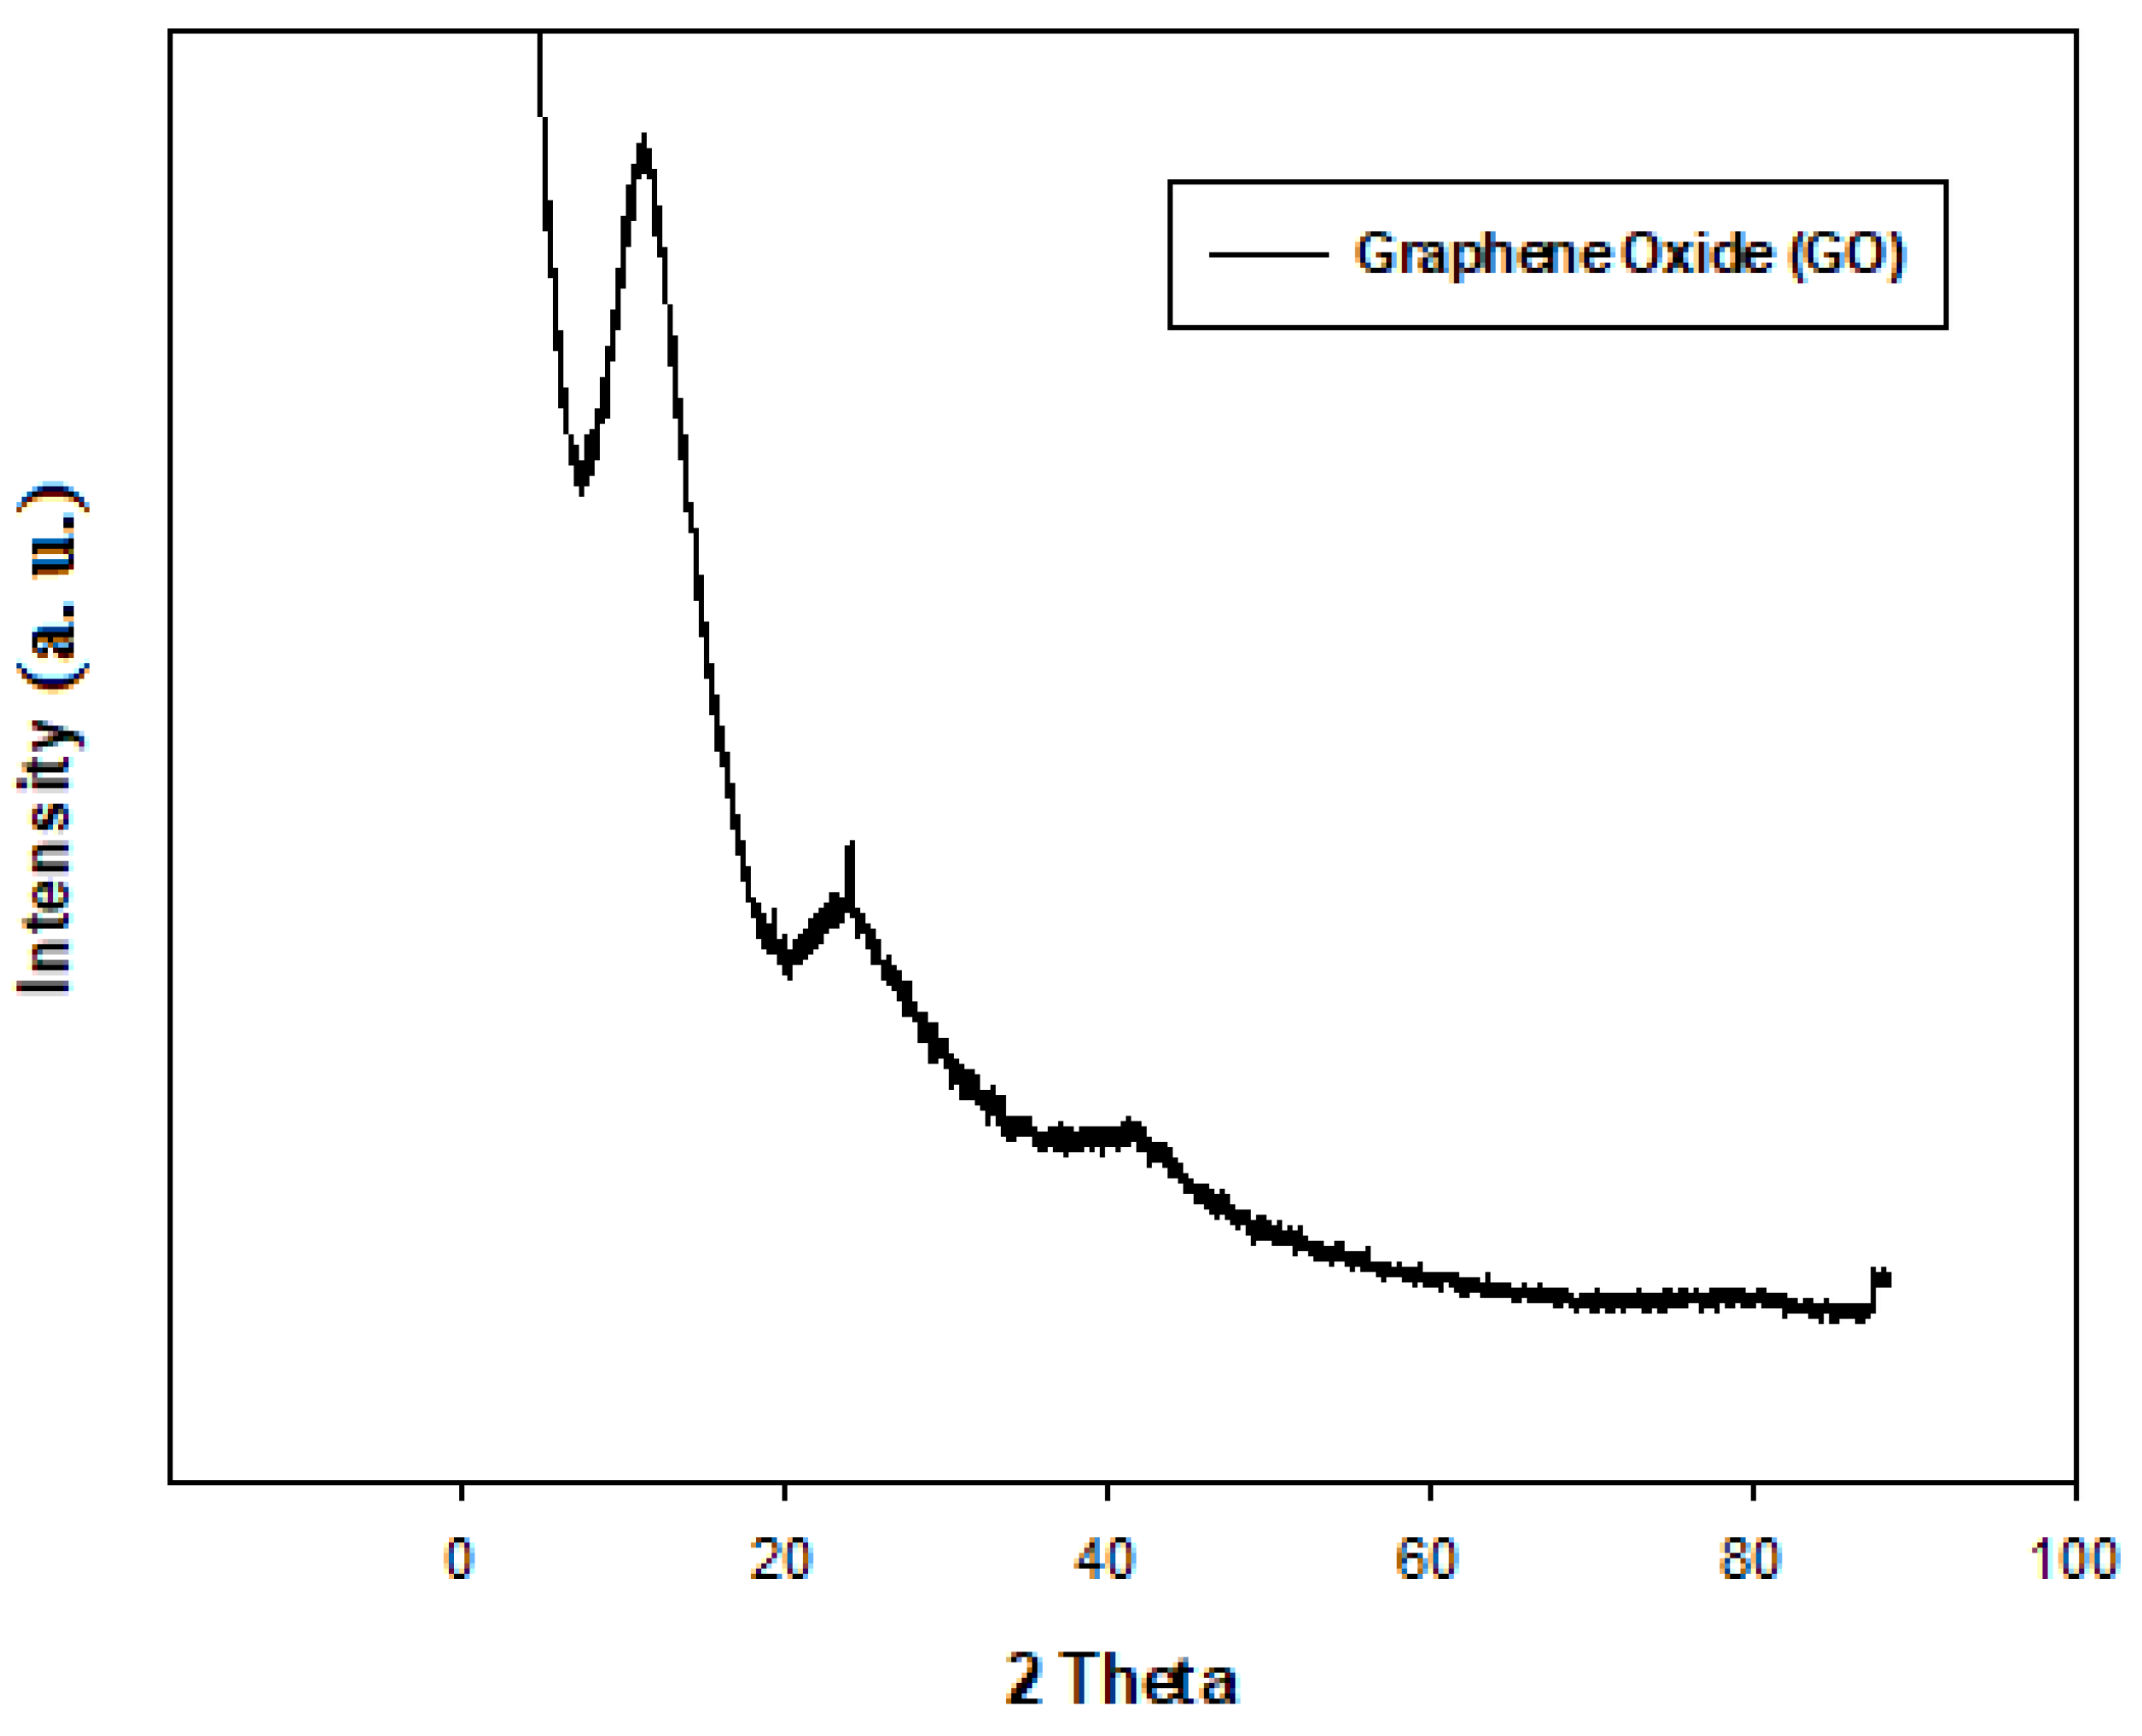
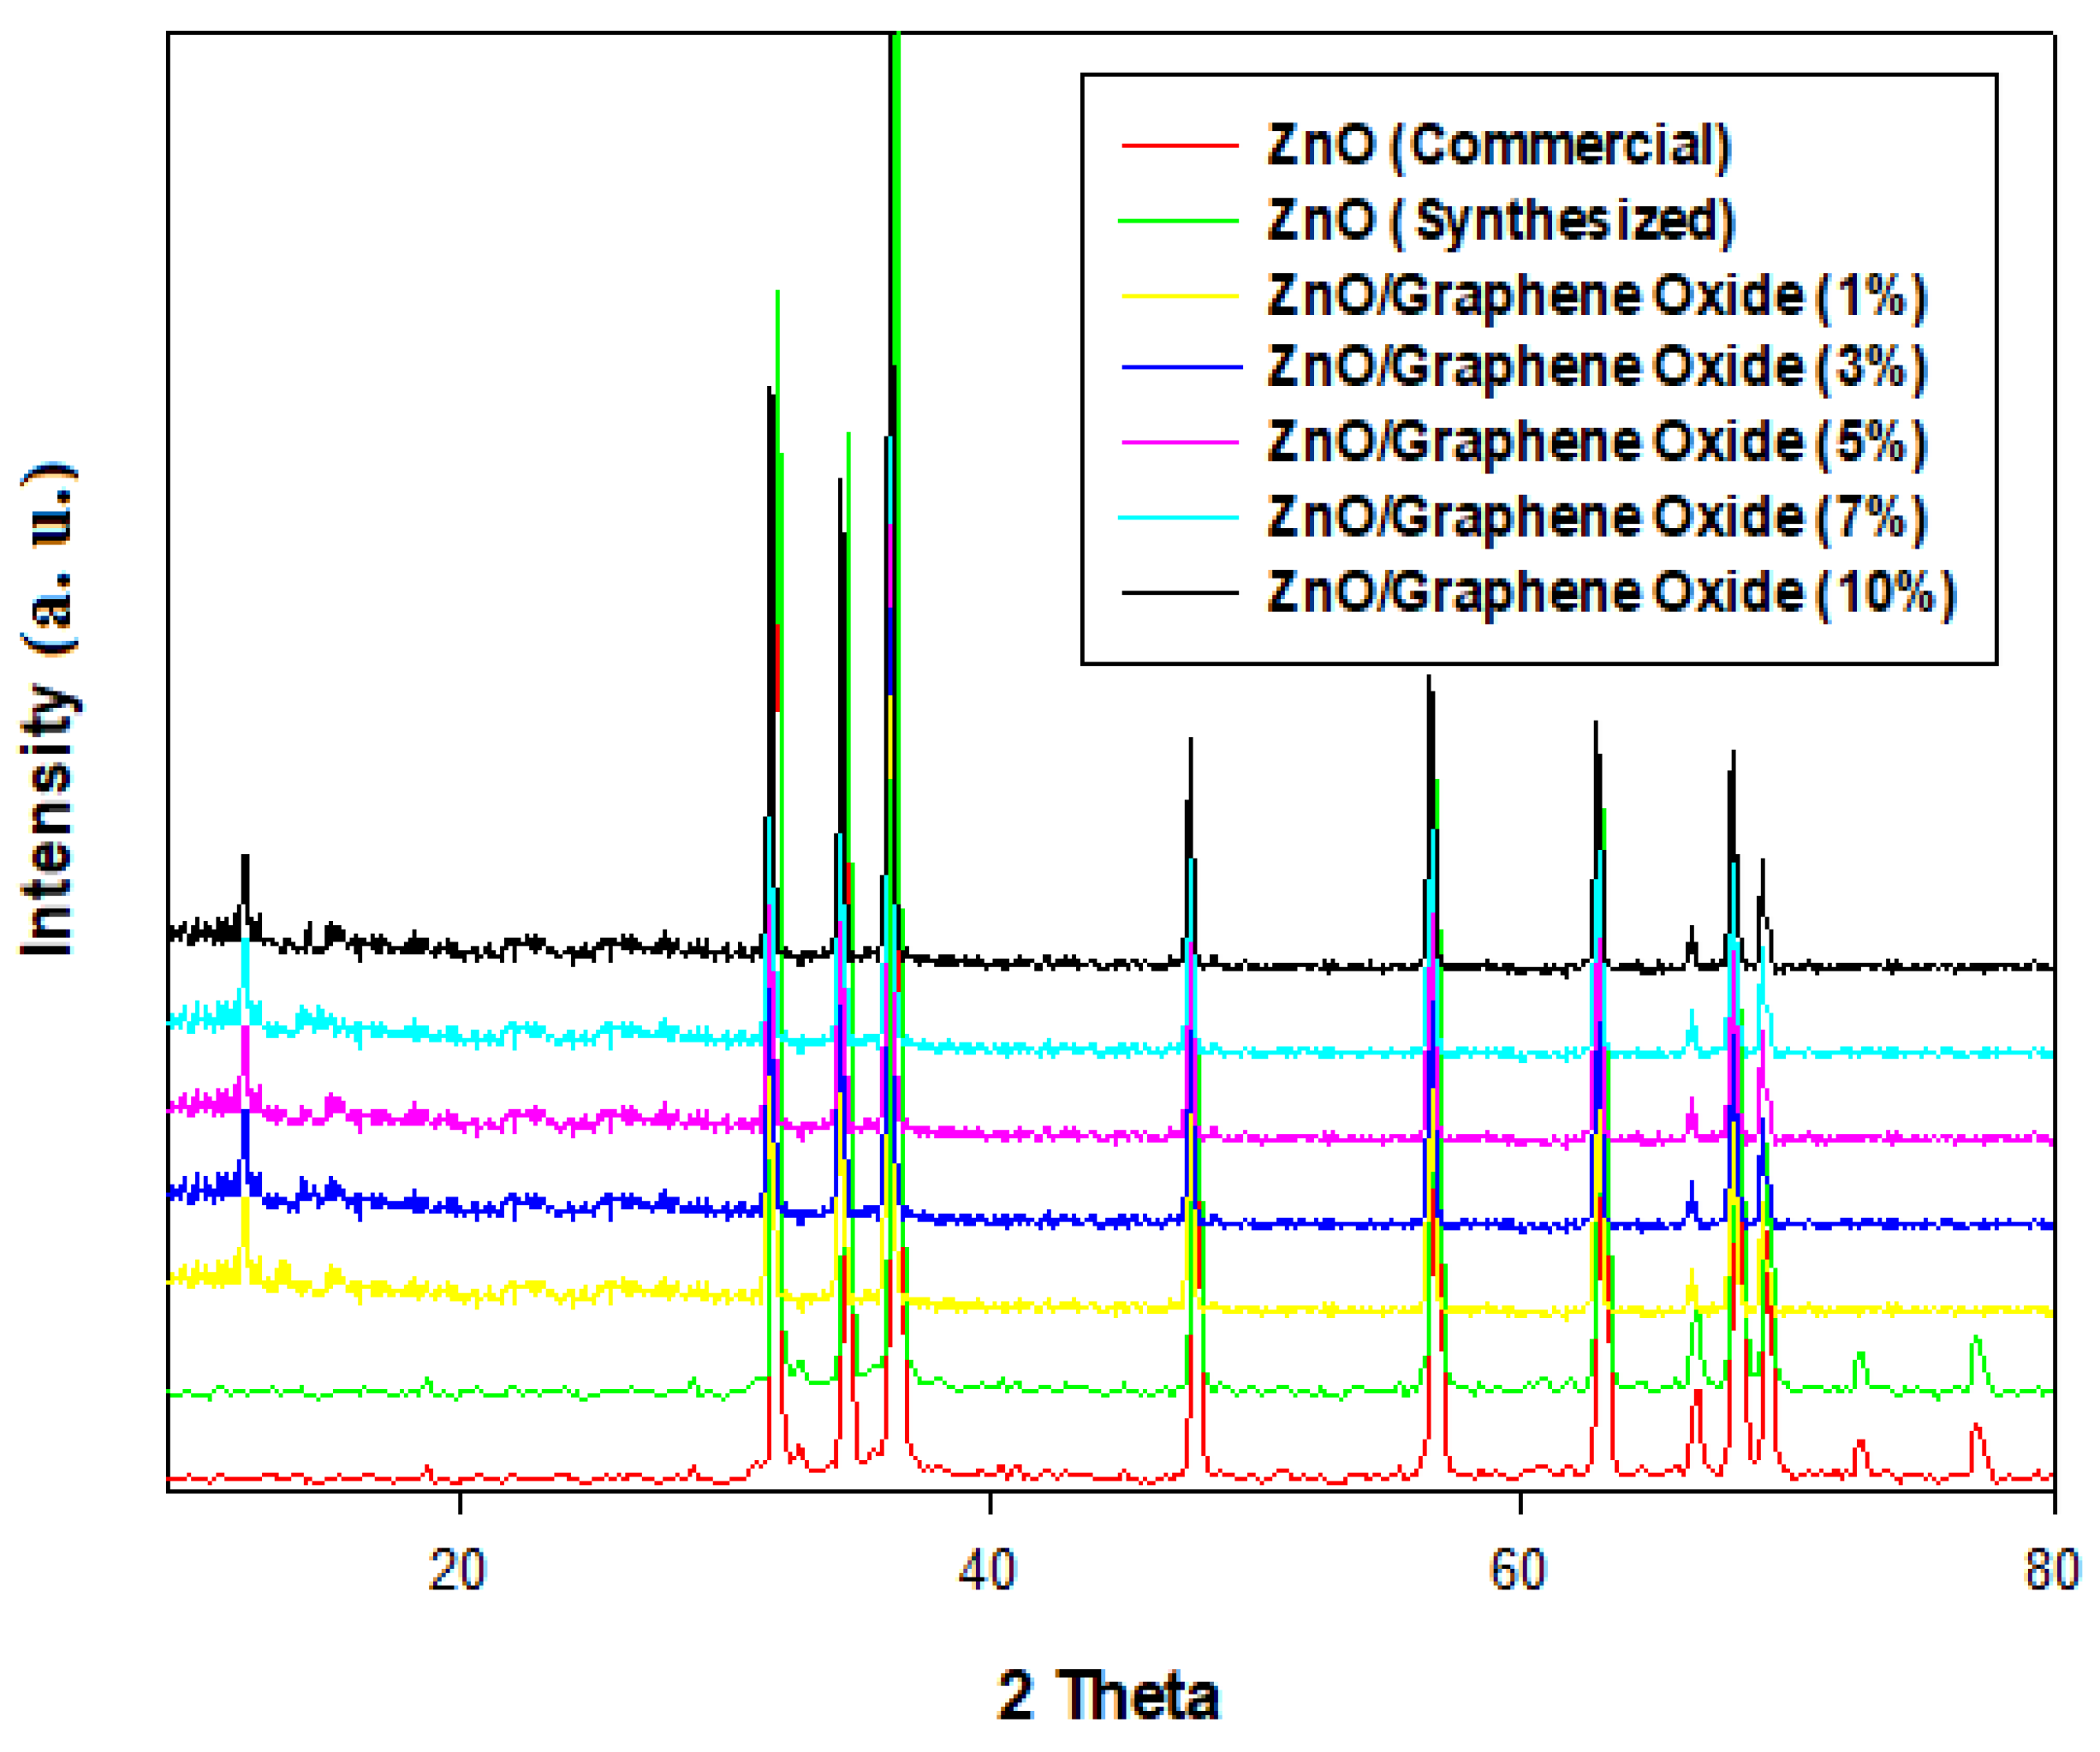
Figure 6 represents the XRD pattern of graphene oxide. A diffraction peak corresponding to the reflection plane (002) in the graphene oxide XRD pattern emerged at a theta value of 11.2° [28]. Figure 7 shows the XRD patterns obtained for ZnO (commercial and synthesized), as well as for ZnO/GO nanocomposites with varying concentrations of graphene oxide. A diffraction peak appeared in the XRD pattern of graphene at a theta value of 11.4°, which corresponds to the reflection plane (002) [28]. X-ray diffraction reveals peaks at two-theta values of 32°, 34.6°, 36.4°, 47.8°, 56.8°, 63°, 66.6°, 68°, and 69.2°, indicating the presence of ZnO, which is accurately indexed to the hexagonal phase of zinc oxide [44]. These peaks correspond to reflection from the crystal planes (100), (002), (101), (102), (110), (103), (200), (112), and (201), respectively. However, the reduced intensity of GO at 11.7° in the nanocomposite indicates the disturbance of graphene oxide’s regular stacking due to the intercalation of zinc oxide nanoparticles. However, the intensity of the peaks associated with ZnO was also slightly disturbed after interfacing with graphene oxide, which may be due to the functionalization of graphene oxide by ZnO [45]. The average crystallite size (D) of synthesised samples was determined from the full width at half maximum (FWHM) of the most intense peaks, using the Scherrer formula as shown in Equation (2).
D = kλ/βcos θ
where D is the average crystallite size, k is the shape factor, λ is the X-ray wavelength, β is the peak width at half maximum (FWHM) expressed in radians, and θ is the Bragg angle. The obtained crystallite sizes of ZnO (commercial), ZnO (synthesized), and ZnO/GO were found to be 83.20, 68.25, and 49.25 nm respectively.

2.6. Photoluminescence (PL) Analysis of ZnO (Commercial, Synthesized) and ZnO/GO

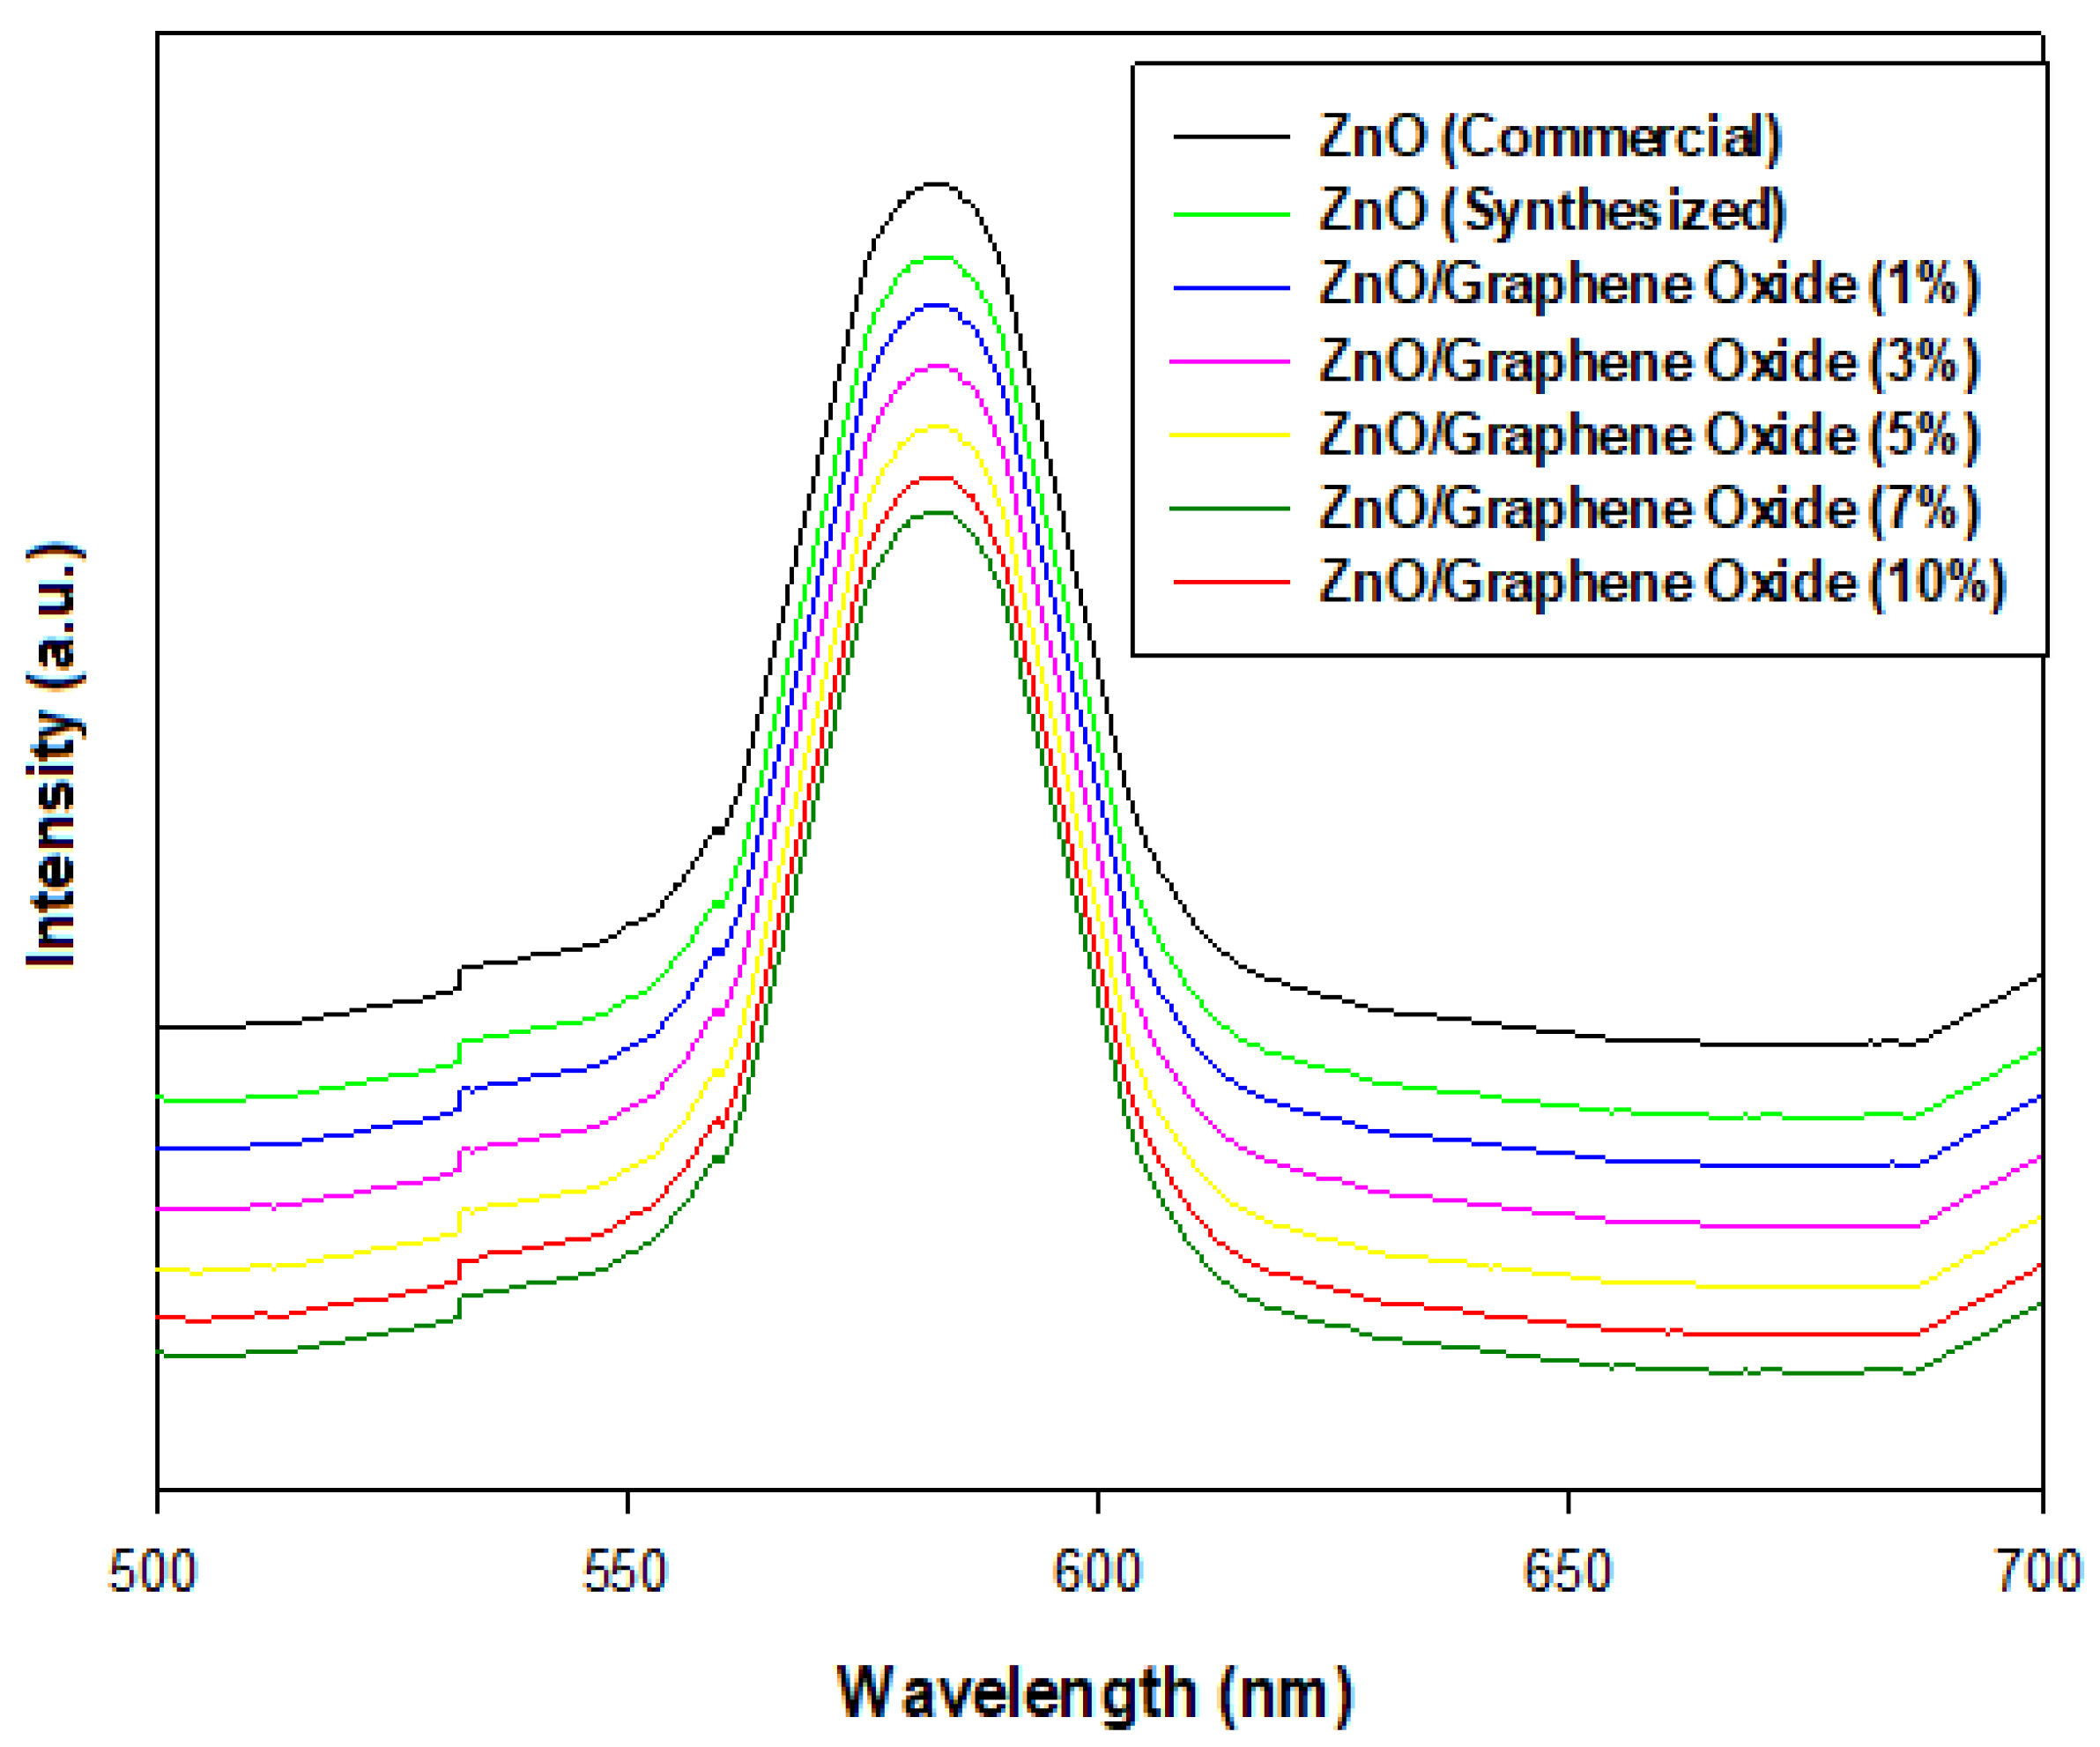
The PL spectra of ZnO (commercial and synthesized) and the ZnO/GO nanocomposite are presented in Figure 8. From the figure, it is evident that the PL emission maximum peak is at 580 nm for an excitement wavelength of 340 nm. The intensity of peaks decreases as the graphene oxide content increases up to 7% [46]. Further, as the ratio increases, i.e., at 10% graphene oxide interfacing, the peak intensity increases. Based on the results, a conclusion may draw that the rate of combination of electron–hole pairs slows down by increasing the ratio of graphene oxide up to 7%, which ultimately increases the photocatalytic activity of the synthesized ZnO/GO nanocomposites. Moreover, the PL emission in the visible range could be applied in many fields like fluorescence quenching and biological labelling. The reduction in intensity observed in ZnO/GO can be attributed to the suppression of electron–hole recombination, likely resulting from the integration of GO within the composite. Additionally, the diminished intensity of photoluminescence emission in the composite arises from an increased charge transfer at junction points and a delayed electron recombination process at defect sites. This suggests that electrons generated in ZnO upon exposure to light can efficiently migrate to GO, which acts as an electron sink, providing a facile pathway for charge carriers. Therefore, ZnO/GO photocatalyst are proven more effective for the degradation of pollutants [47].

2.7. Raman Analysis of GO, ZnO (Synthesized) and ZnO/GO

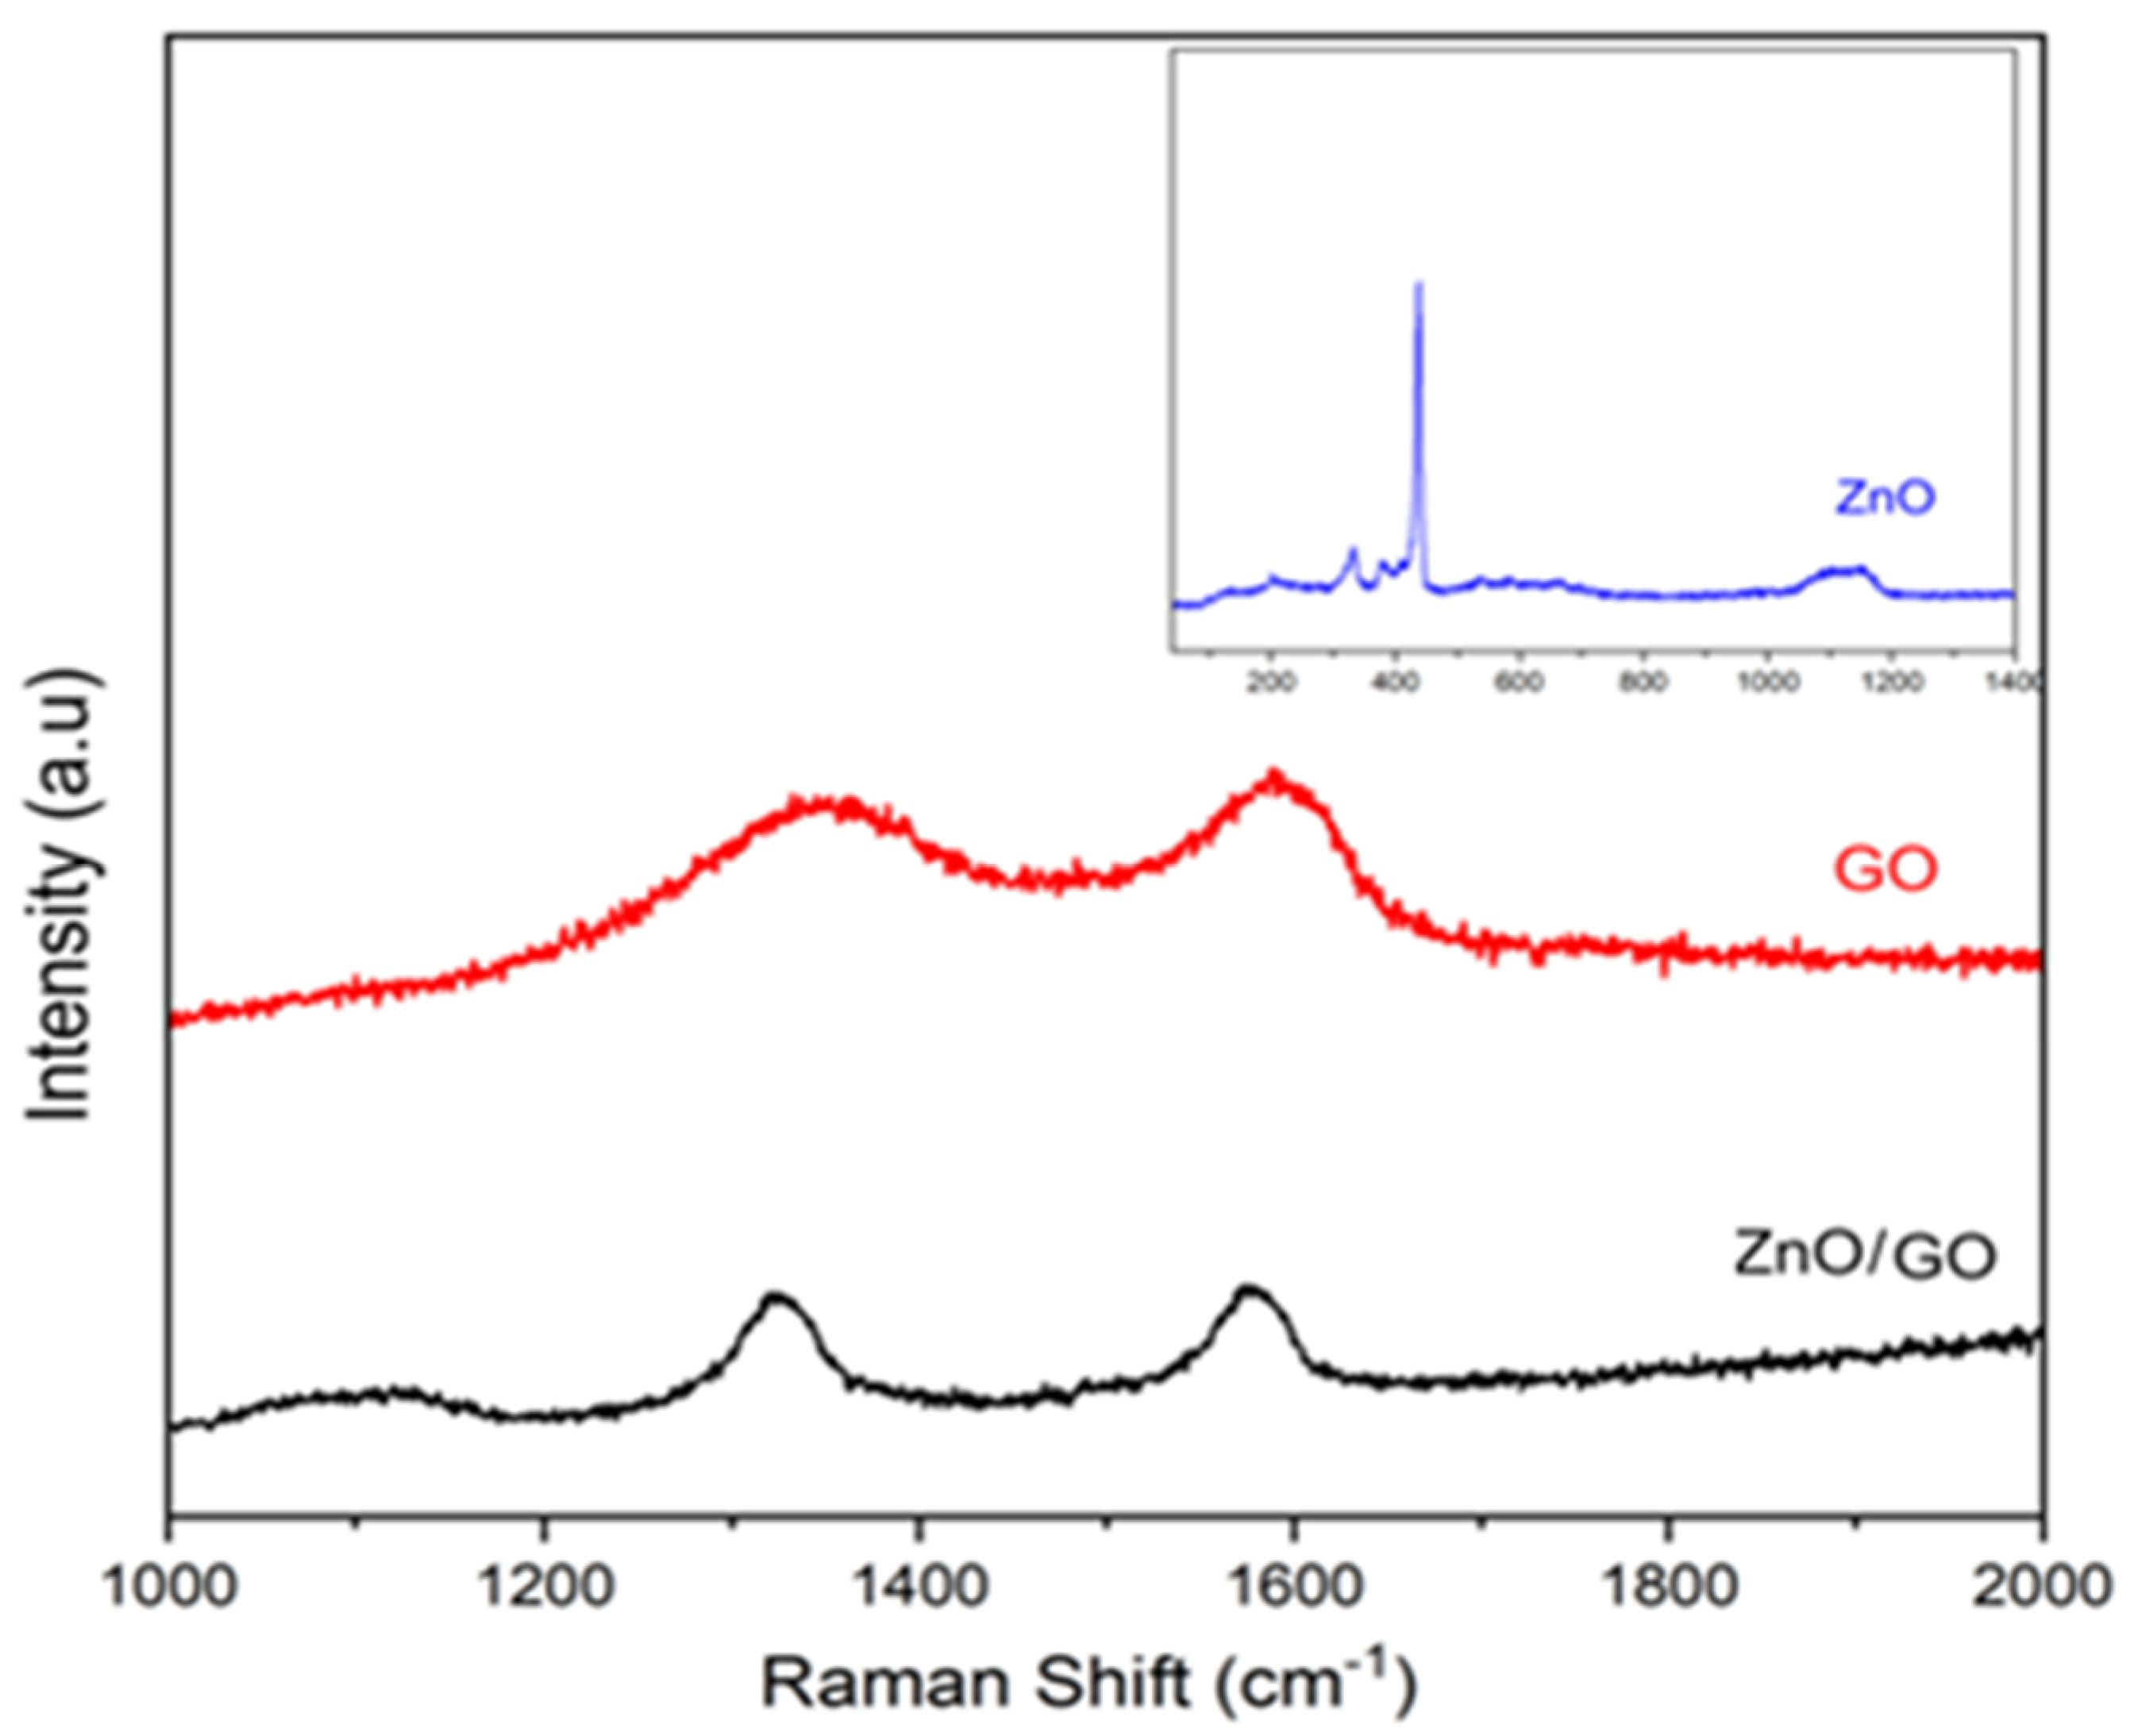
In Figure 9, the Raman spectra of GO and ZnO/GO are shown, with the inset of the figure showing the Raman spectra of ZnO. In the case of GO, there are two notable peaks, known as the D-band and G-band, at around 1362 cm−1 and 1596 cm−1, respectively. The A1 transversal optical (TO) and E2 (high) vibration mode, fundamental phonon modes of hexagonal ZnO, are represented by the peaks at around 380 cm−1 and 437 cm−1 in the spectra of synthesized ZnO, respectively. The multi phonon scattering mode presented at 331 cm−1 is assigned to 3E2H-E2L [48]. The peaks in ZnO/GO broadened, with lower intensity compared to pure GO [49]. The ID/IG intensity ratio serves as an indicator of both the level of disorder and the sizes of sp2 domains. This higher ratio suggests a lower size but a bigger number of plates in the sp2 domain. The ID/IG ratio of GO/ZnO was high as compared to that of GO. The higher ID/IG ratio found in ZnO/GO may be attributed to the increase in smaller sp2 domains of carbon atoms [50].

2.8. Point of Zero Charge (PZC) of ZnO/GO

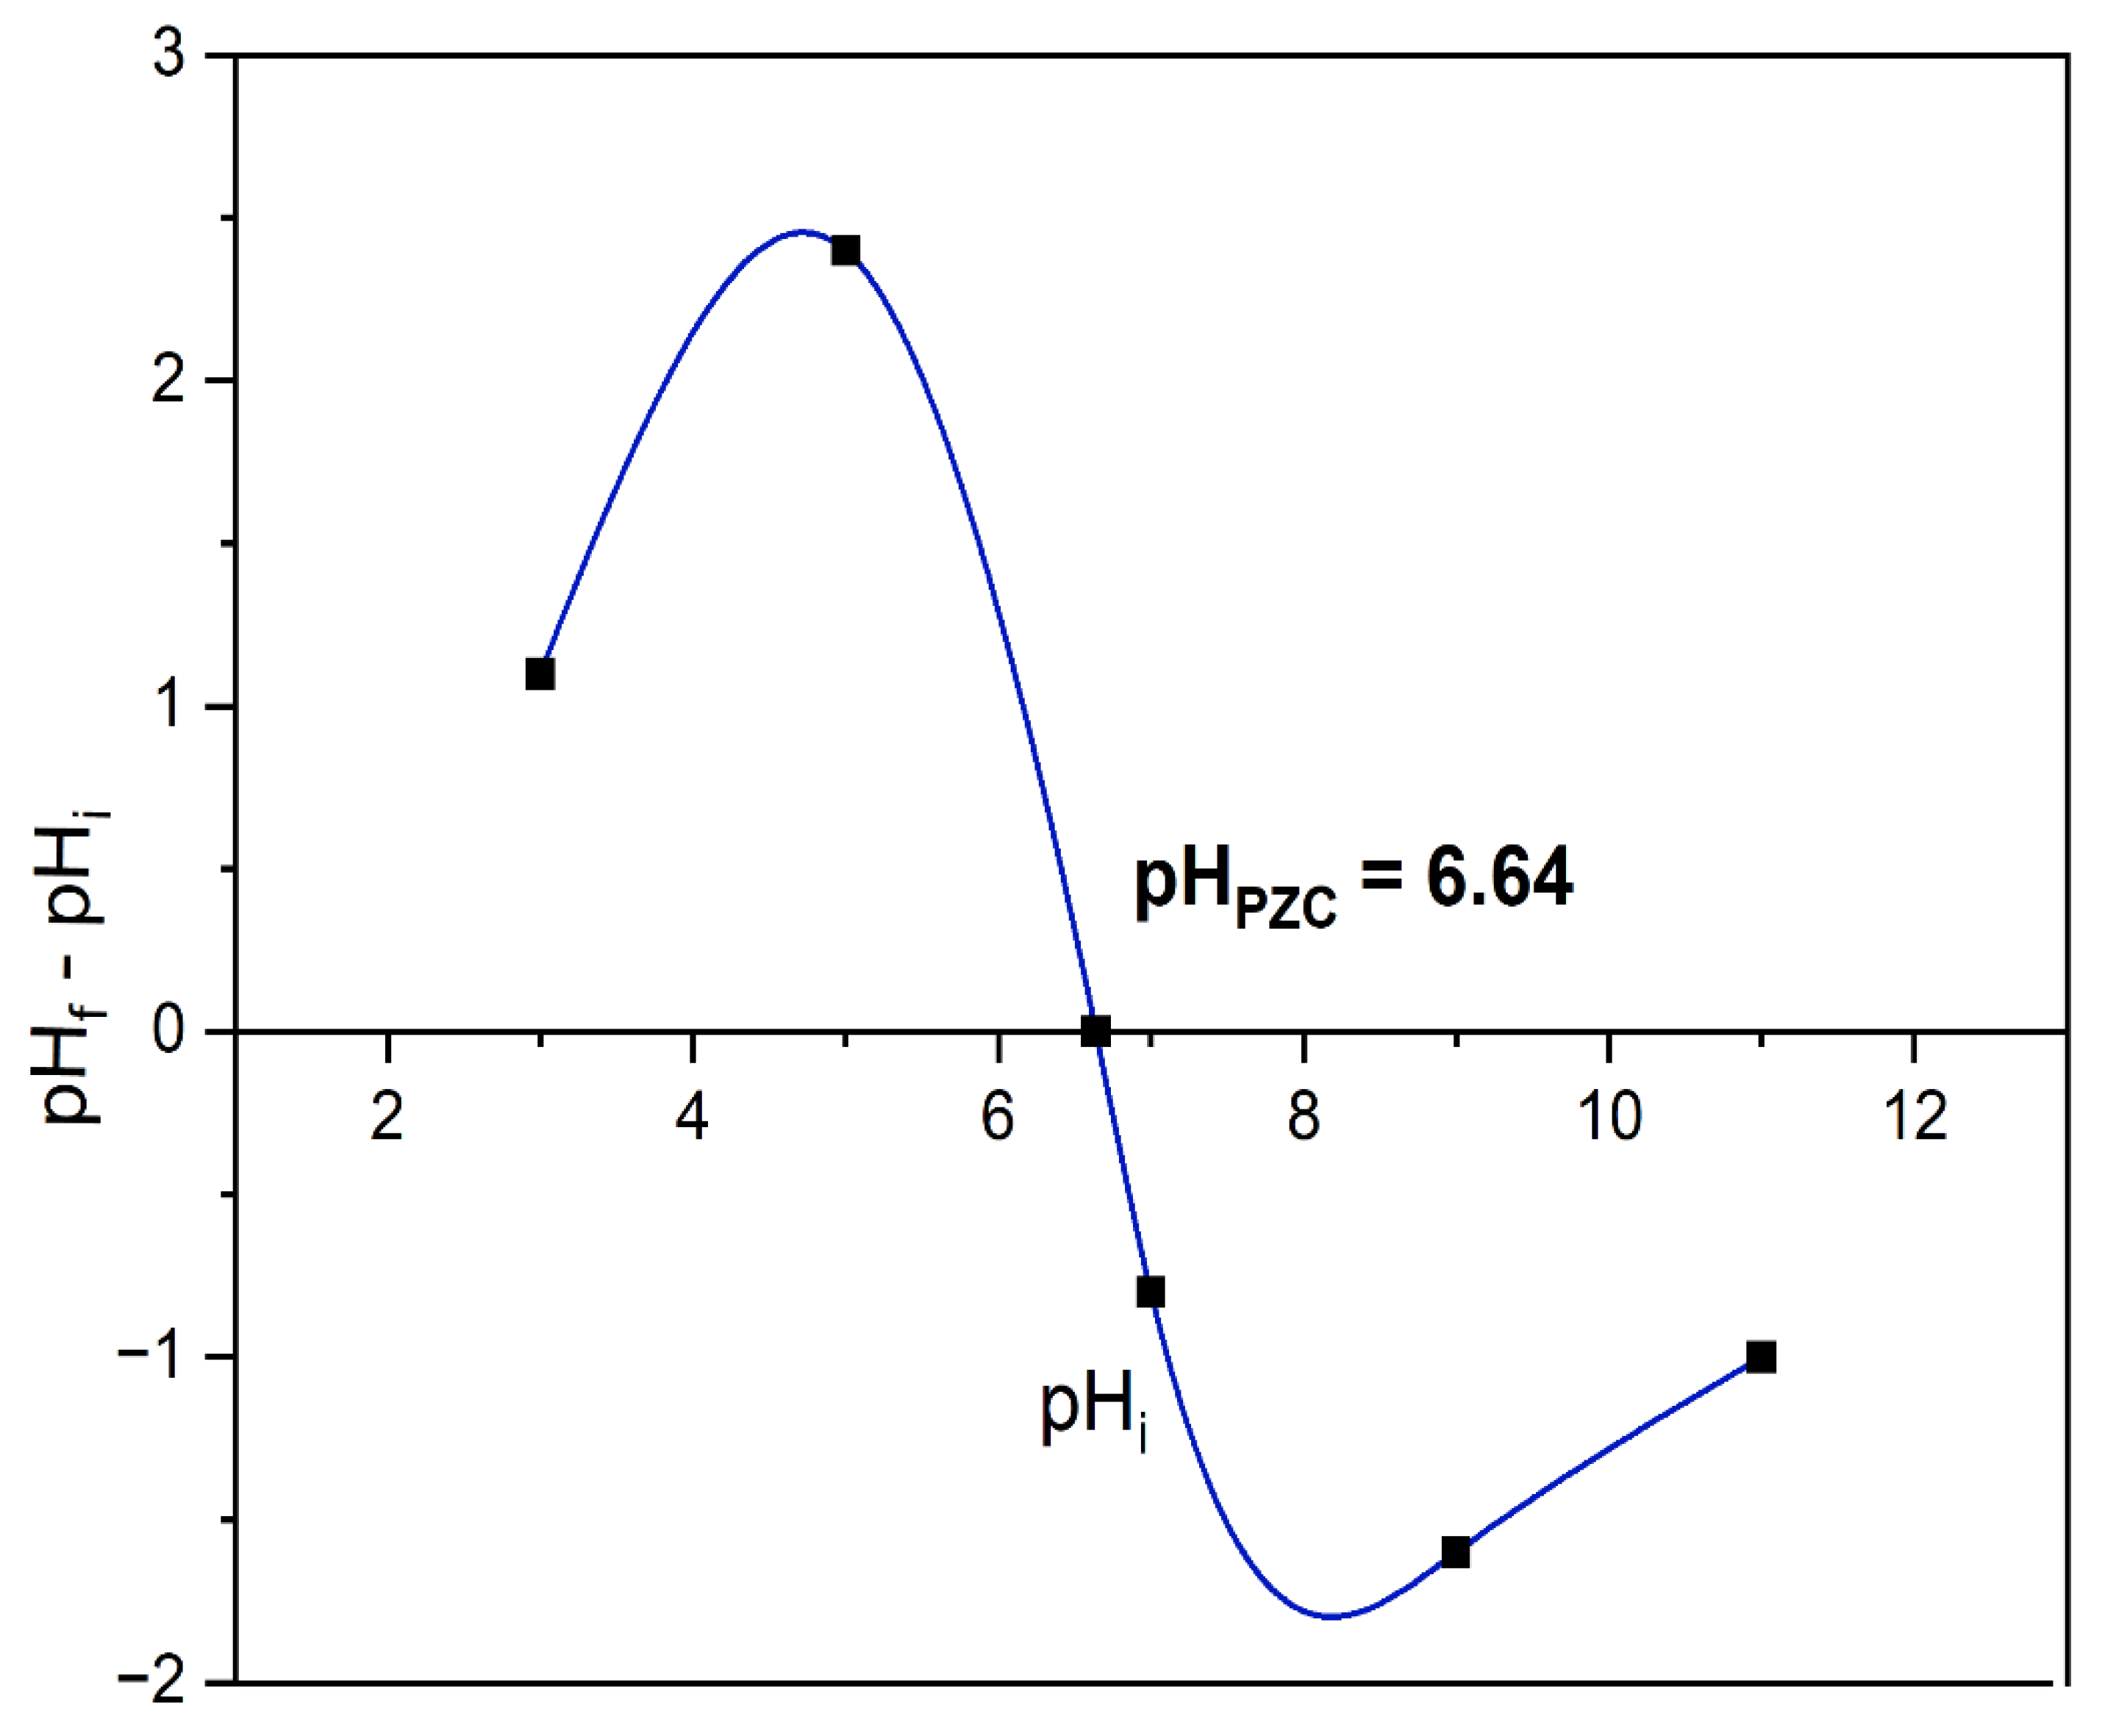
pHPZC refers to the pH value at which the total positive charges on a surface are equal to the total negative charges on the same surface. The variety of pHPZC is determined by several factors, such as the manner of materials synthesis, size distribution, and any heat treatment operations, which directly influence the hydration ratio of the materials. The pH value at which the point of zero charge (PZC) of the ZnO/GO occurs was found to be 6.64, as seen in Figure 10, which is comparable to the value reported in literature. Moreover, there are several factors, such as the manner of materials synthesis, size distribution, and any heat treatment operations that may responsible for the variation that occurred in pHPZC values. In the literature, Abbasi et al. reported a pHPZC value of 6.8 for Fe3O4@rGO/ZnO/Ag2CO3, synthesised using a hydrothermal process [51]. In another work, the value for a GO/ZnO/Ag composite was reported to be 6.78 [52].

2.9. Photocatalytic Activity

2.9.1. Photocatalytic Activity of ZnO (Commercial), ZnO (Synthesized), and ZnO with Varying GO Concentrations for the Photocatalytic Degradation of Methylene Blue

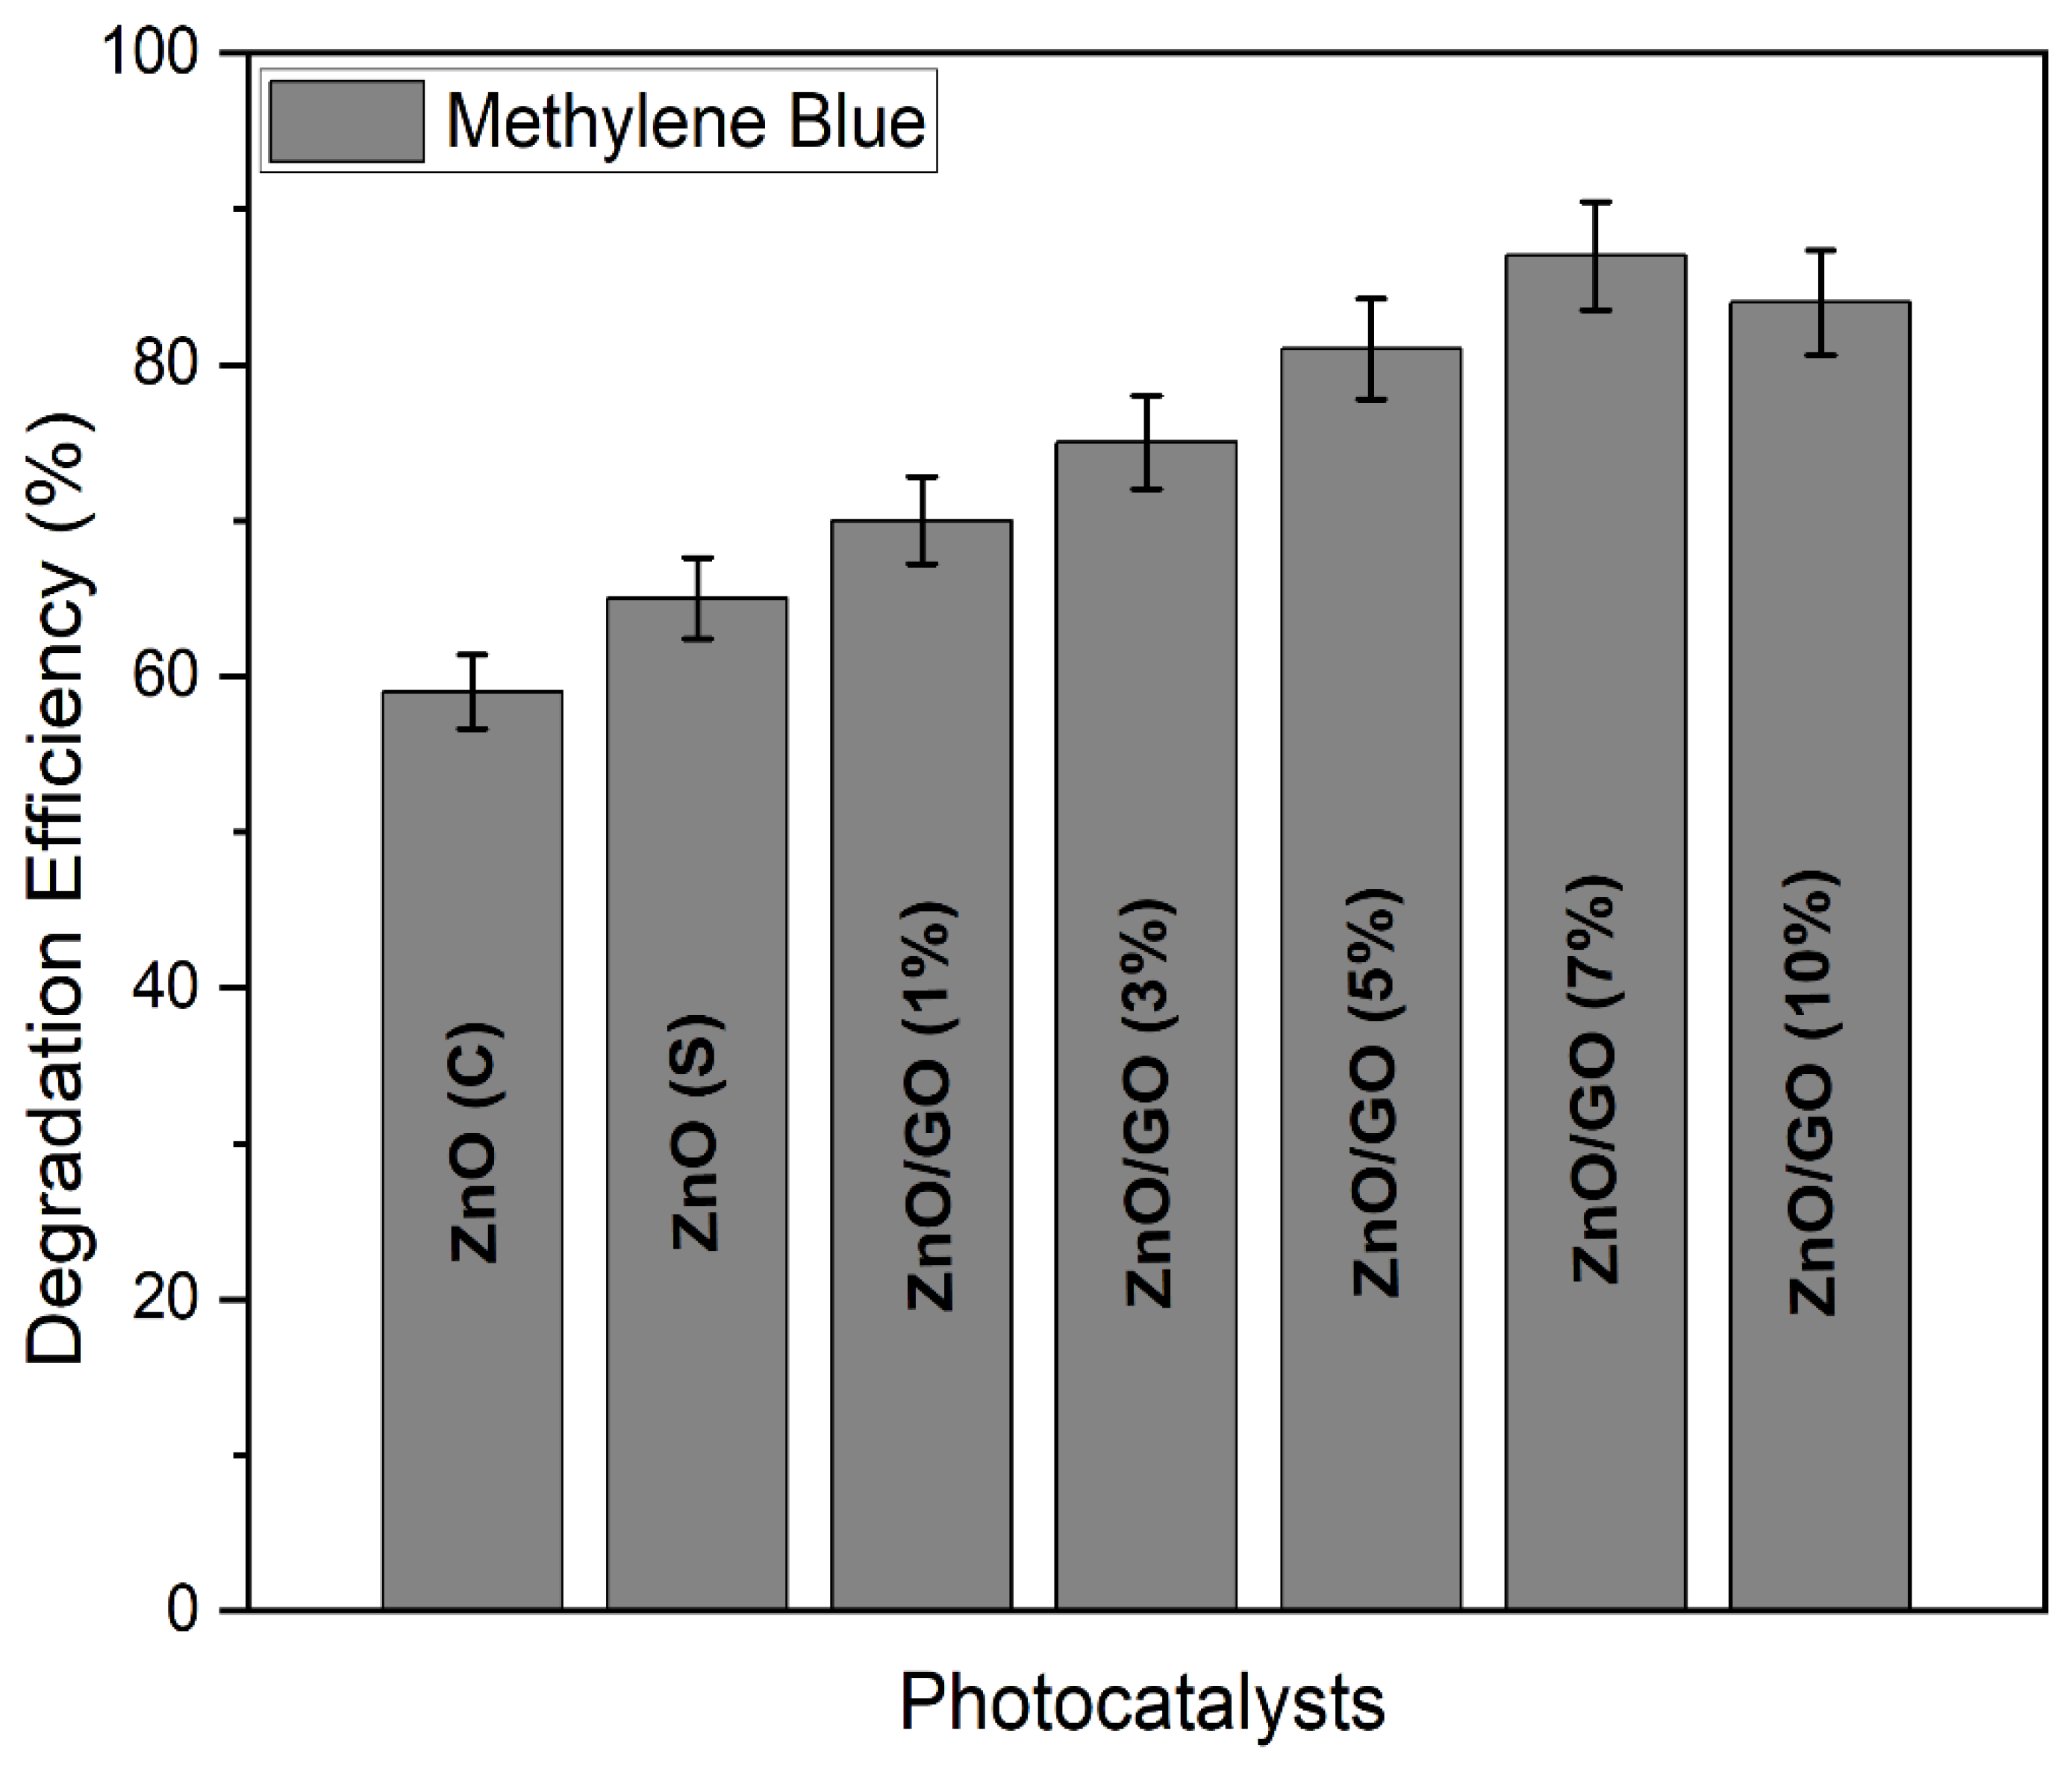
Commercial ZnO, synthesized ZnO, and ZnO with varying concentrations of graphene oxide (GO), acting as photocatalysts, were employed to assess their efficacy in degrading methylene blue in a suspension using a halogen linear lamp (which generally emits radiationhaving wavelengths from 350–700 nm, i.e., mostly in the visible region) in the presence of atmospheric oxygen. Figure 11 illustrates the degradation efficiencies of these photocatalysts, and from the figure, it can be observed that the degradation effectiveness of synthesized ZnO is higher than that of the commercial one, possibly due to the comparably smaller size of particles of synthesized ZnO (which can be seen from the SEM image particle size distribution), which provides a larger surface area for reactions to occur.
Moreover, the degradation efficiency also increases with the increase in ratio of graphene oxide (GO) from 1 to 7%. However, with a subsequent rise in the proportion of GO, a slight decrease in degradation was observed [53]. Moreover, the efficacy of the photocatalyst is also contingent upon the nature of the pollutant model. The zinc oxide particles get nucleated, grow/attach onto the graphene oxide material, and help enhance photocatalytic activities based on the tuned properties [54]. Briefly, the higher degradation rate after interfacing the graphene oxide (GO) with zinc oxide could be described with the following explanation. The GO is well characterized by its two-dimensional π-conjugated structure, serves as an effective electron acceptor that facilitates charge carrier transport, and effectively segregates photogenerated electrons and holes [55]. Within nanocomposites, GO functions as an electron acceptor, engaging in interfacial interactions to accept photogenerated electrons from the conduction band of ZnO, while the corresponding holes are retained in ZnO to perform the oxidation process [56]. Consequently, the recombination rate of electron–hole pairs generated by light could be significantly reduced in the ZnO/GO nanocomposite compared to pure ZnO [57]. This reduction enables more charge carriers to remain available for reacting with water molecules, resulting in the production of a greater quantity of hydroxyl radicals (OH) and consequently higher photocatalytic activity in the ZnO/GO nanocomposite. The GO shows a high surface area and electron mobility properties, acting as an electron sink and helping prevent the recombination of photogenerated electrons and holes in ZnO. Moreover, the characteristic of GO to efficiently transport electrons also helps separate photogenerated electron–hole pairs in ZnO. This prevents the rapid recombination of these charge carriers, allowing more of them to participate in photocatalytic reactions [53]. Furthermore, the high surface area of GO provides more sites for the adsorption of reactant molecules, increasing the number of available active sites for photocatalysis. This close contact between ZnO and GO, facilitated by their strong interfacial interactions, further enhances the accessibility of these active sites. Interfacing GO with ZnO also introduces defects and modifies the electronic structure of ZnO, leading to an increase in active sites [21].
Furthermore, the enhanced performance of the ZnO/GO nanocomposite compared to ZnO nanoparticles can be further attributed to their optical characteristics. Moreover, according to UV-Vis diffuse reflectance spectroscopy (Figure 4), as the proportion of GO increases in the ZnO/GO nanocomposite, the bandgap energy decreases, enabling it to absorb a broader spectrum of radiation and thereby exhibit higher activity [39]. Moreover, a rise in the concentration of GO within the composite led to a decrease in the transmission of radiation, consequently reducing the UV absorption by ZnO and increasing recombination rates. These effects contributed to a decline in the catalytic activity of the ZnO/GO nanocomposite at higher graphene oxide ratios. In all following experiments, the photocatalyst ZnO/GO (7%) was used to degrade methylene blue, since this combination exhibited the highest degradation effectiveness. For the photocatalytic experiments, three replicates were performed, and the standard deviations are reported as error bars in the respective graphs.

2.9.2. Impact of Time Duration on the Photocatalytic Degradation of Methylene Blue with ZnO/GO (7%) Photocatalyst

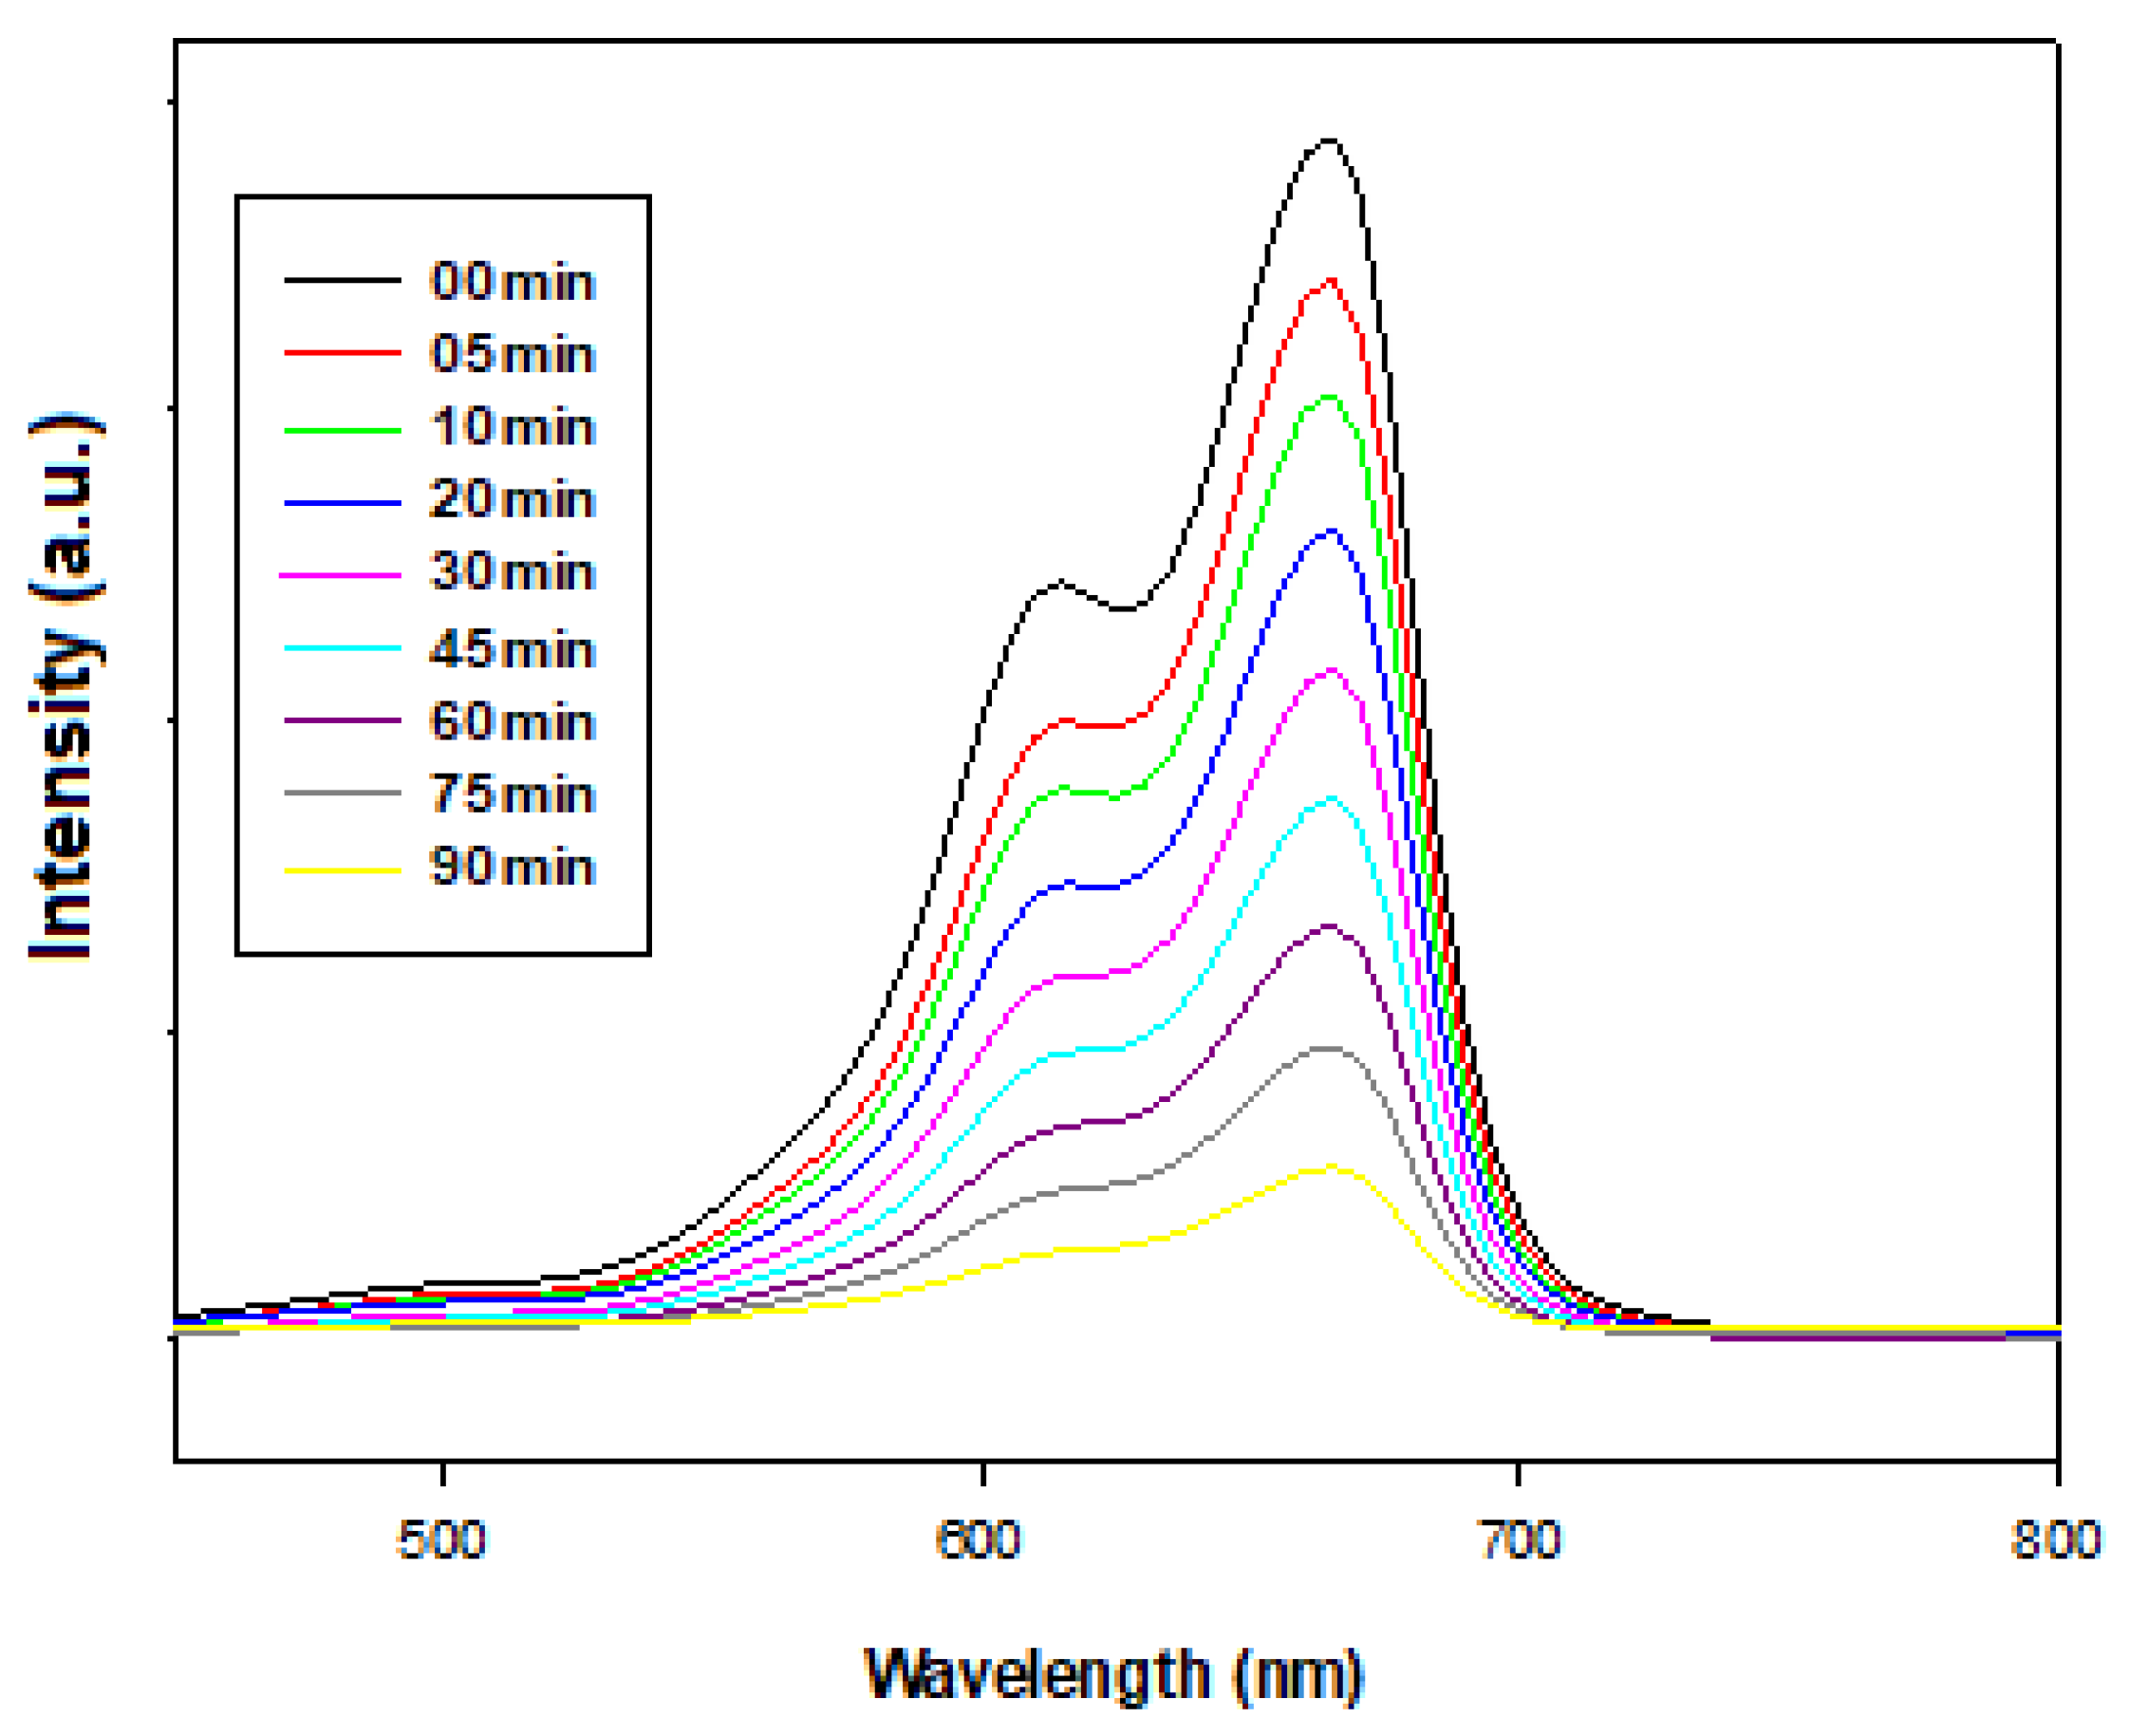
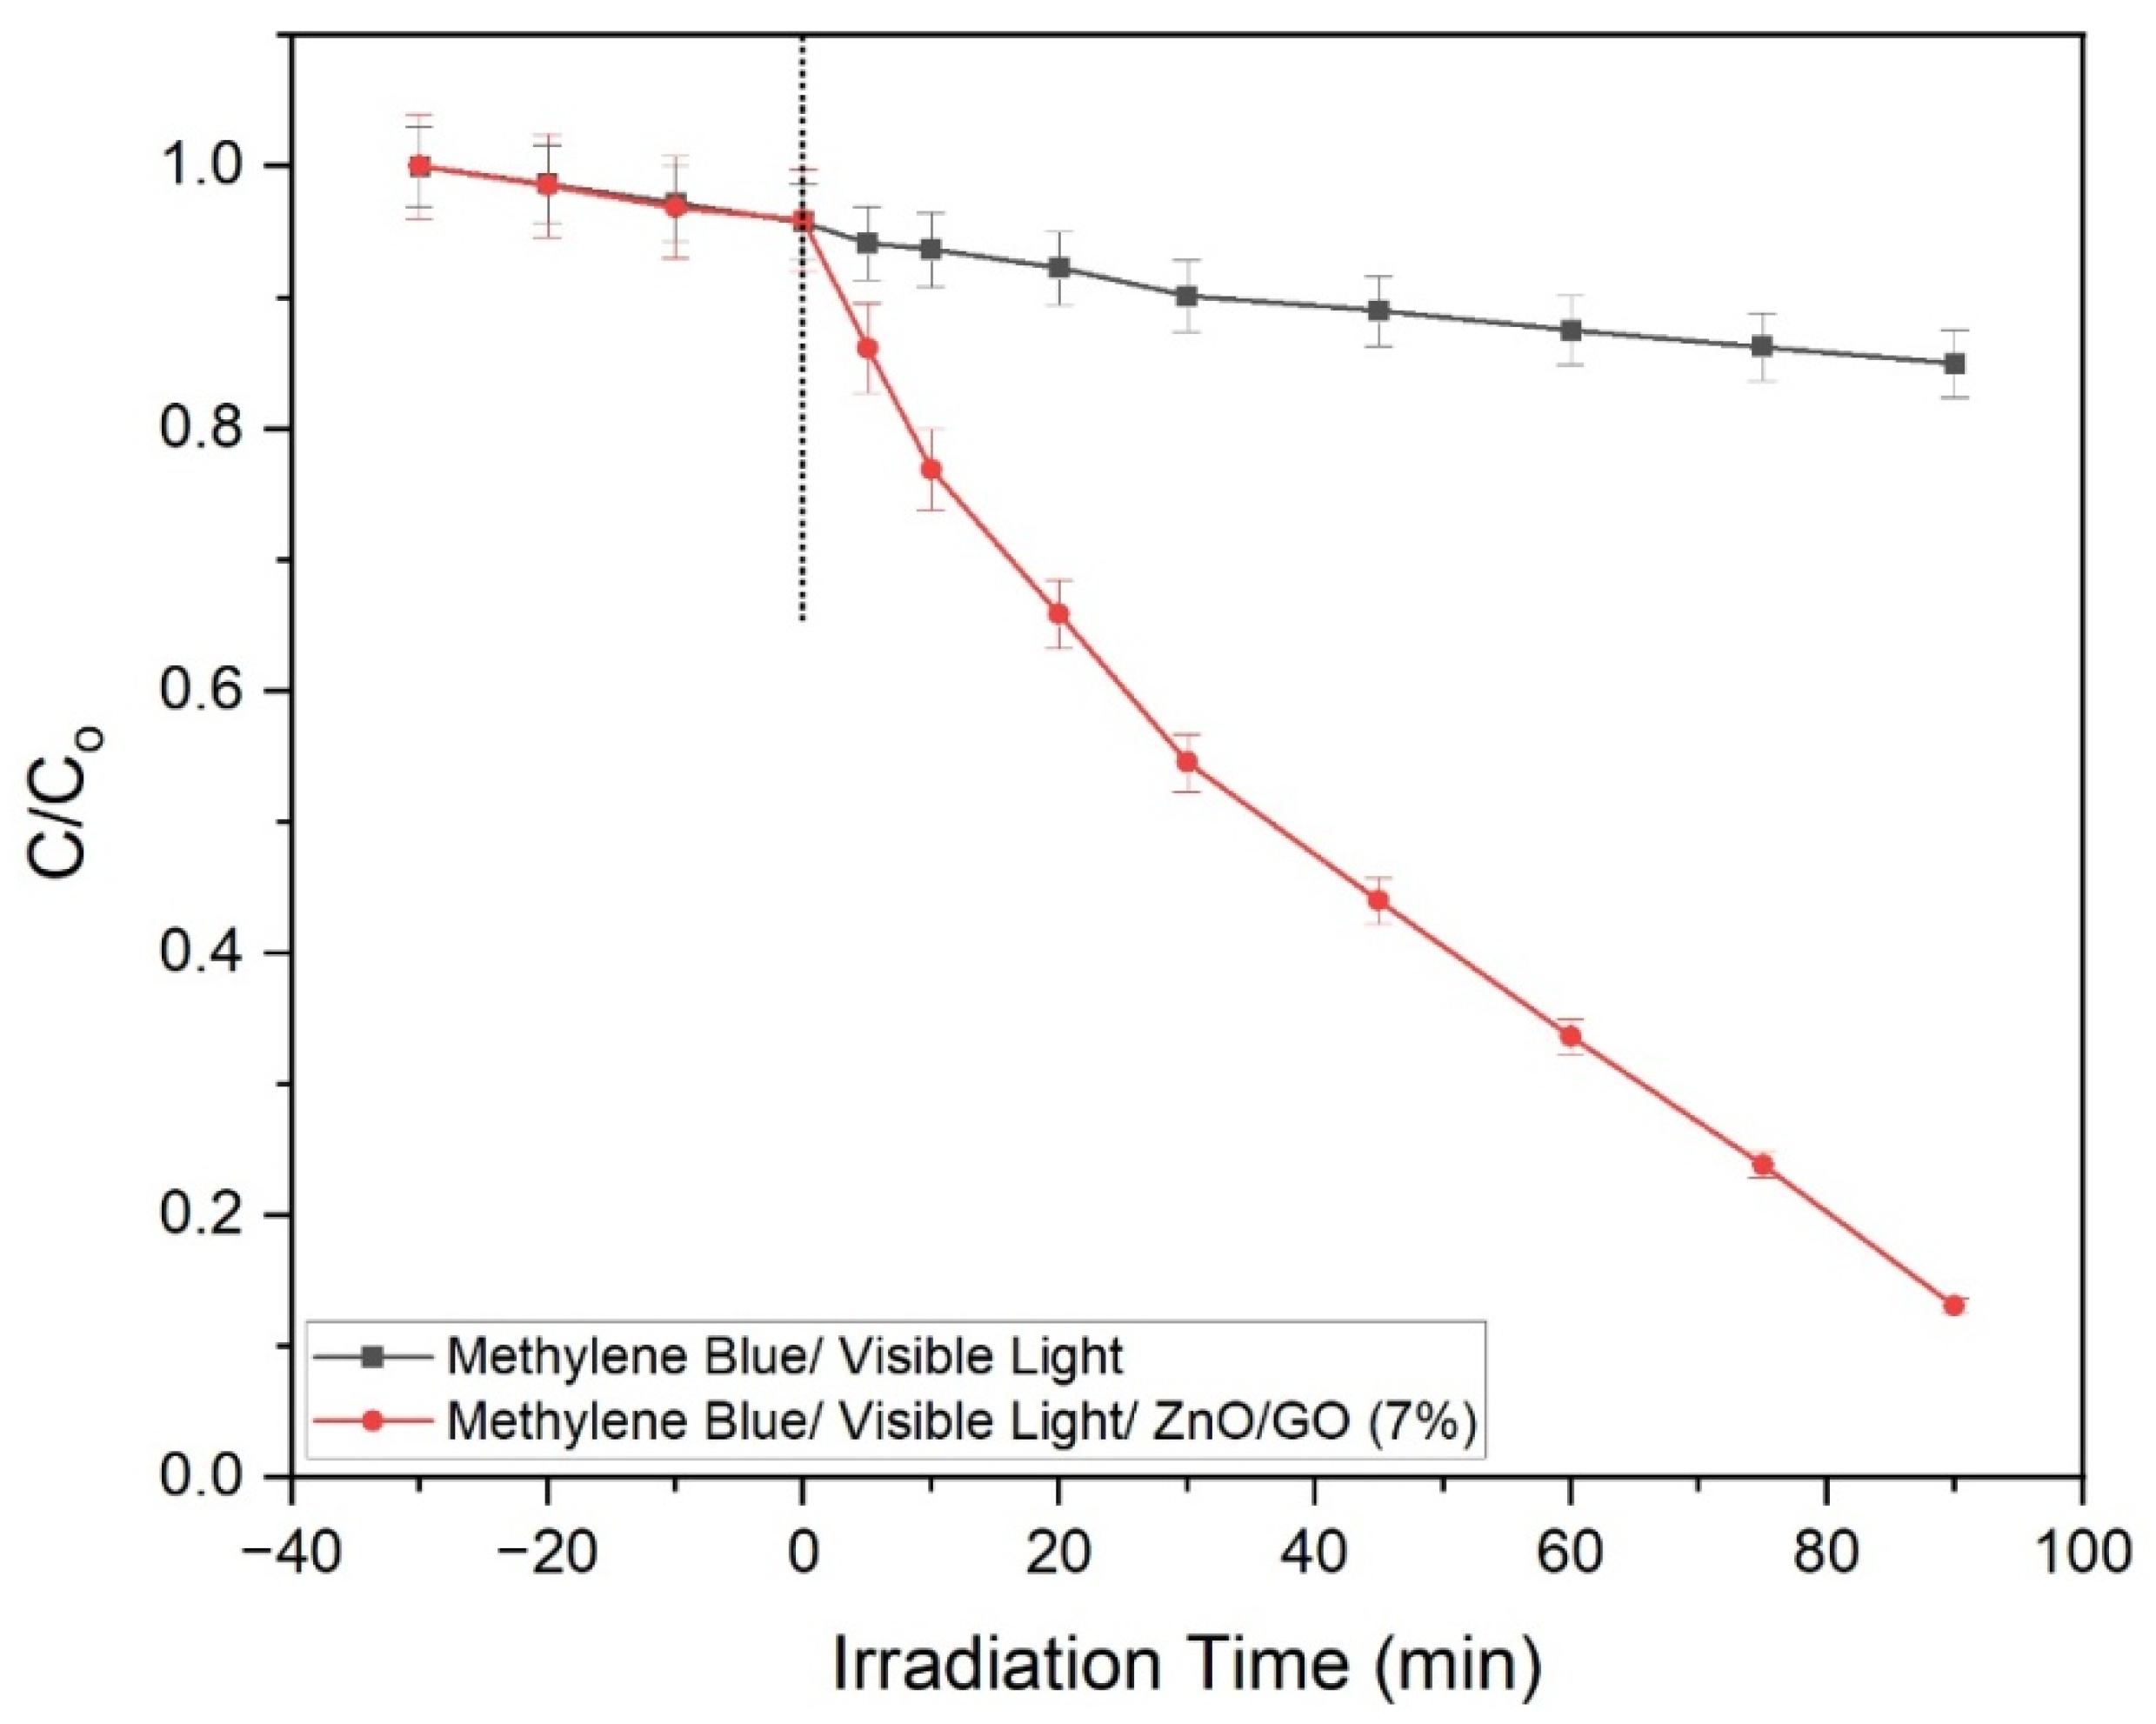
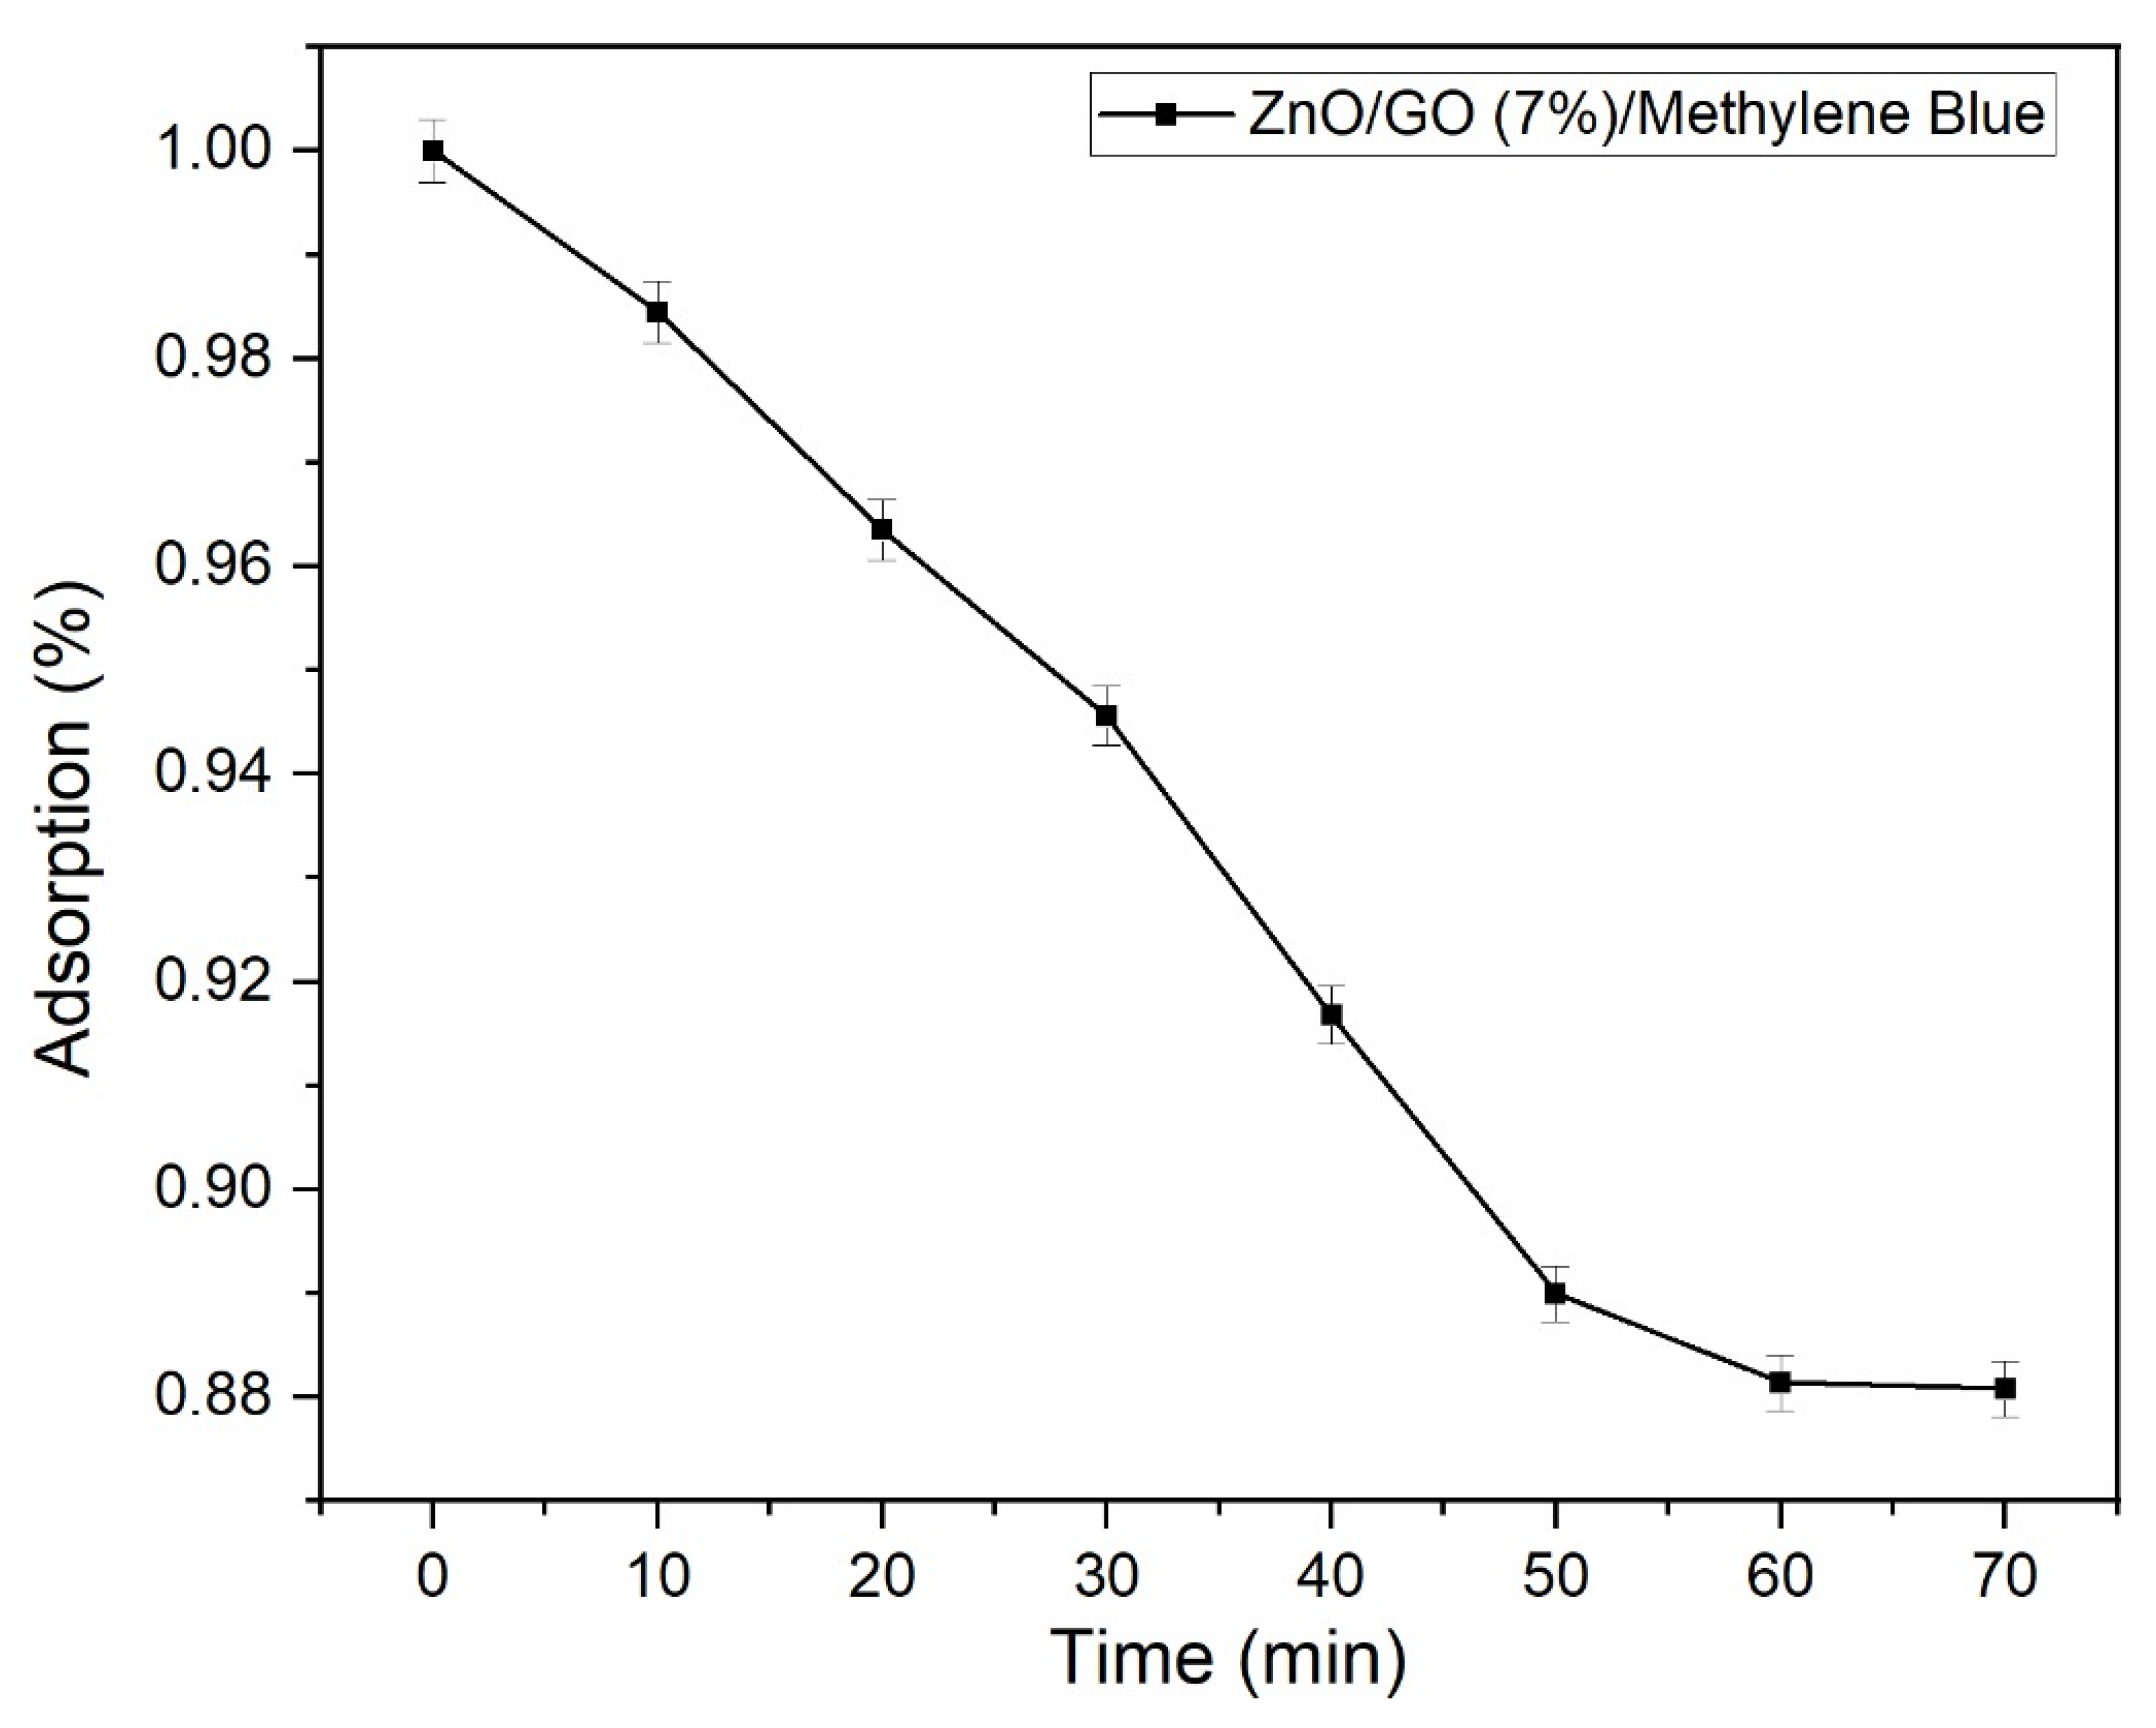
In the presence of a ZnO/GO (7%) photocatalyst, methylene blue (MB) was subjected to irradiation using a visible light halogen linear lamp, while maintaining continuous stirring and aeration with atmospheric oxygen. As a representative example, we observed the changes in absorbance over various time intervals with exposure to ZnO/GO (7%), as illustrated in Figure 12. The spectrum displays two peaks, one centered around 600 nm and the other near 660 nm, with the highest absorbance intensity. With time, the absorbance at these wavelengths gradually decreases, indicating a reduction in the concentration of dye. Additionally, Figure 13 illustrates the changes in concentration over time, comparing the presence (ZnO/GO, 7%) and absence of ZnO/GO (7%) for the degradation of methylene blue (MB). In this case, an 87% reduction in dye concentration occured after 90 min of irradiation when a ZnO/GO (7%) photocatalyst was present, while an 11% reduction in dye concentration was observed in the absence of the photocatalyst. Further, before the irradiation process, samples were also taken until the reading was found to be constant, as shown in Figure 13. Prior to irradiation, the samples were kept in the dark for 30 min to allow an adsorption–desorption equilibrium between the dye molecules and the surface of the photocatalyst. During this period, a slight reduction in dye concentration was recorded. A significant and steady decrease in dye concentration was observed in the presence of the photocatalyst, indicating that 87% of the dye was degraded. Moreover, the results of ZnO/GO (7%) adsorption are shown in Figure 14, where a 13.7% adsorption of dye took place in 70 min.

2.9.3. The Impact of Varying Concentrations of the Substrate (Dye) on the Photocatalytic Degradation of Methylene Blue

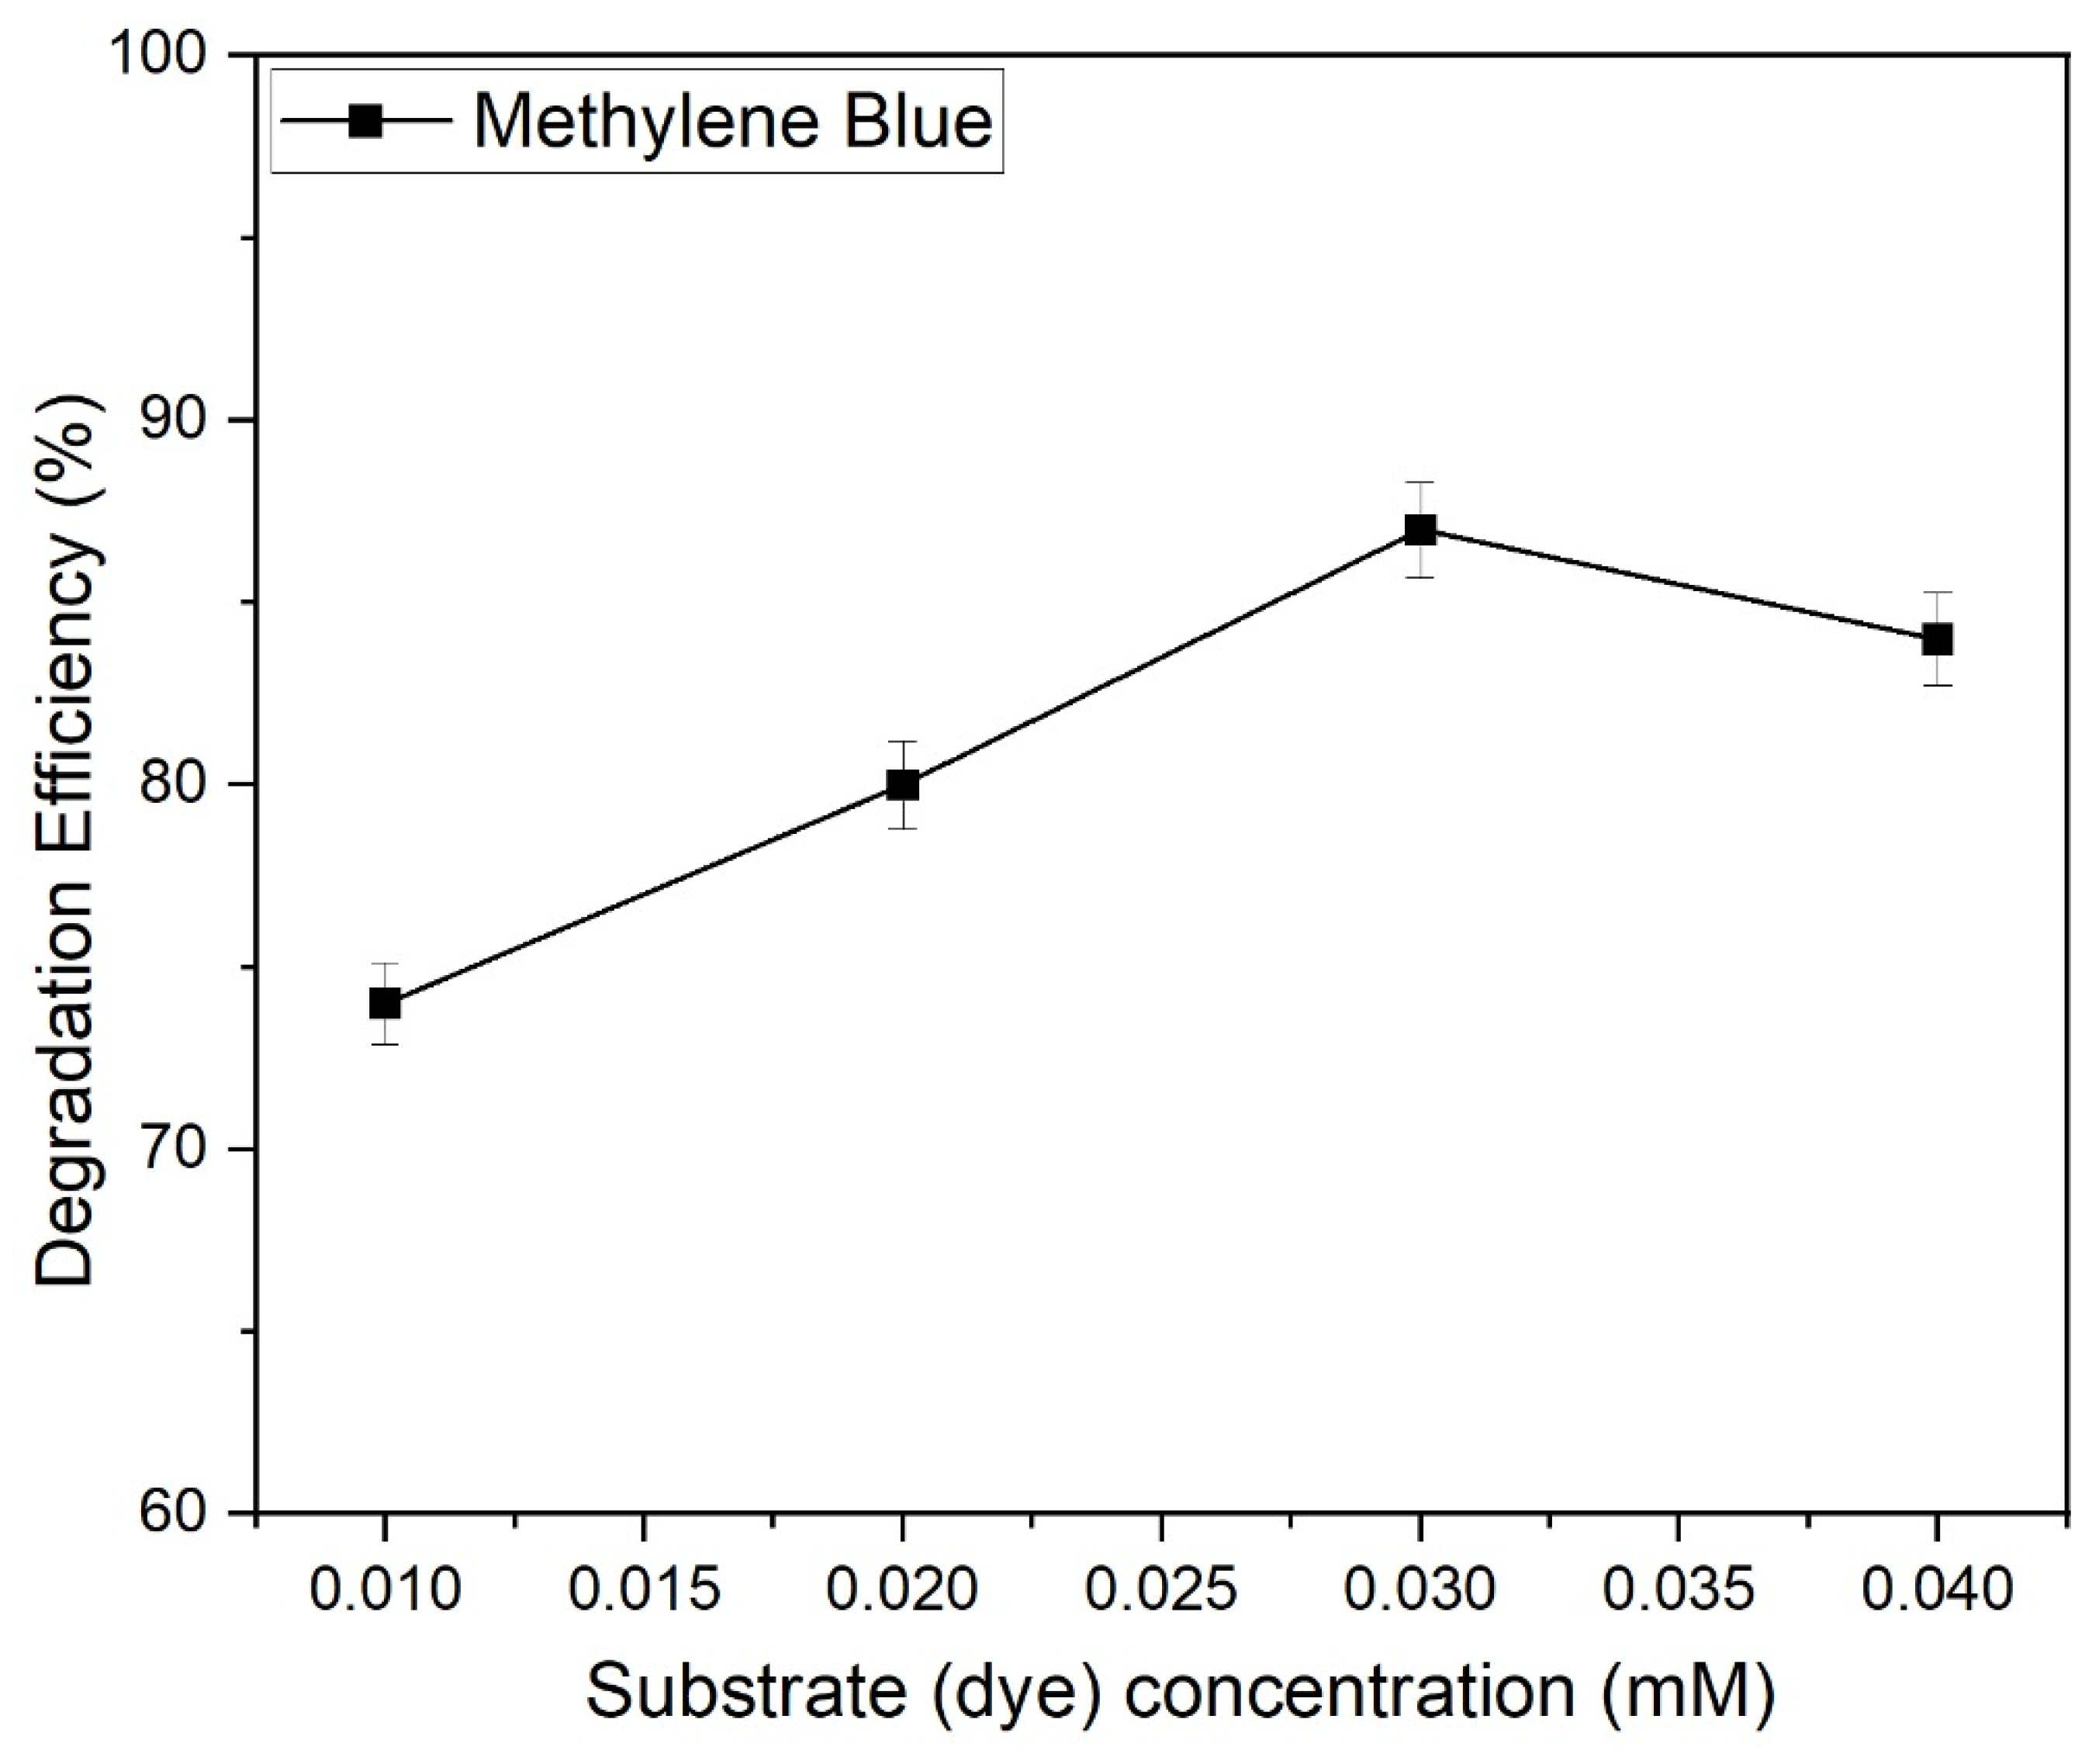
Generally, a high initial concentration of pollutants shows the way their molecules are adsorbed onto the surface of a photocatalyst, which is ultimately responsible for a high degradation efficiency. Therefore, it is necessary to study the correlation between substrate (dye) concentration and the rate of photocatalytic reaction, in terms of understanding the mechanism and practical applications. The impact of varying initial concentrations of the degradation of methylene blue was examined. The degradation efficiency, considering as function of substrate concentration and employing a ZnO/GO (7%) photocatalyst, is depicted in Figure 15. From the figure, it is evident that the degradation efficiency increased to a certain extent as the substrate concentration increased. However, a further increase in substrate concentration led to a reduction in degradation efficiency. For instance, the degradation efficiency rises from 0.01 M to 0.03 M, but beyond that, an increase in substrate concentration results in a decrease. This decline in degradation efficiency at higher concentrations might be attributed to the heightened intensity of the irradiating mixture’s color as the initial dye concentration increases, hindering light penetration to the catalyst’s surface [58]. The generation of OH (Hydroxyl radical) and O2 (superoxide radical) on the catalyst surface remains unchanged when the light intensity, illumination duration, and catalyst concentration are kept constant [58]. On the other hand, their levels will diminish with a rise in dye concentration since the dye molecules predominantly absorb and block light photons from reaching the catalyst surface [59]. Thus, with a constant photocatalyst weight, the degradation effectiveness of the dye reduces as the dye concentration rises.
Also, after a certain amount of dye, coverage of the catalyst surface by these dye molecules occurrs, blocking the catalyst surface from receiving an appropriate amount of light energy to generate the reactive radical species. Therefore, further increasing the concentration of dye (pollutant) has been found to decrease the degradation efficiency [59].

2.9.4. Impact of Catalyst Loading on the Photocatalytic Degradation of Methylene Blue

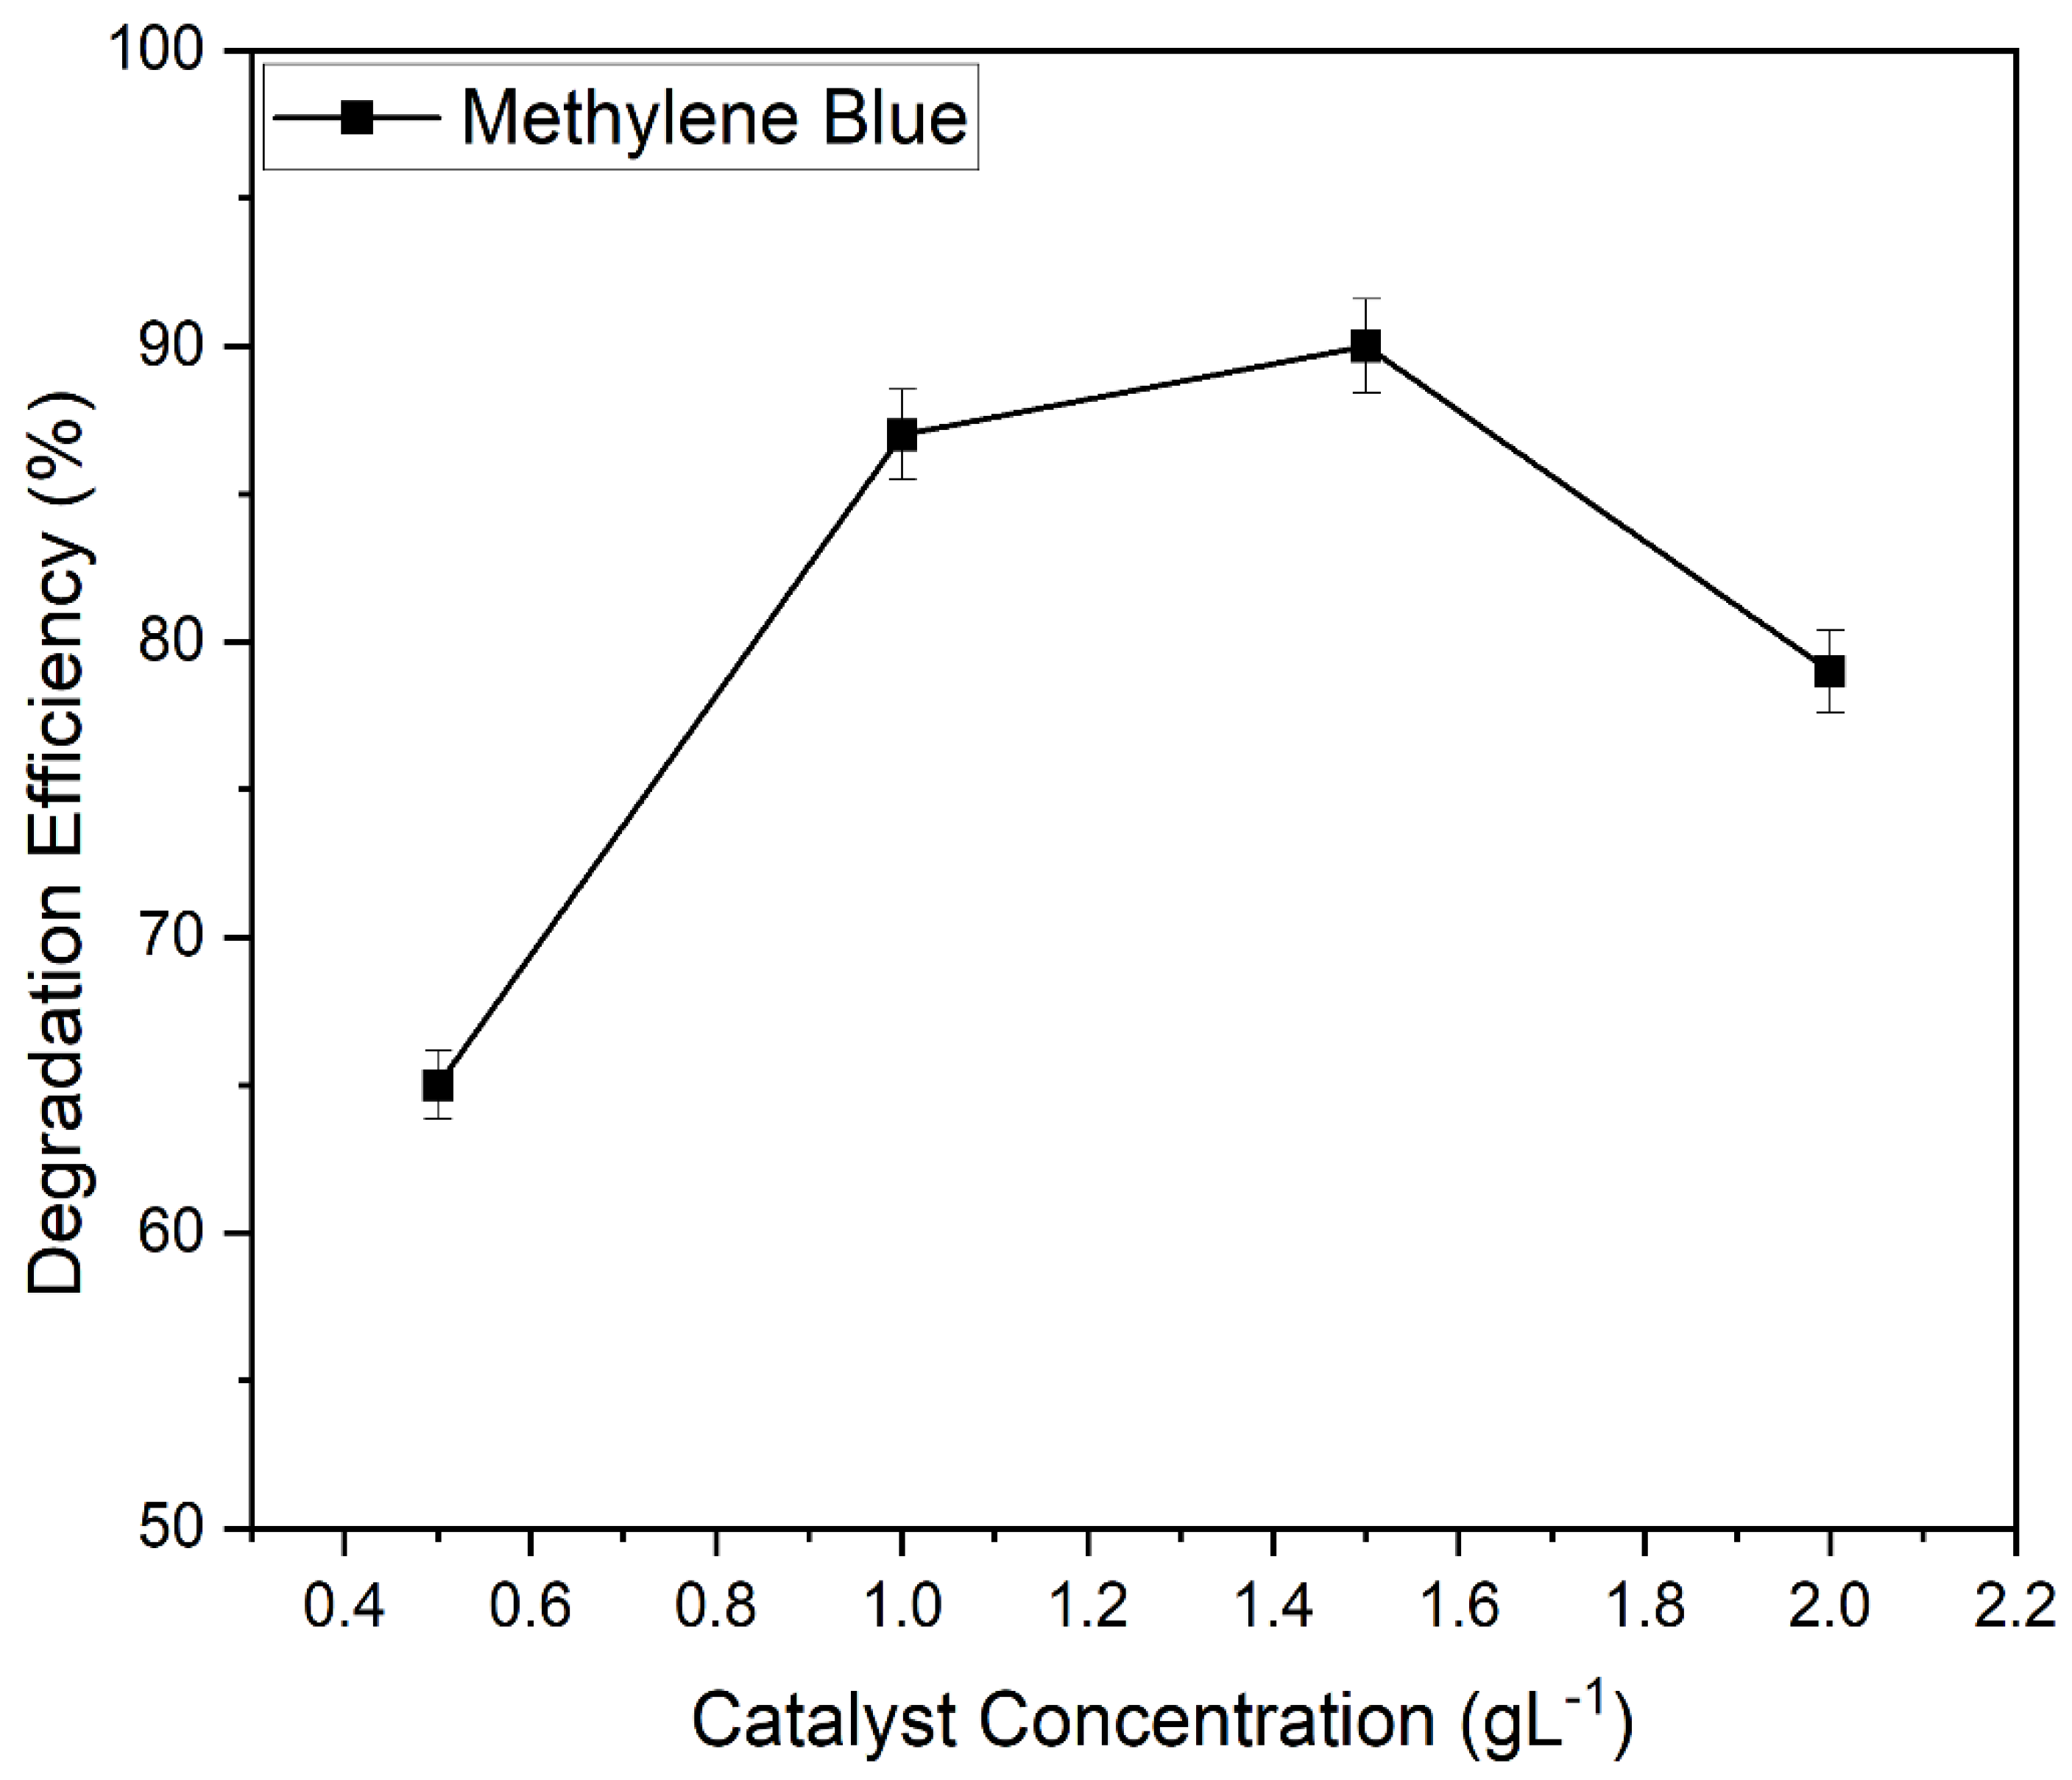
Identifying the optimal catalyst value at which the best degradation efficiency takes place is also important. Therefore, the impact of the photocatalyst concentration on the efficiency of methylene blue degradation (MB) was also examined, employing ZnO/GO (7%) at concentrations ranging from 0.5 to 2 gL−1. Figure 16 illustrates how the degradation efficiency of the dye changes with varying catalyst concentration. The figure demonstrates that increasing the weight of the photocatalyst up to 1.5 gL−1 enhances the degradation effectiveness for methylene blue. However, with increases in the amount of catalyst, a decline in degradation efficiency was observed. During the degradation process of methylene blue, the degradation efficiency increases as the catalyst concentration increases from 0.5 gL−1 to 1.5 gL−1. However, further increasing the catalyst concentration from 1.5 gL−1 to 2 gL−1 results in a decrease in the degradation efficiency. It was noted that beyond a specific concentration threshold, the degradation efficiency declines. This threshold is determined by the photoreactor’s configuration and operational circumstances, ensuring complete illumination of all exposed particle surfaces with a specific quantity of photocatalyst [60]. At high catalyst concentrations, light penetration is hindered by turbidity after a certain distance along the optical path. Therefore, it is essential to determine the optimal catalyst concentration to prevent excess usage and ensure efficient light penetration throughout the process. In the case of the zinc oxide/graphene oxide (7%) photocatalyst, although the best degradation efficiency was found at 1.5 gL−1, there was not much difference in the degradation efficiency at 1 gL−1 and 1.5 gL−1; therefore, to avoid wastage of the photocatalyst, 1 gL−1 was used across all other parameters.

2.9.5. Effect of pH on the Photocatalytic Degradation of Methylene Blue

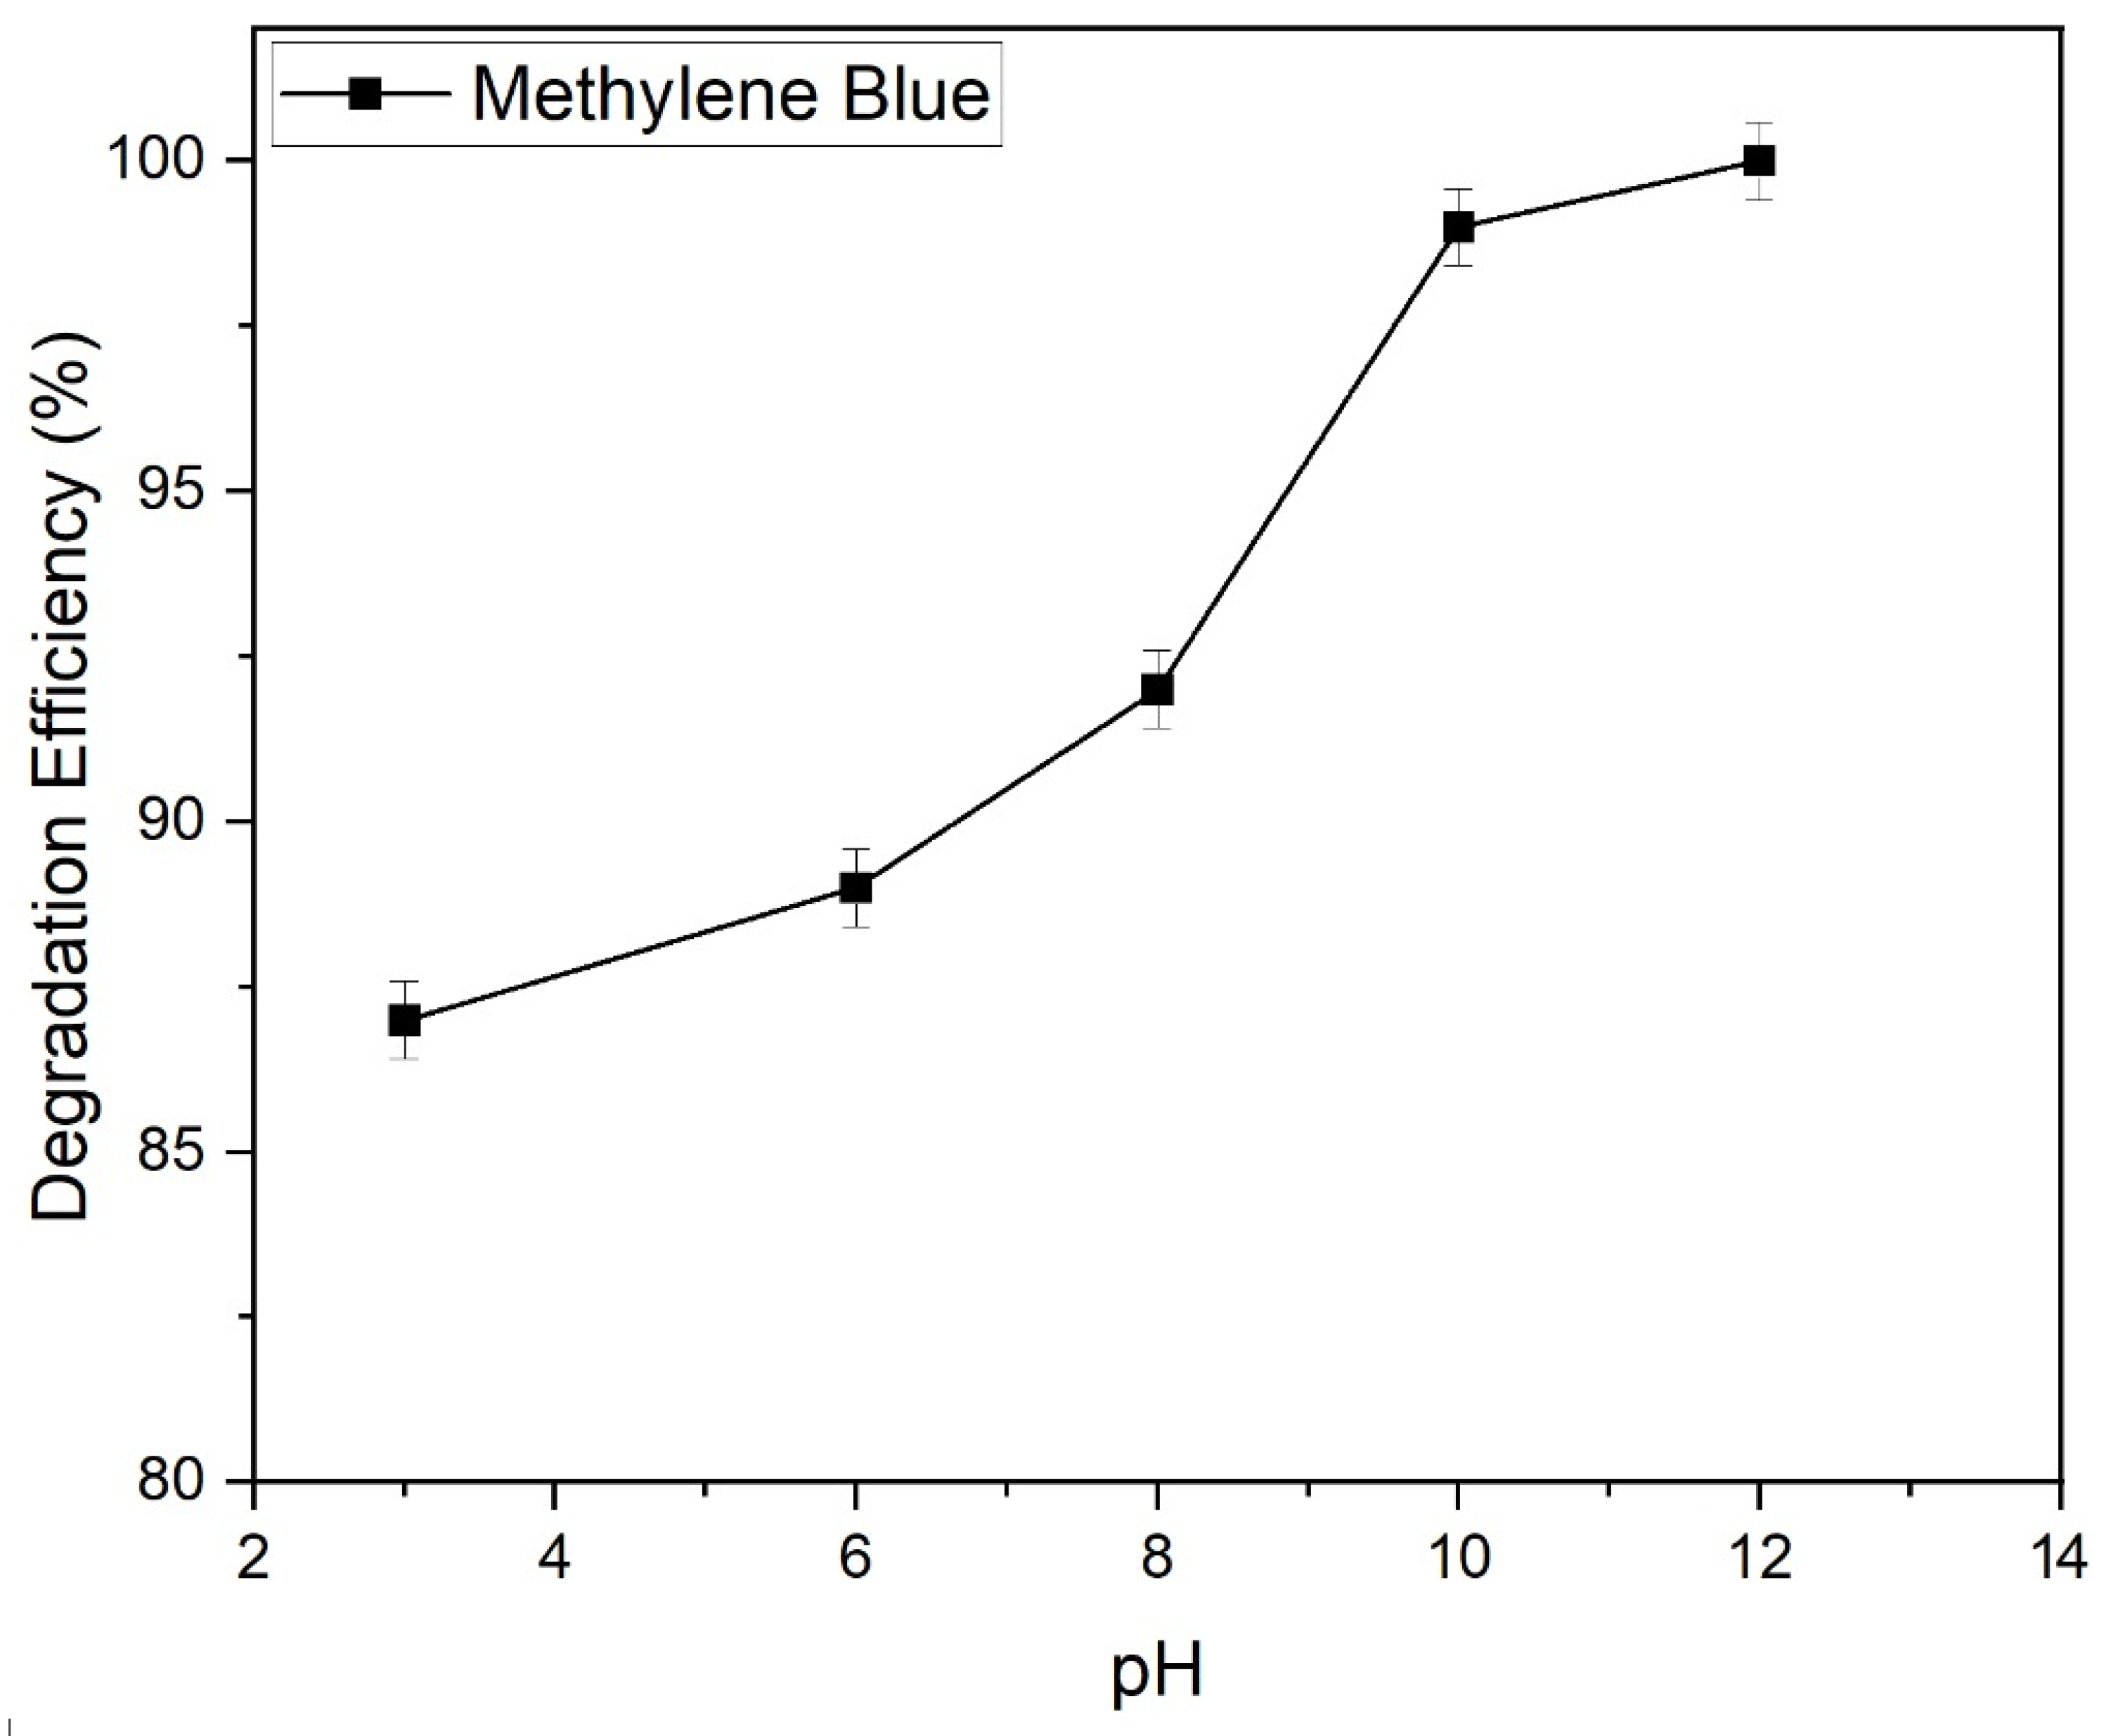
The effectiveness in degrading methylene blue was examined within a pH range of 3 to 12, utilizing ZnO/GO (7%) as the photocatalyst. Figure 17 illustrates the relationship between reaction pH and the degradation effectiveness of methylene blue. The findings reveal that the dye’s degradation efficiency was lower at lower pH values and increased as the initial reaction pH increased, with the highest efficiency noted at pH 12. The pH (pzc) value was found to be 6.64. Also, in the literature, a comparable value was reported for zinc oxide/graphene oxide photocatalysts [61]. Conversely, with a pKa value of 3.8 for methylene blue, dye molecules exist predominantly in their cationic form above this value and anionic form below this value. As pH rises, the negative charge on the photocatalyst leads to increased attraction with dye molecules, which intensifies with higher pH levels, consequently increasing photodegradation effectiveness [53]. Furthermore, the large number of hydroxyl radicals also causes an increase in the degradation process at higher pH values [62].

2.9.6. Reusability of the Photocatalyst for Photocatalytic Degradation of Methylene Blue

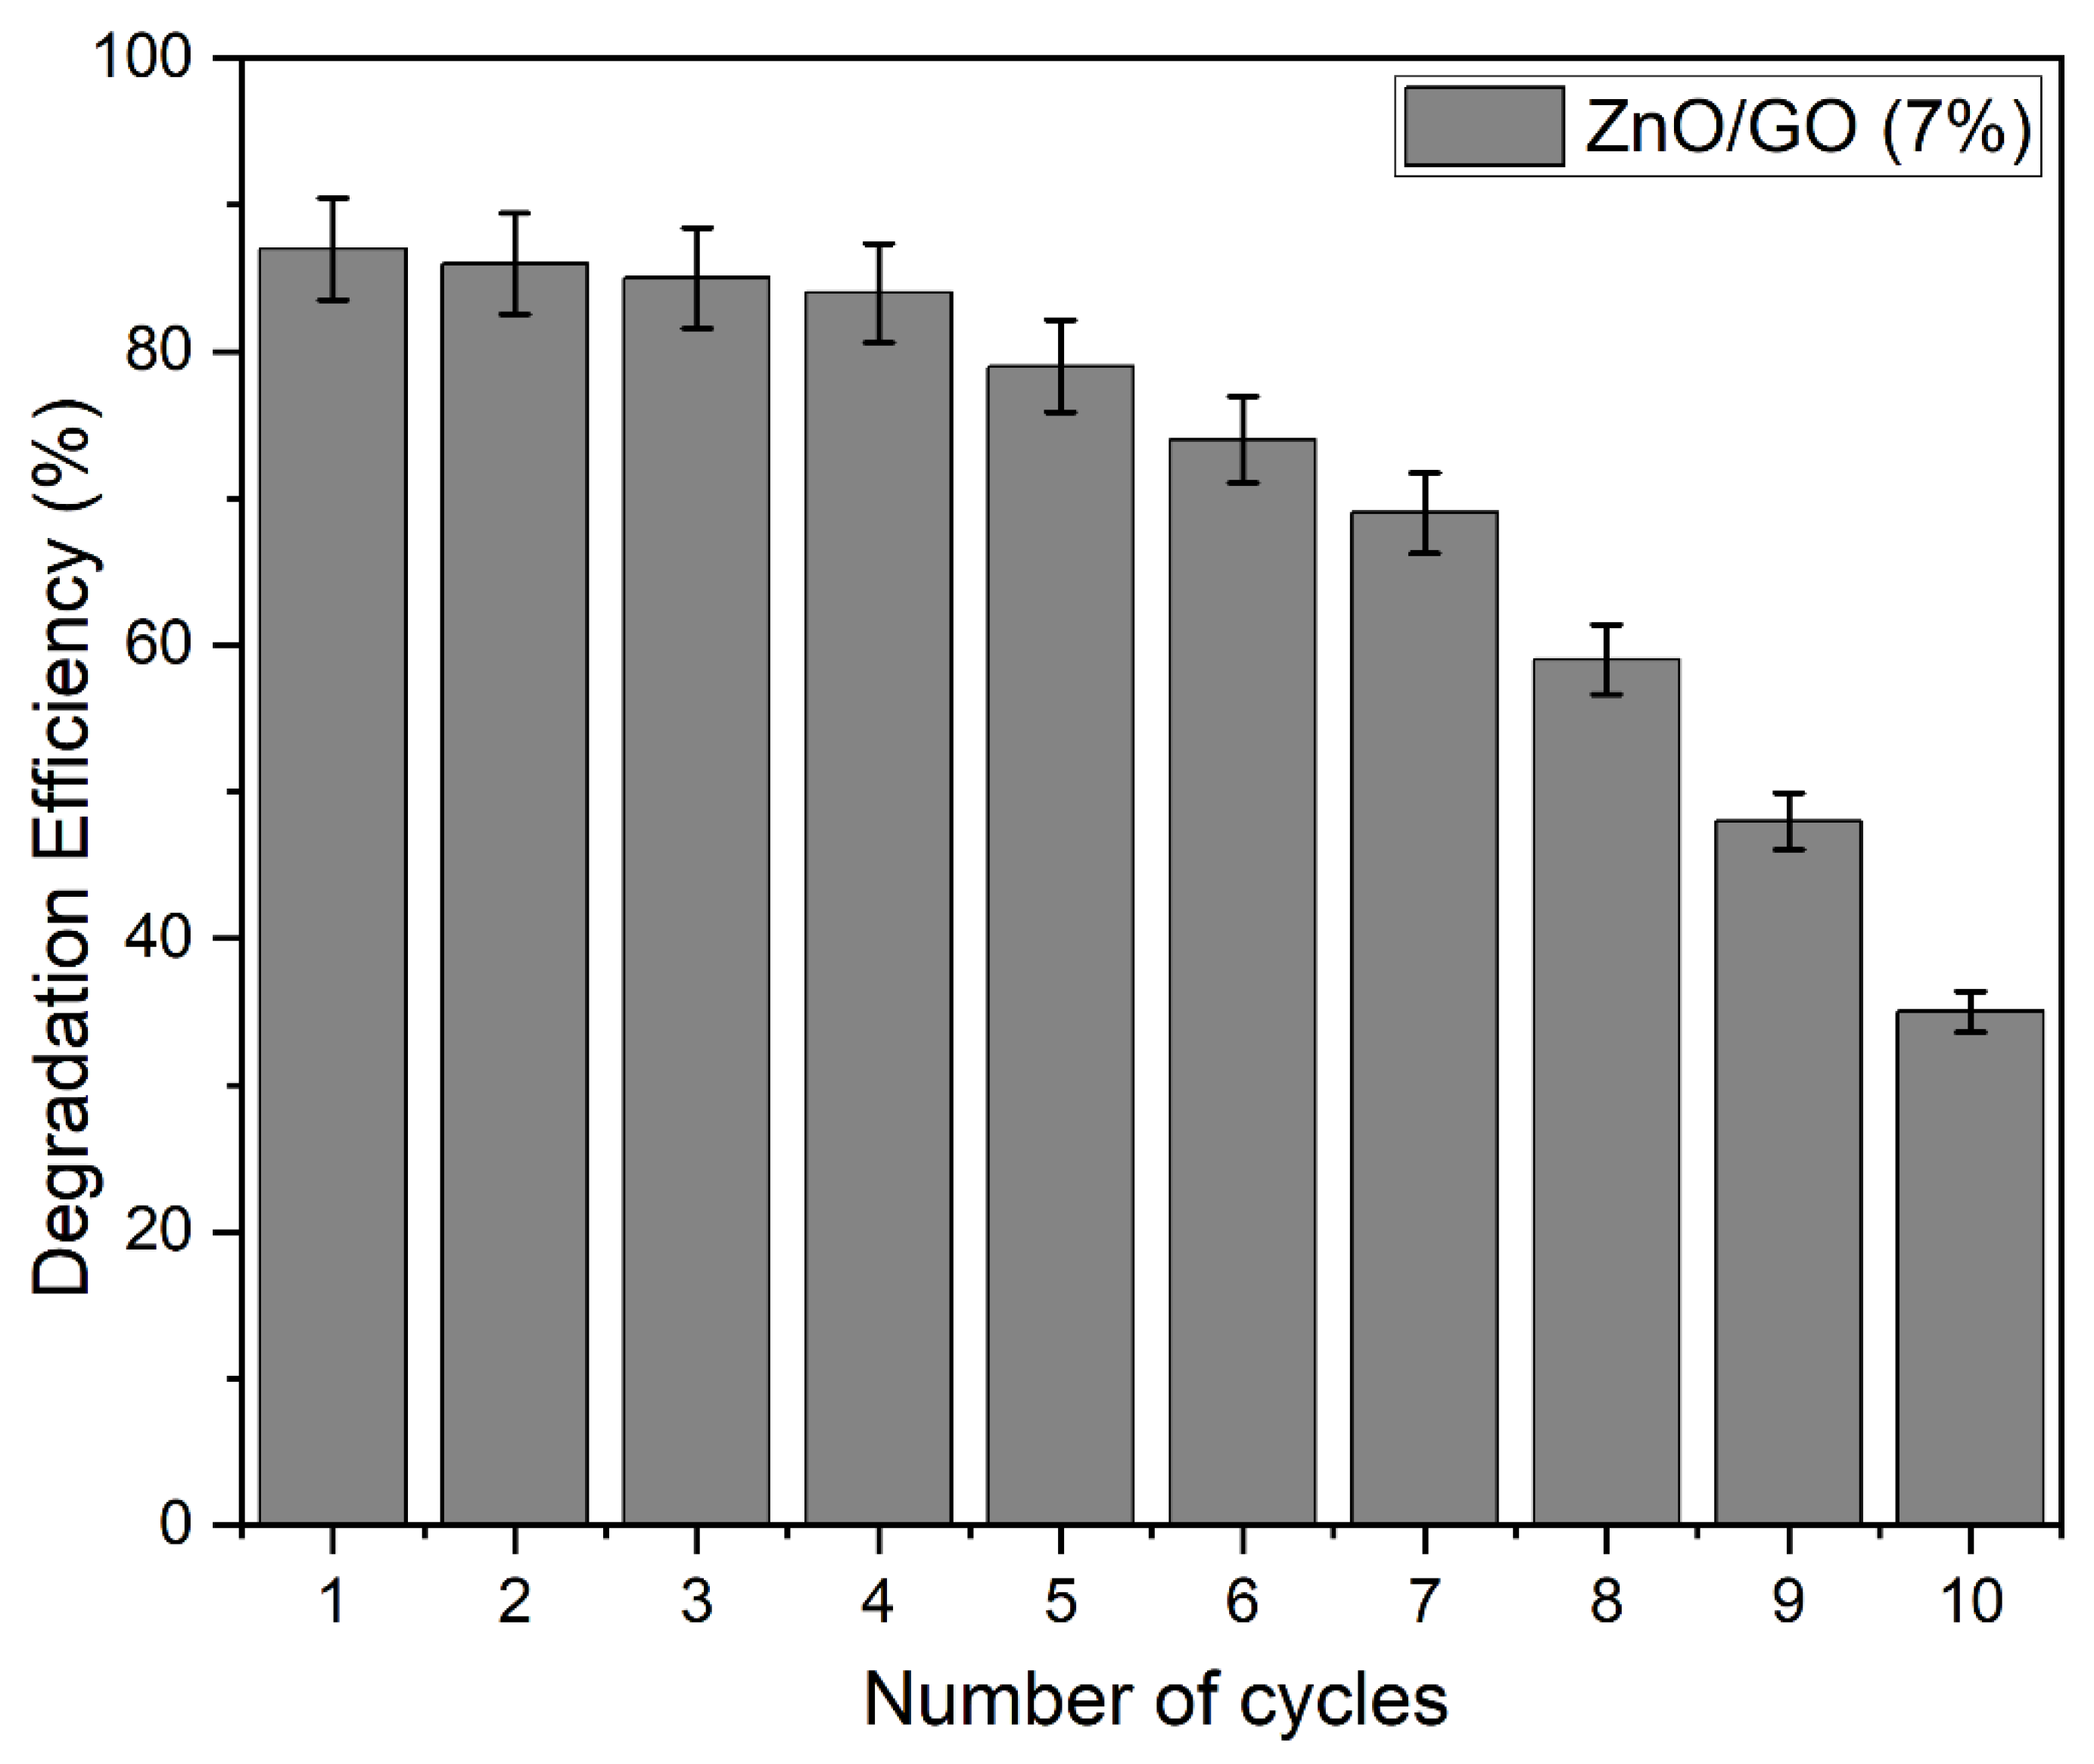
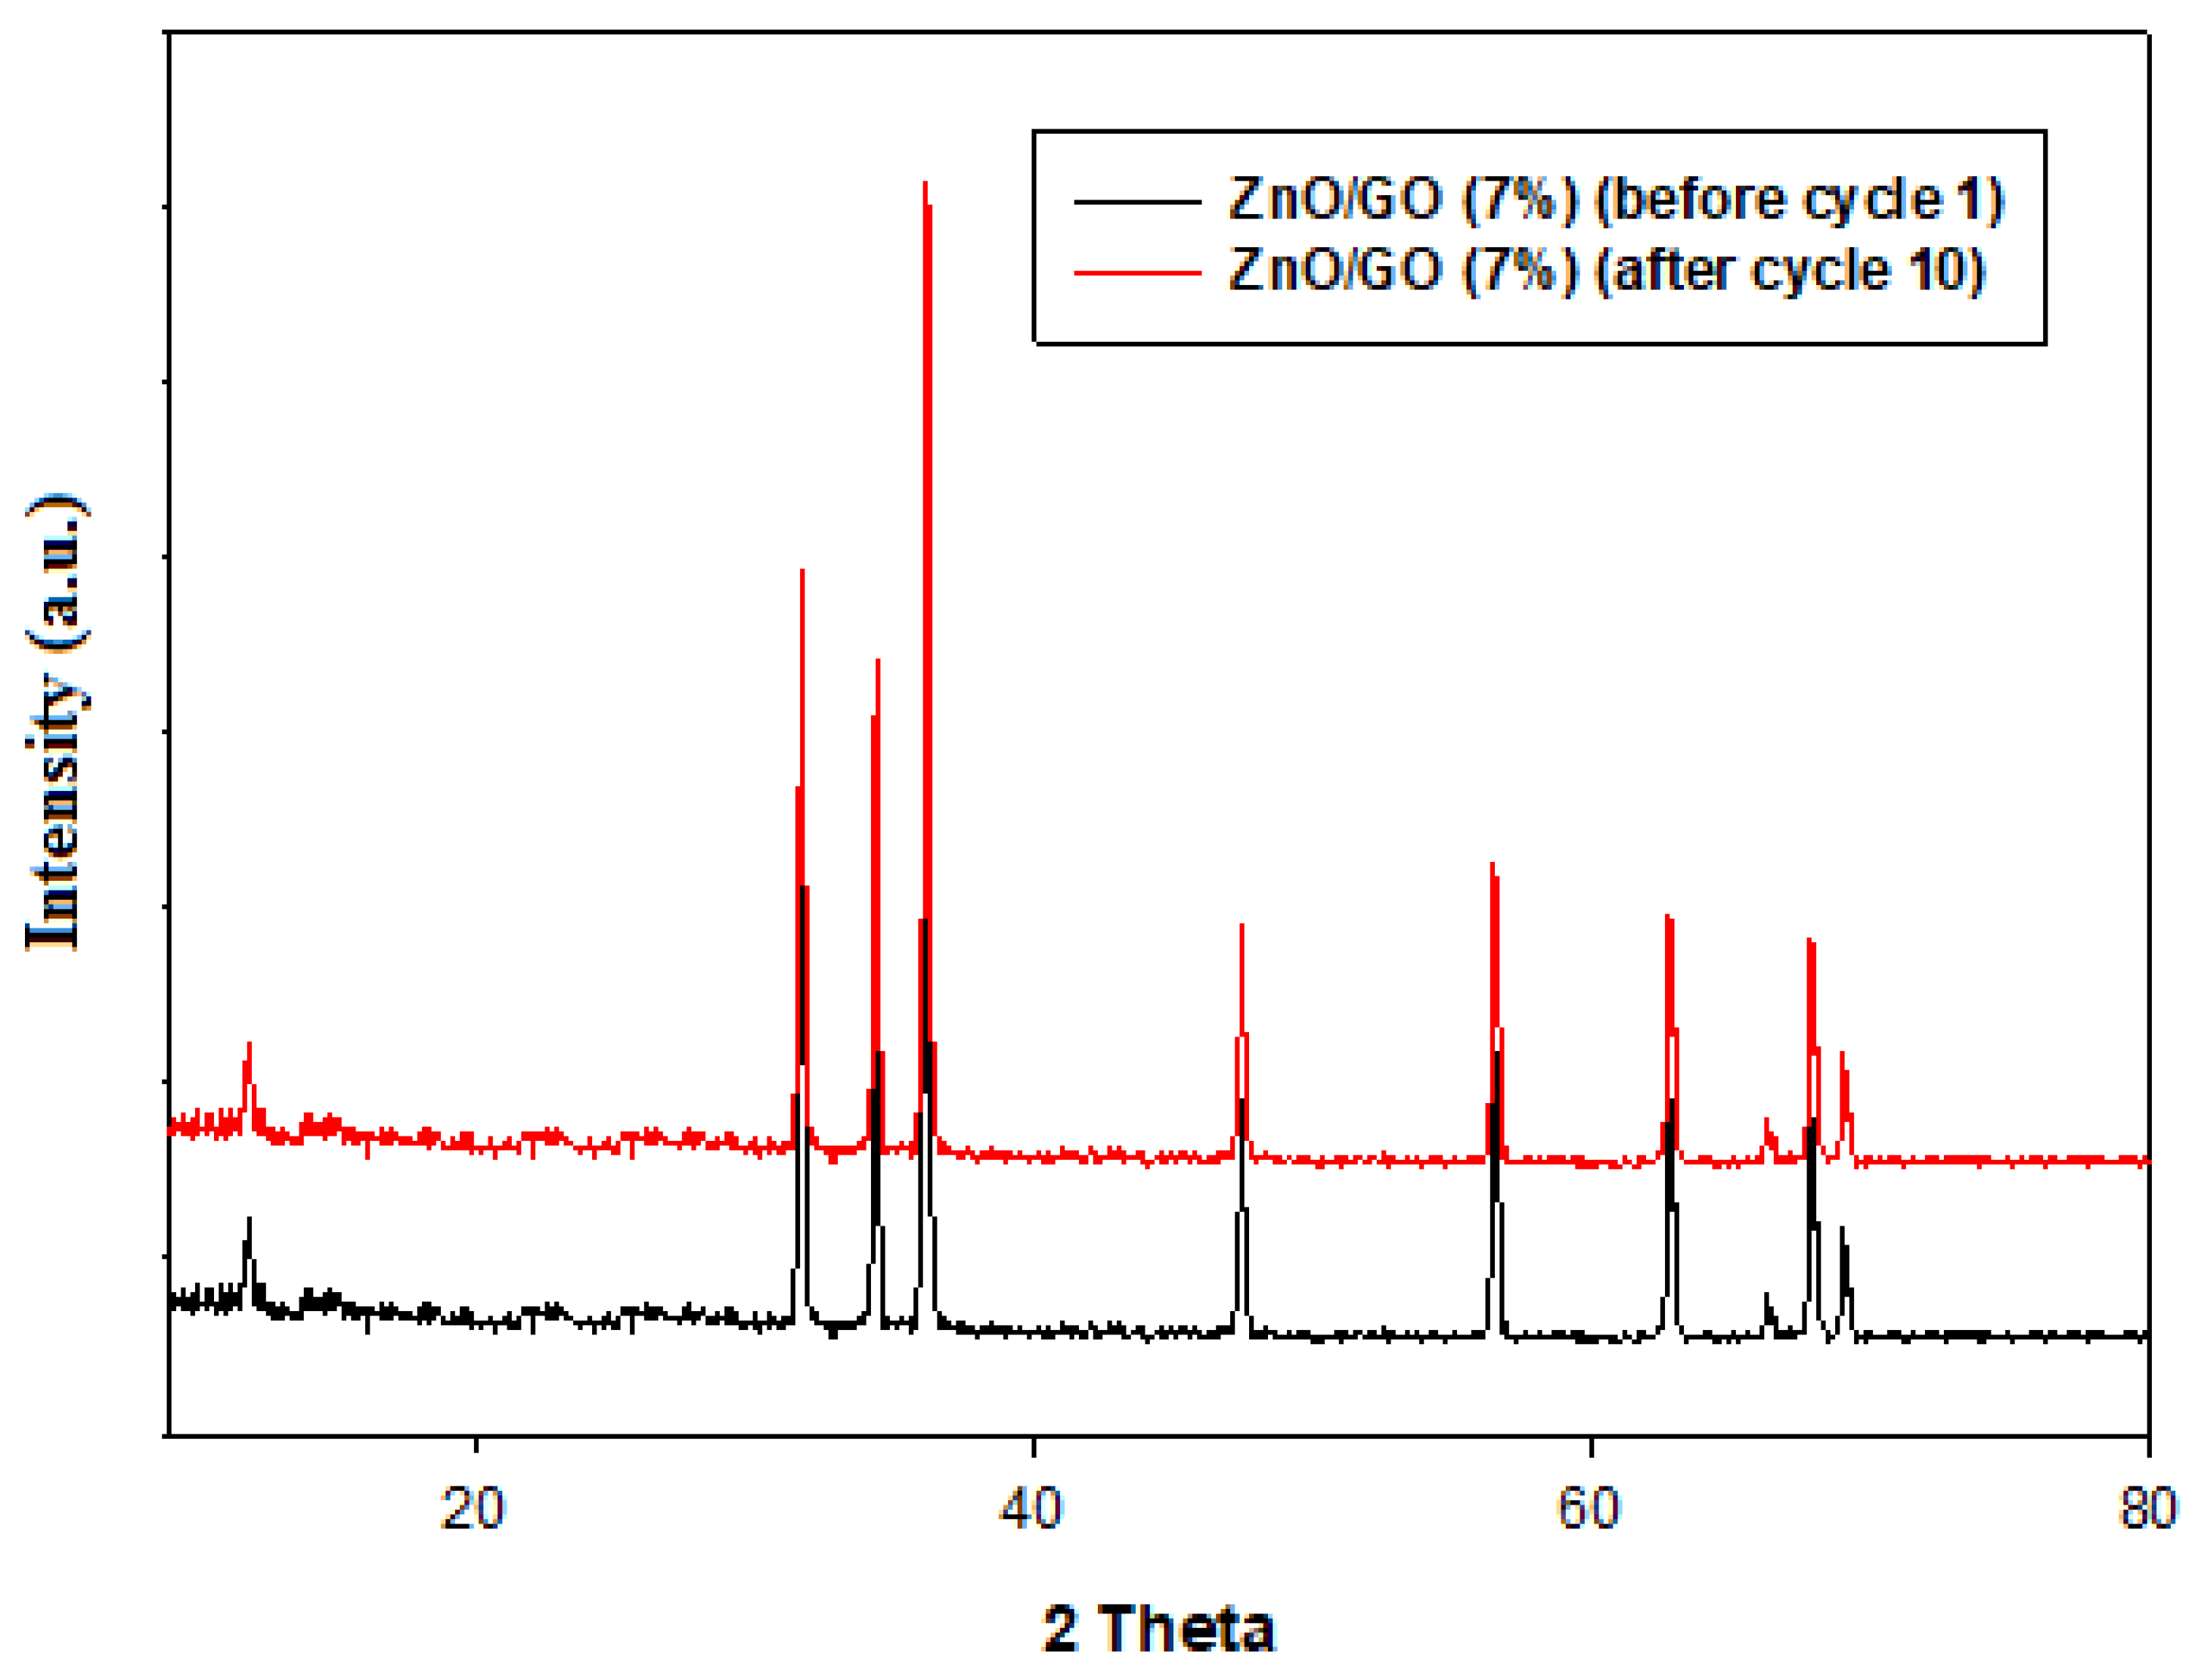
The reusability of ZnO/GO (7%) nanocomposites was assessed to explore their stability and efficiency during the operational process. For this purpose, ten consecutive tests (cycles) were conducted with catalyst recycling under same conditions. Following each experimental test, the photocatalyst underwent centrifugation, was dried at 65 °C for 4 h, and was subsequently utilized again for the degradation of methylene blue. Figure 18 displays the outcomes of methylene blue degradation using ZnO/GO (7%) as the photocatalyst. After the tenth cycle, a decrease in degradation efficiency from 87% to 37.5% was observed. This trend indicates a modest decline in degradation efficiency, possibly attributed to the formation of specific oxidation products on the catalyst surface, which may have depleted certain active sites [54]. Secondly, the aggregation of photocatalysts in each cycle caused a decrease the surface area of the photocatalyst, resulting in a decrease in the photocatalytic activity. Moreover, the catalysts were in powder form during recovering, leading to some loss in the reaction medium in each cycle and also causing a decrease in efficiency. Moreover, the deactivation of photocatalysts occurred due to strong surface adsorption of some intermediates and products formed during the photocatalytic degradation process. Furthermore, deactivation of doped/interfaced photocatalysts may be caused by aggregation or reduction/oxidation of the doped materials. The leaching of Zn2+ ions or carbonaceous portions during the recyclability process can significantly impact the long-term stability of the photocatalyst. It could reduce the material’s performance and introduce contaminants into the environment. Moreover, the leaching of Zn2+ ions can also lead to a gradual loss of functionality, especially in applications like photocatalysis, where zinc is a key component, while carbonaceous fragments can affect the performance of the material. Figure 19 shows the XRD patterns of TiO2/GO (7%), before cycle 1 and after cycle 10, with the results suggesting the restoration of the structural phase of the photocatalyst.

2.9.7. Reaction Kinetics for the Degradation of Methylene Blue Using ZnO (Commercial and Synthesized) and ZnO/GO (7%)

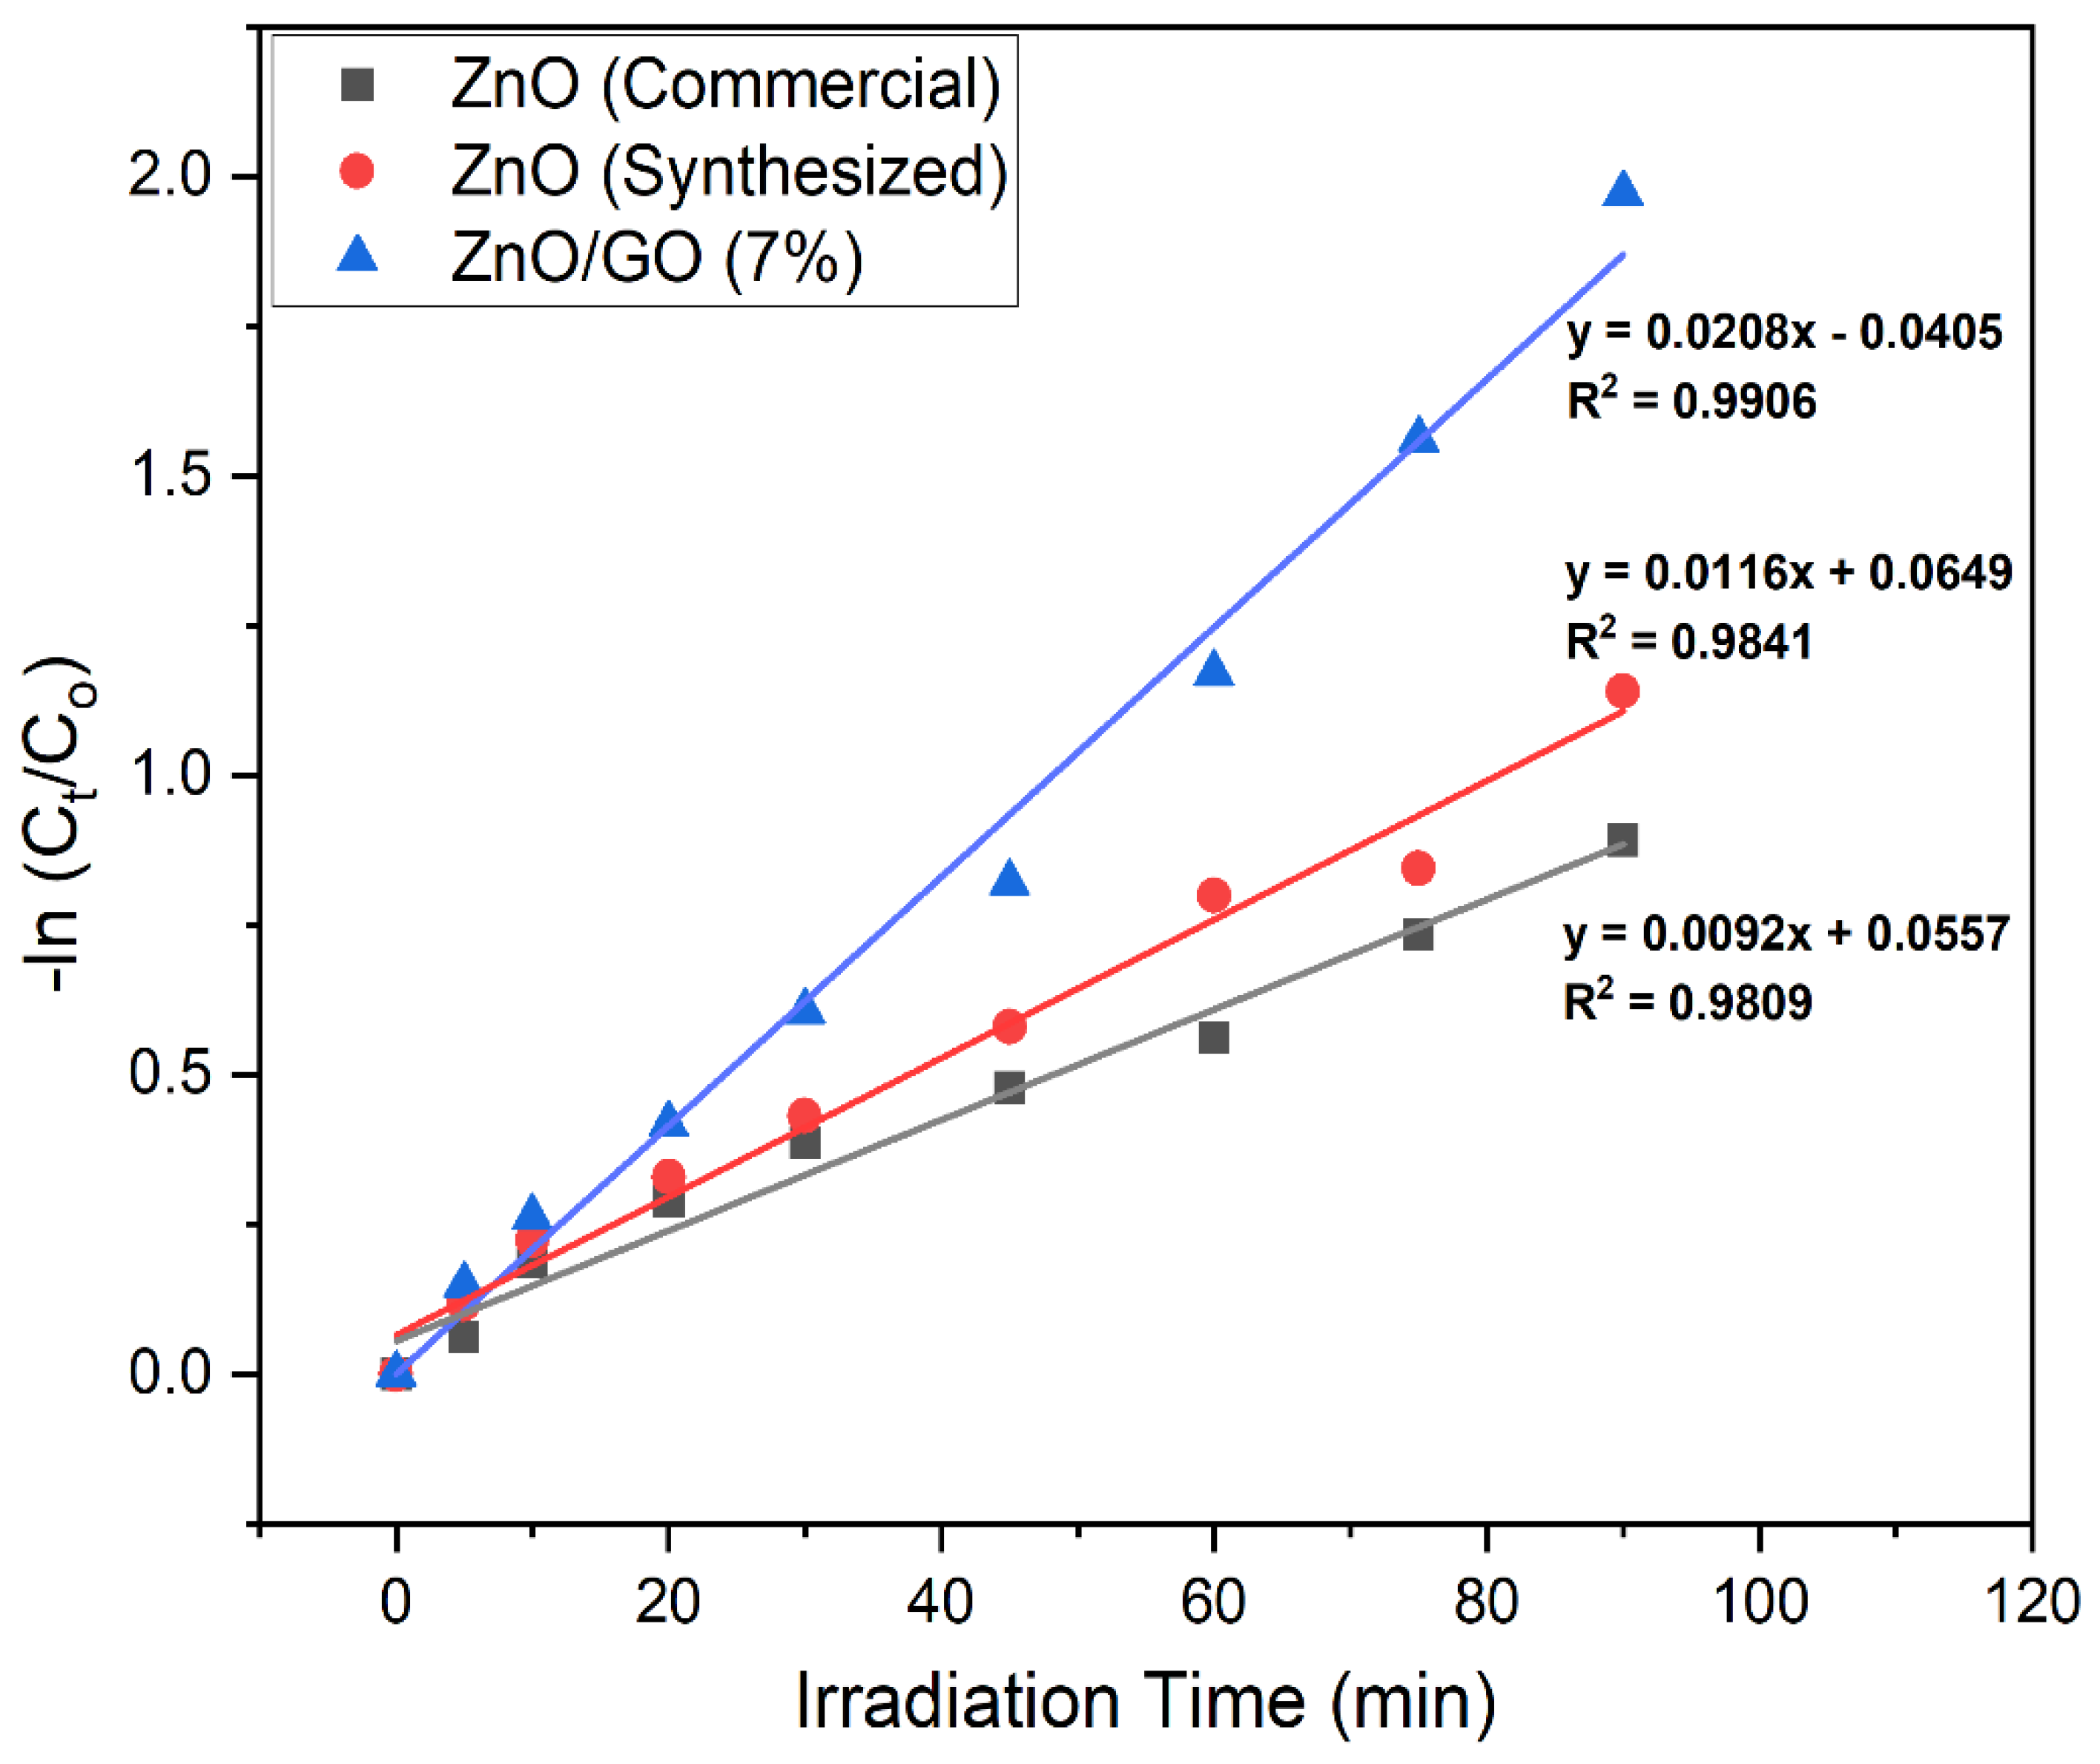
The kinetics of photocatalytic degradation of methylene blue were carried out by employing the optimal experimental conditions that were found in the above experiments. The experiment on catalytic degradation follows the rate constant of pseudo-first-order kinetics [plots − ln (Ct/Co)] vs. time, showing a linear relationship, as shown in Figure 20. In the equation [−ln(Ct/Co) = kt], Co is the equilibrium concentration of methylene blue, and Ct is the concentration at time t. According to the equation, the apparent pseudo-first-order rate constant kapp and regression coefficient values (R2) are calculated for all samples, and the obtained values are given in Table 2. The calculated rate constant values for commercial ZnO, synthesized ZnO, and ZnO/GO were found to be 0.0092, 0.0116, and 0.0208 min−1, respectively. The degradation of MB by the GO/ZnO photocatalyst shows the highest rate constant value, following the pseudo-first-order kinetic model. The calculated regression coefficient (R2) values for commercial ZnO, synthesized ZnO, and ZnO/GO are, 0.9809, 0.9841, and 0.9906 respectively. Our observation is consistent with previous studies [63,64].

2.9.8. Scavenger Test for the Degradation Methylene Blue Using ZnO/GO (7%)

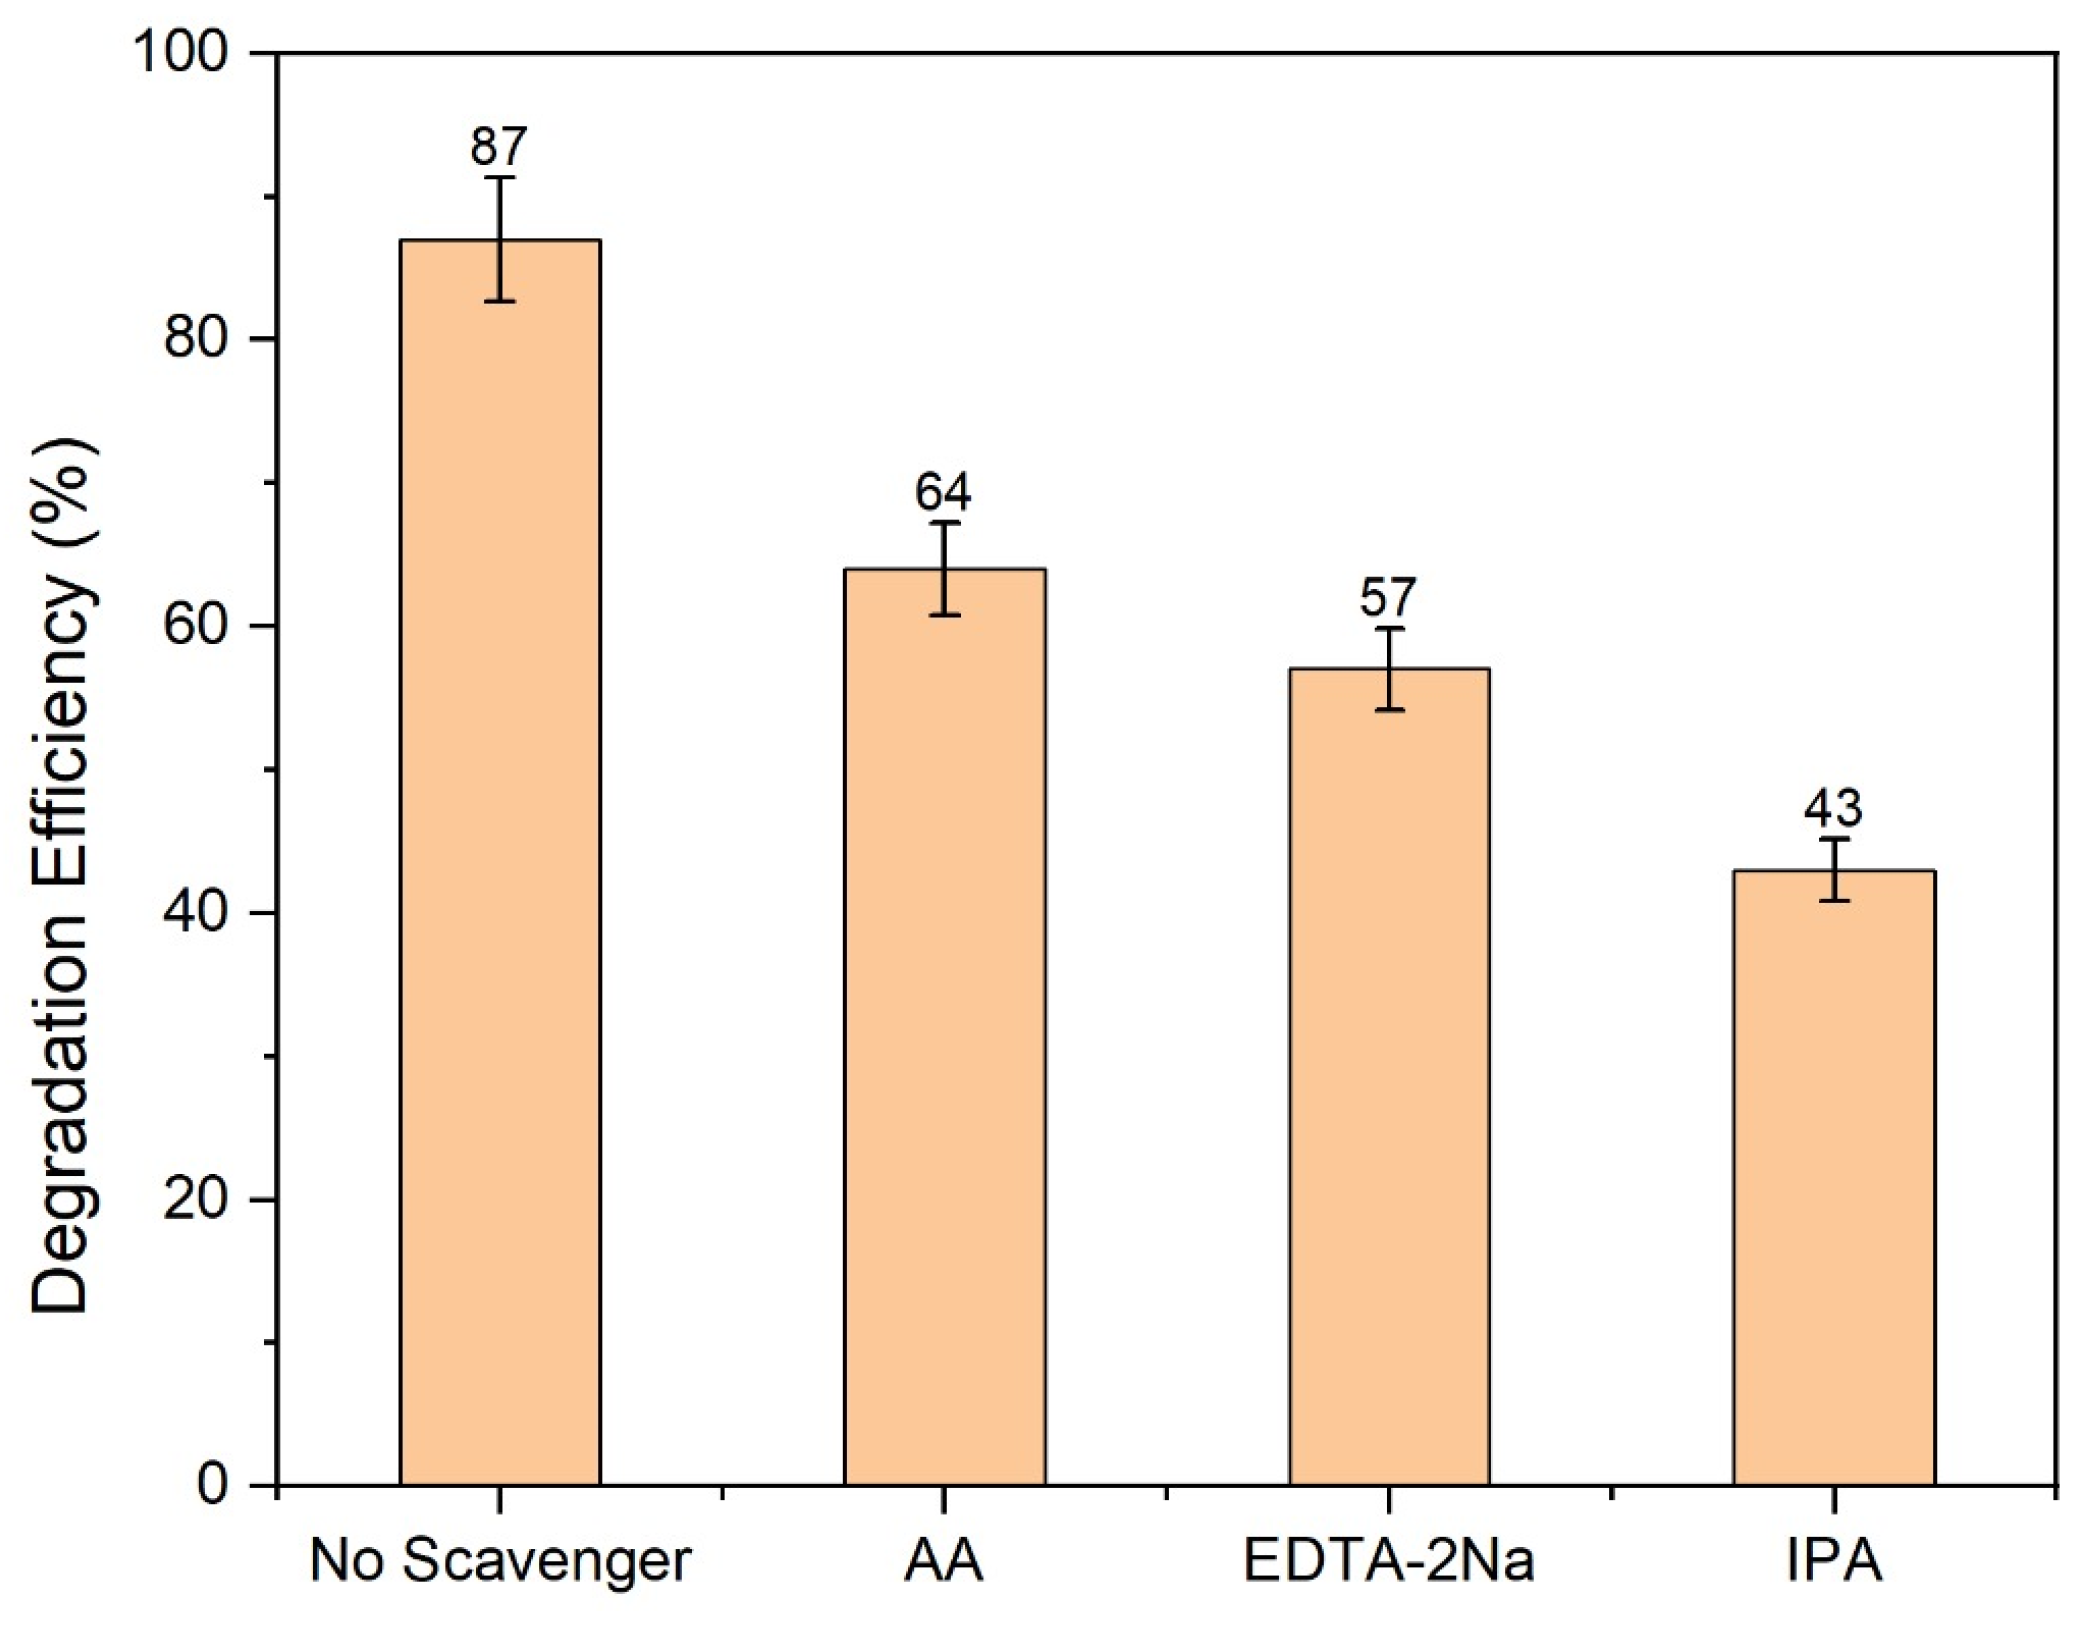
To identify the predominant reactive oxygen species (ROS) involved in the photocatalytic degradation of MB using ZnO/GO (7%), scavenger experiments were performed by employing isopropyl alcohol (IPA, 1 mM) for hydroxyl radicals (OH), EDTA-2Na (1 mM) for holes (h+), and ascorbic acid (AA, 1 mM) for superoxide radicals (O2). The results are presented in Figure 21, which show a significant effect of these scavengers on the photocatalytic efficiency of ZnO/GO (7%). Likewise, the addition of EDTA-2Na shows the lowest inhibitory effect, which suggests that that photogenerated electrons play a less significant role, while IPA shows the highest inhibitory effect, as shown in Figure 21. The degradation efficiency decreases from 87% to 64%, 57%, and 43% when adding AA, EDTA, and IPA respectively. This suggests that hydroxyl radicals (OH) act as highly influential species actively participating in the oxidation of MB as compared to others, such as holes (h+) and superoxide radicals (O2). According to the obtained results, the order of involvement of species in the degradation of MB is as follows: (OH > h+ > O2) [65]. Moreover, the photocatalytic activity of ZnO/GO, as obtained in this study, was compared with those of the related samples reported in the literature and is shown in Table 3.

3. Material and Methods

3.1. Materials

The raw material and chemicals used in this study are OPEFB fibre, lime peel, zinc sulphate, hydrochloric acid (HCL, 37%), zinc oxide, ethanol (70%), potassium permanganate, sodium nitrate, sulfuric acid, (95–98%), AND hydrogen peroxide, (30%). All chemicals were purchased from Chemiz (M) Sdn. Bhd, Shah Alam, Malaysia. The techniques that were used in the preparation of the photocatalyst nanocomposites and characterization study are Fourier transform infrared (Perkin Elmer System 2000, Norwalk, CT, USA), photoluminescence (Perkin Elmer LS55, Waltham, MA, USA), X-ray diffraction (Philips PW 1710 X-ray diffractometer, New York, NY, USA), scanning electron microscopy (Quanta FEG 650, Fei; Columbia, MO, USA), transmission electron microscopy (Model Zeiss Libra 120; Jena, Germany), Raman spectroscopy (Renishaw in Via Raman Microscope, Gloucestershire, UK), ultraviolet–visible spectroscopy (UV-2600 SHIMADZU, Kyoto, Japan), and ultraviolet–visible diffuse reflectance spectroscopy (UV-Vis DRS) (Perkin Elmer Lambda 35, Norwalk, CT, USA), employing a furnace (Carbolite AAF 1100, Neuhausen, Germany), weighing balance (Sartorius, BSA224S-CW, Göttingen, Germany), hotplate stirrer (Favorit, Melaka, Malaysia), centrifuge (KUBOTA Fujioka, Japan), and oven (Schwabach, Germany).

3.2. Methods

3.2.1. Carbonization of Oil Palm Empty Fruit Bunch Fibre (OPEFB)

A furnace was used to carbonise 20 g of OPEFB fibre for three hours at 700 °C. The sample was heated at a steady rate of 10 °C per min. Later, the sample was left to cool until it reached room temperature. The sample (3.98 g) was then milled into a fine powder and utilised in the subsequent step of OPEFB_GO production.

3.2.2. Preparation of Graphene Oxide (GO)

Commercial graphite was substituted with carbonised OPEFB for GO synthesis. Hummers’ technique was used to oxidise the material. Initially, 69 mL of concentrated sulphuric acid, 1.5 g of sodium nitrate, and 3 g of carbonised sample were combined while being constantly stirred, and the mixture was cooled to 0–4 degrees Celsius with the help of an ice bath. After that, 9 g of potassium permanganate was added, and the reaction’s temperature was kept below 20 °C. The mixture was then agitated at 35 °C for 30 min. This time, the reaction was cooled by gradually adding 138 mL of water. Afterwards, 420 mL of water was mixed with 30 mL of hydrogen peroxide. Following a wash with ethanol, water, and hydrochloric acid, the solid was centrifuged for 15 min at 3500 rpm, and the supernatant was decanted. The residue was allowed to dry overnight at room temperature, weighing 0.815 g. In the following section of the experiment, the synthesised GO was further utilized and characterized.

3.2.3. Synthesis of ZnO

The synthesis of ZnO implemented in this work is a modified version of reported methodology form a previous study [22]. Firstly, 10 g of lime peel powder was added into a beaker containing 250 mL of distilled water. After one hour of stirring, the mixture was placed in a water bath at 60 °C for 1 h. Next, the mixture was filtered, and the extract was used to prepare ZnO. In this stage, 2 g of zinc sulphate was mixed with 150 mL of the lime extract and stirred for 1 h. Following this, the mixture was placed in a water bath at 60 °C for 1 h. Afterwards, the mixture was dried at 100 °C for 1 h and calcined with a steady rate of 10 °C per min up to 400 °C, weighing 0.745 g.

3.2.4. Preparation of ZnO/GO Nanocomposites

The ZnO/GO nanocomposites (shown in Figure 2) were prepared following the procedure reported in a previous study (21). Varied loadings of GO were used, ranging from 1%, 3%, 5%, 7%, and 10%. Initially, a required amount of GO was dispersed in distilled water to obtain a GO suspension using the sonication process. Then, synthesis was performed, with a mass ratio of GO:Zn(SO4)2. The mass ratio variations were 1:99 (1.0 mg:99.0 mg), 3:97 (3.0 mg:97.0 mg), 5:95 (5.0 mg:95.0 mg), and so on, with the addition of 250 mL of lime peel extract in a continuous stirring process. The suspension containing ZnO/GO was filtered and washed with ethanol. Finally, the product was dried in an oven at 75 °C for 12 h.

3.2.5. Photocatalytic Degradation Experiment

Prior to the degradation study, a stock solution of MB (0.03 mM) was prepared in distilled water. The photocatalytic degradation of MB dye was carried out using the prepared ZnO and ZnO/GO as the catalyst by adding the required amount. A defined concentration of dye was placed in a photoreactor, and the desired amount of catalyst was dispersed into the dye solution accordingly. The mixture was stirred for 30 min, and the conditions were kept dark to achieve an adsorption–desorption equilibrium before being irradiated using halogen linear lamp (which generally emits radiation, having wavelength from 350–700 nm, i.e., mostly in the visible region). A round cylindrical photoreactor was used in this study, and the light intensity falling on the solution was found to be 1.46–1.49 mWcm−1. During irradiation, stirring was maintained using a magnetic stirrer with a magnetic bar. The collected sample was centrifuged at 3000 rpm to remove the catalyst. The final MB concentration was determined using a UV–Vis spectrometer.

4. Conclusions

This study successfully demonstrated a sustainable and effective approach for the photocatalytic degradation of methylene blue (MB) using novel ZnO/GO nanocomposites synthesized via green methods. The utilization of lime peel extract for ZnO synthesis and oil palm empty fruit bunch (OPEFB) fibre for GO production showcases a promising waste-to-resource strategy, significantly reducing reliance on toxic chemicals and addressing agricultural waste management. Comprehensive characterization techniques confirmed the successful formation of ZnO/GO nanocomposites with tailored properties. The integration of GO effectively mitigated the inherent limitations of pristine ZnO, such as rapid electron–hole recombination and limited visible light absorption. Specifically, the ZnO/GO (7%) nanocomposite exhibited superior photocatalytic performance, achieving an impressive 87% degradation of MB within 90 min under visible light irradiation. This enhanced efficiency was primarily attributed to GO’s role as an efficient electron acceptor and transporter, which facilitated charge separation and increased the availability of reactive species for degradation. Optimized operational parameters, including catalyst loading, initial dye concentration, and pH, further highlighted the practical applicability of the developed photocatalyst. The pseudo-first-order kinetic model accurately described the degradation process, with the ZnO/GO (7%) composite demonstrating the highest reaction rate constant. Scavenger experiments elucidated the crucial role of hydroxyl radicals (OH) as the predominant reactive oxygen species in the degradation mechanism. In conclusion, this research provides a viable and environmentally friendly solution for mitigating dye-induced water pollution. The green synthesized ZnO/GO nanocomposites offer a cost-effective, sustainable, and efficient photocatalytic platform for the removal of organic pollutants from industrial effluents, aligning with global sustainability goals and contributing to cleaner water initiatives. Moreover, as a future recommendation, there will be more work required in this area to ensure that wastewater treatment applications can be used efficiently on a large scale.

Supplementary Materials

The following supporting information can be downloaded at: https://www.mdpi.com/article/10.3390/catal15090874/s1, Light source characterization; near-ultraviolet (NUV); visible light; infrared (IR).

Author Contributions

Investigation and writing—original draft preparation, H.A.A.J.; Methodology, supervision, and writing—review and editing, K.U.; validation, S.K.A.; writing—review and editing, H.A.; visualization and writing—review and editing, T.P.; writing—review and editing, U.H. All authors have read and agreed to the published version of the manuscript.

Funding

This work has been funded by the Nippon Sheet Glass Foundation for Materials Science and Engineering Japan, grant 304/PKIMIA/6501261/N120.

Data Availability Statement

Data can be provided upon request from the corresponding author.

Conflicts of Interest

The authors declare no conflicts of interest.

References

  1. Afridi, S.K.; Umar, K. Comprehensive Exploration of Photocatalytic Degradation: Eradication of Various Dye Classes Using Elemental-Doped and Graphene-Interfaced Semiconductor Nanocomposites in a Sustainable Framework. Catal. Lett. 2025, 155, 167. [Google Scholar] [CrossRef]
  2. Ashtekar, V.S.; Bhandari, V.M.; Shirsath, S.R.; Sai, C.P.L.; Jolhe, P.D.; Ghodke, S.A. Dye wastewater treatment: Removal of reactive dyes using inorganic and organic coagulants. J. Ind. Pollut. Control 2014, 1, 30. [Google Scholar]
  3. Shakoor, M.H.; Shakoor, M.B.; Jilani, A.; Ahmed, T.; Rizwan, M.; Dustgeer, M.R.; Iqbal, J.; Zahid, M.; Yong, J.W.H. Enhancing the Photocatalytic Degradation of Methylene Blue with Graphene Oxide-Encapsulated g-C3N4/ZnO Ternary Composites. ACS Omega 2024, 9, 16187. [Google Scholar] [CrossRef] [PubMed]
  4. Foteinis, S.; Chatzisymeon, E. Heterogeneous Photocatalysis for Water Purification. In Nanostructured Photocatalysts; Boukherroub, R., Ogale, S.B., Robertson, N., Eds.; Micro and Nano Technologies; Elsevier: Amsterdam, The Netherlands, 2020. [Google Scholar]
  5. Al-Zahrani, S.A.; Umar, K.; Tweib, S.A.; Rashd, J.A.M.; Afridi, S.K.; Bhawani, S.A.; Otaibi, A.A.; Masood, N.; Mansour, D.; Khan, A.; et al. Biomass Mediated Synthesis of ZnO and ZnO/GO for the Decolorization of Methylene Blue under Visible Light Source. Catalysts 2023, 13, 409. [Google Scholar] [CrossRef]
  6. Afridi, S.K.; Umar, K. A Novel Bio-Facilitated Synthesis of GO/ZnO/Ag Nanocomposite via Citrulline Lanatus and OPEFB for Enhanced Photocatalytic Degradation of Imidacloprid: Kinetics, Mechanism and Byproduct Analysis. J. Water Process Eng. 2025, 72, 107603. [Google Scholar] [CrossRef]
  7. Baig, A.; Siddique, M.; Panchal, S. A Review of Visible-Light-Active Zinc Oxide Photocatalysts for Environmental Application. Catalysts 2025, 15, 100. [Google Scholar] [CrossRef]
  8. Umar, K.; Afridi, S.K.; Al-Ghurabi, Z.A.S.; Parveen, T.; Adnan, R.; Jameel, M. Biochar in Redox-Mediated Reactions for the Removal of Organic Pollutants from Water Resources. In Biochar: A Sustainable Approach; Bhawani, S.A., Bhat, A.H., Wahi, R., Ngaini, Z., Eds.; Springer Nature: Singapore, 2024. [Google Scholar]
  9. Afridi, S.K.; Umar, K.; Adnan, R.; Parveen, T. Biochar-Based Photocatalysts and Their Application. In Biochar-Based Catalysts: Preparation, Characterization and Applications; Bhawani, S.A., Umar, K., Mohamad Ibrahim, M.N., Alotaibi, K.M., Eds.; Springer Nature: Singapore, 2024. [Google Scholar]
  10. Molla, A.; Hoque, M.M.; Richi, F.T.; Kabir, M.H.; Alam, S.; Ahmed, N.U.; Emon, N.U.; Shao, C.; Zeng, C.; Wang, S. Biosynthesis and Characterization of ZnO Nanoparticles Using Citrus reticulata Peel Followed by Photocatalytic, Antibacterial, and Antioxidative Nanotherapeutic Attributes Assessment Supported by Computer Simulation. Int. J. Nanomed. 2025, 20, 4803. [Google Scholar] [CrossRef]
  11. Mao, T.; Liu, M.; Lin, L.; Cheng, Y.; Fang, C. A Study on Doping and Compound of Zinc Oxide Photocatalysts. Polymers 2022, 14, 4484. [Google Scholar] [CrossRef]
  12. Umar, K.; Aris, A.; Parveen, T.; Jaafar, J.; Majid, Z.A.; Reddy, A.V.; Talib, J. Synthesis, characterization of Mo and Mn doped ZnO and their photocatalytic activity for the decolorization of two different chromophoric dyes. Appl. Catal. A: Gen. 2015, 505, 507. [Google Scholar] [CrossRef]
  13. Afridi, S.K.; Umar, K.; Parveen, T.; Razali, M.R. Nanocomposites in the Degradation of Organic Pollutants. In Nanocomposites-Advanced Materials for Energy and Environmental Aspects; Khan, M.E., Aslam, J., Verma, C., Eds.; Woodhead Publishing Series in Composites Science and Engineering; Woodhead Publishing: Cambridge, UK, 2023. [Google Scholar]
  14. Poorna, A.R.; Saravanathamizhan, R.; Balasubramanian, N. Graphene and graphene like structure from biomass for Electrochemical Energy Storage application: A Review. Electrochem. Sci. Adv. 2021, 1, 2000028. [Google Scholar] [CrossRef]
  15. Yaqoob, A.A.; Noor, N.H.; Umar, K.; Adnan, R.; Ibrahim, M.N.M.; Rashid, M. Graphene oxide–ZnO nanocomposite: An efficient visible light photocatalyst for degradation of rhodamine B. Appl. Nanosci. 2021, 11, 1291. [Google Scholar] [CrossRef]
  16. Chiang, A.K.M.; Ng, L.Y.; Ng, C.Y.; Lim, Y.P.; Mahmoudi, E.; Tan, L.S.; Mah, S.K. Conversion of Palm Oil Empty Fruit Bunches to Highly Stable and Fluorescent Graphene Oxide Quantum Dots: An Eco-Friendly Approach. Mater. Chem. Phys. 2023, 309, 128433. [Google Scholar] [CrossRef]
  17. Atchudan, R.; Edison, T.N.J.I.; Perumal, S.; Karthikeyan, D.; Lee, Y.R. Facile Synthesis of Zinc Oxide Nanoparticles Decorated Graphene Oxide Composite via Simple Solvothermal Route and Their Photocatalytic Activity on Methylene Blue Degradation. J. Photochem. Photobiol. B Biol. 2016, 162, 500. [Google Scholar] [CrossRef]
  18. Posa, V.R.; Annavaram, V.; Koduru, J.R.; Ammireddy, V.R.; Somala, A.R. Graphene-ZnO Nanocomposite for Highly Efficient Photocatalytic Degradation of Methyl Orange Dye under Solar Light Irradiation. Korean J. Chem. Eng. 2016, 33, 456. [Google Scholar] [CrossRef]
  19. Qin, J.; Zhang, X.; Yang, C.; Cao, M.; Ma, M.; Liu, R. ZnO Microspheres-Reduced Graphene Oxide Nanocomposite for Photocatalytic Degradation of Methylene Blue Dye. Appl. Surf. Sci. 2017, 392, 196. [Google Scholar] [CrossRef]
  20. Liu, Y.; Hu, Y.; Zhou, M.; Qian, H.; Hu, X. Microwave-Assisted Non-Aqueous Route to Deposit Well-Dispersed ZnO Nanocrystals on Reduced Graphene Oxide Sheets with Improved Photoactivity for the Decolorization of Dyes under Visible Light. Appl. Catal. B Environ. 2012, 125, 425. [Google Scholar] [CrossRef]
  21. Yaqoob, A.A.; Mohd Noor, N.H.; binti; Serrà, A.; Mohamad Ibrahim, M.N. Advances and Challenges in Developing Efficient Graphene Oxide-Based ZnO Photocatalysts for Dye Photo-Oxidation. Nanomaterials 2020, 10, 932. [Google Scholar] [CrossRef]
  22. Thi, T.U.D.; Thoai Nguyen, T.; Dang Thi, Y.; Thi, K.H.T.; Thang Phan, B.; Ngoc Pham, K. Green Synthesis of ZnO Nanoparticles Using Orange Fruit Peel Extract for Antibacterial Activities. RSC Adv. 2020, 10, 23899. [Google Scholar] [CrossRef]
  23. Kusiak-Nejman, E.; Wojnarowicz, J.; Morawski, A.W.; Narkiewicz, U.; Sobczak, K.; Gierlotka, S.; Lojkowski, W. Size-Dependent Effects of ZnO Nanoparticles on the Photocatalytic Degradation of Phenol in a Water Solution. Appl. Surf. Sci. 2021, 541, 148416. [Google Scholar] [CrossRef]
  24. Khavar, A.H.C.; Moussavi, G.; Mahjoub, A.; Yaghmaeian, K.; Srivastava, V.; Sillanpää, M.; Satari, M. Novel Magnetic Fe3O4@rGO@ZnO Onion-like Microspheres Decorated with Ag Nanoparticles for the Efficient Photocatalytic Oxidation of Metformin: Toxicity Evaluation and Insights into the Mechanisms. Catal. Sci. Technol. 2019, 9, 5819. [Google Scholar] [CrossRef]
  25. Bharadwaj, P.; Kiran, G.R.; Acharyya, S.G. Remarkable Performance of GO/ZnO Nanocomposites under Optimized Parameters for Remediation of Cd (II) from Water. Appl. Surf. Sci. 2023, 626, 157238. [Google Scholar] [CrossRef]
  26. Verma, N.; Chundawat, T.S.; Chandra, H.; Verma, M.; Vaya, D. Role of GO Content in ZnO/@ x Wt% GO NCs for the Reduction of Cr(VI) Pollutant from Wastewater Stream. Int. J. Environ. Sci. Technol. 2025, 22, 1123. [Google Scholar] [CrossRef]
  27. Habibi Jetani, G.; Rahmani, M.B. TiO2/GO Nanocomposites: Synthesis, Characterization, and DSSC Application. Eur. Phys. J. Plus 2020, 135, 720. [Google Scholar] [CrossRef]
  28. Cheshme Khavar, A.H.; Moussavi, G.; Mahjoub, A.R. The Preparation of TiO2@rGO Nanocomposite Efficiently Activated with UVA/LED and H2O2 for High Rate Oxidation of Acetaminophen: Catalyst Characterization and Acetaminophen Degradation and Mineralization. Appl. Surf. Sci. 2018, 440, 963. [Google Scholar] [CrossRef]
  29. Nourbakhsh, A.; Abbaspour, S.; Masood, M.; Mirsattari, S.N.; Vahedi, A.; Mackenzie, K.J.D. Photocatalytic Properties of Mesoporous TiO2 Nanocomposites Modified with Carbon Nanotubes and Copper. Ceram. Int. 2016, 42, 11901. [Google Scholar] [CrossRef]
  30. Lei, X.F.; Xue, X.X.; Yang, H. Preparation and Characterization of Ag-Doped TiO2 Nanomaterials and Their Photocatalytic Reduction of Cr(VI) under Visible Light. Appl. Surf. Sci. 2014, 321, 396. [Google Scholar] [CrossRef]
  31. Raja, K.; Ramesh, P.S.; Geetha, D. Structural, FTIR and Photoluminescence Studies of Fe Doped ZnO Nanopowder by Co-Precipitation Method. Spectrochim. Acta Part A Mol. Biomol. Spectrosc. 2014, 131, 183. [Google Scholar] [CrossRef]
  32. Reddy, A.J.; Kokila, M.K.; Nagabhushana, H.; Chakradhar, R.P.S.; Shivakumara, C.; Rao, J.L.; Nagabhushana, B.M. Structural, Optical and EPR Studies on ZnO:Cu Nanopowders Prepared via Low Temperature Solution Combustion Synthesis. J. Alloys Compd. 2011, 509, 5349. [Google Scholar] [CrossRef]
  33. Achehboune, M.; Khenfouch, M.; Boukhoubza, I.; Leontie, L.; Doroftei, C.; Carlescu, A.; Bulai, G.; Mothudi, B.; Zorkani, I.; Jorio, A. Microstructural, FTIR and Raman Spectroscopic Study of Rare Earth Doped ZnO Nanostructures. Mater. Today Proc. 2022, 53, 319. [Google Scholar] [CrossRef]
  34. Bano, N.; Hussain, I.; EL-Naggar, A.M.; Albassam, A.A. Reduced Graphene Oxide Nanocomposites for Optoelectronics Applications. Appl. Phys. A 2019, 125, 215. [Google Scholar] [CrossRef]
  35. Ching, L.W.; Keesan, F.W.M.; Muhamad, I.I. Optimization of ZnO/GO Nanocomposite-Loaded Polylactic Acid Active Films Using Response Surface Methodology. J. King Saud Univ.-Sci. 2022, 34, 101835. [Google Scholar] [CrossRef]
  36. Chen, J.; Li, Y.; Huang, L.; Li, C.; Shi, G. High-Yield Preparation of Graphene Oxide from Small Graphite Flakes via an Improved Hummers Method with a Simple Purification Process. Carbon 2015, 81, 826. [Google Scholar] [CrossRef]
  37. Mututu, V.; Sunitha, A.K.; Thomas, R.; Pandey, M.; Manoj, B. An Investigation on Structural, Electrical and Optical Properties of GO/ZnO Nanocomposite. Int. J. Electrochem. Sci. 2019, 14, 375. [Google Scholar] [CrossRef]
  38. Makuła, P.; Pacia, M.; Macyk, W. How To Correctly Determine the Band Gap Energy of Modified Semiconductor Photocatalysts Based on UV–Vis Spectra. J. Phys. Chem. Lett. 2018, 9, 6814. [Google Scholar] [CrossRef]
  39. Lv, N.; Li, Y.; Huang, Z.; Li, T.; Ye, S.; Dionysiou, D.D.; Song, X. Synthesis of GO/TiO2/Bi2WO6 Nanocomposites with Enhanced Visible Light Photocatalytic Degradation of Ethylene. Appl. Catal. B Environ. 2019, 246, 303. [Google Scholar] [CrossRef]
  40. Olatunde, O.C.; Onwudiwe, D.C. Graphene-Based Composites as Catalysts for the Degradation of Pharmaceuticals. Int. J. Environ. Res. Public Health 2021, 18, 1529. [Google Scholar] [CrossRef]
  41. Rahimi, K.; Yazdani, A.; Ahmadirad, M. Facile Preparation of Zinc Oxide Nanorods Surrounded by Graphene Quantum Dots Both Synthesized via Separate Pyrolysis Procedures for Photocatalyst Application. Mater. Res. Bull. 2018, 98, 148. [Google Scholar] [CrossRef]
  42. Paul, R.; Gayen, R.N.; Biswas, S.; Bhat, S.V.; Bhunia, R. Enhanced UV Detection by Transparent Graphene Oxide/ZnO Composite Thin Films. RSC Adv. 2016, 6, 61661. [Google Scholar] [CrossRef]
  43. Ahamad, T.; Ahmed, A.S. Influence of graphene oxide on the dielectric properties of biogenically synthesized ZnO nanoparticles. Hybrid Adv. 2023, 3, 100059. [Google Scholar] [CrossRef]
  44. Wojnarowicz, J.; Opalinska, A.; Chudoba, T.; Gierlotka, S.; Mukhovskyi, R.; Pietrzykowska, E.; Sobczak, K.; Lojkowski, W. Effect of Water Content in Ethylene Glycol Solvent on the Size of ZnO Nanoparticles Prepared Using Microwave Solvothermal Synthesis. J. Nanomater. 2016, 2016, 2789871. [Google Scholar] [CrossRef]
  45. Boukhoubza, I.; Khenfouch, M.; Achehboune, M.; Leontie, L.; Galca, A.C.; Enculescu, M.; Carlescu, A.; Guerboub, M.; Mothudi, B.M.; Jorio, A.; et al. Graphene Oxide Concentration Effect on the Optoelectronic Properties of ZnO/GO Nanocomposites. Nanomaterials 2020, 10, 1532. [Google Scholar] [CrossRef] [PubMed]
  46. Yadav, A.; Yadav, M.; Gupta, S.; Popat, Y.; Gangan, A.; Chakraborty, B.; Ramaniah, L.M.; Fernandes, R.; Miotello, A.; Press, M.R.; et al. Effect of Graphene Oxide Loading on TiO2: Morphological, Optical, Interfacial Charge Dynamics-A Combined Experimental and Theoretical Study. Carbon 2019, 143, 51. [Google Scholar] [CrossRef]
  47. Abdolhosseinzadeh, S.; Asgharzadeh, H.; Sadighikia, S.; Khataee, A. UV-Assisted Synthesis of Reduced Graphene Oxide–ZnO Nanorod Composites Immobilized on Zn Foil with Enhanced Photocatalytic Performance. Res. Chem. Intermed. 2016, 42, 4479. [Google Scholar] [CrossRef]
  48. Silambarasan, M.; Shanmugam, S.; Soga, T. Raman and Photoluminescence Studies of Ag and Fe-Doped ZnO Nanoparticles. Int. J. ChemTech Res. 2015, 7, 1644. [Google Scholar]
  49. How, G.T.S.; Pandikumar, A.; Ming, H.N.; Ngee, L.H. Highly Exposed {001} Facets of Titanium Dioxide Modified with Reduced Graphene Oxide for Dopamine Sensing. Sci. Rep. 2014, 4, 5044. [Google Scholar] [CrossRef]
  50. Ghanbari Shohany, B.; Khorsand Zak, A. Doped ZnO Nanostructures with Selected Elements-Structural, Morphology and Optical Properties: A Review. Ceram. Int. 2020, 46, 5507. [Google Scholar] [CrossRef]
  51. Abbasi, Z.; Farrokhnia, A.; Garcia-Lopez, E.I.; Zargar Shoushtari, M.; Aghaie, E. Synthesis of ZnO–Ag2CO3–Fe3O4@rGO Core–Shell Structure: Magnetically Separable Photocatalyst for Degradation of MB Using the Box–Behnken Design. J. Mater. Sci. Mater. Electron. 2020, 31, 19554. [Google Scholar] [CrossRef]
  52. Pham, T.A.T.; Tran, V.A.; Le, V.D.; Nguyen, M.V.; Truong, D.D.; Do, X.T.; Vu, A.-T. Facile Preparation of ZnO Nanoparticles and Ag/ZnO Nanocomposite and Their Photocatalytic Activities under Visible Light. Int. J. Photoenergy 2020, 2020, 8897667. [Google Scholar] [CrossRef]
  53. Chauhan, H.A.; Rafatullah, M.; Ali, K.A.; Umar, M.F.; Khan, M.A.; Jeon, B.-H. Photocatalytic Activity of Graphene Oxide/Zinc Oxide Nanocomposite Derived from Rice Husk for the Degradation of Phenanthrene under Ultraviolet-Visible Light. J. Water Process Eng. 2022, 47, 102714. [Google Scholar] [CrossRef]
  54. Kumar, A.; Pandey, G. Preparation and Photocatalytic Activity of TiO2/PPy/GO for the Degradation of Rose Bengal and Victoria Blue Dye in Visible Light in Aqueous Solution. Desalination Water Treat. 2018, 114, 265. [Google Scholar] [CrossRef]
  55. Zhang, G.; Sun, Y.; Zhang, C.; Yu, Z. Decomposition of Acetaminophen in Water by a Gas Phase Dielectric Barrier Discharge Plasma Combined with TiO2-rGO Nanocomposite: Mechanism and Degradation Pathway. J. Hazard. Mater. 2017, 323, 719. [Google Scholar] [CrossRef] [PubMed]
  56. Fakhri, H.; Mahjoub, A.R.; Aghayan, H. Effective Removal of Methylene Blue and Cerium by a Novel Pair Set of Heteropoly Acids Based Functionalized Graphene Oxide: Adsorption and Photocatalytic Study. Chem. Eng. Res. Des. 2017, 120, 303. [Google Scholar] [CrossRef]
  57. Minella, M.; Sordello, F.; Minero, C. Photocatalytic Process in TiO2/Graphene Hybrid Materials. Evidence of Charge Separation by Electron Transfer from Reduced Graphene Oxide to TiO2. Catal. Today 2017, 281, 29. [Google Scholar] [CrossRef]
  58. Lin, C.J.; Yang, W.-T.; Chou, C.-Y.; Liou, S.Y.H. Hollow Mesoporous TiO2 Microspheres for Enhanced Photocatalytic Degradation of Acetaminophen in Water. Chemosphere 2016, 152, 490. [Google Scholar] [CrossRef]
  59. Akpotu, S.O.; Oseghe, E.O.; Ayanda, O.S.; Skelton, A.A.; Msagati, T.A.M.; Ofomaja, A.E. Photocatalysis and Biodegradation of Pharmaceuticals in Wastewater: Effect of Abiotic and Biotic Factors. Clean Technol. Environ. Policy 2019, 21, 1701. [Google Scholar] [CrossRef]
  60. Umar, K.; Dar, A.A.; Haque, M.M.; Mir, N.A.; Muneer, M. Photocatalysed Decolourization of Two Textile Dye Derivatives, Martius Yellow and Acid Blue 129, in UV-Irradiated Aqueous Suspensions of Titania. Desalination Water Treat. 2012, 46, 205. [Google Scholar] [CrossRef]
  61. Rani, M.; Shanker, U. Insight in to the Degradation of Bisphenol A by Doped ZnO@ZnHCF Nanocubes: High Photocatalytic Performance. J. Colloid Interface Sci. 2018, 530, 16. [Google Scholar] [CrossRef]
  62. Göktaş, S. Synergic effects of pH, reaction temperature, and various light sources on the photodegradation of methylene blue without photocatalyst: A relatively high degradation efficiency. Chem. Afr. 2024, 7, 4425. [Google Scholar] [CrossRef]
  63. Cano, F.J.; Coste, S.; Reyes-Vallejo, O.; Makowska-Janusik, M.; Velumani, S.; Olvera, M.d.l.L.; Kassiba, A. Influence of GO Oxidation Degrees on the Organization and Physical Features of TiO2–GO-Based Nanocomposites for Water Dye Removal. Surf. Interfaces 2024, 46, 104004. [Google Scholar] [CrossRef]
  64. Ramos-Álvarez, D.; Hernández-Rodríguez, Y.M.; Vega-Gómez, J.; Cigarroa-Mayorga, O.E. Influence of Copper Support on the Charge Transfer Enhancement of Zinc Oxide Nanoflakes. Mater. Lett. 2023, 349, 134875. [Google Scholar] [CrossRef]
  65. Kaur, M.; Pal, B.; Kaur, D. Modified Ag-ZnO Coated Graphene Oxide Ternary Composite for Superior Photocatalytic Degradation of Crystal Violet Dye under Visible Light Irradiation. Diam. Relat. Mater. 2024, 143, 110935. [Google Scholar] [CrossRef]
  66. Anjum, F.; Asiri, A.M.; Khan, M.A.; Khan, M.I.; Khan, S.B.; Akhtar, K.; Chakraborty, S. Photo-degradation, thermodynamic and kinetic study of carcinogenic dyes via zinc oxide/graphene oxide nanocomposites. J. Mater. Res. Technol. 2021, 15, 3171. [Google Scholar] [CrossRef]
  67. Oyewo, O.A.; Ramaila, S.; Mavuru, L.; Onwudiwe, D.C. Enhanced photocatalytic degradation of methyl orange using Sn-ZnO/GO nanocomposite. J. Photochem. Photobiol. 2022, 11, 100131. [Google Scholar] [CrossRef]
  68. Chaudhary, K.; Aadil, M.; Zulfiqar, S.; Ullah, S.; Haider, S.; Agboola, P.O.; Shakir, I. Graphene oxide and reduced graphene oxide supported ZnO nanochips for removal of basic dyes from the industrial effluents. Fuller. Nanotub. Carbon Nanostruct. 2021, 29, 915. [Google Scholar] [CrossRef]
  69. Puneetha, J.; Kottam, N.; Rathna, A. Investigation of photocatalytic degradation of crystal violet and its correlation with bandgap in ZnO and ZnO/GO nanohybrid. Inorg. Chem. Commun. 2021, 125, 108460. [Google Scholar]
  70. Al-Rawashdeh, N.A.; Allabadi, O.; Aljarrah, M.T. Photocatalytic activity of graphene oxide/zinc oxide nanocomposites with embedded metal nanoparticles for the degradation of organic dyes. ACS Omega 2020, 5, 28046. [Google Scholar] [CrossRef]
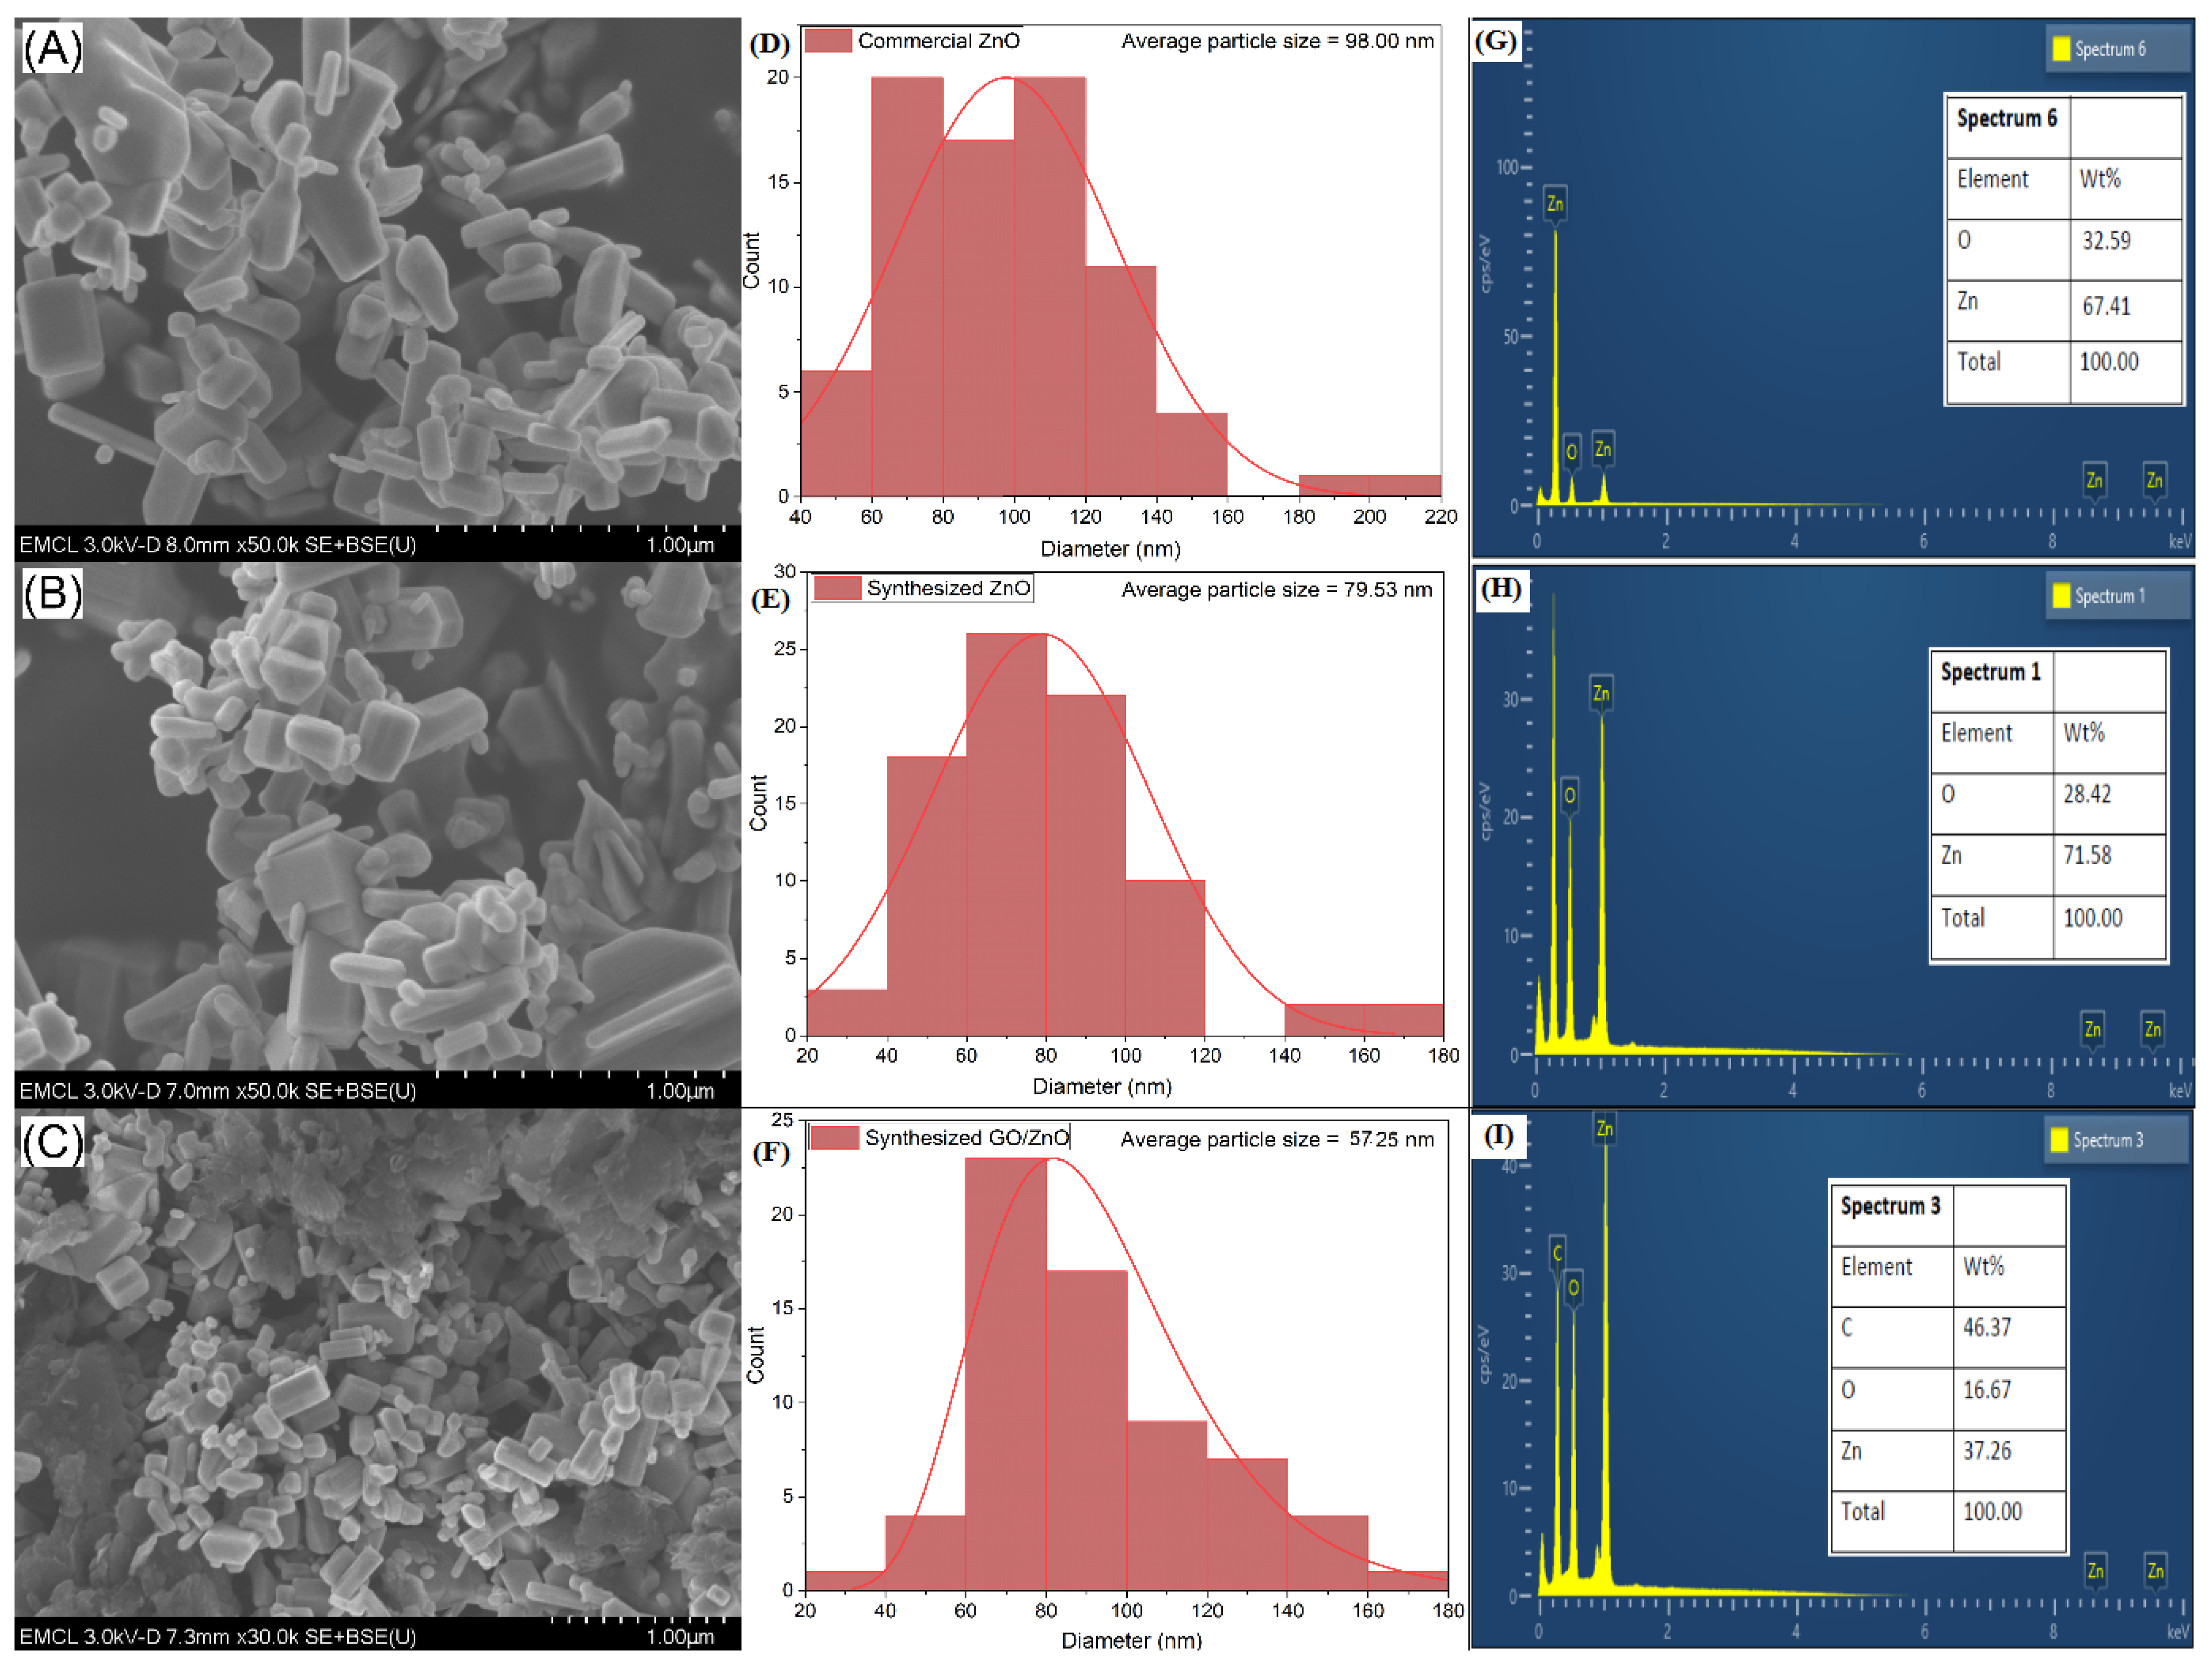
Figure 1. (A) SEM image of commercial ZnO; (B) SEM image of synthesized ZnO; (C) SEM image of ZnO/GO; (D) particle size distribution graph (PSD) of commercial ZnO; (E) PSD of synthesized ZnO; (F) PSD of ZnO/GO; (G) EDX graph of commercial ZnO; (H) EDX graph of synthesized ZnO; (I) EDX graph of ZnO/GO.
Catalysts 15 00874 g001
Figure 2. TEM image of (A) ZnO (commercial), (B) ZnO (synthesized), and (C) ZnO-GO nanocomposite.
Catalysts 15 00874 g002
Figure 3. The FTIR spectra of GO, commercial and synthesized ZnO, and ZnO-GO 1%, 3%, 5%, 7%, and 10%.
Catalysts 15 00874 g003
Figure 4. UV-DRS spectra of zinc oxide, ZnO (commercial, synthesized), and ZnO-GO (with varying concentrations).
Catalysts 15 00874 g004
Figure 5. Tauc plot to determine the optical bandgap of commercial ZnO, synthesized ZnO, and ZnO-GO nanocomposites.
Catalysts 15 00874 g005
Figure 6. XRD pattern of graphene oxide, GO.
Catalysts 15 00874 g006
Figure 7. XRD pattern of ZnO (commercial, synthesized) and ZnO/GO (with varying concentrations of graphene oxide, GO).
Catalysts 15 00874 g007
Figure 8. PL spectra of ZnO (commercial, synthesized) and ZnO-GO (with varying concentrations of graphene oxide, GO).
Catalysts 15 00874 g008
Figure 9. Raman spectrum of GO, ZnO-GO, and ZnO (in inset).
Catalysts 15 00874 g009
Figure 10. Point-of-zero-charge (pHPZC) plot of ZnO-GO (7%).
Catalysts 15 00874 g010
Figure 11. Photocatalytic performance of photocatalysts in the degradation process of methylene blue.
Catalysts 15 00874 g011
Figure 12. Change in absorbance for degradation of methylene blue (MB) in the presence of ZnO/GO (7%).
Catalysts 15 00874 g012
Figure 13. Change in concentration for degradation of methylene blue (MB) in absence and presence of ZnO-GO (7%).
Catalysts 15 00874 g013
Figure 14. Change in adsorption percentage for methylene blue (MB) in the presence of ZnO/GO (7%).
Catalysts 15 00874 g014
Figure 15. The concentration of the dye impacting the degradation of methylene blue.
Catalysts 15 00874 g015
Figure 16. Impact of catalyst concentration on the degradation of methylene blue.
Catalysts 15 00874 g016
Figure 17. Impact of pH on the degradation of methylene blue.
Catalysts 15 00874 g017
Figure 18. Reusability analysis of ZnO/GO (7%) photocatalyst for the degradation of methylene blue.
Catalysts 15 00874 g018
Figure 19. XRD pattern of ZnO/GO (7%) before cycle 1 and after cycle 10.
Catalysts 15 00874 g019
Figure 20. Linear curve fitting for pseudo-first-order reaction kinetics model of methylene blue degradation under optimal degradation parameters.
Catalysts 15 00874 g020
Figure 21. Effect of various scavengers on the degradation of methylene blue in the presence of ZnO/GO (7%) photocatalyst.
Catalysts 15 00874 g021
Table 1. Bandgap energy of ZnO (commercial, synthesized) and ZnO/GO (with varying concentrations of graphene oxide, GO).
No.Photocatalyst MaterialBandgap Energy (eV)
1ZnO (Commercial)3.30
2ZnO (Synthesized)3.27
3ZnO/Graphene Oxide (1%)3.20
4ZnO/Graphene Oxide (3%)3.11
5ZnO/Graphene Oxide (5%)3.04
6ZnO/Graphene Oxide (7%)2.95
7ZnO/Graphene Oxide (10%)3.01
Table 2. Rate constant, regression coefficient, degradation efficacy, and bandgap energy for methylene blue degradation under optimal degradation parameters.
PhotocatalystsRate Constant
(k, min−1)
Regression
Coefficient (R2)
Degradation Efficiency (%)Bandgap Energy (eV)
ZnO (Commercial)0.00920.9809593.30
ZnO (Synthesized)0.01160.9841653.27
ZnO/GO (7%)0.02080.9906872.95
Table 3. ZnO/GO derivatives nanocomposites in their photocatalytic performance for the photodegradation of dyes.
PhotocatalystPollutantPollutant ConcentrationRemoval (%)Light SourceDosageRef
ZnO/GOMethyl red25 ppm98Xenon Lamp10 mg[66]
ZnO/GOMethyl orange50 ppm96Xenon lamp100 mg[67]
ZnO/GORhodamine-B25 ppm77Xenon Lamp50 mg[68]
ZnO/GOCrystal violet5 ppm99Mercury vapour lamp80 mg[69]
ZnO/GOMethylene blue3.13 × 10−5 M84Xenon Lamp50 mg[70]
ZnO/GOMethylene Blue0.03 mM87Halogen linear lamp100 mg[Present study]
Disclaimer/Publisher’s Note: The statements, opinions and data contained in all publications are solely those of the individual author(s) and contributor(s) and not of MDPI and/or the editor(s). MDPI and/or the editor(s) disclaim responsibility for any injury to people or property resulting from any ideas, methods, instructions or products referred to in the content.