Article

Physicochemical Characterization and Formation Pathway of Hydrochar from Brewer’s Spent Grain via Hydrothermal Carbonization

1
Department of Chemical Engineering for Energy Resources, School of Resources and Environmental Engineering, East China University of Science and Technology, Shanghai 200237, China
2
Engineering Research Center of Resource Utilization of Carbon-Containing Waste with Carbon Neutrality, Ministry of Education, East China University of Science and Technology, Shanghai 200237, China
3
School of Environmental Engineering, Henan University of Technology, Zhengzhou 450001, China
4
School of Chemistry and Chemical Engineering, Harbin Institute of Technology, Harbin 150001, China
5
Zhengzhou Research Institute of Harbin Institute of Technology, Zhengzhou 450001, China
*
Authors to whom correspondence should be addressed.
Catalysts 2025, 15(9), 847; https://doi.org/10.3390/catal15090847
Submission received: 7 August 2025 / Revised: 1 September 2025 / Accepted: 1 September 2025 / Published: 3 September 2025

Abstract

In order to investigate the formation pathway of hydrochar during hydrothermal carbonization (HTC) and to identify the optimal process conditions for producing high-quality pyrolysis feedstock, the effect of hydrothermal temperature (220, 250, and 280 °C) on tar and hydrochar properties were analyzed by GC-MS, XRD, XPS, FT-IR, and SEM using protein-rich brewer’s spent grain (BSG) as raw material. The results showed that aromatic compounds play a major role in tar production. Increasing hydrothermal temperature significantly enhanced volatile matter removal and consequently increased the fixed carbon content from 23.14 wt.% in HC-220 to 27.07 wt.% in HC-280, while the catalytic effect of H3O+ produced by high-temperature water facilitated the dehydration and decarboxylation reactions, resulting in a reduction in the H/C atomic ratio from 1.44 in HC-220 to 1.25 in HC-280 and the O/C atom ratio from 0.32 in HC-220 to 0.25 in HC-280. HC-280 exhibited superior fuel properties, with a high heating value (HHV) of 35.4 MJ/kg. XPS analysis indicated that elevated temperatures promote the conversion of sp3 C to sp2 C (the value of sp2 C/sp3 C increased from 1.13 in HC-220 to 1.49 in HC-280), significantly increasing the aromatic condensation degree of hydrochar. The more pronounced reduction in the -OH content compared to -COOH indicated that dehydration reactions predominated over decarboxylation. Finally, the formation pathways of hydrochar during HTC were revealed based on the properties of different products. The results demonstrate that HTC is an effective method for converting BSG into pyrolysis feedstock with potential applications in energy production. Future work should focus on the technical–economic assessment of the process at a pilot scale and evaluating the hydrochar’s performance in real pyrolysis systems.

Graphical Abstract

1. Introduction

The improvement in human living standards has led to a continuous increase in energy demand [1]. However, the extensive use of fossil fuels has exacerbated climate change and environmental pollution, making it imperative to accelerate the development of renewable energy to reduce reliance on traditional energy sources [2,3]. Biomass energy has received much attention due to abundant reserves and renewable characteristics [4,5]. Among various biomass feedstocks, agricultural and industrial residues are particularly attractive for the conversion of waste into energy due to their low cost and wide availability. BSG is a typical example of such residues. As a major beer producer, China generates a substantial amount of BSG annually. BSG is rich in protein and crude fiber, making it a high-quality biomass resource [6]. Currently, BSG is commonly disposed of in landfills or used as feed, with problems of inefficient utilization and potential secondary pollution [7]. Pyrolysis technology is commonly used for the utilization of biomass resources [8,9,10]. However, the high water content of BSG makes storage difficult. The need to dry it prior to pyrolysis consumes additional energy, and the pyrolysis products are usually of low quality. BSG can be converted into high-quality pyrolysis feedstock (high higher heating value (HHV), high fixed carbon content, low O/C and H/C atomic ratios, and high hydrophobicity) by pre-treatment with HTC technology.
During the HTC process, water acts as a reactant, solvent, and catalyst in the process, enabling the conversion of raw materials into high-quality hydrochar through dehydration, decarboxylation, demethylation, and aromatization at 180–300 °C [11,12,13,14]. The HTC process significantly reduces the H/C and O/C atomic ratios of the raw material, improves the physical and chemical properties of the material, solves the storage problem of the high-moisture biomass, and provides high-quality feedstock for further resource utilization [15]. As an effective pretreatment method for high-moisture raw materials, HTC technology has received extensive attention in recent years. Abifarin et al. [16] studied the effect of different hydrothermal conditions on the energy storage performance of activated carbon, first via the hydrothermal carbonization of lignin and then via the activation of hydrochar at 800 °C, and they found that a hydrothermal temperature of 220 °C, time of 18 h, concentration of 80 g/L, and pH value of 4 represent the optimal hydrothermal conditions to enhance PHC’s energy storage performance. Arauzo et al. [17] indicated that after the removal of protein in BSG, the hydrochar exhibited a lower yield, a higher C/N ratio, and a higher ash content, making it more suitable for energy production compared to hydrochar produced without protein removal. Peng et al. [18] studied the impact of the hydrothermal temperature on hydrochar properties using urban sludge. They found that increasing the temperature from 180 °C to 300 °C decreased the hydrochar yield by 13.18% and promoted dehydration and decarboxylation, reducing the volatile matter content. However, existing research has mainly focused on the influence of the hydrothermal conditions on the yield and properties of hydrochar, as well as the application of hydrochar. There are few studies that have explored the hydrochar formation pathways during the HTC process. In addition, N-containing compounds also play an important role in the HTC process, yet studies on their transformation pathways in the HTC process are still relatively limited. An in-depth understanding of the transformation mechanism of N-containing compounds will help to better utilize BSG to develop high-performance functional materials.
In order to clarify the conversion law of functional groups and the formation pathways of hydrochar during HTC, as well as to identify the optimal process conditions for producing high-quality pyrolysis feedstock, this study employed protein-rich brewer’s spent grain (BSG) as the raw material. The physicochemical properties of the tar and hydrochar obtained from BSG in the HTC process at different temperatures (220, 250, and 280 °C) were analyzed. Based on these analyses, the organic matter transformation pathways and structural evolution of hydrochar were explored, thereby investigating the formation pathways of hydrochar. This study contributes to providing data support and theoretical references for the targeted regulation of BSG hydrochar’s structure.

2. Results and Discussion

2.1. The Composition Analysis of Tar

The content of different compounds in the tar was positively correlated with the corresponding peak areas in the GC-MS spectra [19]. The components and relative content of the compounds are shown in Table S1, which were obtained by analyzing the GC-MS spectra of Tar-220, Tar-250, and Tar-280. The compounds were systematically classified as ammonia compounds, N-containing heterocyclic compounds, aromatic compounds, ketone compounds, and acid compounds. As shown in Figure 1, the main components of the tar were aromatic compounds, primarily derived from lignin via bond breaking and condensation and from cellulose and hemicellulose through hydrolysis, dehydration, deoxygenation, and cyclization [19]. The aromatic compound content increased from 23.08% in Tar-220 to 31.34% in Tar-280 because the high temperature promoted the self-ionization of water to produce more H3O+, which catalyzed the hydrolysis of proteins, hemicellulose, cellulose, and lignin in the BSG, breaking glycosidic and ester bonds, etc., to produce small-molecule compounds, which, in turn, produced more aromatic compounds by condensation [20]. Acid compounds mainly originate from the hydrolysis and decomposition of cellulose and hemicellulose, protein hydrolysis, deamination, and decarboxylation reactions, with a small portion also coming from lignin depolymerization intermediates through oxidation or hydrolysis [21]. As the hydrothermal temperature increased from 220 °C to 250 °C, the acid compound content increased from 7.49% to 21.59%, which was attributed to the hydrolysis of macromolecules, which was limited at 220 °C, whereas the increased temperature promoted hydrolysis, decomposition, deamination, and decarboxylation reactions, thus facilitating the production of acid compounds. However, the acid content then declined to 20.89% in Tar-280 because radical cleavage reactions became predominant at elevated temperatures, converting acids into ketones and aldehydes through dehydration and condensation, which also accounts for the increased ketone content. Additionally, some acid compounds underwent intermolecular dehydration, polymerization, and carbonization to form hydrochar, further reducing the acid compound content [22]. The ammonia compound content decreased from 5.05% in Tar-220 to 4.53% in Tar-280, while the N-containing heterocyclic compound content increased from 6.27% to 11.86%, which was attributed to the fact that proteins generated ammonia compounds through decarboxylation at low temperatures, whereas higher temperatures favored their conversion into more stable N-containing heterocyclic compounds via Maillard reactions with sugars [23]. The N-containing heterocyclic compound content showed a minimal increase between Tar-250 (11.11%) and Tar-280 because N-containing heterocyclic compounds underwent polymerization and condensation reactions catalyzed by H3O+ to form complex aromatic structures (e.g., graphitized carbon layers), with nitrogen becoming fixed in the hydrochar [24]. Tar is an important by-product of the HTC process, which is a typical complex mixture containing nitrogen and oxygen heteroatoms. The higher temperature increased the content of N-containing heterocyclic compounds, aromatic compounds, and ketone compounds, and they are important chemical raw materials that can be separated and purified for the production of high-value chemicals (such as rubber, pesticides, organic glass, etc.) to realize the high-value utilization of tar. Ammonia compounds may corrode equipment and combine with acidic gases to form ammonium salts, which can clog the system. Ammonia compounds may also adhere to the surface of hydrochar by condensation or adsorption, increasing its hydrophilicity and affecting its performance as a pyrolysis feedstock. Therefore, the generation of ammonia compounds should be minimized as much as possible.

2.2. Proximate and Ultimate Analysis of BSG and Hydrochars

The proximate and ultimate analysis of the BSG and hydrochars are shown in Table 1. The hydrochar yield decreased from 77.51 wt.% to 65.33 wt.% as the temperature increased from 220 °C to 280 °C due to the different hydrolysis temperatures of hemicellulose (180 °C), cellulose (230 °C), and lignin (260 °C) [25]. As the temperature increased, water self-ionized to produce more H3O+. H3O+ then catalyzed the decomposition of macromolecules as well as the dehydration and decarboxylation of small-molecule compounds such as glucose, producing substantial gaseous and liquid-phase products, leaving a solid residue with a higher fixed carbon content [26]. The slight decrease in the absolute ash content was primarily due to the dissolution of water-soluble inorganic salts in the liquid phase. However, the relative proportion of ash in the hydrochar increased compared to the BSG due to the significant loss of volatile organic compounds during HTC. Hydrochar with a high fixed carbon content showed a higher biochar yield during pyrolysis. Ash is an important catalyst in the pyrolysis process, which promoted the release of volatiles, reduced the biochar yield, and affected the composition of the pyrolysis oil, and a low ash content in hydrochar is conducive to the reduction in uncontrollable catalytic effects and the improvement of biochar yield. The ultimate analysis results demonstrate that increasing the temperature led to a higher C content and a lower O content in the hydrochars, accompanied by decreased H/C and O/C atomic ratios, indicating that higher temperatures promote dehydration and decarboxylation reactions and enhance the aromatization degree of hydrochars. The decrease in the N content can be attributed to enhanced decomposition of proteins and the release of N-containing volatiles (e.g., NH3, HCN) at high temperatures [27]. In addition, an increase in temperature led to an increase in the HHV of the hydrochars from 32.74 MJ/kg of HC-220 to 35.36 MJ/kg of HC-280. The low O/C and H/C atomic ratio of HC-280 facilitated the production of a high calorific value and stable tars during pyrolysis, and the high calorific value of HC-280 means that less external energy is required for pyrolysis.

2.3. Microcrystalline Structure Analysis of BSG and Hydrochar

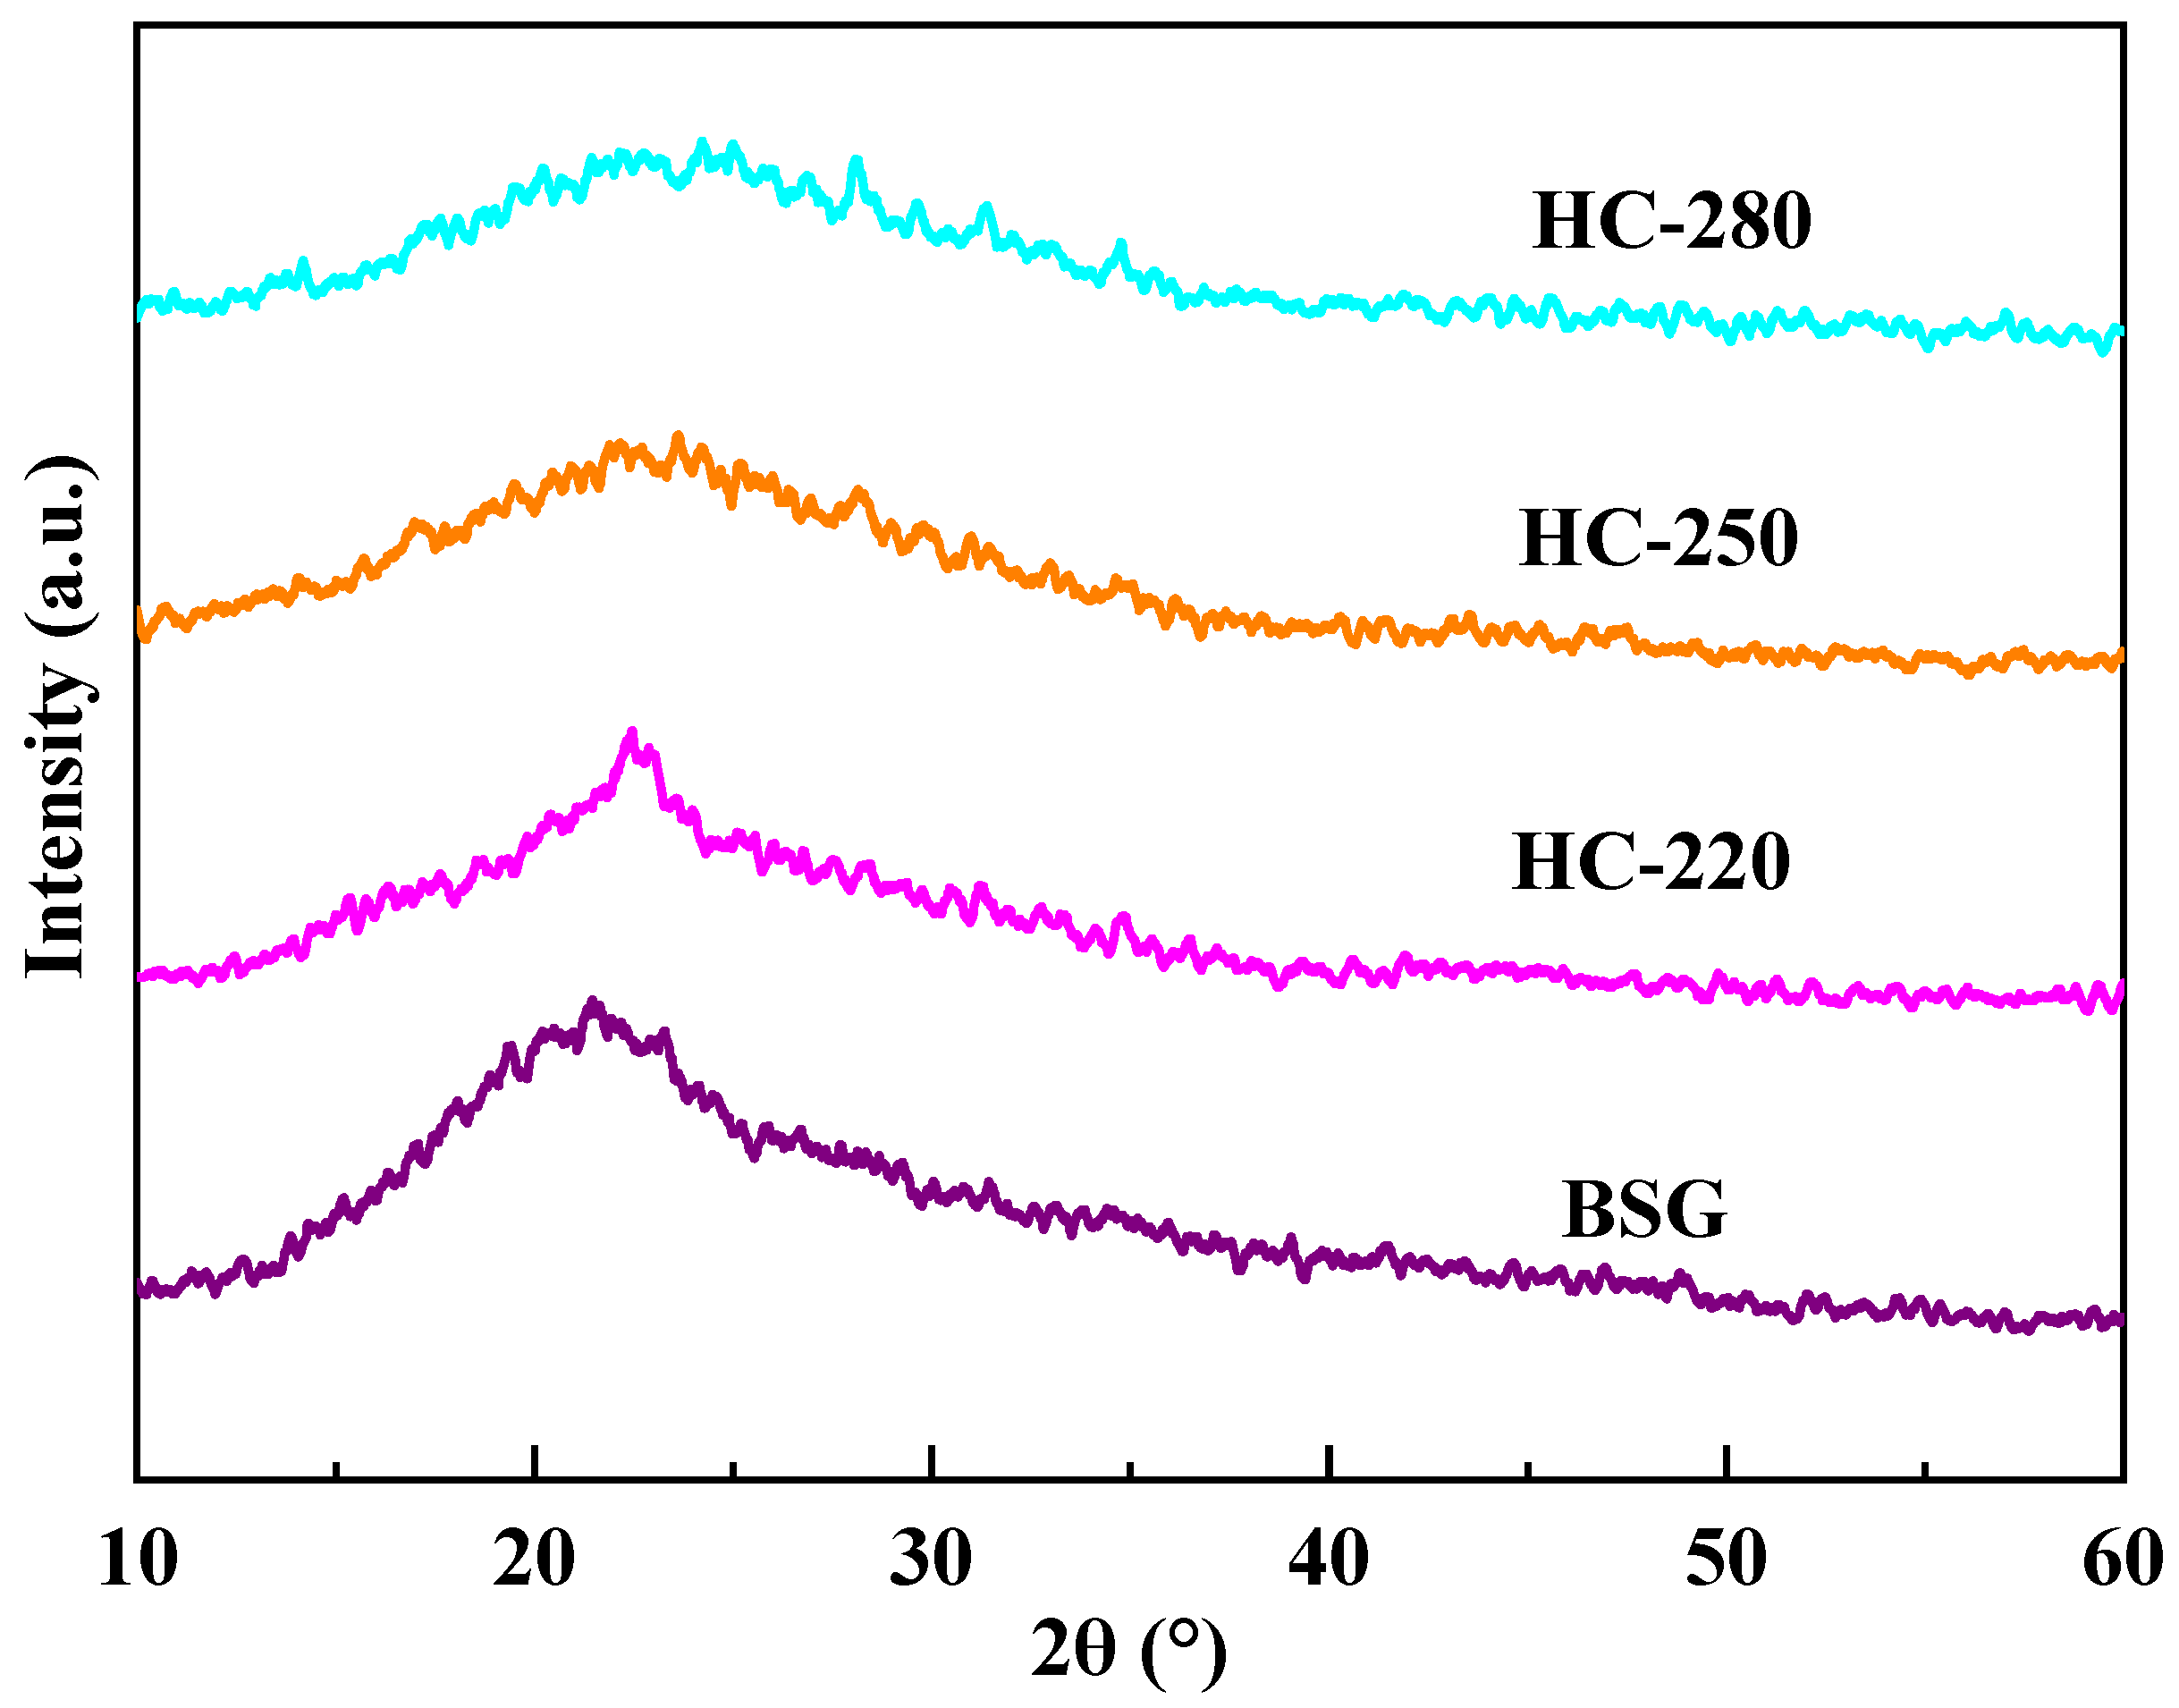
X-ray diffraction (XRD) was used to analyze the effect of temperature on the microcrystalline structure of hydrochar. The XRD patterns of BSG, HC-220, HC-250, and HC-280 are shown in Figure 2. The diffraction peak near 2θ = 23°, which corresponds to the {002} crystal plane, is related to the order of the sample, where a sharper peak indicates a more ordered crystal structure [28]. As can be seen in Figure 2, BSG and HC-220 exhibit a distinct peak characteristic of the crystallinity of cellulose near 2θ = 23° [29], demonstrating that the cellulose structure remained largely intact at 220 °C. Increased temperature produced more H3O+, and H3O+ catalyzed hydrolysis, dehydration, and polycondensation of cellulose, improving the ordering of the hydrochar. However, the diffraction peaks of HC-250 and HC-280 near 2θ = 23° show a rightward shift and broadening, indicating reduced structural order in the hydrochar. This is due to the condensation of the crosslinked network of lignin into highly crosslinked amorphous carbon wrapped around cellulose-derived intermediates, which inhibits aromatic ring stacking, and the crosslinked structure remains resistant to complete rupture even at 280 °C. Therefore, there is no significant improvement in the ordering of HC-250 and HC-280. In addition, as the temperature increases, the decomposition of cellulose leads to a fuller conversion of the feedstock and an increased degree of carbonization, making HC-280 more favorable for use as a pyrolysis feedstock than HC-220.

2.4. Surface Chemical Properties Analysis of BSG and Hydrochar

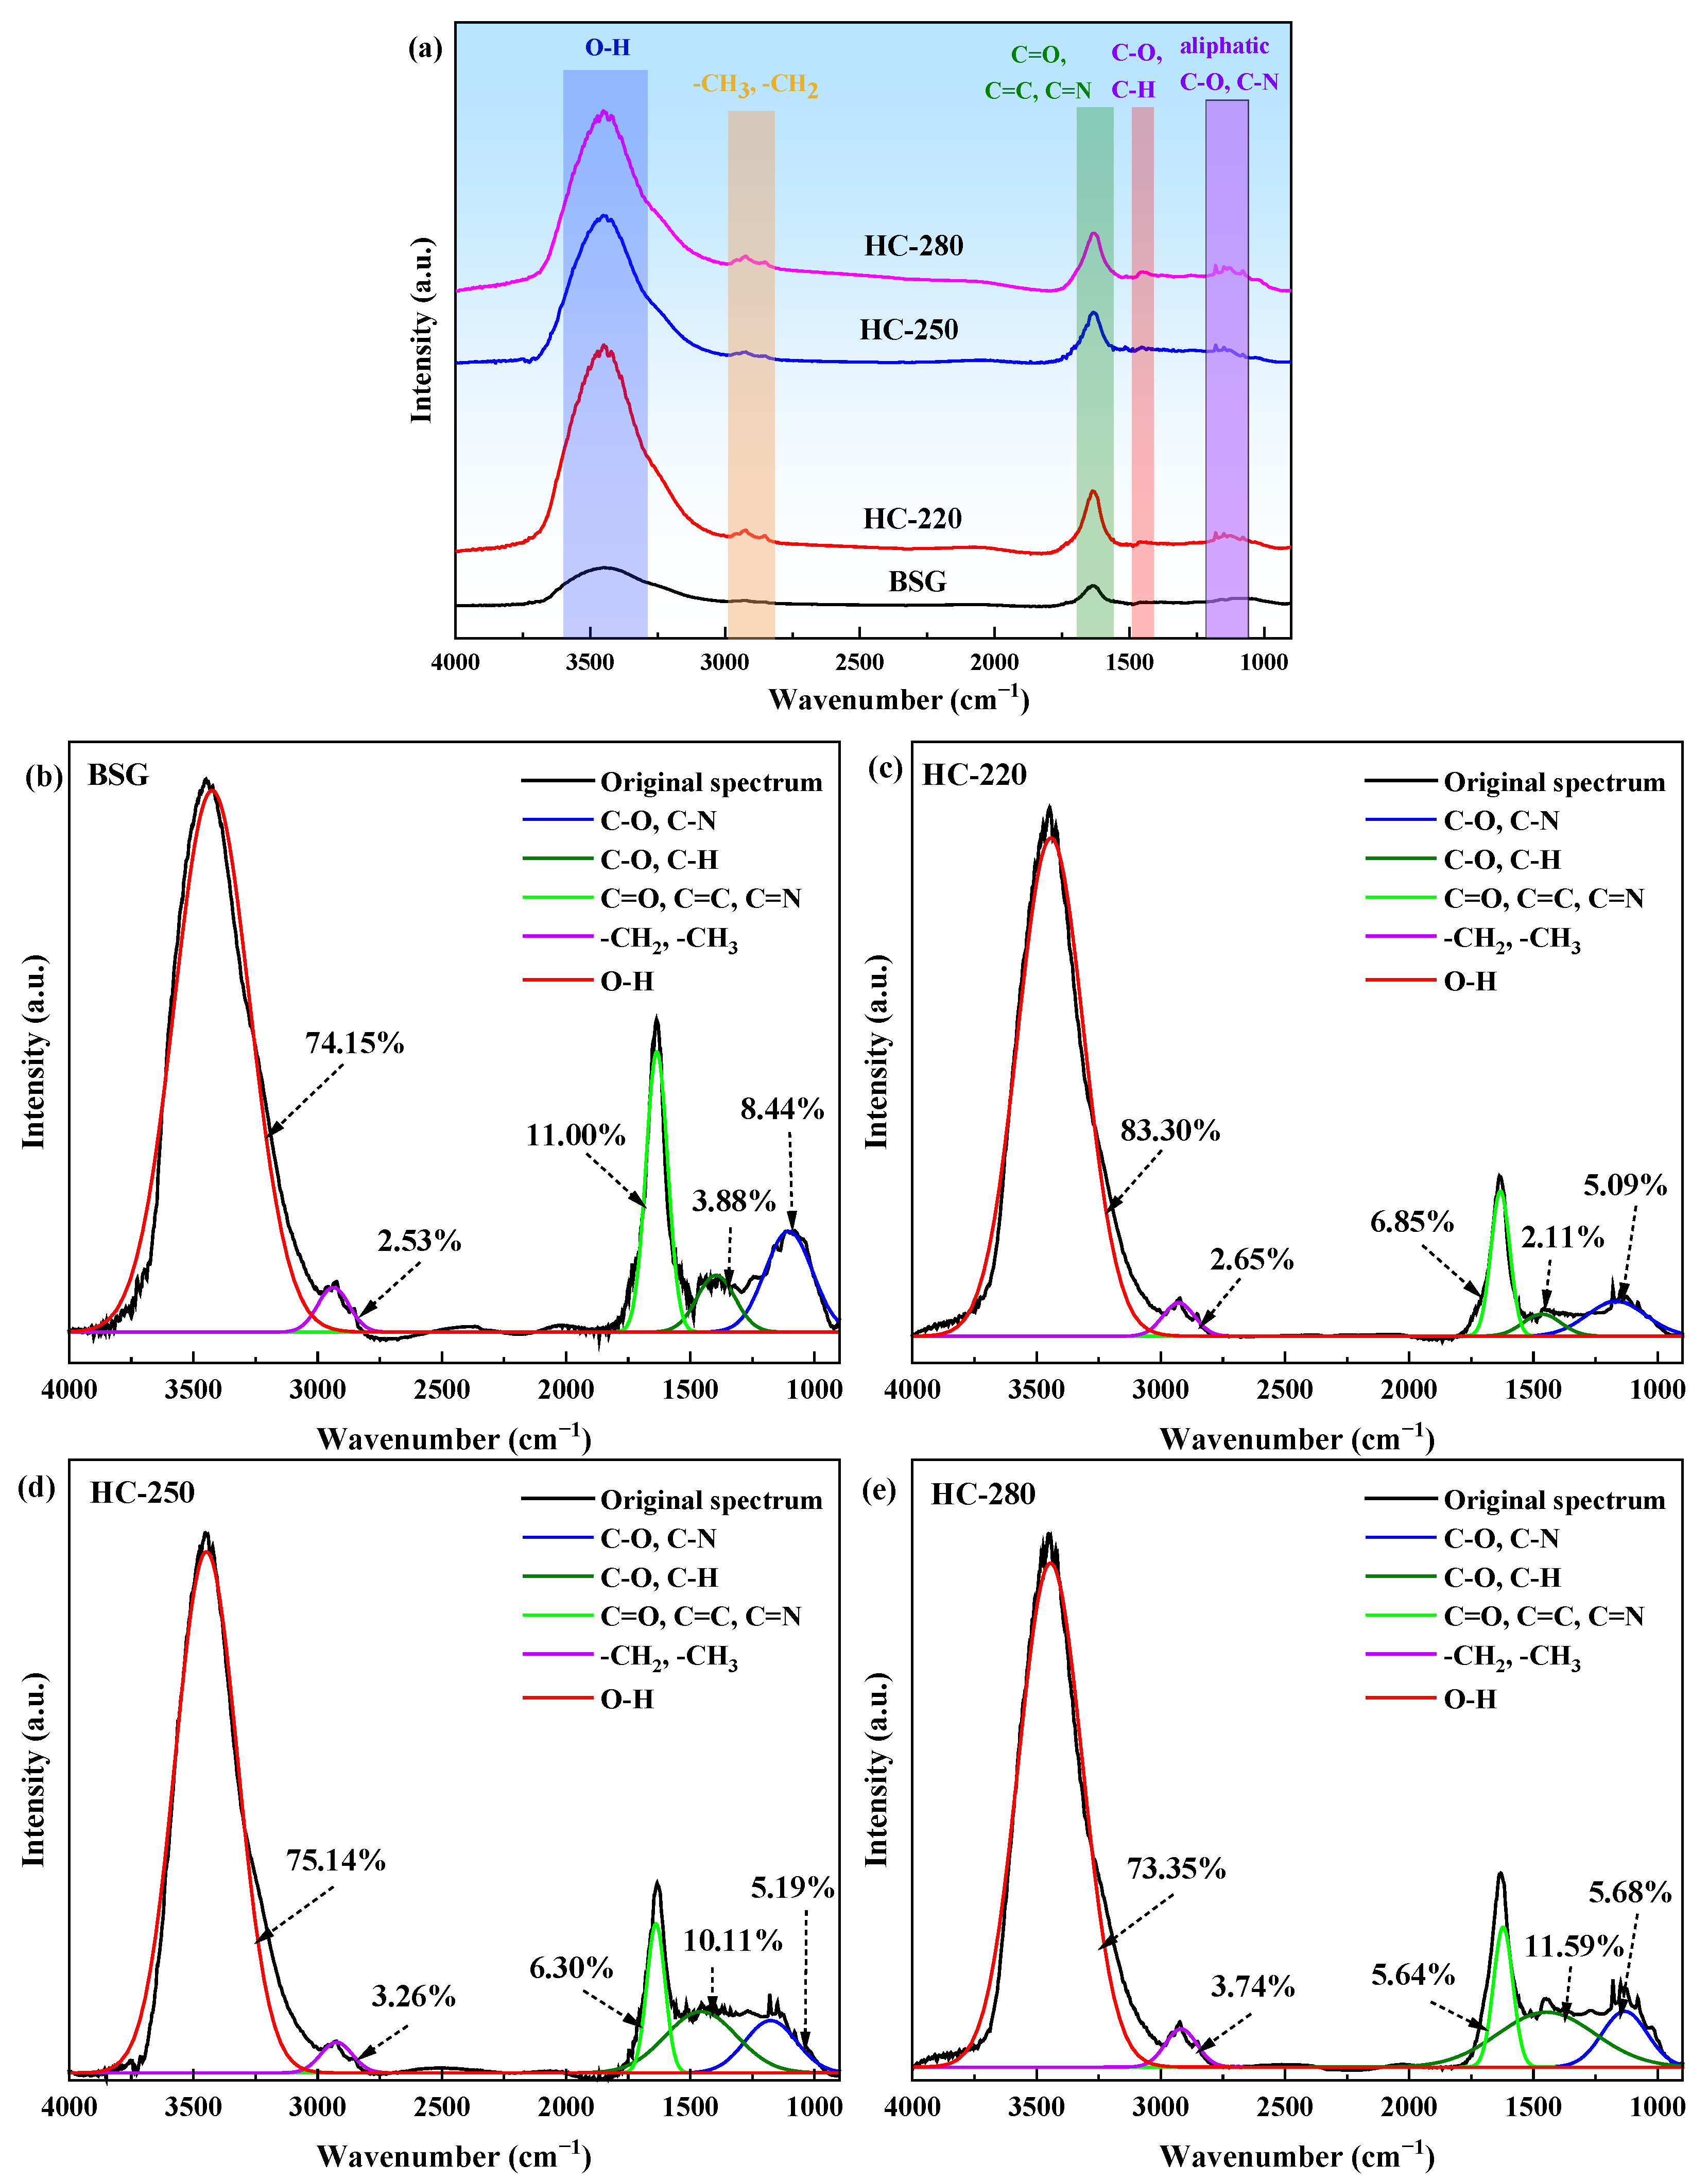
The FT-IR spectra of BSG, HC-220, HC-250, and HC-280 were fitted by peak splitting, and the relative contents of different functional groups were analyzed preliminarily by characteristic peak areas, and the results are shown in Figure 3. The broad absorption peak at 3400 cm−1 is assigned to -OH stretching vibration [10,30]. After HTC, the relative content of O-H increased from 74.15% in BSG to 83.30% in HC-220 due to the disruption of crystalline structures in cellulose and lignin that previously restricted -OH groups through hydrogen bonding, thereby releasing free hydroxyl groups [31]. This enhancement was further amplified by the formation of hydroxyl-rich intermediates through macromolecular hydrolysis, dehydration, and condensation; however, relative content of O-H in HC-250 and HC-280 reduced to 75.14% and 73.35%, respectively, as high-temperature dehydroxylation and decarboxylation became dominant. The reduced O-H content indicated that sufficient dehydration occurred, and HC-280 is more suitable as a pyrolysis feedstock because of its enhanced aromaticity and hydrophobicity. The absorption peak at approximately 2900 cm−1 is associated with the stretching vibrations of -CH3 and -CH2 groups [32]. After HTC, the area of the absorption peak increased from 2.65% in HC-220 to 3.74% in HC-280 due to the elevated temperatures promoting crude fiber cleavage, generating abundant alkyl fragments [33]. The strong absorption peak observed in the 1600−1750 cm−1 region is attributed to the stretching vibrations of C=O, C=N, and aromatic C=C groups [34,35]. After HTC, the absorption peak area decreased from 11.00% in BSG to 5.64% in HC-280, which was the result of the evolution of BSG from a functional-group-rich amorphous polymer to a highly condensed and aromatized coal-like structure by HTC. The absorption peak near 1450 cm−1 corresponds to the bending vibration of C-H and the stretching vibration of C-O. After HTC, the absorption peak area decreased from 3.88% in BSG to 2.11% in HC-220. This was attributed to the decrease in C-O content due to the hydrolysis, dehydration, and decarboxylation reactions catalyzed by H3O+. The relative areas of the absorption peaks in HC-250 and HC-280 were increased to 10.11% and 11.59%, respectively, which was attributed to the high temperatures that promoted a large amount of O-containing functional groups to be consumed and the increase in the relative content of thermally stable C-H. The peak in the 900−1200 cm−1 region is attributed to the stretching vibrations of C-O and C-N groups [36]. The absorption peak area of the hydrochar is lower than that of BSG, which is consistent with Yang’s findings on bamboo HTC [37].

2.5. XPS Analysis of BSG and Hydrochars

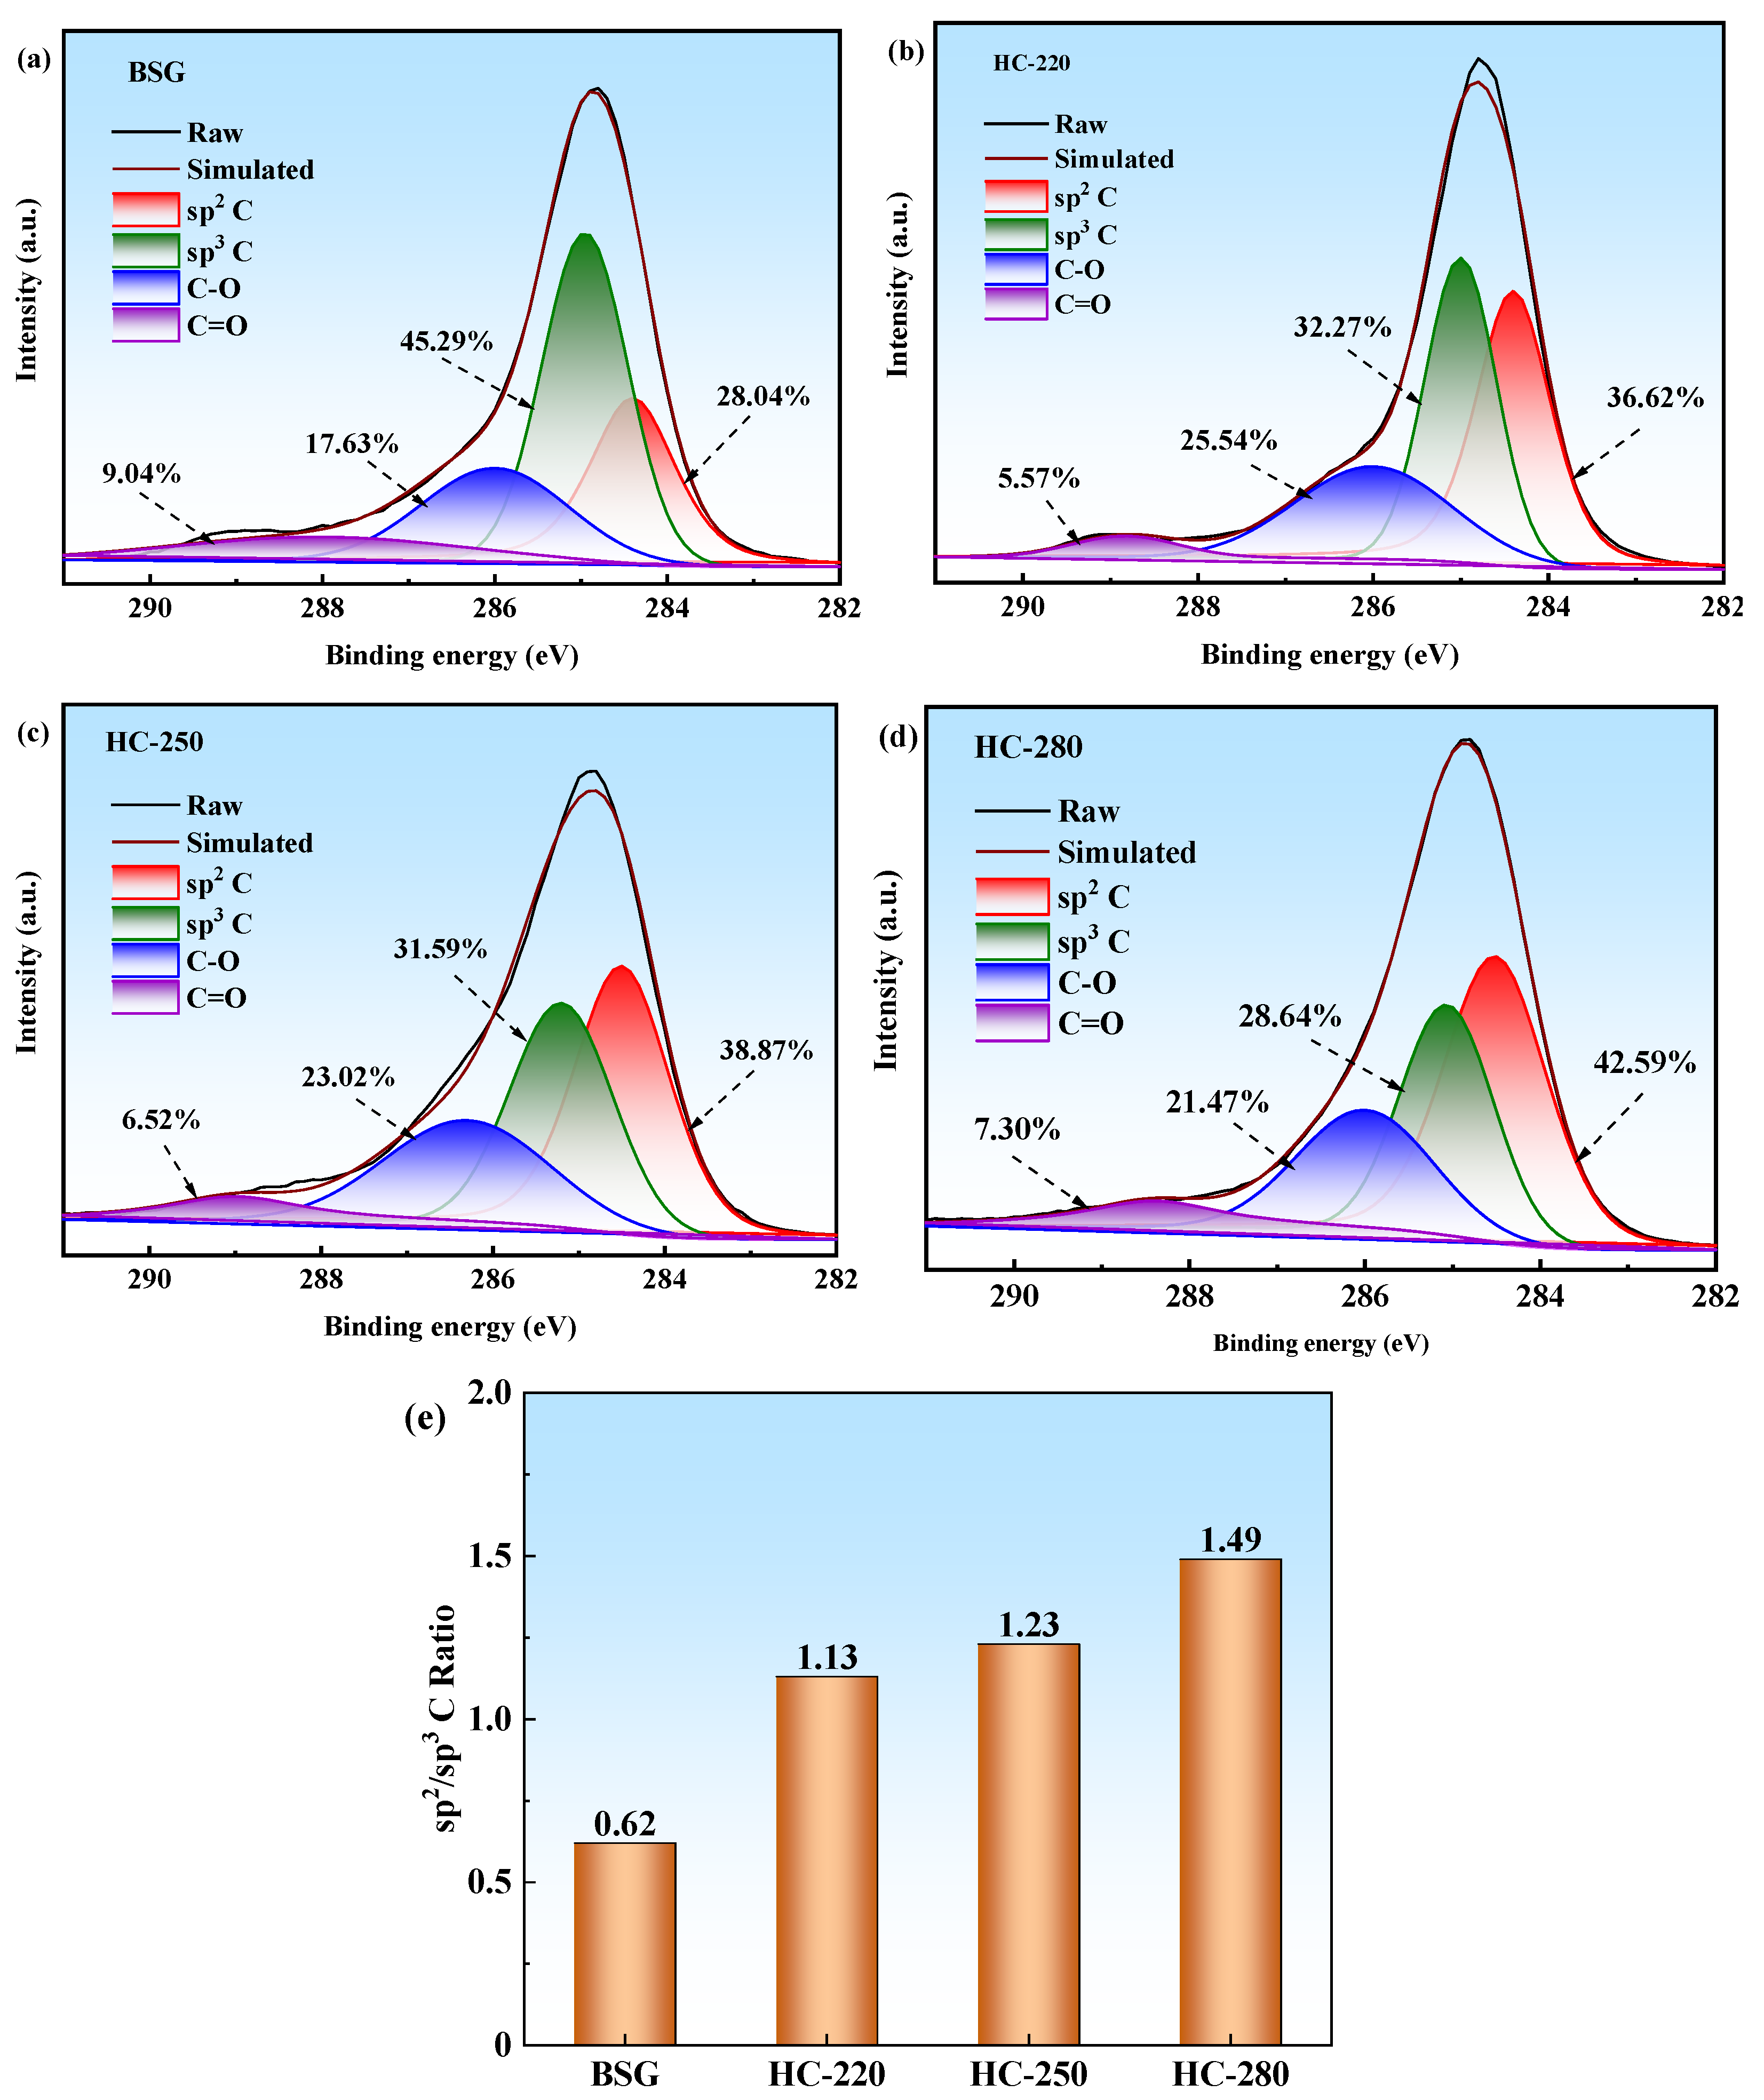
Figure 4 shows the XPS C1s spectra of BSG, HC-220, HC-250, and HC-280. All spectra were deconvoluted into four characteristic peaks corresponding to sp2 C (graphitic carbon, 284.4 ± 0.2 eV), sp3 C (284.8 ± 0.3 eV), C-O (286.2 ± 0.4 eV), and C=O (289.5 ± 0.5 eV) [38]. BSG exhibits a high proportion of sp3 C, primarily originating from the glycan rings of cellulose and hemicellulose and the aliphatic side chains of lignin, while sp2 C mainly originates from the benzene rings of lignin. During HTC, thermally unstable carboxyl groups undergo decarboxylation, while cellulose glycosidic bonds and lignin aliphatic chains break down into small organic molecules, reducing the sp3 C and C=O group content in HC-220. The increased sp2 C content results from the polymerization of intermediate products, forming polycyclic aromatic structures, and from the condensation of lignin-derived benzene rings into larger conjugated systems. The thermally stable C-O groups primarily undergo condensation reactions at 220 °C, thereby increasing their relative content. Elevated temperatures not only facilitate the conversion of sp3 to sp2 C (thus raising the sp2 C/sp3 C ratio) but also intensify dehydroxylation and ether bond cleavage, ultimately leading to a reduction in both the sp3 and C-O content. The sp2 C/sp3 C ratio was used to characterize the degree of aromatic condensation of the samples, with larger values indicating a higher aromatic condensation degree [7]. As shown in Figure 4e, the sp2 C/sp3 C ratio increased from 1.13 in HC-220 to 1.49 in HC-280, confirming that elevated temperatures effectively increase the degree of aromatic condensation. The hydrochar with a high sp2 C/sp3 C ratio exhibited strong aromaticity and high chemical stability, making it more suitable for use as an energy storage material. In the research by Abifarin et al., lignin was first converted into hydrochar via HTC at 220 °C and then activated to produce activated carbon, which exhibited excellent energy storage properties [16].
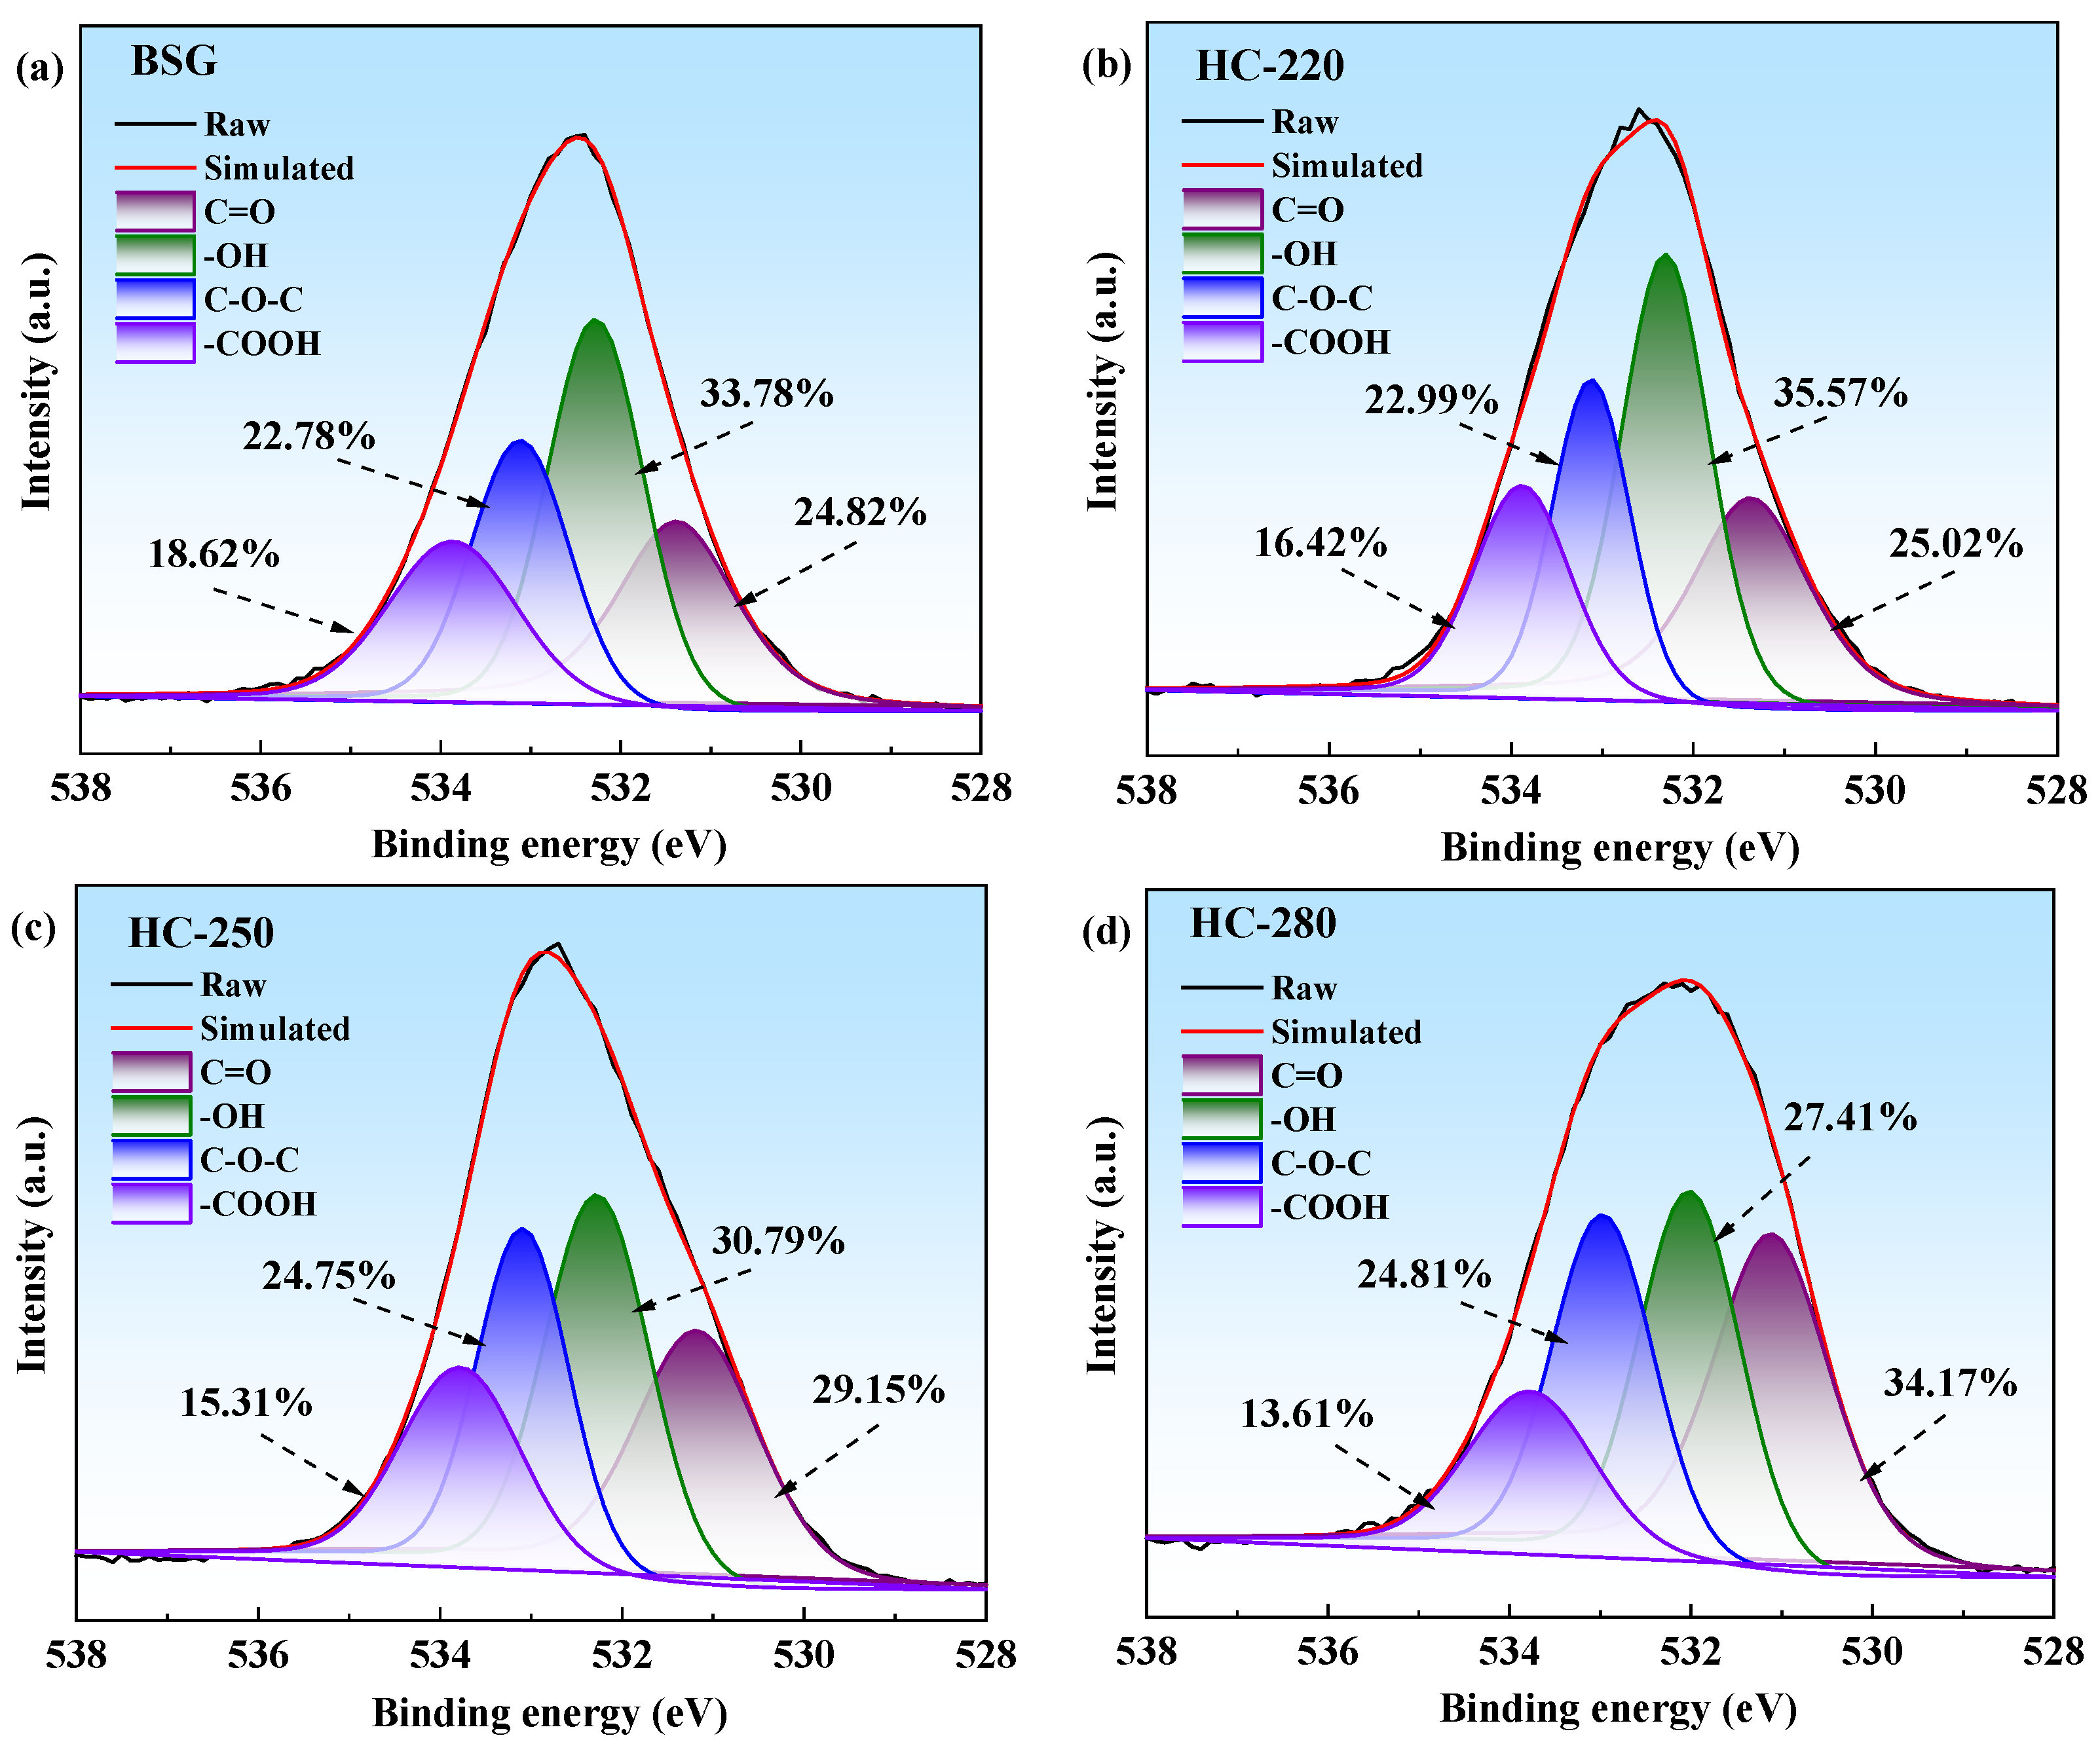
As shown in Figure 5, the XPS O1s spectra were fitted to carbonyl oxygen in COOR (C=O, 531.1 ± 0.2 eV), hydroxyl oxygen (-OH, 531.9 ± 0.3 eV), ether oxygen on anhydrides and lactones (C-O-C, 532.9 ± 0.3 eV), and oxygen in carboxyl groups (-COOH, 534 ± 0.3 eV) [39]. HC-220 exhibited a significant reduction in the -COOH content compared to BSG, demonstrating that HTC promotes decarboxylation reactions. Meanwhile, HC-220 exhibited a higher -OH content than BSG due to HTC disrupting the intramolecular hydrogen bond network of cellulose and releasing previously bound -OH groups, thereby increasing free hydroxyl groups [31]. When the temperature increased to 280 °C, the -OH and -COOH contents of HC-280 decreased to 27.41% and 13.61%, respectively. This is because the higher temperature intensified the dehydration and decarboxylation reactions, converting -OH and -COOH groups into more thermally stable C-O-C and C=O bonds through intramolecular or intermolecular reactions. The more substantial decrease in the -OH content relative to -COOH indicates that dehydration reactions prevail over decarboxylation during the HTC process. HC-280 with a low -OH/-COOH content is hydrophobic and easy to store and dry, and with a low O content, it can be pyrolyzed to produce high-quality tar and stable biochar, which are excellent raw materials for pyrolysis. The -OH and -COOH groups are the main surface complexation and ion exchange sites. Hydrochar with high -OH and -COOH contents is well-suited for adsorbing polar/ionic pollutants (e.g., heavy metals, dyes, phosphates).
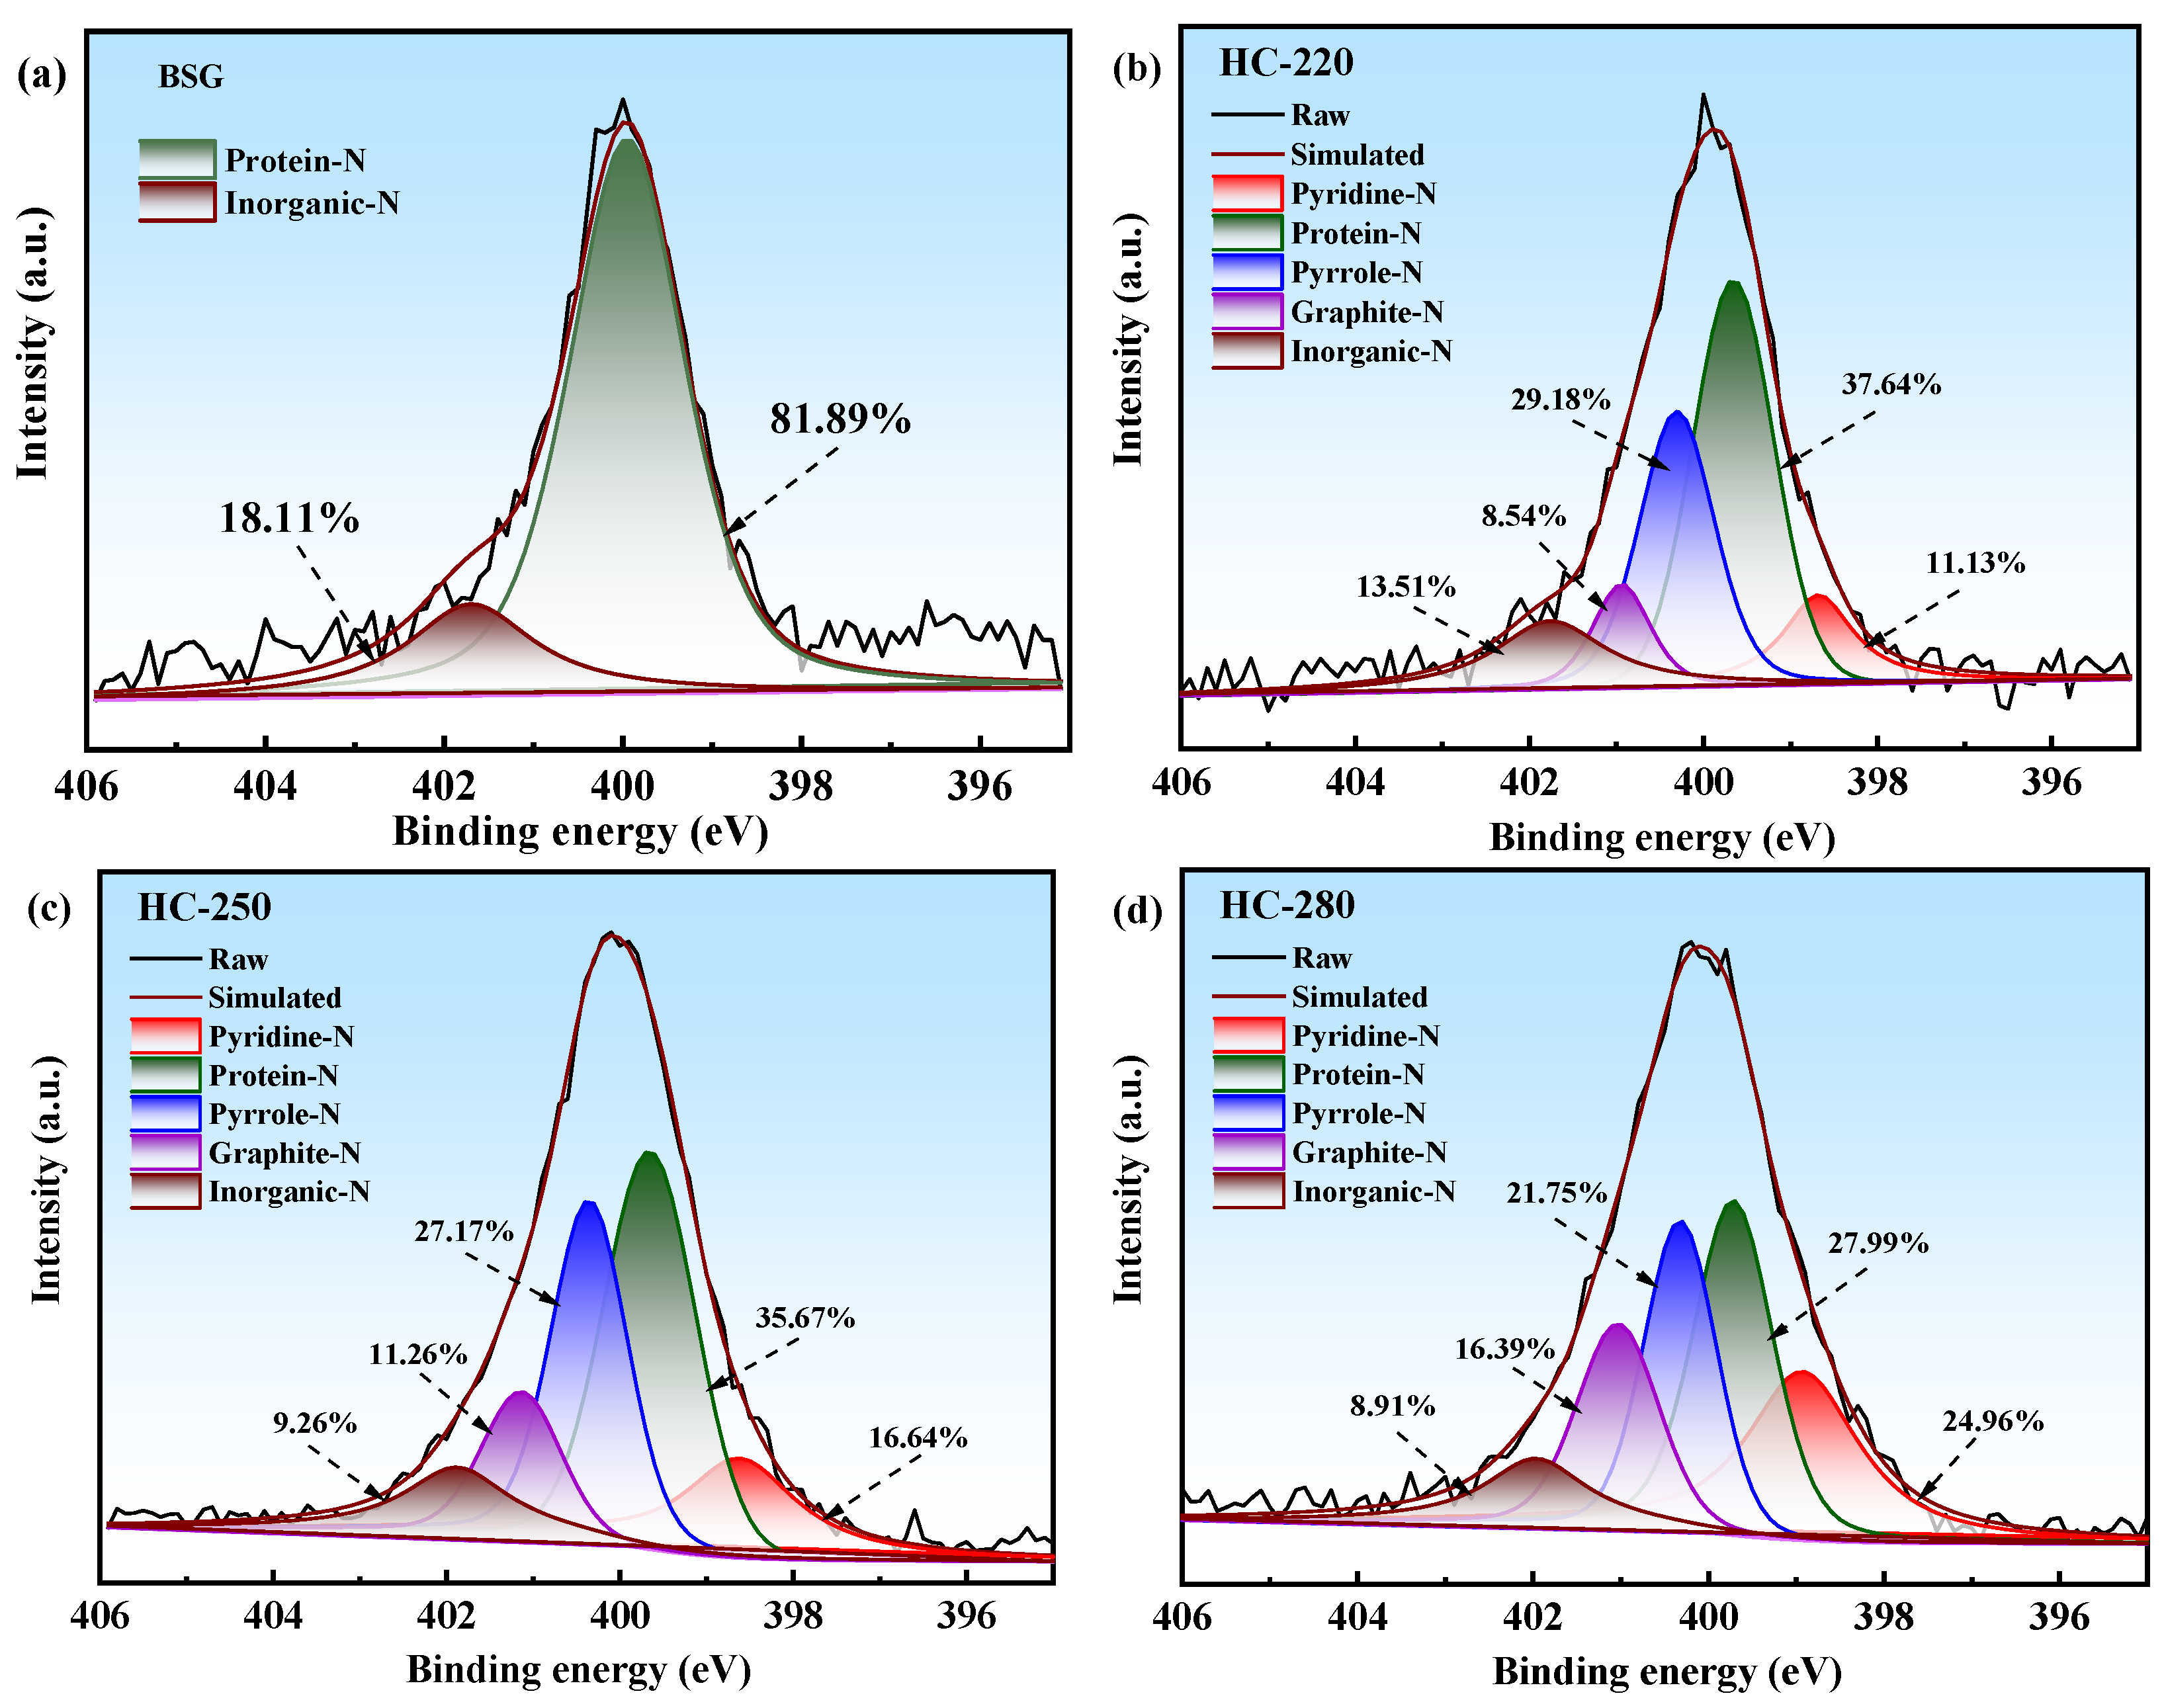
The XPS N1s spectra of different samples were fitted to pyridine-N (398.8 ± 0.3 eV), protein-N (399.9 ± 0.3 eV), pyrrole-N (400.5 ± 0.3 eV), graphite-N (401.3 ± 0.3 eV), and inorganic-N (401.9 ± 0.3 eV) [24]. As shown in Figure 6, the dominant N-containing groups in BSG were protein-N and inorganic-N, with relative contents of 81.89% and 18.11%, respectively. After HTC, three new N-containing functional groups (pyridine-N, pyrrole-N, and graphite-N) were formed in HC-220, while protein-N and inorganic-N contents decreased to 37.64% and 13.51%, respectively. This was due to thermal decomposition of unstable protein-N and inorganic-N generating N-containing tar, along with amino acids undergoing dehydration, deamination, and dehydrogenation reactions forming pyridine-N and pyrrole-N, with graphite-N primarily produced through condensation of pyridine-N and pyrrole-N [40]. Increasing the hydrothermal temperature to 280 °C further reduced the protein-N and inorganic-N contents to 27.99% and 8.91% through enhanced protein dehydration and condensation reactions. The elevated temperature also promoted pyrrole ring opening, rearrangement, and reclosure into pyridine-N, decreasing the pyrrole-N content while simultaneously facilitating pyrrole and pyridine condensation to increase the graphite-N content and stabilize nitrogen within the hydrochar. Notably, the pyridine-N and pyrrole-N contents remained higher than graphite-N in the hydrochar because only partial stabilization takes place under HTC, while the complete formation of graphite-N requires pyrolysis at higher temperatures [40].

2.6. SEM Analysis of BSG and Hydrochar

Scanning electron microscopy (SEM) analysis revealed distinct morphological changes in BSG, HC-220, HC-250, and HC-280, as shown in Figure 7. BSG displayed a rough surface with scattered needle-like structures, while HC-220 exhibited a smoother surface with few microspheres. HC-250 showed more numerous and larger microspheres, resulting from macromolecular decomposition into intermediates that subsequently polymerized into elongated carbon microspheres. Kluse et al. [41] also found that hydrochar derived from carbohydrates forms regular spherical structures, whereas hydrochar from N-containing substances (e.g., proteins) and carbohydrates (e.g., cellulose, hemicellulose, and lignin) develops a “peanut-like” morphology [41]. HC-280 demonstrated reduced microsphere numbers but increased surface size due to temperature-enhanced polymerization of intermediates into larger carbon microspheres [42]. Overall, HTC is less destructive to the feedstock, and the hydrochar has a lot of microspheres on the surface and a looser structure than carbon obtained through high temperatures and without oxygen [10].

2.7. The Formation Pathways of Hydrochar

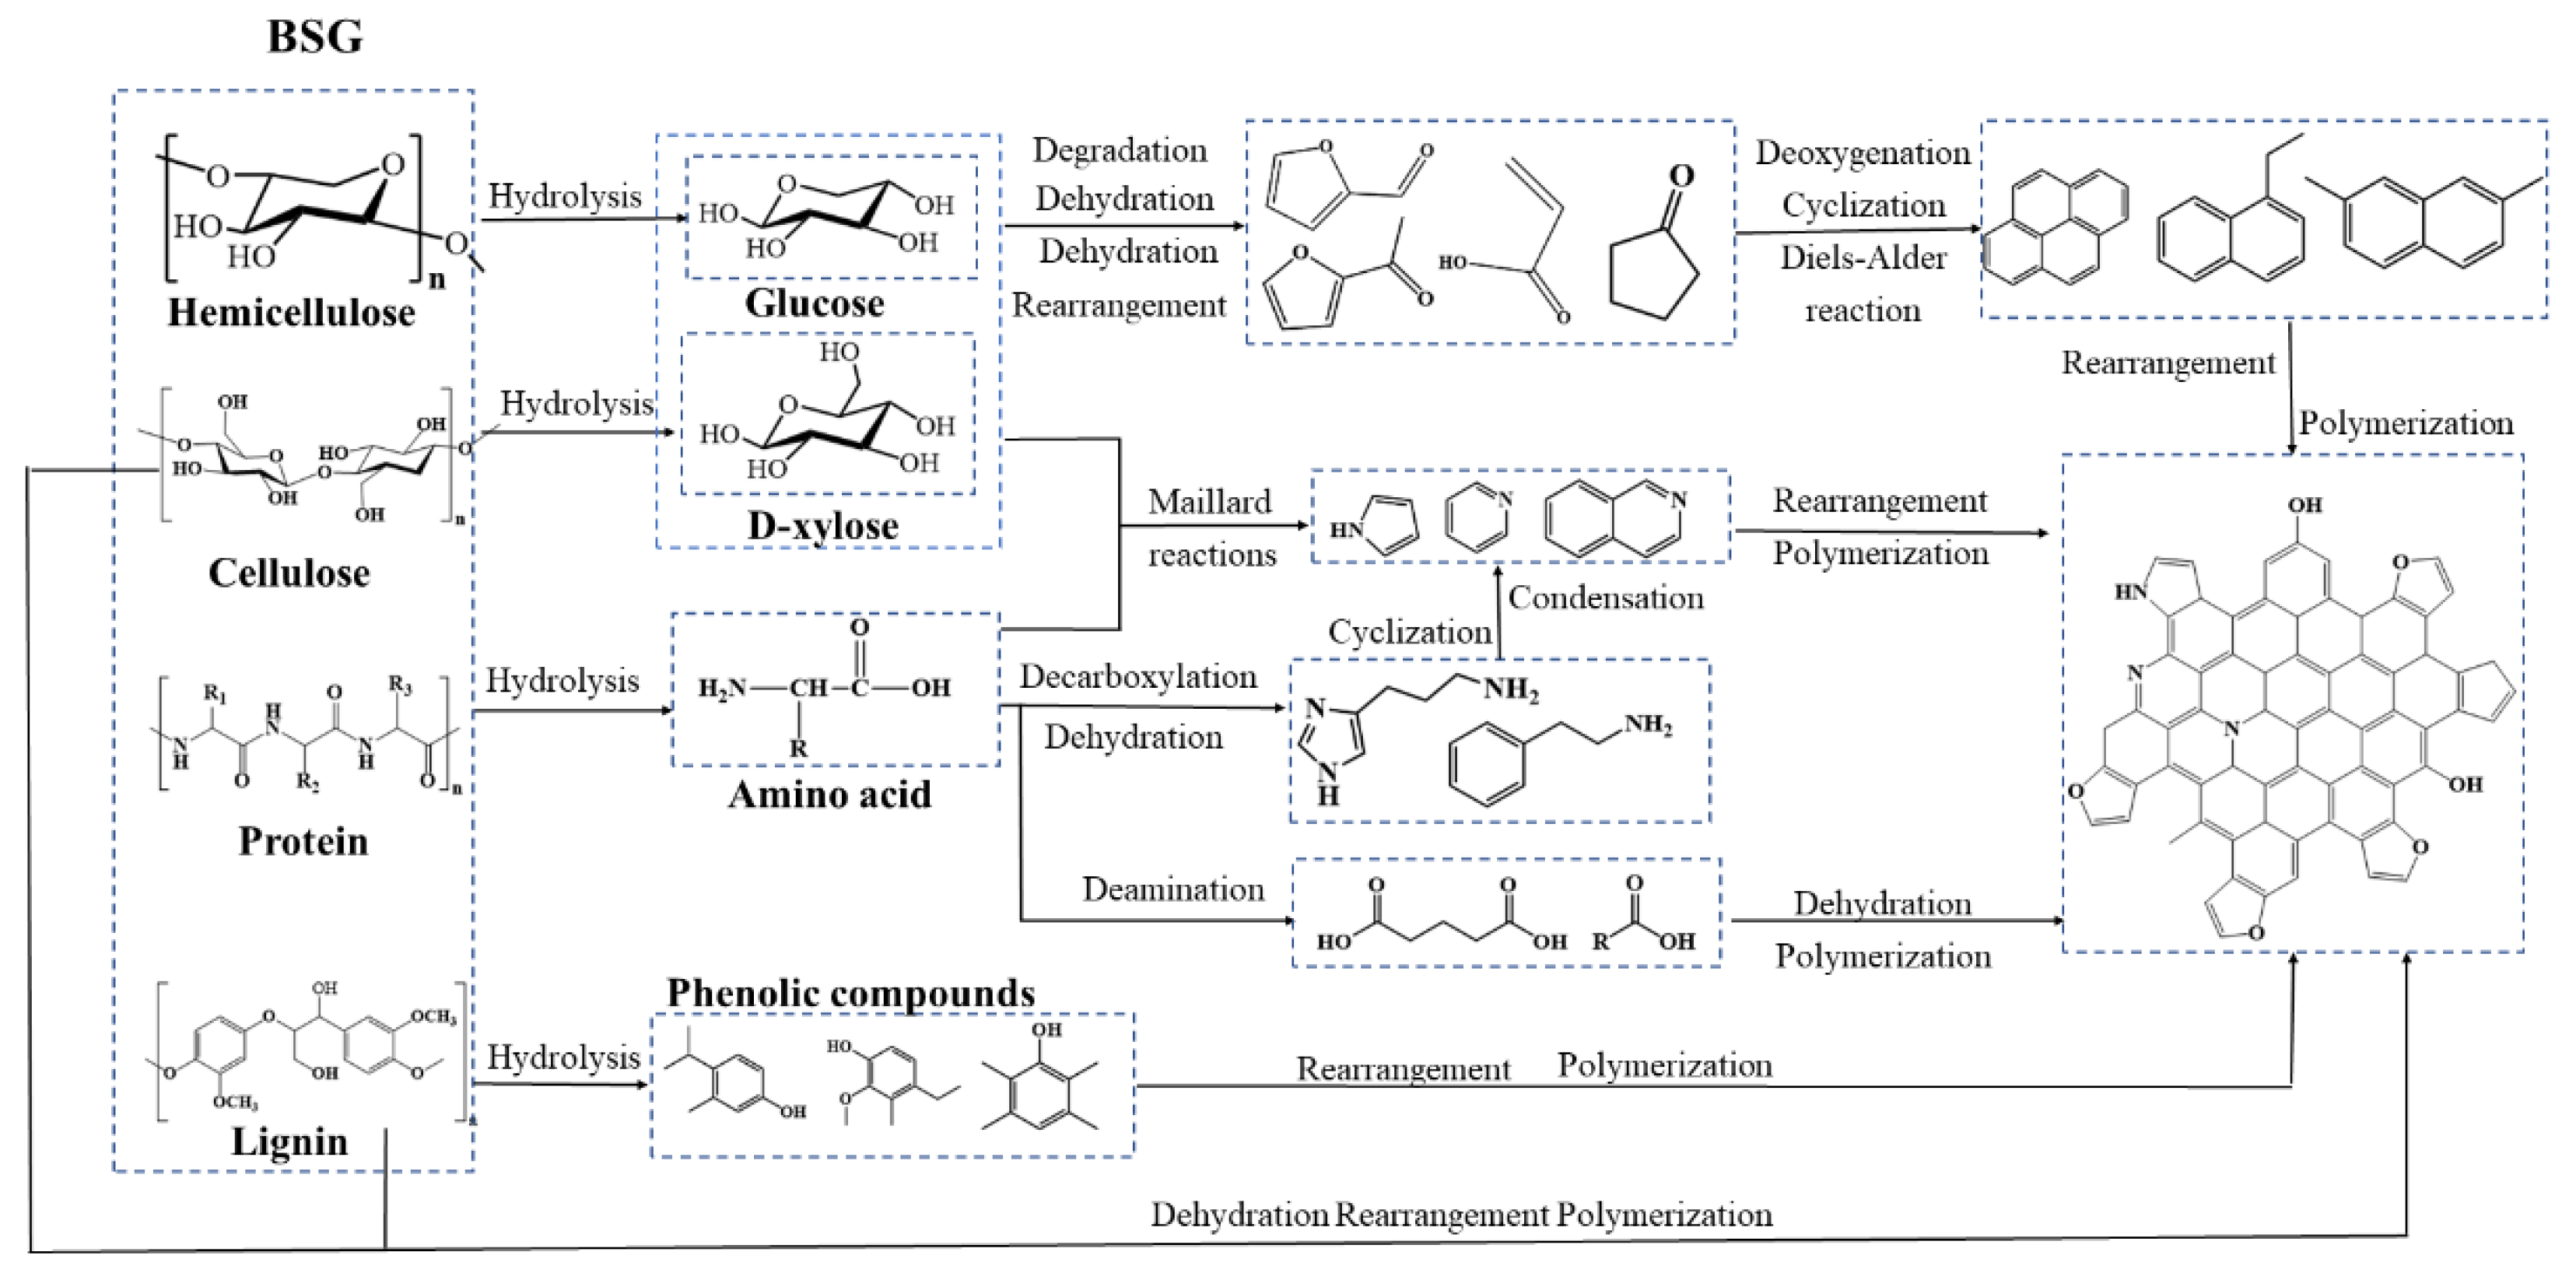
Based on the above analysis of the composition and distribution of tar and the physicochemical properties of hydrochar derived from BSG via HTC, and in conjunction with current research on hydrochar formation mechanisms [11,18], the possible formation pathways of hydrochar during HTC of BSG are described in Figure 8. The transformation process is characterized by a complex interplay of parallel and competing reactions, primarily involving hydrolysis, decomposition, repolymerization, and aromatization.
BSG primarily consists of proteins, hemicellulose, cellulose, and lignin and undergoes significant structural changes during HTC. The self-ionization of water at elevated temperatures generates H3O+, which catalyzes the hydrolysis of macromolecules. Consequently, hydrochar formation proceeds through the following main routes: (1) The hydrolysis-dominated pathway: Proteins are hydrolyzed into amino acids. A portion of these acids undergo deamination to form organic acids, while others decarboxylate into ammonia compounds that further cyclize and condense into N-containing heterocyclic compounds. Simultaneously, the Maillard reaction between amino acids and reducing sugars (from carbohydrate decomposition) generates N-containing heterocyclic compounds such as pyrrole and pyridine, which constitute a primary nitrogen source in the tar [43]. As the temperature increases, these N-containing heterocyclic compounds can be incorporated into hydrochar through molecular rearrangement and condensation, forming stable nitrogen functionalities like pyridine-N and graphite-N, which is corroborated by lower ammonia compounds in Tar-280 than in Tar-220 and Tar-250 and higher contents of pyridine-N and graphite-N in HC-280 than in HC-220 and HC-250. Hemicellulose and amorphous cellulose are readily hydrolyzed into oligosaccharides and monosaccharides (e.g., glucose). These sugars subsequently dehydrate, undergo ring-opening, or experience C-C bond cleavage, yielding key intermediates including ketones, furans, aldehydes, and organic acids. As the temperature increases, the sharp decrease in the O/C ratio and the increase in the sp2 C/sp3 C ratio of hydrochar indicate that these intermediates undergo intense deoxygenation, cyclization (e.g., Diels–Alder reactions), and polycondensation to form the aromatic core of the hydrochar. Lignin’s high thermal stability limits its hydrolysis to only small quantities of phenolic compounds that contribute to hydrochar formation through condensation and rearrangement. (2) The solid-state conversion pathway: The thermally stable constituents of BSG, notably lignin and a portion of crystalline cellulose, are highly resistant to hydrolysis. Instead, they are primarily converted through solid-phase reactions involving dehydration, molecular rearrangement, and polycondensation reactions. This direct solid-state aromatization pathway, which shares similarities with the pyrolytic char formation process at high temperatures [44,45], contributes substantially to the yield of highly aromatic hydrochar. It is noteworthy that these pathways are not mutually exclusive but rather exist in a dynamic equilibrium, particularly between depolymerization and repolymerization. The properties of the final hydrochar are determined by the relative dominance of these competing reaction routes.

3. Materials and Methods

3.1. Materials

In this study, the experimental materials used were brewer’s spent grains from Tsingtao Brewery Shanghai Songjiang Manufacturing Co., Ltd., located in Shanghai, China. Prior to use, brewer’s spent grains were dried in a vacuum-drying oven for 24 h at 105 °C, followed by milling to pass through a 40-mesh sieve (the aperture of the sieve was 425 μm). The dried samples were designated as BSG.

3.2. Hydrothermal Carbonization Experiments

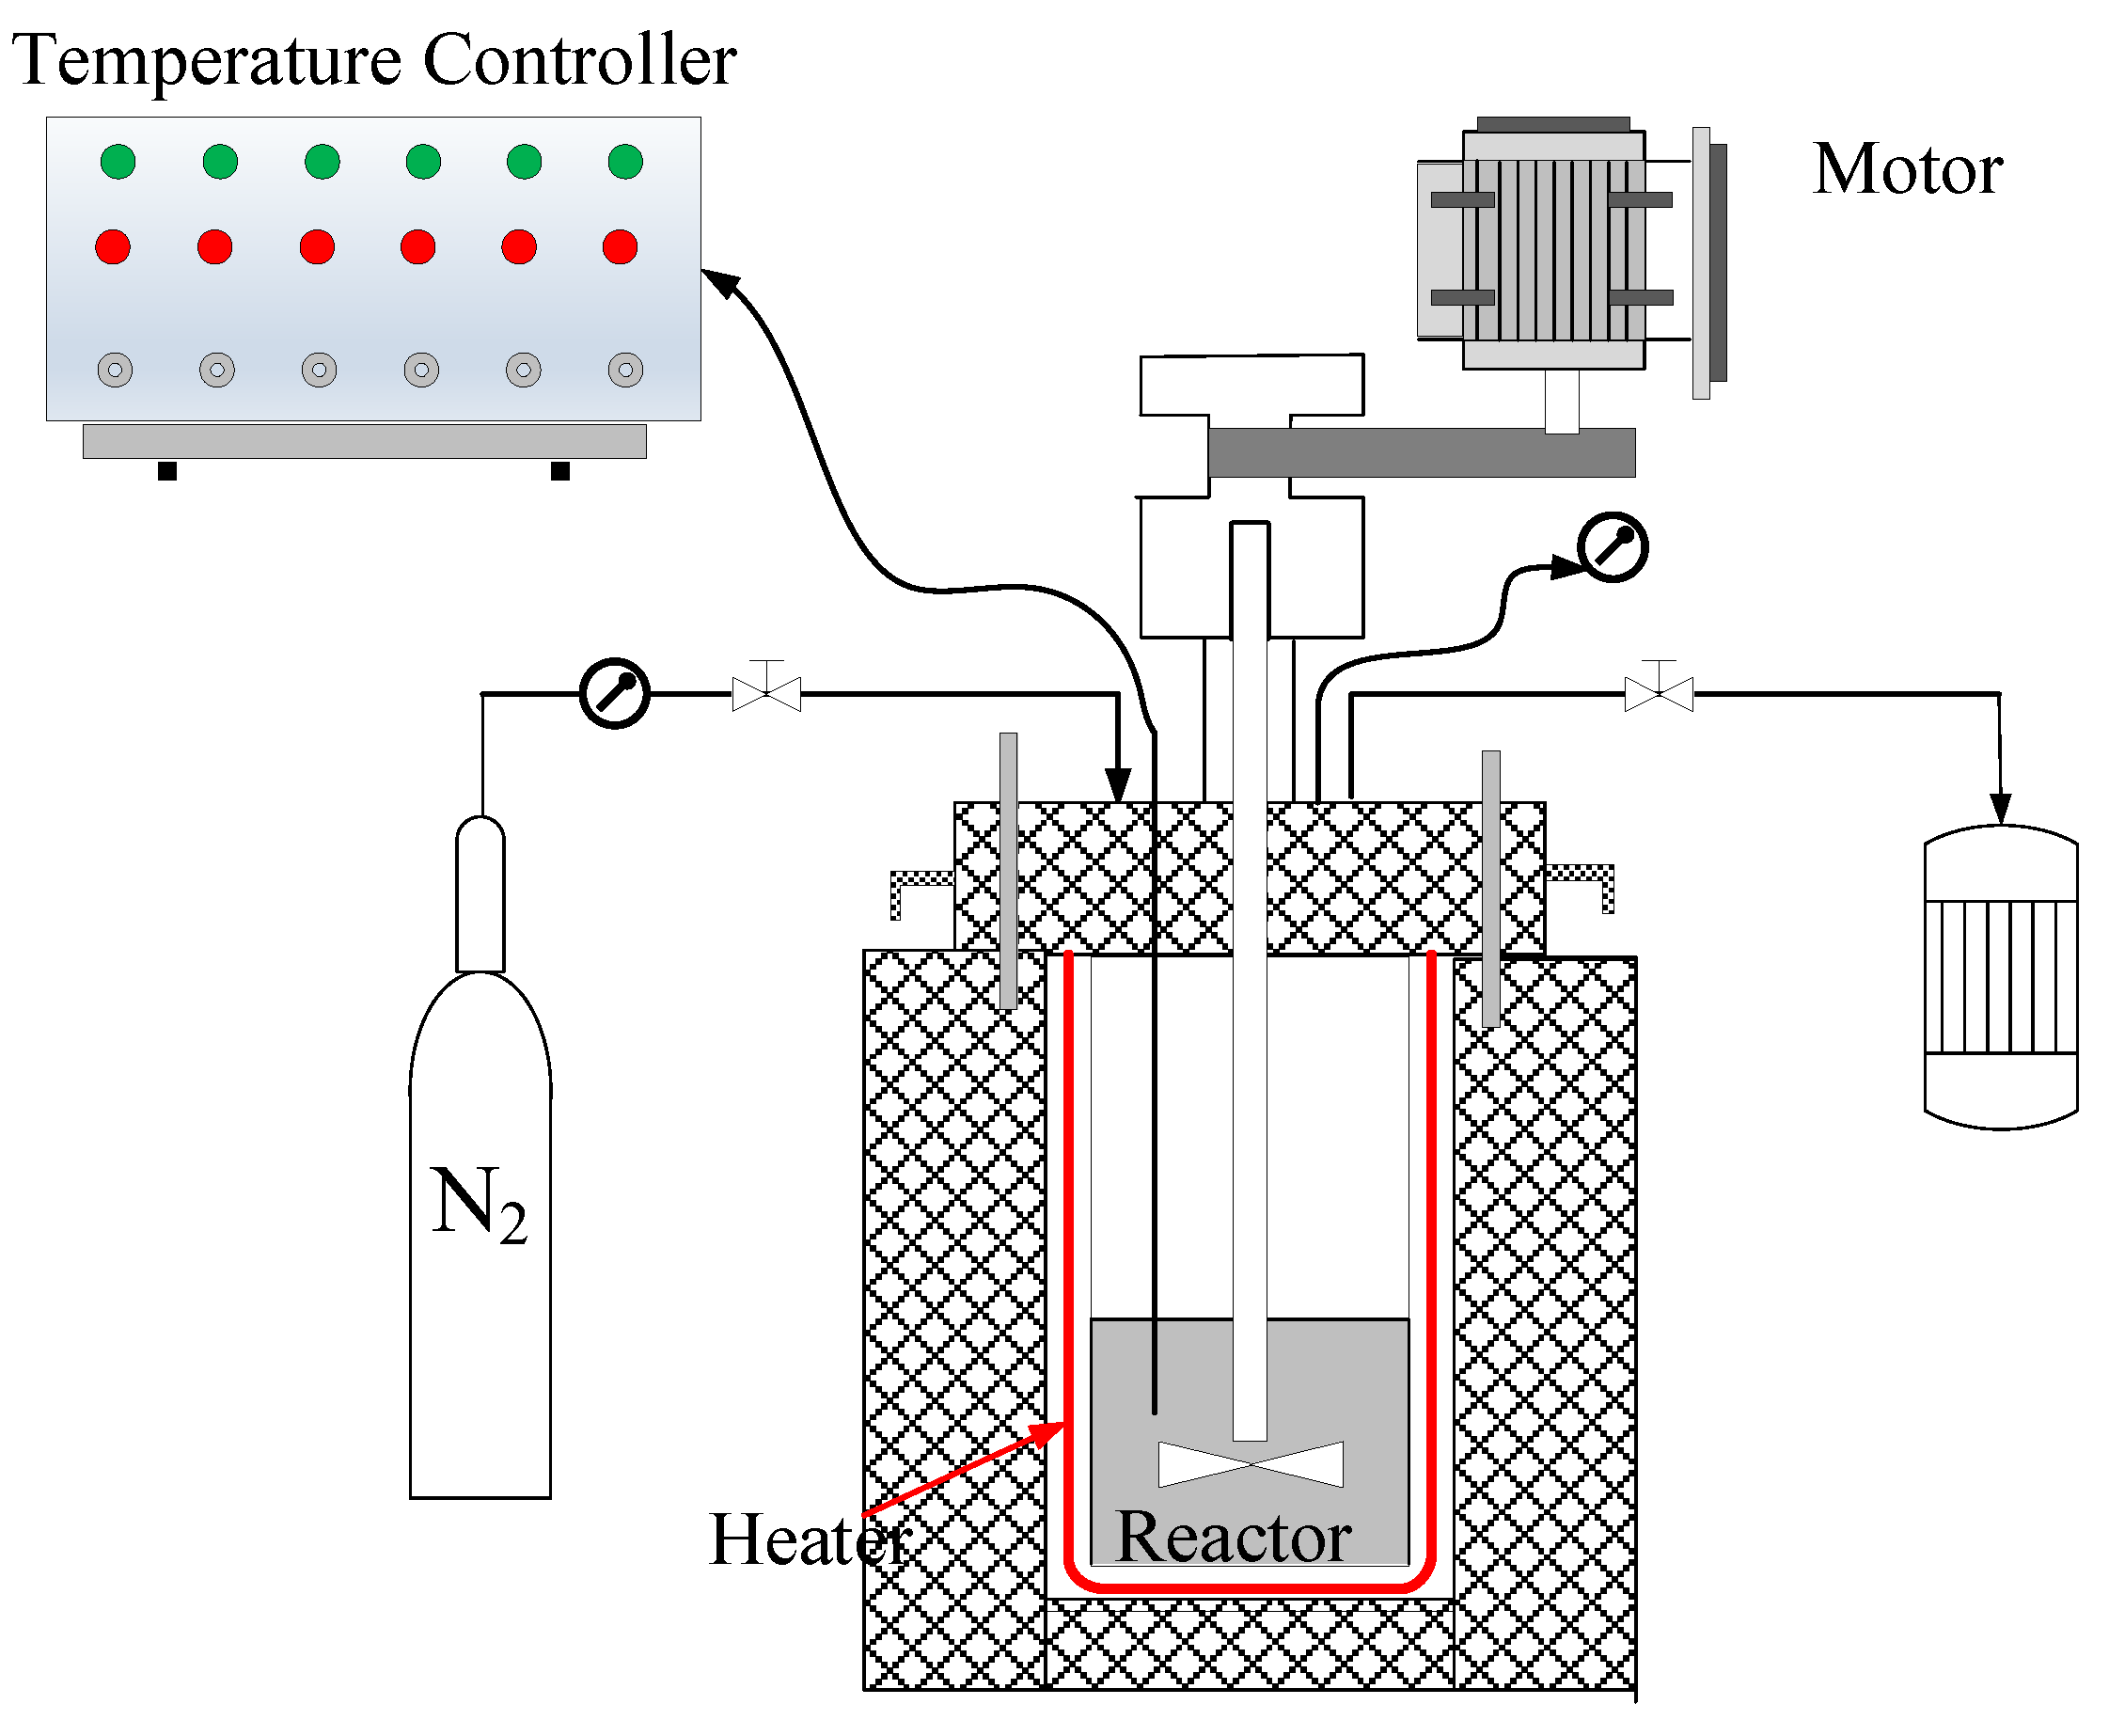
The HTC experiments of BSG were carried out in a hydrothermal reactor (KCF015-30/316L, Songling Chemical Co., Ltd., Yantai, China), as shown in Figure 9 (the volume of reactor was 500 mL). A total of 30 ± 0.1 g (denoted as MRW) of BSG and 150 mL of deionized water were mixed and poured into the reactor (the ratio of BSG to water was 5 mL/g). The reaction time and biomass-to-water ratio were selected based on preliminary experiments, which indicated that these conditions ensured complete reaction while effectively isolating the predominant influence of temperature on the HTC process. Before starting the experiment, N2 was passed through at a flow rate of 400 mL/min for 5 min to expel the air from the water heat reactor. The initial temperatures required for the hydrolysis of hemicellulose, cellulose, and lignin were 180 °C, 230 °C, and 260 °C, respectively [25], and temperatures of 220 °C, 250 °C, and 280 °C, which were slightly higher than their hydrolysis temperatures, were chosen as the temperatures for this study. The experimental conditions were as follows: The reactor was heated from 25 °C to the target temperatures (220, 250, and 280 °C) at a rate of 5 °C/min and held at the target temperatures for 60 min. After the reactor was cooled to room temperature, the solid–liquid mixture was removed. To minimize mass loss, the reactor was then rinsed with dichloromethane until it was colorless. The solid–liquid mixture was separated by filtration, and the solid product was dried at 105 °C to obtain hydrochar, the mass of which was noted as MHC. The tar was obtained by removing dichloromethane via rotary evaporation. To minimize errors, every experiment was repeated three times, and the results were averaged. The hydrochar was named HC-T, and the tar was named Tar-T, where T is the hydrothermal temperature; for example, the hydrochar and tar obtained by HTC of BSG at 220 °C were named HC-220 and Tar-220, respectively. The yield (Y) of hydrochar was calculated as follows:
Y = MHC/MRW

3.3. Characterization

3.3.1. Tar Analysis

The analysis of tar was conducted using gas chromatography–mass spectrometry (GC-MS, 7890B/5977C, Agilent Technologies, Santa Clara, CA, USA). The model of the chromatographic column was HP-5, and a hydrogen flame detector was used. FID was used to determine the concentration of each component in the tar, and the organic components were identified by NIST05. The detection conditions were as follows: N2 was selected as the carrier gas, the air/H2 ratio was set to 10:1, and the split ratio was set to 20:1. The column, inlet, and detector temperatures were set to 60 °C, 315 °C, and 310 °C, respectively. The temperature increase program was set as follows: firstly, the column chamber was held at 60 °C for 2 min, and then the temperature was increased to 300 °C at an increase rate of 5 °C/min and held for 10 min. N2 was selected as the carrier gas. The incubation program was set as follows: firstly, the column chamber was held at 60 °C for 2 min, and then the temperature of the column chamber was increased to 300 °C at an elevated rate of 5 °C/min and held for 10 min.

3.3.2. Hydrochar Analysis

The ultimate analysis of various samples was carried out using an elemental analyzer (VARIO ELⅢ, Elementer, Frankfurt, Germany). The following parameters were used: helium as a carrier gas, sample mass of 30 ± 0.5 mg, combustion tube temperature of 1100 °C, reduction tube temperature of 850 °C, and analytical precision of 0.1%. The O content was obtained by a differential subtraction method. The micro-morphology of the samples was observed through scanning electron microscopy (SEM, S-3400N, Hitachi, Tokyo, Japan), and the sample needed to be sprayed with gold prior to testing, with an operating voltage of 20 kV. The surface chemical properties of the samples were determined by X-ray photoelectron spectroscopy (XPS, ESCALAB 250Xi, ThermoFisher, Altrincham, UK). The test conditions were as follows: Al Kα X-rays were used as the photoelectron excitation source, with an operating voltage of 12 kV and a filament current of 6 mA; the fluence energies of the narrow-spectrum and full-spectrum scans were 150 eV and 50 eV, respectively, and the scanning step sizes were set to 0.5 eV and 1 eV, and the charge displacement was calibrated by using C1s (284.8 eV) as the internal standard. Data processing was performed using XPSPEAK 4.1. The crystal structure of the samples was analyzed using X-ray diffraction (XRD, 18KW/D/max2550VB/PC, Nippon Neo-electric Machine, Tokyo, Japan). The test conditions were as follows: Cu target, tube current of 100 mA, tube voltage of 40 kV, and scanning over a diffraction angle range of 10-80° in 0.02° steps. Fourier-transform infrared spectroscopy (FT-IR, Nicolet 6700, Nicolet, Madison, WI, USA) was employed to examine the surface functional groups of the samples; the KBr and samples were mixed at a ratio of 300:1, and then a pressing process was carried out. The test conditions were as follows: the scanning range was 400–4000 cm−1, and the resolution was 4 cm−1.

4. Conclusion

This study investigated the formation pathways of hydrochar from BSG during HTC by tracking the evolution of tar and hydrochar properties at different temperatures (220, 250, and 280 °C). The primary objective was to understand the chemical pathways governing hydrochar formation and to identify the optimal temperature for producing high-quality solid fuel with superior pyrolysis potential. The main conclusions are derived as follows:
The main components of the tar were aromatic compounds and acid compounds. The H3O+ generated by the self-ionization of water at high temperature catalyzed the hydrolysis of large molecules such as cellulose, hemicellulose, and lignin to generate small-molecule compounds, resulting in an increase in the acid compound content from 7.49% in Tar-220 to 21.59% in Tar-250. The condensation of small molecules increased the content of aromatic compounds from 23.08% in Tar-220 to 31.34% in Tar-280.
Higher temperatures reduced the ash and volatile contents and increased the fixed carbon content of the hydrochar, and HC-280 exhibited the lowest H/C (1.25) and O/C (0.25) atomic ratios and the highest HHV (35.36 MJ/kg). XPS analysis indicates that HTC promoted dehydration, decarboxylation, molecular re-arrangement, and polycondensation in the BSG, thereby improving the degree of aromatic condensation of hydrochar. HC-280 exhibited the highest sp2 C/sp3 C ratio and the lowest -OH and -COOH contents. Hydrochar forms primarily through two pathways: the hydrolysis products of BSG undergo dehydration, polymerization, aromatization, and carbonization to produce hydrochar, while components with high thermal stability in BSG form hydrochar through dehydration, molecular rearrangement, and polycondensation. Based on an analysis of HHV, the O/C and H/C ratios, ash content, aromaticity, and tar quality, 280 °C was established as the optimal HTC temperature for converting BSG into hydrochar for pyrolysis applications. HC-280 demonstrated superior fuel quality and is considered an ideal pyrolysis feedstock. This finding provides valuable guidance for the utilization of BSG through HTC technology.

Supplementary Materials

The following supporting information can be downloaded at: https://www.mdpi.com/article/10.3390/catal15090847/s1, Table S1: Relative content (area%) of major compounds in Tar-220, Tar-250, and Tar-280.

Author Contributions

Conceptualization, X.W., X.L. and S.W.; methodology, P.L.; software, P.L.; validation, S.H.; formal analysis, P.L. and S.H.; investigation, P.L., X.L. and X.W.; resources, S.W.; data curation, P.L., X.L. and X.W.; writing—original draft preparation, P.L., X.L. and X.W.; writing—review and editing, X.W. and S.W.; visualization, P.L., Y.W. and S.H.; supervision, X.W., Y.W. and S.W.; funding acquisition, S.W. All authors have read and agreed to the published version of the manuscript.

Funding

This research was supported by the National Key R&D Program of China (2023YFB4103501-3) and the National Natural Science Foundation of China (Grant No. 22378129).

Data Availability Statement

The data presented in this study are available upon request from the corresponding author.

Conflicts of Interest

The authors declare no conflicts of interest.

References

  1. Ashokkumar, V.; Venkatkarthick, R.; Jayashree, S.; Chuetor, S.; Dharmaraj, S.; Kumar, G.; Chen, W.-H.; Ngamcharussrivichai, C. Recent advances in lignocellulosic biomass for biofuels and value-added bioproducts—A critical review. Bioresour. Technol. 2022, 344, 126195. [Google Scholar] [CrossRef]
  2. Moon, J.; Mun, T.-Y.; Yang, W.; Lee, U.; Hwang, J.; Jang, E.; Choi, C. Effects of hydrothermal treatment of sewage sludge on pyrolysis and steam gasification. Energy Convers. Manag. 2015, 103, 401–407. [Google Scholar] [CrossRef]
  3. Chen, Y.; Liu, B.; Yang, H.; Wang, X.; Zhang, X.; Chen, H. Generalized two-dimensional correlation infrared spectroscopy to reveal the mechanisms of lignocellulosic biomass pyrolysis. Proc. Combust. Inst. 2019, 37, 3013–3021. [Google Scholar] [CrossRef]
  4. Cheng, C.; Guo, Q.; Ding, L.; Gong, Y.; Yu, G. Insights into pyrolysis process of coconut shell waste hydrochar: In-situ structural evolution and reaction kinetics. J. Clean. Prod. 2024, 448, 141701. [Google Scholar] [CrossRef]
  5. Hu, B.; Cheng, A.-S.; Xie, W.-L.; Liu, J.; Huang, Y.-B.; Zhu, L.-J.; Zhang, B.; Li, M.-X.; Zhao, L.; Wang, T.-P.; et al. The oxalic acid-assisted fast pyrolysis of biomass for the sustainable production of furfural. Fuel 2022, 322, 124279. [Google Scholar] [CrossRef]
  6. de Araújo, T.P.; Quesada, H.B.; Bergamasco, R.; Vareschini, D.T.; de Barros, M.A.S.D. Activated hydrochar produced from brewer’s spent grain and its application in the removal of acetaminophen. Bioresour. Technol. 2020, 310, 123399. [Google Scholar] [CrossRef] [PubMed]
  7. Martin, D.S.; Orive, M.; Iñarra, B.; Castelo, J.; Estévez, A.; Nazzaro, J.; Iloro, I.; Elortza, F.; Zufía, J. Brewers’ Spent Yeast and Grain Protein Hydrolysates as Second-Generation Feedstuff for Aquaculture Feed. Waste Biomass- Valorization 2020, 11, 5307–5320. [Google Scholar] [CrossRef]
  8. Borel, L.D.M.S.; Lira, T.S.; Ribeiro, J.A.; Ataíde, C.H.; Barrozo, M.A.S. Pyrolysis of brewer’s spent grain: Kinetic study and products identification. Ind. Crops Prod. 2018, 121, 388–395. [Google Scholar] [CrossRef]
  9. Qi, W.; Yang, W.; Xu, Q.; Xu, Z.; Wang, Q.; Liang, C.; Liu, S.; Ling, C.; Wang, Z.; Yuan, Z. Comprehensive Research on the Influence of Nonlignocellulosic Components on the Pyrolysis Behavior of Chinese Distiller’s Grain. ACS Sustain. Chem. Eng. 2020, 8, 3103–3113. [Google Scholar] [CrossRef]
  10. Abifarin, J.; Obada, D.; Dauda, E.; Dodoo-Arhin, D. Experimental data on the characterization of hydroxyapatite synthesized from biowastes. Data Brief. 2019, 26, 104485. [Google Scholar] [CrossRef]
  11. Zhang, C.; Zheng, C.; Ma, X.; Zhou, Y.; Wu, J. Co-hydrothermal carbonization of sewage sludge and banana stalk: Fuel properties of hydrochar and environmental risks of heavy metals. J. Environ. Chem. Eng. 2021, 9, 106051. [Google Scholar] [CrossRef]
  12. Asadullah, M. Barriers of commercial power generation using biomass gasification gas: A review. Renew. Sustain. Energy Rev. 2014, 29, 201–215. [Google Scholar] [CrossRef]
  13. Poerschmann, J.; Weiner, B.; Wedwitschka, H.; Baskyr, I.; Koehler, R.; Kopinke, F.-D. Characterization of biocoals and dissolved organic matter phases obtained upon hydrothermal carbonization of brewer’s spent grain. Bioresour. Technol. 2014, 164, 162–169. [Google Scholar] [CrossRef]
  14. Glasner, C.; Deerberg, G.; Lyko, H. Hydrothermal Carbonization: A Review. Chem. Ing. Tech. 2011, 83, 1932–1943. [Google Scholar] [CrossRef]
  15. Gong, P.; Liu, H.; Wang, M.; Dai, X.; Yao, J. Characteristics of hydrothermal treatment for the disintegration of oxytetracycline fermentation residue and inactivation of residual antibiotics. Chem. Eng. J. 2020, 402, 126011. [Google Scholar] [CrossRef]
  16. Abifarin, J.K.; Abifarin, F.B.; Ofodu, J.C. Lignin-hydrothermal fabrication of 3D hierarchical porous carbon for energy storage application. Bioresour. Technol. Rep. 2024, 26, 101883. [Google Scholar] [CrossRef]
  17. Arauzo, P.; Du, L.; Olszewski, M.; Zavala, M.M.; Alhnidi, M.; Kruse, A. Effect of protein during hydrothermal carbonization of brewer’s spent grain. Bioresour. Technol. 2019, 293, 122117. [Google Scholar] [CrossRef] [PubMed]
  18. Peng, C.; Zhai, Y.; Zhu, Y.; Xu, B.; Wang, T.; Li, C.; Zeng, G. Production of char from sewage sludge employing hydrothermal carbonization: Char properties, combustion behavior and thermal characteristics. Fuel 2016, 176, 110–118. [Google Scholar] [CrossRef]
  19. Zhang, B.; Zhong, Z.; Ding, K.; Song, Z. Production of aromatic hydrocarbons from catalytic co-pyrolysis of biomass and high density polyethylene: Analytical Py–GC/MS study. Fuel 2015, 139, 622–628. [Google Scholar] [CrossRef]
  20. Toor, S.S.; Rosendahl, L.; Rudolf, A. Hydrothermal liquefaction of biomass: A review of subcritical water technologies. Energy 2011, 36, 2328–2342. [Google Scholar] [CrossRef]
  21. Li, C.; Zhang, G.; Zhang, Z.; Ma, D.; Wang, L.; Xu, G. Hydrothermal pretreatment for biogas production from anaerobic digestion of antibiotic mycelial residue. Chem. Eng. J. 2015, 279, 530–537. [Google Scholar] [CrossRef]
  22. Wang, T.; Zhai, Y.; Zhu, Y.; Li, C.; Zeng, G. A review of the hydrothermal carbonization of biomass waste for hydrochar formation: Process conditions, fundamentals, and physicochemical properties. Renew. Sustain. Energy Rev. 2018, 90, 223–247. [Google Scholar] [CrossRef]
  23. Danso-Boateng, E.; Shama, G.; Wheatley, A.; Martin, S.; Holdich, R. Hydrothermal carbonisation of sewage sludge: Effect of process conditions on product characteristics and methane production. Bioresour. Technol. 2015, 177, 318–327. [Google Scholar] [CrossRef]
  24. Wang, T.; Zhai, Y.; Zhu, Y.; Peng, C.; Xu, B.; Wang, T.; Li, C.; Zeng, G. Influence of temperature on nitrogen fate during hydrothermal carbonization of food waste. Bioresour. Technol. 2018, 247, 182–189. [Google Scholar] [CrossRef] [PubMed]
  25. Pauline, A.L.; Joseph, K. Hydrothermal carbonization of organic wastes to carbonaceous solid fuel—A review of mechanisms and process parameters. Fuel 2020, 279, 118472. [Google Scholar] [CrossRef]
  26. Chen, D.; Mei, J.; Li, H.; Li, Y.; Lu, M.; Ma, T.; Ma, Z. Combined pretreatment with torrefaction and washing using torrefaction liquid products to yield upgraded biomass and pyrolysis products. Bioresour. Technol. 2017, 228, 62–68. [Google Scholar] [CrossRef] [PubMed]
  27. Liu, H.; Chen, Y.; Yang, H.; Gentili, F.G.; Söderlind, U.; Wang, X.; Zhang, W.; Chen, H. Hydrothermal carbonization of natural microalgae containing a high ash content. Fuel 2019, 249, 441–448. [Google Scholar] [CrossRef]
  28. Wang, L.; Wang, X.; Zou, B.; Ma, X.; Qu, Y.; Rong, C.; Li, Y.; Su, Y.; Wang, Z. Preparation of carbon black from rice husk by hydrolysis, carbonization and pyrolysis. Bioresour. Technol. 2011, 102, 8220–8224. [Google Scholar] [CrossRef]
  29. Wei, X.; Ma, Z.; Jin, S.; Li, Y.; Wang, T.; Yu, Y. Hydrothermal carbonization of kitchen wastes: Physicochemical properties and combustion performance of hydrochars. J. Renew. Sustain. Energy 2025, 17, 033105. [Google Scholar] [CrossRef]
  30. Fu, Y.; Zhang, N.; Shen, Y.; Ge, X.; Chen, M. Micro-mesoporous carbons from original and pelletized rice husk via one-step catalytic pyrolysis. Bioresour. Technol. 2018, 269, 67–73. [Google Scholar] [CrossRef]
  31. Sevilla, M.; Fuertes, A. The production of carbon materials by hydrothermal carbonization of cellulose. Carbon 2009, 47, 2281–2289. [Google Scholar] [CrossRef]
  32. Chen, C.; Liu, G.; An, Q.; Lin, L.; Shang, Y.; Wan, C. From wasted sludge to valuable biochar by low temperature hydrothermal carbonization treatment: Insight into the surface characteristics. J. Clean. Prod. 2020, 263, 121600. [Google Scholar] [CrossRef]
  33. Wei, X.; Liu, P.; Huang, S.; Li, X.; Wu, Y.; Wu, S. Hydrothermal carbonization characteristics and mechanism of penicillin mycelial residues and CO2 gasification performance of hydrochars. Biomass-Bioenergy 2024, 183, 107130. [Google Scholar] [CrossRef]
  34. Wu, Q.; Yu, S.; Hao, N.; Wells, T.; Meng, X.; Li, M.; Pu, Y.; Liu, S.; Ragauskas, A.J. Characterization of products from hydrothermal carbonization of pine. Bioresour. Technol. 2017, 244, 78–83. [Google Scholar] [CrossRef] [PubMed]
  35. Lin, Y.; Wang, D.; Wang, T. Ethanol production from pulp & paper sludge and monosodium glutamate waste liquor by simultaneous saccharification and fermentation in batch condition. Chem. Eng. J. 2011, 191, 31–37. [Google Scholar] [CrossRef]
  36. Ma, D.; Zhang, G.; Zhao, P.; Areeprasert, C.; Shen, Y.; Yoshikawa, K.; Xu, G. Hydrothermal treatment of antibiotic mycelial dreg: More understanding from fuel characteristics. Chem. Eng. J. 2015, 273, 147–155. [Google Scholar] [CrossRef]
  37. Yang, W.; Wang, H.; Zhang, M.; Zhu, J.; Zhou, J.; Wu, S. Fuel properties and combustion kinetics of hydrochar prepared by hydrothermal carbonization of bamboo. Bioresour. Technol. 2016, 205, 199–204. [Google Scholar] [CrossRef]
  38. Zhu, M.; Zhou, K.; Sun, X.; Zhao, Z.; Tong, Z.; Zhao, Z. Hydrophobic N-doped porous biocarbon from dopamine for high selective adsorption of p-Xylene under humid conditions. Chem. Eng. J. 2017, 317, 660–672. [Google Scholar] [CrossRef]
  39. Ma, X.; Zhang, Z.; Wu, H.; Li, J.; Yang, L. Adsorption of Volatile Organic Compounds at Medium-High Temperature Conditions by Activated Carbons. Energy Fuels 2019, 34, 3679–3690. [Google Scholar] [CrossRef]
  40. Chen, W.; Yang, H.; Chen, Y.; Xia, M.; Chen, X.; Chen, H. Transformation of Nitrogen and Evolution of N-Containing Species during Algae Pyrolysis. Environ. Sci. Technol. 2017, 51, 6570–6579. [Google Scholar] [CrossRef]
  41. Kruse, A.; Koch, F.; Stelzl, K.; Wüst, D.; Zeller, M. Fate of Nitrogen during Hydrothermal Carbonization. Energy Fuels 2016, 30, 8037–8042. [Google Scholar] [CrossRef]
  42. Jain, A.; Balasubramanian, R.; Srinivasan, M. Hydrothermal conversion of biomass waste to activated carbon with high porosity: A review. Chem. Eng. J. 2016, 283, 789–805. [Google Scholar] [CrossRef]
  43. Körner, P. Hydrothermal Degradation of Amino Acids. ChemSusChem 2021, 14, 4947–4957. [Google Scholar] [CrossRef] [PubMed]
  44. He, C.; Zhang, Z.; Ge, C.; Liu, W.; Tang, Y.; Zhuang, X.; Qiu, R. Synergistic effect of hydrothermal co-carbonization of sewage sludge with fruit and agricultural wastes on hydrochar fuel quality and combustion behavior. Waste Manag. 2019, 100, 171–181. [Google Scholar] [CrossRef]
  45. Wang, Q.; Wu, S.; Cui, D.; Pan, S.; Xu, F.; Xu, F.; Wang, Z.; Li, G. Co-hydrothermal carbonization of corn stover and food waste: Characterization of hydrochar, synergistic effects, and combustion characteristic analysis. J. Environ. Chem. Eng. 2022, 10, 108716. [Google Scholar] [CrossRef]
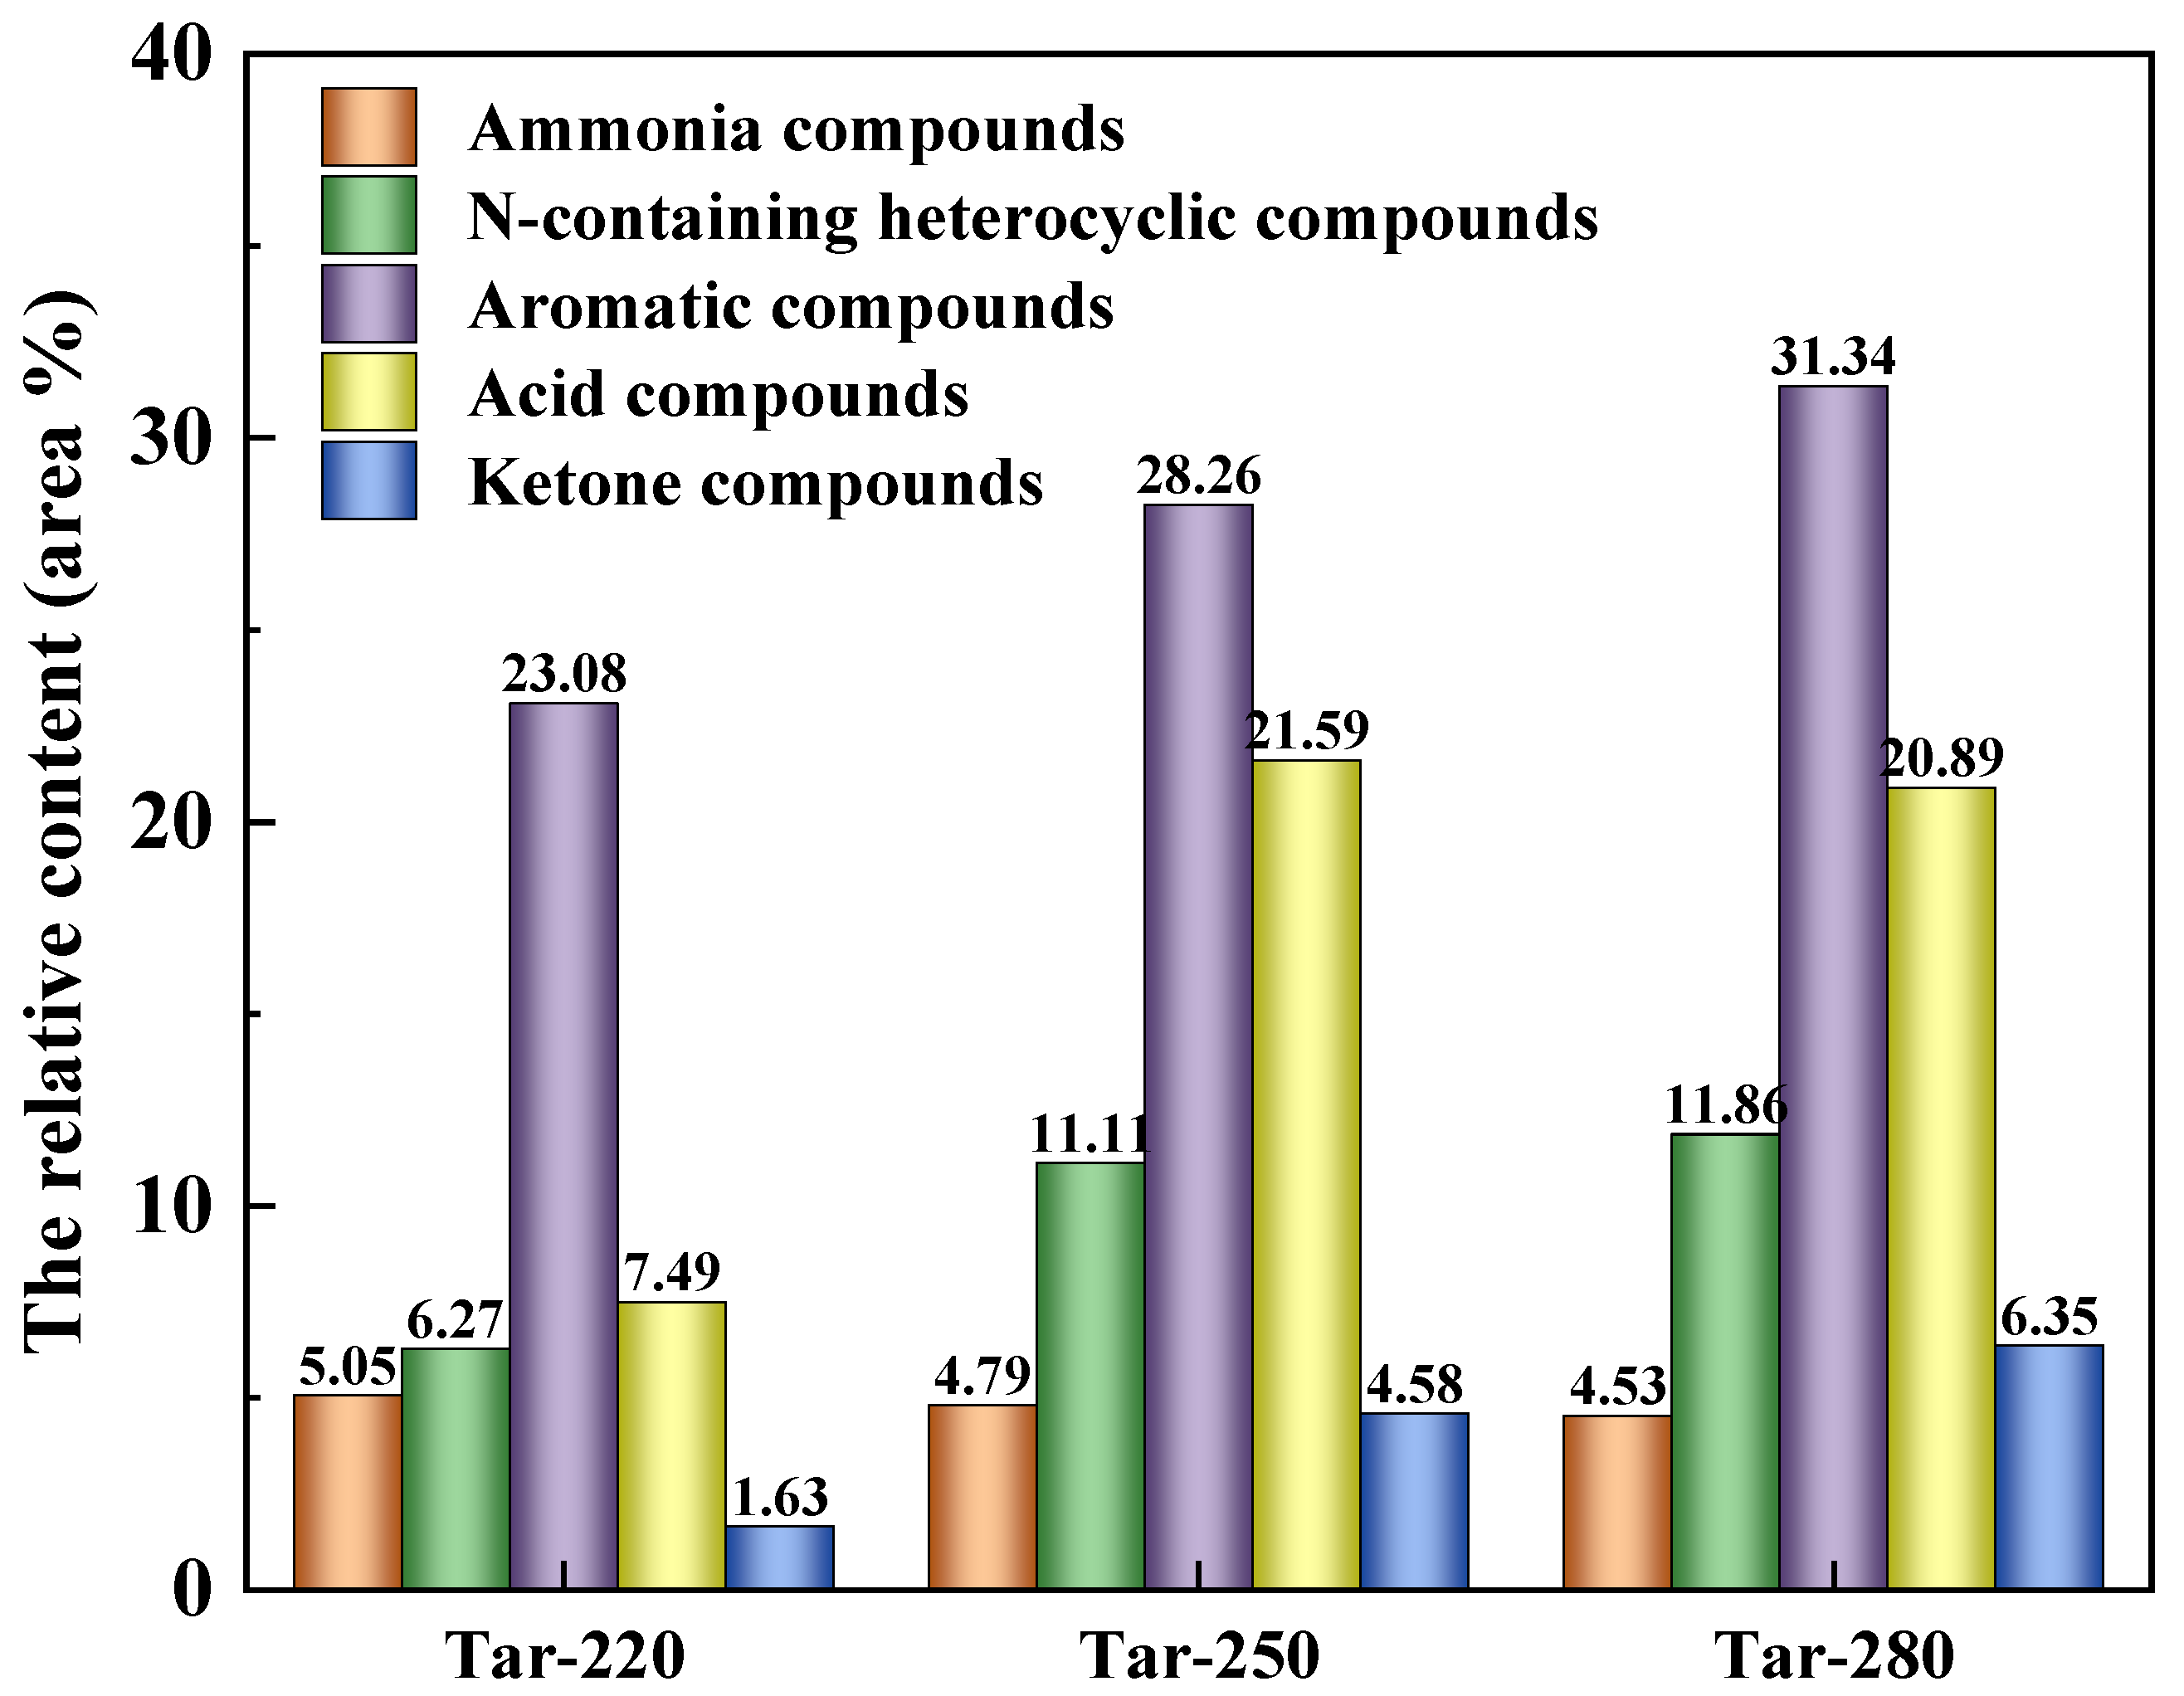
Figure 1. The component distribution of tar.
Catalysts 15 00847 g001
Figure 2. XRD patterns of different samples.
Catalysts 15 00847 g002
Figure 3. (a) FT-IR spectra of different samples. The peak fitting results of FT-IR of (b) BSG, (c) HC-220, (d) HC-250, (e) HC-280.
Catalysts 15 00847 g003
Figure 4. The XPS C1s spectra and the relative content of C-containing functional groups (ad), and the sp2/sp3 C ratio (e) of different samples.
Catalysts 15 00847 g004
Figure 5. The XPS O1s spectra and the relative content of O-containing functional groups of (a) BSG, (b) HC-220, (c) HC-250, (d) HC-280.
Catalysts 15 00847 g005
Figure 6. The XPS N1s spectra and the relative content of N-containing functional groups of (a) BSG, (b) HC-220, (c) HC-250, (d) HC-280.
Catalysts 15 00847 g006
Figure 7. SEM images of different samples of (a) BSG, (b) HC-220, (c) HC-250, (d) HC-280.
Catalysts 15 00847 g007
Figure 8. The possible formation pathways of hydrochar in the HTC process of BSG.
Catalysts 15 00847 g008
Figure 9. Schematic diagram of hydrothermal reactor.
Catalysts 15 00847 g009
Table 1. Proximate and ultimate analysis of samples.
SamplesProximate Analysis (wt.%, Dry Basis)Ultimate Analysis
(wt.%, Dry Basis)
Atomic RatioYield (%)HHV b (MJ/kg)
AshFixed CarbonVolatileCHO aNSH/CO/C
BSG3.89 ± 0.0614.05 ± 0.1582.06 ± 0.2550.177.6734.393.670.211.830.51-32.74
HC-2202.28 ± 0.1123.14 ± 0.2474.58 ± 0.1961.327.3526.522.390.141.440.3277.5134.70
HC-2501.85 ± 0.0925.82 ± 0.1772.33 ± 0.2064.257.1224.442.250.091.330.2972.1435.03
HC-2801.72 ± 0.1027.07 ± 0.1271.21 ± 0.1466.916.9722.322.030.051.250.2565.3335.36
a: By difference: O% = 100% − C% − H% − N% − S% − ash%. b: HHV= 0.339C + 1.2414H + 0.0093S − 0.1804O + 0.001464N.
Disclaimer/Publisher’s Note: The statements, opinions and data contained in all publications are solely those of the individual author(s) and contributor(s) and not of MDPI and/or the editor(s). MDPI and/or the editor(s) disclaim responsibility for any injury to people or property resulting from any ideas, methods, instructions or products referred to in the content.