Article

Plasma-Assisted CO2 Conversion to Methanol in Energy Systems: Parameter Optimization and Synergistic Effects

1
Guangdong Energy Group Science and Technology Research Institute Co., Ltd., Guangzhou 511458, China
2
State Key Laboratory of Clean Energy Utilization, Zhejiang University, Hangzhou 310027, China
3
School of Environment, Hangzhou Institute for Advanced Study, University of Chinese Academy of Sciences, Hangzhou 310024, China
4
Guangdong Energy Group, Guangzhou 510630, China
*
Authors to whom correspondence should be addressed.
Catalysts 2025, 15(9), 846; https://doi.org/10.3390/catal15090846
Submission received: 21 July 2025 / Revised: 25 August 2025 / Accepted: 29 August 2025 / Published: 3 September 2025
(This article belongs to the Special Issue Catalytic Processes in Environmental Applications)

Abstract

The integrated process of CO2 hydrogenation and catalytic methanol synthesis under plasma conditions holds great potential for CO2 conversion from waste gases. This process connects a dielectric barrier discharge (DBD) plasma reactor and a methanol synthesis fixed-bed reactor through a pressurization device, achieving the stepwise conversion of CO2 to CO and then to methanol, thereby establishing a low-carbon and high-efficiency energy conversion system. This study experimentally investigated the key parameters influencing the CO2 hydrogenation process in the DBD plasma reactor and the methanol synthesis process in the fixed-bed reactor. The results show that in the plasma reaction, discharge power, discharge gap, gas flow rate, and gas composition significantly affect CO2 conversion efficiency. In the methanol synthesis process, the CO/CO2 mixed feed exhibits superior catalytic performance compared to pure CO2. The optimal operating conditions for the integrated process are a plasma voltage of 40 V and a downstream reaction temperature of 240 °C, under which the system achieves the best overall performance.

Graphical Abstract

1. Introduction

As the economy and technology have developed, CO2 emissions have continued to rise, contributing to a global temperature increase of 1.2 °C, to date [1]. The resulting climate change has become a major issue that requires urgent global attention. In recent years, China has prioritized CO2 emissions reduction as a key national strategy, implementing a series of policies and measures to address the issue. In his address at the 75th United Nations General Assembly, President Xi Jinping emphasized that “China will enhance its nationally determined contributions, adopt more robust policies and measures, aim to peak CO2 emissions before 2030, and strive to achieve carbon neutrality by 2060” [2].
Given the current energy structure and CO2 emission situation in China, Carbon Capture, Utilization, and Storage (CCUS) technologies are key measures and effective strategies for achieving significant CO2 emission reductions, zero CO2 emissions, and even negative emissions. CCUS refers to a greenhouse gas emission-reduction technology system that involves capturing CO2 from industrial emission sources or the atmosphere, compressing and transporting it, and subsequently utilizing it for industrial conversion or geological storage. The technical process can be categorized into capture, transportation, utilization, and storage [3]. Currently, carbon capture technologies at the front end of CCUS have undergone multiple generations of absorber development and process optimization, leading to industrial-scale demonstrations with capacities in the range of millions of tons and energy consumption controlled at <2.4 GJ/t CO2 [4]. However, CO2 geological storage and utilization technologies such as enhanced oil recovery and seaweed cultivation at the back end are significantly influenced by regional and economic factors, which limits their large-scale industrial development. This is particularly challenging for regions like Guangdong, which are highly industrialized, densely populated, and land-scarce. Therefore, the development of high-value utilization technologies for low-cost, high-efficiency synthesis of fuels or basic chemicals from CO2 will be crucial to overcoming geographical and resource constraints. It will play a key role in achieving carbon neutrality or negative carbon emissions, and will be central to building a sustainable energy and raw material supply system for the future.
Compared to the synthesis of other carbon-based chemicals or fuels, catalytic hydrogenation of CO2 to methanol is one of the most promising high-value utilization pathways for CO2, due to its significant commercial potential. Methanol not only serves as a clean fuel alternative, but is also a promising “intermediate” product. Currently, advanced chemical processes enable the conversion of methanol into various chemicals, such as high-octane gasoline through methanol-to-gasoline (MTG) [5], low-octane olefins through methanol-to-olefins (MTO) [6], and aromatics through methanol-to-aromatics (MTA) [7]. Furthermore, methanol can also be used as a hydrogen carrier, overcoming the technical challenges of hydrogen storage and transportation, which are costly and difficult [8]. The ‘methanol economy’ concept proposed by George A. Olah systematically elucidates methanol’s multifunctional role as a core C1 chemical carrier [9]. Its large-scale application enables efficient CO2 utilization, establishing a sustainable technological bridge between carbon emission reduction, environmental protection, and the transition of the chemical and energy industries.
The mainstream industrial-scale technologies for CO2 hydrogenation to methanol are the one-step and two-step processes. The one-step process directly synthesizes methanol from CO2 and hydrogen, through a catalytic reaction. The two-step process also uses CO2 and hydrogen as feedstocks, but first converts CO2 into syngas via the Reverse Water–Gas Shift (RWGS) reaction, and then synthesizes methanol from the syngas. The one-step process requires relatively high temperatures, because CO2 molecules are stable and difficult to activate [10]. However, since CO2 conversion to methanol is an exothermic reaction, high temperatures hinder the forward reaction [11]. Additionally, the water produced in the reaction competes with the main reaction by promoting the RWGS reaction, leading to lower CO2 conversion and methanol yield, compared to the two-step process. While the two-step process generally offers better performance, the high temperature (above 800 °C) in the RWGS reactor can lead to catalyst deactivation due to coke deposition, and significantly increases energy consumption, making its capital investment much higher than that of the one-step process [12]. Both processes have their advantages and disadvantages, but they are both traditional thermal catalytic methods that face thermodynamic limitations. Therefore, more efficient and cost-effective technologies are needed to advance CO2 hydrogenation to methanol.
Emerging catalytic technologies for CO2 conversion include electrocatalysis, photocatalysis, photo-electrocatalysis, and plasma catalysis, among others. Among these, low-temperature plasma is regarded as one of the most promising cutting-edge technologies. As previously mentioned, a key challenge in the CO2 hydrogenation process to methanol is the activation of CO2 molecules and overcoming thermodynamic limitations. Non-Thermal Plasma (NTP) technology offers a potential alternative to conventional thermal catalysis, as it can effectively activate CO2 under mild temperature and pressure conditions [13]. NTP generates high-energy electrons that act as a “catalyst”, facilitating the activation of reactants such as CO2 and H2. These reactive species—such as free radicals, excited atoms, ions, and molecules—trigger and propagate chemical reactions. From both the perspective of molecular activation and energy efficiency, NTP technology presents significant advantages.
However, addressing the activation of CO2 alone is insufficient for efficient CO2 hydrogenation to methanol. One of the major drawbacks of NTP technology for CO2 conversion is its poor selectivity, particularly for methanol. In NTP processes, CO selectivity tends to be higher than that of methanol, followed by methane [14,15,16,17,18,19]. Recent studies have increasingly focused on investigating the synergistic effects between dielectric barrier discharge (DBD) plasma and catalytic systems for enhancing CO2 hydrogenation efficiency [20]. For example, Wang et al. reported a CO2 conversion rate of 21.2% and methanol selectivity of 53.7% using a Cu/γ-Al2O3 catalyst under plasma catalysis conditions [21]. Similarly, in a non-catalytic plasma-assisted CO2 hydrogenation study conducted by Zeng et al., the regulation of parameters in a DBD reactor achieved a maximum CO2 conversion rate of 42.97%, with CO selectivity reaching 92.77%. Under circulating water-cooled jacket conditions, the selectivity of CH4 was enhanced, while methanol selectivity remained nearly negligible [22]. Ashford et al. demonstrated that Ru-based catalysts can effectively mediate CO2 hydrogenation to ethane under DBD plasma conditions [23]. Meloni et al. demonstrated that bimetallic Ru-Rh catalysts significantly enhance the plasma–catalytic hydrogenation of CO2 to methane in DBD systems [24].
As outlined above, low-temperature plasma technology has shown considerable promise in converting CO2 to CO, but its performance in methanol production remains suboptimal. Therefore, further investigation is needed to integrate low-temperature plasma technology into existing CO2 hydrogenation to methanol catalytic systems, in order to enhance its efficiency and selectivity.
This work represents an exploratory study aimed at analyzing the integrated process of CO2 hydrogenation and catalytic methanol synthesis under plasma conditions, with the objective of obtaining experimental results for the combined application of low-temperature plasma technology and thermal catalysis. The plasma-assisted catalytic CO2 conversion-to-methanol enhancement process consists of two steps: (1) the generation of syngas via the RWGS reaction in a dielectric barrier discharge plasma reactor; and (2) the catalytic hydrogenation of CO and CO2 to methanol in a fixed-bed reactor.

2. Results and Discussion

2.1. Chemical Characteristics of Hydrogen Reduction of CO2 Under Plasma Conditions

CO is the signature product of CO2 hydrogenation under plasma conditions, and serves as a key intermediate, linking downstream syngas–catalytic-methanol synthesis. Therefore, CO2 conversion rate and CO selectivity are regarded as critical metrics for evaluating the reaction performance of DBD plasma systems.
This section systematically studies the influence of key reaction parameters, including input voltage, discharge gap, gas flow rate, and gas composition, on the hydrogen reduction of CO2 conversion performance. The specific experimental parameters are detailed in Table 1.

2.1.1. Input Voltage

The input voltage directly influences both the discharge power and the peak voltage in the DBD process. When the input voltage was adjusted to 20 V, 25 V, 30 V, 35 V, 40 V, 45 V, and 50 V, the corresponding discharge power increased to 13.25 W, 20.62 W, 29.90 W, 40.11 W, 59.63 W, 48.76 W, and 71.76 W, respectively. With further increase in the input voltage, the amplitude of the applied voltage across the reactor rose significantly, from approximately 7.2 kV to about 16.0 kV. It is particularly important to note that the term “input voltage” in this context specifically refers to the external excitation voltage output by the plasma power supply, while the “applied voltage across the reactor” denotes the effective working voltage actually applied between the electrodes of the plasma reactor. During the actual discharge process, the applied voltage typically reaches the kilovolt (kV) level, which directly affects the initiation and development of electron avalanches in the discharge.
As shown in Figure 1a, the CO2 conversion rate exhibits a bell-shaped trend with increasing input voltage. At 20 V, the conversion rate reaches its lowest value (37.17%). As the voltage rises, the conversion rate gradually improves, peaking at 62.52% at 40 V, before declining to 57.95% at 50 V.
Meanwhile, CO selectivity shows a continuous downward trend with increasing voltage, decreasing from 95.4% to 92.63%, while CH4 selectivity follows an opposite trend, rising from 4.60% to 7.37%. Experimental data indicate that the system achieves optimal overall conversion performance at 40 V, where the CO concentration reaches 20.76% and the CO2 concentration drops to 13.33% (Figure 1b). Notably, to more clearly illustrate the concentration trends of carbon-containing species, Figure 1b specifically presents the content distribution of carbonaceous products (CO2/CO/CH4), and this selective presentation approach is uniformly applied to all subsequent figures.
Experimental results demonstrate that as the input voltage increases, the discharge power further intensifies. From an energy perspective, additional energy is injected into the discharge gap, primarily utilized for breaking the chemical bonds of CO2 and H2. From a molecular dynamics standpoint, higher input voltage enhances the electric field strength in the discharge gap, promoting the generation of more high-energy electrons. According to the exponential growth law of electron avalanches, the collision probability between these electrons and reactant molecules significantly increases, thereby accelerating the ionization and dissociation of CO2 and H2, to form more reactive intermediates.
However, when the input voltage increased from 30 V to 35 V, the CO2 conversion rate showed only a marginal improvement of ~3%, indicating saturation effects. This phenomenon can be attributed to charge accumulation on the dielectric surface approaching saturation at higher voltages, which hinders charge migration and restricts the extension of microdischarge channels in the DBD plasma. These observations are consistent with the measured discharge characteristics, showing nearly stagnant transferred charge quantities. Specifically, the charge transfer—determined using the Lissajous figure method—increased from 89 nC at 20 V to 700 nC at 30 V, and reached 728 nC at 35 V. Beyond this voltage, further increases resulted in minimal change, with the charge transfer plateauing around 730 nC. Beyond 40 V, the CO2 conversion rate declines, likely due to excessive discharge intensity causing direct CO fragmentation and reverse CO2 dissociation (i.e., CO splitting into C and O, or recombination with O in the highly ionized gas).
As shown in Figure 1, the primary products are CO and CH4, with CO dominating (>92% selectivity), while CH4 selectivity remains below 8%. This selectivity pattern arises because electrons and radicals efficiently cleave CO2 bonds to form CO and oxygen radicals, while hydrogen radicals preferentially attack the oxygen termini of CO2, further promoting CO production. In contrast, CH4 formation requires CO as a precursor for subsequent hydrogenation—a process demanding higher energy input and more complex reaction pathways. Nevertheless, the gradual rise in CH4 selectivity with increasing voltage suggests enhanced hydrogen atom availability, which facilitates deeper CO hydrogenation.
The discharge power under different input voltages was determined using Lissajous figures, from which the corresponding specific input power was calculated. Experimental results demonstrate that the DBD reactor exhibits a specific input power of 1500 kJ/mol at an input voltage of 40 V. Although this operating condition yields optimal CO2 conversion performance, the relatively high specific input power indicates significant energy loss within the system. This phenomenon is likely attributed to substantial conversion of electrical energy into thermal energy during the discharge process. This inference is supported by infrared thermometry data: as the input voltage increases from 20 V to 50 V, the external wall temperature of the reactor rises markedly, from 63 °C to 230 °C. This temperature variation trend provides direct evidence for the conversion of discharge energy into thermal energy.

2.1.2. Discharge Gap

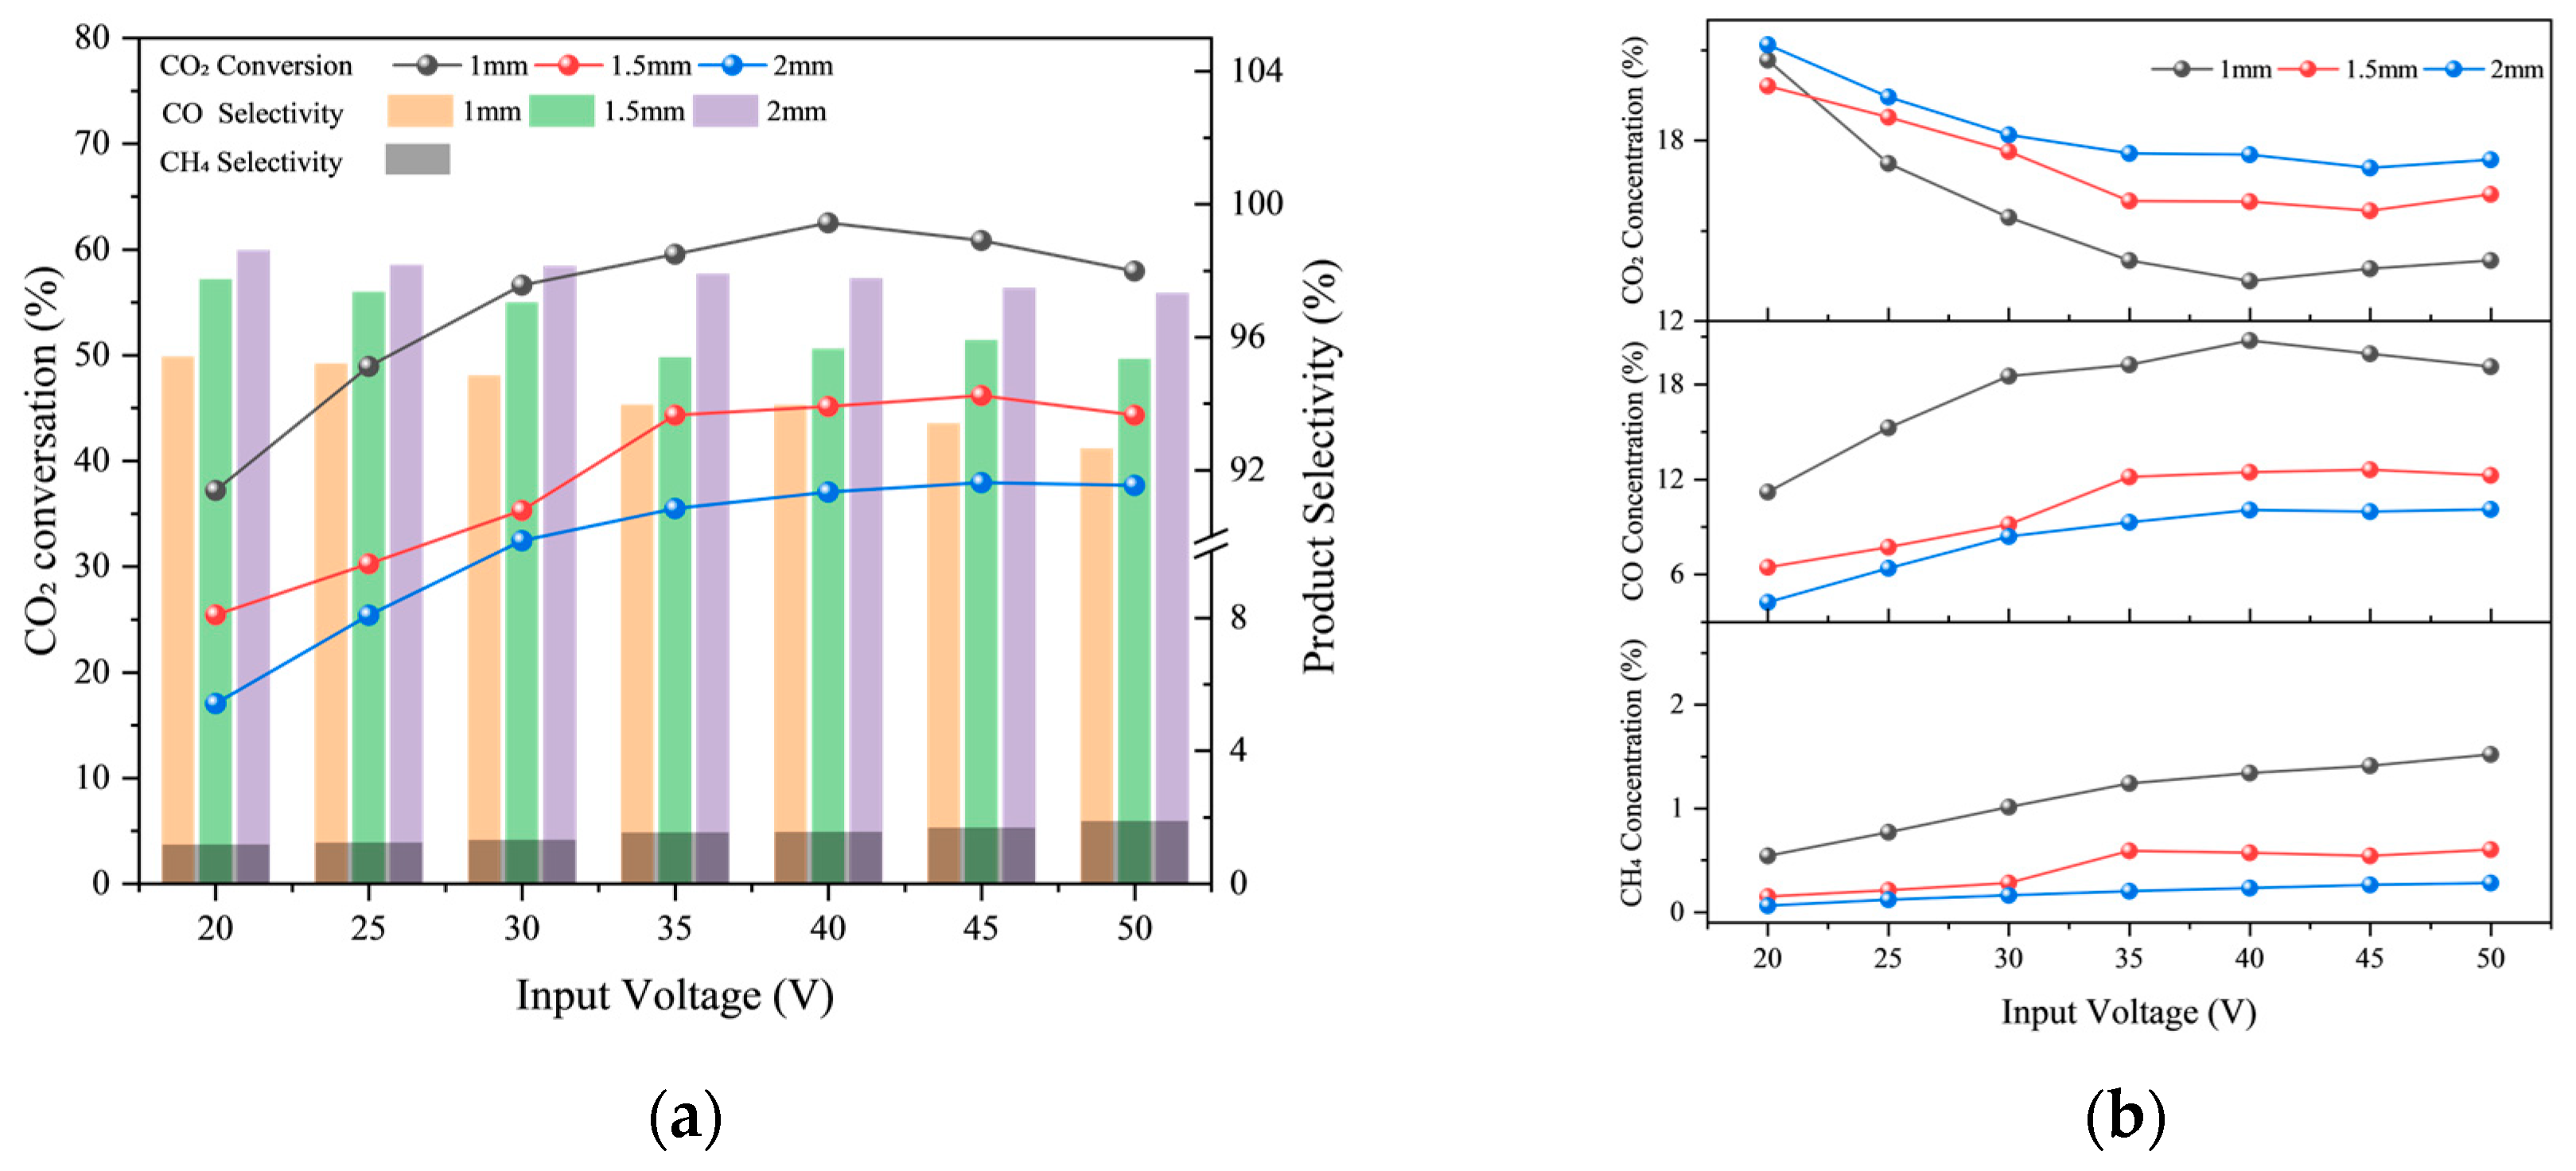
Figure 2 demonstrates the voltage-dependent CO2 hydrogenation performance under different discharge gaps. Experimental results reveal that across all tested gap distances (1–2 mm), the CO2 conversion rate follows a volcano-shaped trend, with increasing input voltage. This pattern suggests that when the reduced electric field strength exceeds a threshold value, while high-energy electrons promote CO2 dissociation, they may simultaneously trigger CO fragmentation into elemental carbon and recombination reactions between CO and O.
The experimental results demonstrate that reducing the discharge gap significantly enhances CO2 conversion under identical input voltage conditions. At 40 V input voltage, the CO2 conversion rate reaches 62.52% with a 1 mm gap, while decreasing to 45.14% and 37.04% for 1.5 mm and 2.0 mm gaps, respectively. This clearly indicates more intense discharge activity and greater voltage sensitivity at smaller gaps. This phenomenon can be explained through the reduced electric field (REF, defined as the ratio of electric field strength to particle number density in the discharge region). According to Equation (1), the discharge gap directly influences the REF, which, consequently, may alter the discharge characteristics in dielectric barrier discharge systems. The REF serves as a critical parameter that determines the amount of energy charged particles acquire from the electric field between successive collisions.
R E F = E g [ N ] = U g d g × 1 [ N ]
In the equation, E g represents the electric field strength in the gas gap (V/m), N denotes the gas density in the gas gap (m−3), U g denotes the voltage applied across the gas gap (V), while d g represents the distance f the discharge gas gap (m).
As described by Equation (1), a smaller discharge gap leads to a higher reduced electric field strength (E/N). The increased E/N enhances electron acceleration under the electric field, thereby elevating their kinetic energy. This promotes more effective collisions between electrons and CO2/H2 molecules, leading to enhanced ionization. The resulting free electrons and ions further intensify the discharge process, generating stronger current.
Moreover, the reduced gap increases particle density within the discharge space, making electron–ion collisions and ionization breakdown processes more frequent. This ultimately improves CO2 conversion efficiency.
The discharge gap also influences product distribution. When the gap decreases from 2 mm to 1 mm, CO selectivity declines, while CH4 selectivity increases. This shift may be attributed to the intensified discharge and confined reaction space, which increases hydrogen atom concentration in the reaction zone. Consequently, hydrogen atoms collide more readily with CO molecules, facilitating CH4 formation.
Notably, the 1 mm gap achieves peak CO2 conversion at 40 V, whereas the 1.5 mm and 2 mm gaps require 45 V to reach maximum conversion. This observation can be explained by charge transport mechanisms: larger discharge gaps increase charge migration distances, requiring higher input voltages to establish sufficient reduced electric field strength, by accumulating saturated surface charges on dielectrics.

2.1.3. Gas Flow Rate

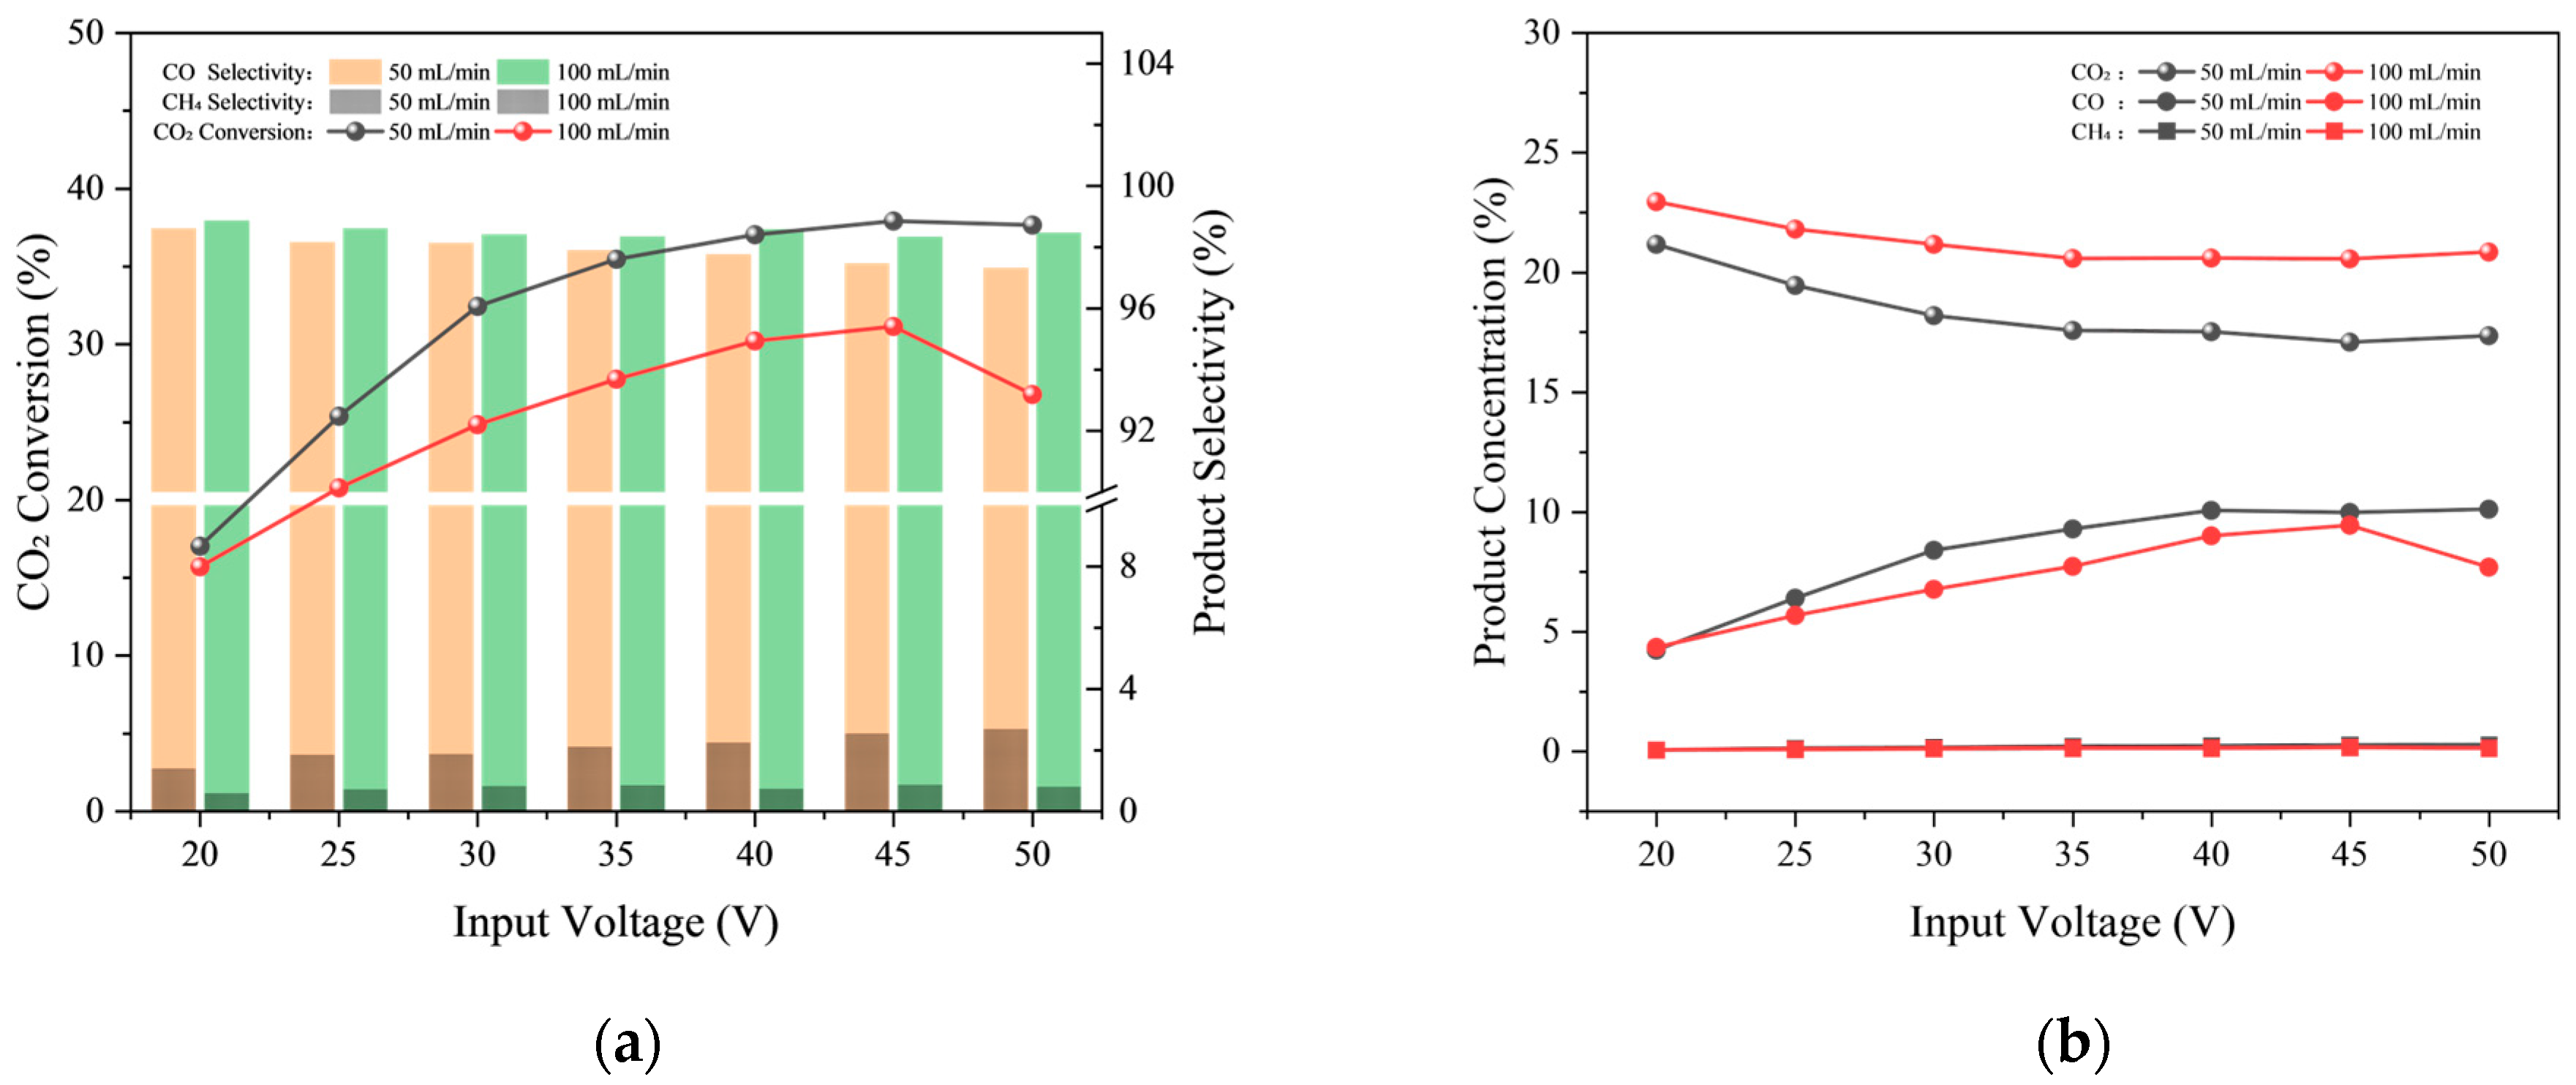
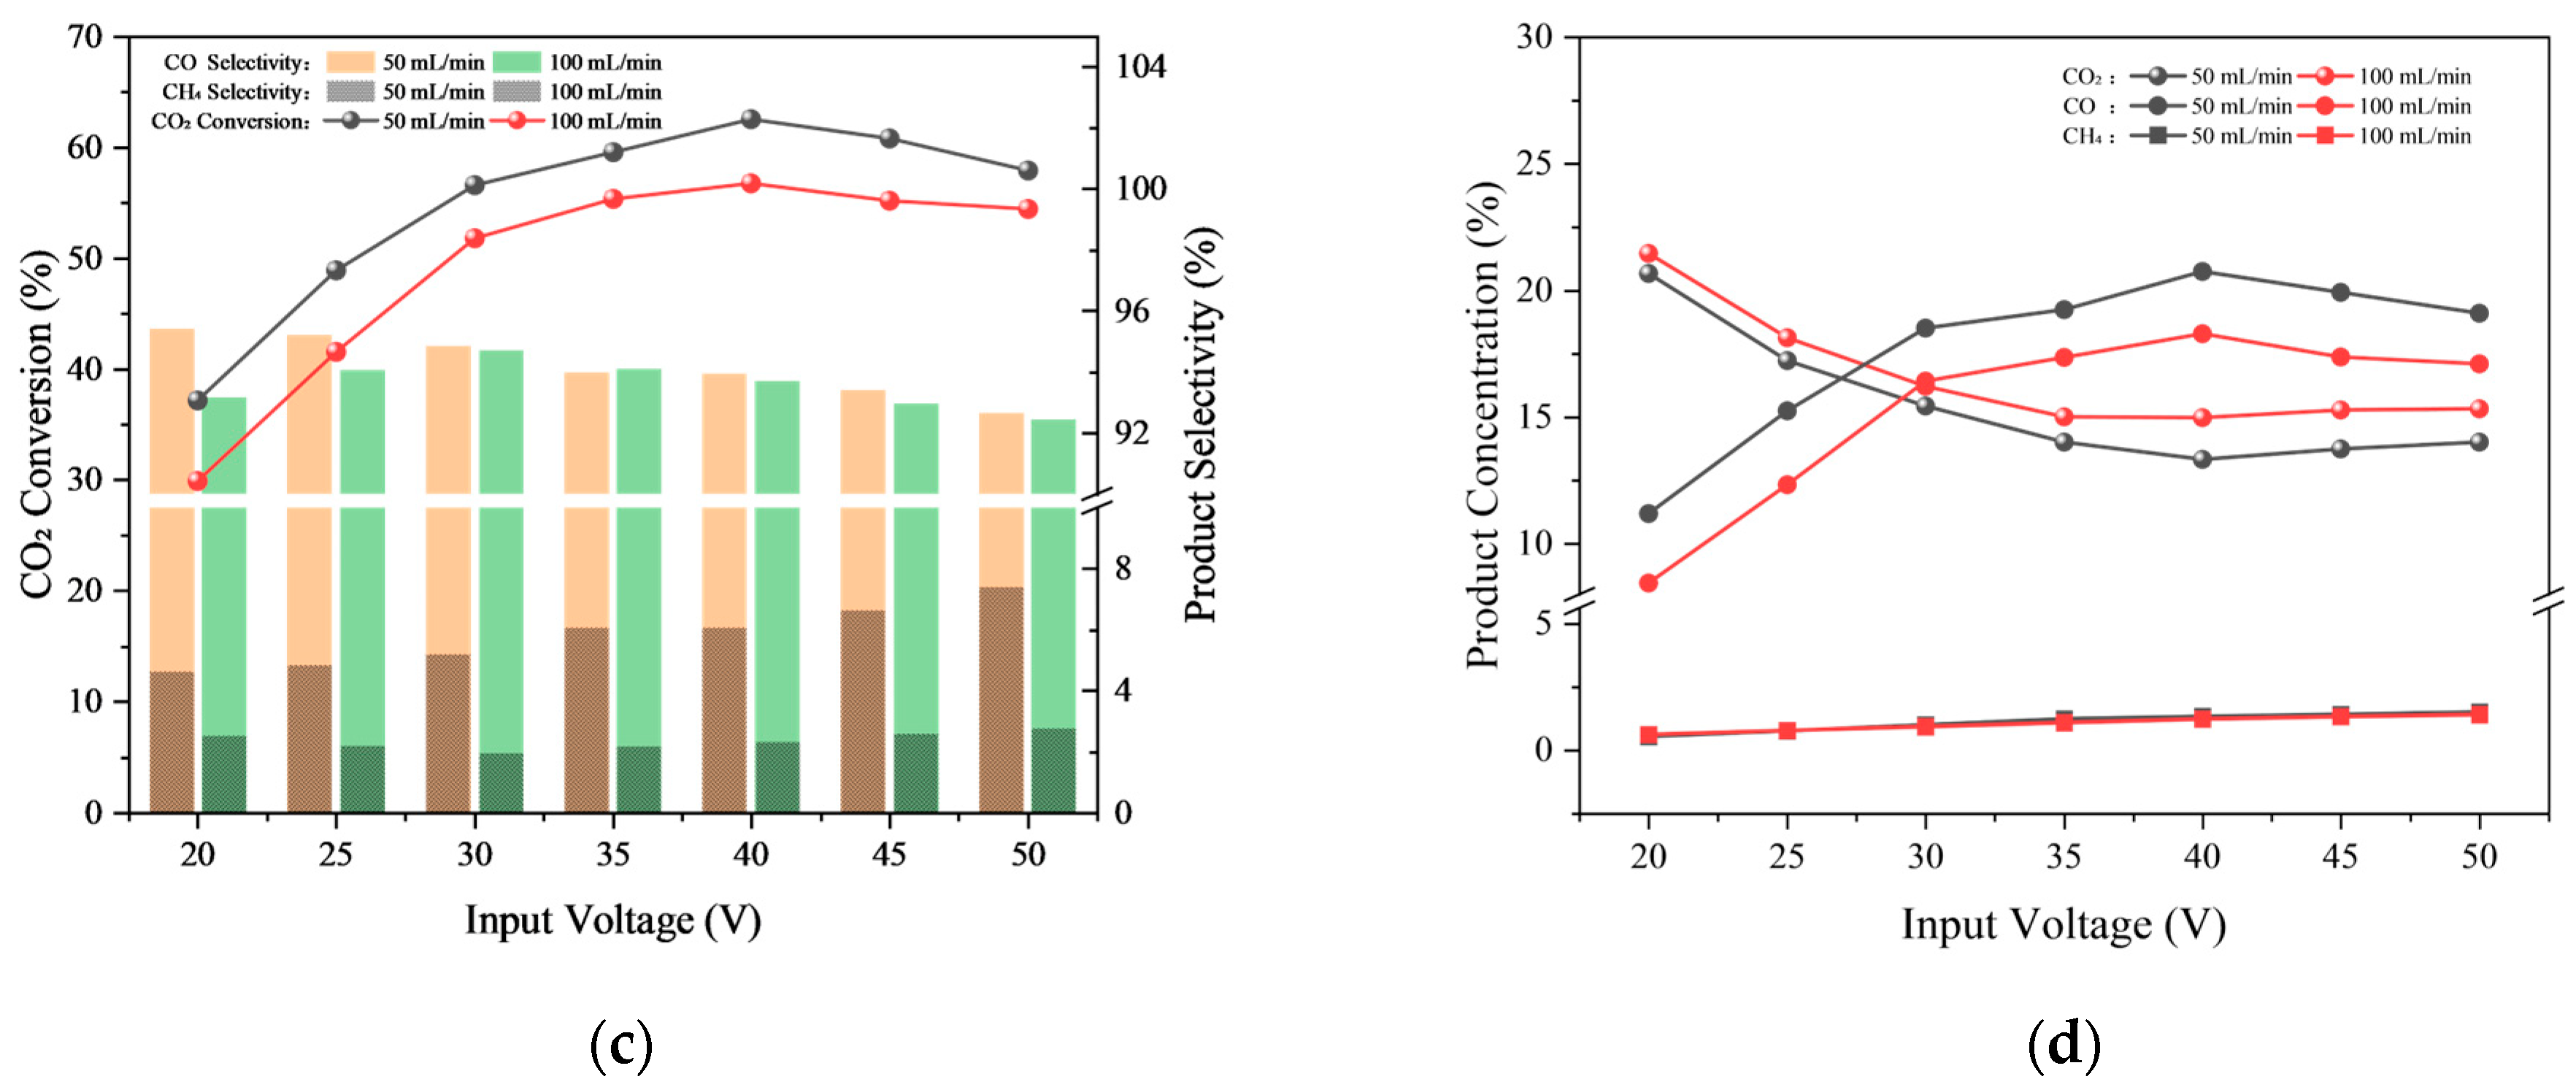
Figure 3 illustrates the effects of gas flow rate on CO2 conversion rate, CO selectivity, CH4 selectivity, and product concentrations, under different discharge gaps. The results demonstrate that with a 2 mm discharge gap, increasing the gas flow rate leads to a significant decrease in CO2 conversion. At a flow rate of 50 mL/min and input voltage of 45 V, the plasma discharge achieves a CO2 concentration of 17.09%. When the flow rate increases to 100 mL/min under the same voltage, the CO2 concentration rises to 20.57%. This phenomenon occurs because CO2 ionization is typically a time-dependent process. Higher flow rates reduce the gas residence time in the plasma zone, thereby shortening the interaction duration between gas molecules and plasma. Since plasma-driven reactions fundamentally rely on collisions and interactions between gas molecules and active species (e.g., free electrons, ions, radicals) within the plasma, reduced contact time limits CO2 molecules’ opportunities to fully react with these energetic species. Consequently, the CO2 conversion efficiency decreases.
Under a 1 mm discharge gap, the influence of gas flow rate on CO2 conversion performance is observed to be insignificant. This occurs because, despite the reduced residence time caused by increasing the flow rate (from 50 mL/min to 100 mL/min), the narrow discharge gap ensures that the gas remains in close proximity to the plasma source (e.g., high-energy electron regions near the electrodes). In such confined geometries, variations in flow rate have limited impact on the interaction between CO2 molecules and plasma-generated active species. Furthermore, the stronger electric field at a 1 mm gap creates a highly concentrated and intense plasma excitation zone, potentially leading to power saturation. Under these conditions, even at higher flow rates, the dense distribution of energetic electrons and reactive particles within the plasma ensures effective gas–plasma interactions. Consequently, within the tested flow rate range (50–100 mL/min), the CO2 conversion rate remains relatively stable for small discharge gaps.

2.1.4. Gas Composition

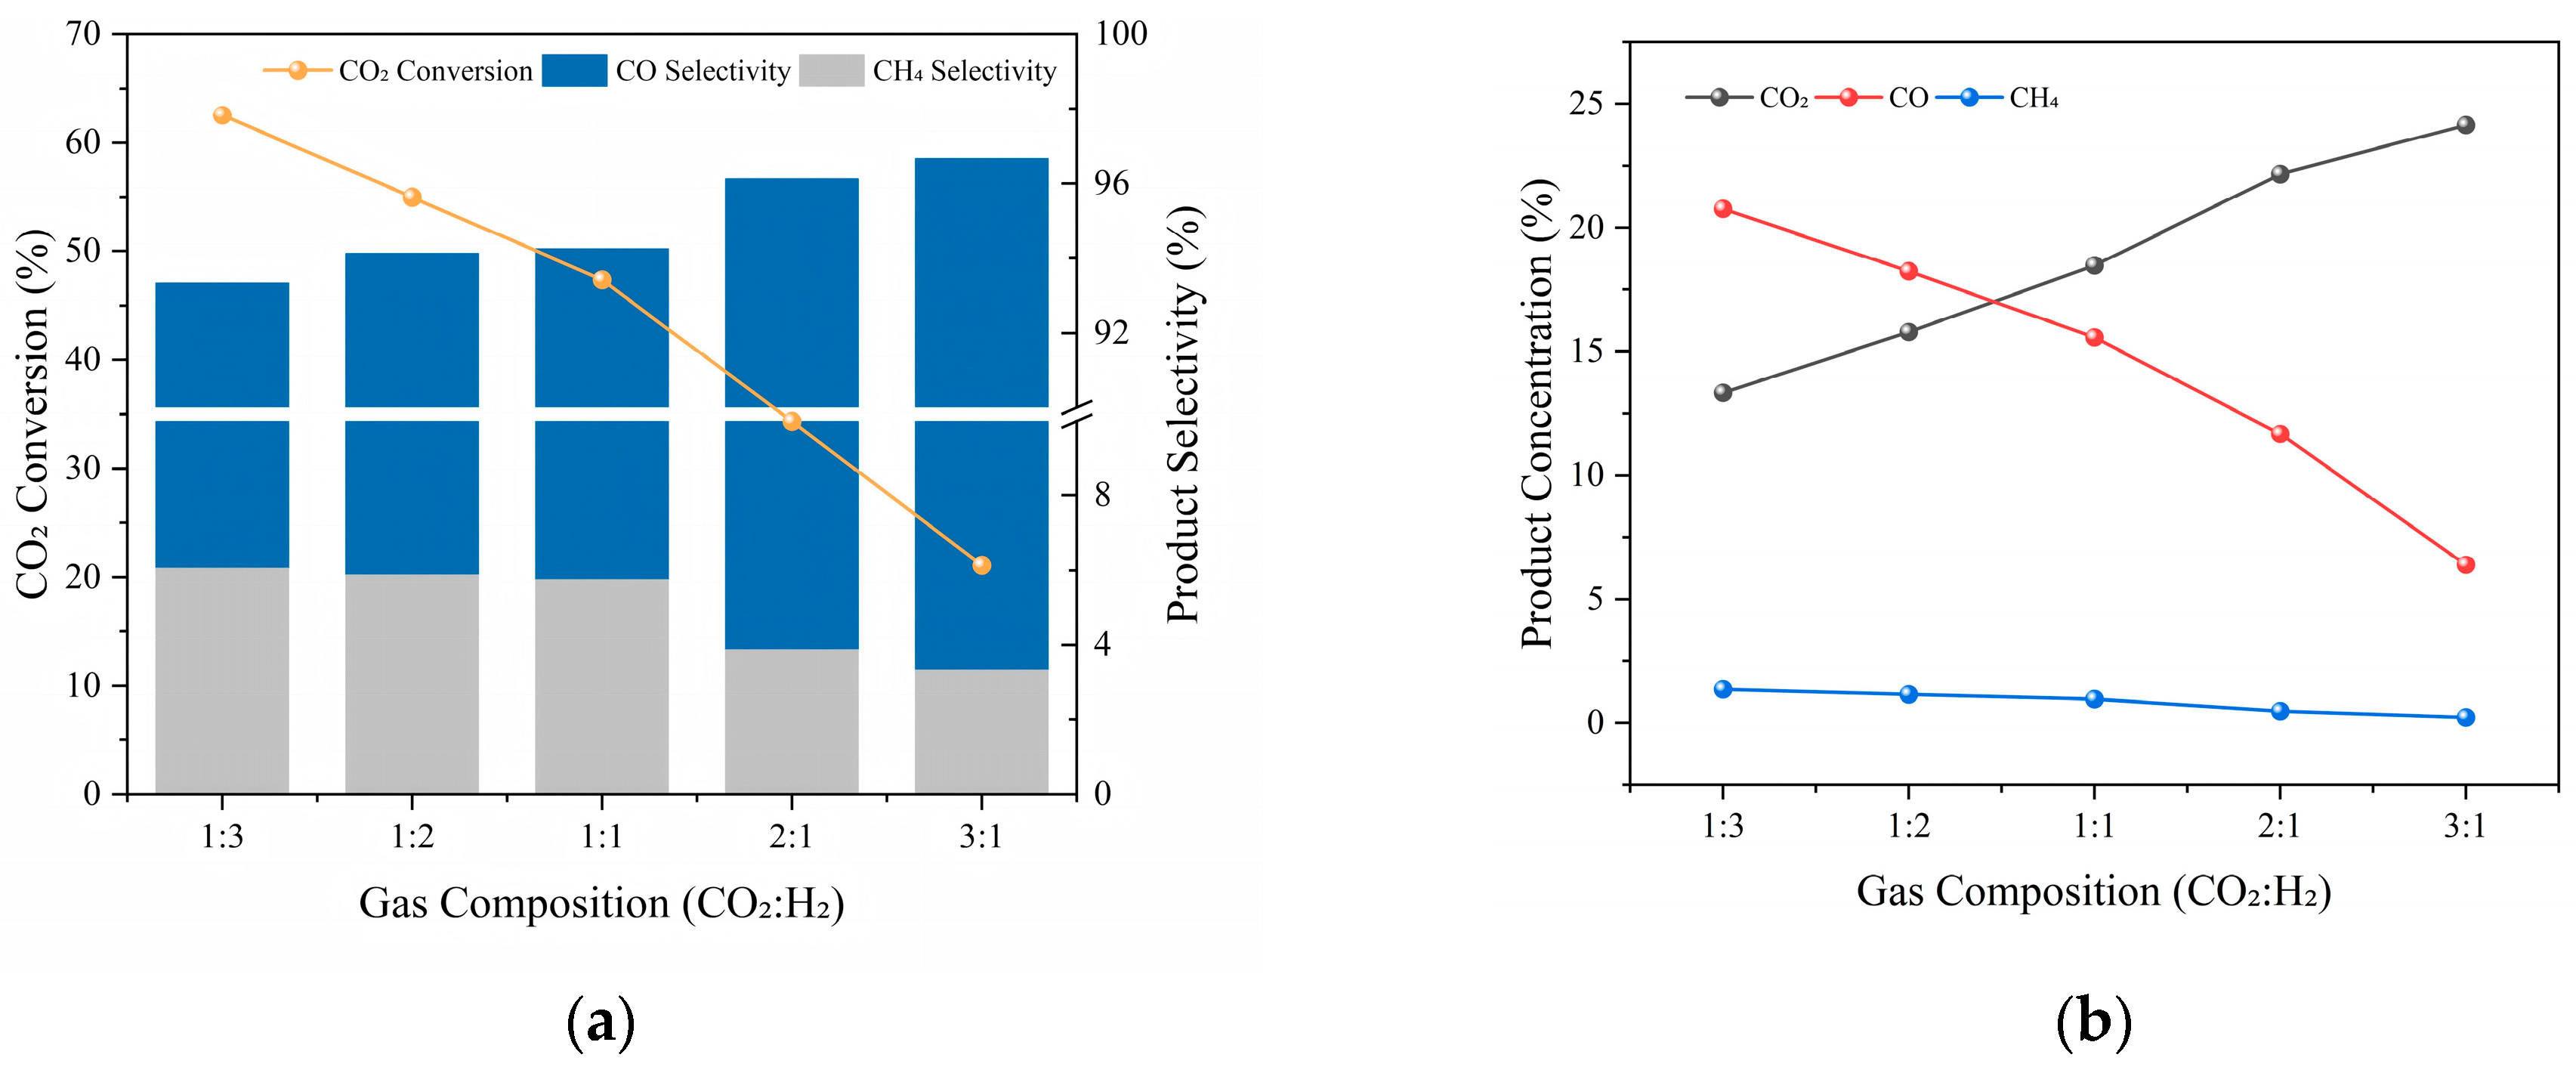
Figure 4 illustrates the effect of CO2/H2 ratio on CO2 hydrogenation performance under fixed conditions: 1 mm discharge gap, 50 mL/min gas flow rate, and 40 V input voltage. Experimental results reveal that as the H2 content increases, the CO2 conversion efficiency shows significant enhancement, rising from 21.09% at the initial CO2/H2 ratio of 3:1 to 62.52% at 1:3. Product distribution analysis indicates that CO remains the dominant product (>93% selectivity), while CH4 selectivity exhibits a modest increase, from 3.33% to 6.06%.
In the CO2 hydrogenation system, H2 acts as the critical reducing agent for generating CO and CH4. The study demonstrates that higher H2 proportions substantially elevate the concentration of active hydrogen species, thereby boosting CO2 conversion efficiency. Mechanistic analysis suggests that H2 concentration significantly influences reaction pathway selection: (1) under H2-lean conditions, CO2 dissociation into CO and the reverse water–gas shift reaction dominate; and (2) with increasing H2, the enhanced reducing environment not only improves CO2 conversion, but also promotes deeper hydrogenation, leading to higher CH4 selectivity—a trend consistent with thermodynamic equilibrium predictions [22].

2.2. Research on Thermocatalytic Hydrogenation of CO/CO2 Mixtures for Methanol Synthesis

As previously stated, the research objective of this study is to develop an efficient reaction system for CO2 hydrogenation to methanol through low-temperature plasma-assisted thermocatalysis. Our preliminary investigations have demonstrated that DBD plasma activation can efficiently convert CO2 into syngas dominated by CO. Building upon these findings, this section focuses on investigating the methanol synthesis process from syngas in the downstream thermocatalytic module.
The experiments employed a self-developed copper-based catalyst system to systematically examine the effects of temperature (180~280 °C) and syngas composition (CO:CO2:H2 ratios) on the space–time yield (STY) of methanol. Through combined catalyst characterization and density functional theory (DFT) calculations, we further elucidate the performance advantages of CO-dominated syngas over direct CO2 hydrogenation for methanol synthesis.

2.2.1. CO/CO2

Throughout the reaction process, CO2 and H2 are first converted into syngas (primarily composed of CO) via the DBD plasma module, which is then fed into a fixed-bed reactor for methanol synthesis. Previous studies have demonstrated that CO, as a key intermediate, participates in thermocatalytic methanol synthesis with significantly higher efficiency, compared to direct CO2 utilization [25,26]. Therefore, investigating the influence of CO concentration in syngas on methanol yield is crucial for optimizing reaction conditions.
This study employs a Cu/ZnO/Al2O3 (CZA) ternary catalyst under fixed conditions (3 MPa, 180~280 °C, 6000 mL/(gcat·h)) to investigate the synergistic effects of CO/CO2 ratio (maintaining COX:H2 = 1:3) and temperature, on catalytic performance.
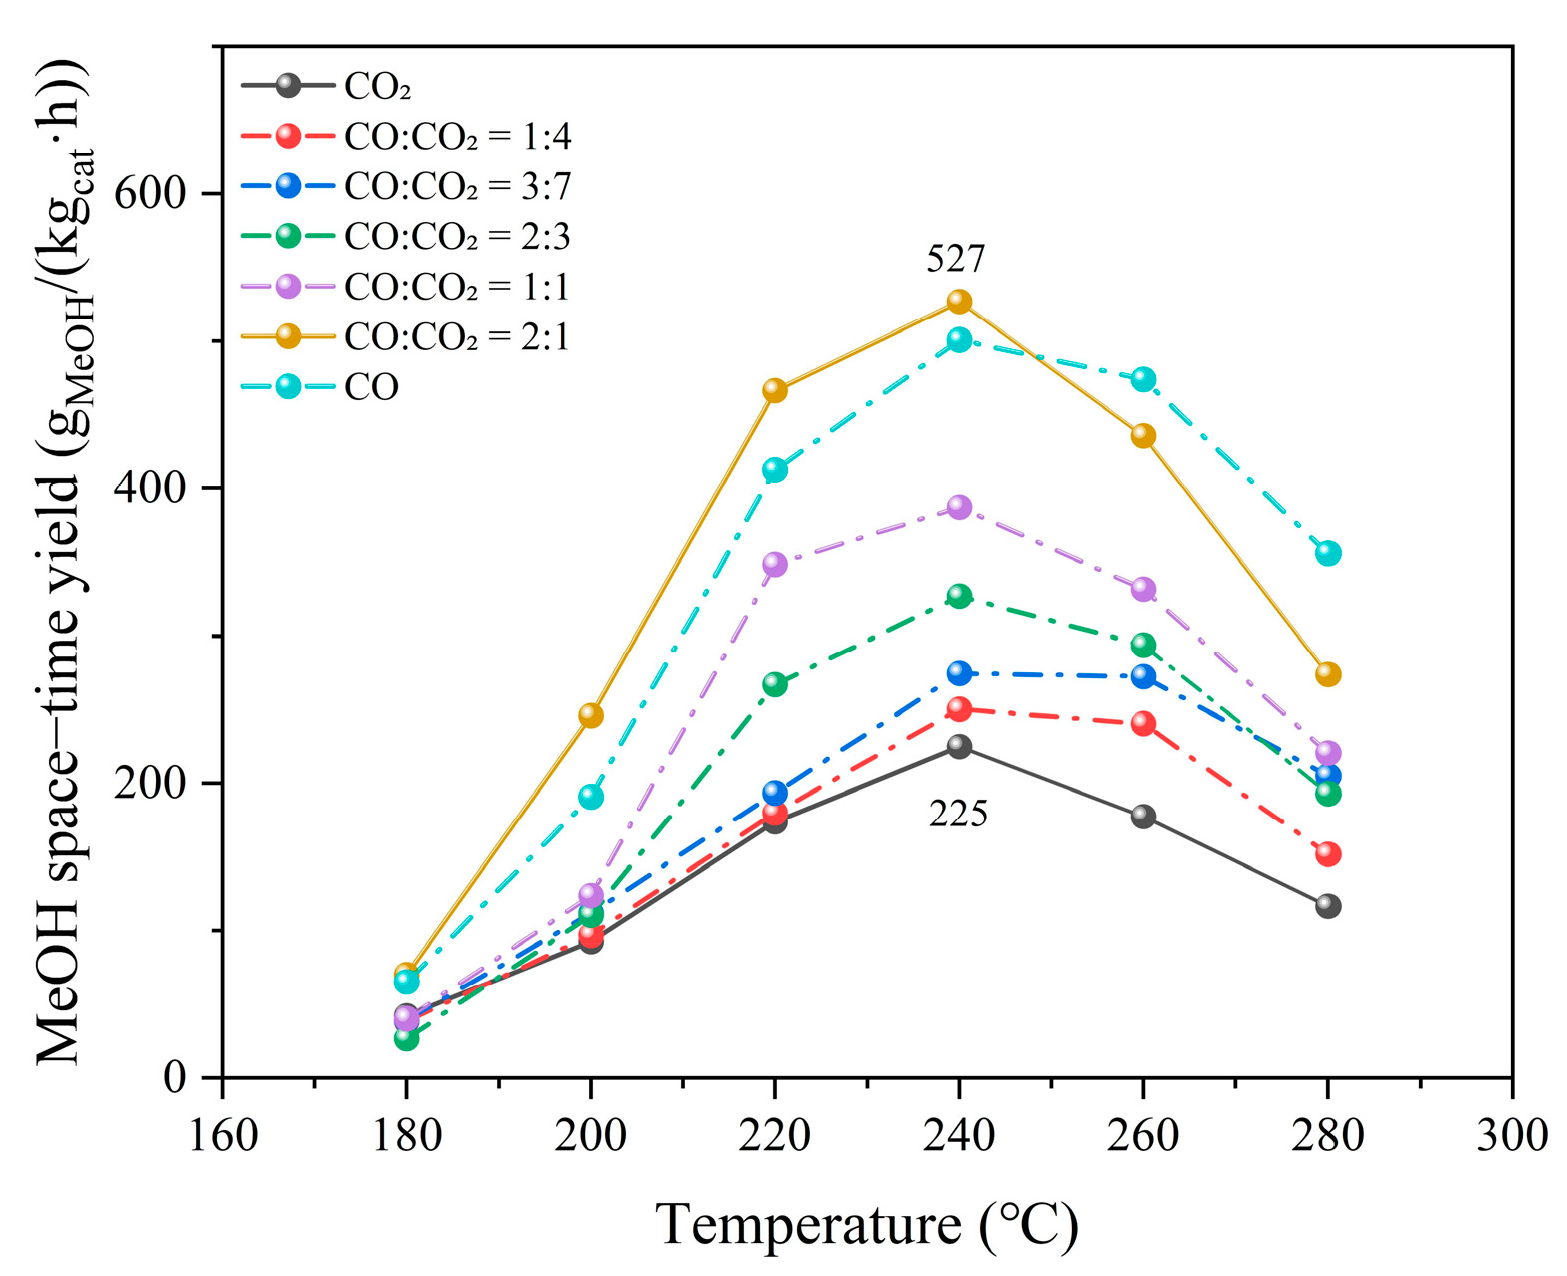
As shown in Figure 5, the introduction of CO significantly enhances methanol yield compared to the pure CO2 hydrogenation system. The methanol STY increases with higher CO concentration in the feed gas, reaching a peak value of 527 gMeOH/(kgcat·h) at CO:CO2:H2 = 2:1:9, confirming CO’s promotional effect on methanol synthesis.
Figure 5 reveals that methanol yield follows similar volcano-shaped curves across different CO:CO2 ratios, with optimal performance consistently achieved at 240 °C—indicating this temperature as the catalytic sweet spot for CZA-01. Figure 5 details the CO:CO2 ratio effects at 240 °C, showing methanol yield first increases then decreases with rising CO concentration, attributable to the following:
Competitive adsorption: CO preferentially occupies active sites over CO2, shifting the carbon source for methanol from CO2 to CO. The lower activation energy of CO hydrogenation pathway enhances methanol formation.
Redox modulation: CO-rich atmospheres maintain Cu0 as dominant active sites (proven more effective for methanol synthesis [27]), while CO2-rich conditions promote Cu+ formation, due to its mild oxidative property.
Reaction pathway control: increased CO suppresses the RWGS of CO2, redirecting more CO2 toward methanol production.
Notably, trace CO2 (10–20%) in CO-dominated feeds unexpectedly boosts methanol yield compared to pure CO, likely because minor CO2 prevents over-reduction of copper sites by CO/H2, preserving optimal Cu0/Cu+ balance for hydrogenation activity.

2.2.2. Surface Chemical State Analysis

To elucidate the mechanistic role of CO addition in enhancing methanol yield, XPS analysis was conducted to compare the chemical state evolution of the CZA catalyst under two distinct reaction atmospheres: (1) CO2/H2 system (CO2:H2 = 1:3); and (2) CO/CO2/H2 mixed system (CO:CO2:H2 = 2:1:9).
XPS analysis reveals the chemical states of surface species on the catalyst. Figure 6 displays the XPS spectra of the CZA catalyst after reaction under two gas atmospheres. The Cu 2p spectra exhibit characteristic Cu 2p3/2 and Cu 2p1/2 peaks, both containing shoulder peaks corresponding to Cu(0), Cu2O, and CuO.
A distinctive feature is the presence of satellite peaks (shake-up peaks) following the main peaks, which are fingerprints of Cu2+ species and are specifically observed in CuO. These satellite peaks serve to distinguish Cu(II) from Cu(I) and Cu(0), indicating partial oxidation of the catalyst under both reaction atmospheres.
In Figure 6a, more pronounced CuO shoulder peaks (934.6 eV) and stronger shake-up peaks (944.48 eV) are observed, demonstrating that the catalyst experienced more significant oxidation of Cu(0) to Cu(II) in the CO2-dominated reaction system.

2.2.3. DFT

The oxidation state of active Cu centers varies under different gas atmospheres. In CO2-rich systems, Cu shows higher oxidation states (Cu2+), while CO/CO2 mixtures maintain lower oxidation states (Cu0/Cu+). Accordingly, two models were established: a CuO crystal-facet model representing Cu2+ in CO2 systems, and a partially reduced model for Cu0/Cu+ in CO/CO2 mixtures.
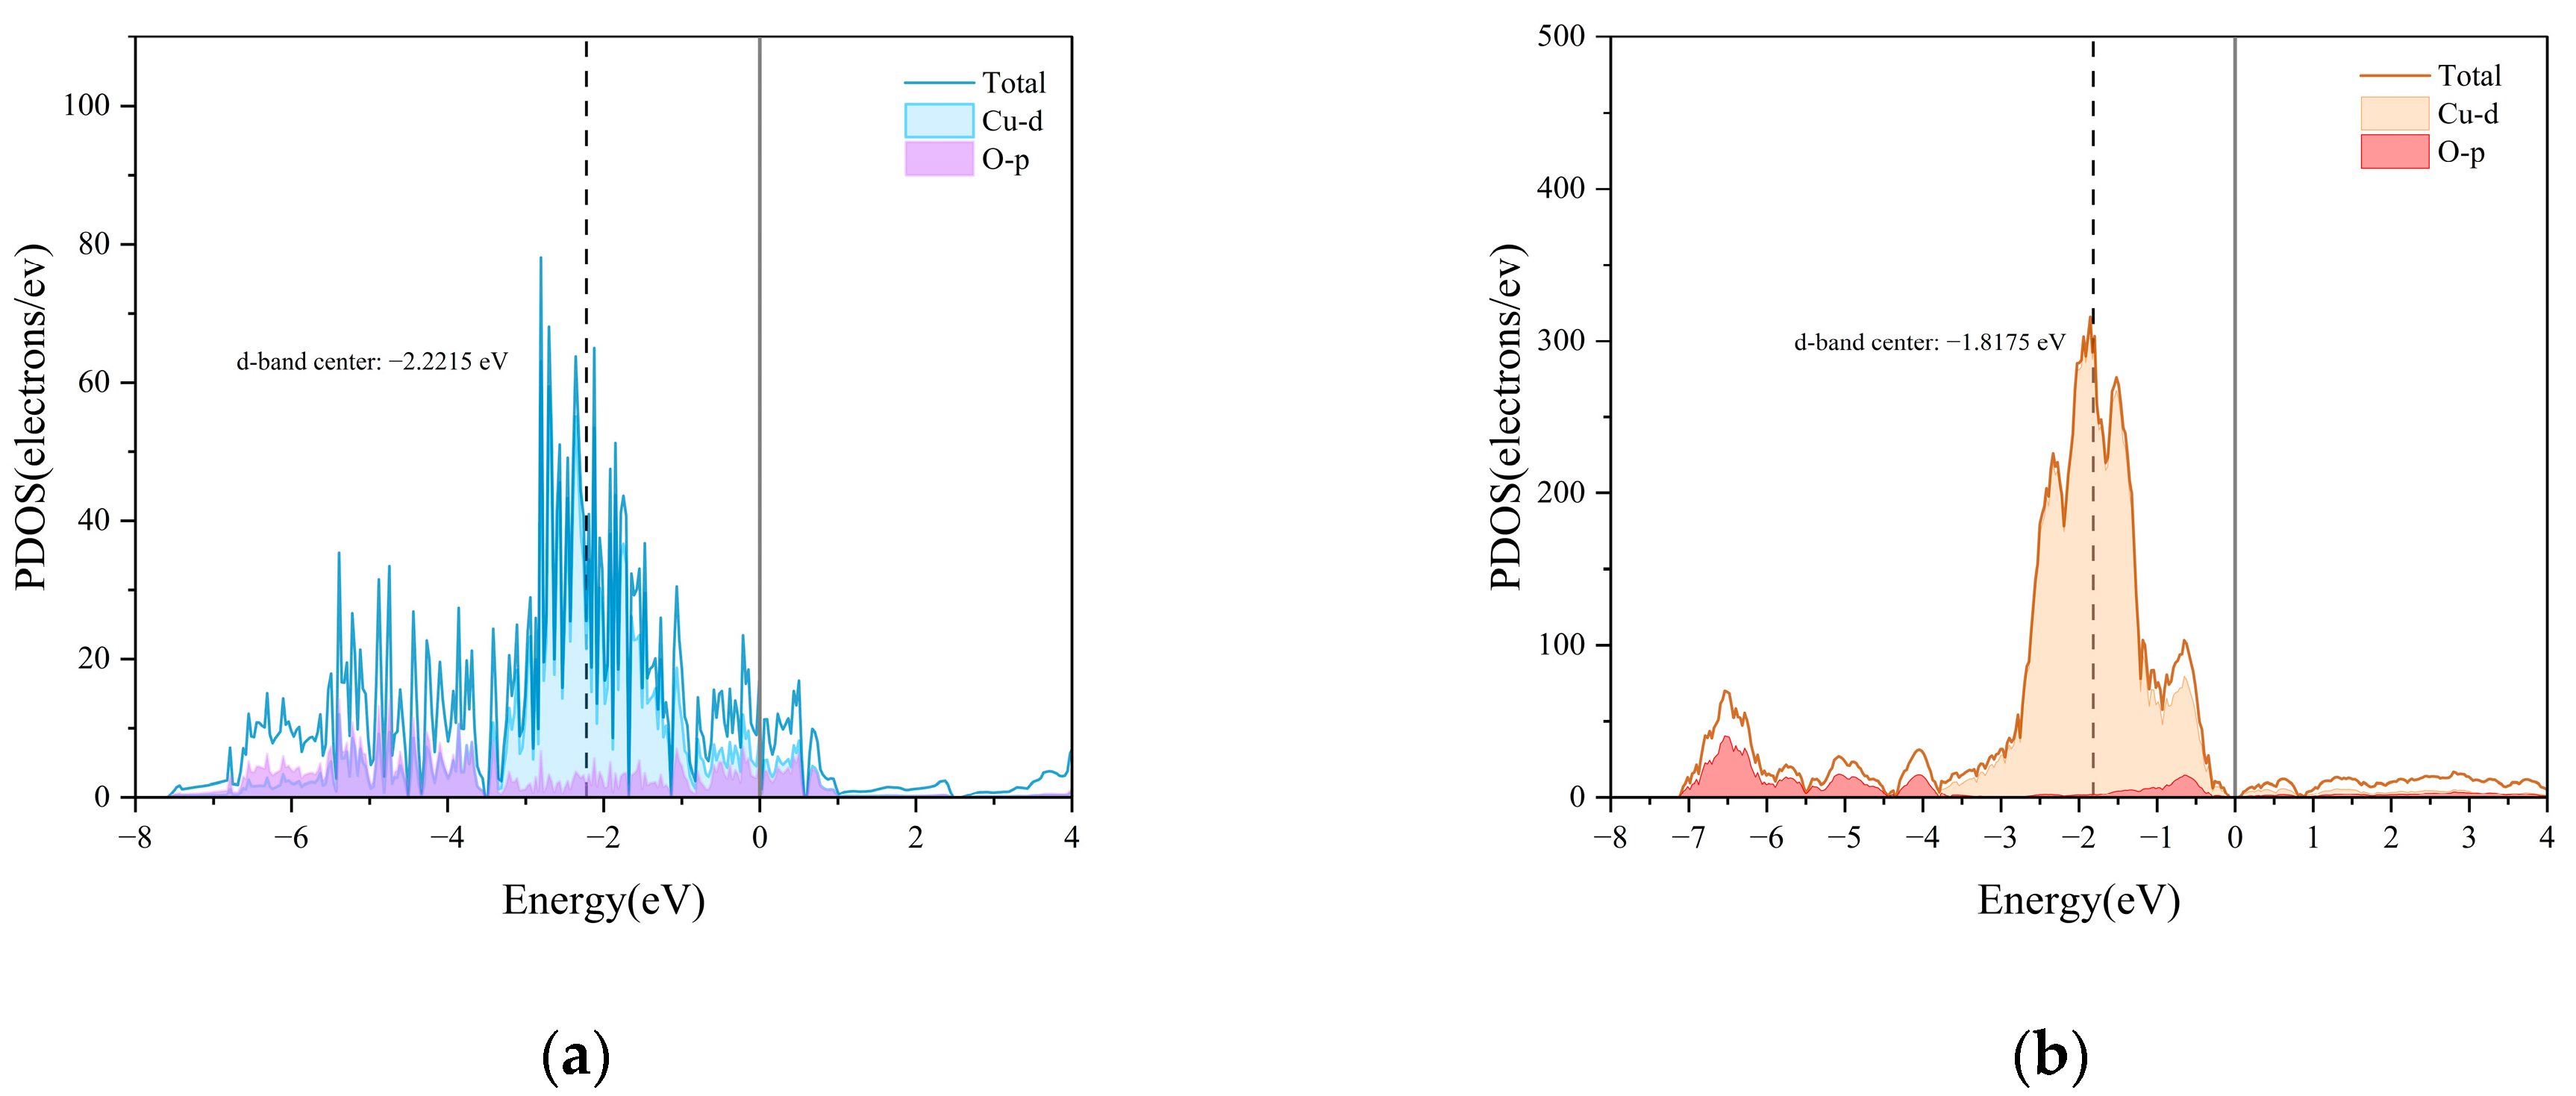
Figure 7 presents the density of states calculations for both models. Comparative analysis reveals that the partially reduced model exhibits an upward shift in the d-band center of active Cu sites compared to the CuO model, with energy levels closer to the Fermi level. According to surface catalysis theory, the relative position of the d-band center to the Fermi level directly regulates the adsorption strength of reactant molecules on the catalyst surface: an upward shift in the d-band center results in an electronic structure more favorable for activating reactant adsorption. This indicates that catalysts with higher Cu0 character demonstrate superior activity. The results further confirm that the CO/CO2 mixed system effectively enhances the reduced state of surface Cu active sites during hydrogenation, thereby improving overall catalytic activity.
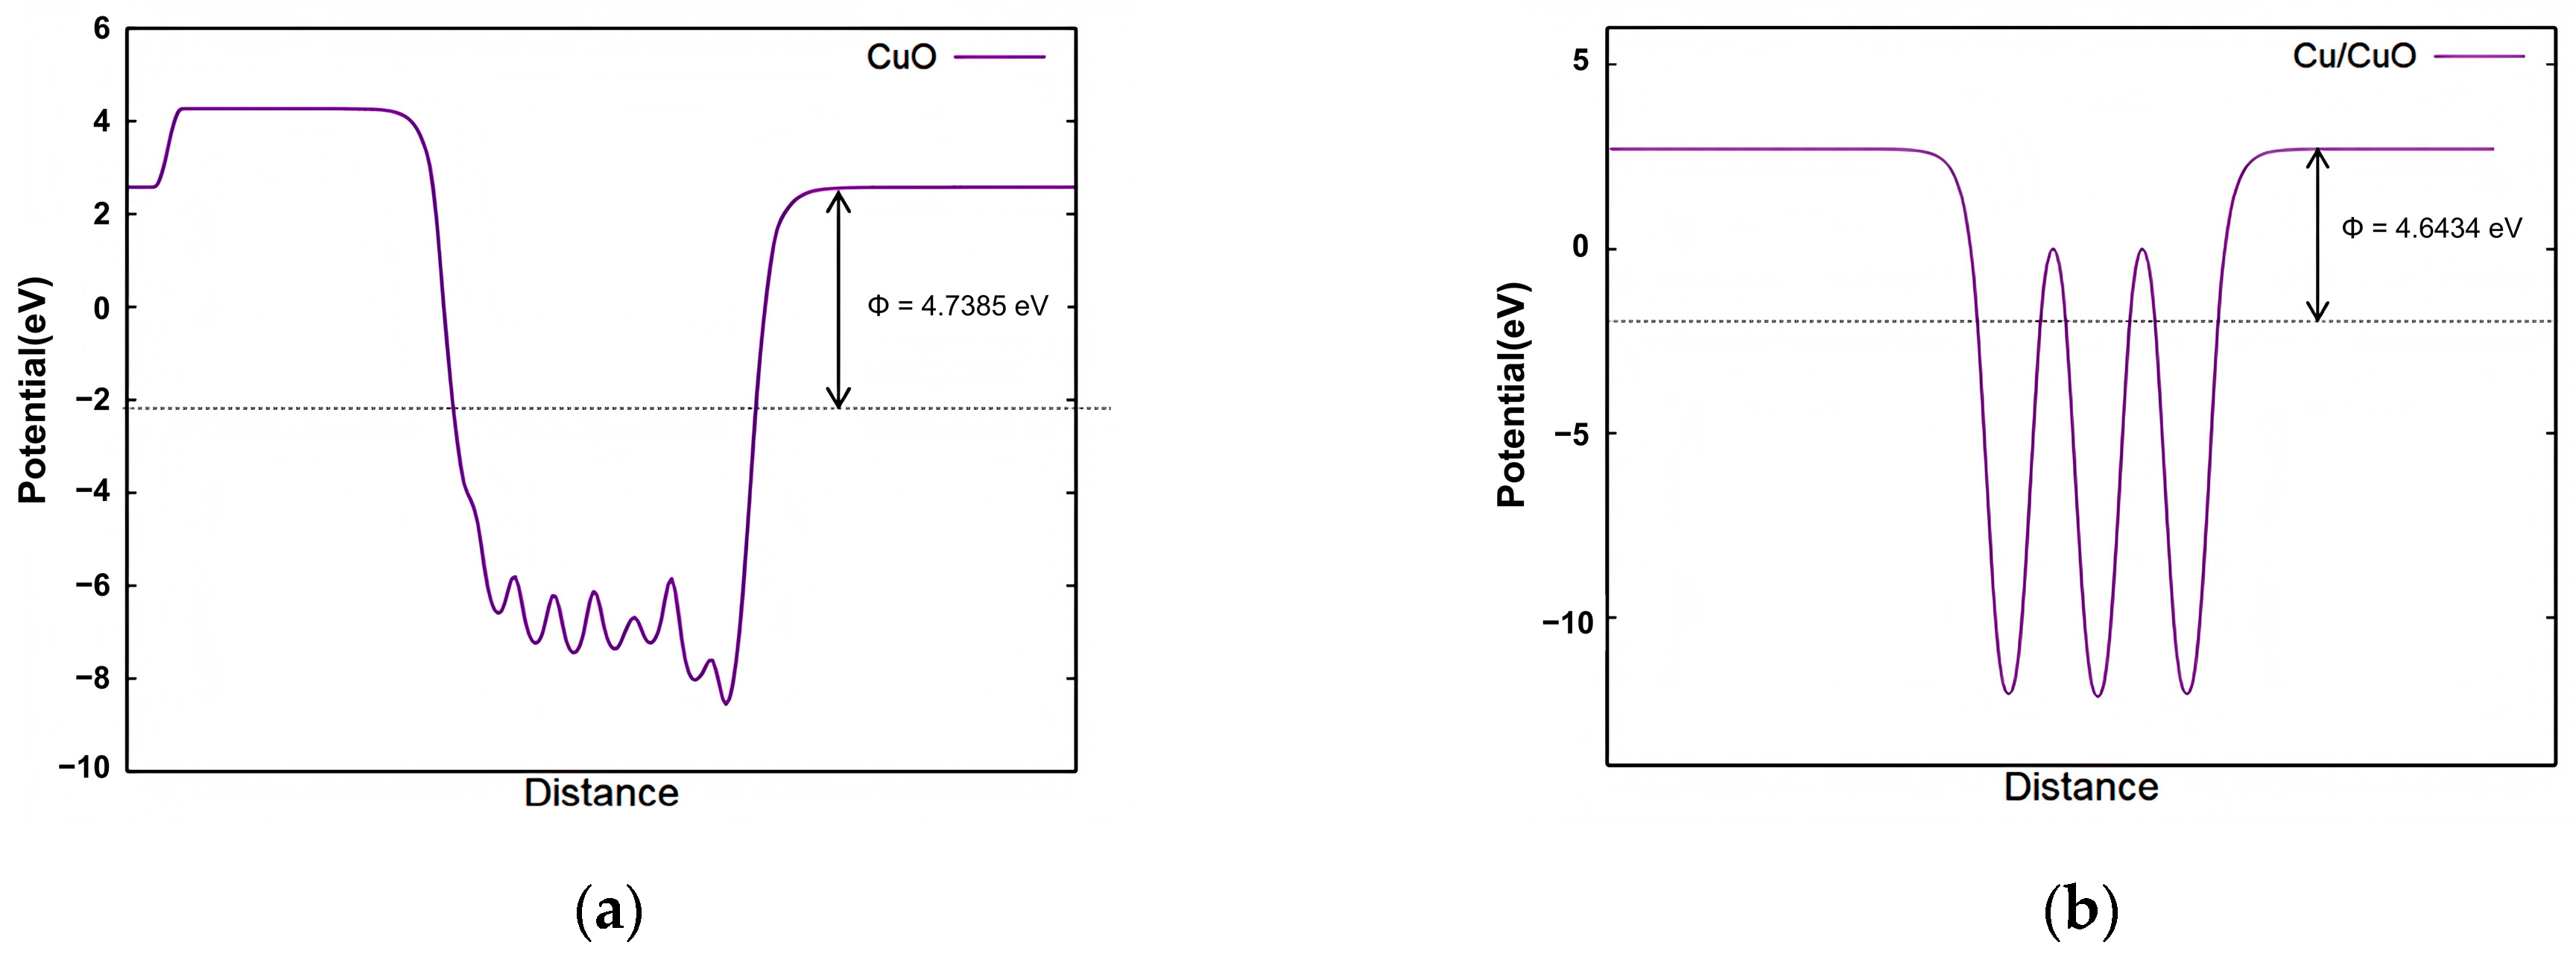
Figure 8 presents the work function ( Φ ) calculations for both models. In the CuO model, the potential energy shows a sharp decline near the surface, stabilizing at approximately −8 eV from an initial 4 eV, forming a deep potential well. This significant energy variation indicates a large surface–vacuum energy difference. The calculated work function Φ of 4.7385 eV reflects the high energy required for electron emission from the CuO surface, suggesting restricted electron transfer and substantial energy barriers for catalytic reactions.
In contrast, the partially reduced model exhibits smaller potential fluctuations of around −10 eV, without deep potential wells, indicating more uniform and stable electron distribution. With a lower work function Φ (4.6434 eV), this model facilitates easier electron transfer from the surface, enhancing reactant interactions and catalytic activity. The comparative results demonstrate that the Cu0/Cu+ interface in the mixed system promotes electron mobility, thereby improving reaction efficiency.
Current CO2 hydrogenation proceeds primarily through two pathways: the RWGS route and the formate pathway. Since this study focuses on syngas-to-methanol conversion, DFT calculations adopted the RWGS route as the elementary reaction steps for methanol formation. Specifically, CO2 first adsorbs on the catalyst surface, forming *CO2, which undergoes hydrogenation to generate the *COOH intermediate. Subsequent hydrogenation cleaves the C-OH bond to produce *CO, which then undergoes further hydrogenation steps, to ultimately form CH3OH.
Figure 9 presents the reaction energy profiles for CO2 hydrogenation on different catalyst surfaces (CuO vs. Cu/CuO). The CuO surface exhibits higher energy barriers, particularly at the transition states from *COOH to *CO, and further to *CHO, indicating significant energetic obstacles. In contrast, the Cu/CuO surface shows lower activation energies, with more stable intermediates and smoother transitions from CO2 to *COOH, suggesting facilitated reaction progression with reduced energy consumption.
These DFT results confirm that the CO/CO2 mixed system demonstrates superior catalytic activity compared to pure CO2 hydrogenation. This enhancement primarily stems from CO’s ability to inhibit CO2-induced oxidation of active Cu sites, maintaining them in a reduced state. Compared to oxidized active centers, CO adsorption on reduced Cu sites involves lower energy barriers, thereby preferentially promoting methanol formation.

2.3. Non-Thermal Plasma–Thermal Catalysis Synergistic System Experiment

The previous studies independently characterized the DBD plasma module (for CO2 hydrogenation to CO) and the thermal catalytic-methanol synthesis module (for CO/CO2 hydrogenation to methanol). To elucidate the overall system performance, this section further investigates the cross-module synergistic effects by establishing a dual-variable regulation system of “plasma input voltage–thermal catalytic reaction temperature”, with which the inter-module coupling effects on the integrated system performance are thoroughly analyzed.
The specific reaction conditions were as follows:
The DBD plasma module operated with a CO2:H2 = 1:3 feed gas mixture at a flow rate of 50 mL/min, under an input voltage of 30–40 V. The thermal catalytic module was loaded with 0.4 g of CZA-01 catalyst, and operated at 3 MPa pressure within a temperature range of 180–280 °C, with a weight hourly space velocity (WHSV) of 6000 mL·gcat−1·h−1.
Figure 10 shows the variations in the overall CO2 conversion rate, methanol selectivity, and methanol yield of the system under different input voltage-reaction temperature conditions. As can be seen from the figure, the input voltage of the plasma module has a decisive influence on the CO2 conversion rate. The CO2 conversion rate at 40 V is higher than at other voltages, which is consistent with the independent experimental results of the plasma module, confirming that the input voltage dominates the CO2 activation process by regulating the discharge power and electric field strength. In contrast, the reaction temperature of the thermal catalytic module has a relatively limited effect on the CO2 conversion rate (fluctuations in CO2 conversion rate are less than 5% across different voltage conditions), indicating that the reaction temperature of the thermal catalytic module primarily affects the CO hydrogenation process. This is reflected in the volcano-shaped curve of methanol selectivity, which first increases and then decreases with rising reaction temperature.
In the range of 180~240 °C, the CO hydrogenation activity significantly increases, leading to a sharp decrease in CO concentration at the inlet of the thermal catalytic module and a substantial rise in methanol concentration. At 240 °C, the methanol selectivity and yield simultaneously reach their optimal values. When the reaction temperature exceeds 240 °C, the methanol selectivity further declines, due to the thermodynamic equilibrium limitation of the exothermic methanol synthesis reaction from CO. This synergistic mechanism—where the plasma module dominates CO2 conversion, while the thermal catalytic module regulates methanol selectivity—enables the system to achieve the highest methanol yield (502 gMeOH·kgcat−1·h−1) under the conditions of 40 V and 240 °C.

3. Materials and Methods

3.1. Experimental Setup

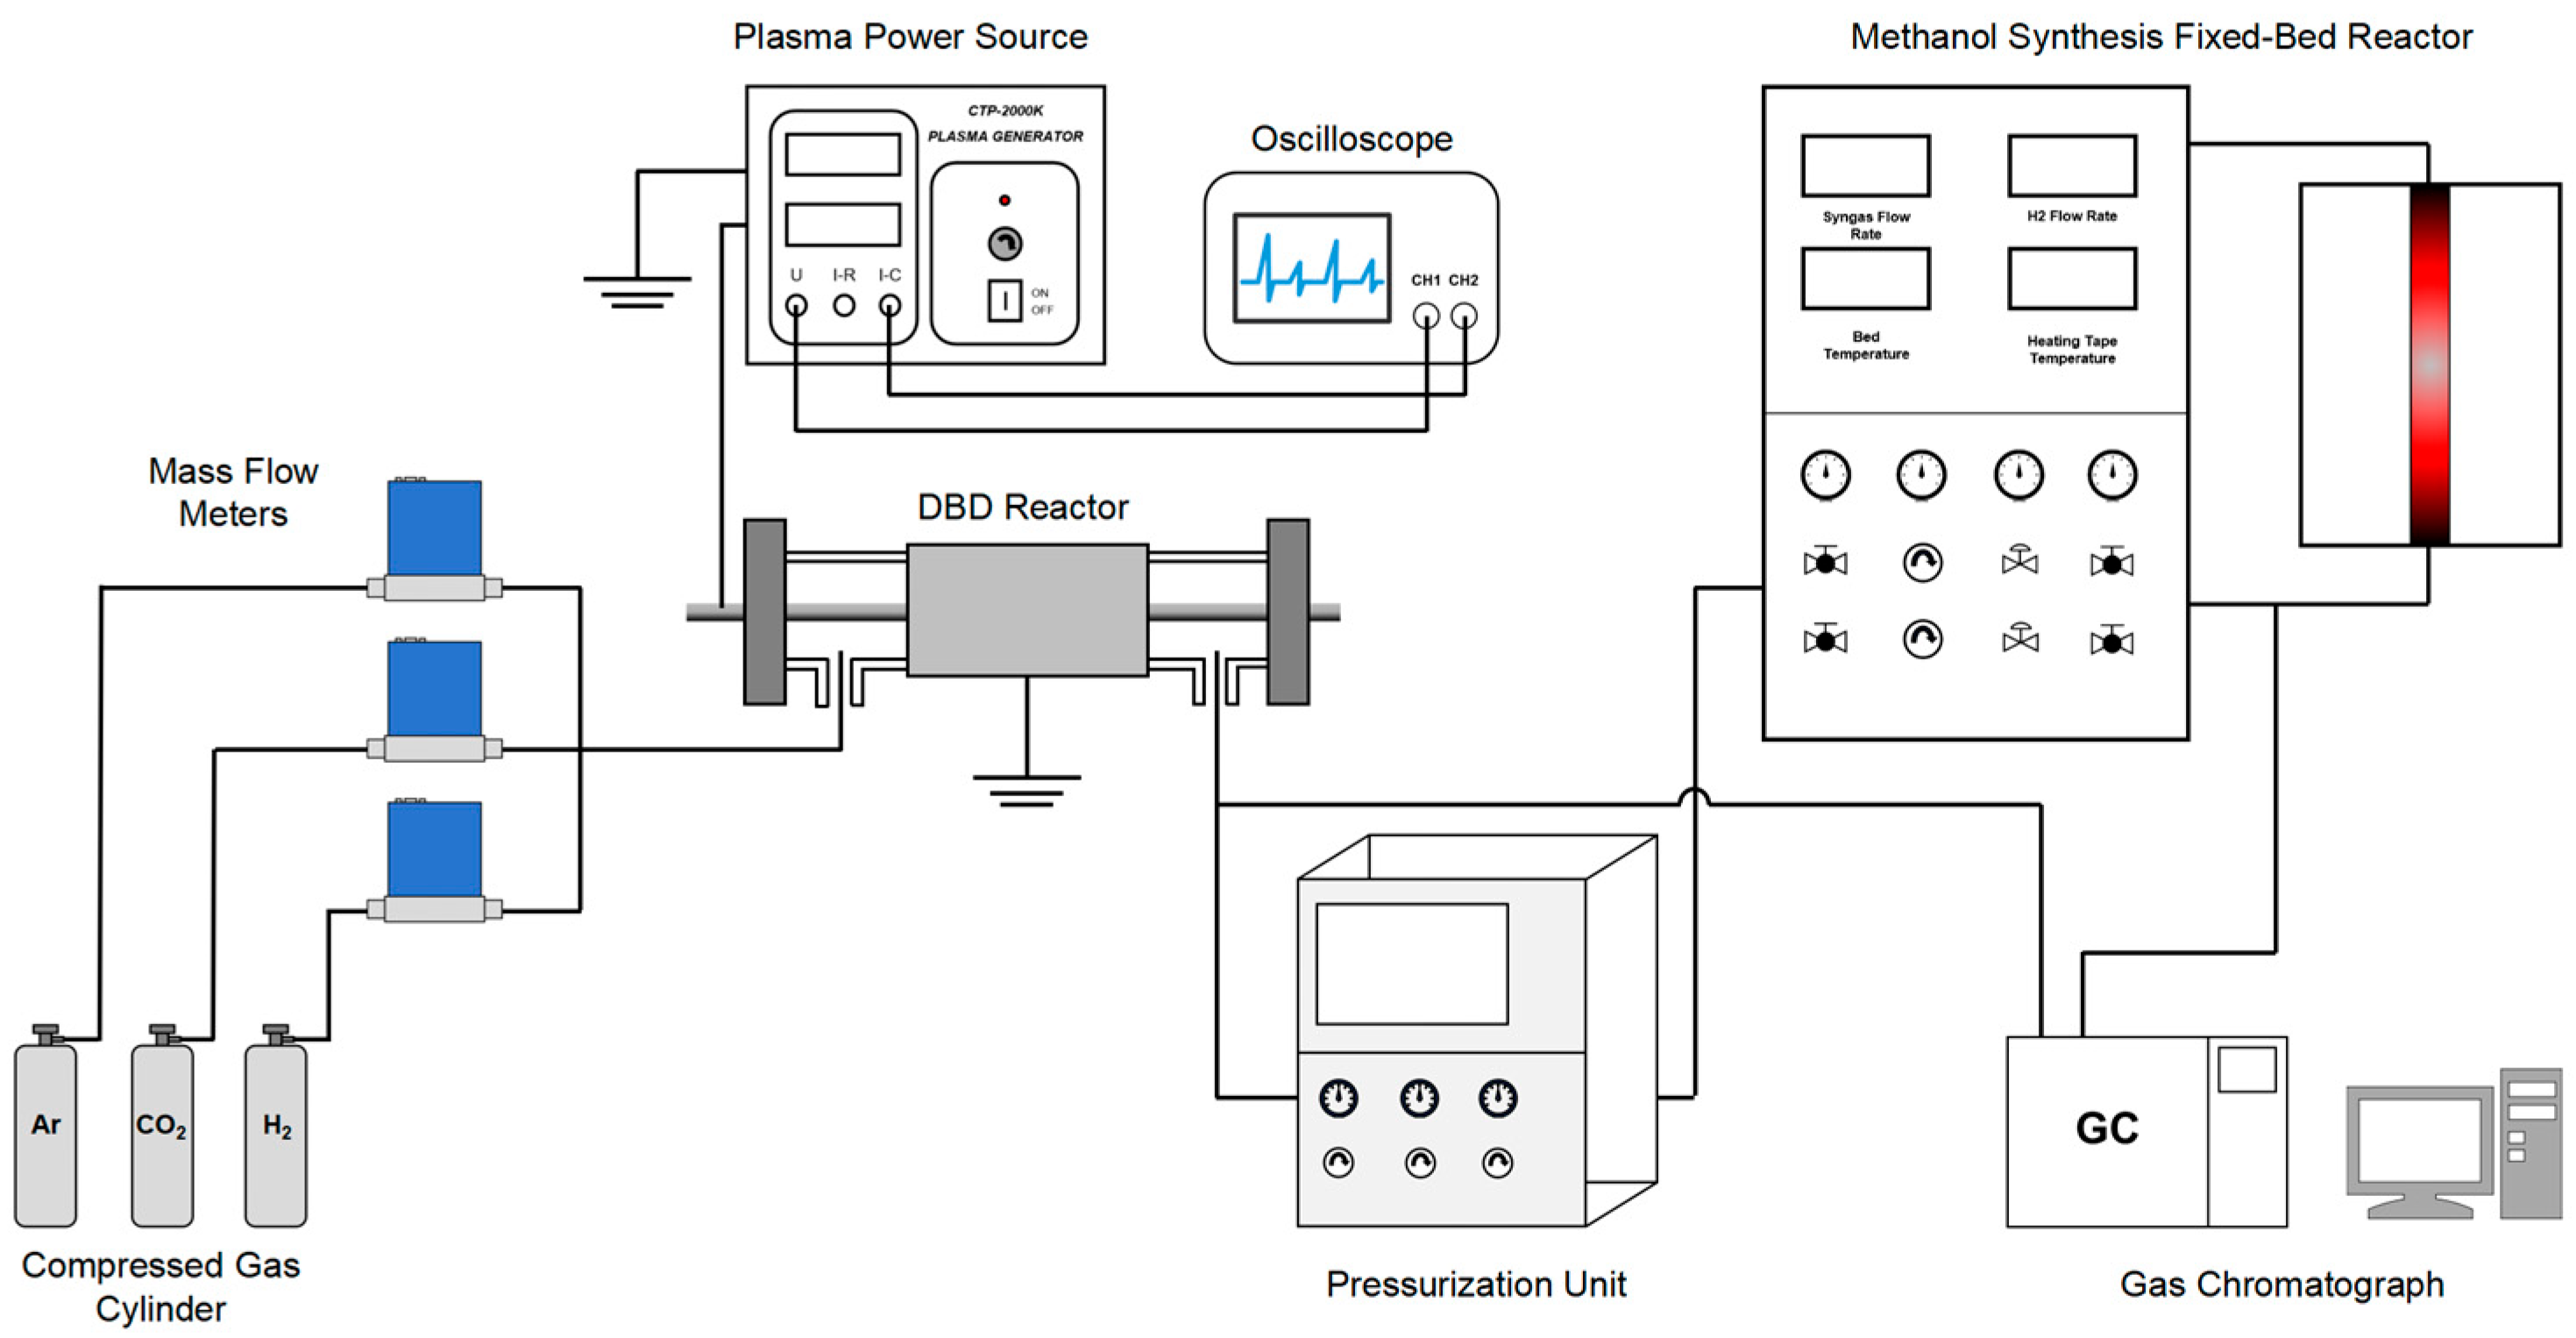
The experimental setup for plasma-based CO2 hydrogenation coupled with catalytic methanol synthesis is shown in Figure 11. A DBD reactor was used to perform CO2 plasma hydrogenation reactions under atmospheric pressure conditions. The reactor is a cylindrical single dielectric-barrier discharge reactor, with a dual-cylindrical shell. The dielectric barrier is made of quartz glass with a thickness of 2 mm. The outer layer of the middle section is covered with a mesh of stainless steel and connected to a wire, serving as the grounding electrode. A tungsten steel rod is used as the high-voltage electrode, inserted along the reactor’s axis through a central hole, with its front end connected to the power supply system via wiring. Gas enters the annular space surrounded by the dielectric through an inlet manifold on a quartz tube, passes through the discharge region where the reaction occurs, and exits via an outlet manifold. The reactor is sealed using flanges and matching rubber gaskets. A detailed schematic of the reactor structure is shown in Figure 12. The methanol synthesis fixed-bed reactor consists of a stainless steel reaction tube and a heating furnace. The DBD reactor is connected to the methanol synthesis fixed-bed via a pressurization device.
In this work, the discharge length of the DBD reactor is 50 mm, and the discharge gap is adjustable. A H2/CO2/Ar mixed gas is introduced into the DBD reactor.

3.2. Experimental Test

CO2, H2, and Ar are controlled via mass flow meters and calibrated using gas system coefficients. By adjusting the individual flow rates of CO2 and H2, different CO2/H2 ratios can be achieved. The presence of Ar enhances CO2 conversion, and also serves as an internal standard for subsequent gas-phase composition analysis. Throughout the plasma experiments, the argon concentration was maintained constant, at 5%.
The DBD reactor outlet is connected to a dual-channel system. Channel one is linked to a pressurization unit, which is used to increase the pressure of the syngas generated at atmospheric pressure to the required level for subsequent methanol synthesis. Channel two is connected to a gas chromatograph (Fuli GC-2014, Zhejiang Fuli Analytical Instrument Co., Ltd., Hangzhou, China) equipped with a thermal conductivity detector (TCD) and a flame ionization detector (FID) for gas-phase product analysis. Quantitative analysis is performed using the internal standard method, with Ar as the internal standard for product analysis. Sampling for analysis begins after 0.5 h of reaction.
The plasma reaction process is powered by a CTP-2000K excitation source. The discharge waveform and other parameters are monitored using an oscilloscope (Tektronix DPO4034B, Tektronix Inc., Beaverton, OR, USA). The input voltage during discharge is controlled within the range of 25 V-55 V, with a fixed frequency of 8250 Hz.
The methanol synthesis fixed-bed reactor is a continuous-flow type, with dual channels at the inlet. Channel one is used for H2 input, to reduce the catalyst, while channel two is connected to the pressurization unit outlet, to introduce the syngas generated by the plasma reaction.
Catalytic methanol synthesis was carried out in the continuous-flow fixed-bed reactor. In a typical run, 0.2 g of the prepared catalyst (40–60 mesh) was combined with quartz wool and placed in the center of the reactor. The catalyst was pre-reduced under a 50 vol % H2 flow (40 mL/min) at 260 °C, for 8 h. After pre-reduction, the system was switched to syngas from channel two at an appropriate pressure (e.g., 3 MPa) and temperature (e.g., 200~300 °C), to initiate the reaction. Gas-phase products were analyzed using an online gas chromatograph equipped with a thermal conductivity detector (TCD, FULI 9790, Zhejiang Fuli Analytical Instrument Co., Ltd., Hangzhou, China) and a flame ionization detector (FID, FULI 9790, Zhejiang Fuli Analytical Instrument Co., Ltd., Hangzhou, China).

3.3. Catalyst Preparation

Copper nitrate trihydrate [Cu(NO3)2·3H2O], zinc nitrate hexahydrate [Zn(NO3)2·6H2O], aluminum nitrate nonahydrate [Al(NO3)3·9H2O] and anhydrous sodium carbonate (Na2CO3) were purchased from Sinopharm Group (Beijing, China). All chemicals were used as received, without further purification. The specifications and manufacturers of all chemicals and gases used in the experiments are detailed in Table 2.
The CZA catalyst was prepared using the co-current coprecipitation method, with the optimized metal molar ratio of Cu:Zn:Al = 6:3:1. The preparation steps are as follows:
Under stirring conditions, 2.41 g of Cu(NO3)2·3H2O, 2.079 g of Zn(NO3)2·6H2O, and 1.125 g of Al(NO3)3·9H2O were dissolved in deionized water to form a precursor solution. The precursor solution was then slowly introduced into a beaker, along with a Na2CO3 solution (1.5 M), through separate dropping funnels. During titration, the mixture was continuously stirred, the temperature was maintained at 65 °C, and the pH was controlled at 7.5.
After complete addition of the precursor solution, the precipitate was aged at 65 °C, for 3 h. Subsequently, the precipitate was filtered under suction and repeatedly washed with deionized water to remove residual salts. The precipitate was then vacuum-dried at 100 °C, for 12 h. After drying, the sample was placed in a tube furnace, where the temperature was increased from room temperature to 500 °C over 60 min, and maintained at 500 °C for 4 h under a flow of dry argon (50 mL/min), yielding the final CZA catalyst sample.

3.4. Evaluation Methodology

To systematically evaluate the reaction performance of CO2 hydrogenation to methanol in the low-temperature plasma-assisted thermocatalytic system, this study employs the following quantitative metrics and calculation formulas:

3.4.1. DBD Plasma Module Evaluation Metrics

CO2 conversion rate:
X C O 2 % = n c o 2 , i n n c o 2 , o u t n c o 2 , i n × 100
CO selectivity:
S C O % = n C O , o u t n c o 2 , i n n c o 2 , o u t × 100
In the equation, n c o 2 , i n represents the molar flow rate of CO2 at the inlet of the DBD reactor (mol/min), n c o 2 , o u t   denotes the molar flow rate of CO2 at the outlet, while n c o , o u t represents the molar flow rate of CO at the outlet of the DBD reactor.

3.4.2. Evaluation Metrics for Syngas Thermocatalytic Methanol Synthesis Module

COX conversion rate (COX: carbon oxides consisting of CO2 and CO generated after the front-end plasma reaction):
X C O X % = n c o X , i n n c o X , o u t n c o X , i n × 100
MeOH selectivity:
S M e O H % = n M e O H , o u t n c o X , i n n c o X , o u t × 100
Methanol STY:
S T Y M e O H = M e O H g / h m c a t a l y s t , k g = X C O X   S M e O H   M M e O H , g / m o l   n c o X , i n , m o l / h m c a t a l y s t , k g
In the equation, n c o X , i n represents the total molar flow rate of CO2 and CO at the inlet of the thermocatalytic reactor (mol/h), n c o X , o u t denotes the total molar flow rate of CO2 and CO at the outlet, n M e O H , o u t is the molar flow rate of methanol at the outlet, M M e O H , g / m o l stands for the molar mass of methanol (g/mol), and m c a t a l y s t , k g refers to the catalyst mass (kg).

3.5. DFT Settings

All Density Functional Theory (DFT) calculations were performed using the Vienna Ab initio Simulation Package (VASP). The generalized gradient approximation (GGA) with the Perdew–Burke–Ernzerhof (PBE) functional was employed, with a plane-wave cutoff energy of 520 eV to describe valence electrons. The projector augmented-wave (PAW) method was used to treat core electrons. The convergence criteria for energy and forces were set to 1 × 10⁻⁵ eV and 0.05 eV/Å, respectively. A 3 × 3 × 1 Gamma-centered k-point mesh was adopted for all surface calculations. A 2 × 2 × 1 supercell was constructed, consisting of four atomic layers, with the bottom two layers fixed and the top two layers fully relaxed. A vacuum layer of 20 Å was introduced along the z-direction, accompanied by dipole corrections.

4. Conclusions

The low-temperature plasma–thermal catalysis synergistic system achieves cooperative enhancement through precise functional complementarity between modules. Specifically, the DBD plasma module efficiently activates stable CO2 molecules into highly reactive CO intermediates via dielectric barrier discharge, while the thermal catalysis module selectively converts CO to methanol through precise C-O bond hydrogenation on Cu-based catalysts, effectively suppressing byproduct formation.
Through this “plasma activation–thermal catalysis regulation” synergistic mechanism, the system demonstrates a CO2 conversion rate two times higher than conventional thermal catalysis (64.11% vs. 21.19%), along with excellent methanol selectivity (45.87%). This ultimately leads to a methanol space–time yield of 502 g·kg−1·h−1, representing a 133% improvement over the standalone thermal catalysis process.

Author Contributions

Conceptualization, X.Z., Y.M. (Yunfei Ma) and Y.M. (Yunfeng Ma); methodology, X.Z.; software, X.Z.; validation, X.Z., Y.M. (Yunfei Ma) and Y.M. (Yunfeng Ma); formal analysis, S.Q.; investigation, C.C.; resources, G.C.; data curation, Z.S.; writing—original draft preparation, X.Z.; writing—review and editing, Y.M. (Yunfei Ma); supervision, A.W. and X.L.; project administration, A.W. and X.L.; funding acquisition, X.Z. and Y.M. (Yunfeng Ma). All authors have read and agreed to the published version of the manuscript.

Funding

This research was funded by the National Key R&D Program of China, grant number 2021YFF0601001 and the China Postdoctoral Science Foundation, grant number 2023M740877.

Data Availability Statement

The data that support the findings of this study are available on request from the corresponding author, Y.M. (Yunfei Ma), upon reasonable request.

Acknowledgments

The authors gratefully acknowledge the technical equipment support provided by the State Key Laboratory of Clean Energy Utilization and the financial support from Guangdong Energy Group Science and Technology Research Institute Co., Ltd. These contributions were instrumental in conducting this research.

Conflicts of Interest

Author Xiangbo Zou, Shiwei Qin, Gongda Chen, and Zirong Shen were employed by the company Guangdong Energy Group Science and Technology Research Institute Co., Ltd. Author Chuangting Chen was employed by the company Guangdong Energy Group. The remaining authors declare that the research was conducted in the absence of any commercial or financial relationships that could be construed as a potential conflict of interest.

Abbreviations

The following abbreviations are used in this manuscript:
DBDDielectric Barrier Discharge
CCUSCarbon Capture, Utilization, and Storage
RWGSReverse Water–Gas Shift
NTPNon-Thermal Plasma
STYSpace–Time Yield
DFTDensity Functional Theory

References

  1. Alexander, M.; Eissa, M.; McDermott-Levy, R.; Osborne, R.; Pleuss, E.; Prabhakaran, P.; Sorensen, C. COP26: Looking Forward from Glasgow by Placing Health at the Center of Climate Action. J. Clim. Change Health 2022, 5, 100117. [Google Scholar] [CrossRef]
  2. Chen, X.; Shuai, C.; Wu, Y.; Zhang, Y. Analysis on the Carbon Emission Peaks of China’s Industrial, Building, Transport, and Agricultural Sectors. Sci. Total Environ. 2020, 709, 135768. [Google Scholar] [CrossRef]
  3. Storrs, K.; Lyhne, I.; Drustrup, R. A Comprehensive Framework for Feasibility of CCUS Deployment: A Meta-Review of Literature on Factors Impacting CCUS Deployment. Int. J. Greenh. Gas Control. 2023, 125, 103878. [Google Scholar] [CrossRef]
  4. Li, Y.; Wang, R.; Zhao, Q.; Fang, X. Status and prospects for CO2 capture, utilization and storage technology in China. Pet. Sci. Bull. 2023, 4, 391–397. [Google Scholar] [CrossRef]
  5. Kianfar, E.; Hajimirzaee, S.; Mousavian, S.; Mehr, A.S. Zeolite-Based Catalysts for Methanol to Gasoline Process: A Review. Microchem. J. 2020, 156, 104822. [Google Scholar] [CrossRef]
  6. Wang, C.; Yang, L.; Gao, M.; Shao, X.; Dai, W.; Wu, G.; Guan, N.; Xu, Z.; Ye, M.; Li, L. Directional Construction of Active Naphthalenic Species within SAPO-34 Crystals toward More Efficient Methanol-to-Olefin Conversion. J. Am. Chem. Soc. 2022, 144, 21408–21416. [Google Scholar] [CrossRef] [PubMed]
  7. Wang, Y.; Li, T.; Ouyang, Y.; Zhong, J.; Zhang, Y.; Xiong, X.; Hu, Q.; Deng, J.; Sun, H.; Yan, Z. Novel-Ordered Hierarchical ZSM-5 Zeolite with Interconnected Macro–Meso–Microporosity for the Enhanced Methanol to Aromatics Reaction. Catal. Sci. Technol. 2024, 14, 2461–2469. [Google Scholar] [CrossRef]
  8. Meca, V.L.; d’Amore Domenech, R.; Crucelaegui, A.; Leo, T.J. Large-Scale Maritime Transport of Hydrogen: Economic Comparison of Liquid Hydrogen and Methanol. ACS Sustain. Chem. Eng. 2022, 10, 4300–4311. [Google Scholar] [CrossRef]
  9. Olah, G.A. Beyond Oil and Gas: The Methanol Economy. Angew. Chem. Int. Ed. 2005, 44, 2636–2639. [Google Scholar] [CrossRef]
  10. Jiang, X.; Nie, X.; Guo, X.; Song, C.; Chen, J.G. Recent Advances in Carbon Dioxide Hydrogenation to Methanol via Heterogeneous Catalysis. Chem. Rev. 2020, 120, 7984–8034. [Google Scholar] [CrossRef]
  11. Álvarez, A.; Bansode, A.; Urakawa, A.; Bavykina, A.V.; Wezendonk, T.A.; Makkee, M.; Gascon, J.; Kapteijn, F. Challenges in the Greener Production of Formates/Formic Acid, Methanol, and DME by Heterogeneously Catalyzed CO2 Hydrogenation Processes. Chem. Rev. 2017, 117, 9804–9838. [Google Scholar] [CrossRef]
  12. Kiani, M.R.; Kamandi, R.; Nozarian, K.; Rahimpour, M.R. Introducing a Novel Catalyst for Efficient Conversion of CO2 into Syngas through Reverse-Water-Gas-Shift (RWGS) Reactions Based on Highly Mesoporous Structures MCM-41: Influence of the Fe Incorporation. Energy Convers. Manag. 2024, 304, 118247. [Google Scholar] [CrossRef]
  13. Chen, H.; Mu, Y.; Xu, S.; Xu, S.; Hardacre, C.; Fan, X. Recent Advances in Non-Thermal Plasma (NTP) Catalysis towards C1 Chemistry. Chin. J. Chem. Eng. 2020, 28, 2010–2021. [Google Scholar] [CrossRef]
  14. Chen, S.; Liu, T.; Niu, J.; Huang, J.; Peng, X.; Zhou, H.; Chen, H.; Fan, X. Plasma-Catalytic CO2 Methanation over Ni Supported on MCM-41 Catalysts: Effect of Metal Dispersion and Process Optimization. Carbon Capture Sci. Technol. 2024, 11, 100194. [Google Scholar] [CrossRef]
  15. Jwa, E.; Lee, S.B.; Lee, H.W.; Mok, Y.S. Plasma-Assisted Catalytic Methanation of CO and CO2 over Ni–Zeolite Catalysts. Fuel Process. Technol. 2013, 108, 89–93. [Google Scholar] [CrossRef]
  16. Arita, K.; Iizuka, S. Production of CH4 in a Low-Pressure CO2/H2 Discharge with Magnetic Field. J. Mater. Sci. Chem. Eng. 2015, 3, 69–77. [Google Scholar] [CrossRef]
  17. Nizio, M.; Albarazi, A.; Cavadias, S.; Amouroux, J.; Galvez, M.E.; Da Costa, P. Hybrid Plasma-Catalytic Methanation of CO2 at Low Temperature over Ceria Zirconia Supported Ni Catalysts. Int. J. Hydrog. Energy 2016, 41, 11584–11592. [Google Scholar] [CrossRef]
  18. Zeng, Y.; Tu, X. Plasma-Catalytic CO2 Hydrogenation at Low Temperatures. IEEE Trans. Plasma Sci. 2016, 44, 405–411. [Google Scholar] [CrossRef]
  19. Zeng, Y.; Tu, X. Plasma-Catalytic Hydrogenation of CO2 for the Cogeneration of CO and CH4 in a Dielectric Barrier Discharge Reactor: Effect of Argon Addition. J. Phys. D Appl. Phys. 2017, 50, 184004. [Google Scholar] [CrossRef]
  20. Lan, L.; Wang, A.; Wang, Y. CO2 Hydrogenation to Lower Hydrocarbons over ZSM-5-Supported Catalysts in a Dielectric-Barrier Discharge Plasma Reactor. Catal. Commun. 2019, 130, 105761. [Google Scholar] [CrossRef]
  21. Wang, L.; Yi, Y.; Guo, H.; Tu, X. Atmospheric Pressure and Room Temperature Synthesis of Methanol through Plasma-Catalytic Hydrogenation of CO2. ACS Catal. 2017, 8, 90–100. [Google Scholar] [CrossRef]
  22. Zeng, Z.; Li, Y.; Ma, Y.; Lin, X.; Zou, X.; Zhang, H.; Li, X.; Lin, Q.; Qu, M.-L.; Ma, Z.; et al. Investigation of Highly Efficient CO2 Hydrogenation at Ambient Conditions Using Dielectric Barrier Discharge Plasma. Green Energy Resour. 2024, 2, 100102. [Google Scholar] [CrossRef]
  23. Ashford, B.; Poh, C.-K.; Ostrikov, K.; Chen, L.; Tu, X. Plasma-Catalytic CO2 Hydrogenation to Ethane in a Dielectric Barrier Discharge Reactor. J. CO2 Util. 2022, 57, 101882. [Google Scholar] [CrossRef]
  24. Meloni, E.; Cafiero, L.; Renda, S.; Martino, M.; Pierro, M.; Palma, V. Ru- and Rh-Based Catalysts for CO2 Methanation Assisted by Non-Thermal Plasma. Catalysts 2023, 13, 488. [Google Scholar] [CrossRef]
  25. Araújo, T.P.; Hergesell, A.H.; Faust-Akl, D.; Büchele, S.; Stewart, J.A.; Mondelli, C.; Pérez-Ramírez, J. Methanol Synthesis by Hydrogenation of Hybrid CO2–CO Feeds. ChemSusChem 2021, 14, 2914–2923. [Google Scholar] [CrossRef]
  26. Duyar, M.S.; Tsai, C.; Snider, J.L.; Singh, J.A.; Gallo, A.; Yoo, J.S.; Medford, A.J.; Abild-Pedersen, F.; Studt, F.; Kibsgaard, J.; et al. A Highly Active Molybdenum Phosphide Catalyst for Methanol Synthesis from CO and CO2. Angew. Chem. Int. Ed. 2018, 57, 15045–15050. [Google Scholar] [CrossRef]
  27. Shi, P.; Han, J.; Yan, Z.; Luo, P.; Wang, J.; Ban, H.; Zhang, X.; Li, C. Insight into the Correlation between Cu Species and Methanol Selectivity from CO2 Hydrogenation over Cu-Based Catalyst. Mol. Catal. 2024, 563, 114278. [Google Scholar] [CrossRef]
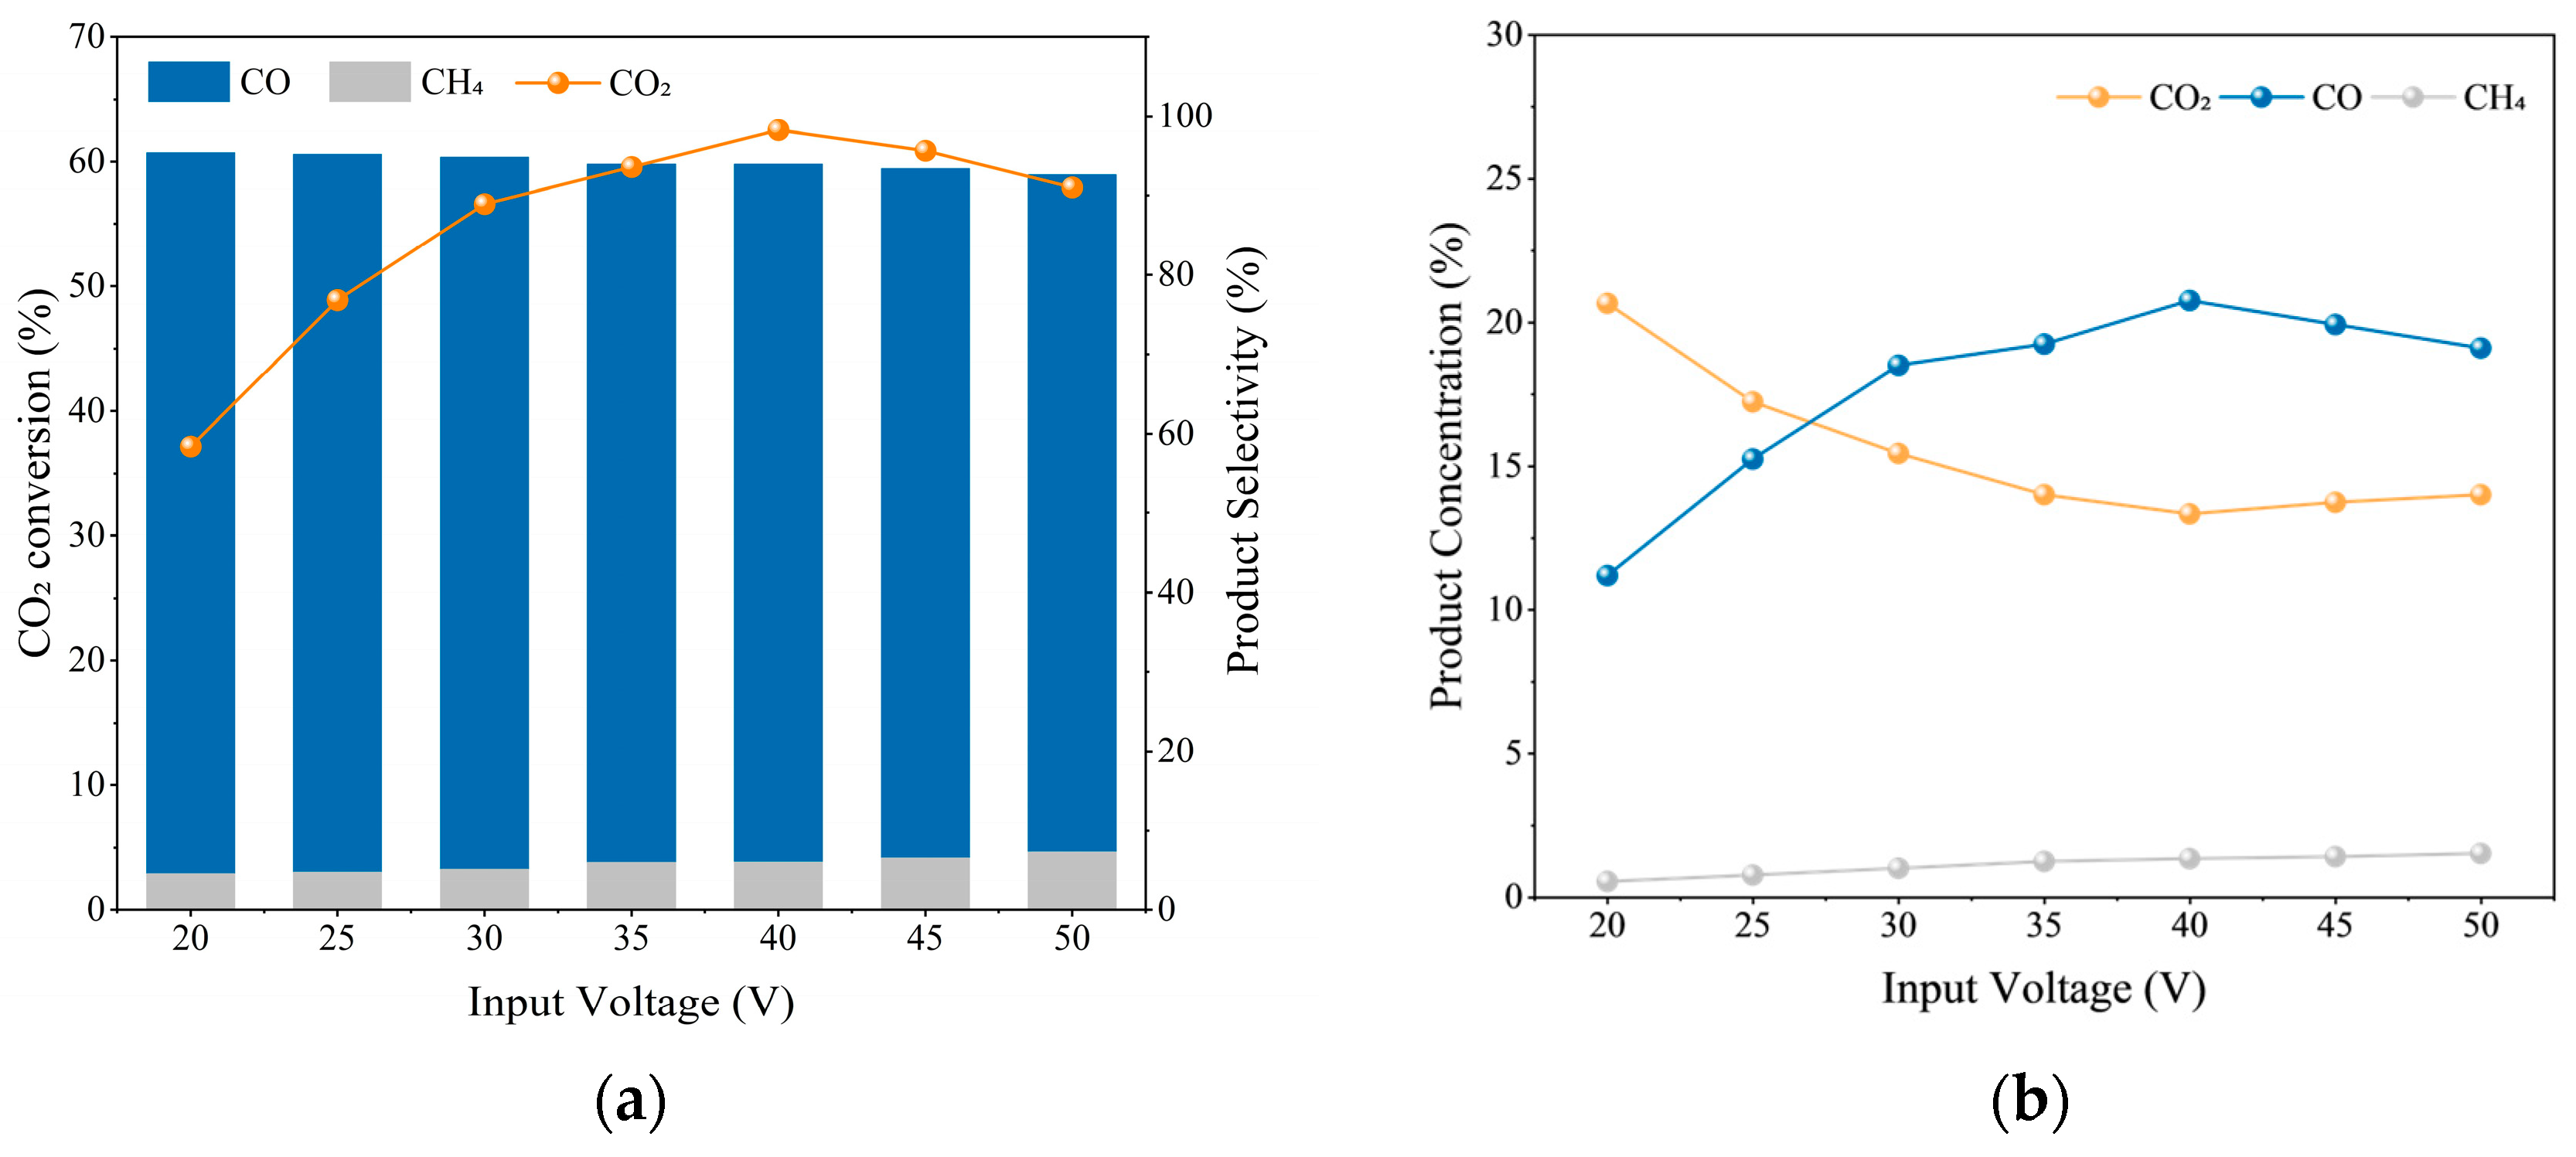
Figure 1. Input voltage-dependent CO2 conversion and product selectivity trends: (a) CO2 conversion (left y-axis) and product selectivity (right y-axis, including CO and CH4); (b) product concentration.
Catalysts 15 00846 g001
Figure 2. CO2 conversion and product distribution vs. input voltage at different discharge gap spacings: (a) CO2 conversion and product selectivity; (b) product concentration.
Catalysts 15 00846 g002
Figure 3. CO2 conversion and product distribution vs. input voltage at different gas flow rates: (a) CO2 conversion and product selectivity at 2 mm gap spacing; (b) product concentration at 2 mm gap spacing; (c) CO2 conversion and product selectivity at 1 mm gap spacing; (d) product concentration at 1 mm gap spacing.
Catalysts 15 00846 g003aCatalysts 15 00846 g003b
Figure 4. CO2 conversion and product distribution as functions of CO2/H2 ratio: (a) CO2 conversion and product selectivity; (b) product concentration.
Catalysts 15 00846 g004
Figure 5. Effects of reaction conditions on methanol synthesis performance from CO/CO2 mixed gas.
Catalysts 15 00846 g005
Figure 6. Chemical state evolution of the CZA catalyst surface: (a) after CO2 reaction; (b) after CO:CO2 reaction.
Catalysts 15 00846 g006
Figure 7. Comparison of d-band center positions: (a) CuO model; (b) partially oxidized model.
Catalysts 15 00846 g007
Figure 8. Work function comparison of catalyst surfaces: (a) CuO model; (b) partially oxidized model.
Catalysts 15 00846 g008
Figure 9. Reaction energy profile: regulation of CO2 hydrogenation pathways by copper valence states.
Catalysts 15 00846 g009
Figure 10. Effects of input voltage and reaction temperature on CO2 conversion, methanol selectivity, and yield: (a) CO2 conversion; (b) methanol selectivity; (c) methanol space–time yield.
Catalysts 15 00846 g010
Figure 11. Plasma-based CO2 hydrogenation and catalytic methanol synthesis.
Catalysts 15 00846 g011
Figure 12. Detailed structure of DBD reactor.
Catalysts 15 00846 g012
Table 1. Operating conditions for plasma performance experiments.
Test ConditionDischarge gap/mmInput Voltage/VGas Flow Rate/sccmCO2/H2 Ratio
TC-A 1.020–50501:3
TC-B1.020–50501:3
1.5
2.0
TC-C1.020–50501:3
1.0100
2.050
2.0100
TC-D1.040501:3
1:2
1:1
2:1
3:1
Table 2. Experimental Chemicals and Gases.
Chemical FormulaSpecificationsManufacturer
CO299.999%Jingong Special Materials Co., Ltd., Hangzhou, China
CO99.999%
H299.999%
Ar99.999%
Cu(NO3)2·3H2OAR, ≥99%China National Pharmaceutical Group Co., Ltd., Beijing, China
Zn(NO3)2·6H2OAR, ≥99%
Al(NO3)2·9H2OAR, ≥99%
Na2CO3AR, ≥99.8%
Disclaimer/Publisher’s Note: The statements, opinions and data contained in all publications are solely those of the individual author(s) and contributor(s) and not of MDPI and/or the editor(s). MDPI and/or the editor(s) disclaim responsibility for any injury to people or property resulting from any ideas, methods, instructions or products referred to in the content.