Article

Flow Field Structure Optimization and Inlet Parameters in Tubular Photocatalytic Reactors: A CFD-Based Study

1
College of Engineering, South China Agricultural University, Guangzhou 510642, China
2
School of Mechanical Engineering, Guangdong Ocean University, Zhanjiang 524088, China
*
Author to whom correspondence should be addressed.
Catalysts 2025, 15(9), 798; https://doi.org/10.3390/catal15090798
Submission received: 21 July 2025 / Revised: 15 August 2025 / Accepted: 19 August 2025 / Published: 22 August 2025
(This article belongs to the Section Photocatalysis)

Abstract

The internal flow field and hydrodynamic properties of a photocatalytic reactor are crucial for the enhancement of degradation performance. In this study, TiO2 films were loaded on the surface of quartz glass tubes and activated with UV-LEDs. Combining the degradation experiments with computational fluid dynamics (CFD) numerical simulations, the regulation laws of film surface area, flow field configuration, ratio of film surface area to solution volume (S/V), inlet flow rate and diameter on the reaction process were systematically evaluated. The results showed that the film surface area was positively correlated with the degradation efficiency of tetracycline hydrochloride (TCH). The degradation rate of TCH ranged between 32.15% and 64.83% in 12 equal film area flow field configurations. It was further found that the S/V value was positively correlated with the degradation efficiency only for the same flow field configuration, and the degradation rate of TCH was enhanced by 32.73% when the S/V value was increased from 0.018 m−1 to 0.034 m−1. In addition, as the flow rate increases, the optimal inlet diameter increases accordingly (10, 25, 40, 55, and 70 mL/min corresponded to 10, 15, 20, 20, and 25 mm, respectively). The optimum structural parameters of the reactor were determined as follows: inlet flow rate of 10 mL/min, inlet diameter of 10 mm, flow field configuration type b, S/V value of 0.034 m−1, and height of 450 mm. The degradation rate of TCH under these conditions was 96.34%. The relationship between the film-reactor flow field and degradation efficiency of the photocatalytic reactor established in this study provides a reference for optimizing the design of tubular catalytic reactors.

Graphical Abstract

1. Introduction

Antibiotic pollution has become a global environmental problem. Tetracycline hydrochloride (TCH) as a typical antibiotic, has been frequently detected in water due to its wide application in medical treatment and animal husbandry, posing a potential threat to the ecological environment and human health [1,2,3]. Photocatalytic oxidation technology, which is efficient, green, and has thorough mineralization, has become one of the most promising options for antibiotic degradation [4,5,6]. TiO2 is recognized as an ideal catalytic material due to its high chemical stability, photocatalytic activity and low cost [7,8,9]. When TiO2 is used as a catalyst, ultraviolet light excites it to produce electrons and holes, forming strong oxidizing species such as ·OH and ·O2. These species can decompose the molecular structure of tetracycline and eventually convert it into CO2, water and inorganic salts. However, TiO2 in powder form suffers from problems such as a tendency to form agglomerations and difficult recycling in practical applications, which limit its engineering applications [10,11]. Fixing TiO2 as a thin film on the surface of a carrier (such as a quartz glass tube) can effectively enhance catalyst recovery, while facilitating long-term operation of the reaction system and achieving efficient and stable wastewater treatment [12,13,14].
Tube-type photocatalytic reactors have garnered significant attention in recent years due to their unique ring-shaped structure, which enables efficient fluid mixing and uniform light radiation [15]. Das et al. immobilized three types (rGO, TiO2, g-C3N4) of catalysts on the inner walls of the reactor and used the designed bubble-type tube reactor to degrade dyes [16]. Zeinali Heris et al. coated the interior of the reactor with TiO2 and ZnO to achieve continuous degradation of TCH. Deng et al. discussed the kinetic parameters of ethylene degradation in tubular reactors [17,18]. However, using traditional experimental optimization methods it is still difficult to comprehensively examine the interactions between various parameters. The development of computational fluid dynamics (CFD) numerical simulation technology has provided new insights for reactor optimization, as it can accurately simulate mass transfer and reaction processes in complex flow fields [19,20,21,22], and it is gradually becoming a useful tool for designing and optimization photocatalytic reactors [23]. Previous studies have reported the optimization of photocatalytic reactors by CFD; for example, Phuan et al. used CFD to design and model PFC reactors [24], and Verbruggen et al. used CFD to accurately determine the adsorption parameters of acetaldehyde on photocatalytic fiber filters [25]. However, the existing research mainly focuses on the macroscopic performance of the reactor [26,27,28,29,30,31,32,33,34,35,36,37], and there is a lack of systematic research on the influence of internal flow field configuration and hydrodynamic characteristics on degradation efficiency.
In this study, TiO2 was immobilized on the surface of quartz glass tubes in the form of a catalyst film to construct a continuous-flow tubular photocatalytic reactor. Using CFD technology, a model was developed for the photocatalytic degradation of TCH in the tubular reactor, with the degradation rate of TCH as the target. The study evaluated the influence of multiple factors (catalyst film area, flow field configuration, S/V ratio, inlet parameters) on the reactor’s degradation efficiency and established quantitative relationships between these factors and the reactor’s degradation efficiency.

2. Results and Discussion

2.1. Effect of the Number of TiO2 Film Layers on Photocatalytic Efficiency

The degradation efficiency of TCH showed a non-monotonic change with the increase in the number of TiO2 film layers, as shown in Figure 1a. Compared with the control group (TiO2 film layer = 0), the degradation rate of TCH increased from 14.1% to 82.9% after 120 min of reaction, suggesting that the introduction of TiO2 played a decisive role in the degradation process, as shown in Figure 1b. However, when the number of TiO2 film layers further increased (1–4), the TCH degradation rate showed a downward trend (82.9%, 80.1%, 77.7%, 77.5%). This may be due to the fact that the increase in the thickness of the TiO2 film hinders the penetration of UV light [38,39].

2.2. Degradation Kinetics Analysis

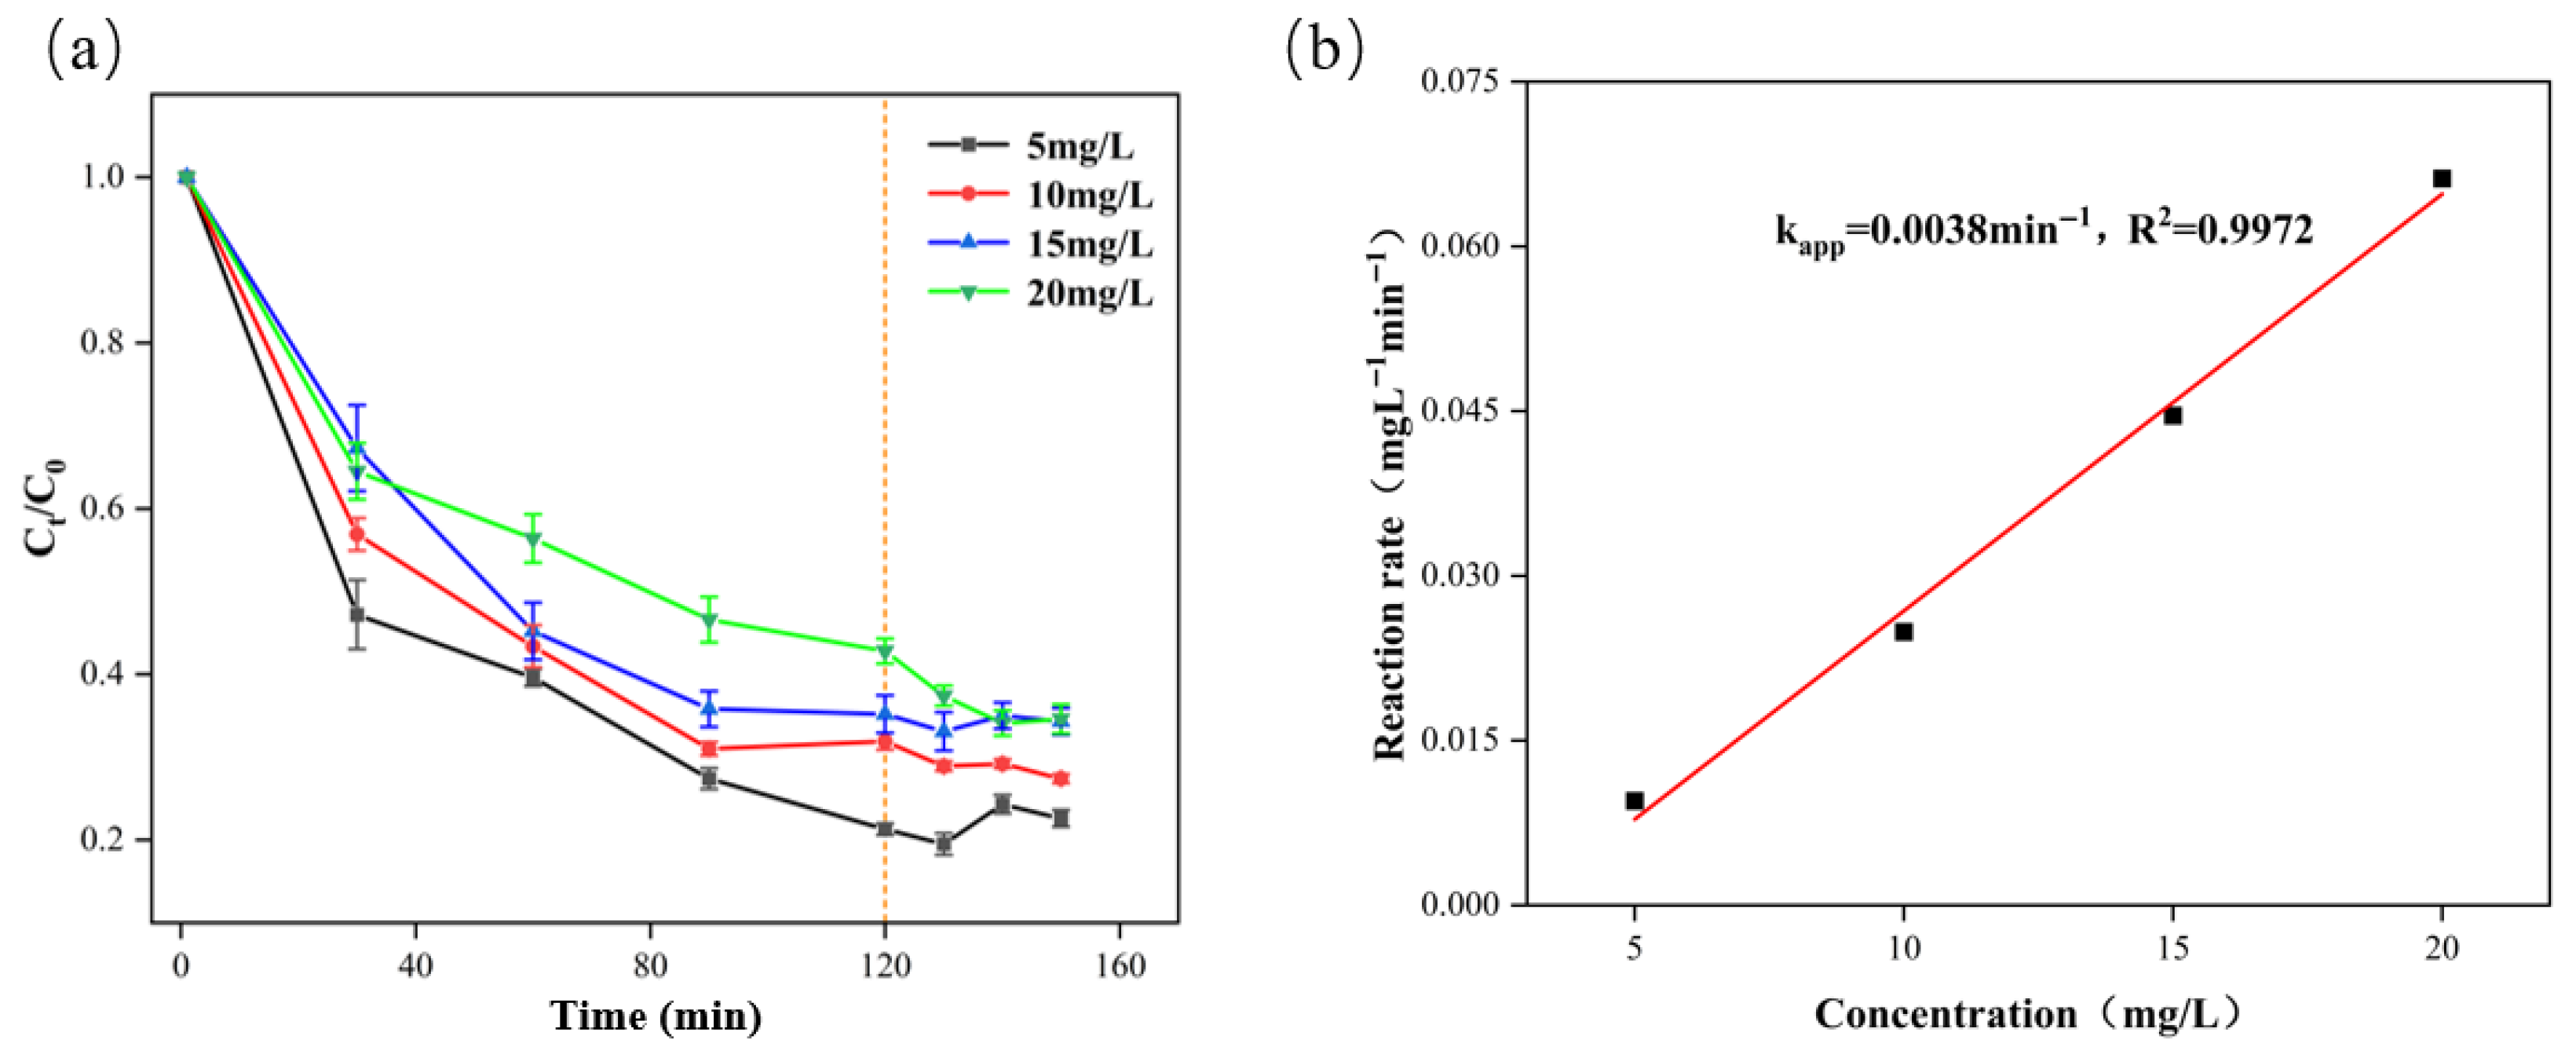
The degradation rate curve of TCH at different substrate concentrations is shown in Figure 2a. The results show that the degradation rate of TCH was significantly negatively correlated with its initial concentration. When the initial concentration of TCH was 5, 10, 15 and 20 mg/L, the degradation rate of TCH was 78.3%, 71.4%, 65.8% and 61.96%, respectively. This may be attributed to the constraining effect of catalytic active sites. Specifically, as the initial concentration increases from 5 mg/L to 20 mg/L, the number of TCH molecules passing through the reactor per unit time increases, while the number of active sites available for the reaction remains unchanged [40].
The average reaction rate of 0–120 min under different initial concentrations of TCH was analyzed, and then the reaction rate was used as the ordinate, and the initial concentration was used as the abscissa to form a scatter plot and perform a linear regression, as shown in Figure 2b. The results show that the slope was 0.0038 min−1, which was used as the rate constant of the reaction system in this study.

2.3. Analysis of Model Validity

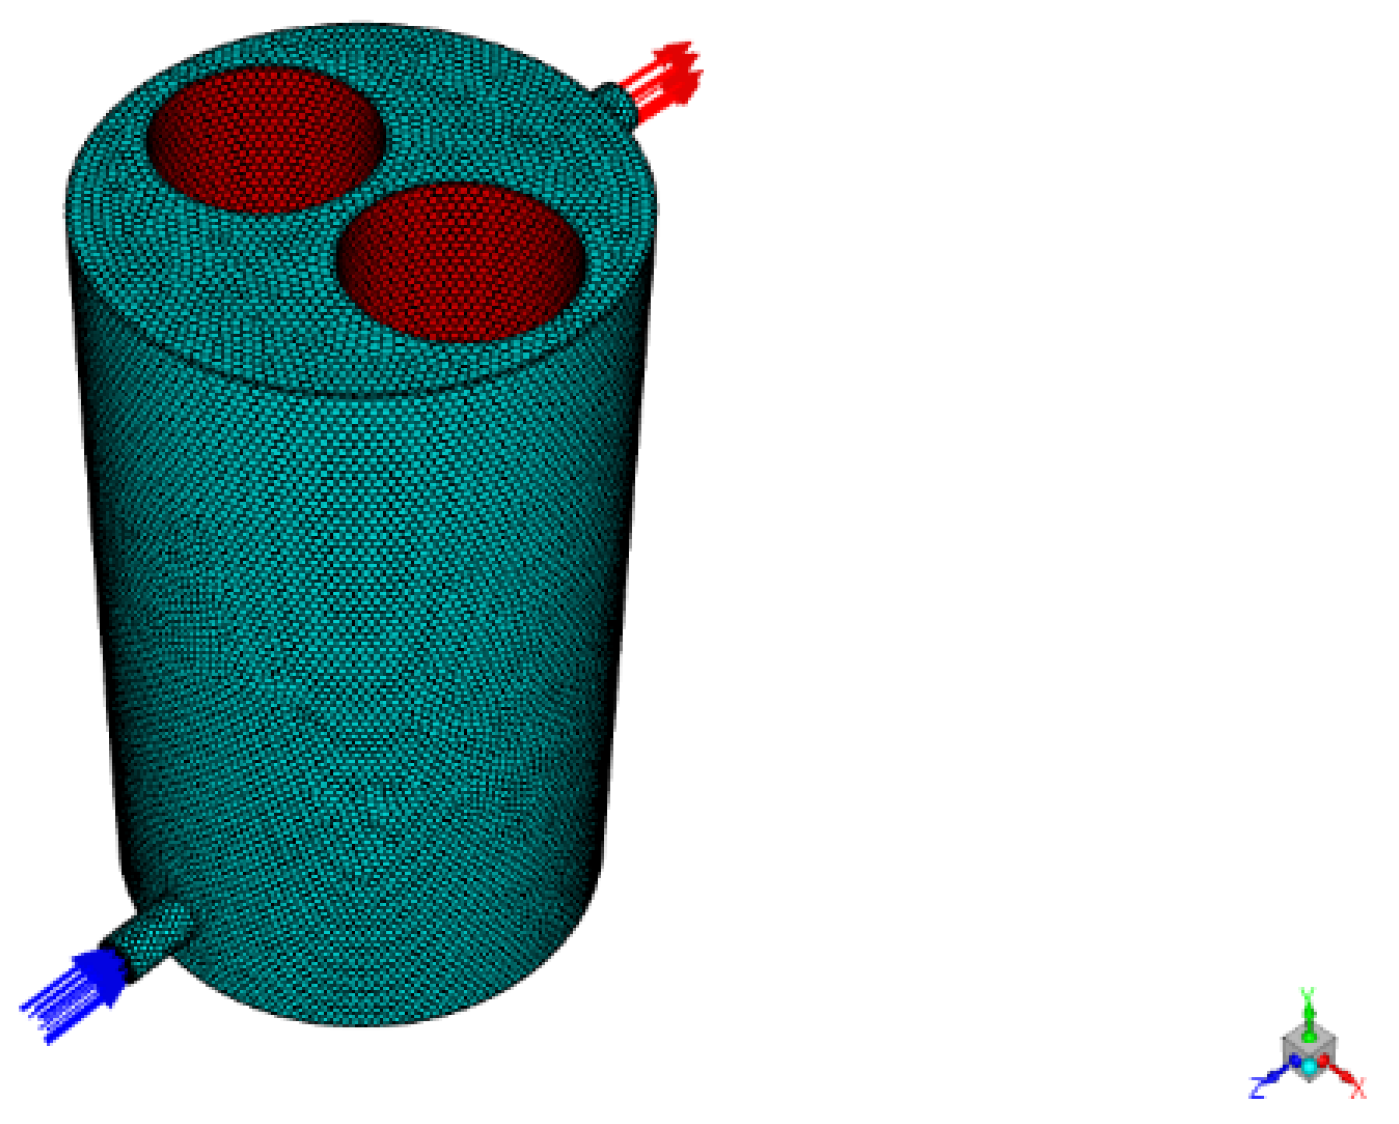
In the ANSYS (2022 version) analysis software, a model with the same size as the actual size of the reactor is established, and the internal flow field of the reactor is meshed by the polyhedron meshing method, as shown in Figure 3.
The bottom opening of the reactor is set as Inlet, the top opening is set as Outlet, the wall of the quartz tube covered by the catalyst is set as the reaction surface, and the other surfaces are set as the boundary surface Wall. The reaction model is the surface reaction rate model, and the turbulence model is the k-epsilon model.
When the inlet velocity is 1 m/s, the outlet velocity corresponding to the number of meshes is shown in Table 1.
The number of meshes of the models established in this study are within the range (157,116~584,693), so it can be assumed that the number of meshes does not affect the results of the simulation. To validate the accuracy of the CFD model, the TCH concentrations at the inlet were set to 5, 10, 15, and 20 mg/L, with corresponding mass concentration parameters of 5 × 10⁻⁶, 1 × 10⁻⁵, 1.5 × 10⁻⁵, and 2 × 10⁻⁵.
As shown in Figure 4., the model analysis results indicate that the simulated TCH degradation rate is marginally higher than the experimentally measured values. This discrepancy may be attributed to the model’s neglect of grain boundary defects in TiO2 and impurities present in the actual film [41]. Furthermore, within the 5–20 mg/L of TCH concentration, the relative error between simulated and experimental results remained within 4.5%. This demonstrates that the model reliably simulates the reactor operation process under investigation.

2.4. Effect of Film Surface Area on Photocatalytic Efficiency

For cylindrical membrane structures, expanding the lateral dimension (diameter) or axial dimension (height) increases the membrane surface area. This augmentation elevates the number of active sites, thereby enhancing the reactor’s peak degradation efficiency. To optimize the quartz glass tube diameter, the TiO2 film diameters were set to 105, 110, 115, 120, and 125 mm, respectively, as shown in Figure 5a. Under specific reaction conditions (TCH concentration: 20 mg/L, inlet flow rate: 25 mL/min, inlet diameter: 15 mm), the influence of TiO2 film surface area on TCH degradation efficiency is depicted in Figure 5c. The results indicate that with increasing TiO2 film diameter from 105 mm to 125 mm, the effective surface area expands by 16%, corresponding to a 12.36% enhancement in TCH degradation efficiency.
This study further investigates the influence mechanism of TiO2 film height on TCH degradation efficiency. Under a constant inlet flow rate (25 mL/min) and fixed membrane base diameter (125 mm), the TiO2 packing heights were set to 250, 300, 350, 400, and 450 mm, respectively, as shown in Figure 5b. The results demonstrate that as the packing height increases from 250 mm to 450 mm, TCH degradation efficiency exhibits a 23.61% enhancement, as illustrated in Figure 5d.

2.5. Effect of Flow Field Configuration on Photocatalytic Efficiency

Photocatalytic reaction kinetics are not solely determined by catalyst film surface area, but are critically governed by hydrodynamic characteristics. The hydrodynamic characteristics govern the convective mass transfer and reaction efficiency within the system by modulating reactant kinematic parameters and spatial distribution. The surface area of the cylindrical film (diameter 125 mm, height 250 mm) is divided into 1~5 parts. Because the flow field formations are infinite in number, 12 kinds of flow field configurations composed of cylindrical films symmetrical in the y-z plane are selected in this study. Under the conditions of inlet flow rate of 25 mL/min and inlet diameter of 15 mm, numerical simulation is carried out, and the results are shown in Figure 6.
The results showed that the degradation rate of TCH was significantly different under different flow fields. Even if the number of films is the same, the degradation rate of configuration b is reduced by 28.73% when it is transformed into configuration c by rotating it by 90° along the axis of the center of the x-z plane; similarly, the degradation rate of configuration f, which results from the rotation of configuration g by the same angle, is also reduced by 22.14%, but the degradation rate of the configurations with different number of films (a, g, j, and k) have smaller differences in degradation rates. In order to show the effect of different configurations on the degradation efficiency more intuitively, the TCH mass traces inside the configurations b and g with larger degradation rates were compared with those inside the configurations c and f with smaller degradation rates, as shown in Figure 7.
The streamlines in configurations b and g exhibit greater dispersion and disorder, indicating that structural modifications in the membrane alter the flow distribution characteristics and modify reactant transport pathways. Furthermore, packing configuration modulates local turbulence intensity, resulting in a larger effective contact area and higher contact probability between TCH molecules and catalysts in these two configurations. In contrast, configurations c and f demonstrate relatively concentrated and uniform streamlines with predominantly laminar flow patterns. This leads to reduced effective contact and lower collision probability between TCH molecules and catalytic surfaces, causing significant quantities of unreacted TCH molecules to exit the reactor outlet [42].
It can be seen that the photocatalytic reaction rate not only depends on the surface area of the catalyst film, but is also closely related to the flow field configuration. This may be due to the fact that a favorable flow field configuration can improve the flow field uniformity and enhance the mass transfer efficiency between the reactants and the catalyst surface, while an unfavorable flow field configuration may produce flow dead zones or short-circuited flows, which significantly reduce the mass transfer effect [43].

2.6. Effect of S/V Value on Photocatalytic Efficiency

The ratio of TiO2 membrane surface area to solution volume (S/V) constitutes a critical parameter influencing reaction efficiency. Conventionally, S/V exhibits a positive correlation with reaction kinetics [44,45,46]. However, from configuration a to l, the S/V ratio progressively decreases, while tetracycline (TCH) degradation rates display irregular variations, as illustrated in Table 2. Notably, although configuration a possesses the maximum S/V value (0.073 m−1), its degradation efficiency merely exceeds that of configuration k (minimum S/V = 0.0258 m−1) by 1.99%, while being significantly lower than configuration b (S/V = 0.034 m−1).
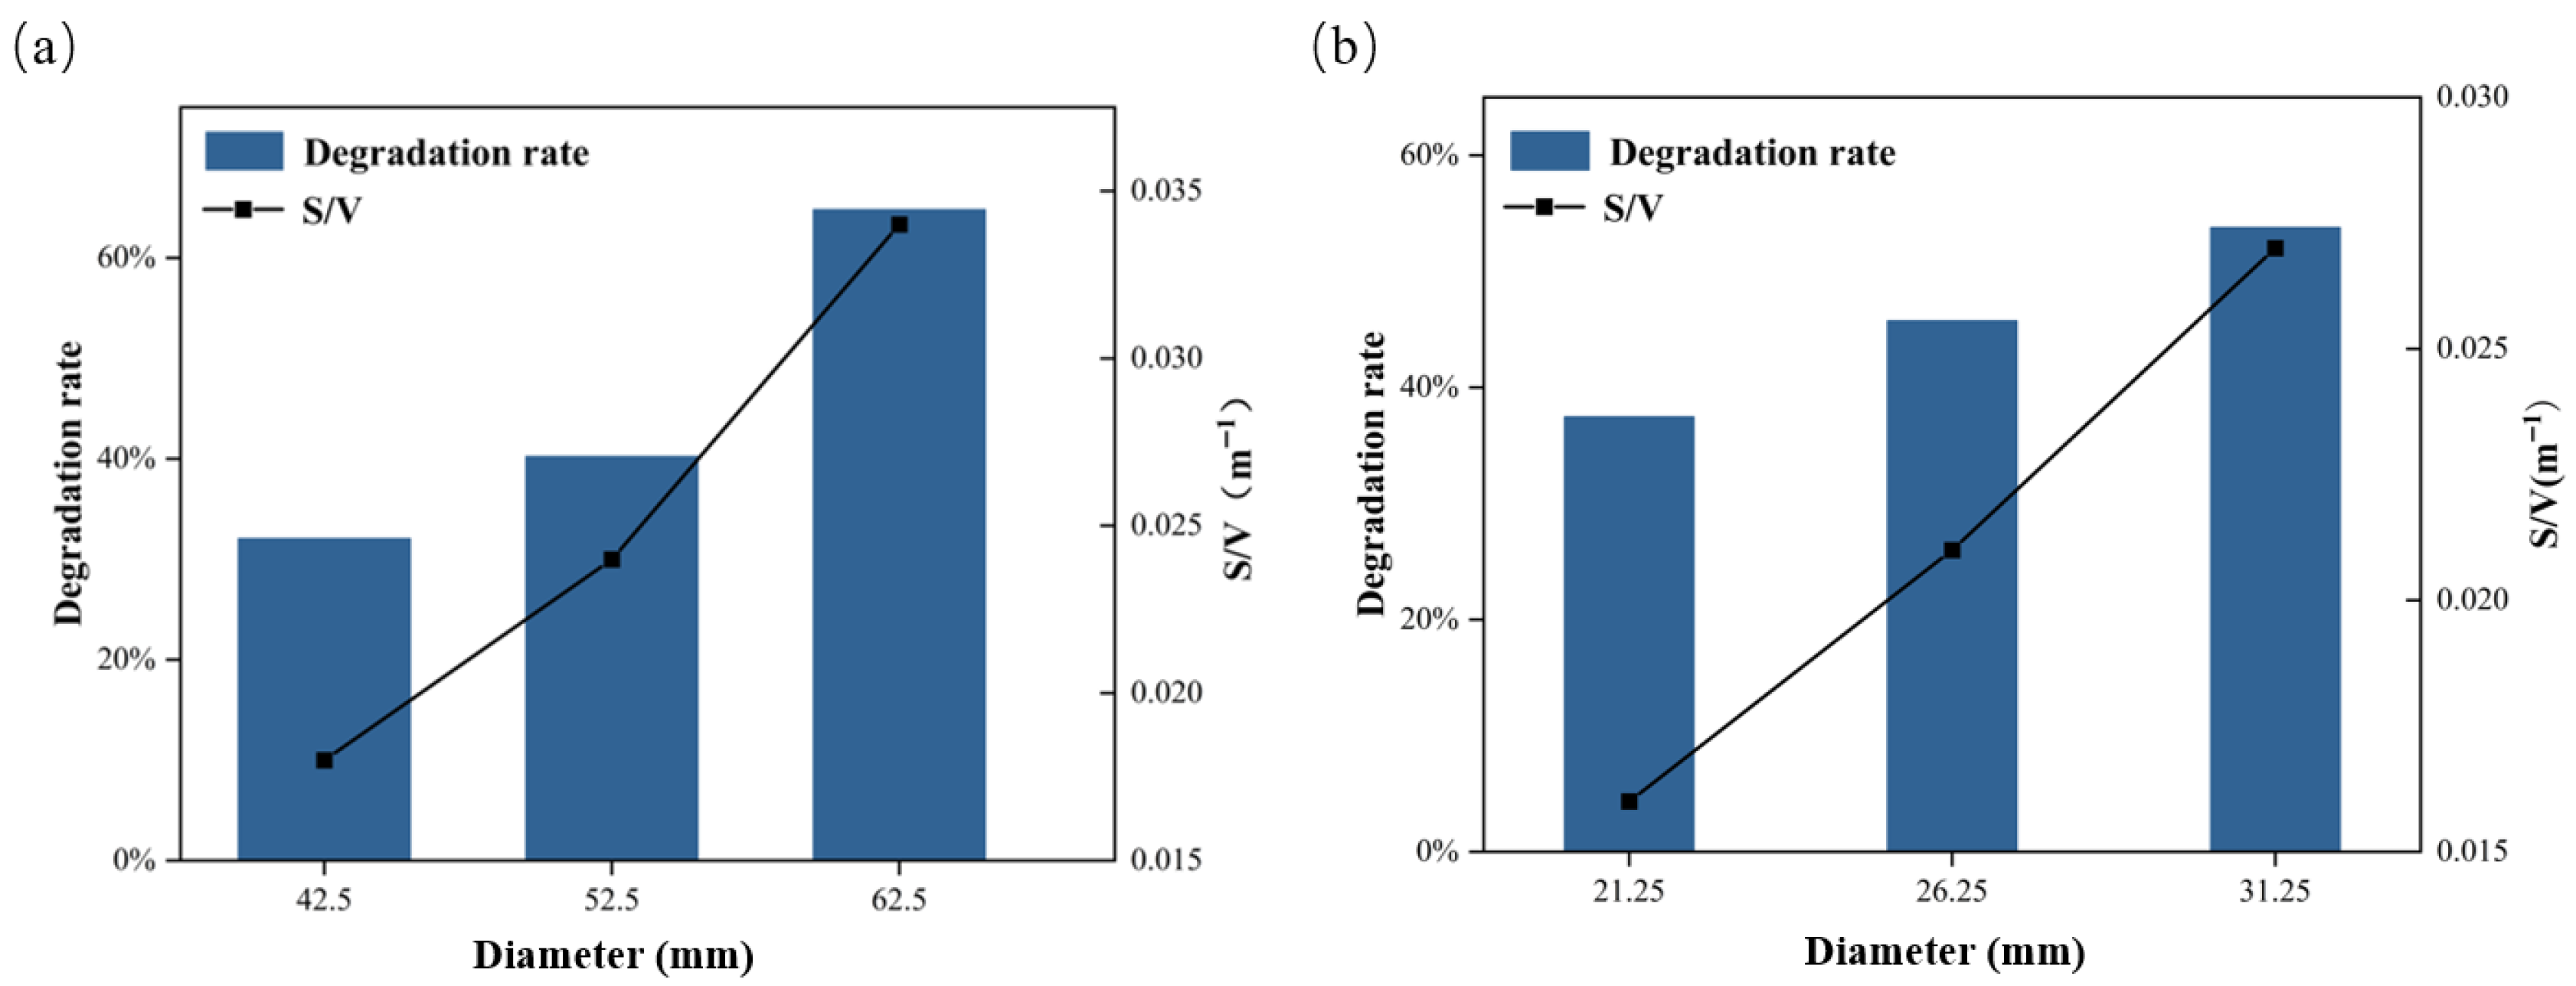
To investigate the correlation between S/V ratio trends and degradation efficiency, the S/V value is adjusted by changing the diameter of the film. Controlled numerical simulations were conducted with inlet flow rate and reactor height fixed at 25 mL/min and 250 mm, respectively. Film diameters for configurations b and j were systematically varied to 42.5, 52.5, 62.5 mm and 21.25, 26.25, 31.25 mm, yielding corresponding S/V ratios of 0.018, 0.024, 0.034 m−1 and 0.016, 0.021, 0.027 m−1. The results demonstrate that for configuration b, elevating the S/V ratio from 0.018 to 0.034 m−1 enhances degradation efficiency by 32.73%. Similarly, configuration j shows a 16.29% efficiency improvement when S/V increases from 0.016 to 0.027 m−1; the TCH degradation efficiency exhibits a positive correlation with increasing S/V values, as shown in Figure 8.
The mass concentration distributions of TCH within configurations b and j as functions of the S/V ratio are presented in Figure 9. The results reveal a consistent vertical concentration gradient in both configurations, with TCH mass concentration progressively decreasing from bottom to top throughout all fluid domains. Crucially, increasing S/V value correspond to enhanced TCH mass consumption at identical elevation planes, demonstrating intensified reaction kinetics with higher surface-to-volume ratios.
This indicates that there is a limitation to increasing the reaction efficiency by simply increasing the S/V value under different flow field configurations, and the mass transfer characteristics inside the flow field should also be considered. For a specific flow field configuration, the increase in S/V value can increase the density of active sites per unit volume, which can enhance the contact probability of reactant molecules with the catalyst and accelerate the reaction, and the degradation rate of TCH is positively correlated with S/V.

2.7. Effect of Inlet Parameters on Photocatalytic Efficiency

Among the 12 configurations previously described, configuration b demonstrates the highest TCH degradation efficiency, warranting detailed characterization. Under fixed membrane dimensions (diameter: 62.5 mm, height: 250 mm), the impacts of inlet diameter and flow rate on TCH degradation in configuration b were systematically assessed, with the results presented in Figure 10.
In general, a smaller inlet diameter can enhance the turbulence effect and promote the mass transfer process. A larger inlet diameter can prolong the reaction time of the reactants in the system. Therefore, the optimal inlet diameter means finding a balance between turbulence effect and reaction time. The results show that, when the inlet flow rates were 10, 25, 40, 55 and 70 mL/min, the corresponding optimal inlet diameters were 10, 15, 20, 20 and 25 mm, respectively.
The optimal inlet diameter shows a clear increasing trend as the inlet flow rate increases. This may be due to the higher pressure drop caused by the larger flow rate, and the velocity is positively correlated with the pressure drop. The change of velocity affects the turbulence effect and residence time of the liquid at the same time, which leads to deviations in the dominant factors in different flow ranges: in the low-flow interval (10–25 mL/min), the turbulence intensity plays a dominant role on the reaction rate, while in the high-flow interval (40–70 mL/min), the effect of residence time is more significant. In addition, at a fixed inlet diameter, the degradation rate of TCH showed a negative correlation with the inlet flow rate, which could be attributed to the fact that the turbulence-enhancing effect of the increased flow rate could not offset the negative effect of the shortened residence time.
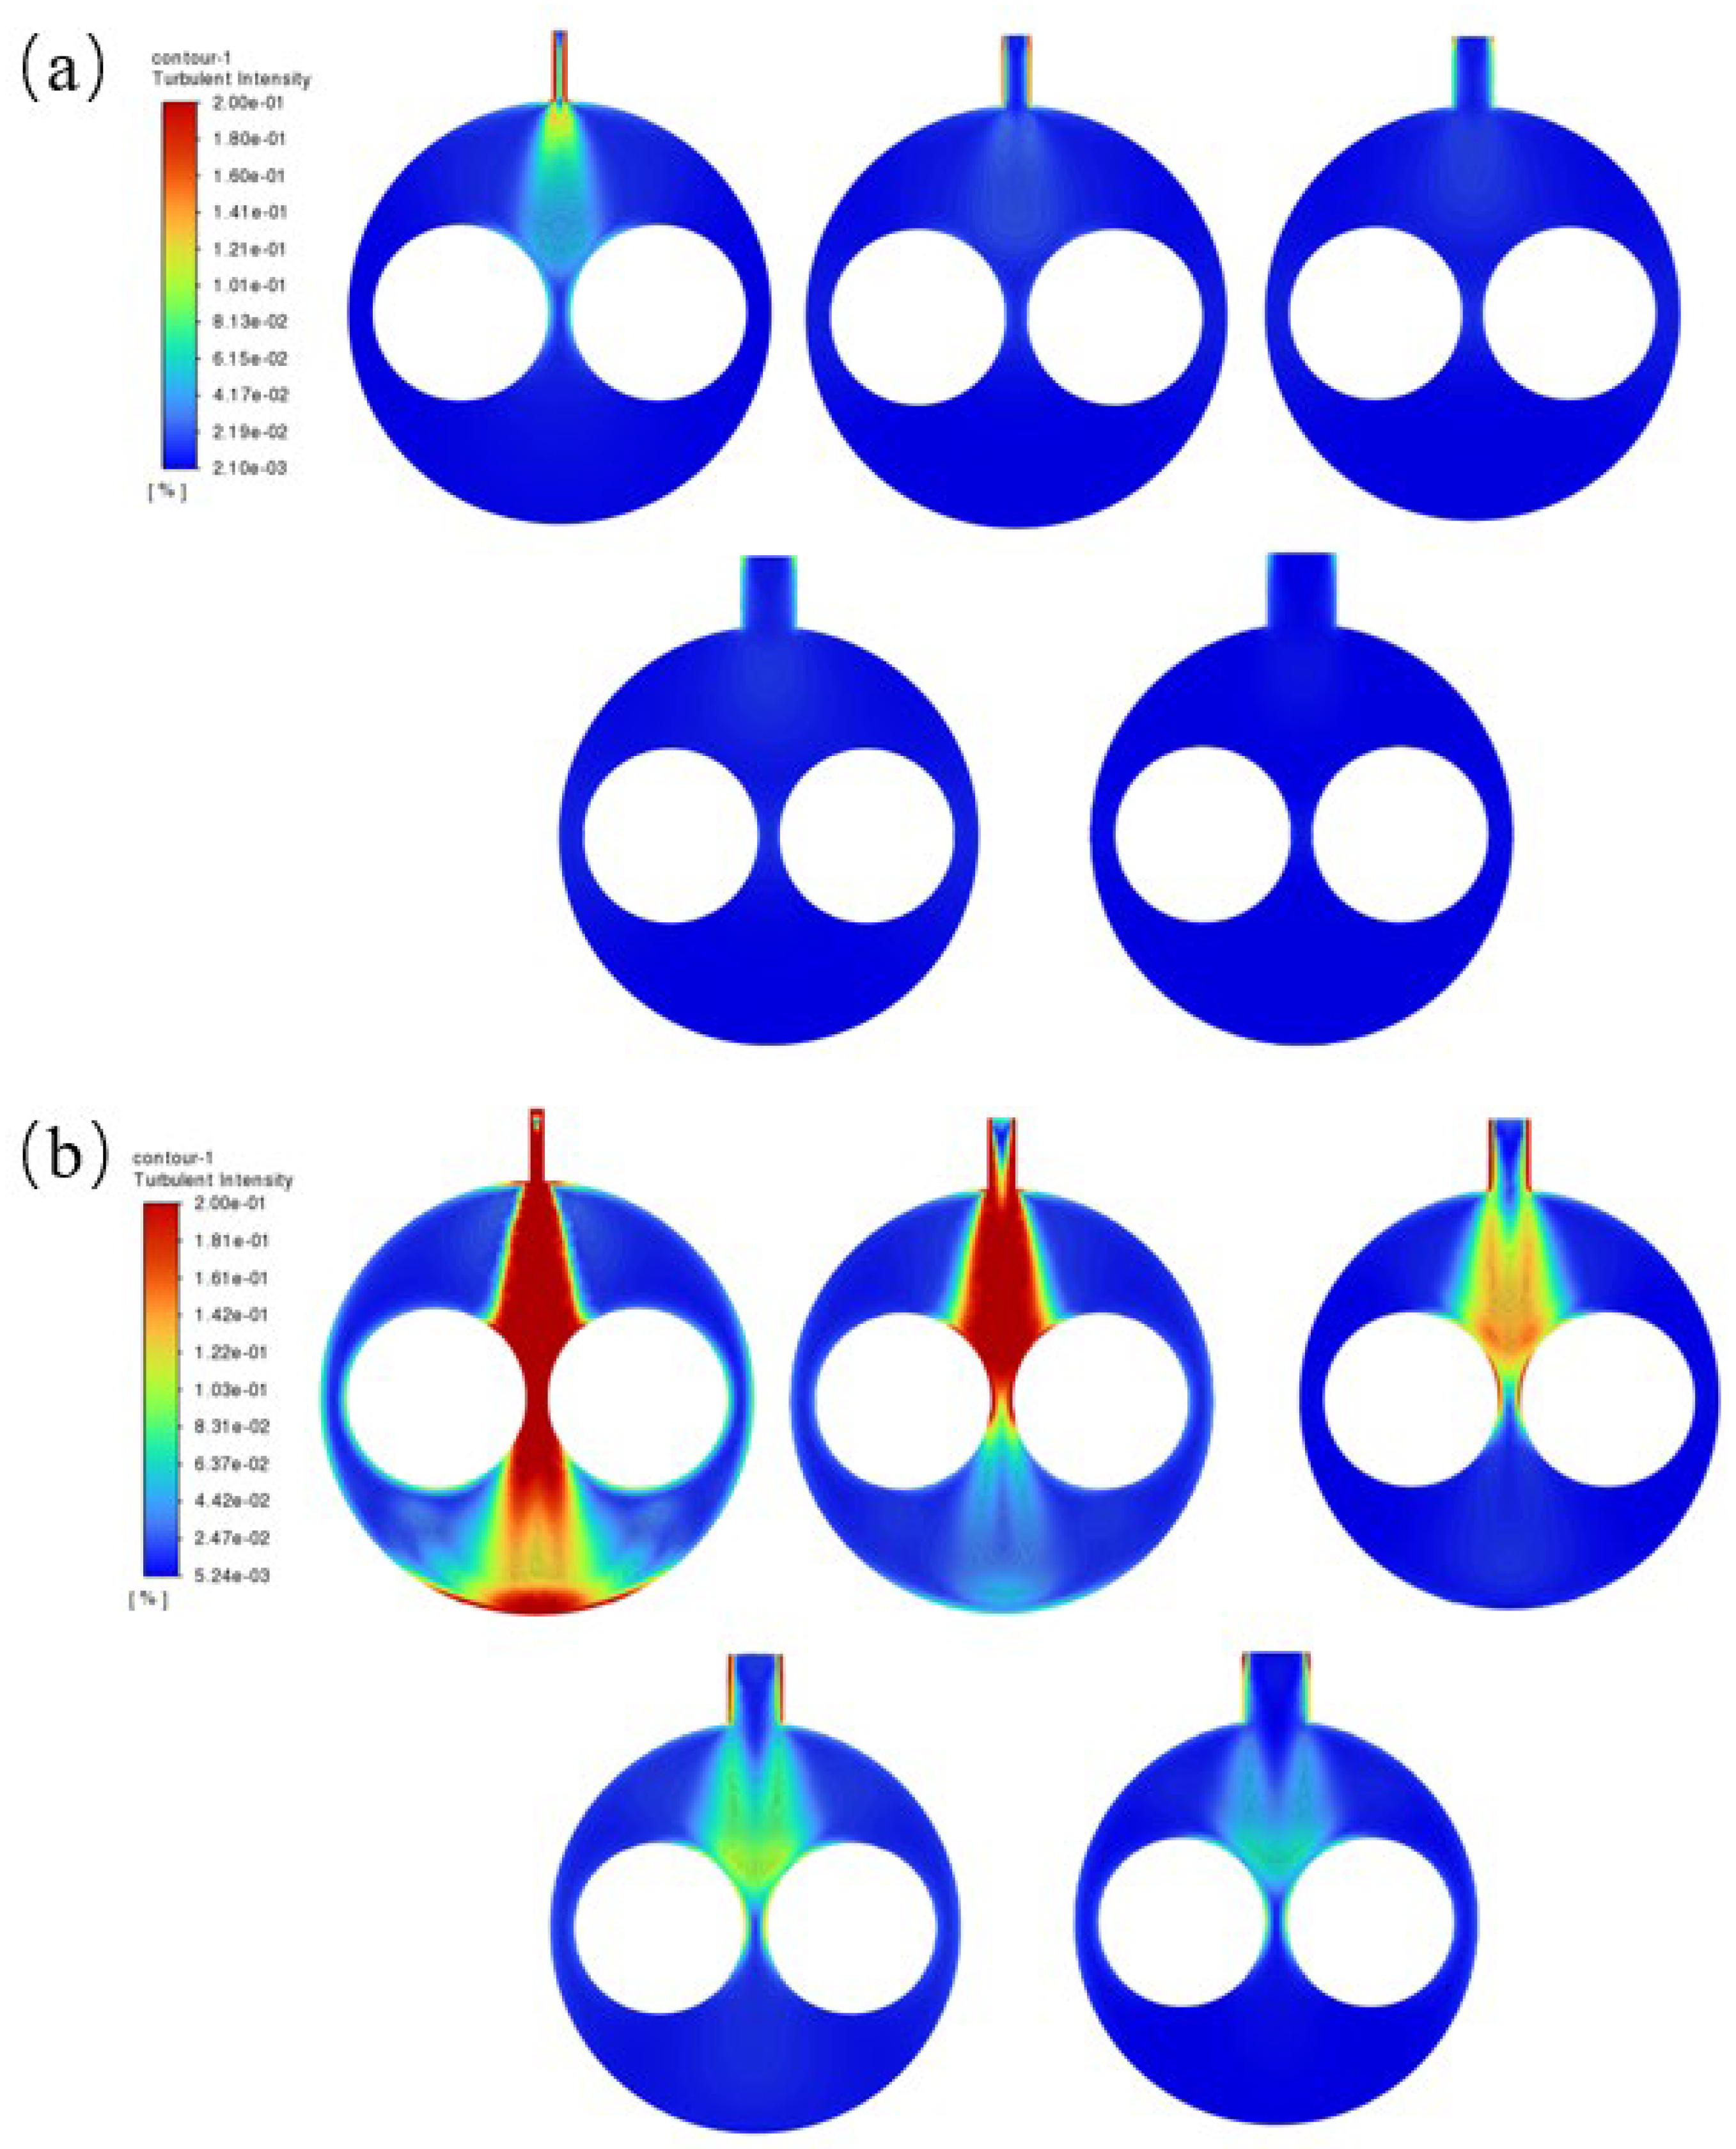
The results visualized in Figure 11 intuitively demonstrate the effect of inlet diameter variation on the flow characteristics: the turbulence intensity inside the reactor shows a significant regular change under different inlet flow conditions. Specifically, as the inlet diameter gradually increases in the range of 5–25 mm, the system turbulence intensity shows a monotonically decreasing trend. Under the same inlet diameter condition, the turbulence intensity showed a significant enhancement effect as the inlet flow rate was increased from 10 mL/min to 70 mL/min.
Based on the factors influencing the efficiency of photocatalytic reactions discussed earlier, the optimal parameters for the tubular reactor were determined as follows: inlet flow rate of 10 mL/min, inlet diameter of 10 mm, flow field configuration type b, S/V value of 0.034 m−1, and height of 450 mm. Under these conditions, the degradation rate of the TCH solution with an initial concentration of 20 mg/L reached 96.34%.

3. Materials and Methods

3.1. Materials

Titanium tetrabutoxide (Ti(OBu)4, 98%), tetracycline hydrochloride (C22H25ClN2O8, 99%), and glacial acetic acid (C2H4O2, 99.8%) were purchased from Shanghai Aladdin Biochemical Technology Co. (Shanghai, China). Anhydrous ethanol (C2H6O, 99.8%) was purchased from Tianjin Fuyu Fine Chemical Co. (Tianjin, China). A peristaltic pump was purchased from Shanghai Kachuaner Fluid Technology Co. (Shanghai, China). Quartz glass tubes were purchased from Jiangsu Donghua Quartz Products Co. (Lianyungang, China). The light source was purchased from Guangdong Shilong Bichen Co. (Dongguan, China).

3.2. Catalyst Film Preparation

TiO2 thin films were prepared by combining the Sol-gel method and dip-coating process. Titanium tetrabutoxide was mixed with anhydrous ethanol at a volume ratio of 1:4 in 80 mL, and after high-speed stirring for 10 min, the pH of the solution was adjusted to 4 by adding glacial acetic acid dropwise, and then stirring was continued for 30 min to obtain a homogeneous solution. Subsequently, the mixed solution was sealed and aged for 24 h to obtain stable, transparent and homogeneous TiO2 sol.
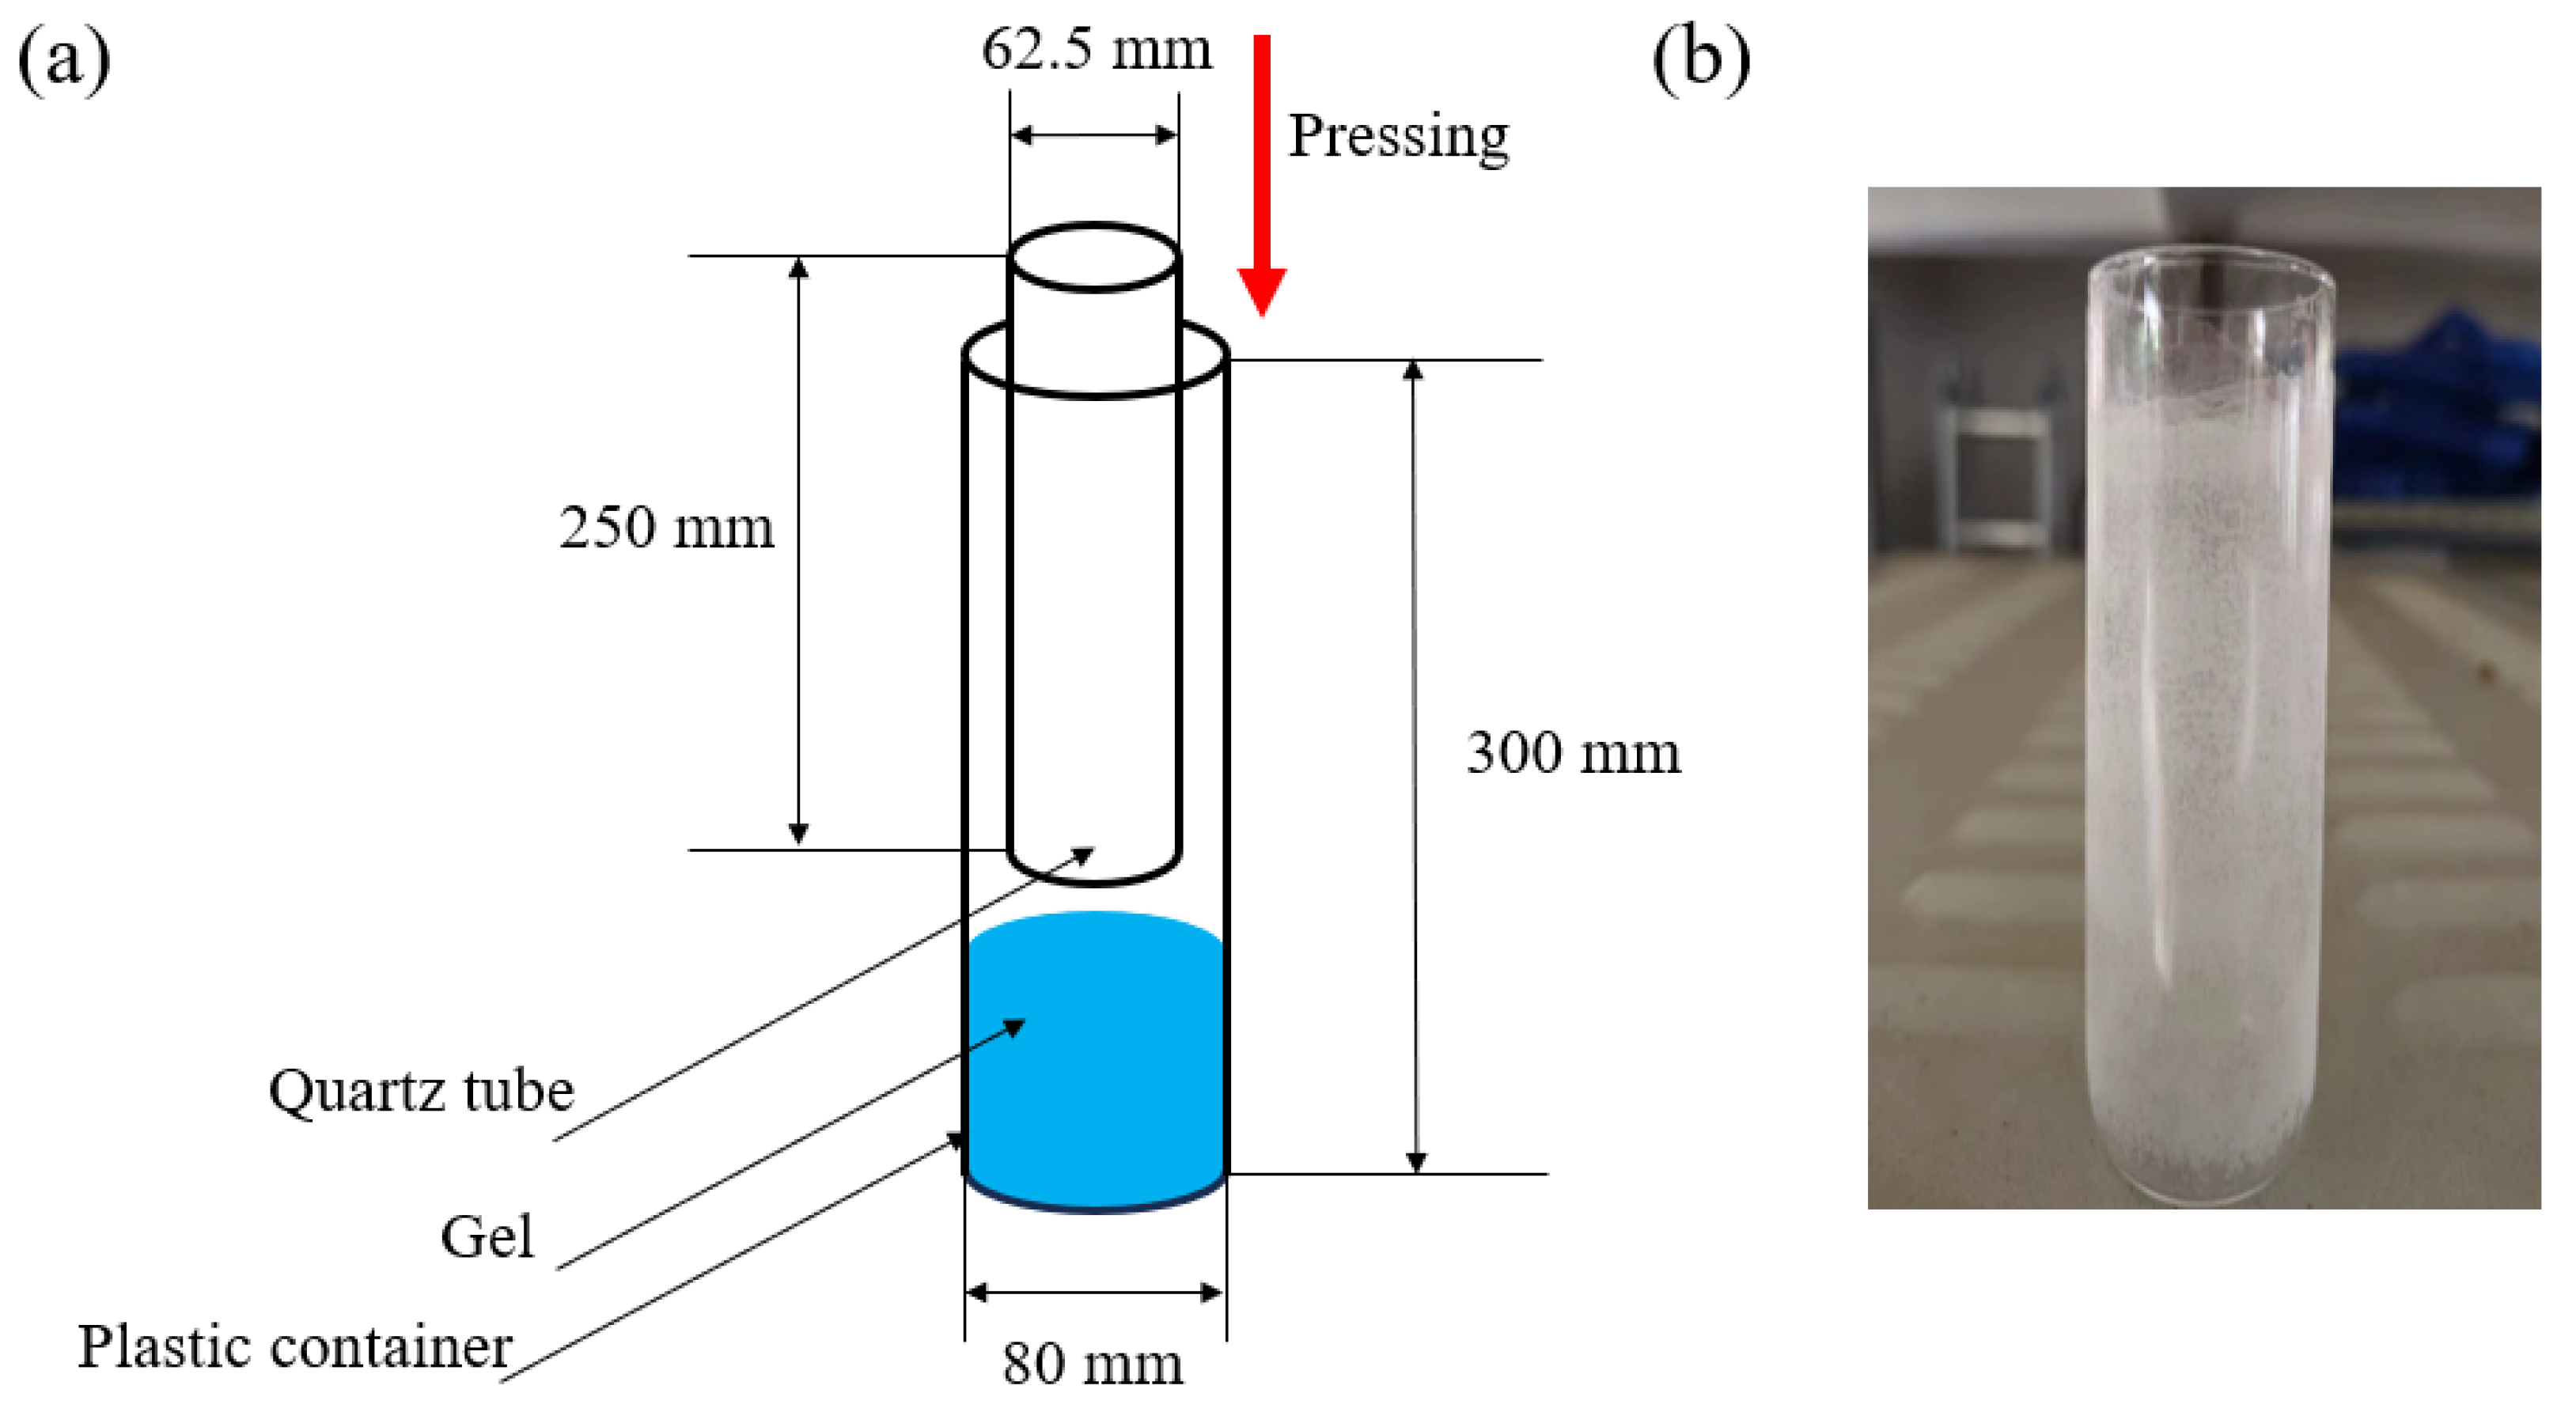
The sol was loaded onto the outer surface of a quartz glass tube by the dipping and lifting method. The quartz glass tube was vertically immersed in the TiO2 sol. After standing for 30 s, the quartz glass tube coated with TiO2 sol was slowly taken out at a constant speed, as shown in Figure 12a. The quartz tube was heat-treated at 75 °C for 20 min in a drying oven, and the above steps were repeated to obtain the predetermined number of layers. Finally, the samples were calcined at 500 °C for 60 min in a muffle furnace, followed by holding for 60 min. Figure 12b shows a quartz glass tube after the coating treatment was applied four times and is uniformly covered by TiO2.

3.3. Photocatalytic Activity Testing

3.3.1. Photocatalytic Reactor

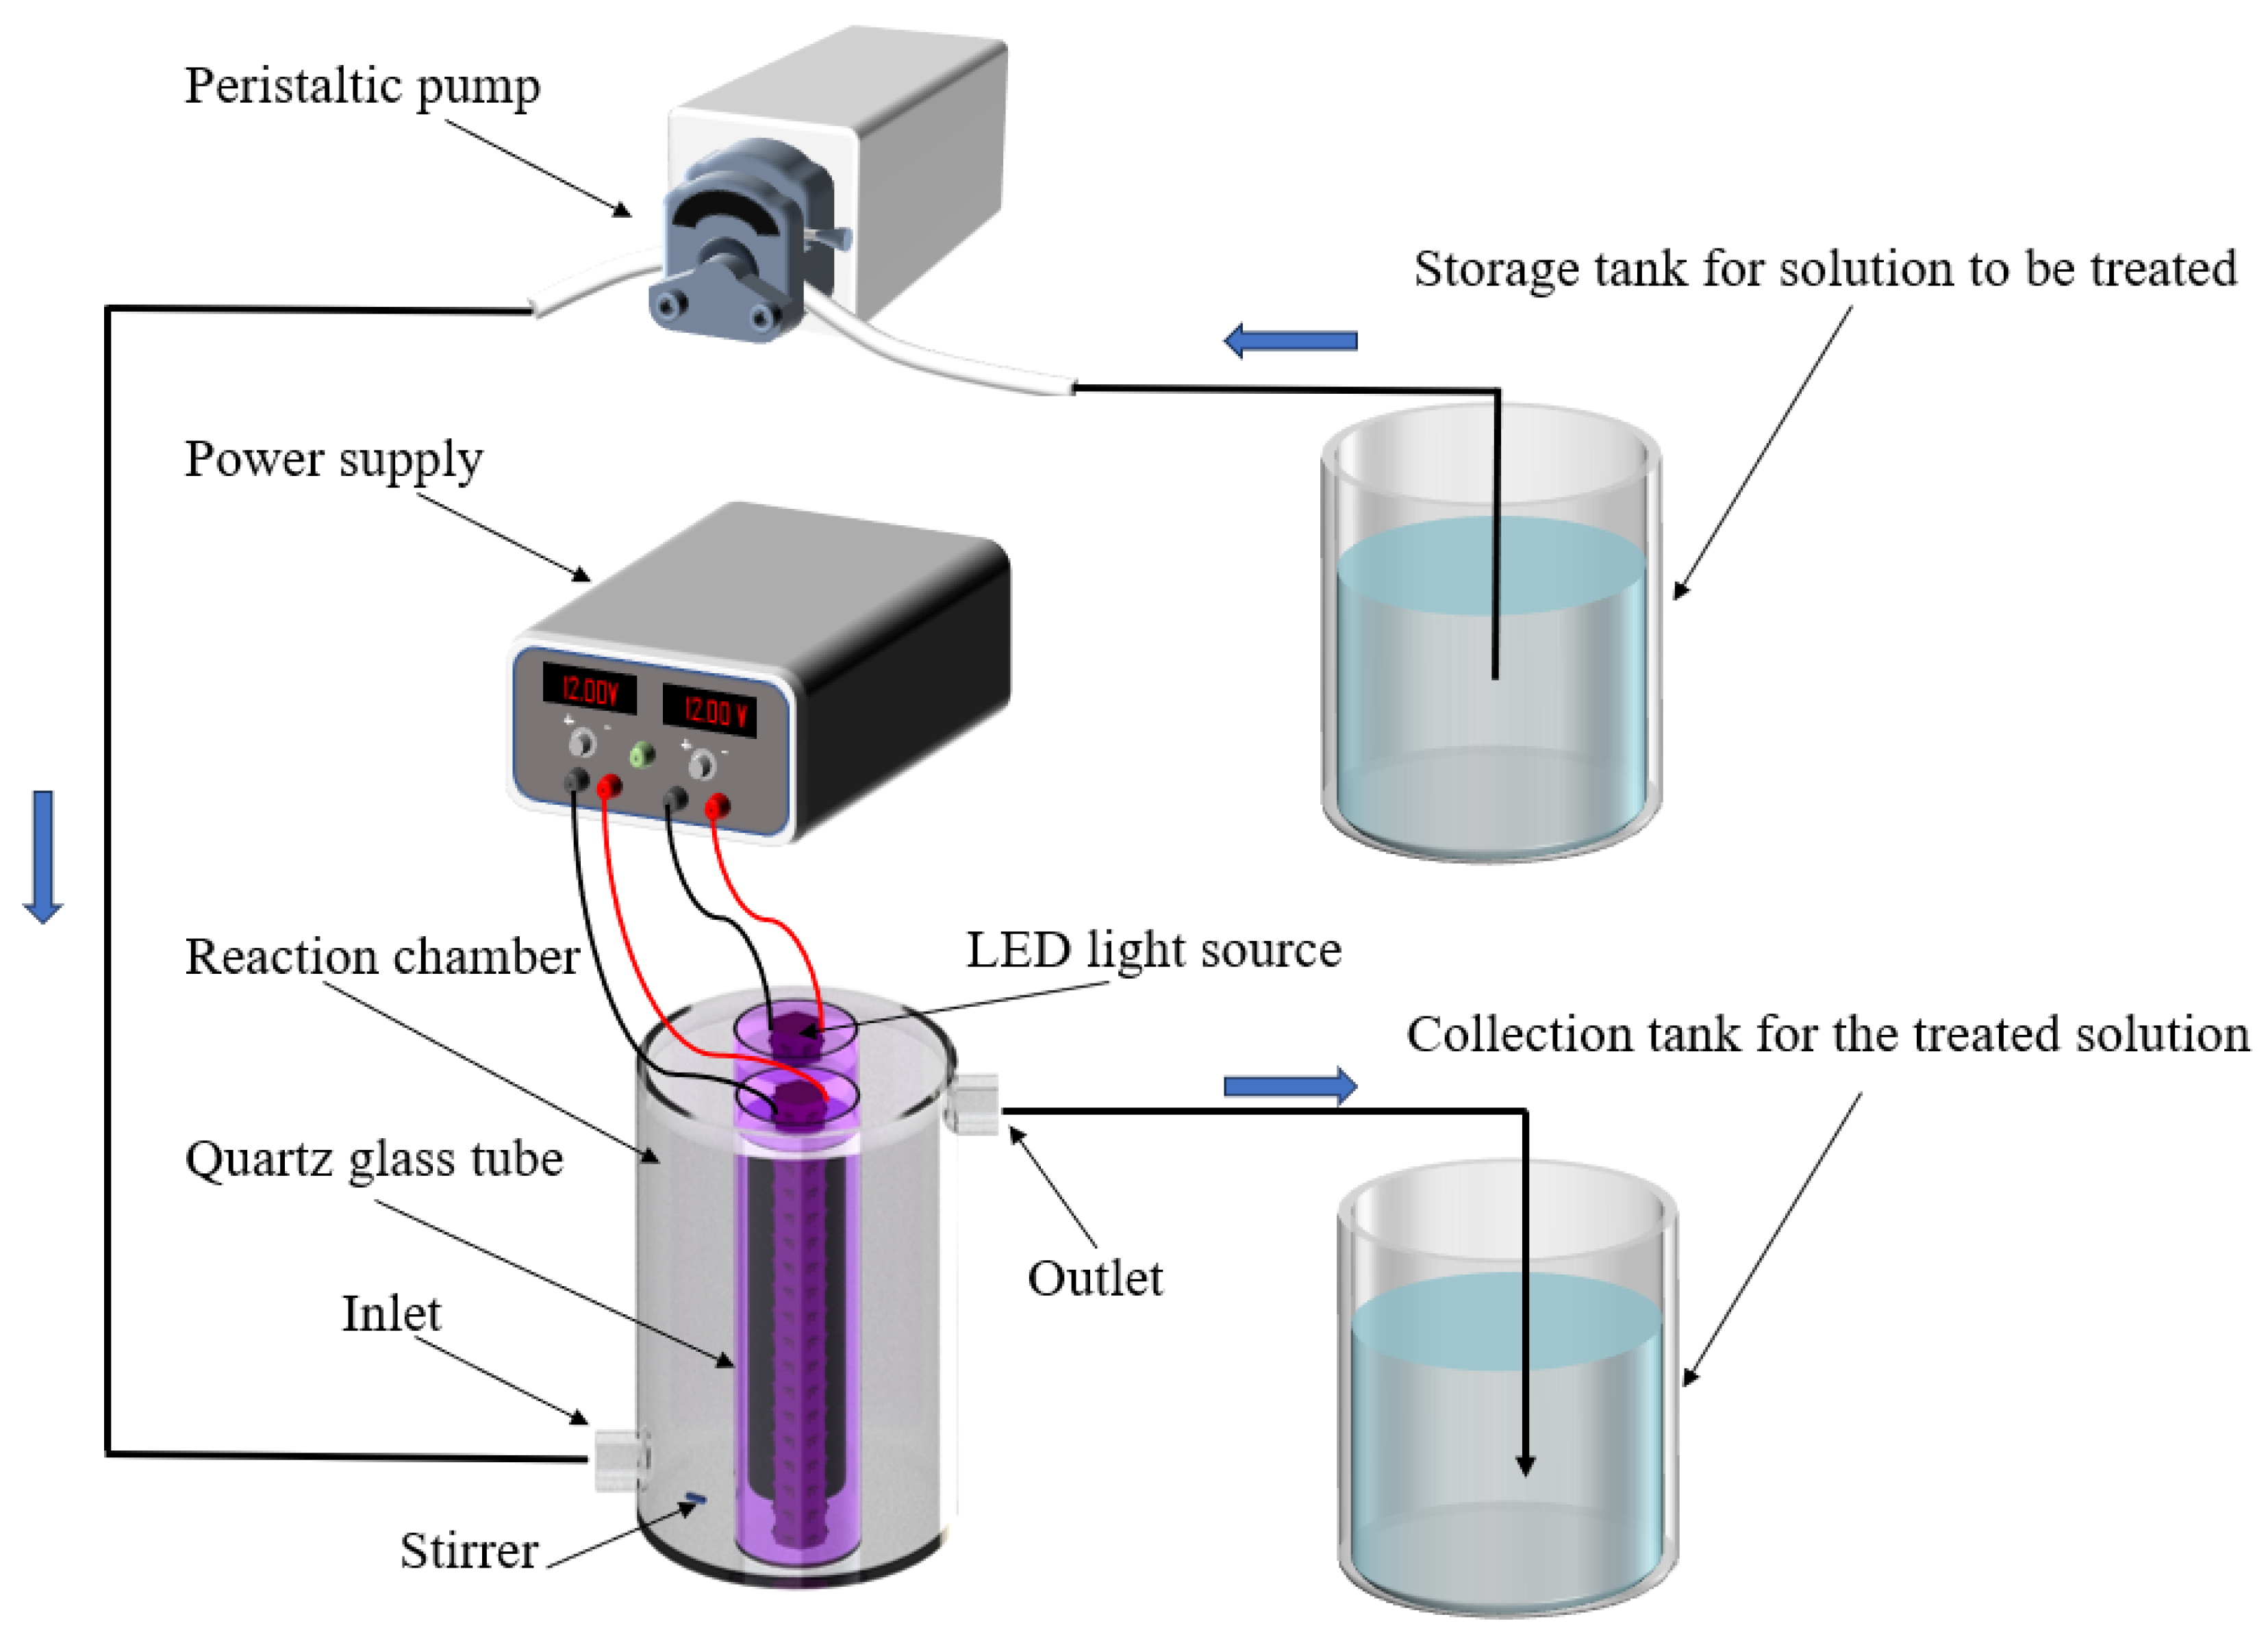
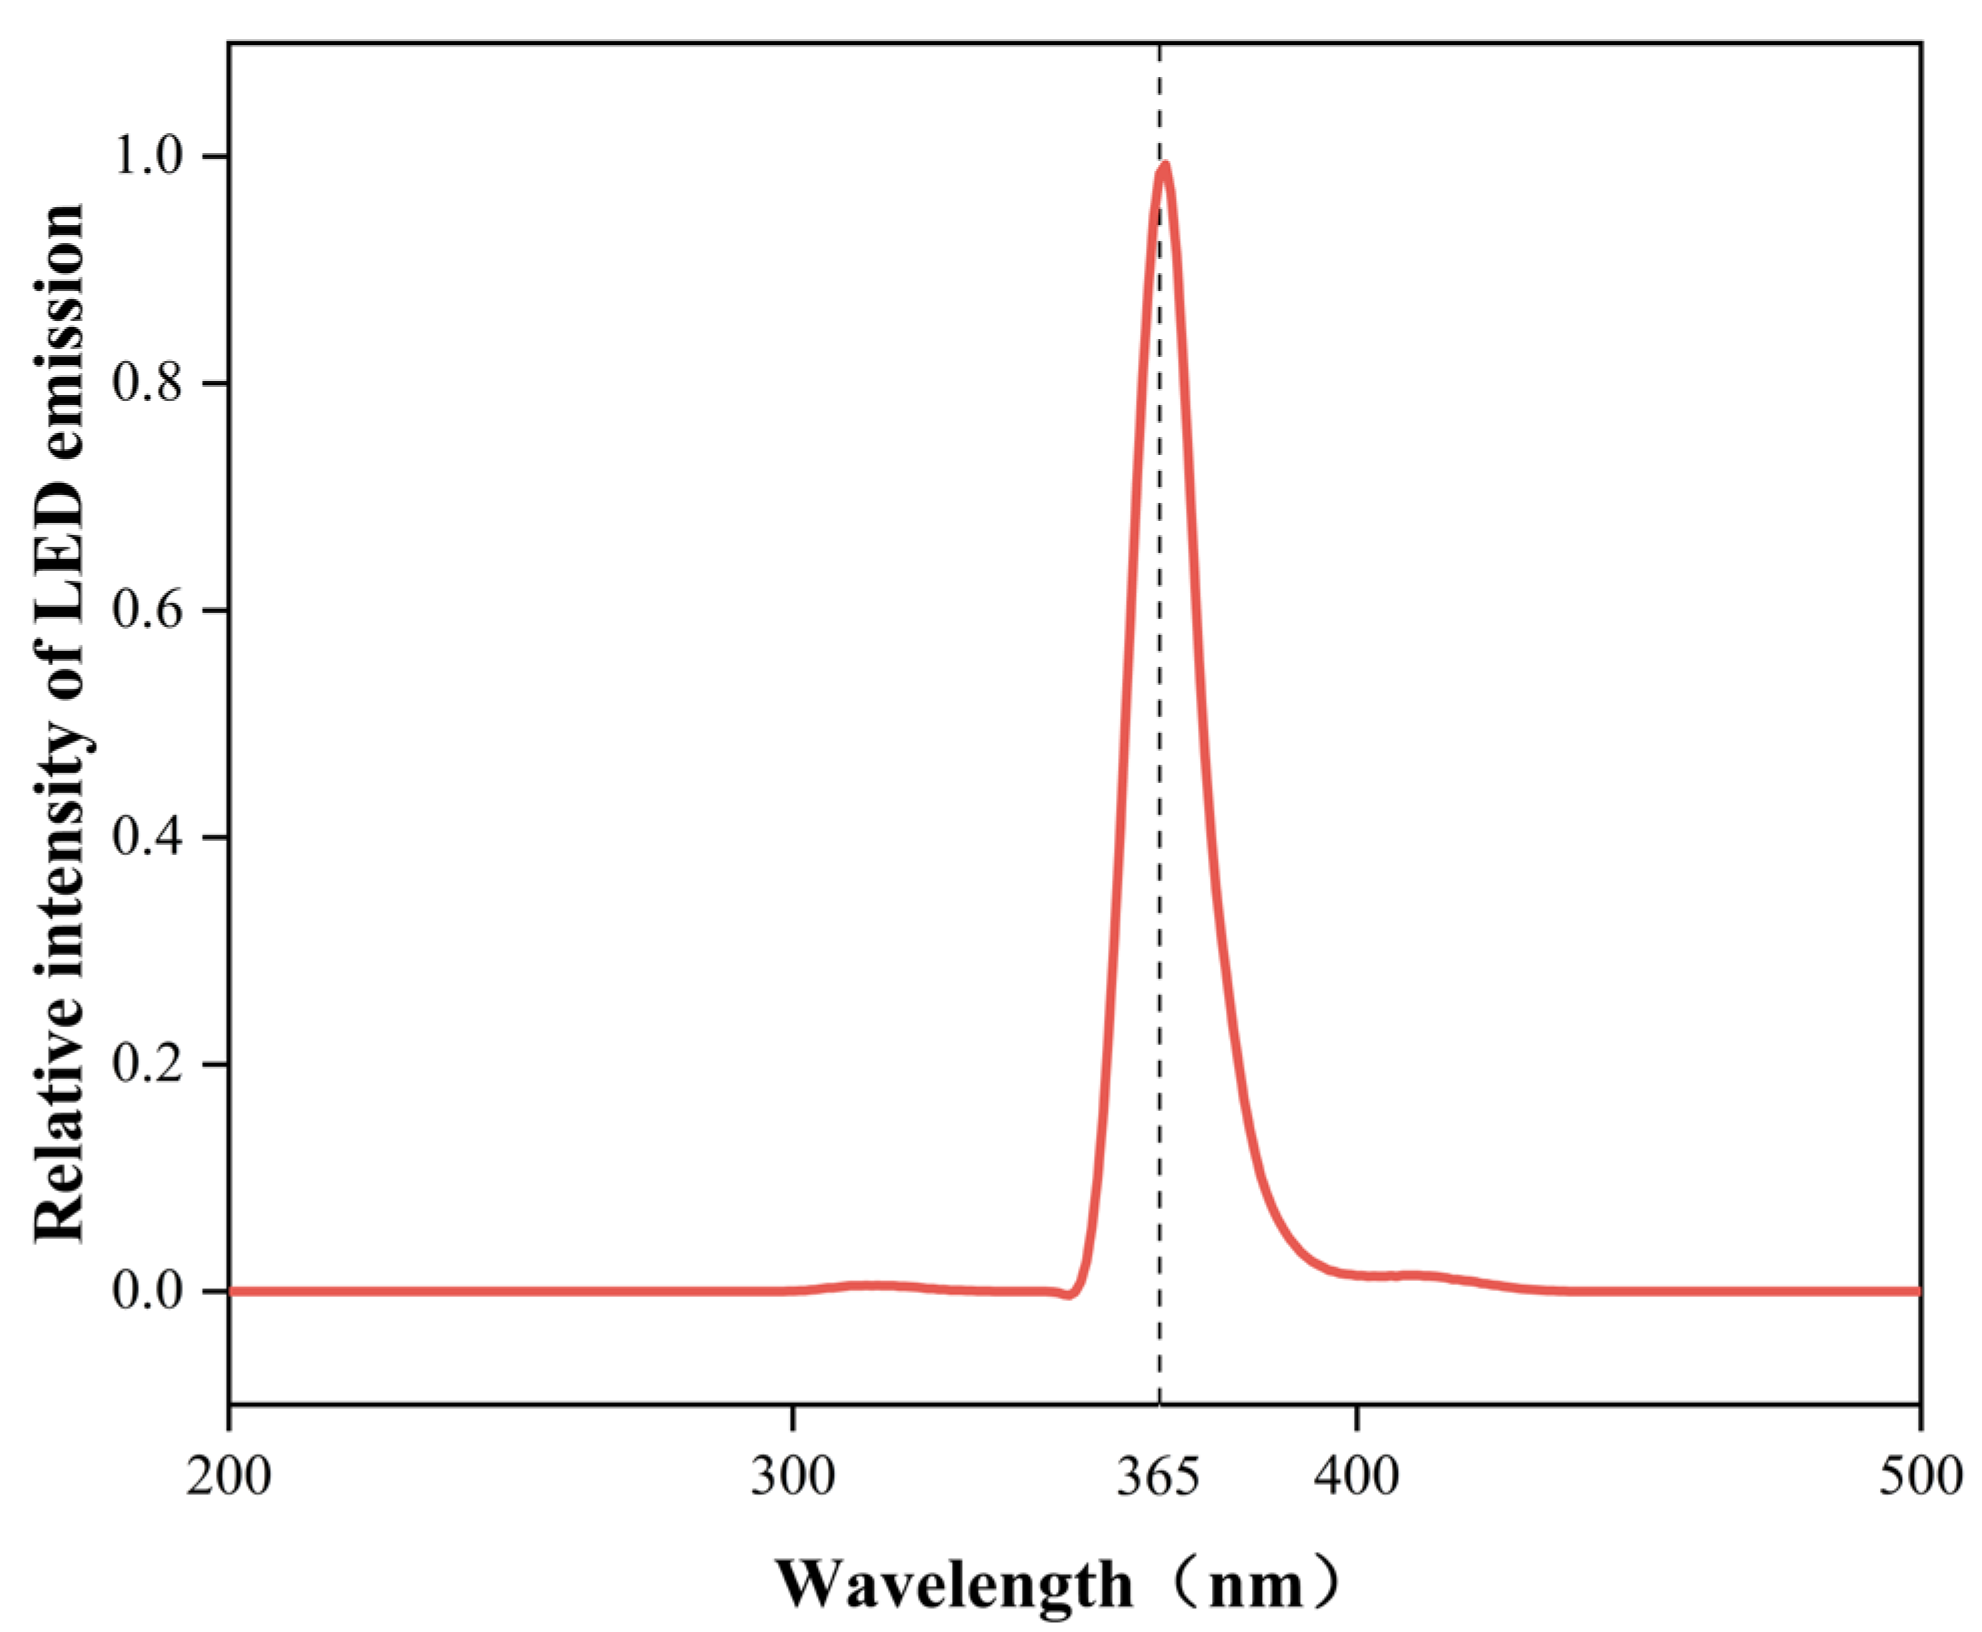
The photocatalytic reactor comprises a peristaltic pump and a reaction chamber (max. volume: 2.88 L). The solution flows from the bottom of the reaction chamber and flows out from the top. The quartz glass tube is placed in a predetermined position, and the LED array is placed in the center of the quartz glass tube, as shown in Figure 13. Regarding the UV-LED light source, its emission wavelength is between 350–385 nm, and the center wavelength is 365 nm, as shown in Figure 14.

3.3.2. Photocatalytic Degradation Experiments

The optimal loading layer number of TiO2 film was determined by batch test. The volume of the solution to be treated was 2.88 L, the corresponding TCH concentration was 20 mg/L, and the magnetic stirrer (300 rpm, 30 min) continued to work in the dark reaction to achieve adsorption–desorption equilibrium. Subsequently, TCH began to degrade under the irradiation of LED light source, and the concentration of TCH was measured every 30 min. The optimal loading layer of TiO2 film was determined by comparing the degradation rate and kinetic rate of TCH.
After the number of membrane layers was determined, the initial concentration of TCH was set to 5, 10, 15, 20 mg/L for continuous degradation. Then the solution inlet and outlet were opened, the magnetic stirrer was removed, and the peristaltic pump was turned on (25 mL/min). The sampling interval within the first 120 min of the reaction process was 30 min, and the subsequent sampling interval was 10 min.

3.4. Basic Governing Equations of Fluid Dynamics

The numerical simulation process of the continuous flow photocatalytic reaction is controlled by the continuity equation, momentum conservation equation, and component transport equation together.
The continuity equation is often used to characterize the mass conservation of a moving fluid, which allows the assumption that the mass flowing into a given volume is equal to the mass flowing out during fluid flow. For any fluid (compressible or incompressible), the differential form of the continuity equation is as shown in Equation (1) [47].
ρ t   + ( ρ u ) = 0
where ρ is the fluid density and u is the velocity of the fluid. For an incompressible fluid with constant density ( ρ = constant), the equation simplifies to Equation (2) [48]:
u = 0
The momentum conservation equation (Navier–Stokes equation of Newton’s second law, Equation (3)) is used to describe the relationship between the various forces on the fluid microclusters and the changes in their motion states. It can capture various flow patterns from laminar to turbulent [49]:
ρ u t + ρ u u = p + [ μ ( u + ( u ) T ) ( 2 3 μ u I ¯ ) ]
where μ is the dynamic fluid viscosity, p denotes the fluid pressure, and I is the unit tensor.
The component transport equation is a concrete expression of the law of conservation of mass in a multi-component system. By quantifying the contribution of different physical mechanisms to component transport, the variation in the concentration field (e.g., pollutants, reactants or products) is revealed, as shown in Equation (4) [50].
t ( ρ Y ) + ( ρ u Y ) = J + S i
where S i denotes the source term due to a chemical reaction, and J denotes the diffusive flux, which can be expressed by Equation (5).
J = ρ D Y
where D is the diffusion coefficient.

4. Conclusions

This study conducted systematic numerical simulation and structural optimization research on the process of TCH degradation in a tubular photocatalytic reactor. An effective CFD model was established. With the degradation rate of TCH as the key evaluation index, the effects of film surface area, flow field configuration, ratio of film surface area to solution volume (S/V), inlet diameter and flow rate on the degradation efficiency of the reactor were evaluated. The results showed that increasing the number of active sites by increasing the film surface area could effectively promote the reaction. With the same film surface area, different flow field configurations affected the degradation efficiency by changing the transport properties of the substances, and the degradation rates of TCH ranged from 32.15% to 64.83% under 12 configurations. Under the same flow field configuration, elevating the S/V value to increase the density of active sites per unit volume could effectively improve the degradation efficiency, and the degradation rate was enhanced by 32.73% when the S/V was increased from 0.018 m−1 to 0.034 m−1. In addition, when the inlet flow rate was constant, there existed an optimal inlet diameter to maximize the degradation rate, at which time the degradation efficiency was maximized under the influence of the turbulence effect of the flow field inside the reactor and the residence time. The optimal diameter showed an increasing trend with the increase in flow rate, and under the condition of fixed inlet diameter, the degradation rate and the inlet flow rate showed an obvious linear negative correlation. Under the optimal conditions (inlet flow rate of 10 mL/min, inlet diameter of 10 mm, flow field configuration of configuration b, S/V value of 0.034 m−1, height of 450 mm), the degradation rate of 20 mg/L of TCH reached 96.34%.

Author Contributions

Conceptualization, Z.F. and Z.Y.; validation, Z.F. and L.M.; formal analysis, Z.F. and K.Z.; investigation, Z.F.; resources, J.D. and Z.Y.; data curation, Z.F.; writing—original draft preparation, Z.F.; writing—review and editing, Z.F. and L.M.; visualization, Z.F. and X.Z.; supervision, J.D.; funding acquisition, L.M. and Z.Y. All authors have read and agreed to the published version of the manuscript.

Funding

This research was funded by the China Postdoctoral Science Foundation, grant number No. 2023M741215.

Data Availability Statement

The data presented in this study are available on request from the corresponding author.

Conflicts of Interest

The authors declare no conflicts of interest.

References

  1. Shen, Y.; Wang, Y.; Shan, P.; Xu, R.; Sun, X.; Hou, J.; Guo, F.; Li, C.; Shi, W. Boosted photo-self-fenton degradation activity by fe-doped carbon dots as dual-function active sites for in-situ H2O2 generation and activation. Sep. Purif. Technol. 2025, 353, 128529. [Google Scholar] [CrossRef]
  2. Qin, H.; He, Y.; Xu, P.; Zhu, Y.; Wang, H.; Wang, Z.; Zhao, Y.; Xie, H.; Tian, Q.; Wang, C.; et al. Carbon-doped CuFe2O4 with C--O--M channels for enhanced Fenton-like degradation of tetracycline hydrochloride: From construction to mechanism. Green Energy Environ. 2024, 9, 732–747. [Google Scholar] [CrossRef]
  3. Deng, H.; Wu, Y.; Li, L.; Jiang, X.; Wang, P.; Fang, K.; Li, J.; Hao, D.; Zhu, H.; Wang, Q.; et al. Synergistic mechanisms for efficient and safe antibiotic removal: Effective adsorption and photocatalytic degradation using aerogels. Sep. Purif. Technol. 2025, 354, 129455. [Google Scholar] [CrossRef]
  4. Wu, Z.; Liu, J.; Shi, J.; Deng, H. Bi2Fe4O9/rGO nanocomposite with visible light photocatalytic performance for tetracycline degradation. Environ. Res. 2024, 249, 118361. [Google Scholar] [CrossRef] [PubMed]
  5. Yang, D.; Ye, Q.; Qu, C.; Meng, F.; Wang, L.; Li, Y. Enhanced hydrogen evolution and tetracycline degradation by a Z-scheme g-C3N4 nanosheets loaded CeO2 photocatalyst under visible light irradiation. J. Environ. Chem. Eng. 2024, 12, 112563. [Google Scholar] [CrossRef]
  6. Wang, X.; Lin, S.; Cui, N.; Qi, K.; Liu, S.; Khan, I. Synthesis of ZnWO4/NiWO4 photocatalysts and their application in tetracycline hydrochloride degradation and antibacterial activities. J. Taiwan Inst. Chem. Eng. 2024, 157, 105408. [Google Scholar] [CrossRef]
  7. Zhang, X.; Zhu, Z.; Rao, R.; Chen, J.; Han, X.; Jiang, S.; Yang, Y.; Wang, Y.; Wang, L. Highly efficient visible-light-driven photocatalytic degradation of gaseous toluene by rutile-anatase TiO2@MIL-101 composite with two heterojunctions. J. Environ. Sci. 2023, 134, 21–33. [Google Scholar] [CrossRef]
  8. Khan, H. Sol-Gel Synthesis of TiO2 from TiOSO4 (Part 2): Kinetics and Photocatalytic Efficiency of Methylene Blue Degradation Under UV Irradiation. Catalysts 2025, 15, 64. [Google Scholar] [CrossRef]
  9. Haque, F.; Blanchard, A.; Laipply, B.; Dong, X. Visible-Light-Activated TiO2-Based Photocatalysts for the Inactivation of Pathogenic Bacteria. Catalysts 2024, 14, 855. [Google Scholar] [CrossRef]
  10. Lu, Z.; Peng, J.; Song, M.; Liu, Y.; Liu, X.; Huo, P.; Dong, H.; Yuan, S.; Ma, Z.; Han, S. Improved recyclability and selectivity of environment-friendly mfa-based heterojunction imprinted photocatalyst for secondary pollution free tetracycline orientation degradation. Chem. Eng. J. 2019, 360, 1262–1276. [Google Scholar] [CrossRef]
  11. Pérez, T.A.; Gerónimo, E.S.; Torres, J.G.; Del Angel Montes, G.A.; Vázquez, I.R.; García, A.C.; Uribe, A.C.; Pavon, A.A.; Pérez, J.C. Photocatalytic Oxidation of Pesticides with TiO2-CeO2 Thin Films Using Sunlight. Catalysts 2025, 15, 46. [Google Scholar] [CrossRef]
  12. Morante, N.; De Guglielmo, L.; Oliva, N.; Monzillo, K.; Femia, N.; Di Capua, G.; Vaiano, V.; Sannino, D. Influence of UV-A Light Modulation on Phenol Mineralization by TiO2 Photocatalytic Process Coadjuvated with H2O2. Catalysts 2024, 14, 544. [Google Scholar] [CrossRef]
  13. Wu, C.; Maggay, I.V.; Chiang, C.; Chen, W.; Chang, Y.; Hu, C.; Venault, A. Removal of tetracycline by a photocatalytic membrane reactor with MIL-53(Fe)/PVDF mixed-matrix membrane. Chem. Eng. J. 2023, 451, 138990. [Google Scholar] [CrossRef]
  14. Lian, Z.; Wu, T.; Zhang, X.; Cai, S.; Xiong, Y.; Yang, R. Synergistic degradation of tetracycline from Mo2C/MoOx films mediated peroxymonosulfate activation and visible-light triggered photocatalysis. Chem. Eng. J. 2023, 469, 143774. [Google Scholar] [CrossRef]
  15. Xu, C.; Ye, S.; Cui, X.; Song, X.; Xie, X. Modelling photocatalytic detoxification of aflatoxin B1 in peanut oil on TiO2 layer in a closed-loop reactor. Biosyst. Eng. 2019, 180, 87–95. [Google Scholar] [CrossRef]
  16. Das, S.; Mahalingam, H. Novel immobilized ternary photocatalytic polymer film based airlift reactor for efficient degradation of complex phthalocyanine dye wastewater. J. Hazard. Mater. 2020, 383, 121219. [Google Scholar] [CrossRef]
  17. Deng, B.; Jiang, Y.; Gao, L.; Zhao, B. CFD modeling of ethylene degradation in gas-phase photocatalytic reactors. Environ. Sci. Pollut. Res. 2023, 30, 24132–24142. [Google Scholar] [CrossRef]
  18. Heris, S.Z.; Etemadi, M.; Mousavi, S.B.; Mohammadpourfard, M.; Ramavandi, B. Preparation and characterizations of TiO2/ZnO nanohybrid and its application in photocatalytic degradation of tetracycline in wastewater. J. Photochem. Photobiol. A Chem. 2023, 443, 114893. [Google Scholar]
  19. Lira, J.O.B.; Riella, H.G.; Padoin, N.; Soares, C. CFD + DoE optimization of a flat plate photocatalytic reactor applied to NOx abatement. Chem. Eng. Process.-Process Intensif. 2020, 154, 107998. [Google Scholar] [CrossRef]
  20. Ahmed, S.; Rasul, M.G.; Sattar, M.A.; Jahirul, M.I. Phenol degradation of waste and stormwater on a flat plate photocatalytic reactor with TiO2 on glass slide: An experimental and modelling investigation. J. Water Process Eng. 2022, 47, 102769. [Google Scholar] [CrossRef]
  21. Khataee, A.; Farshchi, M.E.; Fathinia, M.; Aghdasinia, H. Photocatalytic ozonation process for degradation of an anthelmintic drug using ceramic coated TiO2 NPs: CFD simulation coupling with kinetic mechanisms. Process Saf. Environ. Prot. 2020, 141, 37–48. [Google Scholar] [CrossRef]
  22. Tong, K.; Yang, L.; Du, X.; Yang, Y. Review of modeling and simulation strategies for unstructured packing bed photoreactors with CFD method. Renew. Sustain. Energy Rev. 2020, 131, 109986. [Google Scholar] [CrossRef]
  23. Alarcón, A.; Busqué, R.; Andreu, T.; Guilera, J. Design of a Multi-Tubular Catalytic Reactor Assisted by CFD Based on Free-Convection Heat-Management for Decentralised Synthetic Methane Production. Catalysts 2022, 12, 1053. [Google Scholar] [CrossRef]
  24. Phuan, Y.W.; Ismail, H.M.; Garcia-Segura, S.; Chong, M.N. Design and CFD modelling of the anodic chamber of a continuous photofuelcell reactor for water treatment. Process Saf. Environ. Prot. 2017, 111, 449–461. [Google Scholar] [CrossRef]
  25. Verbruggen, S.W.; Keulemans, M.; van Walsem, J.; Tytgat, T.; Lenaerts, S.; Denys, S. CFD modeling of transient adsorption/desorption behavior in a gas phase photocatalytic fiber reactor. Chem. Eng. J. 2016, 292, 42–50. [Google Scholar] [CrossRef]
  26. Verbruggen, S.W.; Lenaerts, S.; Denys, S. Analytic versus CFD approach for kinetic modeling of gas phase photocatalysis. Chem. Eng. J. 2015, 262, 1–8. [Google Scholar] [CrossRef]
  27. Matiazzo, T.; Vilar, V.J.P.; Riella, H.G.; Padoin, N.; Soares, C. CFD and radiation field modeling of the NETmix milli-photocatalytic reactor for n-decane oxidation at gas phase: Effect of LEDs number and arrangement. Chem. Eng. J. 2022, 444, 136577. [Google Scholar] [CrossRef]
  28. van Walsem, J.; Verbruggen, S.W.; Modde, B.; Lenaerts, S.; Denys, S. CFD investigation of a multi-tube photocatalytic reactor in non-steady-state conditions. Chem. Eng. J. 2016, 304, 808–816. [Google Scholar] [CrossRef]
  29. Luo, M.; Zeng, F.; Jeong, T.; Wu, G.; Guan, Q. CFD Modeling of UV/H2O2 Process in Internal Airlift Circulating Photoreactor. Water 2020, 12, 3237. [Google Scholar] [CrossRef]
  30. Duran, J.E.; Mohseni, M.; Taghipour, F. Design improvement of immobilized photocatalytic reactors using a CFD-Taguchi combined method. Ind. Eng. Chem. Res. 2011, 50, 824–831. [Google Scholar] [CrossRef]
  31. Tedesco, G.C.; Moraes, P.B. Innovative design of a continuous flow photoelectrochemical reactor: Hydraulic design, CFD simulation and prototyping. J. Environ. Chem. Eng. 2021, 9, 105917. [Google Scholar] [CrossRef]
  32. Einaga, H.; Tokura, J.; Teraoka, Y.; Ito, K. Kinetic analysis of TiO2-catalyzed heterogeneous photocatalytic oxidation of ethylene using computational fluid dynamics. Chem. Eng. J. 2015, 263, 325–335. [Google Scholar] [CrossRef]
  33. Wang, X.; Tan, X.; Yu, T. Kinetic study of ozone photocatalytic decomposition using a thin film of TiO2 coated on a glass plate and the CFD modeling approach. Ind. Eng. Chem. Res. 2014, 53, 7902–7909. [Google Scholar] [CrossRef]
  34. Tong, K.; Yang, L.; Du, X. Modelling of TiO2-based packing bed photocatalytic reactor with Raschig rings for phenol degradation by coupled CFD and DEM. Chem. Eng. J. 2020, 400, 125988. [Google Scholar] [CrossRef]
  35. Balestrin, E.; Valle, R.D.C.S.; de Souza, S.M.A.G.; Valle, J.A.B.; Da Silva, A. Performance analysis of photocatalytic reactor with immobilized catalyst for emerging pollutants water treatment using CFD simulation and optimization method. Chem. Eng. Process.-Process Intensif. 2024, 205, 110016. [Google Scholar] [CrossRef]
  36. Pandey, P.; Mohanan, S.; Surenjan, A. Photocatalytic degradation of metformin on a rectangular baffled reactor: CFD modeling and validation investigation. Chem. Eng. Process.-Process Intensif. 2024, 202, 109833. [Google Scholar] [CrossRef]
  37. de OB Lira, J.; Padoin, N.; Vilar, V.J.P.; Soares, C. Photocatalytic NOx abatement: Mathematical modeling, CFD validation and reactor analysis. J. Hazard. Mater. 2019, 372, 145–153. [Google Scholar] [CrossRef]
  38. Zhu, K.; Ma, L.; Duan, J.; Fang, Z.; Yang, Z. Photocatalytic Degradation of Tetracycline Hydrochloride Using TiO2/CdS on Nickel Foam Under Visible Light and RSM–BBD Optimization. Catalysts 2025, 15, 113. [Google Scholar] [CrossRef]
  39. Li, C.; Lu, Z.; Ao, X.; Sun, W.; Huang, X. Degradation kinetics and removal efficiencies of pharmaceuticals by photocatalytic ceramic membranes using ultraviolet light-emitting diodes. Chem. Eng. J. 2022, 427, 130828. [Google Scholar] [CrossRef]
  40. Ma, L.; Duan, J.; Ji, B.; Liu, Y.; Li, C.; Li, C.; Zhao, W.; Yang, Z. Ligand-metal charge transfer mechanism enhances TiO2/Bi2WO6/rGO nanomaterials photocatalytic efficient degradation of norfloxacin under visible light. J. Alloys Compd. 2021, 869, 158679. [Google Scholar] [CrossRef]
  41. Muñoz, V.; Casado, C.; Suárez, S.; Sánchez, B.; Marugán, J. Photocatalytic NOx removal: Rigorous kinetic modelling and ISO standard reactor simulation. Catal. Today 2019, 326, 82–93. [Google Scholar] [CrossRef]
  42. Borrás-Jiménez, D.; Silva-López, W.; Nieto-Londoño, C. Towards the configuration of a photoelectrocatalytic reactor: Part 2—Selecting photoreactor flow configuration and operating variables by a numerical approach. Nanomaterials 2022, 12, 3030. [Google Scholar] [CrossRef] [PubMed]
  43. Rasul, M.G.; Ahmed, S.; Sattar, M.A.; Jahirul, M.I. Hydrodynamic performance assessment of photocatalytic reactor with baffles and roughness in the flow path: A modelling approach with experimental validation. Heliyon 2023, 9, e19623. [Google Scholar] [CrossRef] [PubMed]
  44. Kaisare, N.S.; Di Sarli, V. The Effect of Catalyst Placement on the Stability of a U-Bend Catalytic Heat-Recirculating Micro-Combustor: A Numerical Investigation. Catalysts 2021, 11, 1560. [Google Scholar] [CrossRef]
  45. Garretón, G.; Maxwell, L.; Cornejo, I. Transition of the flow regime inside of monolith microchannel reactors fed with highly turbulent flow. Catalysts 2023, 13, 938. [Google Scholar] [CrossRef]
  46. Whyte, H.E.; Subrenat, A.; Raillard, C.; Héquet, V. Understanding the influence of media geometry on the degradation of acrylonitrile: Experimental and CFD analysis. Chem. Eng. Sci. 2019, 209, 115217. [Google Scholar] [CrossRef]
  47. De Brito Lira, J.O.; Riella, H.G.; Padoin, N.; Soares, C. An Overview of Photoreactors and Computational Modeling for the Intensification of Photocatalytic Processes in the Gas-Phase: State-of-Art. J. Environ. Chem. Eng. 2021, 9, 105068. [Google Scholar] [CrossRef]
  48. Lira, J.O.B.; Riella, H.G.; Padoin, N.; Soares, C. Computational fluid dynamics (CFD), artificial neural network (ANN) and genetic algorithm (GA) as a hybrid method for the analysis and optimization of micro-photocatalytic reactors: NOx abatement as a case study. Chem. Eng. J. 2022, 431, 133771. [Google Scholar] [CrossRef]
  49. Gholami, D.; Shahbazi, S.; Mosleh, S.; Ghoorchian, A.; Hajati, S.; Dashtian, K.; Yasin, G. In situ growth of CuFeS2/CuS bridged heterojunction catalyst with mixed redox-couple cations for excellent photocatalytic degradation of organophosphate insecticide: CFD and DFT modeling. Chem. Eng. J. 2023, 461, 141950. [Google Scholar] [CrossRef]
  50. Gao, J.; Dong, P.; Tan, J.; Zhang, L.; Wang, C. Optimal design of novel honeycomb photocatalytic reactors for numerical analysis of formaldehyde degradation by CFD modeling. Res. Chem. Intermed. 2023, 49, 1683–1700. [Google Scholar] [CrossRef]
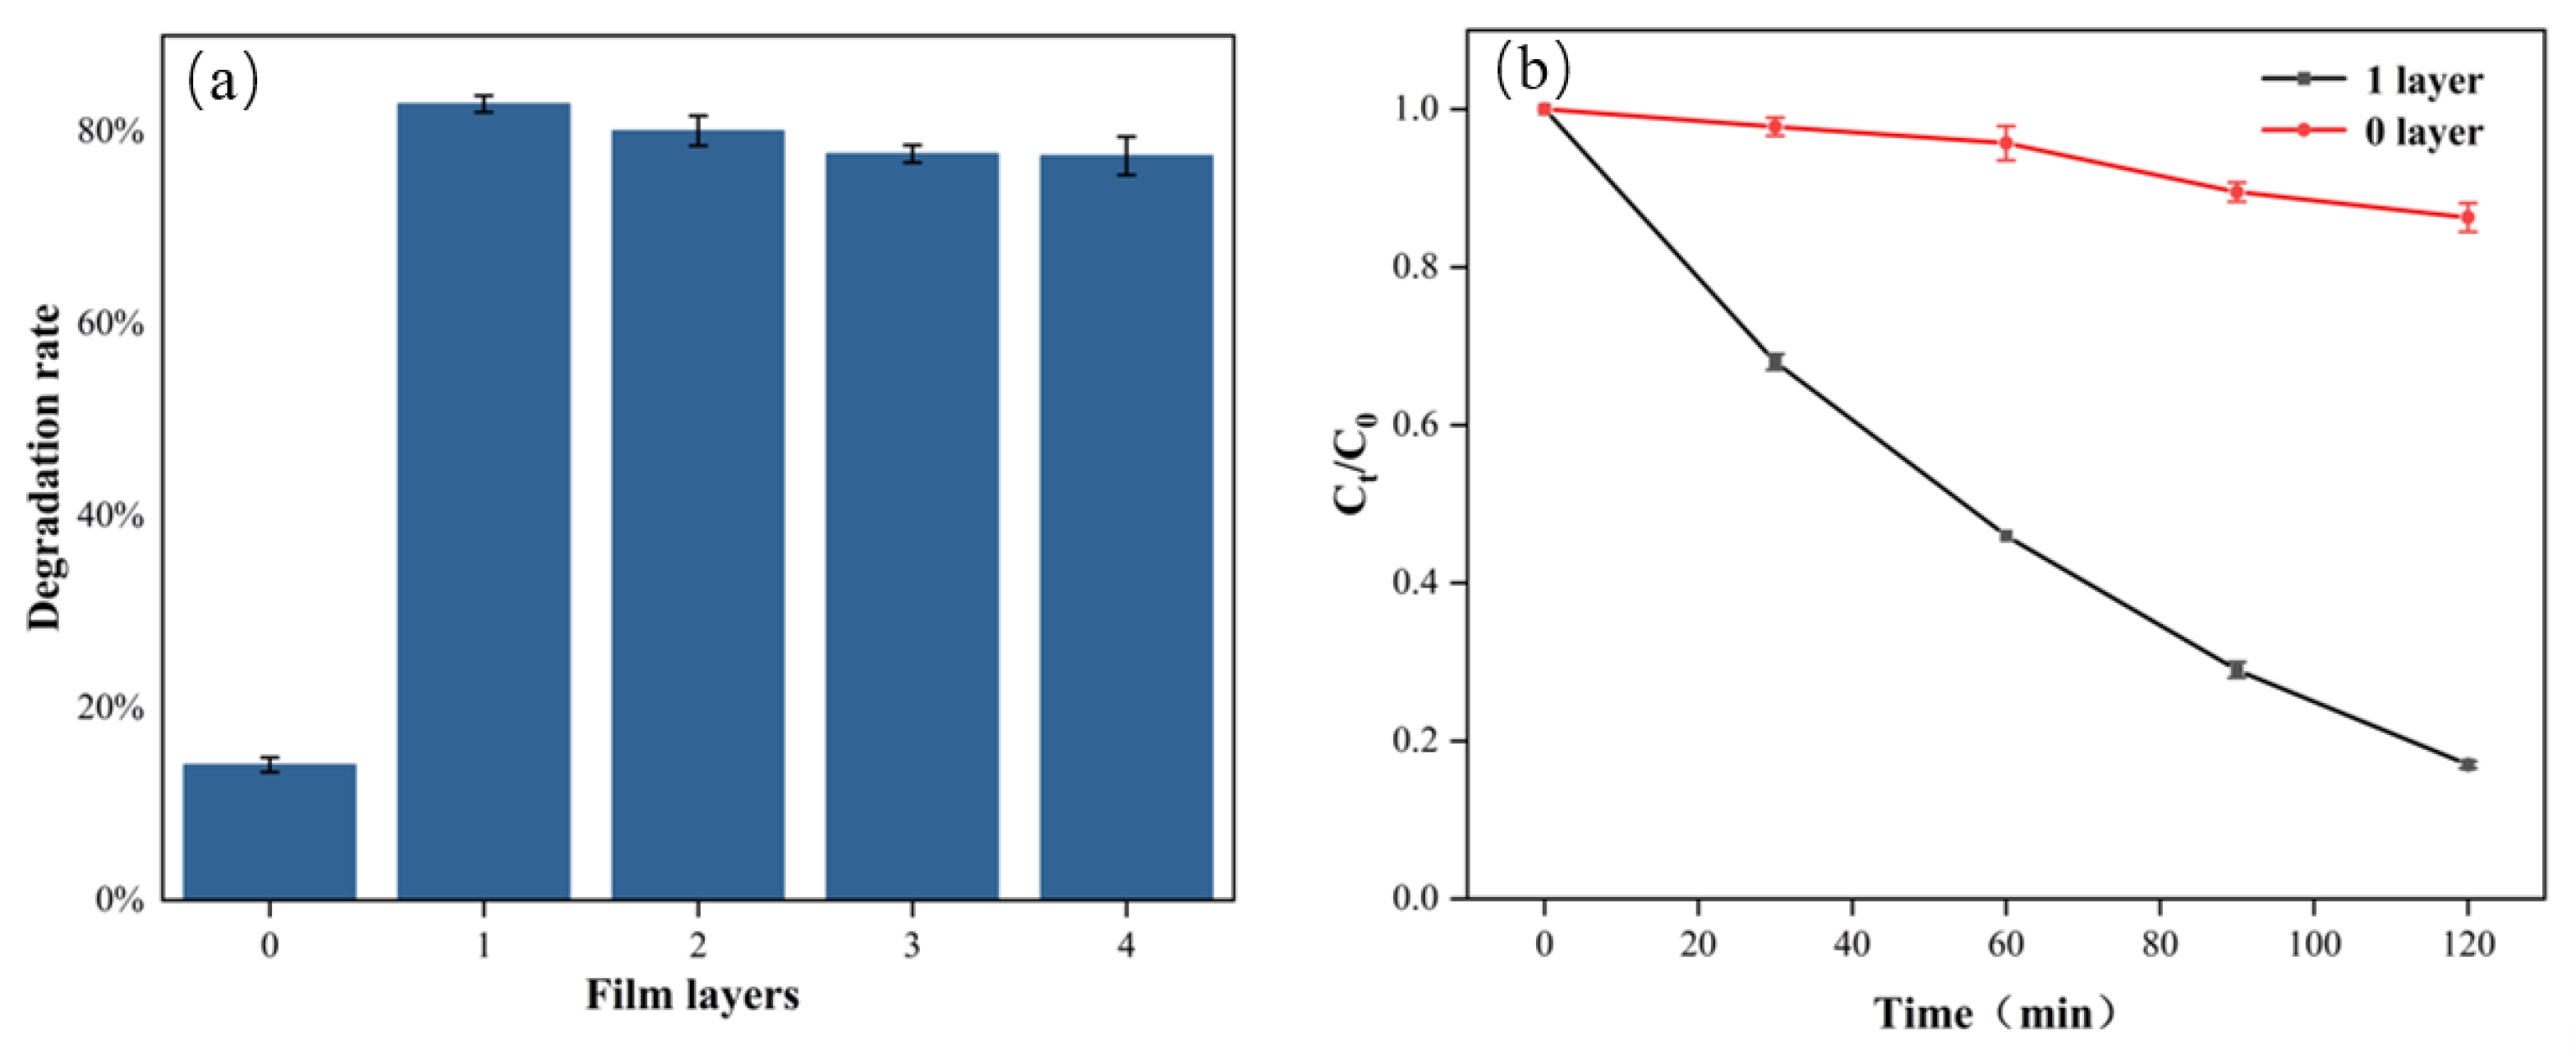
Figure 1. (a) Variation in degradation rate of TCH for 0–4 layer films; (b) degradation curves of TCH over 120 min for films with 0 and 1 layer.
Catalysts 15 00798 g001
Figure 2. (a) Degradation curve of TCH over 120 min at different concentrations, (b) Fitting curve of apparent rate constant.
Catalysts 15 00798 g002
Figure 3. Mesh partitioning of the internal flow field of the reactor.
Catalysts 15 00798 g003
Figure 4. Comparison of TCH degradation rate between simulated and experimental values at four concentrations.
Catalysts 15 00798 g004
Figure 5. (a) Flow field regions corresponding to films with different diameters; (b) flow field regions corresponding to films with different heights; (c) TCH degradation rate at different film diameters; (d) TCH degradation rate at different film heights.
Catalysts 15 00798 g005
Figure 6. The cross sections of 12 flow field configurations and the corresponding degradation rates and S/V values that were obtained.
Catalysts 15 00798 g006
Figure 7. (a) Mass trace of configuration b; (b) mass trace of configuration c; (c) mass trace of configuration f; (d) mass trace of configuration g.
Catalysts 15 00798 g007
Figure 8. (a) Degradation rate of TCH for different (S/V) values of configuration b; (b) degradation rate of TCH for different (S/V) values of configuration j.
Catalysts 15 00798 g008
Figure 9. (ac) Mass concentration distribution of different (S/V) values for configuration b. (df) Mass concentration distribution of different (S/V) values for configuration j.
Catalysts 15 00798 g009
Figure 10. Effect of inlet diameter and flow rate on the degradation rate of TCH.
Catalysts 15 00798 g010
Figure 11. (a) Turbulence intensity cloud for different inlet diameters at 10 mL/min; (b) turbulence intensity cloud for different inlet diameters at 70 mL/min.
Catalysts 15 00798 g011
Figure 12. (a) Impregnation lift-off coating process; (b) four-layer TiO2 film on the surface of a quartz glass tube.
Catalysts 15 00798 g012
Figure 13. Photocatalytic reactor and its working process.
Catalysts 15 00798 g013
Figure 14. LED emission spectrum; the central wavelength is 365 nm.
Catalysts 15 00798 g014
Table 1. Outlet velocity under different number of meshes.
Inlet Velocity (m/s)Number of MeshesOutlet Velocity (m/s)
1157,1160.9683
1363,3430.9679
1584,6930.9675
Table 2. The S/V values of the 12 configurations and the corresponding TCH degradation rates.
ConfigurationS/V (m−1)Degradation Rate (%)
a0.07353.45
b0.03464.83
c0.03436.1
d0.02844.2
e0.02849.77
f0.02832.15
g0.02854.29
h0.026844.69
i0.026846.5
j0.026853.76
k0.025851.46
l0.025849.05
Disclaimer/Publisher’s Note: The statements, opinions and data contained in all publications are solely those of the individual author(s) and contributor(s) and not of MDPI and/or the editor(s). MDPI and/or the editor(s) disclaim responsibility for any injury to people or property resulting from any ideas, methods, instructions or products referred to in the content.