Abstract
This study examines the effects of several commercial surfactants on the dispersion of catalyst inks for proton exchange membrane fuel cells (PEMFCs). Catalyst inks containing Pt/C were spray-coated and assembled into membrane electrode assemblies (MEAs) by hot pressing. The structural and electrochemical properties of the resulting catalyst layers were characterized through particle size analysis, zeta potential measurements, contact angle determinations, and single-cell performance tests. Among the formulations evaluated, the ink with non-ionic surfactant Triton X-100 (TX) delivered the best performance, achieving a current density of 1134 mA/cm2 at 0.3 V—substantially higher than that of the surfactant-free control. These findings provide practical guidance for selecting appropriate surfactants to optimize catalyst-ink preparation and enhance PEMFC performance.
1. Introduction
The continued reliance on fossil fuels and the associated increase in greenhouse gas emissions have led to severe climate change and environmental degradation [1,2,3]. In response, the international community adopted the Paris Agreement, committing to limit the global average temperature rise to below 1.5–2 °C. In alignment with these global initiatives, South Korea has announced its goal of achieving carbon neutrality by 2050 and is actively advancing research and development in alternative and renewable energy technologies to meet this target [1,3]. Among various clean energy solutions, fuel cells have gained significant attention due to their high efficiency and near-zero greenhouse gas emissions. PEMFCs are emerging as promising power sources for both transportation and stationary energy applications, offering substantial reductions in carbon dioxide emissions [4,5,6].
In PEMFCs, hydrogen gas is oxidized at the anode, generating electrons that travel through an external circuit, while protons migrate through the electrolyte membrane to the cathode. There, the proton reacts with oxygen and the returning electrons to produce water as the sole byproduct [4,5,7]. A key component of PEMFCs is the MEA, which critically influences both performance and durability. Extensive research has focused on optimizing MEA design and functionality [7,8,9,10], including efforts to enhance catalyst activity, reduce mass transport resistance, and improve catalyst ink formulation through adjustments in catalyst loading and physicochemical properties [11,12,13].
For example, Yang et al. [14] investigated different methods of ionomer dispersion during catalyst ink preparation. Their approach involved separately dispersing ionomers and then re-dispersing other components using additional equipment. The study showed that improved ionomer mobility in the solvent led to better pore structure, reduced resistance, and a higher electrochemically active surface area, ultimately boosting fuel cell performance [13,15,16,17]. Regarding Nafion ionomer content, several studies [18,19,20] have reported that insufficient ionomer levels fail to establish a continuous network among catalyst particles, thereby reducing both electronic and ionic conductivity. On the other hand, excessive ionomer content can obstruct gas diffusion and diminish Pt catalyst activity, thus limiting mass transport. Optimal ionomer content, especially under low Pt loading conditions, has been reported to range between 20 and 35 wt.% [16,21,22]. Zhekun Chen et al. [23] evaluated the effects of surfactants and carbon materials on the structural and compositional uniformity of the microporous layer (MPL). They discovered that ink with a high degree of network growth produces an MPL with a low density of cracks. Conversely, ink with a high polydispersity index results in an MPL characterized by poor crack homogeneity. Additionally, both polar surfactants and the non-polar polymer polytetrafluoroethylene (PTFE) are insoluble, leading to a heterogeneous distribution of PTFE. On the other hand, Jülide Hazal Özdemir et al. [24] investigated the synthesis and characteristics of platinum (Pt) nanoparticles on immobilized carbon supports. They noted an approximately 12% reduction in the Pt content of the catalyst synthesized using Tween 80 as a surfactant. However, there was an enhancement of 85% in the electrochemically active surface area, which significantly improved the performance of the single-cell proton exchange membrane fuel cell (PEMFC).
In addition, the type and composition of dispersion solvents have been shown to significantly affect catalyst ink properties, including viscosity and dispersion uniformity [25,26,27]. These solvent characteristics influence catalyst particle aggregation within the catalyst layer (CL) and affect the distribution of ionomers in the ink. Therefore, optimizing the catalyst ink formulation is essential for improving MEA performance and overall energy efficiency [28,29]. Lee et al. [30] further studied the impact of surfactants on catalyst inks. Their findings revealed that surfactants facilitated uniform dispersion, leading to smoother and more homogeneous electrode surfaces. In contrast, inks without surfactants exhibited binder aggregation, as indicated by an increased fluorine and carbon content on the electrode surface. These structural differences had a notable impact on both the performance and durability of the electrodes, favoring those prepared with surfactants.
Despite extensive research on catalyst ink manufacturing [11,13,28,29], limited studies have examined the structural, physical, and performance-related effects of surfactant incorporation, even though surfactant-enhanced dispersion and performance improvements have been reported [31,32,33,34]. Therefore, further investigation into the use of surfactants with varying ionic properties during MEA fabrication is warranted. Non-uniform dispersion of catalyst particles often leads to agglomeration, which can prevent uniform ionomer coverage and reduce electrochemical activity, thereby degrading fuel cell performance. While some progress has been made in optimizing ink formulations, comprehensive investigations into the influence of surfactant type and concentration on dispersion uniformity and catalyst layer structure remain insufficient.
This study aims to improve MEA performance by enhancing catalyst ink dispersion through the incorporation of various surfactants during electrode fabrication. The physicochemical characteristics of the resulting electrodes were analyzed using scanning electron microscopy (SEM), particle size distribution, and contact angle measurements. The inclusion of surfactants effectively suppressed catalyst particle agglomeration and improved the utilization of Pt/C catalysts. Single-cell PEMFC performance tests further confirmed that surfactant-assisted dispersion led to enhanced catalyst distribution and significantly improved overall cell performance.
2. Results and Discussion
The addition of surfactants has been reported to inhibit particle aggregation in solution, as demonstrated in previous studies [31,34]. The dispersion quality of catalyst ink is influenced by the physicochemical properties of the surfactants, particularly their ionic charge, which can affect the ionomer–catalyst interaction and subsequently enhance the electrochemical activity of platinum catalysts after ionomer coating. Figure 1 presents a schematic illustration of the catalyst ink preparation process incorporating various surfactants during electrode fabrication. Compared to inks without a surfactant, those containing surfactants exhibit markedly reduced particle aggregation, resulting in more uniform dispersion within the ink.
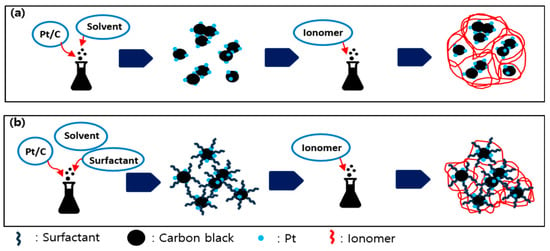
Figure 1.
Schematic illustration of the catalyst ink dispersion process with or without surfactant. Catalyst ink dispersion without surfactant (a), and with surfactant (b).
Catalyst inks prepared with and without surfactants were evaluated for sedimentation behavior over time using a filter paper method. The control sample, designated as SD, contained no surfactant and was tested alongside formulations containing various surfactants for comparison. Due to the dark color of the catalyst ink, a direct visual assessment of sedimentation was challenging. To overcome this, the upper layer of the ink—containing relatively fewer particles after sedimentation—was carefully dropped (50 μL) onto white filter paper to assess color brightness.
A lighter color on the filter paper indicated greater sedimentation of catalyst particles and thus poorer dispersion stability, whereas a darker color suggested that more particles remained suspended, reflecting a better dispersion quality [35,36]. The results, presented in Figure 2, show the evolution of dispersion stability over time. Observations were initially recorded at intervals of 30 min, 1 h, and 3 h, followed by extended intervals at 12 and 24 h to evaluate long-term dispersion behavior. After 4 days, minimal changes in color intensity were observed across all samples, indicating that the dispersion stability of the catalyst inks had reached equilibrium and became comparable.
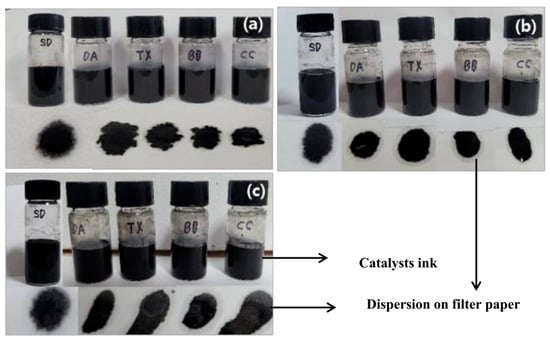
Figure 2.
Photographs of catalyst ink sedimentation on the tissue paper observed over time, 0 h (a), 48 h (b), and 96 h (c) for SD, DA, TX, BB, and CC.
Particle size analysis based on volume distribution (Table 1 and Figure 3) reveals that adding the ionomer reduces the mean particle diameter in every catalyst-ink sample. This decrease stems from Nafion’s amphiphilic nature: its hydrophobic polytetrafluoroethylene (PTFE) backbone (C2F4)n and hydrophilic sulfonic acid (-SO3H) side chains enable it to act like a surfactant [7,17,37,38]. Upon ionization, the sulfonic acid groups become negatively charged, generating electrostatic repulsion that suppresses aggregation and improves dispersion [14]. The greater size reduction produced by the ionomer than by the surfactants mainly reflects dosage differences: Nafion was introduced at 25 wt.% of the catalyst mass, whereas each surfactant accounted for only 1 wt.% of the total solids [31,32].

Table 1.
Zeta potential and particle size data for samples according to the presence of ionomers.
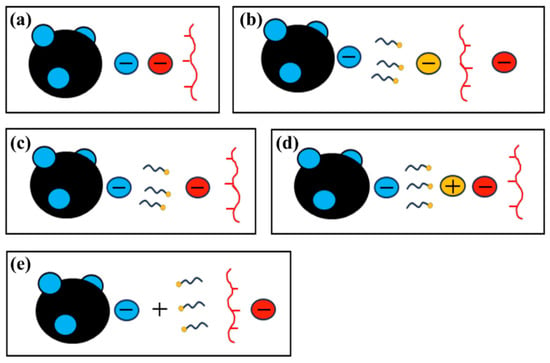
Figure 3.
Schematic diagrams for the electrical action of ionomers on the catalyst surface with different surfactants in the catalyst ink. Without surfactant (a), anionic (b), nonionic (c), zwitterionic (d), and cationic (e).
Comparing the surfactant-free SD ink with the surfactant-containing inks (Figure S3) shows that most surfactants further decreased particle size [31,33]. In particular, the DA and TX formulation displayed ~30% smaller particles than the SD control. By contrast, the CC formulation produces larger particles, and the BB formulation showed no meaningful change. These outcomes imply that, for CC and BB, the hydrophilic head groups, especially under cationic or zwitterionic conditions, diminish net electrostatic repulsion by accumulating positive charge, thus promoting re-aggregation rather than dispersion [39]. Particle size distribution curves (Figure S4) confirm a pronounced narrowing upon surfactant addition: both intensity and cumulative distributions shift toward smaller diameters. Among the surfactants tested, TX yields the narrowest distribution, whereas CC exhibits the broadest. This refinement underscores the effectiveness of appropriate surfactants in tailoring ink microstructures.
Zeta potential data (Table 1) provides complementary insights. In aggregated ionomer domains, sulfonic acid groups are largely buried; when the ionomer is well-dispersed, more sulfonic acid groups are exposed, dissociate, and adsorb onto the catalyst surface, driving the zeta potential to more negative values—an indicator of improved ionomer coverage and dispersion [14,40].
Figure 3a shows the electrostatic environment of the surfactant-free SD ink. After ionomer addition, the zeta potential shifts to more negative values, implying that Nafion’s sulfonate side chains orient toward the catalyst surface and increase the surface charge density. In the DA formulation (Figure 3b), the anionic surfactant’s negatively charged head groups repel the ionomer’s sulfonate moieties, further enhancing the net surface negativity and lowering the zeta potential [41]. For the TX ink (Figure 3c), the non-ionic surfactant introduces no additional charge, yielding a zeta potential comparable to that of the SD control; the slight decrease suggests that the ethoxylate head groups orient away from the hydrophobic Pt surface. In the BB sample (Figure 3d), the zwitterionic surfactant acquires cationic character under the mildly acidic measurement conditions, partially neutralizing the ionomer-derived negative charges and producing a less-negative zeta potential [31]. By contrast, in the CC formulation (Figure 3e), the cationic surfactant’s quaternary-ammonium head groups promote additional ionomer adsorption yet force the sulfonate groups to point outward, giving the most negative zeta potential of all samples [42].
Figure 4 displays SEM micrographs of electrodes fabricated from catalyst inks both with and without surfactants. In these images, the outer region of the catalyst layer (CL) appears brighter, whereas the CL interior is darker. To avoid any diverse effects on Pt activity, surfactant loading was limited to 1 wt.% of the combined mass of Pt/C and Nafion. At 30,000× magnification, no discernible structural differences emerge among the samples, indicating that the overall electrode morphology is essentially independent of surfactant presence or type in the ink formulation.
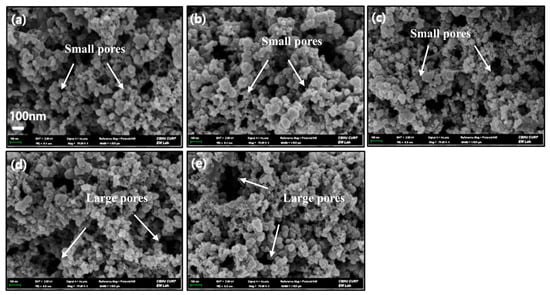
Figure 4.
Surface morphology (SEM images) of electrodes with different surfactants. SD (without surfactant) (a), DA (b), TX (c), BB (d), and CC (e).
Figure 5 displays images of water droplets placed on the surfaces of electrodes prepared from different formulates, with noticeable variations in contact angles between the left and right sides of each droplet. The average of these two angles was used to assess and compare the surface characteristics of the electrodes. All samples exhibited contact angles around or above 130°, indicating that the electrode surfaces were predominantly hydrophobic [43,44]. This hydrophobic nature facilitates effective water removal during fuel cell operation, thereby reducing the risk of flooding [45]. In the case of the SD sample without surfactant (Figure 5a), a contact angle slightly below 130° was observed. In contrast, samples containing surfactants showed contact angles around 135°, suggesting that the surfactants—composed of both hydrophilic and hydrophobic groups, with a dominant hydrophobic component—enhanced the hydrophobicity of the electrode surfaces [46]. As shown in Figure 5b–e, the larger contact angles indicate improved surface hydrophobicity [43,44].
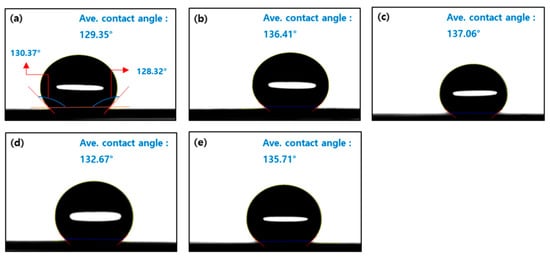
Figure 5.
Contact angles of catalyst layers with different surfactants. SD (without surfactant) (a), DA (b), TX (c), BB (d), and CC (e).
Electrodes prepared from catalyst inks—with and without surfactants—were assembled into MEAs and evaluated in a single-cell PEMFC. Figure 6a shows the polarization (I–V) curves and corresponding maximum current densities, whereas Figure 6b compares the mean current densities at 0.5 V and 0.3 V. The non-ionic Triton X-100 (TX) formulation delivered the best performance, reaching 1134 mA/cm2 at 0.3 V; the cationic CC formulation followed closely at 1100 mA/cm2. The remaining samples were ranked DA > SD > BB, although their differences were modest. At 0.5 V (Figure 6b), TX achieved 740 mA/cm2—about 3.4% higher than DA (716 mA/cm2). The advantage of TX persisted at 0.3 V, at which TX and CC reached 1134 and 1088 mA cm−2, respectively. The power density curves Figure 6c corroborate these trends: the surfactant-free SD MEA attained a peak power density of 370 mW cm−2 at 0.49 V, while TX outperformed all other inks with 390 mW cm−2. By contrast, CC, DA, and BB yielded lower maxima of 357, 370, and 360 mW cm−2, respectively. Kinetic analyses (Figure 6d) further highlight the efficacy of TX. The TX-based MEA exhibited the smallest Tafel slope (53.8 mV dec−1), indicating the lowest kinetic overpotential. The slopes increased to 54.6 mV dec−1 for SD, 55.7 mV dec−1 for CC, and 60.0 mV dec−1 for DA.
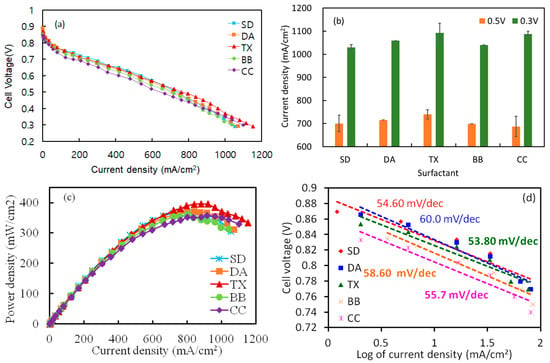
Figure 6.
Effect of several surfactants on the cell performance of PEMFC. (a) Polarization (I-V) curve (a), current density comparison at 0.5 and 0.3 V (b), power density curve (I-P) (c), and Tafel slope comparison of surfactants (d).
The open-circuit voltage (OCV, Figure S5) decreased when surfactants were introduced, most likely because surfactant adsorption partially blocked Pt active sites. The SD MEA retained the highest OCV (0.888 V). Among the surfactant-modified inks, TX displayed a moderate OCV of 0.868 V, DA remained comparable to SD, and CC showed the lowest value (0.844 V).
Overall, TX provides the most uniform catalyst dispersion and the best balance of kinetic and mass-transport performance, whereas CC incurs a larger kinetic penalty that offsets its otherwise favorable dispersion.
By comparing the physicochemical characteristics of catalyst inks and electrodes with their corresponding performance test results, we examined how variations in the MEA fabrication process influence the structure and functionality of catalyst layers. Figure 7a illustrates the relationship between particle size and current density at 0.3 V. In general, smaller average particle diameters (≈0.2–0.4 μm) correspond to a higher current density at 0.3 V. The CC electrode is an outlier: despite its larger mean size (>0.5 μm), it still delivers robust performance, implying that factors other than particle size—such as porosity or ionomer distribution—also govern cell efficiency [47]. Inks formulated without surfactants (e.g., SD) disperse reasonably well, yet the ionomer coats the Pt/C particles unevenly, as observed by So et al. [48]. By contrast, the TX, DA, and BB inks form smaller aggregates with more uniform ionomer coverage, which strengthens interfacial contact and boosts electrochemical activity. Although the CC ink yields larger agglomerates, the resulting macropores may enhance catalyst accessibility and gas transport, compensating for its coarser morphology.
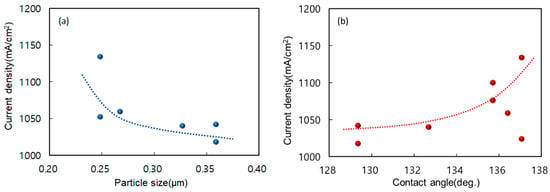
Figure 7.
Relationship between cell performance and catalyst particle size or contact angle, particle size in catalyst ink (a), and contact angle of catalytic layer (b). Current density is compared to 0.3 V for both.
Figure 7b presents the correlation between the electrode surface contact angle and current density at 0.3 V. Contact angles span 128–138°, and higher angles consistently correlate with better performance at 0.30 V [49]. Yu et al. [42] showed that fine pore networks (10–100 μm) favor high-current operation, whereas a modest fraction of macropores (100–1000 μm) improves mass transport under heavy loads [50]. Das et al. [51] further demonstrated that a more hydrophobic GDL—indicated by a larger contact angle—expedites water removal, lowers saturation, and eases oxygen transport, all of which raise overall PEMFC output. [52].
In the previous MEA test, the non-ionic surfactant Triton X-100 delivered the best performance. To refine its optimum loading, additional MEAs were fabricated with Triton X-100 at 0.5, 1.0, 2.0, and 3.0 wt.%. Figure 8a shows the polarization curves, while Figure 8b compares the mean current densities at 0.50 V and 0.30 V. The 0.5–2.0 wt.% samples displayed virtually identical behavior, each exceeding 1120 mA/cm2 at 0.30 V. By contrast, the 3.0 wt.% sample reached only 1032 mA/cm2, an ≈8.5% drop. The same trend appears in Figure 8b: the 3.0 wt.% electrode produced the lowest average current density, whereas performance improved progressively from 0.5 to 2.0 wt.%.
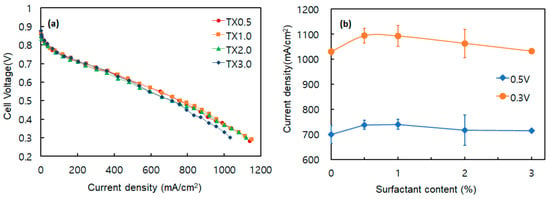
Figure 8.
Effect of surfactant (TX) amount on the cell performance of PEMFC. (a) Polarization (I-V) curve (a), and current densities at 0.5 and 0.3 V (b).
These findings indicate that moderate Triton X-100 loadings enhance catalyst ink dispersion and MEA output relative to the surfactant-free control (SD), but excessive surfactant is detrimental. Concentrations above about 3 wt.% likely disturb uniform catalyst agglomeration and raise internal mass-transfer resistance, as reported by So et al. [47]. The resulting denser catalyst layer impedes reactant transport and lowers overall cell performance.
3. Materials and Methods
Four commercial surfactants—each representing a distinct ionic class—were investigated: anionic 4-dodecylbenzenesulfonic acid (DA; Sigma-Aldrich, St. Louis, MI, USA); nonionic Triton X-100 (TX; Sigma-Aldrich, St. Louis, MI, USA); zwitterionic EMPIGEN® BB detergent (BB; Sigma-Aldrich, St. Louis, MI, USA); and cationic cetyltrimethylammonium chloride solution (CC; Sigma-Aldrich, St. Louis, MI, USA). Catalyst inks were prepared according to a unified protocol and are identified hereafter by the abbreviation of the surfactant they contain (DA, TX, BB, or CC).
The electrocatalyst was 40 wt.% Pt supported on Vulcan XC-72 carbon (Premetek Co., Cherry Hill, NJ, USA). A 15 µm thick reinforced proton-exchange membrane (FCMT, Anyang-si, Republic of Korea) and a 5 wt.% Nafion ionomer solution (Chemours, Wilmington, DE, USA) was used as received. Isopropyl alcohol (IPA, Samchun Chemicals, Gangnam-gu, Seoul, Republic of Korea) and all other reagents were employed without further purification. Key properties of the surfactants are summarized in Table 2.

Table 2.
Types and characteristics of surfactants used in ink preparation.
Catalyst inks were prepared by first dissolving each surfactant at 1 wt.% of the combined mass of Pt/C and Nafion. A surfactant stock solution (distilled water: IPA = 6: 4 v/v) was added to a vial containing ~0.05 g of Pt/C (40 wt.% Pt/Vulcan XC-72, Premetek, Cherry Hill, NJ, USA), followed by 10 min of ultrasonication. Nafion ionomer (5 wt.% solution, Chemours, Wilmington, DE, USA) was then introduced at 25 wt.% of the Pt/C mass, and the suspension was magnetically stirred for ≥1 h.
Uniform catalyst layers were formed by spray coating the ink onto gas-diffusion layers (AvCarb 1120, Fuel Cell Store, Bryan, TX, USA) and the membrane, using a hot plate/spray gun setup that enables manual control of spray width and speed, thus minimizing catalyst loss [53]. The target Pt loading was 0.30 mg cm−2 over an active area of 25 cm2. After pre-treating the proton-exchange membrane (15 µm reinforced membrane, FCMT, Republic of Korea; procedure in the Supporting Information), the anode GDL was hot-pressed to the membrane at 120 °C and 150 kgf cm−2 for 1 min; the cathode GDL was added during final cell assembly (Figure S2).
Particle-size distributions were measured with a Mastersizer 3000 (Malvern Panalytical, Malvern, Worcestershire, UK), and zeta potentials were obtained by electrophoretic light scattering on an ELSZ neo (Otsuka Electronics, Osaka, Japan). Electrode surface morphology was examined by field-emission SEM (Hitachi SU8220, Minato-ku, Tokyo, Japan). Static contact angles were recorded with a Phoenix-Pico goniometer (SEO, Mumbai, India; 0–180° range, ±1° accuracy) by depositing pico-to-nanoliter droplets onto the electrode surface.
Single-cell hardware (Figure S3) comprised two end plates, current collectors, graphite flow-field plates, a 20 µm silicone gasket, and the MEA. Assembly followed Shrivastava et al. [2], using a compression pressure of 70–75 kgf cm−2 (matched to the 180 µm GDL and 20 µm gasket) to ensure low contact resistance and gas-tight sealing.
Electrochemical testing was performed on a Smart2-PEM system (Wonatech, Seocho-gu, Seoul, Republic of Korea) controlled by WFTS (SMART, version 2.0) software. Hydrogen and air were supplied at stoichiometric ratios of 1.5 and 3.0, respectively. Gas and cell temperatures were set to 90 °C (H2), 70 °C (air), and 80 °C (cell). Current–voltage and power density curves were recorded to compare the performance of the fabricated MEAs.
4. Conclusions
This study systematically evaluated how different surfactant types and loading influence catalyst ink dispersion and, in turn, PEMFCs’ performance. Adding surfactants together with the Nafion ionomer markedly decreased catalyst particle size and suppressed agglomeration, as confirmed by particle-size analysis and SEM imaging. The resulting inks produced catalyst layers (CLs) with denser, better-interconnected microstructures and more uniform ionomer coverage. Zeta-potential and contact-angle data showed that each surfactant’s physicochemical properties modulated interfacial interactions and surface wettability, thereby shaping CL morphology. Improved dispersion translated into higher catalyst utilization and enhanced cell performance. Among the four surfactants tested, non-ionic Triton X-100 (TX) delivered the best results, reaching 1134 mA/cm2 at 0.30 V—surpassing anionic DA, zwitterionic BB, and cationic CC. These results corroborate earlier reports that optimized dispersion is critical for maximizing electrochemical efficiency, especially at low Pt loadings. Overall, the findings provide practical guidance on surfactant selection and underscore the importance of tailoring interfacial properties to further boost PEMFC performance in future applications.
Supplementary Materials
The following supporting information can be downloaded at: https://www.mdpi.com/article/10.3390/catal15080790/s1, Figure S1: Cell components and operation mechanism of PEMFCs; Figure S2: Catalyst ink preparation and MEA fabrication process for PEMFCs; Figure S3: Effect of ionomer on the catalyst ink’s particle size; Figure S4: Particle size distribution with several surfactants. SD (a), DA (b), TX (c), BB (d), and CC (e); Figure S5: Open circuit voltage (OCV) comparison of surfactants.
Author Contributions
J.K.: conceptualization, methodology, data curation, writing—original draft. D.-H.L.: methodology, data curation. H.-S.K. and G.P.: formal analysis. I.-T.K.: investigation. M.M.R.: formal analysis. H.-J.K.: investigation. H.-J.S. and J.S.: writing—review and editing, supervision, validation, project administration, funding acquisition. All authors have read and agreed to the published version of the manuscript.
Funding
This work was supported by the Korea Institute of Energy Technology Evaluation and Planning (KETEP) grant funded by the Korea government (MOTIE) (RS-2022-KP002707, Jeonbuk Regional Energy Cluster Training of human resources), Basic Science Research Program through the National Research Foundation of Korea (NRF) funded by the Ministry of Education (No. 2021R1I1A3057906) and Korea Institute for Advancement of Technology (KIAT) grant funded by the Korea Government (MOTIE) (P0018390).
Data Availability Statement
No new data were created or analyzed in this study. Data sharing is not applicable to this article.
Conflicts of Interest
Author In-Tae Kim was employed by the company Sungeel Hi-Metal. The remaining authors declare that the research was conducted in the absence of any commercial or financial relationships that could be construed as a potential conflict of interest.
References
- Abas, N.; Kalair, A.; Khan, N. Review of fossil fuels and future energy technologies. Futures 2015, 69, 31–49. [Google Scholar] [CrossRef]
- Shrivastava, N.K.; Chatterjee, A.; Harris, T.A.L. Effect of cell compression on the performance of a non–hot–pressed MEA for PEMFC. Int. J. Energy Res. 2019, 44, 370–387. [Google Scholar] [CrossRef]
- Mohr, S.H.; Wang, J.; Ellem, G.; Ward, J.; Giurco, D. Projection of world fossil fuels by country. Fuel 2015, 141, 120–135. [Google Scholar] [CrossRef]
- Majlan, E.H.; Rohendi, D.; Daud, W.R.W.; Husaini, T.; Haque, M.A. Electrode for proton exchange membrane fuel cells: A review. Renew. Sustain. Energy Rev. 2018, 89, 117–134. [Google Scholar] [CrossRef]
- Zhang, Y.; Lee, J.-J.; Park, G.-S.; Lee, H.-K.; Shim, J.-P. Analysis for Performance Deviation of Individual Cells in a Multi-Cell Test System for Rapid-Screening of Electrode Materials in PEMFCs. Trans. Korean Hydrog. New Energy Soc. 2011, 22, 842–851. [Google Scholar] [CrossRef]
- Han, C.-S.; Kim, I.-T.; Sun, H.-J.; Park, G.-S.; Lee, J.-J.; Lee, H.-K.; Shim, J.-P. Effect of Carbon Content on the Physical Properties of Carbon Composite Gas Diffusion Layer in PEMFCs. Int. J. Electrochem. Sci. 2012, 7, 8627–8636. [Google Scholar] [CrossRef]
- Lee, Y.-D.; Kim, J.-Y.; Yoo, D.-J.; Ju, H.; Kim, H. Review of research trend in fuel cell: Analysis on fuel-cell-related technologies in electrode, electrolyte, separator plate, stack, system, balance of plant, and diagnosis areas. J. Hydrog. New Energy 2020, 31, 530–545. [Google Scholar] [CrossRef]
- Li, W.; Lin, R.; Yang, Y. Investigation on the reaction area of PEMFC at different position in multiple catalyst layer. Electrochim. Acta 2019, 302, 241–248. [Google Scholar] [CrossRef]
- Shim, J.-P.; Lee, C.-R.; Lee, H.-K.; Lee, J.-S.; Cairns, E.J. Electrochemical characteristics of Pt–WO3/C and Pt–TiO2/C electrocatalysts in a polymer electrolyte fuel cell. J. Power Sources 2001, 102, 172–177. [Google Scholar] [CrossRef]
- Shim, J.-P.; Yoo, D.-Y.; Lee, J.-S. Characteristics for electrocatalytic properties and hydrogen–oxygen adsorption of platinum ternary alloy catalysts in polymer electrolyte fuel cell. Electrochim. Acta 2000, 45, 1943–1951. [Google Scholar] [CrossRef]
- Shin, S.-J.; Lee, J.-K.; Ha, H.-Y.; Hong, S.-A.; Chun, H.-S.; Oh, I.-H. Effect of the catalytic ink preparation method on the performance of polymer electrolyte membrane fuel cells. J. Power Sources 2002, 106, 146–152. [Google Scholar] [CrossRef]
- Liu, H.; Ney, L.; Zamel, N.; Li, X. Effect of Catalyst Ink and Formation Process on the Multiscale Structure of Catalyst Layers in PEM Fuel Cells. Appl. Sci. 2022, 12, 3776. [Google Scholar] [CrossRef]
- Huang, D.-C.; Yu, P.-J.; Liu, F.-J.; Huang, S.-L.; Hsueh, K.-L.; Chen, Y.-C.; Wu, C.-H.; Chang, W.C.; Tsau, F.H. Effect of Dispersion Solvent in Catalyst Ink on Proton Exchange Membrane Fuel Cell Performance. Int. J. Electrochem. Sci. 2011, 6, 2551–2565. [Google Scholar] [CrossRef]
- Yang, D.; Guo, Y.; Tang, H.; Wang, Y.; Yang, D.; Ming, P.; Zhang, C.; Li, B.; Zhu, S. Influence of the dispersion state of ionomer on the dispersion of catalyst ink and the construction of CL. Int. J. Hydrogen Energy 2021, 46, 33300–33313. [Google Scholar] [CrossRef]
- Fernández-Alvarez, V.M.; Malek, K.; Eikerling, M.H.; Young, A.; Dutta, M.; Kjeang, E. Molecular Dynamics Study of Reaction Conditions at Active Catalyst-Ionomer Interfaces in Polymer Electrolyte Fuel Cells. J. Electrochem. Soc. 2022, 169, 024506. [Google Scholar] [CrossRef]
- Xie, J.; Xu, F.; Wood, D.L.; More, K.L.; Zawodzinski, T.A.; Smith, W.H. Influence of ionomer content on the structure and performance of PEFC membrane electrode assemblies. Electrochim. Acta 2010, 55, 7404–7412. [Google Scholar] [CrossRef]
- Kim, T.-H.; Yi, J.-Y.; Jung, C.-Y.; Jeong, E.-G.; Yi, S.-C. Solvent effect on the Nafion agglomerate morphology in the catalyst layer of the proton exchange membrane fuel cells. Int. J. Hydrogen Energy 2017, 42, 478–485. [Google Scholar] [CrossRef]
- Kim, K.H.; Lee, K.Y.; Kim, H.J.; Cho, E.A.; Lee, S.Y.; Lim, T.H.; Yoon, S.P.; Hwang, I.C.; Jang, J.H. The effects of Nafion® ionomer content in PEMFC MEAs prepared by a catalyst-coated membrane (CCM) spraying method. Int. J. Hydrogen Energy 2010, 35, 2119–2126. [Google Scholar] [CrossRef]
- Wuttikid, K.; Shimpalee, S.; Punyawudho, K. Evaluation of Nafion with Various Pt-C Concentrations in MEAs for PEMFCs. Fuel Cells 2017, 17, 643–651. [Google Scholar] [CrossRef]
- Passos, R.R.; Paganin, V.A.; Ticianelli, E.A. Studies of the performance of PEMFC cathodes with the catalyst layer directly applied on Nafion membranes. Electrochim. Acta 2006, 51, 5239–5245. [Google Scholar] [CrossRef]
- Suzuki, A.; Sen, U.; Hattori, T.; Miura, R.; Nagumo, R.; Tsuboi, H.; Hatakeyama, N.; Endou, A.; Takaba, H.; Williams, M.C.; et al. Ionomer content in the catalyst layer of polymer electrolyte membrane fuel cell (PEMFC): Effects on diffusion and performance. Int. J. Hydrogen Energy 2011, 36, 2221–2229. [Google Scholar] [CrossRef]
- Miguel, L.H.; Guétaz, L.; Printemps, T.; Morin, A.; Escribano, S.; Jouneau, P.H.; Pascale, B.; Chandezon, F.; Gebel, G. Three-dimensional analysis of Nafion layers in fuel cell electrodes. Nat. Commun. 2014, 5, 5229. [Google Scholar] [CrossRef]
- Chen, Z.; Pan, W.; Tang, L.; Chen, X.; Wang, F. Effect of carbon material and surfactant on ink property and resulting surface cracks of fuel-cell microporous layers. Chin. J. Chem. Eng. 2024, 69, 1–12. [Google Scholar] [CrossRef]
- Özdemir, J.H.; Haşimoğlu, A.; Elçiçek, H.; Özdemir, O.K.; Akkaş, N. Production of Highly Efficient Pt/C for PEM Fuel Cell Applications. Electrocatalysis 2025, 16, 379–390. [Google Scholar] [CrossRef]
- Ngo, T.T.; Yu, T.L.; Lin, H.L. Influence of the composition of IPA/water mixture solvents in catalyst ink solutions on PEMFC performance. J. Power Sources 2013, 225, 293–303. [Google Scholar] [CrossRef]
- Ren, H.; Meng, X.; Lin, Y.; Shao, Z. Microstructure formation mechanism of catalyst layer and its effect on fuel cell performance: Effect of dispersion medium composition. J. Energy Chem. 2022, 73, 588–598. [Google Scholar] [CrossRef]
- Orfanidi, A.; Rheinländer, P.J.; Gasteiger, H.A. Ink solvent dependence of the ionomer distribution in the catalyst layerof a PEMFC. J. Electrochem. Soc. 2018, 165, 1254. [Google Scholar] [CrossRef]
- Zhou, Z.; Yang, D.; Guo, Y.; Li, B. Effect of the physical adsorption of ionomer on Pt particles on the fluid characteristics of PEMFC catalyst ink. Int. J. Hydrogen Energy 2023, 48, 318–326. [Google Scholar] [CrossRef]
- Du, S.; Li, W.; Wu, H.; Chuang, P.Y.A.; Pan, M.; Sui, P.C. Effects of ionomer and dispersion methods on rheological behavior of proton exchange membrane fuel cell catalyst layer ink. Int. J. Hydrogen Energy 2020, 45, 29430–29441. [Google Scholar] [CrossRef]
- Lee, W.-J.; Lee, J.-S.; Park, H.-Y.; Park, H.-S.; Lee, S.-Y.; Song, K.-H.; Kim, H.-J. Improvement of fuel cell performances through the enhanced dispersion of the PTFE binder in electrodes for use in HT-PEMFC. Int. J. Hydrogen Energy 2020, 45, 32825–32833. [Google Scholar] [CrossRef]
- Bharti, A.; Cheruvally, G. Surfactant assisted synthesis of Pt-Pd/MWCNT and evaluation as cathode catalyst for proton exchange membrane fuel cell. Int. J. Hydrogen Energy 2018, 43, 14729–14741. [Google Scholar] [CrossRef]
- Mulmi, S.; Park, C.-H.; Kim, H.-K.; Lee, C.-H.; Park, H.-B.; Lee, Y.-M. Surfactant-assisted polymer electrolyte nanocomposite membranes for fuel cells. J. Membr. Sci. 2009, 344, 288–296. [Google Scholar] [CrossRef]
- Krause, B.; Mende, M.; Pötschke, P.; Petzold, G. Dispersability and particle size distribution of CNTs in an aqueous surfactant dispersion as a function of ultrasonic treatment time. Carbon 2010, 48, 2746–2754. [Google Scholar] [CrossRef]
- Yang, D.; Yan, Z.; Li, B.; Higgins, D.C.; Wang, J.; Lv, H.; Chen, Z.; Zhang, C. Highly active and durable Pt–Co nanowire networks catalyst for the oxygen reduction reaction in PEMFCs. Int. J. Hydrogen Energy 2016, 41, 18592–18601. [Google Scholar] [CrossRef]
- Inaba, M.; Quinson, J.; Arenz, M. pH matters: The influence of the catalyst ink on the oxygen reduction activity determined in thin film rotating disk electrode measurements. J. Power Sources 2017, 353, 19–27. [Google Scholar] [CrossRef]
- Bapat, S.; Giehl, C.; Kohsakowski, S.; Peinecke, V.; Schäffler, M.; Segets, D. On the state and stability of fuel cell catalyst inks. Adv. Powder Technol. 2021, 32, 3845–3859. [Google Scholar] [CrossRef]
- Haubold, H.-G.; Vad, T.; Jungbluth, H.; Hiller, P. Nano structure of NAFION: A SAXS study. Electrochim. Acta 2001, 46, 1559–1563. [Google Scholar] [CrossRef]
- Curtin, D.E.; Lousenberg, R.D.; Henry, T.J.; Tangeman, P.C.; Tisack, M.E. Advanced materials for improved PEMFC performance and life. J. Power Sources 2004, 131, 41–48. [Google Scholar] [CrossRef]
- Ridaoui, H.; Jada, A.; Vidal, L.; Donnet, J.-B. Effect of cationic surfactant and block copolymer on carbon black particle surface charge and size. Colloids Surf. A Physicochem. Eng. Asp. 2006, 278, 149–159. [Google Scholar] [CrossRef]
- Zhang, H.; Pan, J.; He, X.; Pan, M. Zeta potential of Nafion molecules in isopropanol-water mixture solvent. J. Appl. Polym. Sci. 2008, 107, 3306–3309. [Google Scholar] [CrossRef]
- Haba, Y.; Segal, E.; Narkis, M.; Titelman, G.I.; Siegmann, A. Polyaniline–DBSA/polymer blends prepared via aqueous dispersions. Synth. Met. 2000, 110, 189–193. [Google Scholar] [CrossRef]
- Yu, H.M.; Ziegler, C.; Hebling, C. Hydrophilicity and hydrophobicity study of CLs in PEMFCs. Electrochim. Acta 2006, 51, 1199–1207. [Google Scholar] [CrossRef]
- Huhtamäki, T.; Tian, X.; Korhonen, J.T.; Ras, R.H. Surface-wetting characterization using contact-angle measurements. Nat. Protoc. 2018, 13, 1521–1538. [Google Scholar] [CrossRef]
- Jung, H.-S.; Kim, D.-H.; Park, C. Characterization of PTFE Electrode Made by Bar-Coating Method Using Alcohol-Based Catalyst Slurry. KHNES 2020, 31, 276–283. [Google Scholar] [CrossRef]
- Lim, C.; Wang, C.-Y. Effects of hydrophobic polymer content in GDL on power performance of a PEMFC. Electrochim. Acta 2004, 49, 4149–4156. [Google Scholar] [CrossRef]
- Verma, C.; Quraishi, M.A.; Rhee, K.Y. Hydrophilicity and hydrophobicity consideration of organic surfactant compounds: Effect of alkyl chain length on corrosion protection. Adv. Colloid Interface Sci. 2022, 306, 102723. [Google Scholar] [CrossRef]
- Siegel, N.P.; Ellis, M.W.; Nelson, D.J.; von Spakovsky, M.R. Single domain PEMFC model based on agglomerate catalyst geometry. J. Power Sources 2003, 115, 81–89. [Google Scholar] [CrossRef]
- So, S.-Y.; Oh, K.-H. Effect of dispersant on catalyst ink properties and catalyst layer structure for high performance PEMFCs. J. Power Source 2023, 561, 232664. [Google Scholar] [CrossRef]
- Avcioglu, G.S.; Ficicilar, B.; Eroglu, I. Improved PEM fuel cell performance with hydrophobic catalyst layers. Int. J. Hydrogen Energy 2018, 43, 18632–18641. [Google Scholar] [CrossRef]
- Yu, Z.; Carter, R.N.; Zhang, J. Measurements of Pore Size Distribution, Porosity, Effective Oxygen Diffusivity, and Tortuosity of PEM Fuel Cell Electrodes. Fuel Cells 2012, 12, 557–565. [Google Scholar] [CrossRef]
- Das, P.-K.; Li, X.; Liu, Z.-S. Effects of catalyst layer structure and wettability on liquid water transport in PEMFC. Int. J. Energy Res. 2011, 35, 1325–1339. [Google Scholar] [CrossRef]
- Pourrahmani, H.; Jan, H.V. The impacts of the gas diffusion layer contact angle on the water management of the proton exchange membrane fuel cells: Three-dimensional simulation and optimization. Int. J. Energy Res. 2022, 46, 16027–16040. [Google Scholar] [CrossRef]
- Lim, B.-H.; Majlan, E.H.; Haque, M.A. Comparison of CCMs and CCS for PEMFC MEA: A review. Chin. J. Chem. Eng. 2021, 33, 1–16. [Google Scholar] [CrossRef]
Disclaimer/Publisher’s Note: The statements, opinions and data contained in all publications are solely those of the individual author(s) and contributor(s) and not of MDPI and/or the editor(s). MDPI and/or the editor(s) disclaim responsibility for any injury to people or property resulting from any ideas, methods, instructions or products referred to in the content. |
© 2025 by the authors. Licensee MDPI, Basel, Switzerland. This article is an open access article distributed under the terms and conditions of the Creative Commons Attribution (CC BY) license (https://creativecommons.org/licenses/by/4.0/).


