1. Introduction
The global transition toward sustainable technologies requires solutions capable of addressing both energy generation and environmental remediation in an integrated manner. In this context, bifunctional photocatalytic systems that simultaneously enable green hydrogen production and wastewater treatment under solar irradiation represent a promising strategy. These dual-function platforms reduce energy input, simplify operations, and contribute to circular economy objectives by coupling two environmentally beneficial processes in a single solar-driven approach [
1,
2].
Conventional hydrogen production methods, such as steam methane reforming (SMR), are highly energy-intensive and release large amounts of CO
2. In contrast, photocatalysis and photoelectrocatalysis have emerged as promising alternatives, using solar irradiation to drive both water-splitting and the degradation of persistent organic pollutants [
3,
4].
Combining hydrogen production and contaminant degradation into a single solar-assisted system can improve overall energy efficiency and reduce the need for additional chemical inputs or separate treatment setups [
5,
6]. This approach not only simplifies operation but also aligns with current efforts to integrate energy conversion and environmental remediation within sustainable, circular-use frameworks [
7,
8].
Titanium dioxide (TiO
2) remains a benchmark photocatalyst due to its chemical stability, low cost, and non-toxicity [
9]. Crystallite size and particle morphology are additional factors that substantially affect photocatalytic performance. Nanostructured materials with small crystallite domains generally offer higher surface-to-volume ratios and improved charge separation dynamics, facilitating faster surface redox reactions. In contrast, excessive grain growth due to thermal sintering can reduce active site accessibility and increase bulk recombination, particularly in rutile-rich systems [
10]. However, its wide bandgap (~3.2 eV) restricts light absorption to the ultraviolet region, which constitutes only a small portion of the solar spectrum [
11,
12]. To address this limitation, strategies such as metal doping and co-catalyst incorporation have been explored. Recent reviews have highlighted that metal-doped TiO
2 systems, particularly those incorporating transition metals, continue to show significant promise in driving both green hydrogen production and contaminant degradation under solar conditions [
13]. The incorporation of transition metals such as copper into TiO
2-based frameworks has emerged as an effective strategy to modulate the band structure and enhance light harvesting under visible irradiation. Cu doping is known to introduce localized 3d states below the conduction band of TiO
2, leading to a significant narrowing of the optical bandgap and improved utilization of solar photons. Moreover, Cu species can promote charge carrier trapping and reduce recombination via reversible redox cycling between Cu
+ and Cu
2+ states [
14,
15]. Among them, NiMo-based systems have gained attention as noble-metal-free HER catalysts due to their synergistic behavior and promising electrochemical performance. Recent studies have shown that the NiMo(O) phase structure plays a critical role in determining HER activity and stability under alkaline conditions [
16]. In addition, the thermal evolution of TiO
2 polymorphs plays a crucial role in defining the structural and electronic behavior of the catalyst. While anatase is widely recognized for its superior charge separation efficiency and photocatalytic performance, its metastability at elevated temperatures often leads to conversion into rutile, a denser phase typically associated with higher recombination rates and lower surface reactivity. However, the concurrent formation of NiTiO
3 during calcination may partially offset this loss by acting as a charge mediator or facilitating the formation of interfacial heterojunctions, potentially enhancing the transport and separation of photogenerated carriers [
10]. In our previous work [
17], the synergy between Ni and Mo was shown to enhance both hydrogen adsorption and charge transfer. Supporting NiMo on TiO
2 not only facilitates dispersion but also improves the transport of photogenerated charge carriers. Under neutral conditions, current densities between −0.07 and −0.13 mA·cm
−2 at −0.1 V vs. RHE were achieved, confirming the viability of these systems for HER. These values were benchmarked against literature, highlighting the competitive performance of NiMo/TiO
2 relative to other non-noble and even noble metal-based catalysts. Still, the binary NiMo/TiO
2 system remains limited by moderate visible-light response and residual recombination losses, prompting the search for further performance boosters [
18].
Copper doping has recently emerged as a valuable strategy to enhance TiO
2-based photocatalysts. Cu can tune the electronic structure, narrow the bandgap [
19], and introduce additional redox-active sites, thereby improving both light absorption and catalytic turnover [
20,
21,
22]. Moreover, Cu is known to affect the oxidation states of neighboring metals, potentially altering Ni and Mo speciation and modulating reactive oxygen species [
23]. Recent advances have also highlighted the role of Cu
2O-based photocathodes in enhancing photogenerated charge separation and solar hydrogen production [
24]. Despite growing interest, the exact contribution of Cu
+/Cu
2+ redox cycling—and its interaction with NiMo domains under operating conditions—remains poorly understood. Most studies focus on optical or degradation outcomes but lack a mechanistic correlation with surface redox chemistry. This work seeks to fill that gap by investigating how Cu incorporation modulates both structural and electronic features relevant to catalytic performance.
In this study, Cu-doped NiMo/TiO2 catalysts were synthesized and thermally treated at 400 °C and 900 °C to investigate the influence of copper incorporation on active site distribution, band structure, and redox behavior. A comprehensive suite of physicochemical and electrochemical analyses was conducted to elucidate how Cu+/Cu2+ redox transitions contribute to multielectron reaction pathways in hydrogen evolution and contaminant oxidation. To support this approach, particular attention was paid to key properties such as band gap narrowing, crystalline phase composition, oxygen vacancies, and redox behavior under operating conditions, given their known relevance to light absorption, charge separation, and catalytic efficiency in dual-function systems.
The ternary NiMoCu catalysts exhibited superior bifunctional performance compared to previously reported NiMo/TiO2 systems, driven by synergistic redox interactions and enhanced charge separation. Remarkably, these improvements were achieved with only a minimal amount of copper (0.6 wt.%), underscoring the efficiency of redox modulation through ultra-low Cu loading. These findings provide mechanistic insight into Cu-mediated photoelectrocatalysis and inform the rational design of efficient, non-noble metal photocatalysts for integrated energy and environmental applications.
This study presents a Cu-doped NiMo/TiO2 system evaluated for dual-function applications: solar-driven hydrogen generation and pharmaceutical contaminant degradation. The novelty lies in integrating these two functionalities within a single photoelectrocatalytic platform while analyzing the effects of Cu on band structure, redox surface chemistry, and phase composition. Particular emphasis is placed on elucidating the structure–function relationship by correlating crystalline phase evolution, oxygen vacancy formation, and morphological characteristics with electrochemical and photocatalytic performance under mild, environmentally relevant conditions.
2. Results
To comprehensively understand the structural, surface, and functional properties of the catalysts, a series of physicochemical and photo/electrochemical characterizations was performed. These analyses enabled the correlation between the composition and nanostructure of the materials and their catalytic behavior under different conditions.
2.1. Physicochemical Properties
The physicochemical characterization aimed to elucidate the structural phases, surface composition, and textural properties of the catalysts as a function of the calcination temperature. X-ray diffraction (XRD) was used to identify crystalline phases and structural transformations, while nitrogen adsorption–desorption isotherms (BET) provided insights into the specific surface area and porosity. X-ray photoelectron spectroscopy (XPS) enabled the analysis of surface oxidation states and elemental distribution, and electron microscopy offered morphological information. Together, these techniques reveal how thermal treatment influences the material’s physicochemical properties, which are crucial for its catalytic behavior.
2.1.1. X-Ray Diffraction (XRD)
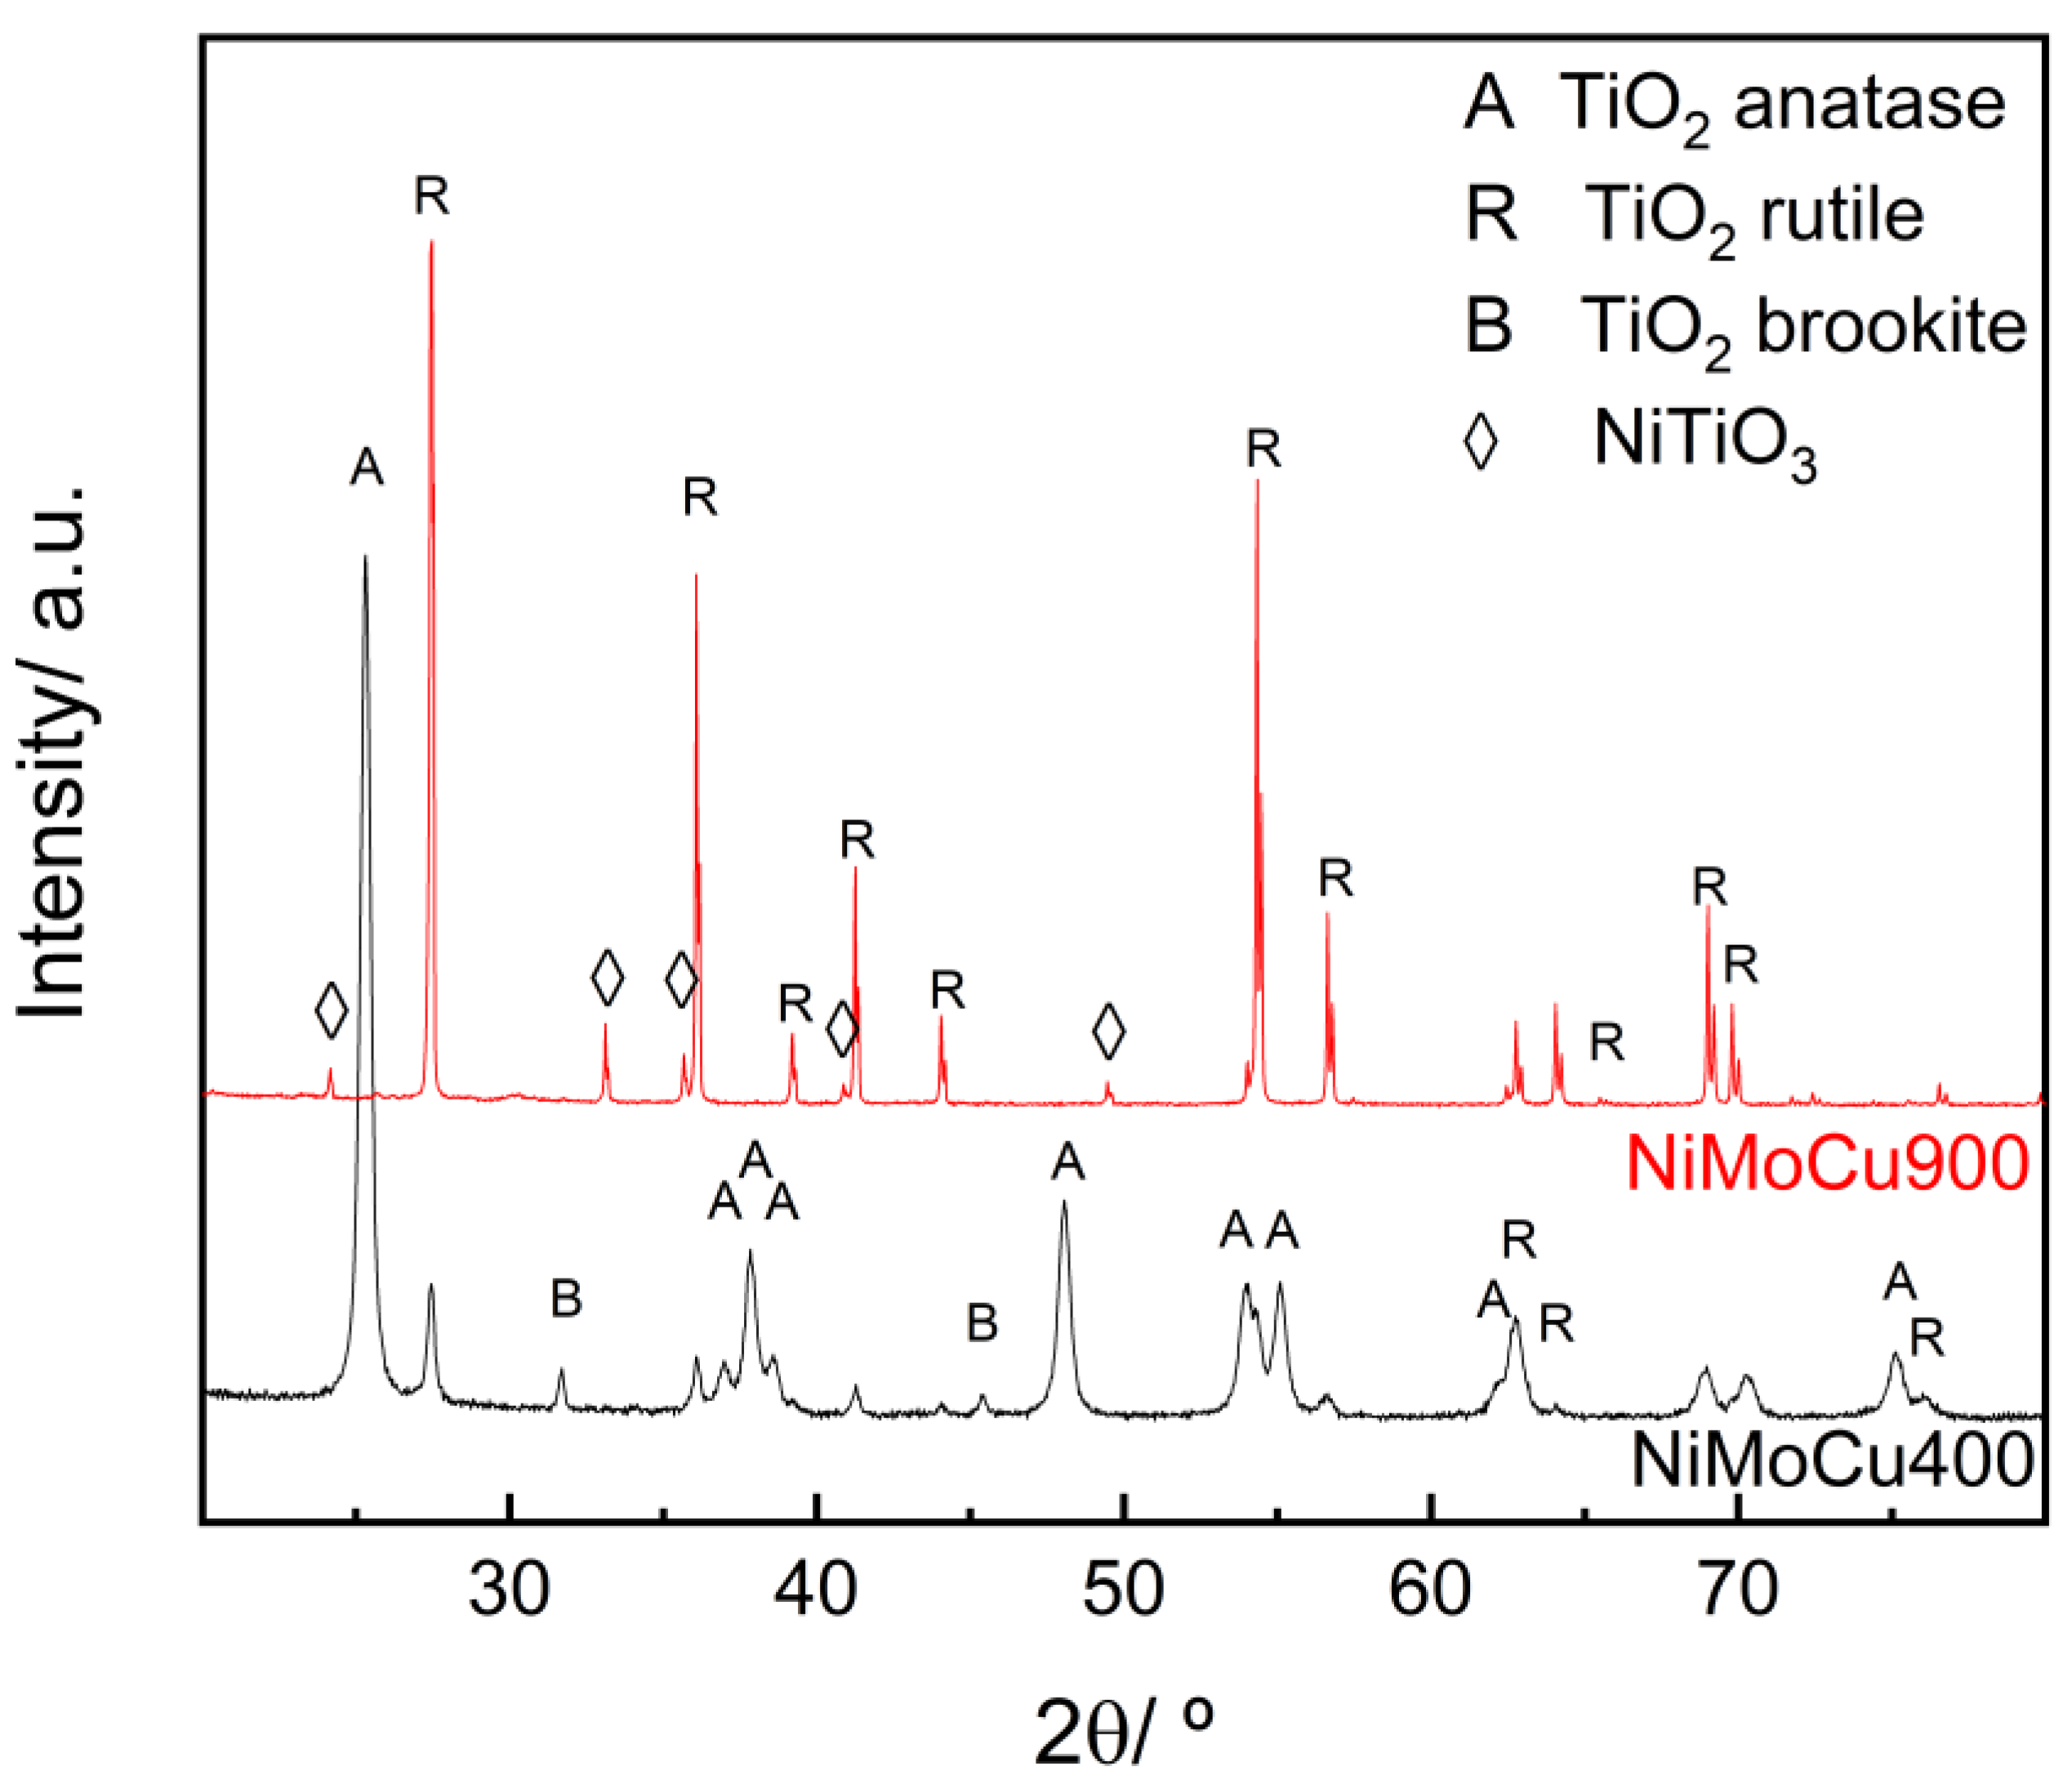
XRD patterns of NiMoCu catalysts calcined at 400 °C and 900 °C (
Figure 1) reveal distinct structural evolutions with temperature. NiMoCu400 displays primarily anatase TiO
2, with minor brookite and traces of rutile, indicating partial crystallization and metastable phase presence [
25]. In contrast, NiMoCu900 exhibits a complete anatase-to-rutile transformation [
26], along with the emergence of NiTiO
3 reflections [
27], suggesting strong Ni–support interactions and phase reconstruction via solid-state diffusion [
28]. The narrowing and intensification of peaks in NiMoCu900 indicate enhanced crystallinity. The loss of brookite and prevalence of rutile may negatively affect photocatalytic performance, as anatase generally offers superior charge separation efficiency. The anatase-to-rutile phase transformation with increasing calcination temperature was confirmed by a semiquantitative analysis based on the relative intensities of the main diffraction peaks. At 400 °C, anatase was the predominant phase (79%), as calculated from the intensity ratio of the (101) peak of anatase and the (110) peak of rutile, while rutile accounted for 18%. After calcination at 900 °C, anatase was no longer detected, and the diffractogram was dominated by rutile and NiTiO
3, indicating a complete structural transformation. Traces of brookite were also detected at 400 °C but disappeared upon further thermal treatment.
To further evaluate the effect of thermal treatment on crystallinity, the crystallite sizes of the main TiO2 phases were estimated using the Scherrer equation. For NiMoCu400, the crystallite sizes of anatase (25.27°), rutile (27.46°), and brookite (31.69°) were 21.15, 30.39, and 46.71 nm, respectively. In contrast, only rutile was detected in NiMoCu900, with a crystallite size of 55.26 nm.
2.1.2. Textural Analysis (BET Method)
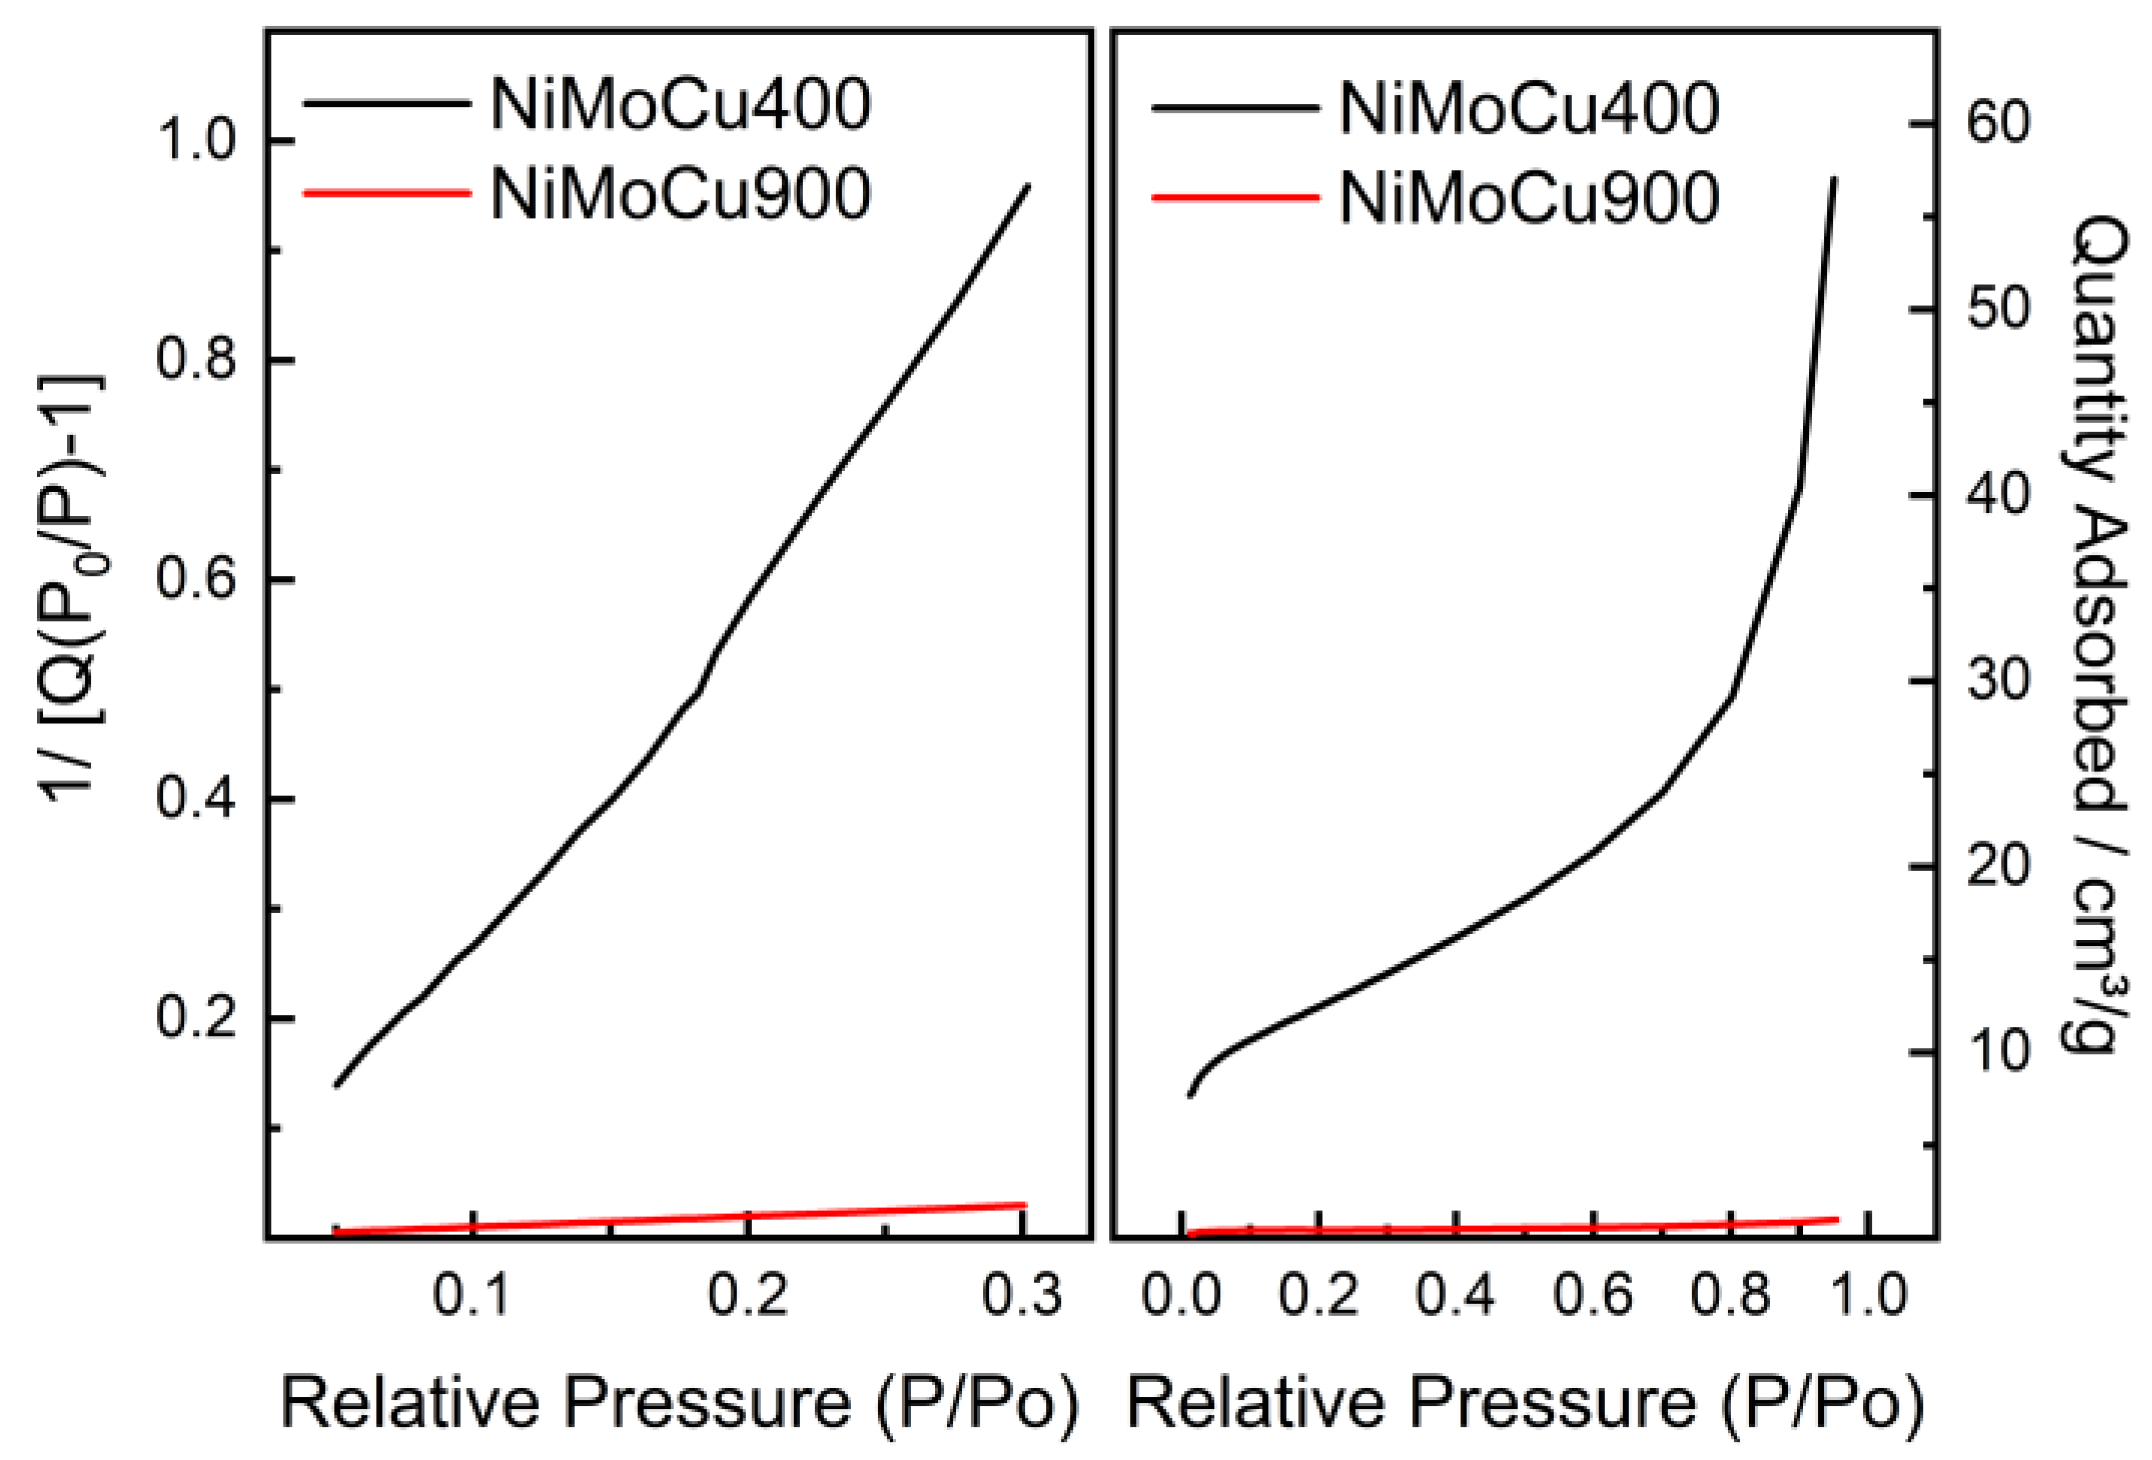
BET results (
Table 1) show a drastic reduction in surface area and porosity with increasing calcination temperature. NiMoCu400 exhibits a high specific surface area (44.4 m
2·g
−1) and mesoporous texture, while NiMoCu900 presents a collapsed porous structure with only 1.4 m
2·g
−1. The accompanying drop in pore volume (from 0.082 to 0.0017 cm
3·g
−1) and pore diameter (from 7.95 to 4.46 nm) confirms densification and sintering. These structural changes may limit accessibility to active sites in the high-temperature sample, potentially affecting its catalytic efficiency.
The N
2 adsorption–desorption isotherms and linearized BET plots (
Figure 2) support these observations: NiMoCu400 shows significantly higher nitrogen uptake, consistent with well-developed porosity, while NiMoCu900 displays negligible adsorption, reflecting severe pore collapse.
2.1.3. Morphological Analysis (SEM/TEM)
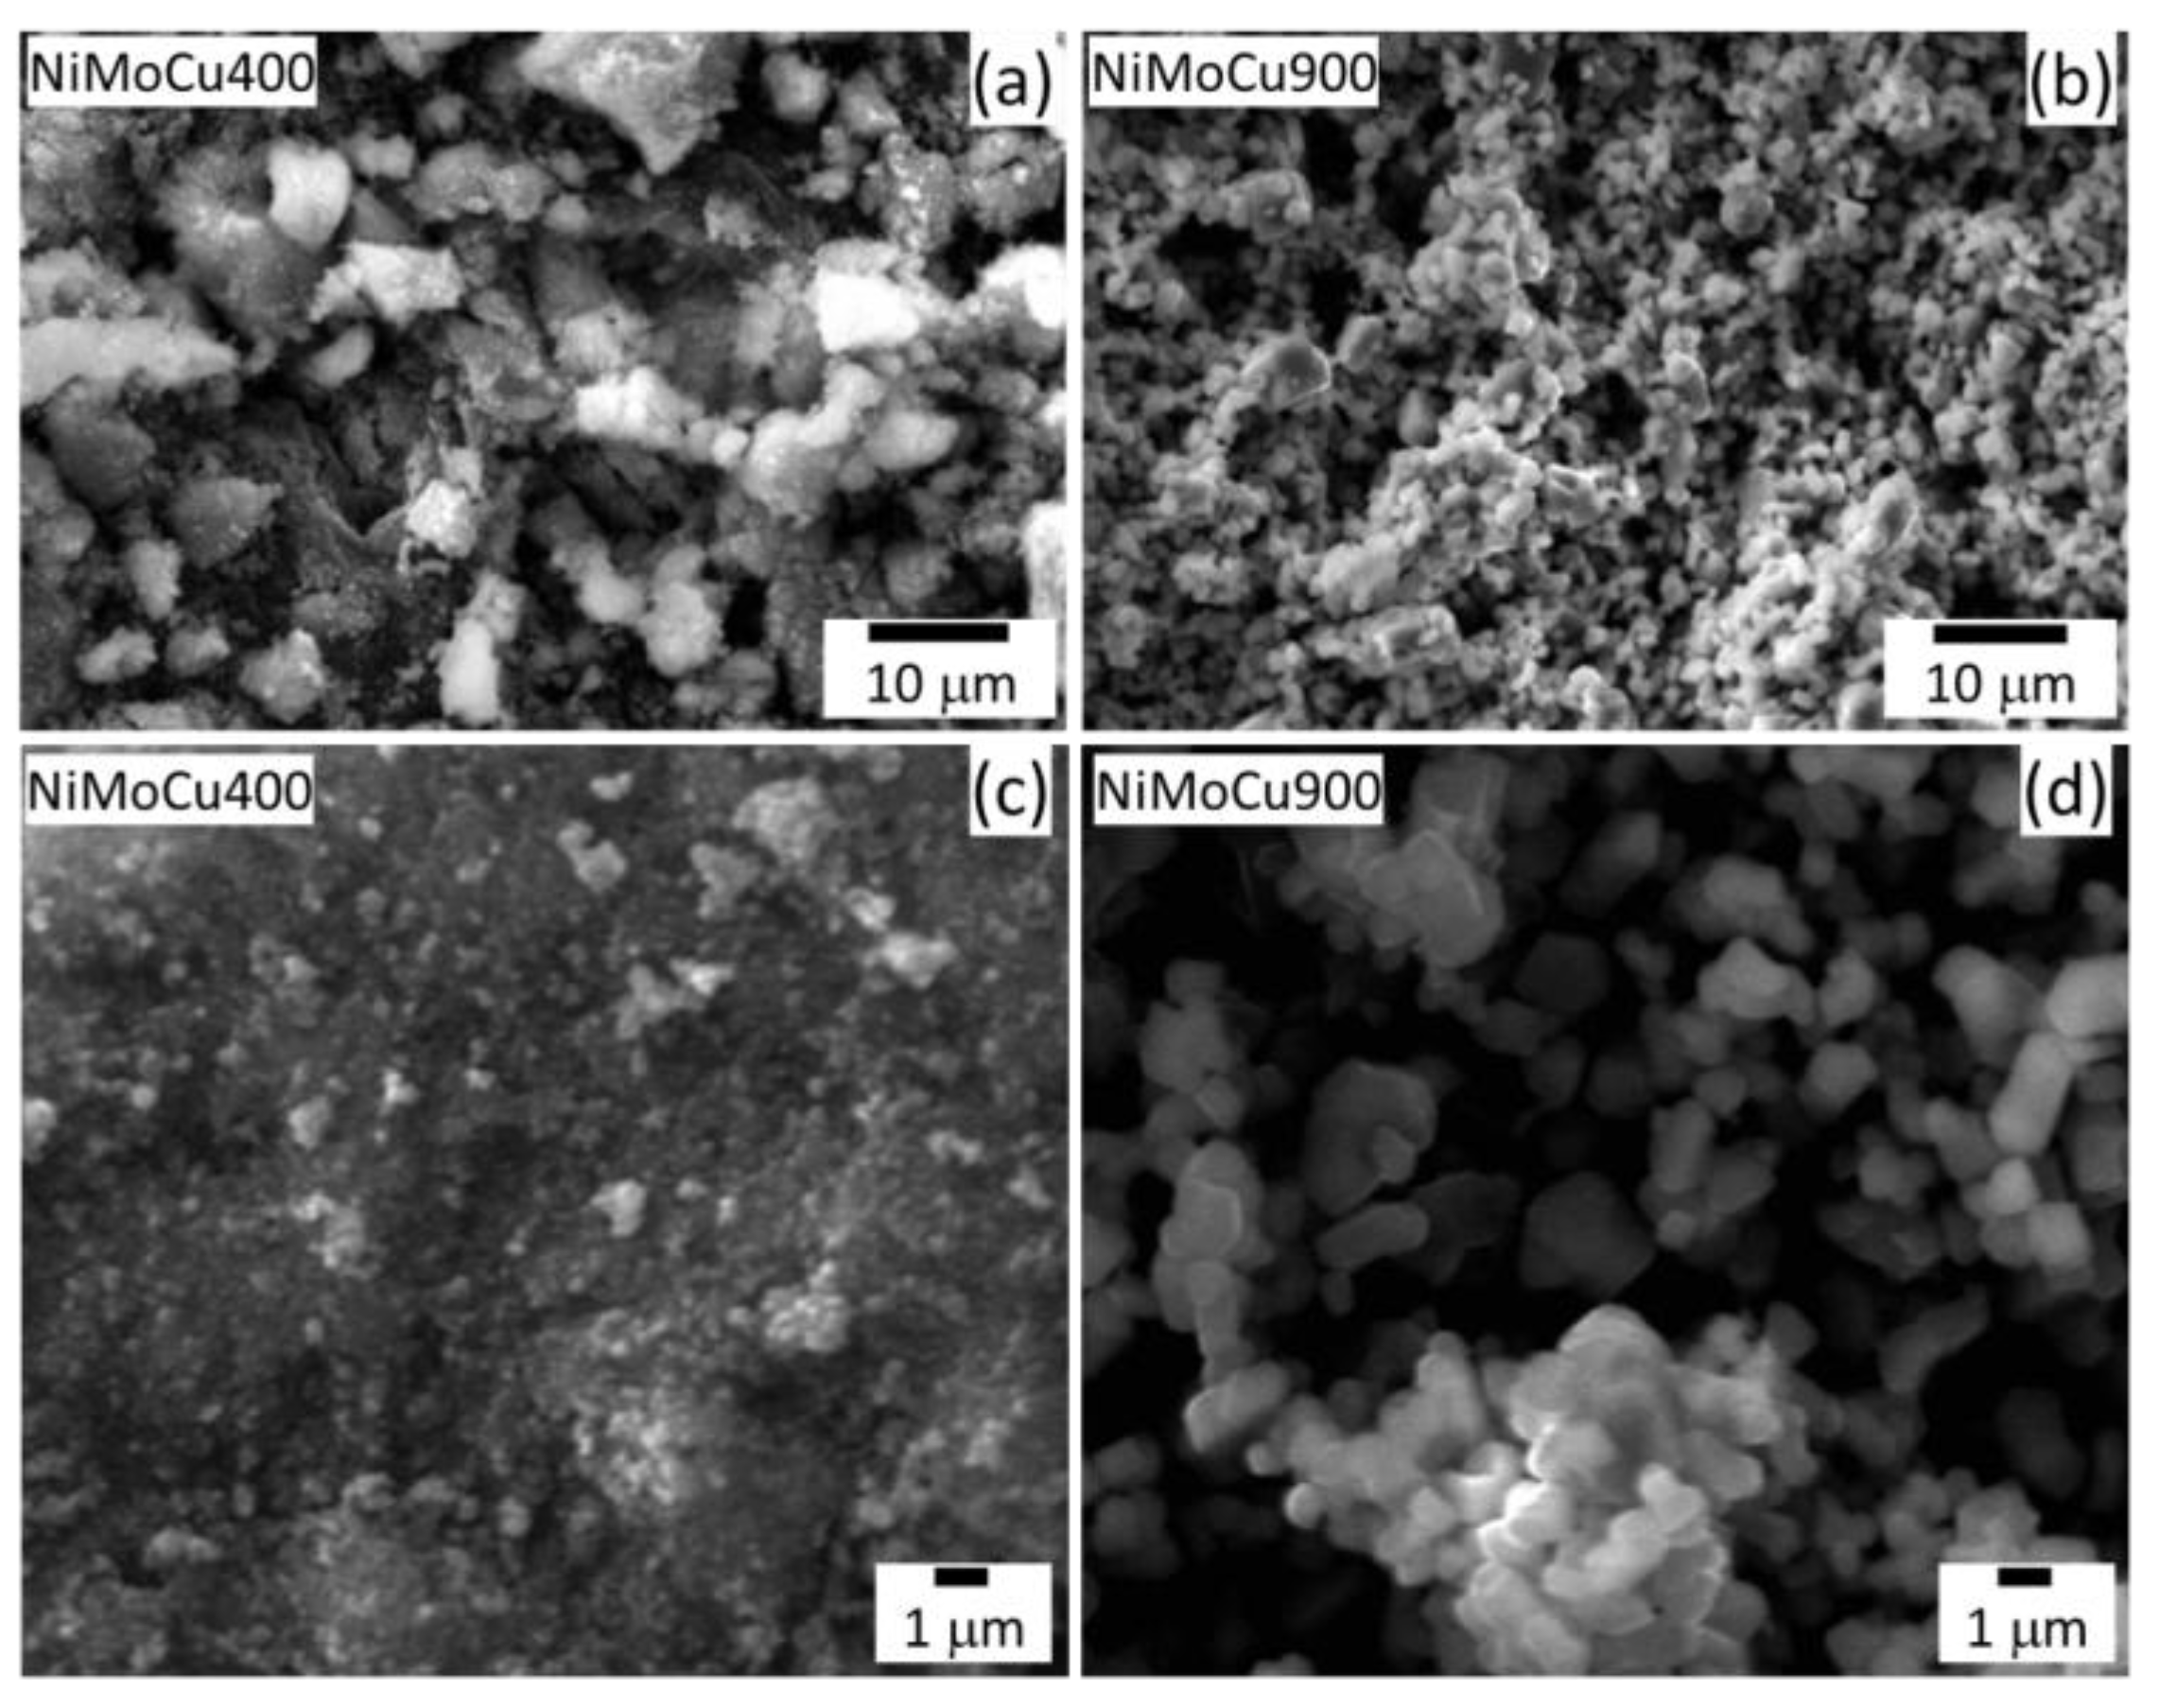
SEM micrographs (
Figure 3) reveal significant morphological differences between the catalysts. NiMoCu400 displays a heterogeneous and porous surface with loosely packed aggregates and fine particulate structures, consistent with its high BET surface area and mesoporosity. In contrast, NiMoCu900 exhibits a compact and sintered morphology, with larger, well-defined particles and smooth surfaces, indicative of crystallite growth and porosity loss due to thermal treatment. These features align with the nitrogen adsorption behavior (
Figure 2), confirming densification and collapse of the porous network at 900 °C.
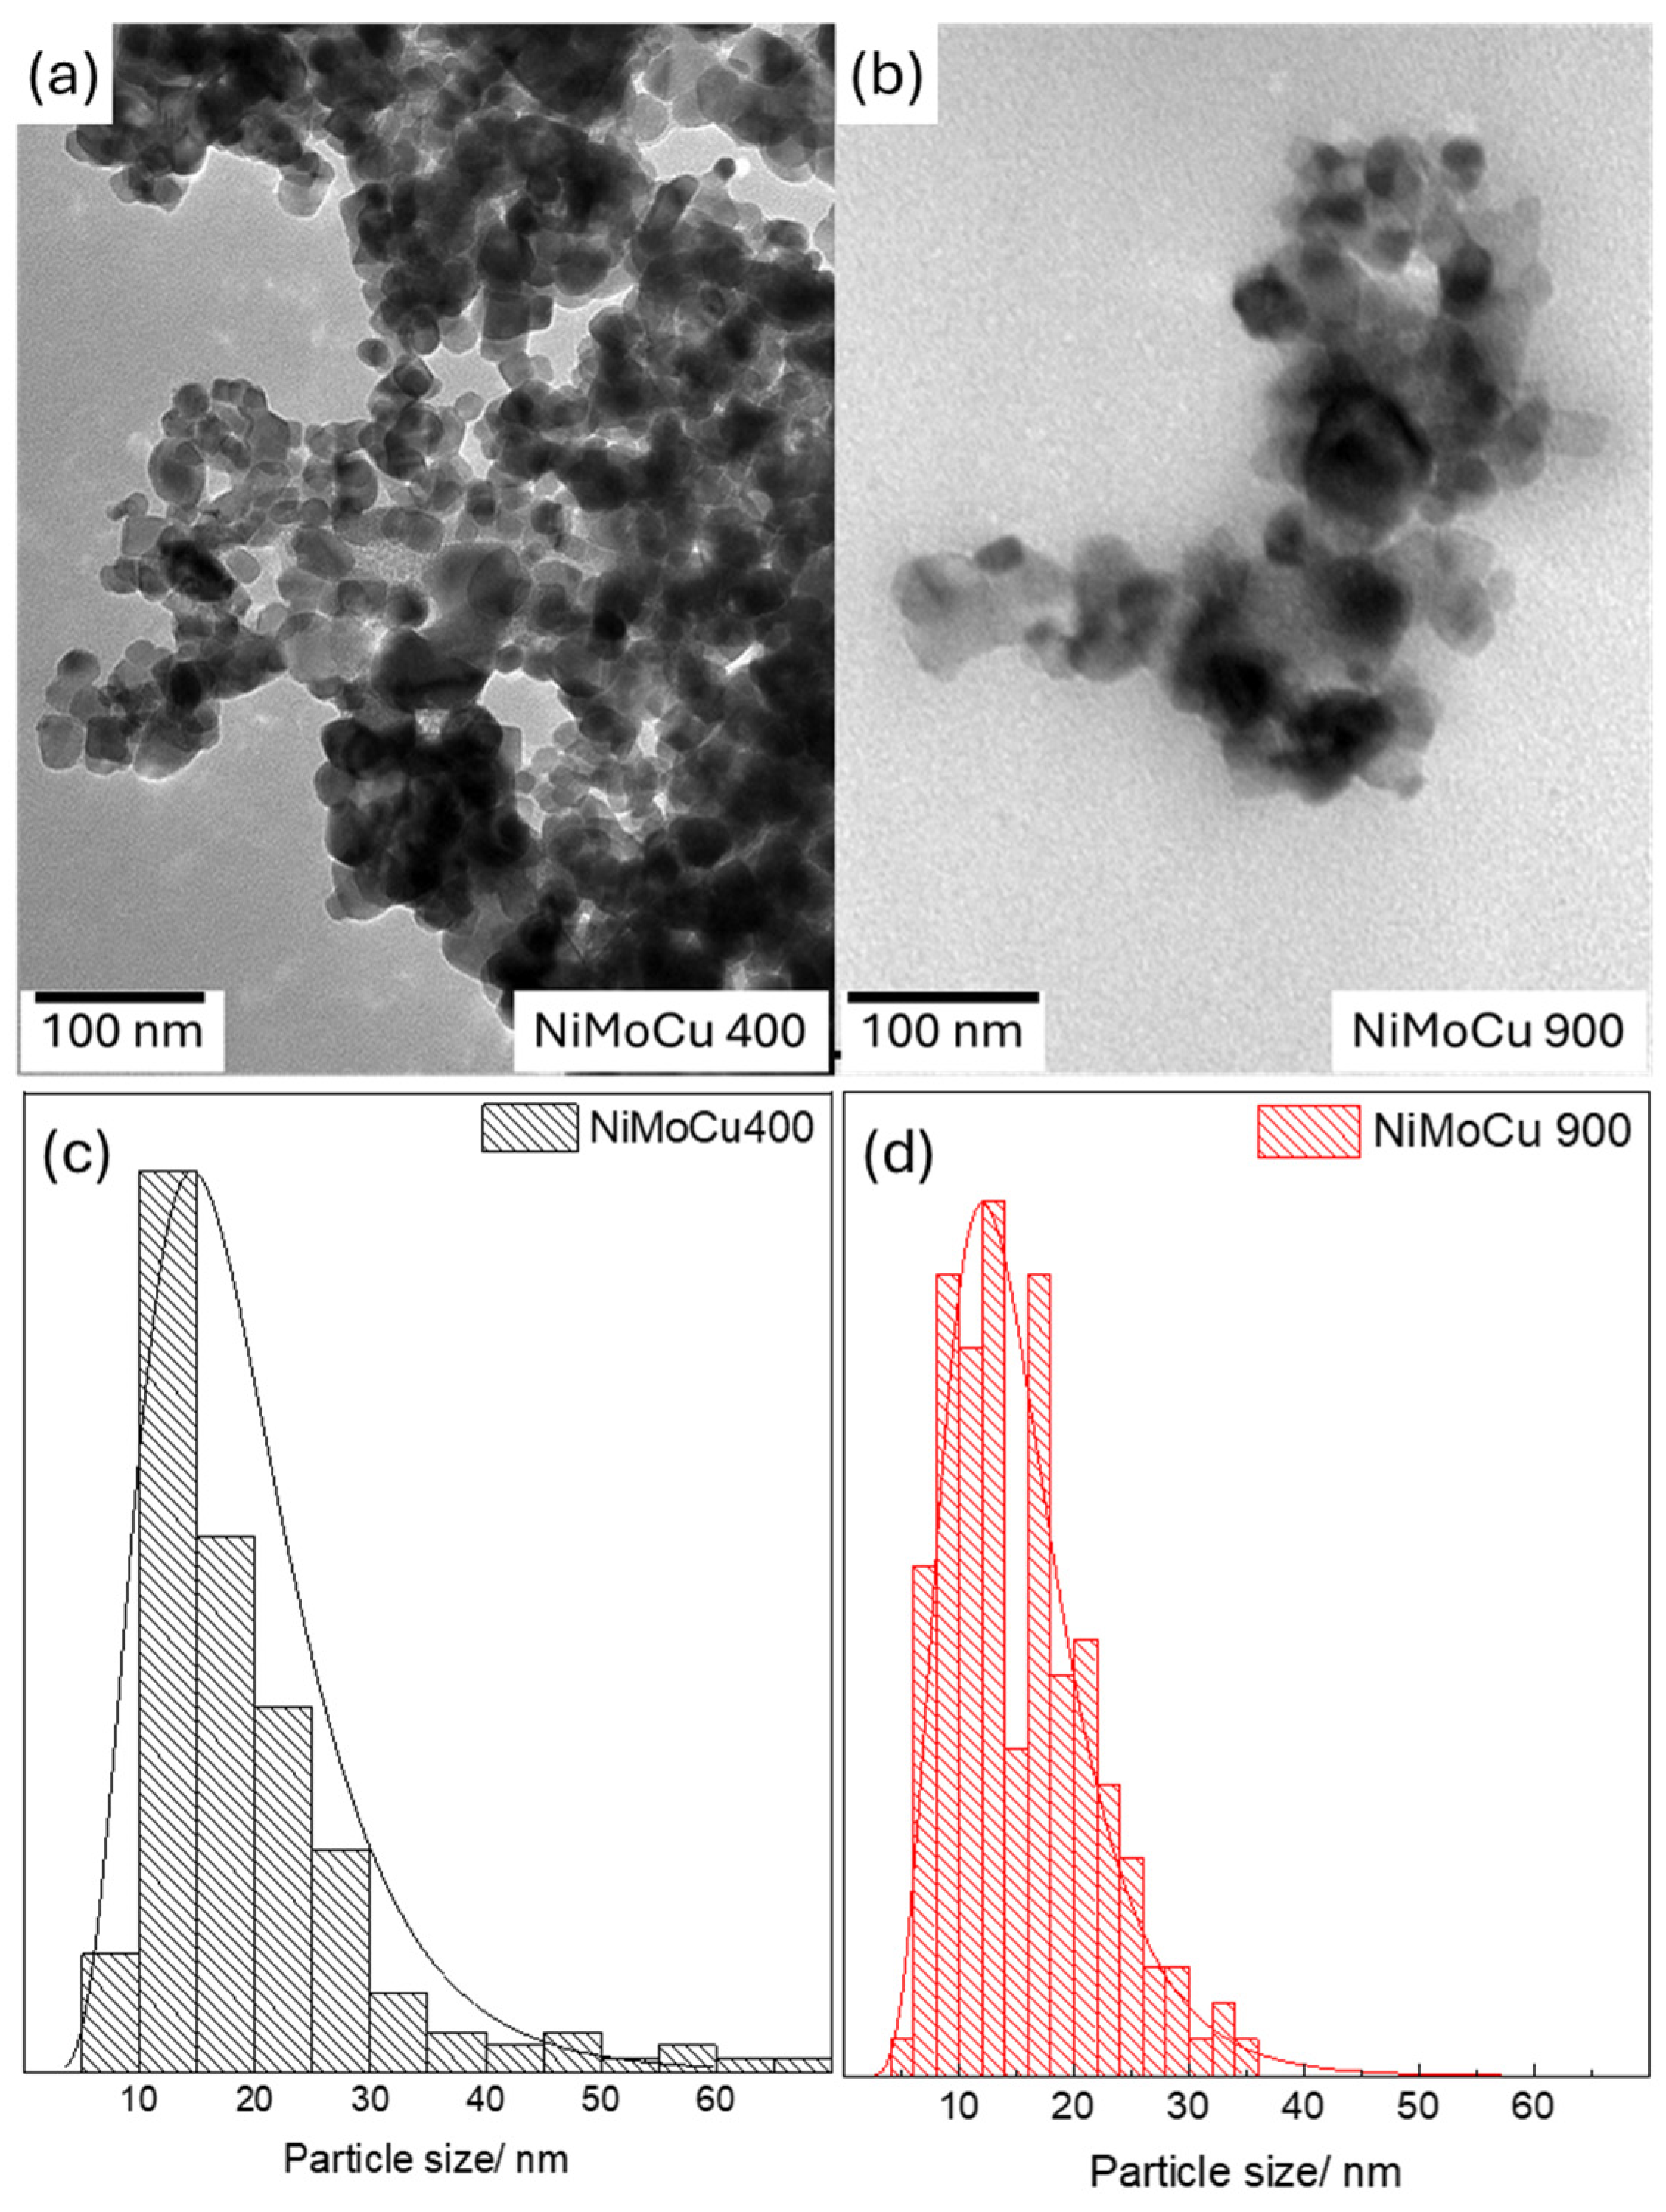
TEM analysis provides further insight into the nanostructure of NiMoCu/TiO
2 catalysts (
Figure 4). NiMoCu400 (
Figure 4a) exhibits a porous and loosely aggregated morphology, with small and irregularly shaped particles. These features suggest limited crystallite growth and stronger metal–support dispersion at lower temperatures. In contrast, NiMoCu900 (
Figure 4b) presents a denser arrangement of larger and more spherical particles, indicative of thermal sintering and grain coalescence. The particle size distributions derived from TEM image analysis are shown in
Figure 5. NiMoCu400 displays a broader and asymmetric distribution centered around 15 nm, with significant polydispersity. In contrast, NiMoCu900 exhibits a narrower and more symmetric size distribution, also centered near 15 nm but with fewer small particles and a greater proportion of coalesced grains. These trends are consistent with the densification and surface area reduction observed by BET.
SEM-EDS analysis indicates that the average atomic composition across both samples was approximately 0.69% Ni, 0.57% Mo, and 0.13% Cu, which is expected from the nominal composition. The corresponding elemental mapping and EDS spectrum for NiMoCu400 are provided in the
Supplementary Materials, Figures S1 and S2, respectively, confirming the uniform distribution of metals across the surface.
2.1.4. X-Ray Photoelectron Spectroscopy (XPS)
The surface chemical composition and oxidation states of Mo, Ni, Cu, Ti, and O were analyzed by XPS. As shown in the survey spectra (
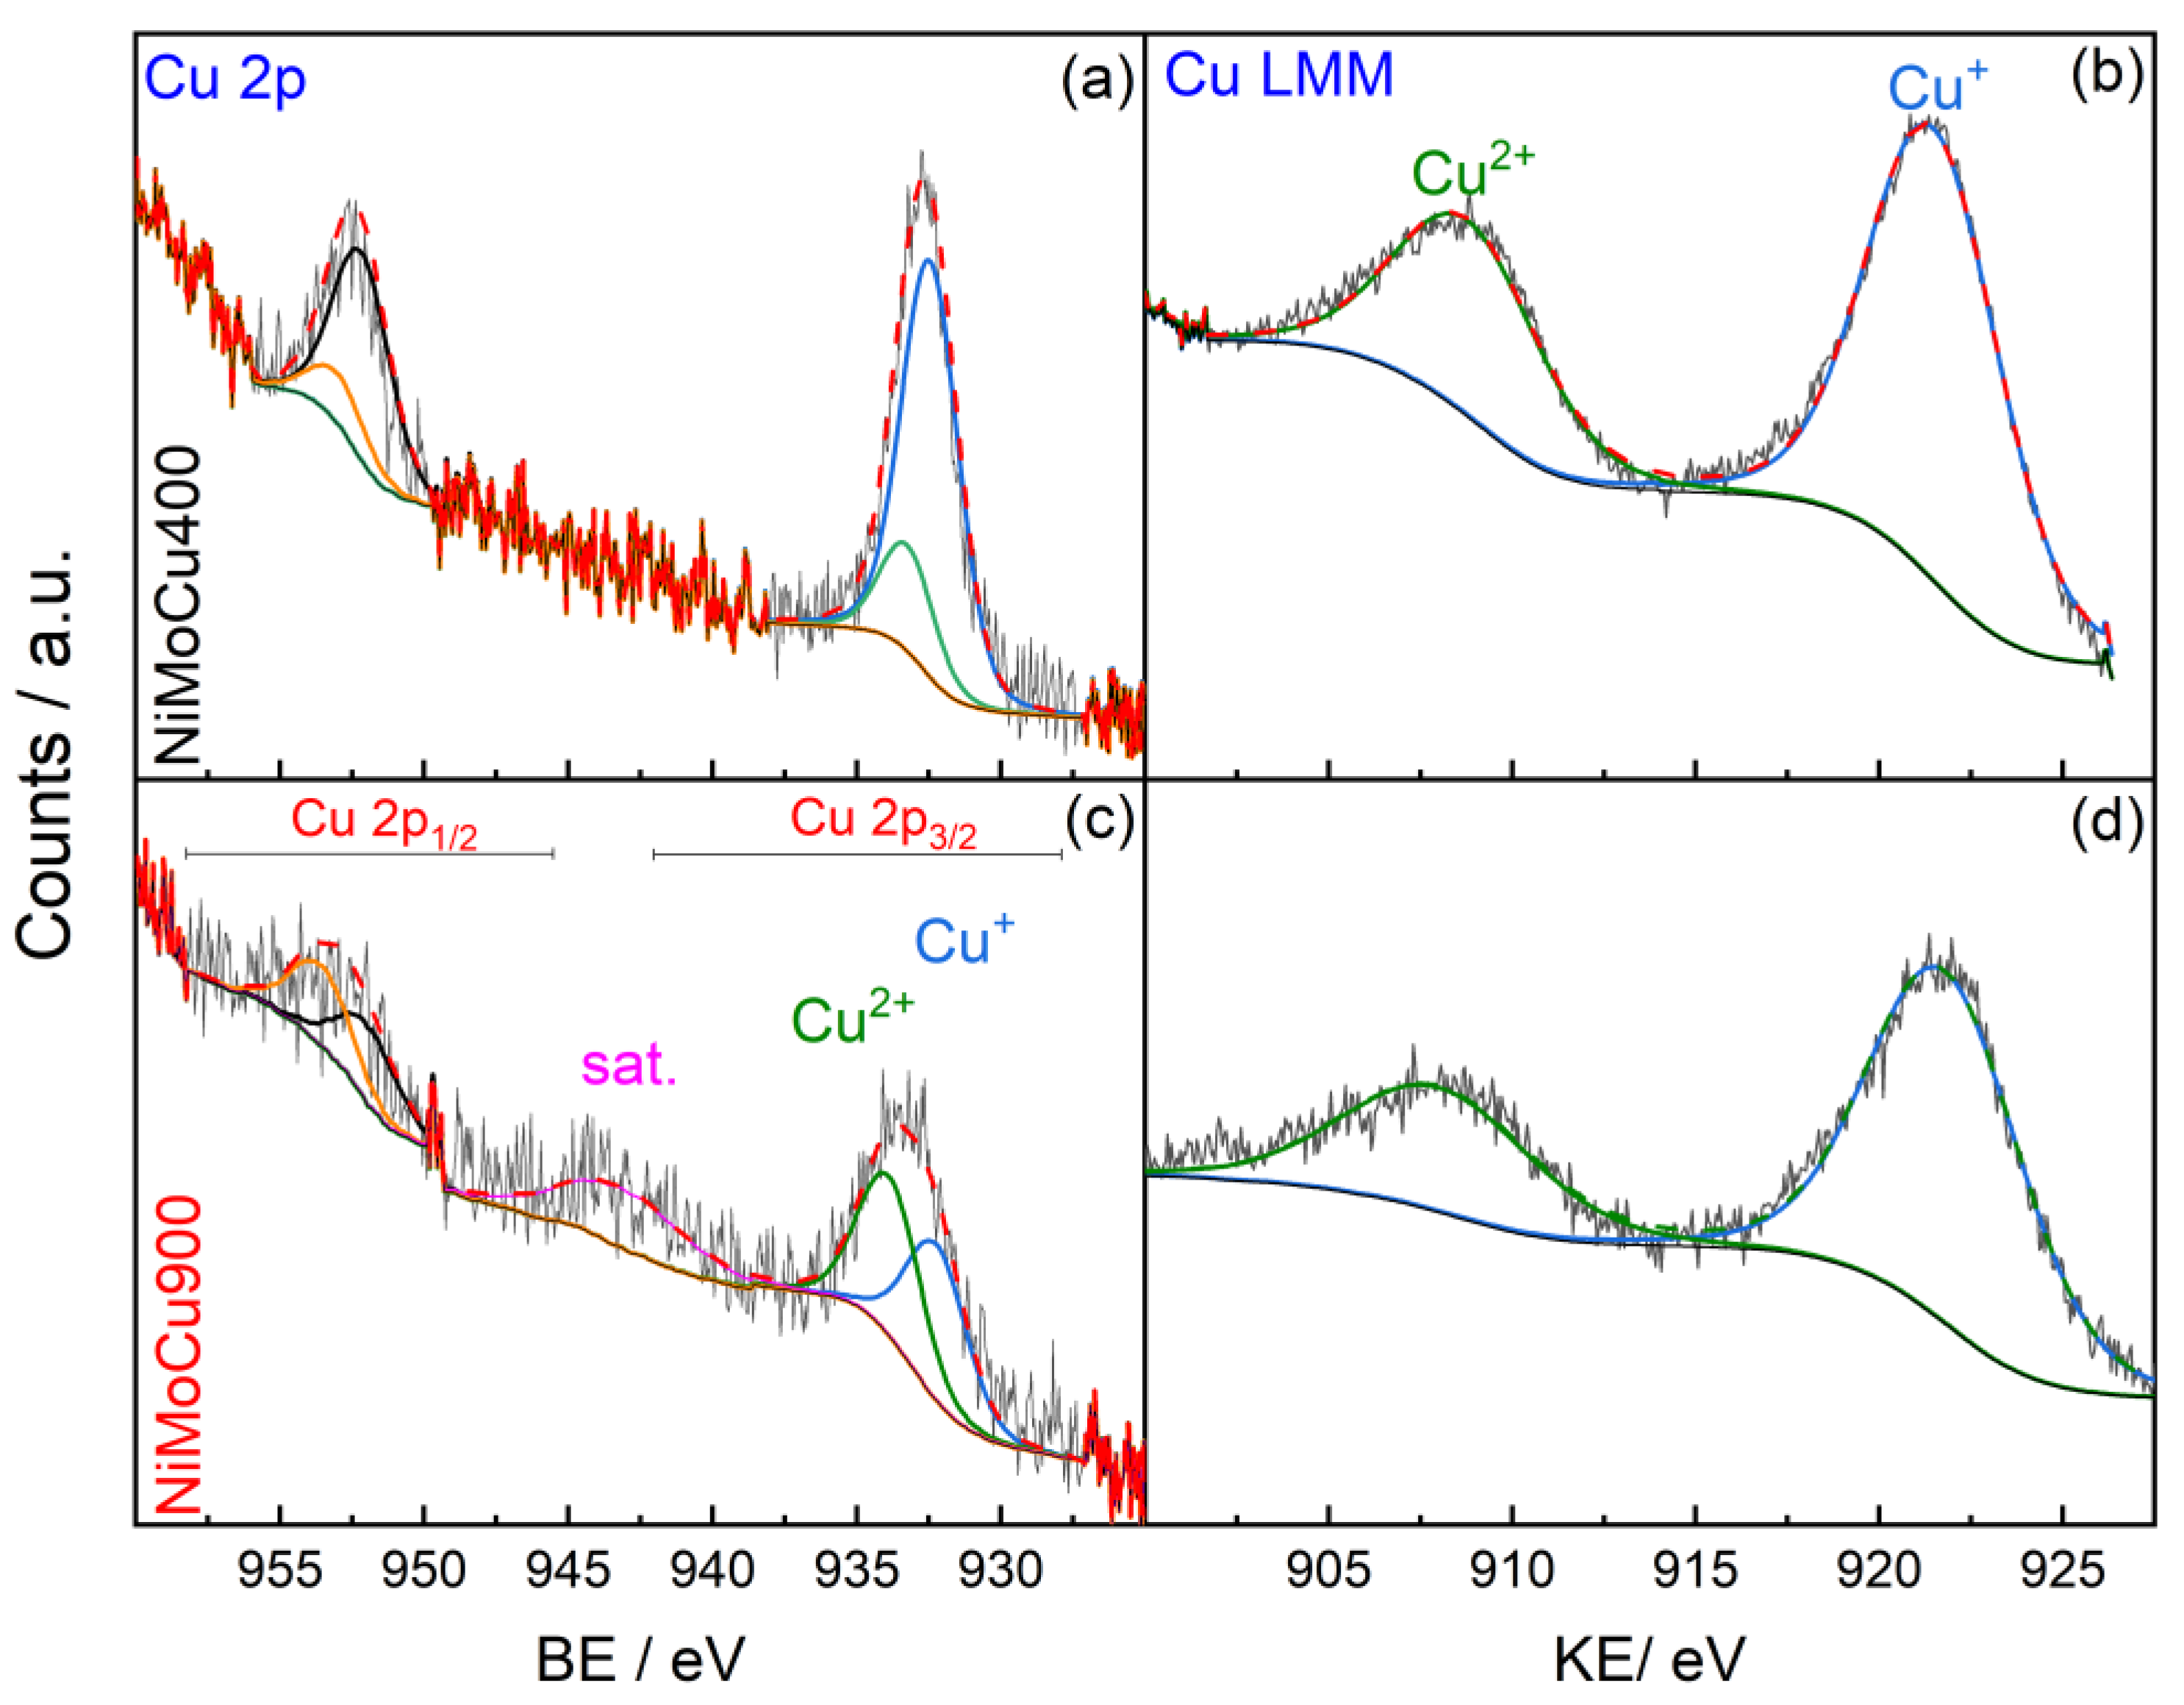
Figure S3, Supplementary Information), all expected elements—Ti, O, Ni, Mo, and Cu—were detected in both NiMoCu400 and NiMoCu900. While the Cu 2p signal was intense in NiMoCu400, it appeared considerably attenuated in NiMoCu900. However, the Cu LMM Auger peak remained clearly visible in both samples, confirming the presence of copper even after calcination at 900 °C.
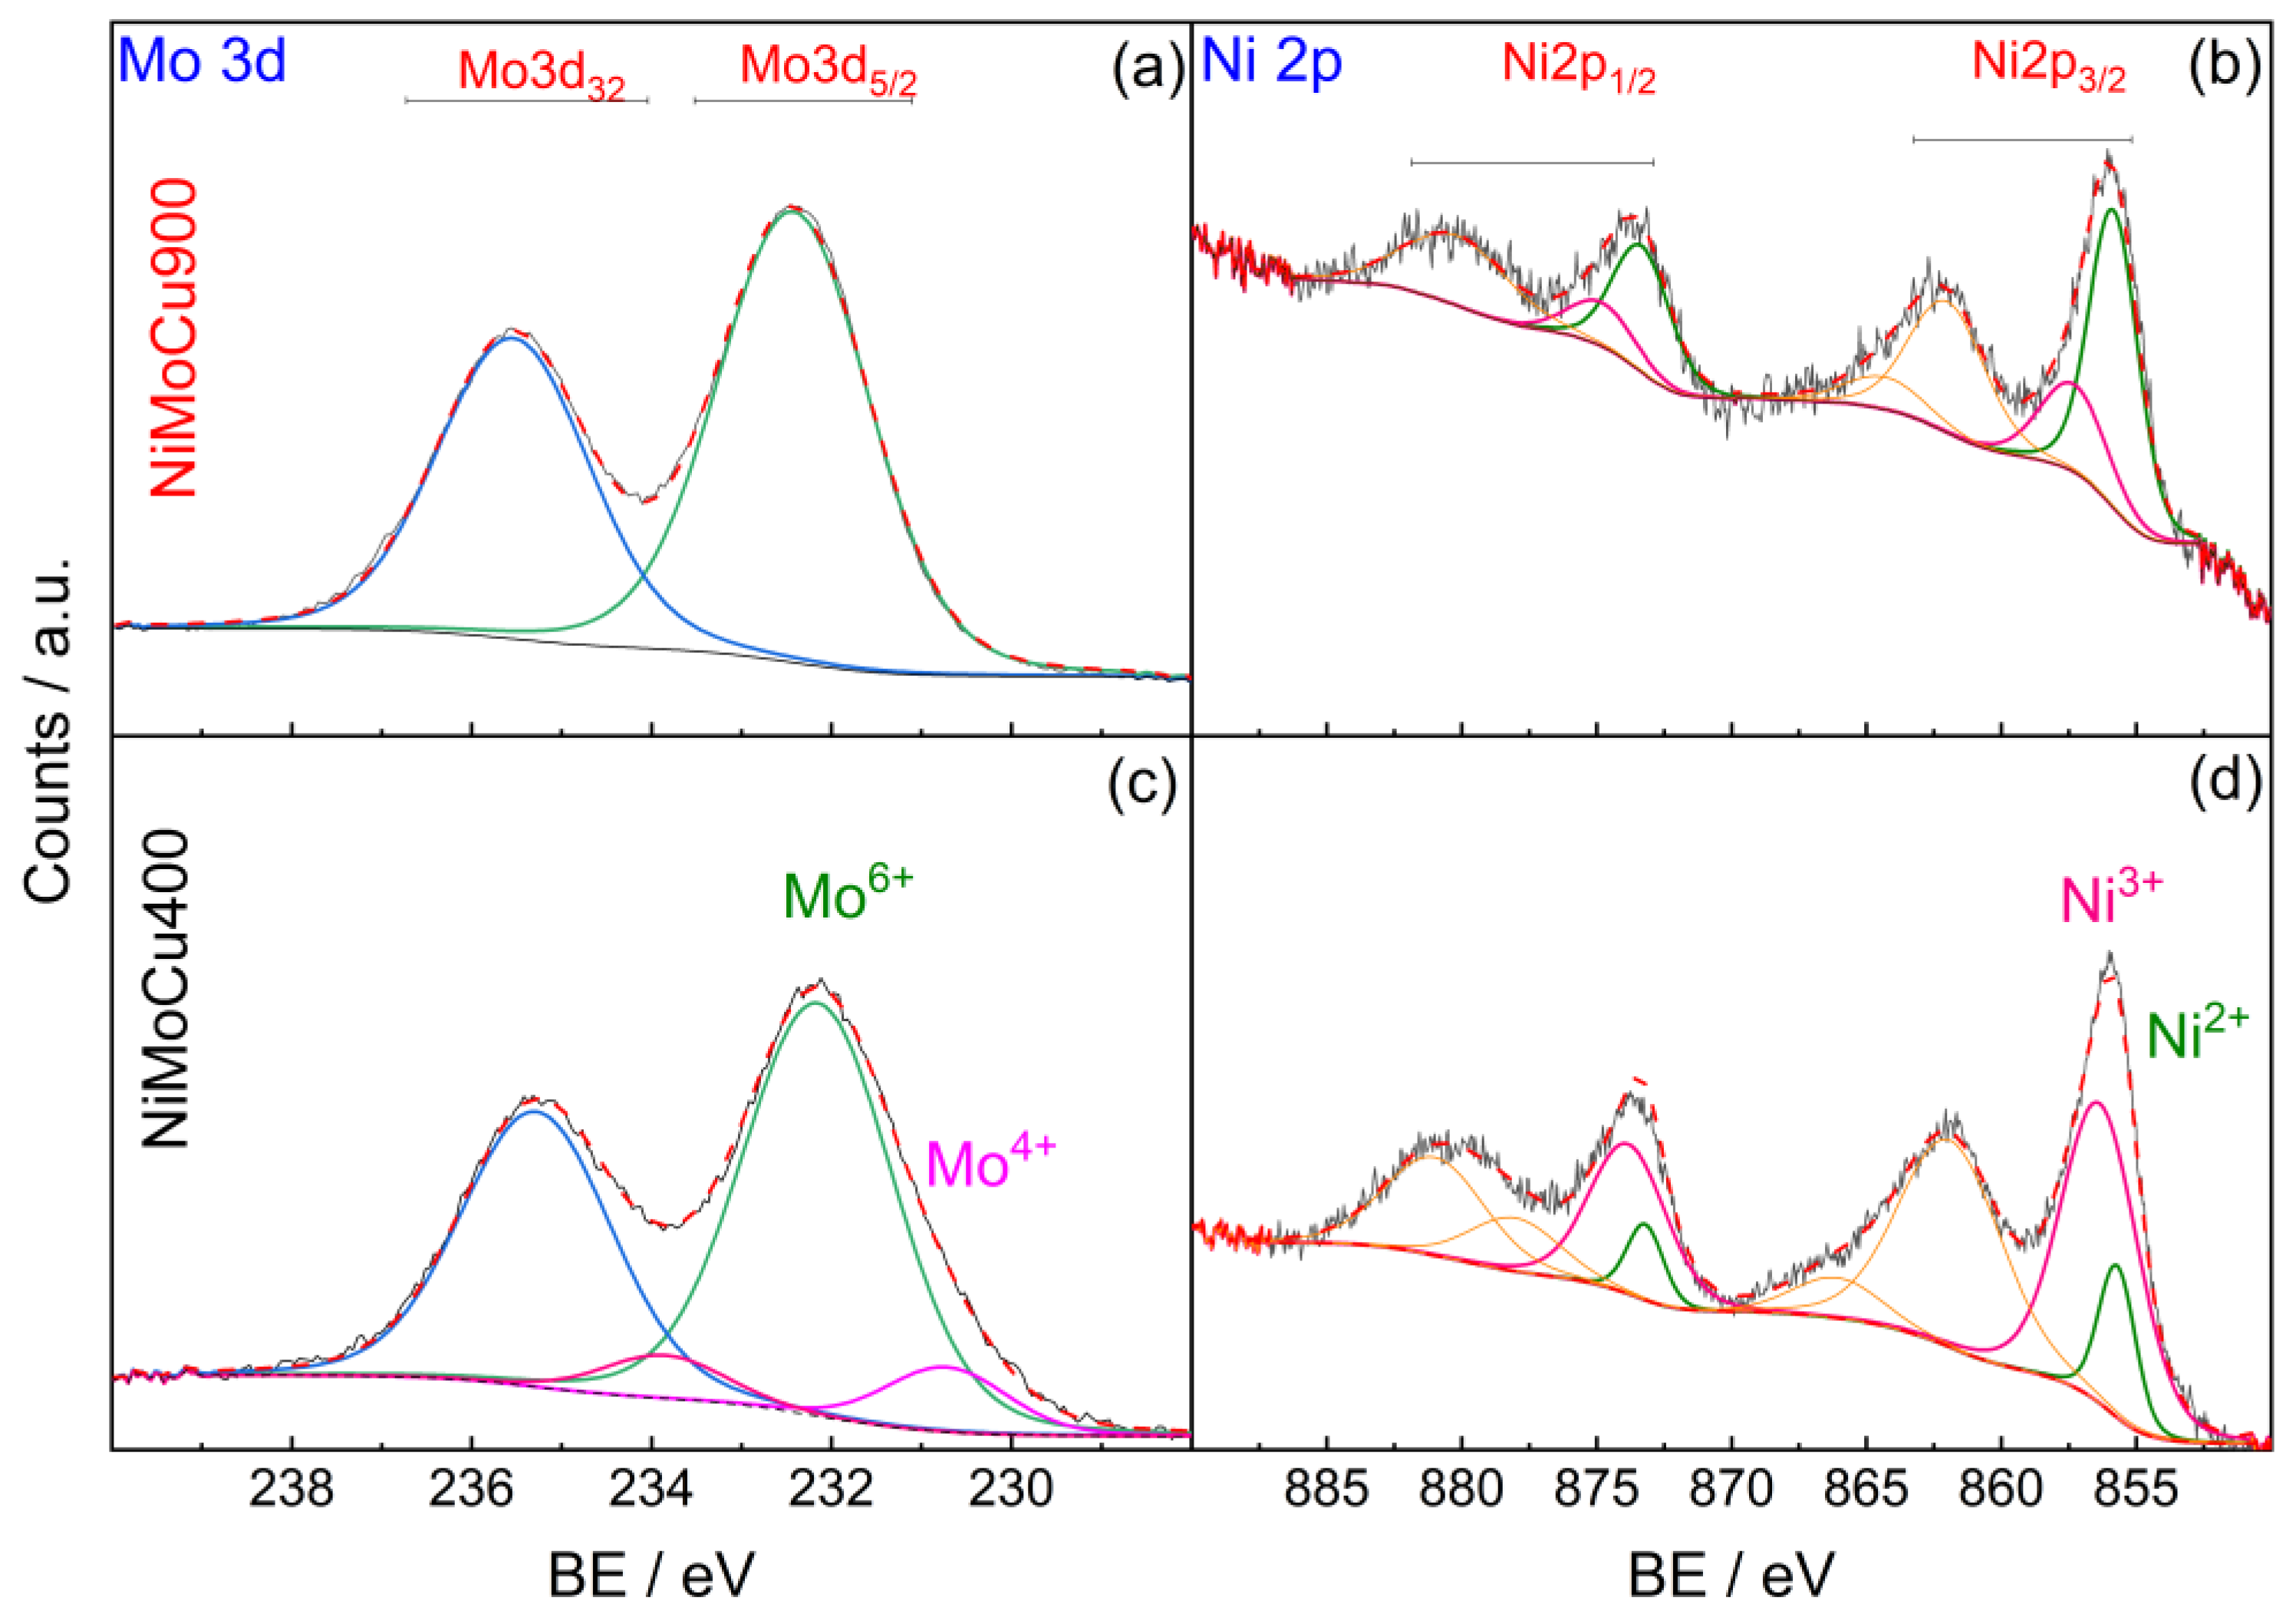
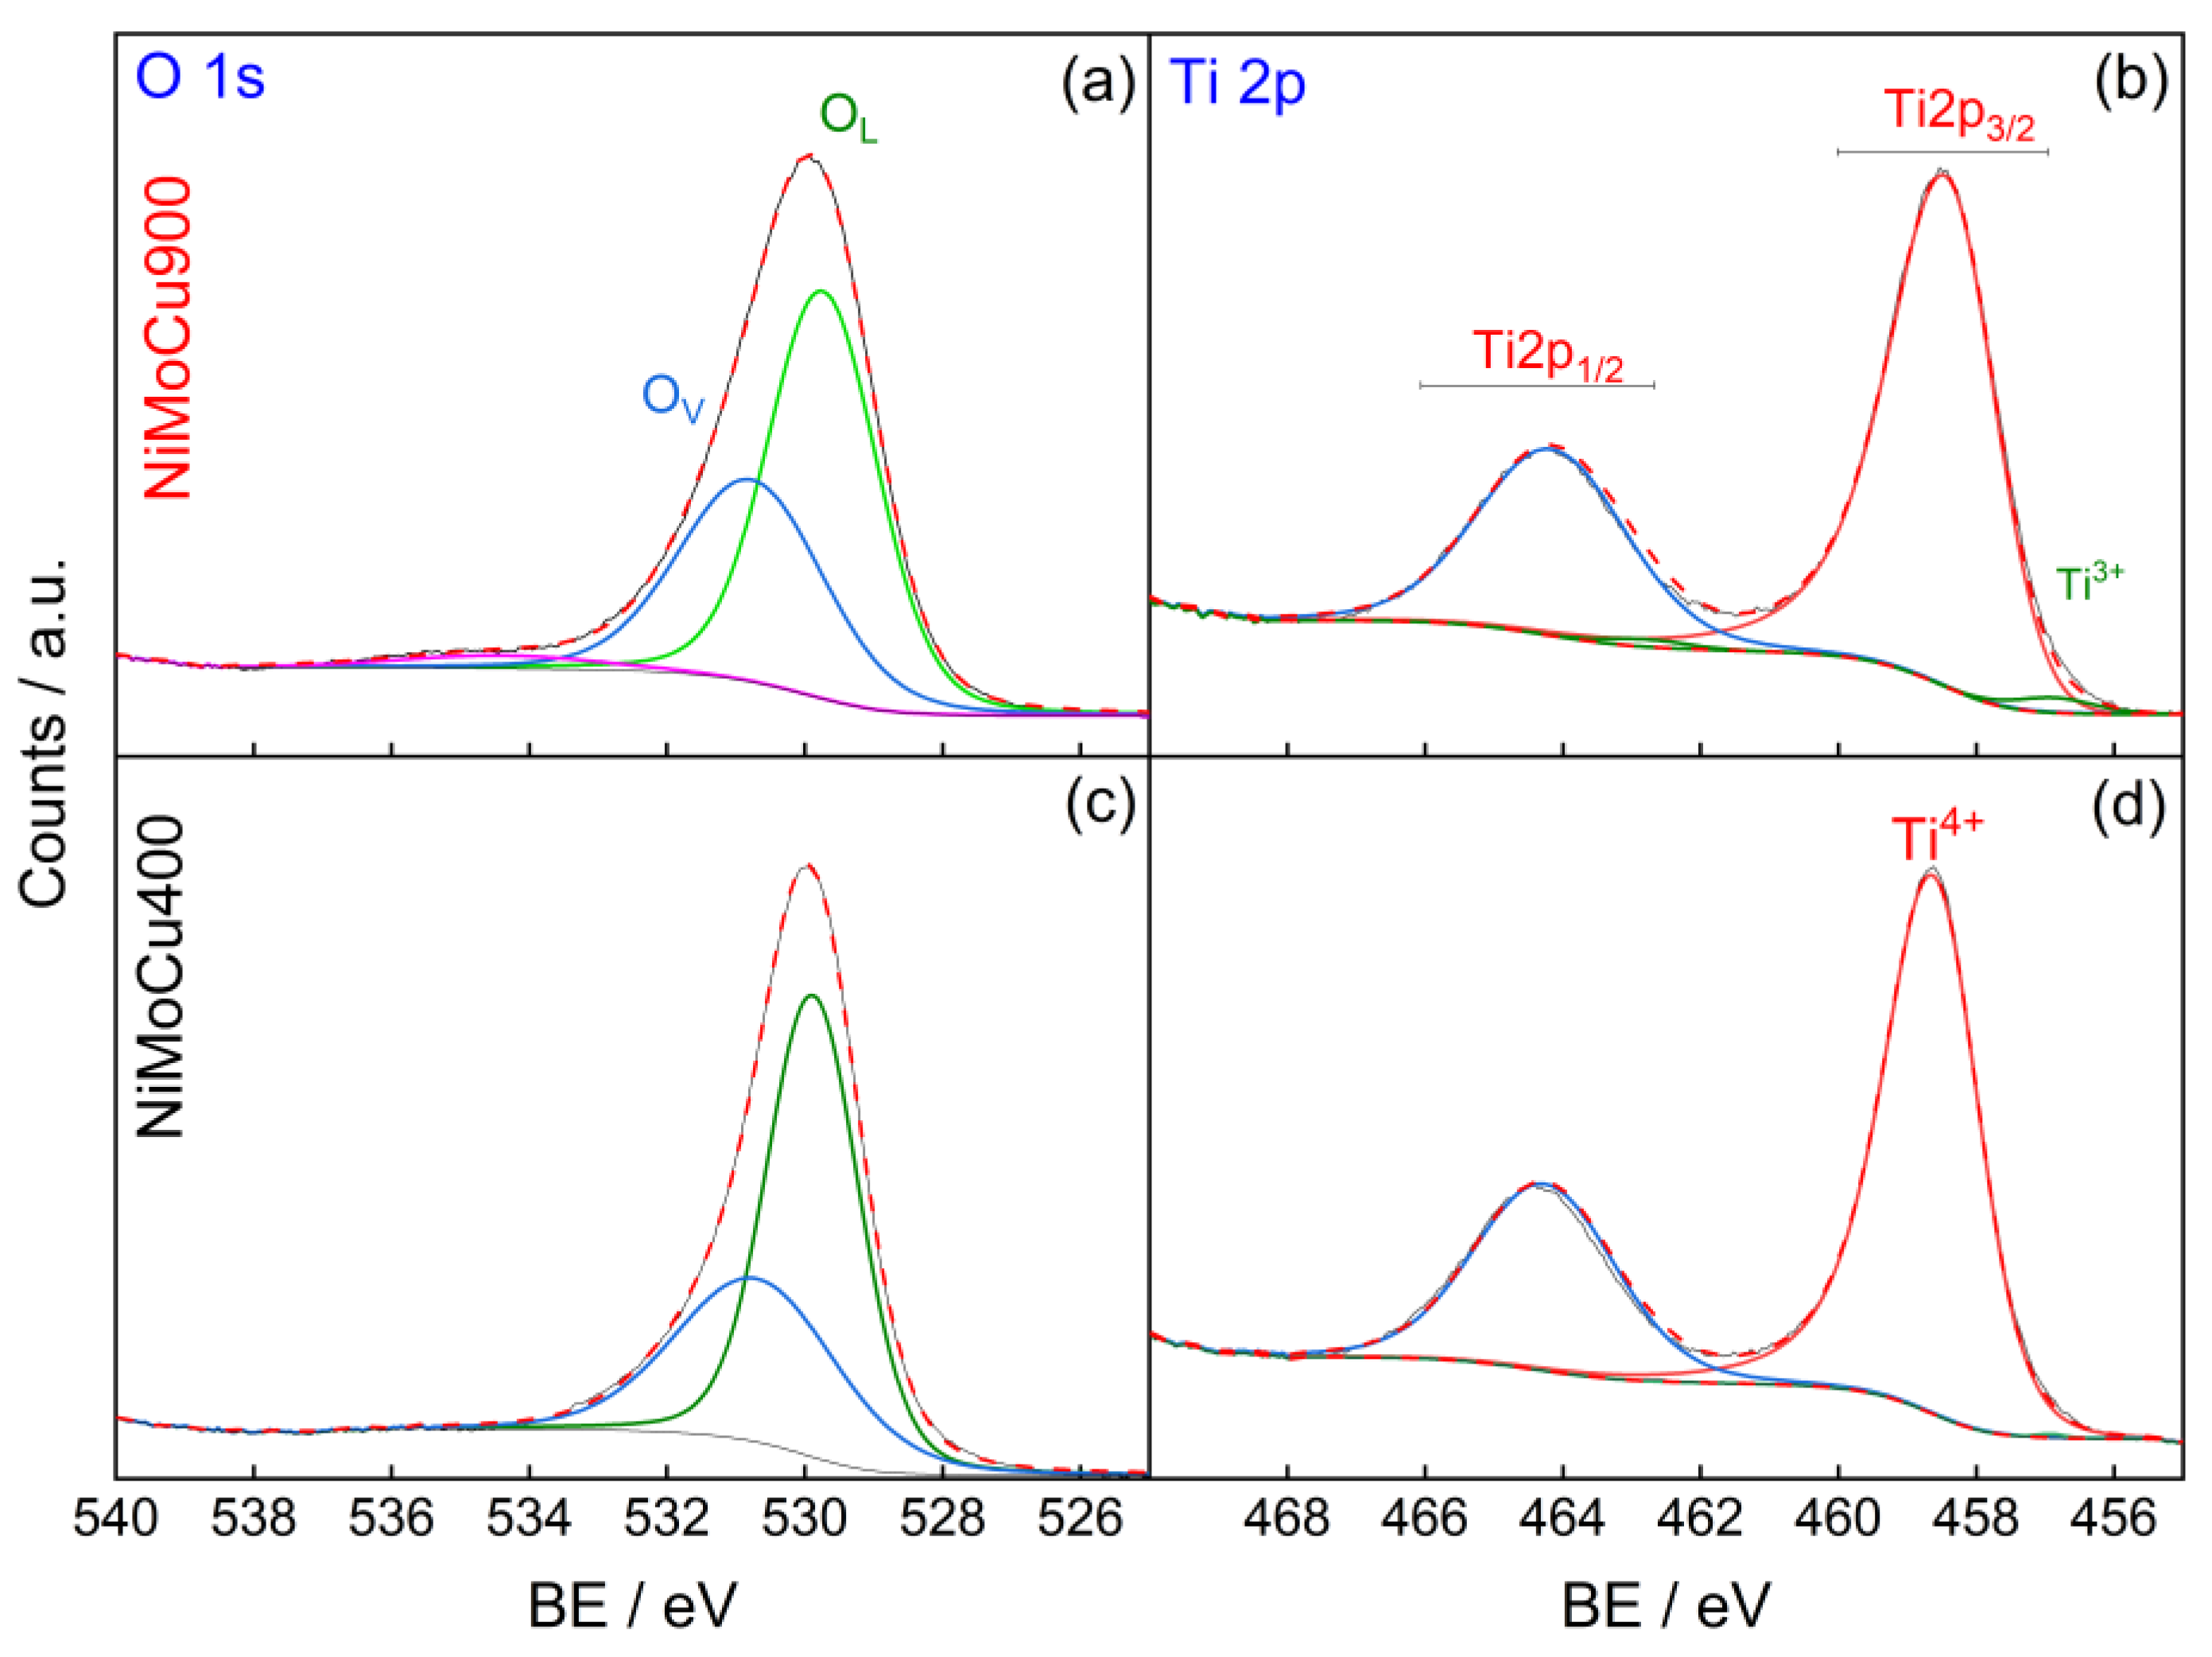
Table 2 summarizes the atomic percentages and binding energies (BE) of the detected species at both calcination temperatures. High-resolution spectra are shown in
Figure 5,
Figure 6 and
Figure 7. For molybdenum (Mo 3d), partial reduction is observed at 400 °C with the presence of Mo
4+ species, while complete oxidation to Mo
6+ occurs at 900 °C, indicating electron loss upon thermal treatment. Nickel (Ni 2p
3/
2) shows a predominant Ni
3+ contribution at 400 °C, which is largely converted to Ni
2+ at 900 °C, suggesting electron gain. Copper (Cu 2p
3/
2) initially presents a majority of Cu
+ species, shifting toward a higher Cu
2+ proportion after calcination. This trend is corroborated by the Cu LMM Auger spectra, where a stronger Cu
2+ signal and an intensified shake-up satellite (~941–944 eV) are observed in NiMoCu900, confirming progressive oxidation (
Figure 6 and
Figure 7). Additionally, the O 1s and Ti 2p regions reveal a moderate increase in surface oxygen vacancies (O
V) and Ti
3+ content, indicating localized reduction processes in the TiO
2 support. A slight increase in the O/Ti ratio and a decrease in overall metal content were also observed upon calcination.
These shifts are consistent with thermally induced charge redistribution processes, likely coupled with solid-state diffusion and phase transformations. In particular, the reduction of Ni
3+ to Ni
2+ and the simultaneous oxidation of Mo
4+ to Mo
6+ suggest a charge transfer from molybdenum to nickel with increasing temperature, a process that may help stabilize the electronic structure under high-temperature conditions. This electron exchange is further associated with the formation of nickel titanate (NiTiO
3), as demonstrated by XRD [
29], involving Ni migration into the TiO
2 lattice and the generation of oxygen vacancies to maintain charge balance. The redistribution of surface species can also be explained by their intrinsic properties: Ni, with a lower atomic volume and Tamman temperature (~590 °C) compared to Mo and Cu, exhibits greater mobility under thermal treatment, promoting its accumulation at the surface. In contrast, Mo forms stable MoOx species strongly anchored to the TiO
2 support, while Cu tends to generate less mobile oxidic aggregates. Thus, calcination at 900 °C leads to a more oxidized and electronically rigid surface, in contrast to the mixed-valence, defect-rich configuration observed at 400 °C, with important implications for catalytic performance. This balance between lattice oxygen and oxygen vacancies is particularly relevant, as these oxygen species play a key role in both photocatalytic pollutant degradation and hydrogen evolution. According to recent studies, including Zou et al. [
30], the presence of surface-adsorbed oxygen species and lattice defects can promote reactive oxygen species (ROS) formation and facilitate multielectron redox processes. The higher O
V content observed in NiMoCu400 suggests a more defect-rich surface, which may favor redox-driven applications under illumination.
The oxidation state shifts of Cu, Ni, and Mo suggest a coupled redox mechanism driven by charge compensation, solid-state diffusion, and defect reorganization. The progressive oxidation of Cu
+ to Cu
2+, accompanied by the reduction of Ni
3+ to Ni
2+ and the full oxidation of Mo
4+ to Mo
6+, reflects the dominance of oxidative conditions at 900 °C and the formation of nickel titanate (NiTiO
3). This behavior is further corroborated by the Cu 2p
3/
2 and Cu LMM Auger spectra (
Figure 6 and
Figure 7), where NiMoCu900 shows a stronger Cu
2+ signal and a more intense shake-up satellite (~944 eV) compared to NiMoCu400. The increase in the Cu
2+/Cu
+ atomic ratio with calcination confirms the progressive copper oxidation [
19].
Thus, NiMoCu400 exhibits a mixed-valence surface (Cu+/Cu2+, Ni2+/Ni3+, Mo4+/Mo6+) conducive to enhanced redox flexibility, whereas NiMoCu900 presents a more oxidized and electronically rigid configuration.
EDS analysis confirmed that the overall Ni, Mo, and Cu contents closely match the nominal composition in both catalysts. However, XPS revealed a clear surface enrichment of molybdenum and depletion of copper, particularly in the NiMoCu900 sample. These differences highlight that high-temperature calcination induces element migration, altering the surface chemical environment.
2.1.5. Optical Properties (UV–Vis DRS)
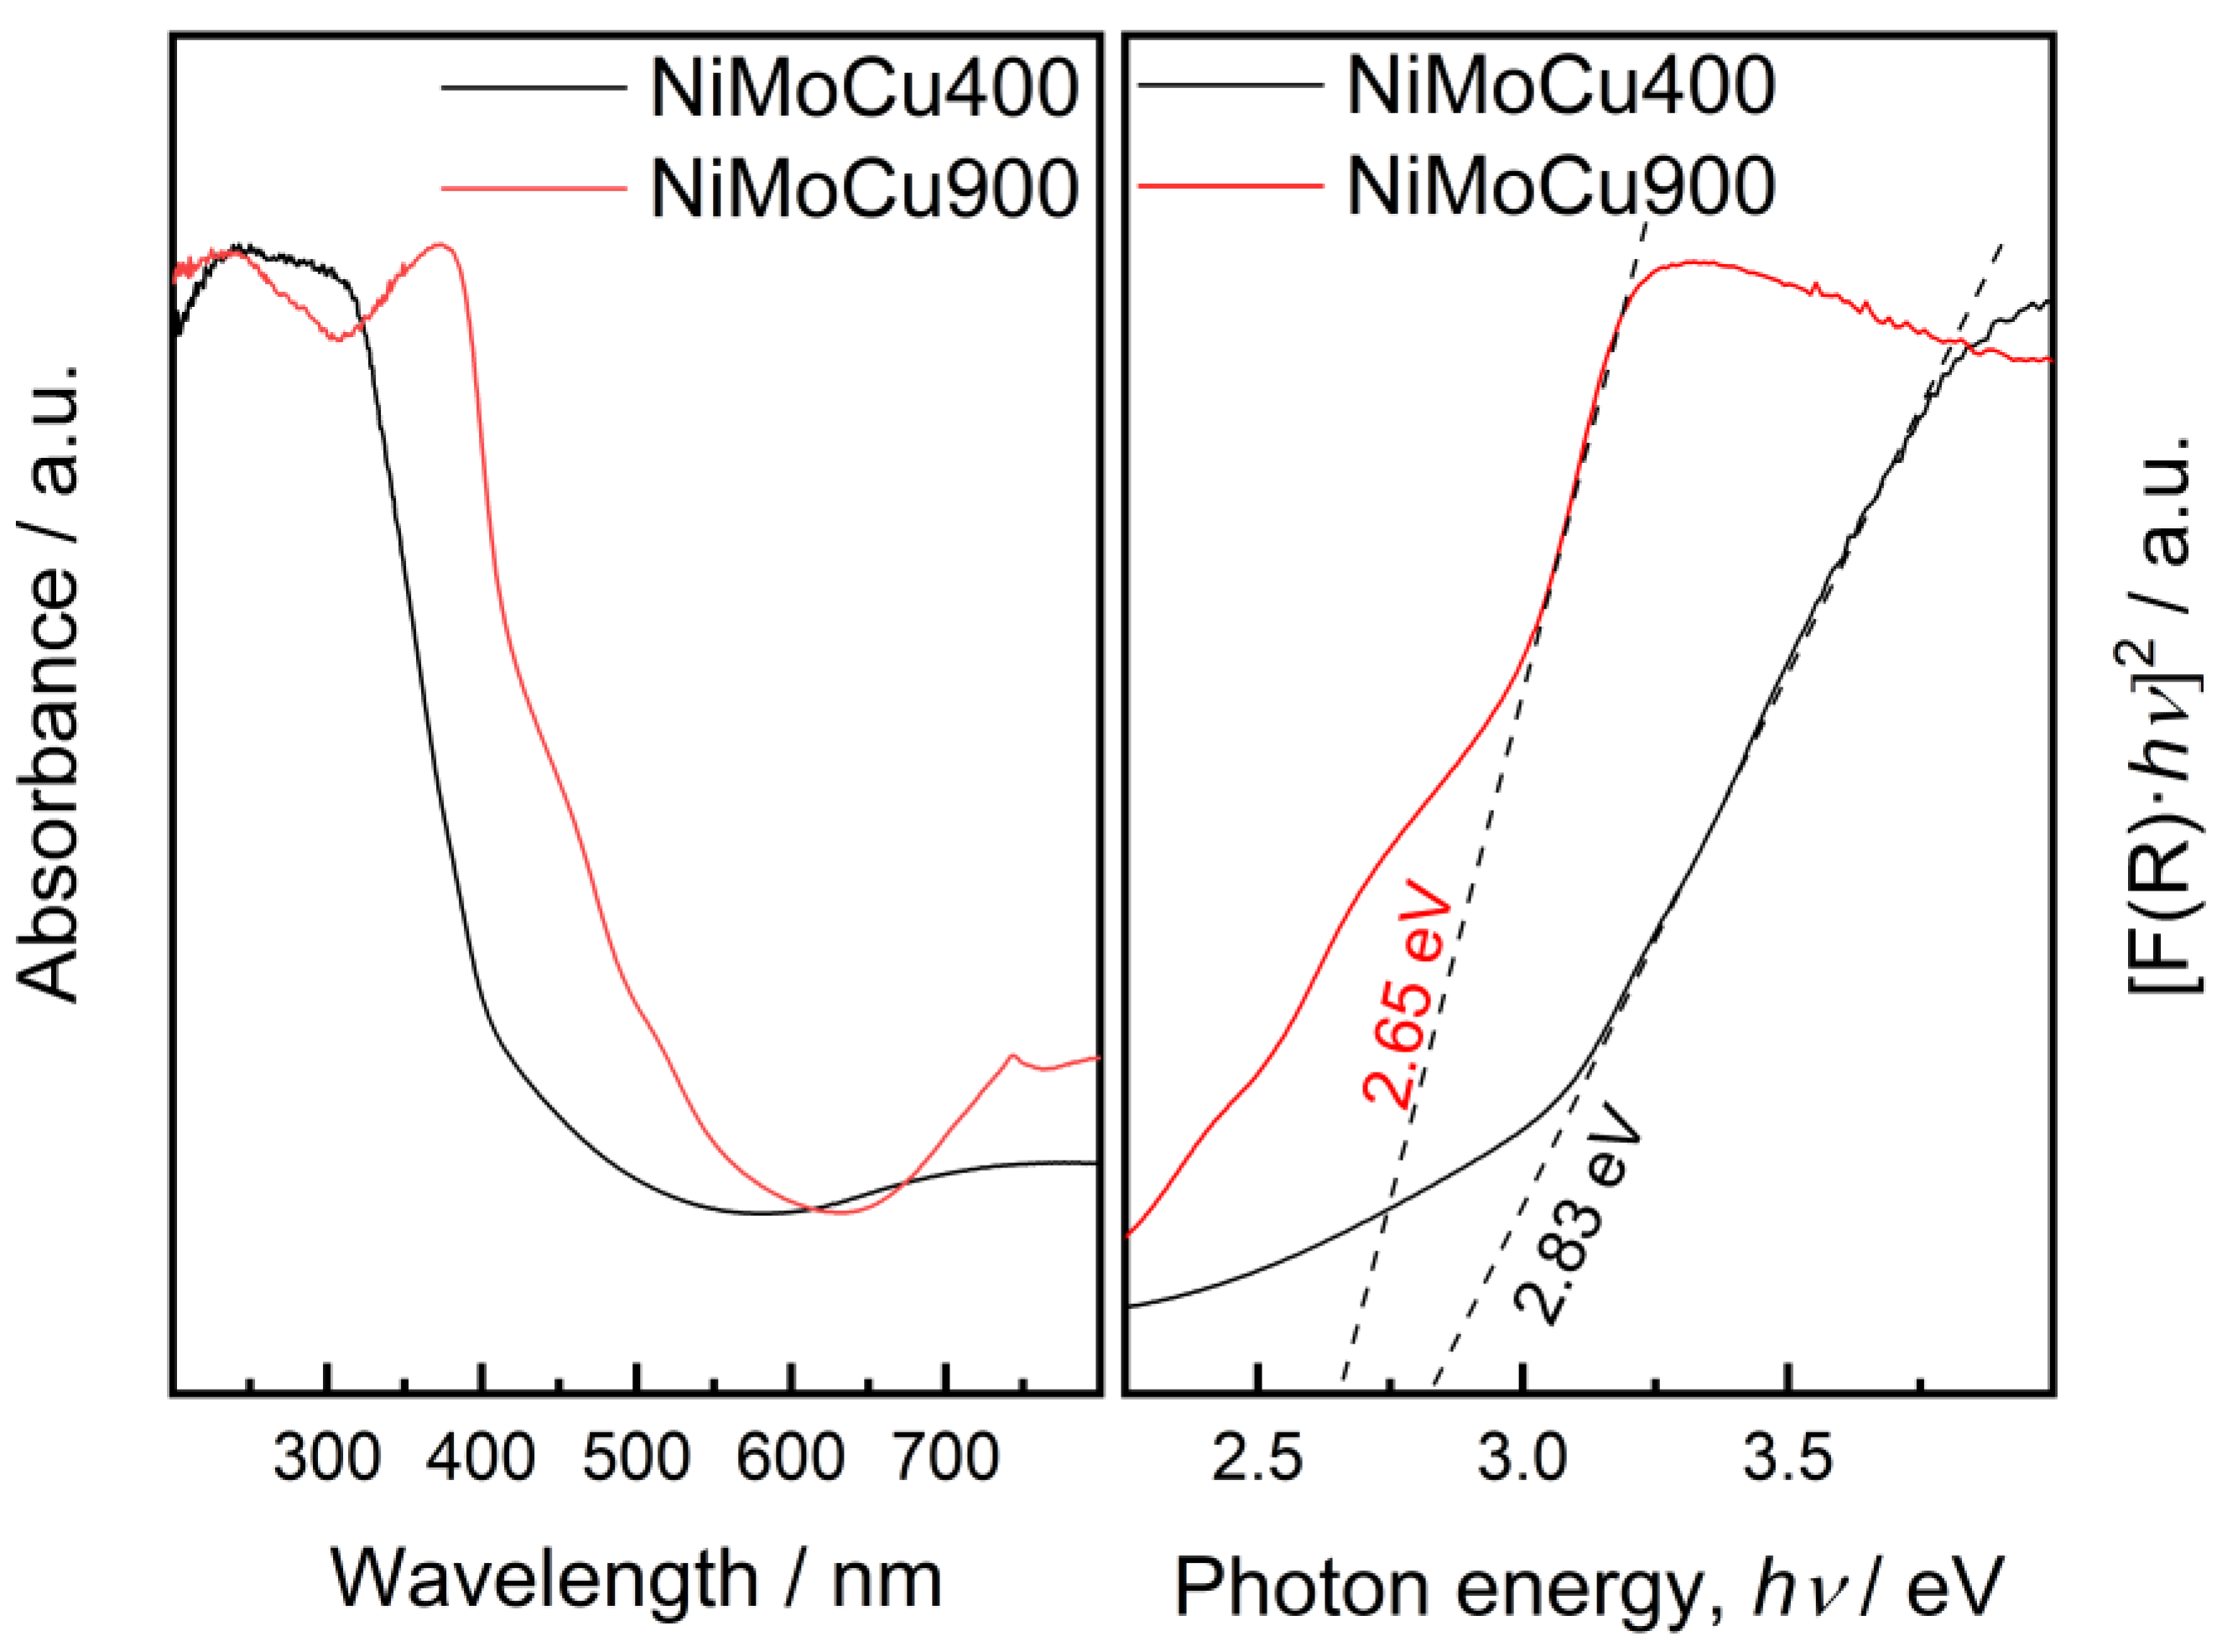
The optical properties of the NiMoCu catalysts were assessed by UV–Vis diffuse reflectance spectroscopy (DRS), and the corresponding Tauc plots are shown in
Figure 8. NiMoCu400 exhibits an absorption edge around 350–380 nm, characteristic of anatase TiO
2, with a slight enhancement in visible-light absorption likely due to the presence of copper and the formation of oxygen vacancies. In contrast, NiMoCu900 shows a further shift of the absorption edge into the visible region (360–400 nm), which can be primarily attributed to the anatase-to-rutile phase transformation revealed by XRD, combined with increased crystallinity and structural densification at higher calcination temperature. This phase conversion, along with the generation of oxygen vacancies and other defect states, contributes to the narrowing of the bandgap and the extension of light absorption towards longer wavelengths [
20,
31]. Similar observations have been reported for thermally treated C-doped TiO
2, where oxygen vacancies contributed significantly to band gap narrowing under visible light [
32].
Bandgap values, estimated from the Tauc plots using the Kubelka–Munk function and assuming indirect allowed transitions (n = ½), confirm this trend. NiMoCu400 and NiMoCu900 exhibit band gaps of 2.83 eV and 2.65 eV, respectively—significantly lower than those reported for undoped NiMo–TiO
2 counterparts (3.48 eV for NiMo–TiO
2-400 and 3.04 eV for NiMo–TiO
2-900) [
17].
The bandgap narrowing observed upon Cu doping is attributed to multiple synergistic effects, including the introduction of Cu 3d states near the conduction band, the formation of oxygen vacancies, and the distortion of the TiO
2 lattice [
21,
23]. These modifications promote visible light harvesting and may enhance charge carrier separation, thereby improving the photocatalytic and photoelectrochemical performance of the materials under light irradiation. In addition, the presence of Cu
+/Cu
2+ redox pairs can facilitate interfacial charge transfer and inhibit electron–hole recombination, which further contributes to the observed photocatalytic improvements [
33].
These results indicate that Cu doping enhances light absorption by reducing the bandgap more effectively than NiMo-TiO2 alone, which could be beneficial for improving photocatalytic activity under visible-light irradiation.
These physicochemical and optical results demonstrate that calcination temperature and copper incorporation strongly influence the structural, electronic, and redox properties of the NiMoCu/TiO2 catalysts. NiMoCu400 retains a porous morphology, a narrower bandgap, and a surface enriched in mixed-valence species and oxygen vacancies, which are all favorable for redox-mediated catalysis. In contrast, NiMoCu900 exhibits a more crystalline and oxidized structure with reduced surface area and limited redox flexibility. To assess how these differences affect charge transfer and catalytic activity, the electrochemical behavior of the materials was evaluated under relevant reaction conditions, as detailed in the following section.
Physicochemical analysis shows that copper incorporation and moderate calcination (400 °C) preserve a mesoporous anatase-rich structure with a high surface area, abundant redox-active sites (Cu+/Cu2+, Ni2+/Ni3+, Mo4+/Mo6+), and oxygen vacancies. The catalysts exhibit a narrower bandgap and extended visible-light absorption. In contrast, high-temperature calcination (900 °C) leads to densification, rutile formation, and redox rigidity, with Mo surface enrichment and Cu depletion, as indicated by XPS and EDS.
2.1.6. Photoelectrochemical Analysis
The photoelectrochemical behavior of the NiMoCu catalysts was investigated under simulated solar illumination using a xenon lamp in 0.1 mol·L
−1 phosphate buffer solution (pH 7). Open-circuit potential (OCP) measurements (
Figure S4) revealed distinct photovoltage responses. Upon light exposure, NiMoCu900 exhibited a sharp potential drop of ~420 mV (from ~1.35 V to ~0.93 V vs. RHE), whereas NiMoCu400 showed a smaller shift of ~260 mV (from ~1.00 V to ~0.74 V). The larger photovoltage shift in NiMoCu900 suggests a higher degree of initial surface reduction species or charge accumulation. However, its photocurrent response under chopped illumination remained negligible (
Figure S5), which may be associated with increased crystallinity and copper depletion at high temperature.
Chronoamperometric measurements were performed at fixed potentials near the OCP of each catalyst (0.70 V for NiMoCu400 and 0.84 V for NiMoCu900). For NiMoCu400 (
Figure S5 (upper)), the average photocurrent density under illumination was ~18 µA·cm
−2. In contrast, NiMoCu900 (
Figure S5 (lower)) exhibited minimal and unstable current, indicating poor charge transport and interfaces prone to recombination.
Mott–Schottky analysis (
Figure S6) provided further insight into the electronic properties of the materials. NiMoCu400 showed a positive slope, characteristic of n-type semiconductors, with an estimated flat-band potential (E_FB) of +1.23 V vs. RHE and a donor density (N_D) of 1.63 × 10
16 cm
−3. Conversely, NiMoCu900 displayed a negative slope, consistent with p-type behavior, with E_FB = +0.30 V vs. RHE and an acceptor density (N_A) of 3.52 × 10
15 cm
−3. This inversion is attributed to structural and electronic rearrangements induced by high-temperature calcination. The complete anatase-to-rutile transformation and the formation of deep oxygen vacancies can alter band alignment via internal dipoles, potentially shifting conductivity from n-type to p-type [
34,
35].
2.2. Electrochemical and Photoelectrochemical Characterization
Electrochemical measurements were performed to investigate the redox behavior, surface accessibility, and catalytic activity of NiMoCu/TiO2 catalysts in neutral phosphate buffer solution (0.1 mol·L−1, pH 7). The analysis focused on evaluating the presence of electroactive redox pairs and the performance toward the hydrogen evolution reaction (HER) and paracetamol oxidation reaction under both dark and illuminated conditions. Cyclic voltammetry (CV), chronoamperometry, and capacitance analysis were used to correlate surface properties with charge transfer behavior. Special attention was given to the influence of copper doping and calcination temperature on the electrochemical response.
2.2.1. Electrochemical Double-Layer Capacitance
The electrochemical double-layer capacitance (Cdl) was determined from non-faradaic cyclic voltammetry measurements conducted in the 0.80–0.90 V vs. RHE potential window, using scan rates between 5 and 150 mV·s
−1 (
Figure S7). The average current density was plotted as a function of scan rate, and Cdl values were extracted from the slope of the linear regression. The results, along with the estimated electrochemically active surface area (ECSA), are summarized in
Table S1 and
Figure S8 (
Supplementary Information).
The Cdl values exhibited notable differences across the samples. NiMoCu400 showed the highest capacitance (94 µF·cm−2), followed by NiMoCu900 (57 µF·cm−2), NiMo400 (51 µF·cm−2), and NiMo900 (36 µF·cm−2). The corresponding ECSA values, calculated using a standard specific capacitance of 40 µF·cm−2, were 2.4, 1.4, 1.3, and 0.9 cm2, respectively. These results indicate a clear enhancement in surface electrochemical accessibility for NiMoCu400, aligned with its superior structural and morphological features. The lower Cdl values observed for NiMo and NiMoCu900 suggest more limited electroactive interfaces under the tested conditions.
2.2.2. Photoelectrochemical Response
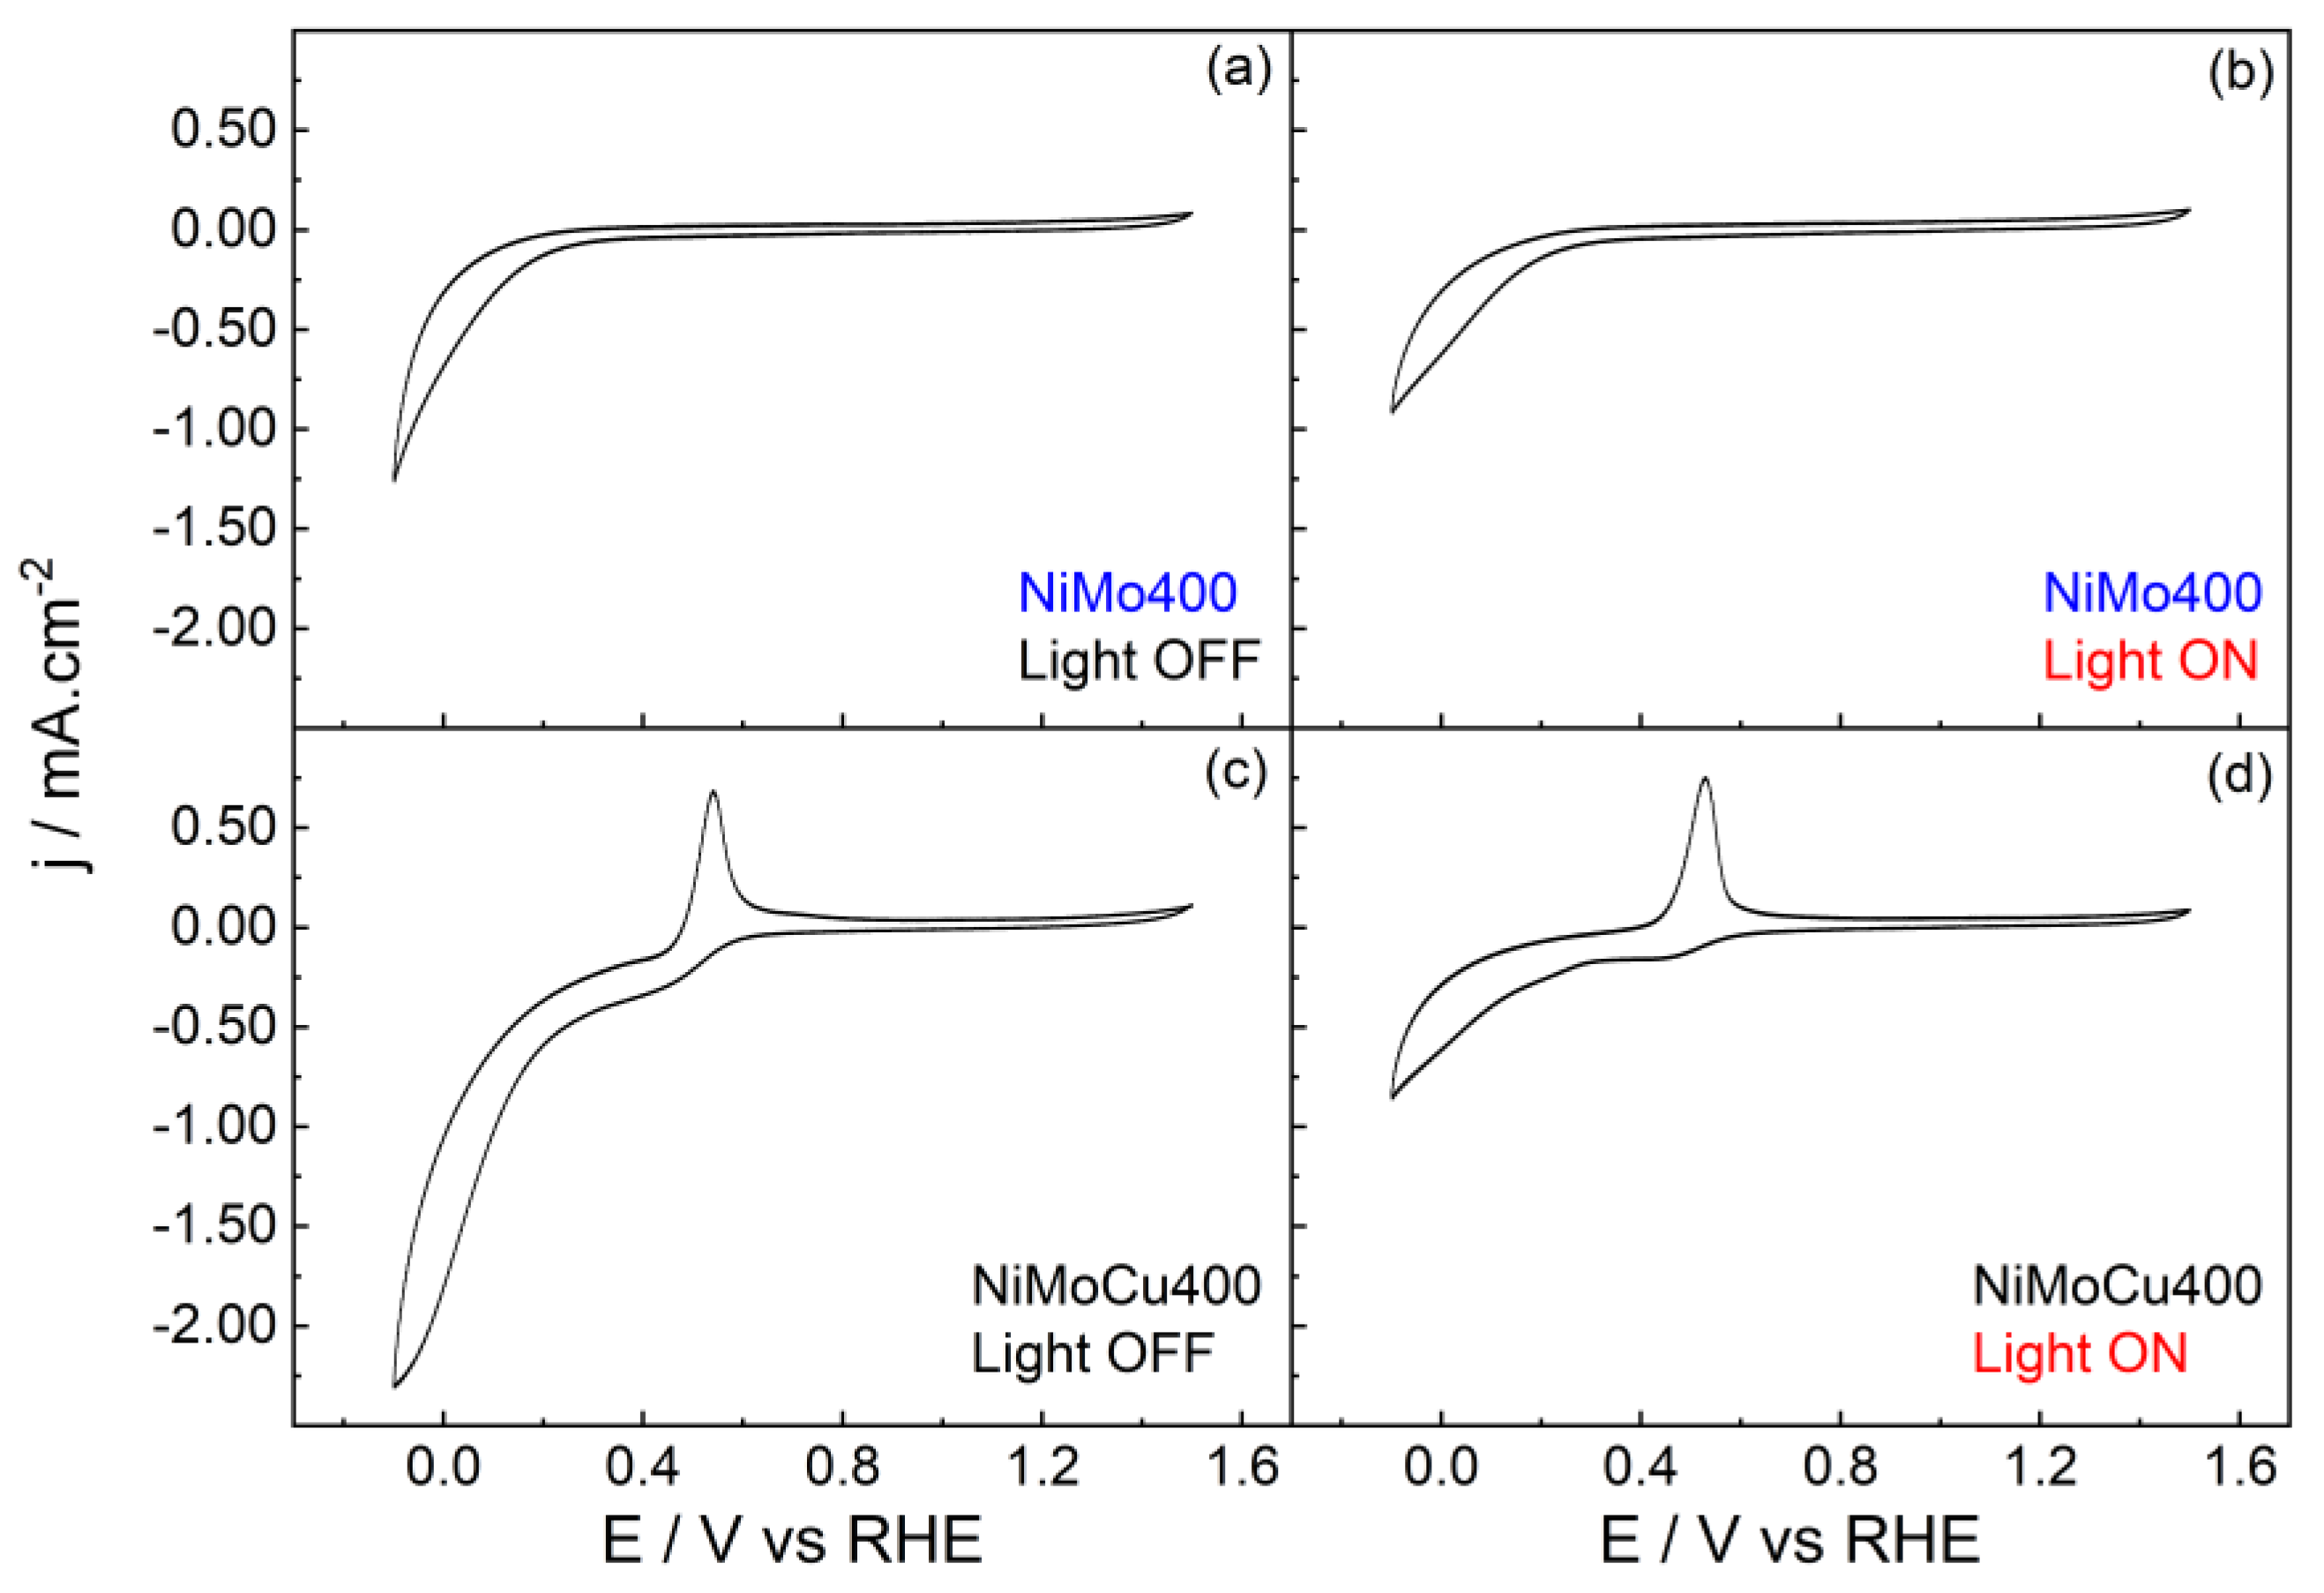
To evaluate the influence of copper incorporation on the electrochemical and photoelectrochemical behavior of the catalysts, cyclic voltammetry was performed in phosphate buffer under dark and illuminated conditions (
Figure 9). Given that the NiMo400 sample previously demonstrated superior HER performance over its high-temperature counterpart [
17], the comparative analysis was restricted to the NiMo400 and NiMoCu400 systems. This selection isolates the specific impact of Cu doping, avoiding the confounding effects of sintering associated with calcination at 900 °C. Nevertheless, similar results were achieved at NiMoCu900.
Figure 10 shows the cyclic voltammetry profiles of NiMo400 and NiMoCu400 under dark and illuminated conditions. In the dark, both catalysts exhibit an increase in cathodic current at potentials below 0.4 V vs. RHE, attributed to the reduction of surface oxides of Ni and Mo, and, in the case of NiMoCu400, also copper species. The presence of Cu enhances the cathodic response, suggesting higher reducibility or better accessibility of active sites compared to the binary system. Then, the hydrogen evolution reaction (HER) and reduction of metal oxides occur at more negative potentials than 0.0 V.
For NiMoCu400, an anodic peak centered around 0.40 V vs. RHE is observed, assigned to the oxidation of Cu+ to Cu2+. Under illumination, the cathodic current associated with the reduction of metal oxide species is significantly suppressed, while the anodic peak persists. This suggests that metal oxide species are reduced under illumination. The latter also applies to NiMo400.
It should also be noted that the TiO
2 support can contribute to the cathodic current through the reduction of surface Ti
3+ species or oxygen vacancies, as previously described for the PdIn/TiO
2 system [
36]. Thus, the overall cathodic response arises from the combined contribution of the metallic oxides and the TiO
2 support.
2.2.3. Hydrogen Evolution and Paracetamol Oxidation Reactions Under Dark Conditions
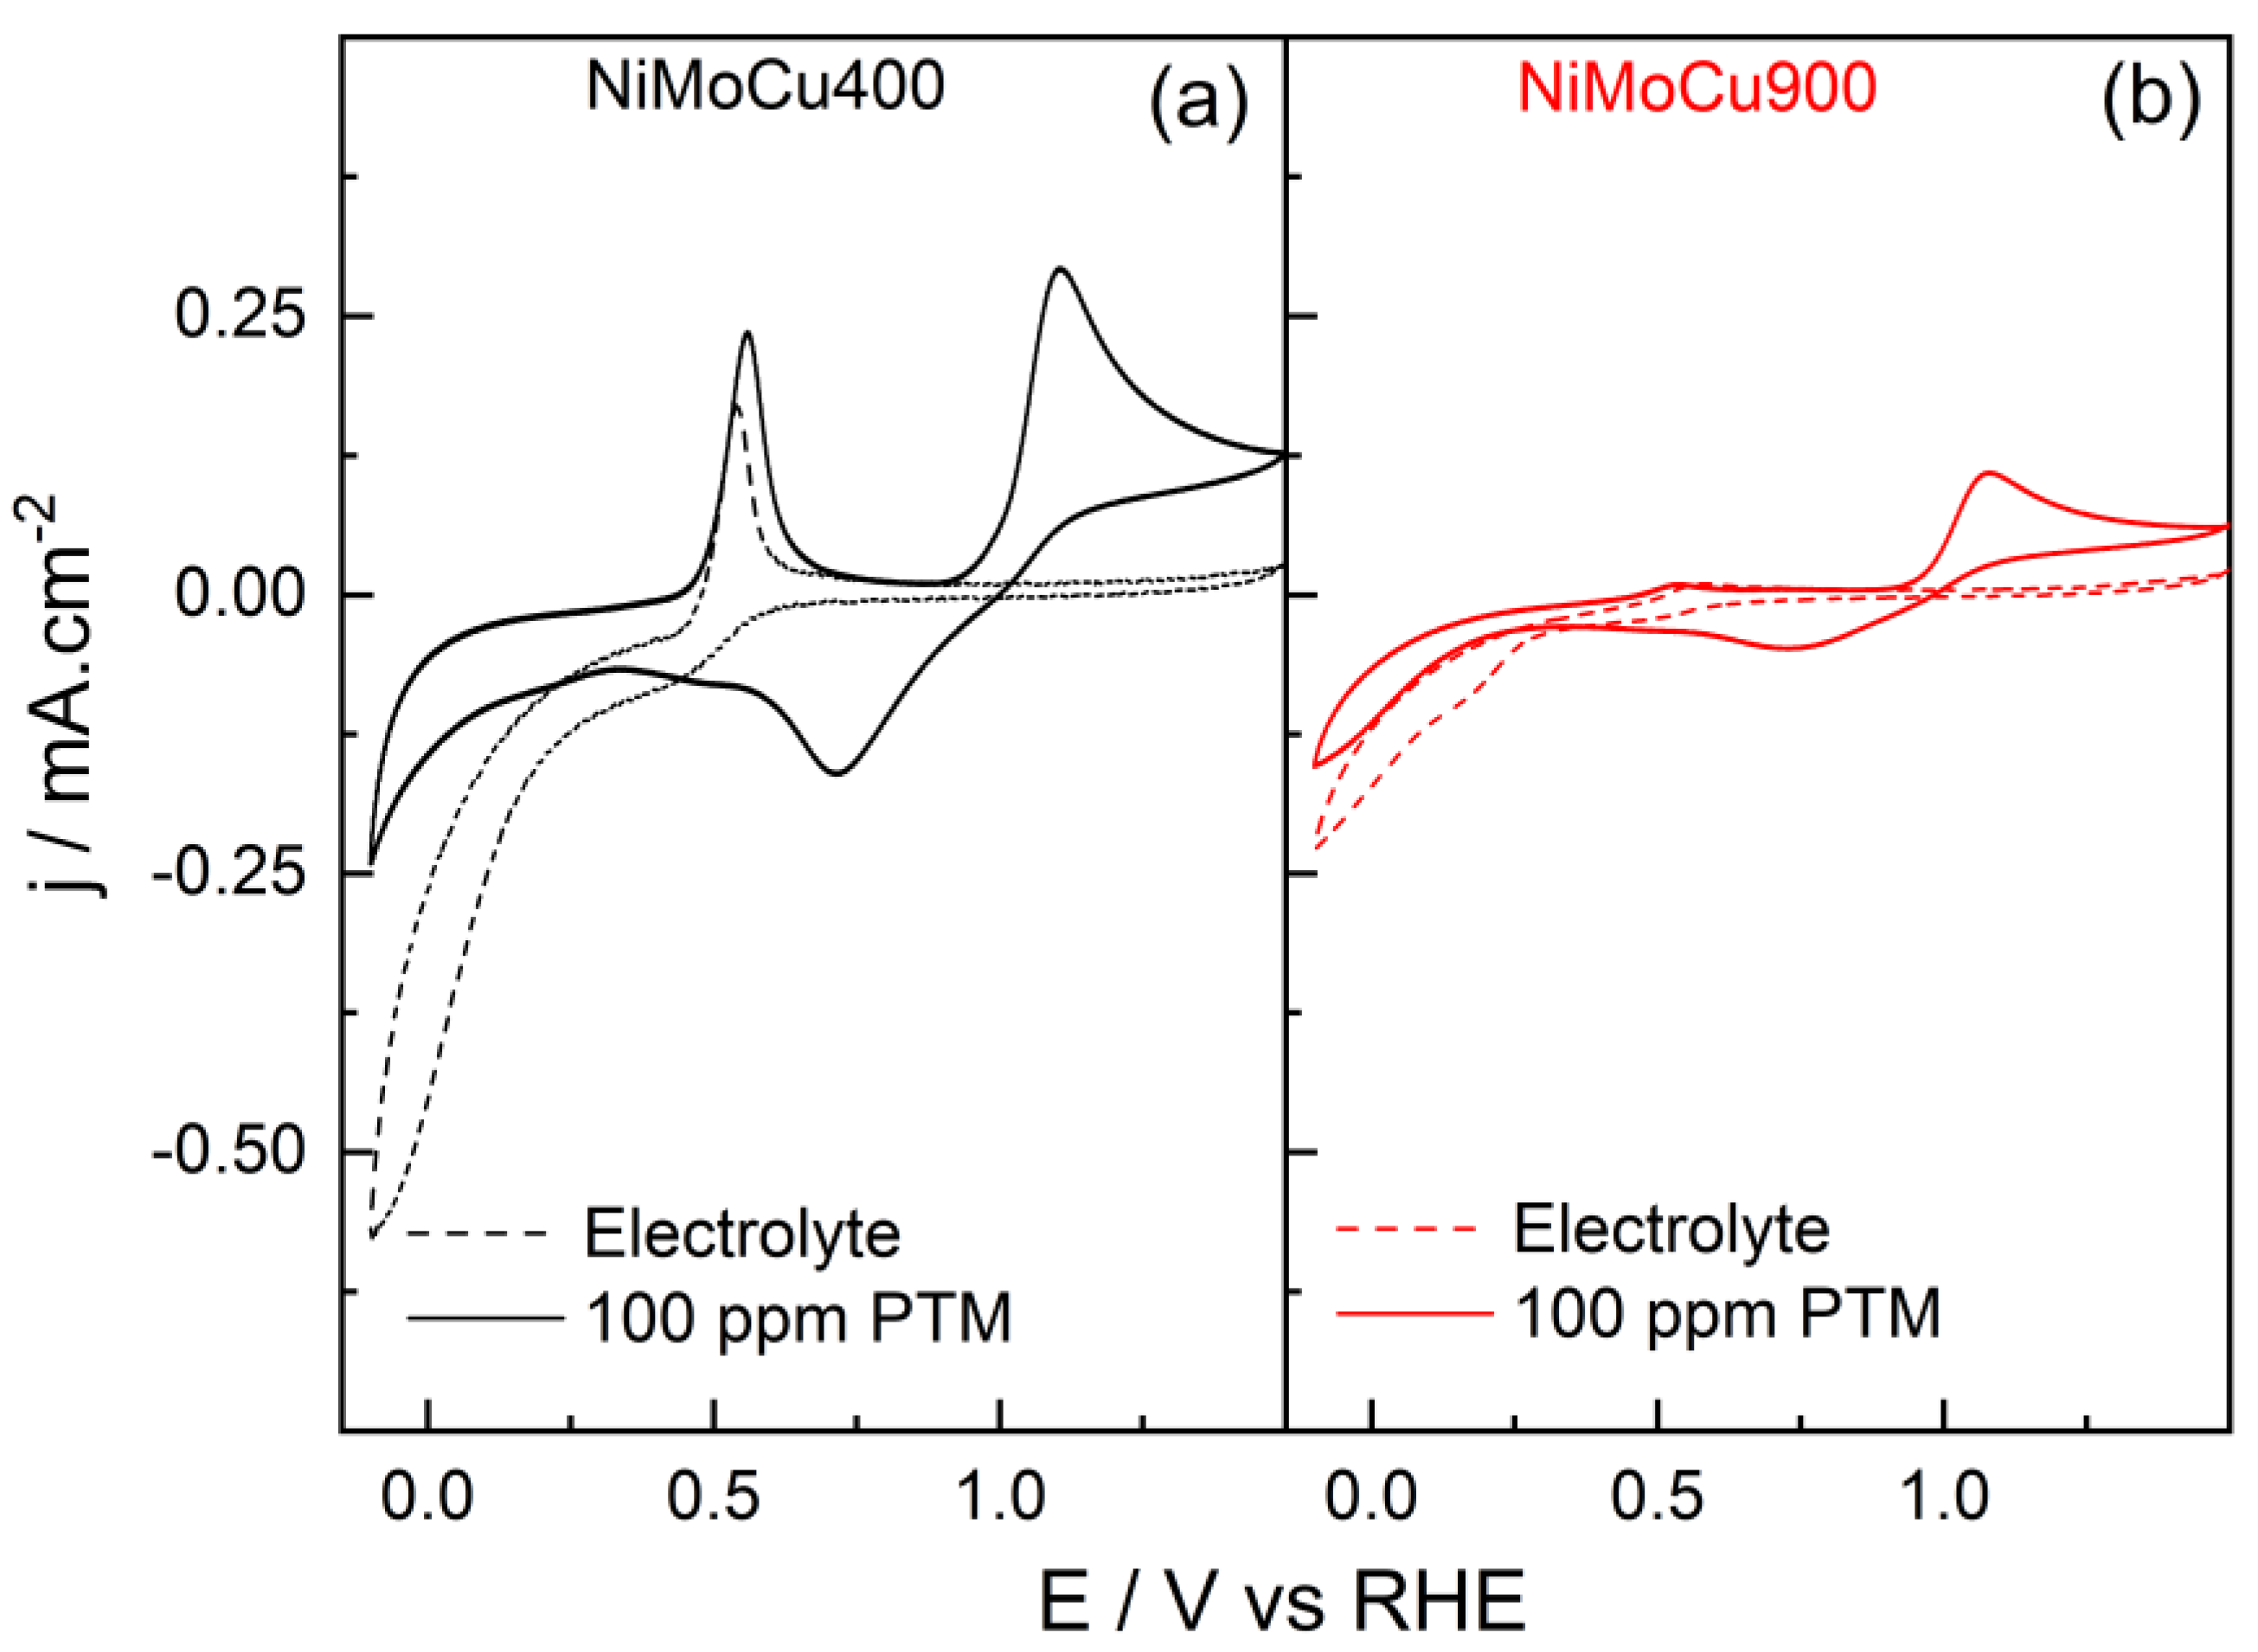
Figure 11 presents the cyclic voltammograms of NiMoCu400 and NiMoCu900 recorded in 0.1 mol·L
−1 phosphate buffer (pH 7) in the absence and presence of 100 ppm paracetamol under dark conditions.
In the absence of paracetamol (blank electrolyte), the onset of the cathodic current is observed at 0.6 V vs. RHE for both catalysts, associated with the electrochemical reduction of surface metal oxides (Ni, Mo, Cu species). The cathodic current density progressively increases as the potential is swept toward more negative values, reaching −0.6 mA·cm−2 for NiMoCu400 and −0.2 mA·cm−2 for NiMoCu900 at the final potential of −0.1 V vs. RHE. Below 0.0 V, the onset of the hydrogen evolution reaction (HER) is expected to contribute to the cathodic process. Notably, NiMoCu400 exhibits higher cathodic current densities across the potential window, indicative of enhanced electroactive surface area and superior redox accessibility compared to NiMoCu900. In the anodic scan, NiMoCu400 exhibits a well-defined peak centered at 0.54 V vs. RHE, attributed to the electrochemical oxidation of surface Cu+ species to Cu2+. This feature is markedly less intense or absent in NiMoCu900, likely due to the lower copper surface concentration and increased surface oxidation, as confirmed by XPS analysis.
Upon addition of paracetamol, both catalysts display an additional redox process associated with the electrochemical oxidation and reduction of paracetamol. For NiMoCu400, the oxidation onset potential is observed at 0.99 V vs. RHE, with a peak current density of 0.28 mA·cm−2. The corresponding cathodic peak appears at ca. 0.75 V with a current density of −0.16 mA·cm−2. For NiMoCu900, the oxidation onset potential is slightly shifted to 0.97 V vs. RHE, with a lower anodic peak current density of 0.10 mA·cm−2, and a cathodic peak current density of −0.05 mA·cm−2 at ca. 0.75 V. These results highlight the superior electrochemical activity of NiMoCu400 towards paracetamol oxidation and reduction reactions.
In the cathodic sweep, at potentials below 0.5 V vs. RHE, a decrease in current density is observed for both catalysts in the presence of paracetamol. This effect is attributed to the adsorption of paracetamol and its intermediates, which inhibit the oxidation of the material. At −0.1 V vs. RHE, the cathodic current density for NiMoCu400 decreases from −0.60 mA·cm−2 (blank) to −0.25 mA·cm−2, and for NiMoCu900 from −0.20 mA·cm−2 to −0.15 mA·cm−2.
2.2.4. Hydrogen Evolution and Paracetamol Oxidation Reactions Under Illumination
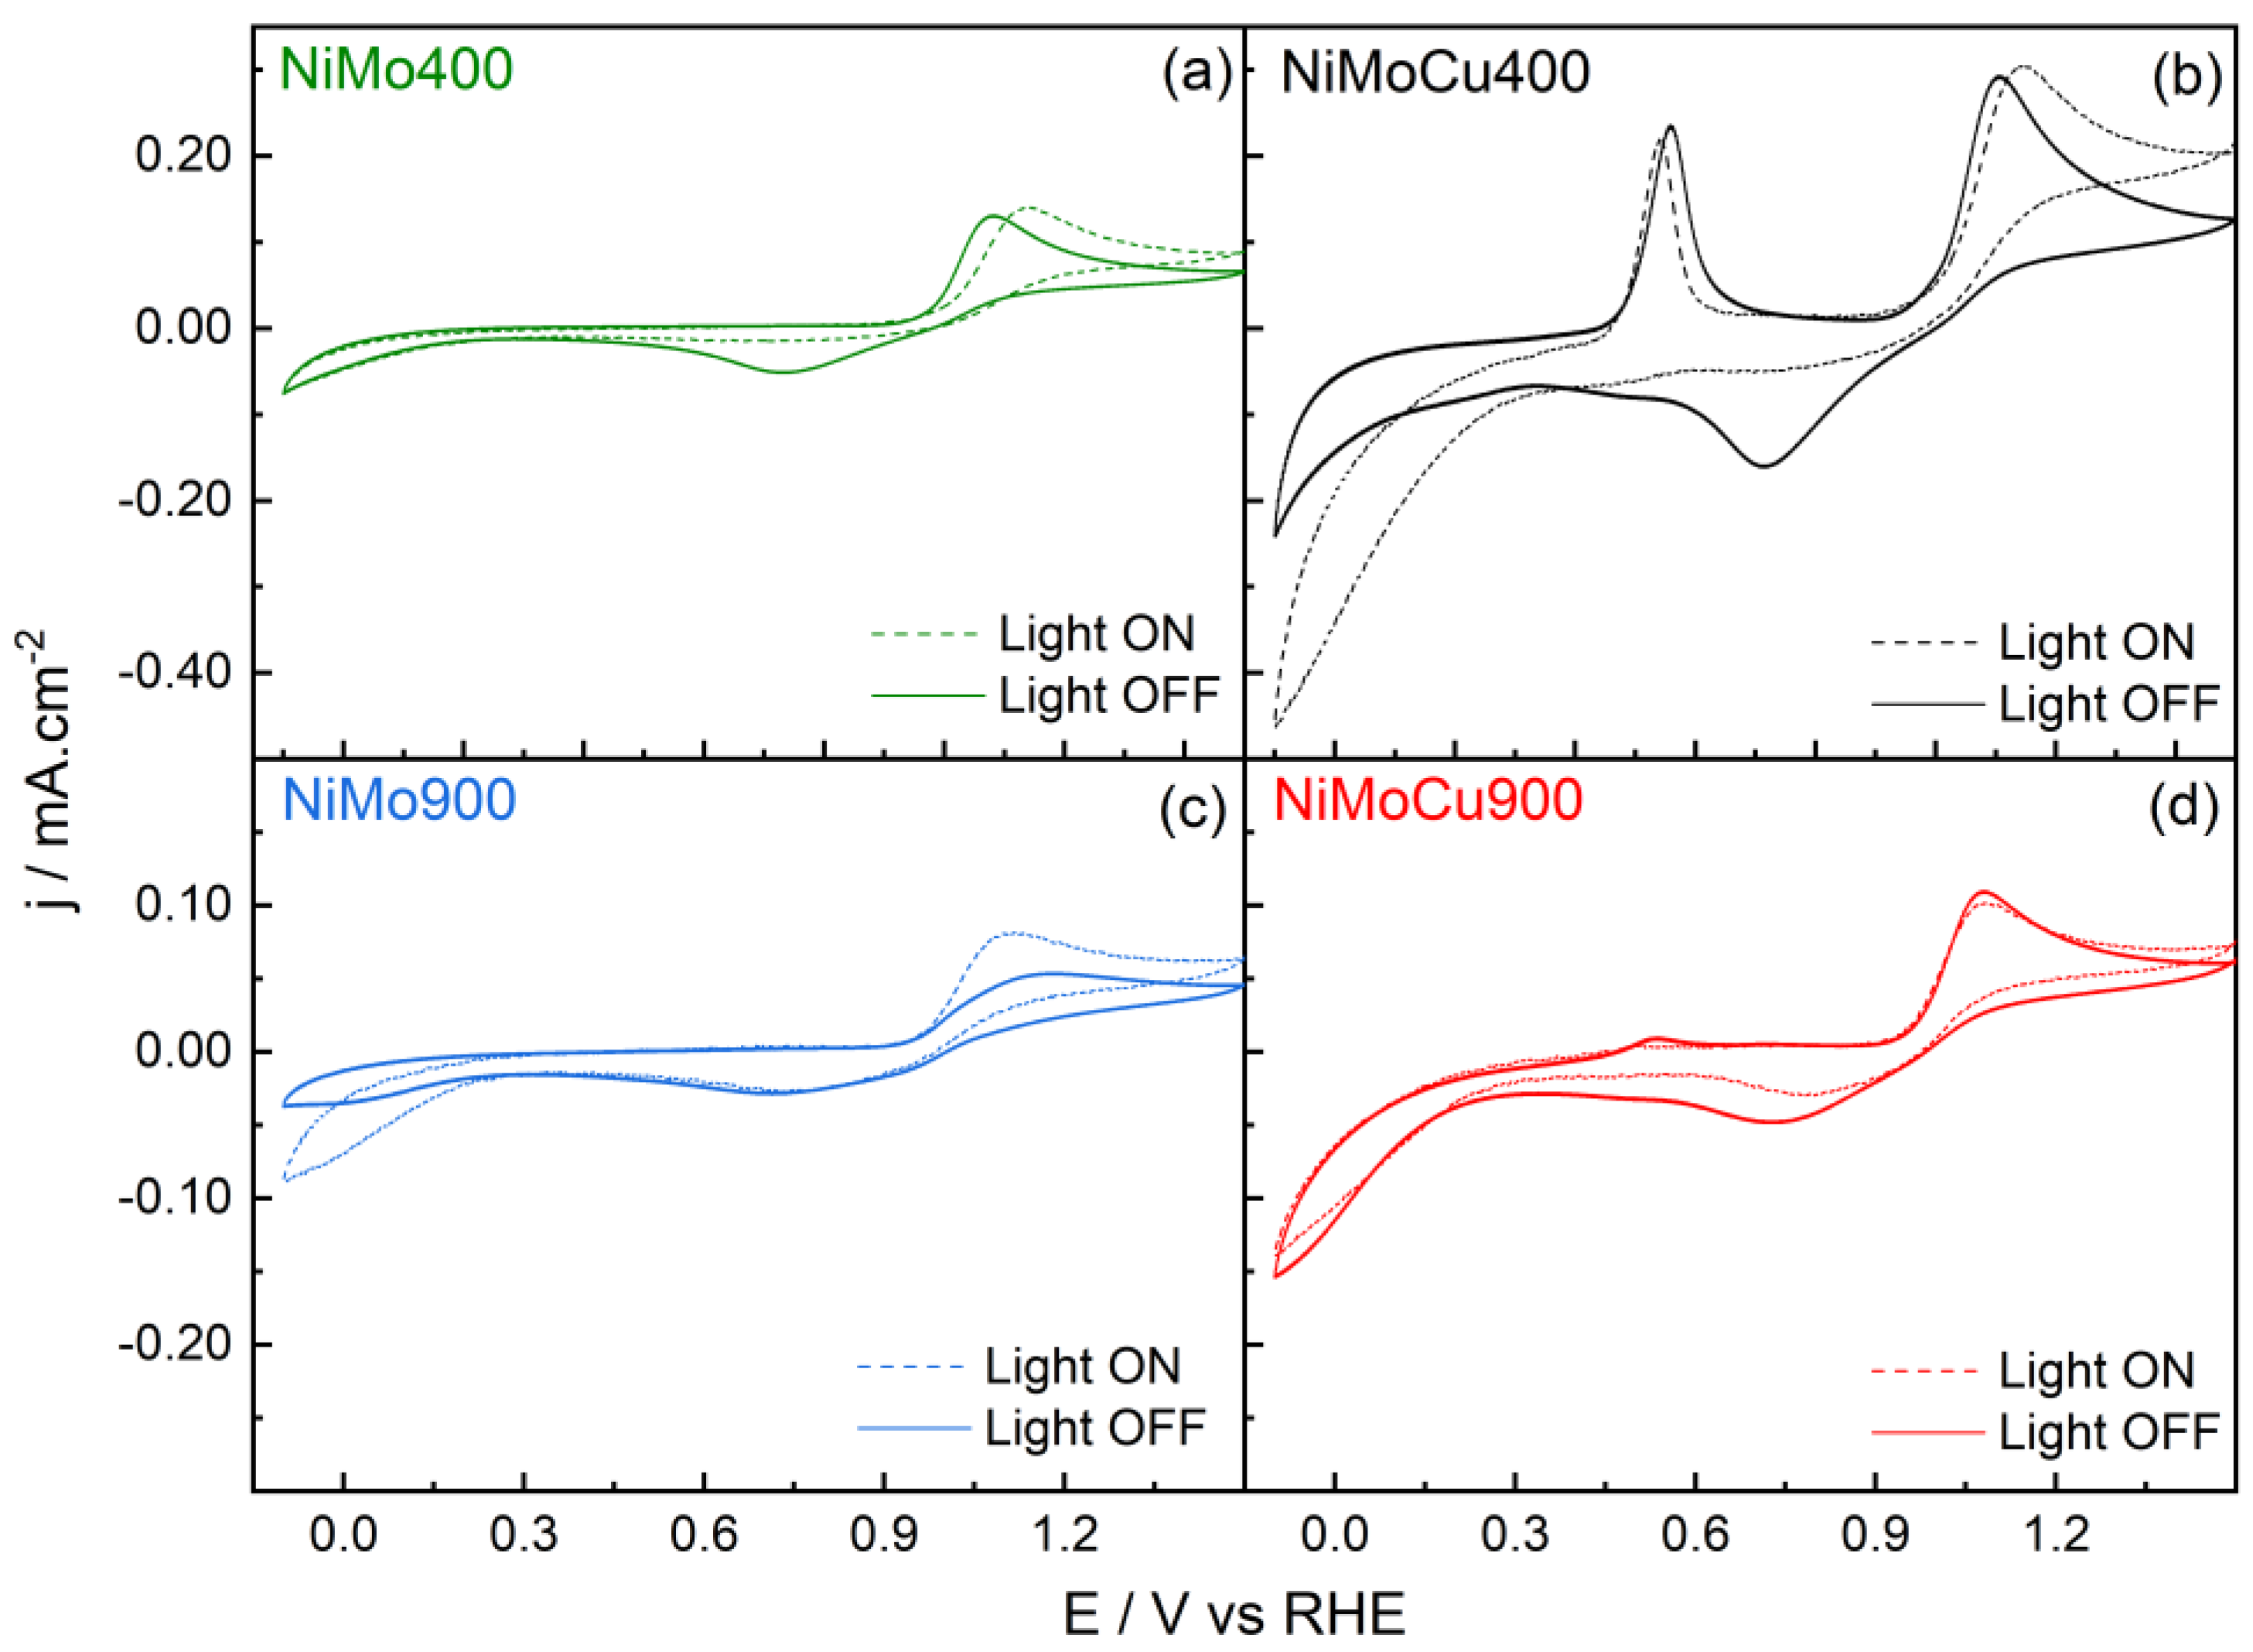
Figure 12 shows the cyclic voltammograms of NiMo400, NiMoCu400, NiMo900, and NiMoCu900 recorded in phosphate buffer with 100 ppm paracetamol under dark and illuminated conditions.
Table 3 summarizes the electrochemical parameters extracted from these profiles.
Under dark conditions, all catalysts exhibit an anodic onset potential near 1.0 V vs. RHE, attributed to the oxidation of paracetamol. Cathodic peaks associated with the reduction of intermediate species are observed for all samples at ca. 0.75 V.
Upon illumination, the anodic current increases notably for NiMoCu400 and NiMo400, while minor changes are observed for NiMo900 and NiMoCu900. For NiMo400 and NiMoCu400, the cathodic peak at 0.75 V disappears, indicating a transition to irreversible oxidation. This behavior is attributed to the formation of non-adsorbed or volatile products, such as CO2, or accelerated oxidation kinetics under illumination, preventing the accumulation of reducible intermediates.
2.2.5. Kinetic Analysis
Cyclic voltammetry (CV) was performed in 0.1 mol·L
−1 phosphate buffer solution (pH 7) containing 100 mg·L
−1 of paracetamol to evaluate the electrocatalytic behavior of NiMo and NiMoCu catalysts thermally treated at 400 and 900 °C. Voltammograms were recorded at scan rates ranging from 10 to 150 mV·s
−1 to investigate charge transfer kinetics, redox accessibility, and the extent of diffusion or kinetic limitations [
37]. Unlike
Figure 11 and
Figure 12, the potential window was restricted to 0.05–1.4 V vs. RHE to focus exclusively on the anodic region, preventing the development of surface oxide reduction and hydrogen evolution reactions.
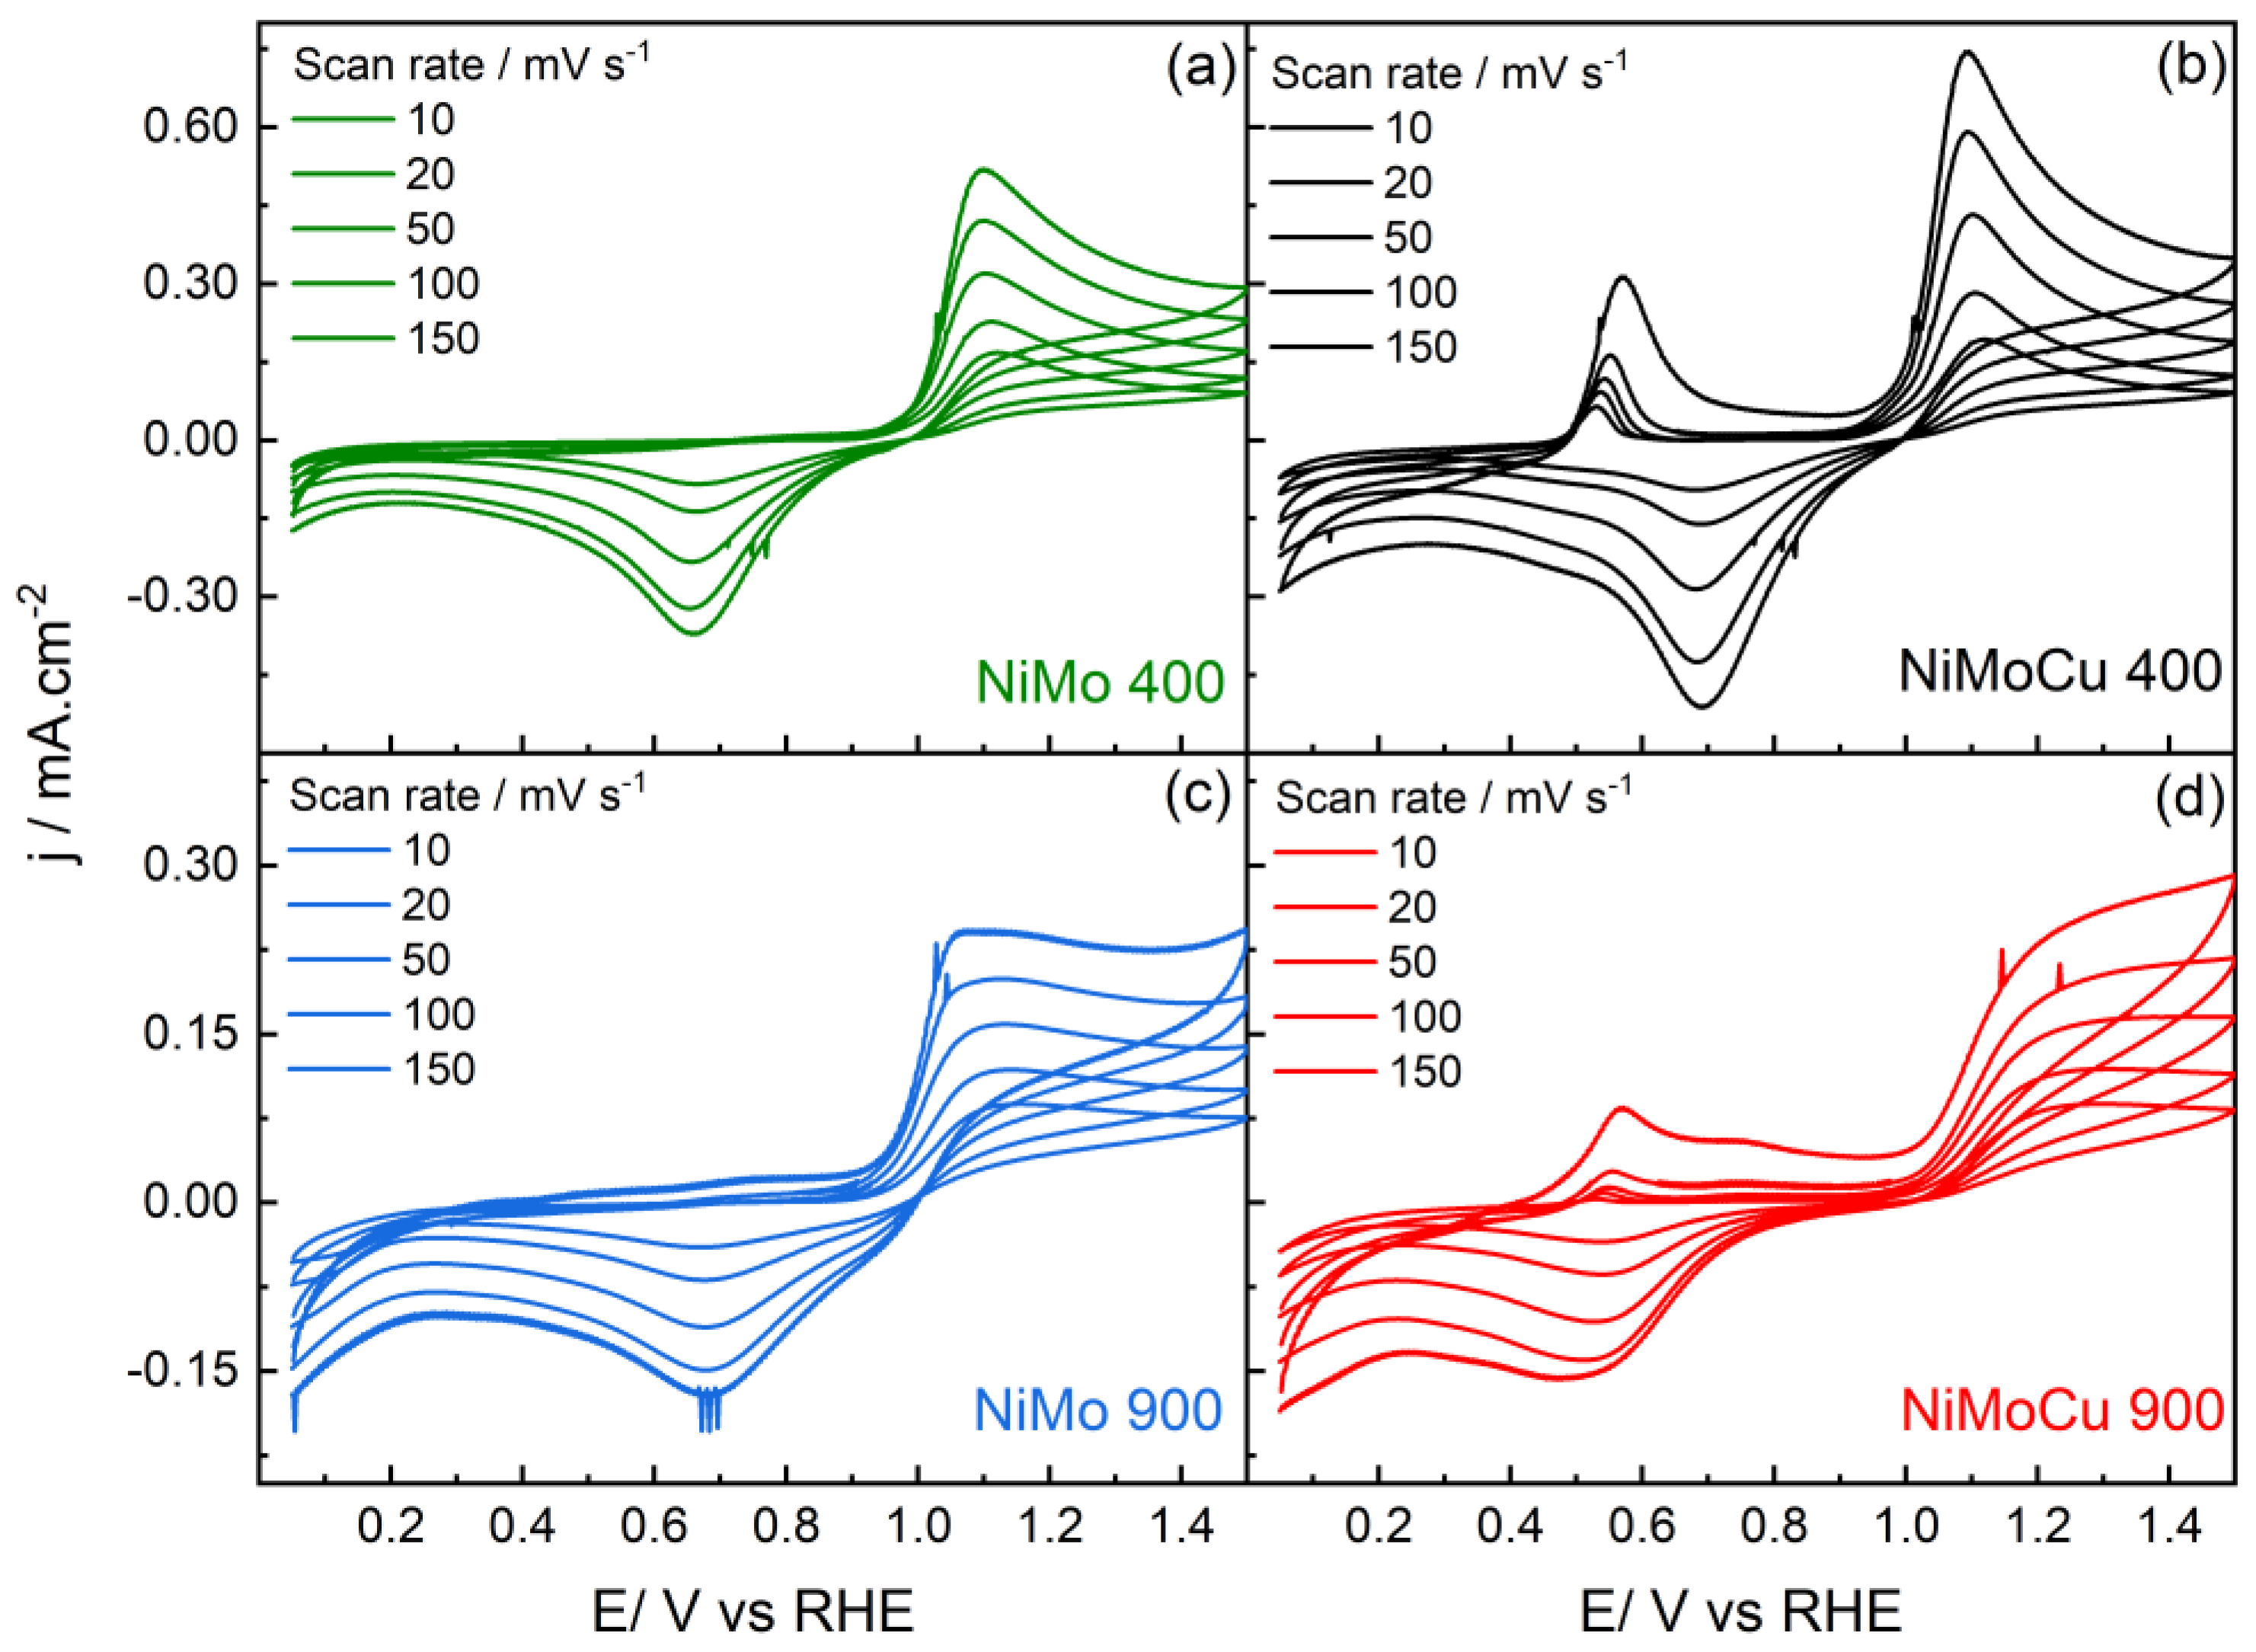
Figure 13 shows the cyclic voltammograms of the catalysts recorded at different scan rates. NiMo400 and NiMoCu400 exhibit defined anodic and cathodic peaks. For both catalysts, the peak current density increases linearly with scan rate, and the voltametric profiles remain similar across all scan rates. NiMoCu400 displays higher peak currents compared to NiMo400.
Additionally, all samples display quasi-irreversible behavior, with anodic and cathodic peaks separated by variable ΔEp values. While NiMo400 and NiMoCu400 exhibit sharper redox features and higher cathodic currents, ΔEp increases significantly in the high-temperature materials, from 310 mV in NiMo900 to 510 mV in NiMoCu900. This reflects enhanced thermodynamic irreversibility upon Cu doping, possibly due to stabilization of oxidized intermediates or deeper oxidative transformations [
38,
39].
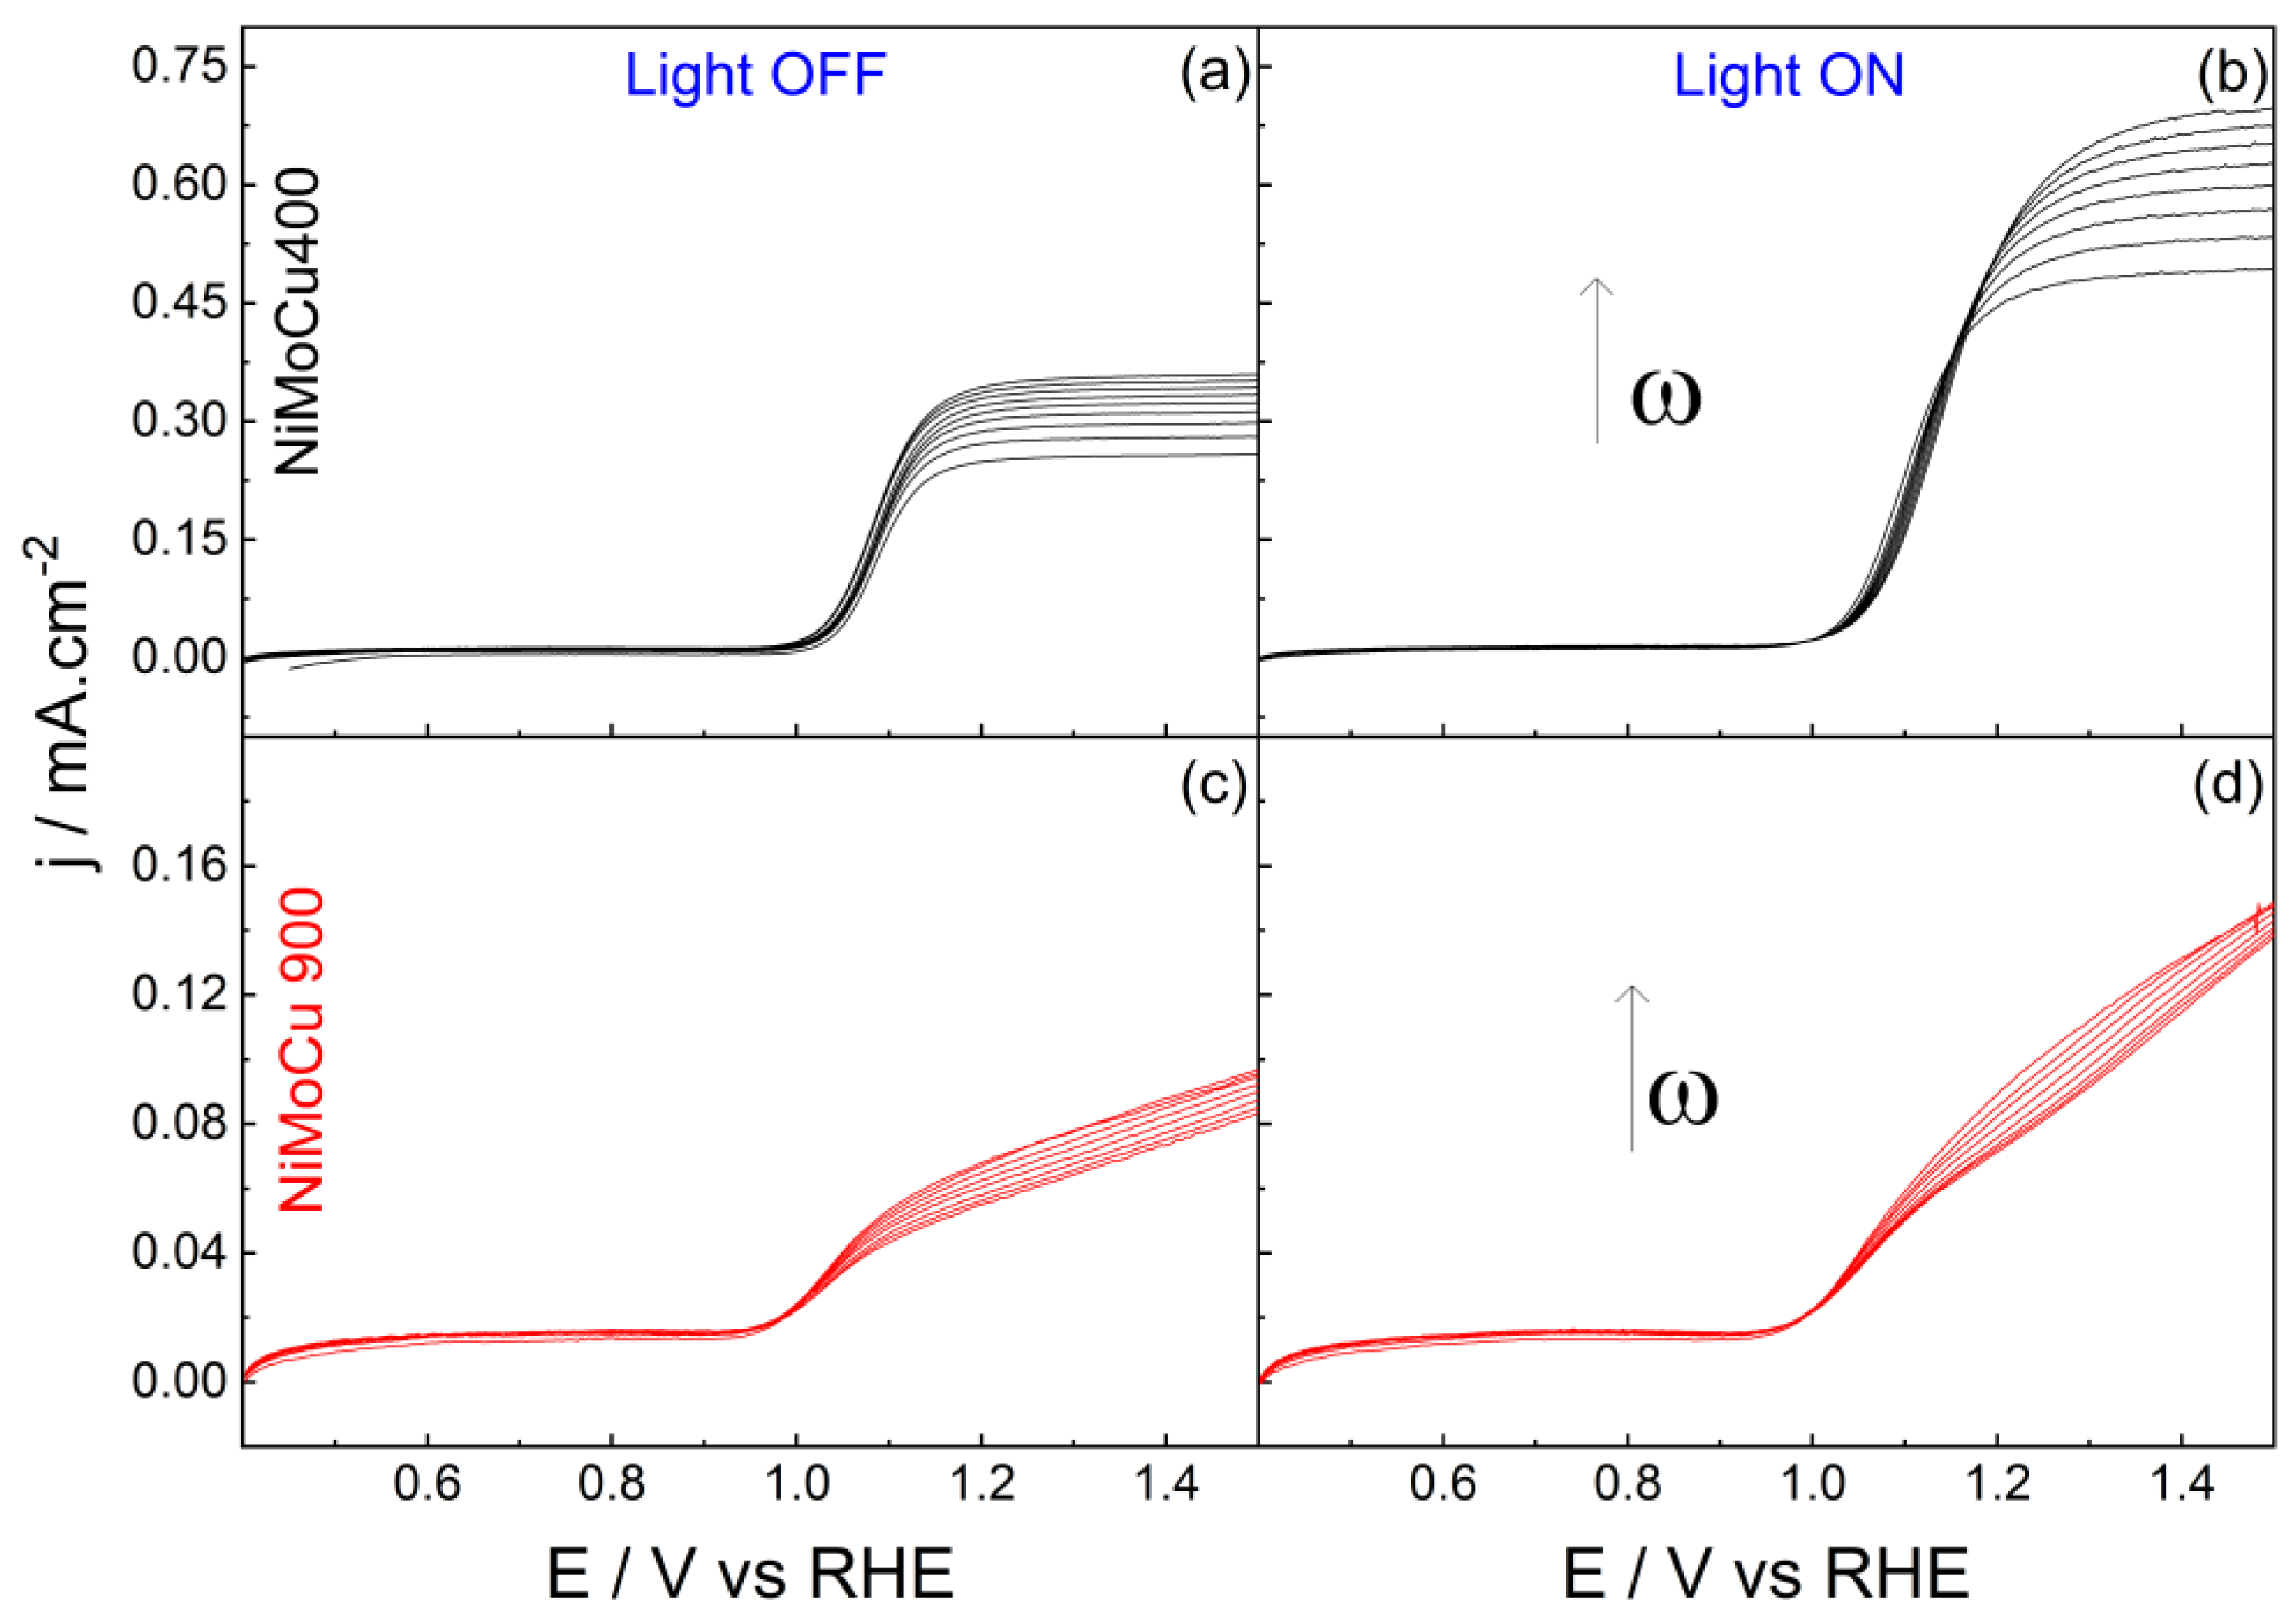
Thus, Cu incorporation not only enhances charge transfer but also stabilizes the catalyst surface under operating conditions, confirming its dual role in improving performance. To further confirm the electron transfer characteristics under diffusion-controlled conditions, hydrodynamic voltammetry experiments were performed using a rotating disk electrode (RDE) under both dark and illuminated conditions, and the results were analyzed via the Koutecký–Levich (KL) approach. The steady-state polarization curves obtained at different rotation speeds under dark and illuminated conditions are shown in
Figure 14. When the rotation rate was varied, the anodic current associated with paracetamol oxidation increased with rotation speed for the catalyst calcined at 400 °C, whereas a weaker dependence was observed on the material prepared at 900 °C (
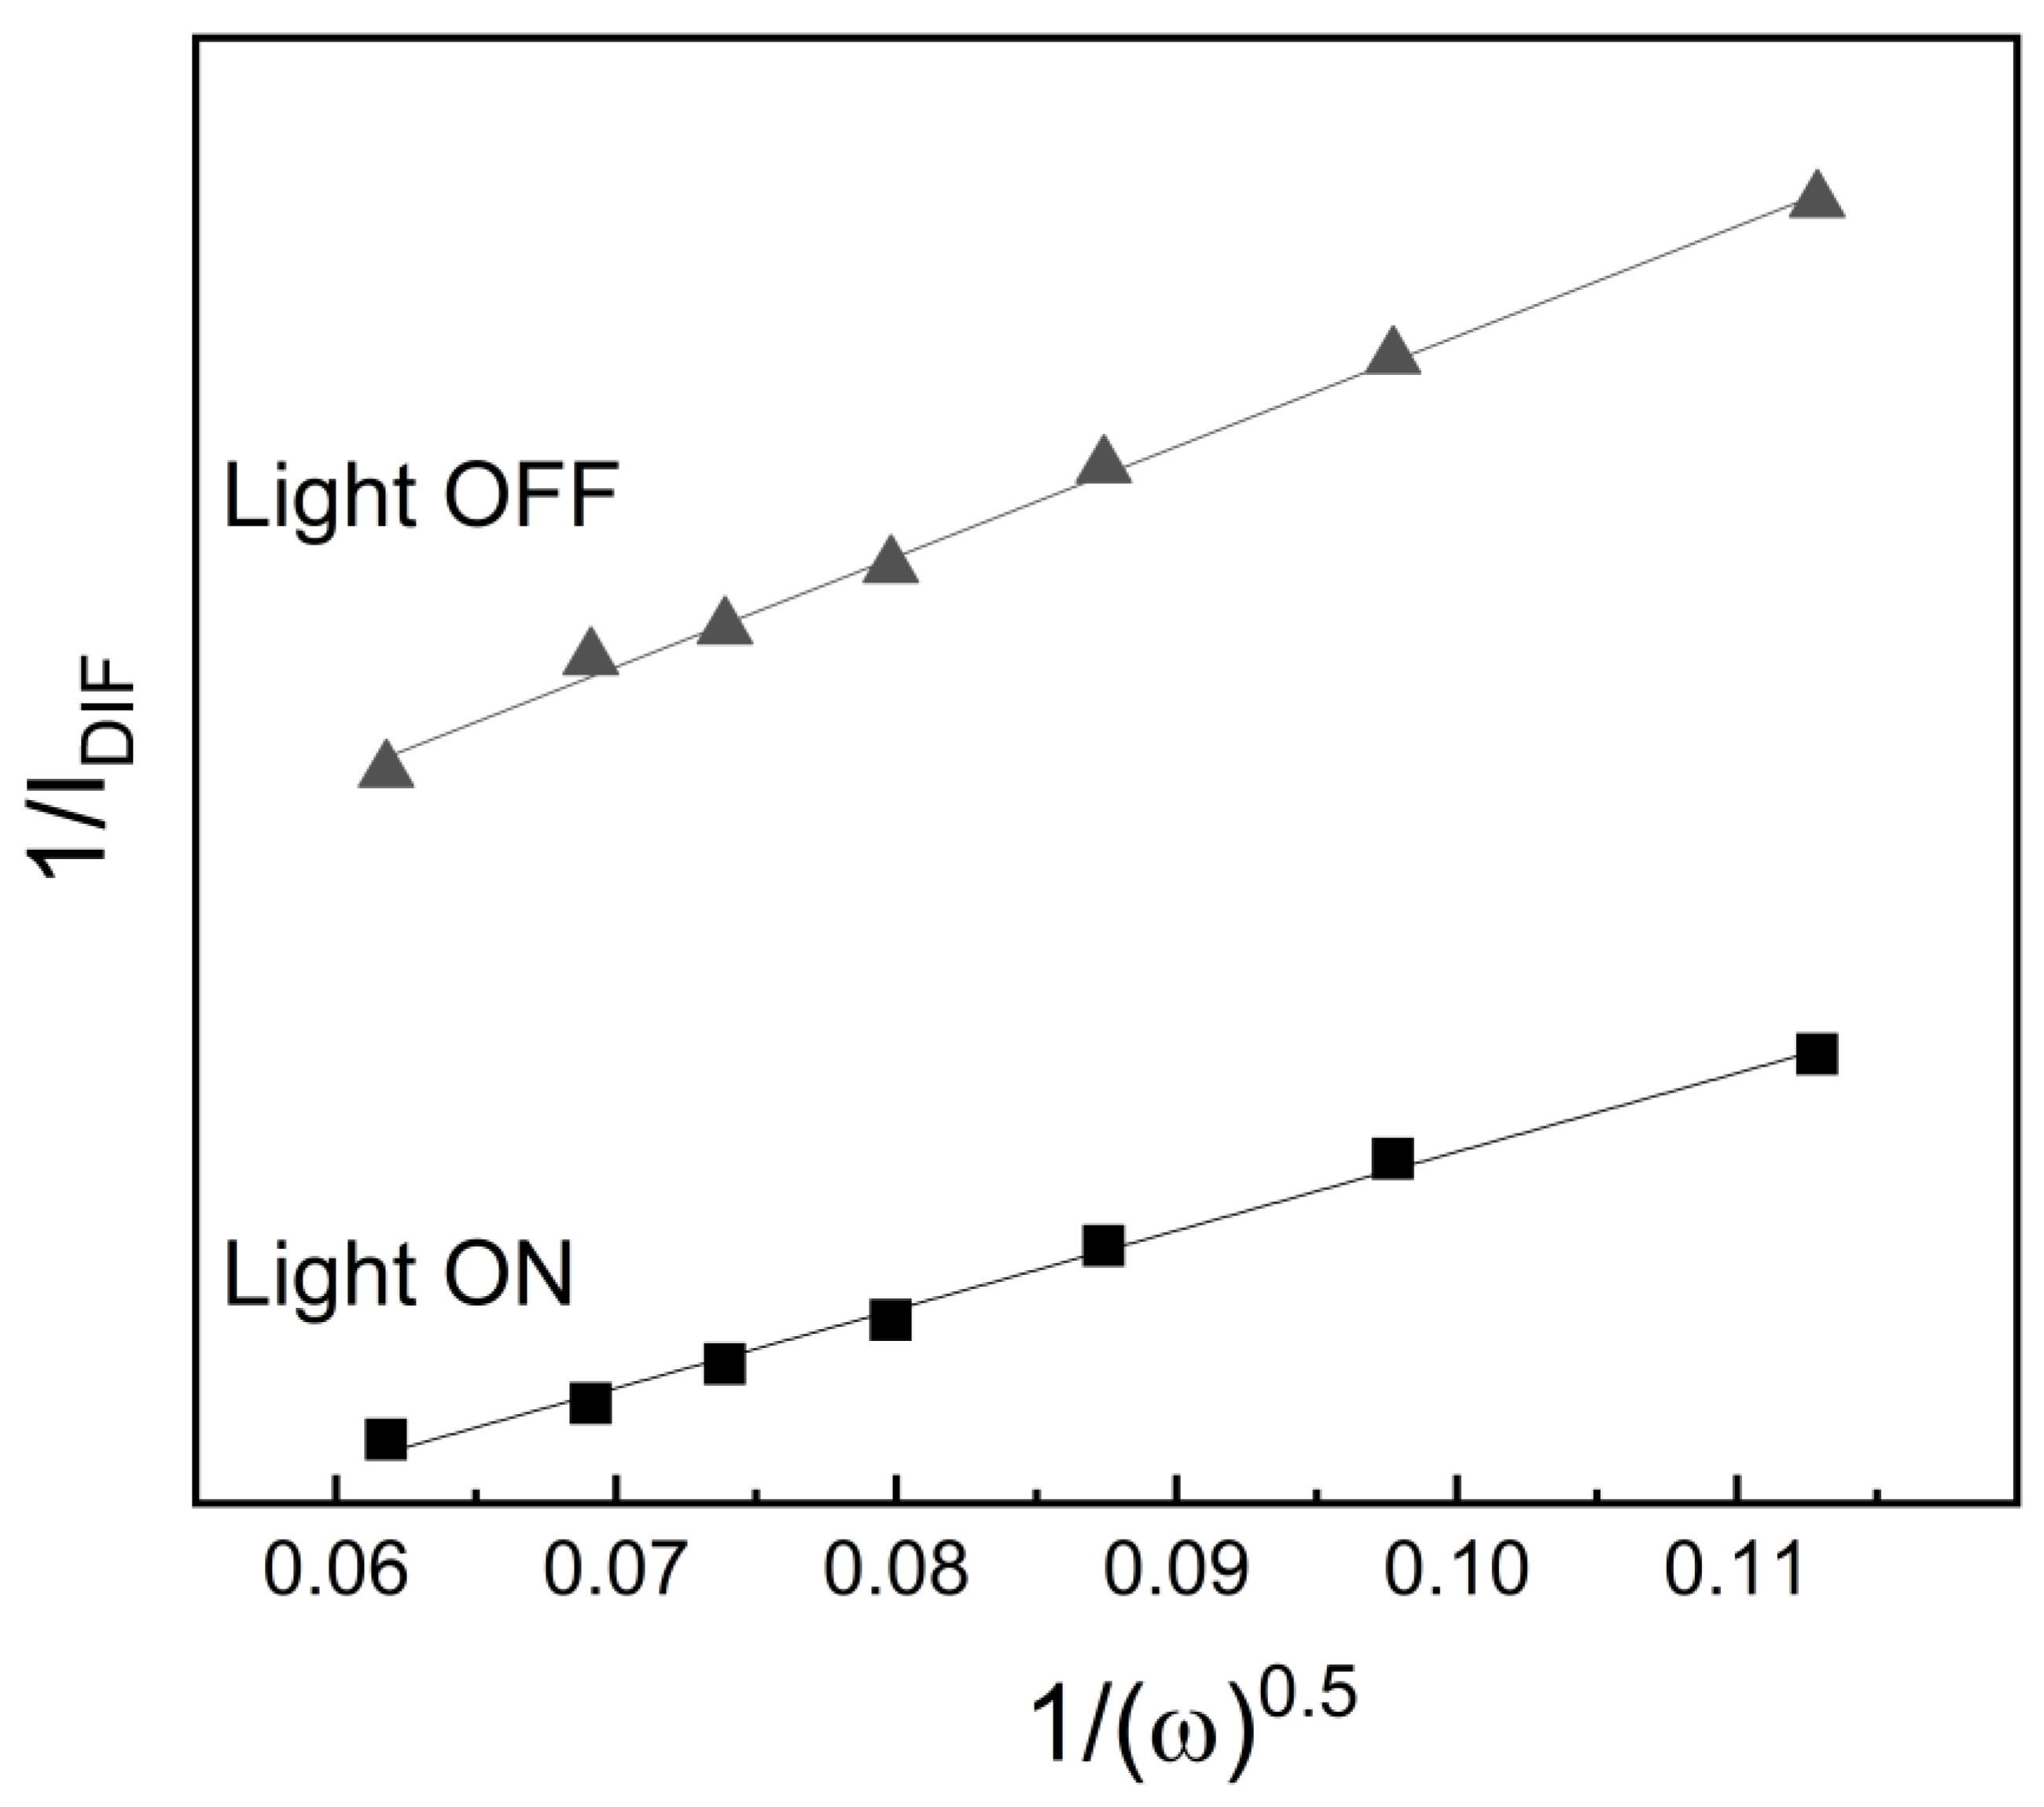
Figure 14). A diffusion-controlled reaction was identified for NiMoCu400, as confirmed by the good linearity of the corresponding Koutecký–Levich plots (
Figure 14). Under illumination, both catalysts calcinated at 400 °C exhibited an increase in anodic current, revealing their photosensitive behavior. However, the photoelectrochemical response strongly depends on the calcination temperature. The catalyst prepared at 400 °C shows a noticeable increase in current under light, while a greater enhancement in paracetamol oxidation is observed for the catalyst calcined at 900 °C under illumination, which may be attributed to the electrooxidation of adsorbed poisoning species.
2.2.6. Analysis of the Number of Electrons Transferred
To obtain quantitative insight into the oxidation mechanism of paracetamol, the number of electrons transferred (n) was estimated using two complementary approaches: the Koutecký–Levich (KL) method derived from hydrodynamic voltammetry using a rotating disk electrode (RDE) and the Randles–Ševčík equation based on scan-rate-dependent cyclic voltammetry (
Figure 13).
By plotting 1/I vs. ω
−1ᐟ
2, the number of electrons transferred during the electrochemical oxidation of paracetamol was determined. For both NiMo400 and NiMoCu400 electrodes, n ≈ 1 was obtained in the absence of light, and n ≈ 2 under illumination. Therefore, Reactions (1) and (2) are the most plausible to occur in the dark, while Reactions (1)–(4) are expected to predominate under irradiation.
Due to the absence of well-defined limiting currents, the high-temperature samples were excluded from Koutecký–Levich analysis. Consequently, the number of electrons transferred during the electrochemical oxidation of paracetamol was estimated for NiMoCu900 using the Randles–Ševčík equation for irreversible systems, based on the anodic peak currents extracted from the voltametric profiles shown in
Figure 14. The calculated n value was approximately 2, consistent with previously reported values for NiMo/TiO
2 catalysts under similar conditions [
17]. Therefore, Reactions (1)–(4) are the most plausible to occur, with adsorbed C
8H
7NO
2 species acting as poisoning intermediates. The presence of light enhances the kinetics of Reaction (2), leading to an increase in anodic current under illumination.
Additionally, to evaluate the short-term operational stability of the materials, additional electrochemical measurements were performed and are presented in the
Supplementary Information (
Figures S9–S11). These included five consecutive cyclic voltammetry (CV) scans in the presence of paracetamol (100 mg·L
−1) under both light and dark conditions, a 1-h chronoamperometric test at −0.1 V vs. RHE, and a subsequent linear sweep voltammetry (LSV) for Tafel slope analysis.
In the CVs, NiMoCu400 exhibited stable voltametric profiles under illumination, with minimal current loss over the cycles, suggesting that light exposure helps preserve surface activity and prevents fouling. In contrast, NiMoCu900 showed a gradual decrease in current, particularly in the dark, likely due to intermediate adsorption and limited surface accessibility.
The chronoamperometric response of NiMoCu400 remained steady after an initial decay, indicating sustained catalytic behavior under HER-relevant conditions. The LSV recorded immediately after the test confirmed a consistent cathodic response, and the corresponding Tafel slope was approximately 900 mV·dec−1, in line with values reported for similar systems exposed to pharmaceutical pollutants. As noted in our previous work on Cu-free NiMo/TiO2 catalysts, such high Tafel slopes are typically associated with surface poisoning or competition for active sites under contaminant-rich conditions.
These electrochemical measurements demonstrate that NiMoCu400 maintains stable performance under repeated operation and light exposure. Its consistent voltametric response, steady cathodic current during chronoamperometry, and reproducible HER behavior highlight its robustness for integrated applications in hydrogen production and pharmaceutical pollutant removal.
In addition to the HER region, catalyst behavior was also evaluated under PEC oxidation conditions relevant to paracetamol degradation. As shown in the
Supplementary Material (
Figures S12 and S13), chronoamperometric measurements under illumination and stirring revealed a stable photocurrent followed by gradual decay, consistent with surface blockage by reaction intermediates. Simultaneously, TOC and UV–Vis measurements at 243 nm indicated the accumulation of oxidized species in solution. This complementary set of data reinforces the bifunctional nature of NiMoCu400, demonstrating not only robust reductive behavior but also sustained oxidative activity under simulated solar conditions. Nonetheless, we acknowledge that structural reconstruction phenomena, particularly for Cu-based electrocatalysts, have been reported under extended photo(electro)catalytic operation, often driven by redox transformations or dissolution redeposition mechanisms [
40,
41]. While such changes could not be evaluated here due to the ink-based preparation and limited catalyst loading, future studies involving recoverable and scalable configurations are warranted to investigate potential morphological or chemical evolution.
3. Discussion
The dual functionality of the NiMoCu/TiO2 catalysts in paracetamol oxidation and hydrogen evolution was evaluated under dark and illuminated conditions. The electrochemical and photoelectrochemical results were correlated with the structural, electronic, and optical properties of the materials to analyze the influence of copper incorporation and calcination temperature on their performance.
The catalyst calcined at 400 °C (NiMoCu400) exhibited higher current densities for both paracetamol oxidation and hydrogen evolution reactions compared to the catalyst treated at 900 °C (NiMoCu900). Under illumination, NiMoCu400 also showed a more significant enhancement in photocurrent, indicating a better PEC response.
These differences are associated with the physicochemical characteristics of the catalysts. NiMoCu400 maintained a mesoporous structure with a specific surface area of 44 m2·g−1, favoring higher electroactive site density, supported by its larger double-layer capacitance (Cdl). XPS analysis indicated the coexistence of Cu+/Cu2+, Ni2+/Ni3+, and Mo4+/Mo6+ species in NiMoCu400, facilitating multielectron transfer processes. In contrast, NiMoCu900 exhibited a surface predominantly composed of Cu2+, Ni3+, and Mo6+ species, correlating with a lower density of redox-active sites and decreased catalytic activity.
Optical characterization by UV–Vis diffuse reflectance spectroscopy confirmed that both catalysts exhibit absorption in the visible range, with NiMoCu900 presenting a slightly lower bandgap. However, the superior photoelectrochemical performance of NiMoCu400 suggests that factors beyond bandgap narrowing, such as higher surface area, better preservation of redox-active species, and reduced charge recombination, play a more significant role.
Electrochemical analysis showed that the number of electrons transferred during paracetamol oxidation was approximately two under illumination for both NiMo400 and NiMoCu400. The incorporation of copper did not modify the electron transfer pathway but improved the reaction kinetics under light. For NiMoCu900, Randles–Ševčík analysis also yielded n ≈ 2, in agreement with previous studies [
17].
Based on these results and previous work [
17], the oxidation of paracetamol likely proceeds through sequential electron transfer steps. Under dark conditions, adsorption of the pollutant on the catalyst surface occurs, followed by an initial electron transfer to form an adsorbed oxidation intermediate. Under illumination, further oxidation steps are promoted by photogenerated charge carriers, leading to degradation of the adsorbed species into smaller organic fragments.
These ECSA results provide further insight into the electrochemical performance trends observed in this study. In particular, the higher surface electrochemical accessibility of NiMoCu400 (2.4 cm2), compared to the other samples, aligns with its superior HER and photoelectrochemical oxidation activity. This reinforces the idea that Cu incorporation at moderate calcination temperatures not only modifies the electronic structure and surface redox states but also enhances the availability of active sites under operational conditions.
Therefore, the improved performance of NiMoCu400 can be attributed to its high surface area and ECSA, greater density of redox-active species, and enhanced visible-light absorption, facilitating electrochemical and photoelectrochemical reactions.
Complementary PEC degradation assays revealed a gradual decay in photocurrent and increasing TOC and UV–Vis signals, indicating the accumulation of oxidized intermediates. While NiMoCu400 promotes initial paracetamol oxidation, the limited mineralization suggests partial blocking of active sites. This underscores the need to further optimize catalyst stability under oxidative conditions.
Additionally, the inversion of semiconductor character observed in NiMoCu900, from n-type to p-type, underscores the role of thermal treatment in modifying not only the crystallographic phase but also the surface electronic properties. Despite exhibiting the largest photovoltage shift, NiMoCu900 showed negligible photocurrent, revealing that high-temperature calcination promotes structural densification, rutile formation, and Cu redistribution, which ultimately suppress interfacial charge transfer. This finding reinforces that optimal photoelectrochemical performance arises from a combination of surface composition (geometric and electronic), defect-mediated conductivity, and controlled phase composition, as exemplified by the superior behavior of NiMoCu400.
4. Materials and Methods
4.1. Catalyst Preparation
NiMo and NiMoCu catalysts supported on TiO
2 were synthesized by aqueous wet impregnation. The preparation of the NiMo system followed our previously reported method [
17], in which nickel chloride (NiCl
2, 0.015 mol·L
−1, ≥99% Sigma-Aldrich, Burlington, MA, USA) and sodium molybdate (Na
2MoO
4, 0.01 mol·L
−1, Sigma-Aldrich, ≥99%) were dissolved in deionized water (50 mL) at 80 °C under continuous stirring. Then, 2 g of TiO
2 (P25, >99% purity, Sigma-Aldrich) was added. The total metal loading was fixed at 15 wt.%, with a Ni:Mo molar ratio of 1.5:1.
Copper (Cu(NO
3)
2·3H
2O, ≥99%, Sigma-Aldrich) was incorporated at 4.15 wt.% relative to Ni + Mo, corresponding to 4.0 wt.% within the total metal loading and 0.6 wt.% in the final catalyst. Citric acid (Sigma-Aldrich, ≥99.5%) was added in a 1:1 molar ratio with Cu
2+ to enhance metal–support interactions [
42,
43]. After impregnation and solvent evaporation, the solids were dried and calcined at either 400 °C or 900 °C for 4 h under static air with a heating ramp of 10 °C·min
−1.
4.2. Physicochemical Characterization
X-ray diffraction (XRD) patterns were recorded using a PANalytical X’Pert PRO (Malvern PANalytical, Almelo, The Netherlands) diffractometer equipped with Cu Kα radiation (λ = 1.5406 Å), operating at 40 kV and 30 mA. Patterns were collected over a 2θ range of 20–100° with a step size of 0.02°.
Morphological features and surface composition were analyzed using a ZEISS EVO MA10 (Carl Zeiss AG, Oberkochen, Germany) scanning electron microscope coupled to an Oxford Instruments EDS detector (Oxford Instruments, Abingdon, UK). Transmission electron microscopy (TEM) was performed on a JEOL JEM-2100 microscope (JEOL Ltd., Tokyo, Japan) operating at 200 kV after dispersing the samples in ethanol and depositing them on carbon-coated copper grids.
Nitrogen adsorption–desorption isotherms were measured at −196 °C using a Micromeritics ASAP 2020 system (Micromeritics Instrument Corp., Norcross, GA, USA). Prior to measurement, samples were degassed under vacuum at 120 °C for 6 h. BET surface area was calculated from adsorption data in the 0.05–0.30 P/P0 range. Pore size distribution was obtained from the desorption branch using the BJH method.
X-ray photoelectron spectroscopy (XPS) was conducted using a SPECS PHOIBOS 150 (SPECS Surface Nano Analysis GmbH, Berlin, Germany) analyzer with monochromatic Al Kα radiation (hν = 1486.6 eV). All spectra were calibrated to the C 1s signal at 284.8 eV.
4.3. Optical Characterization
UV–Vis diffuse reflectance spectra were obtained using a Shimadzu UV-2600 spectrophotometer (Shimadzu Corporation, Kyoto, Japan) equipped with an ISR-2600Plus Shimadzu Corporation, Kyoto, Japan integrating sphere. Measurements were recorded over the 200–800 nm range using BaSO4 as a reflectance standard. The reflectance data were converted using the Kubelka–Munk function, and optical bandgaps were determined from Tauc plots assuming indirect allowed transitions (n = ½).
The optical band gap of each catalyst was estimated from UV–Vis diffuse reflectance data using the Kubelka–Munk function F(R), which relates reflectance to the absorption coefficient:
where R is the absolute reflectance. A modified K–M function can be obtained by multiplying the F(R) function by hν, using the corresponding coefficient (n) associated with an electronic transition (Equation (2)).
The intercept of the linear region of the Tauc plot with the energy axis provided the estimated band gap value. This approach allows for consistent comparison of optical absorption thresholds across materials with varying composition and calcination treatment.
4.4. Electrochemical and Photoelectrochemical Measurements
Electrochemical measurements were carried out using a GAMRY Reference 600 potentiostat (Gamry Instruments, Warminster, PA, USA) in a standard three-electrode cell configuration. A reversible hydrogen electrode (RHE) served as the reference electrode, a glassy carbon rod as the counter electrode, and a glassy carbon disk (0.071 cm2, Pine Instruments, (Pine Research Instrumentation, Durham, NC, USA)) as the working electrode.
Catalyst inks were prepared by dispersing 2 mg of catalyst in 500 μL of isopropanol (IPA, Sigma-Aldrich) and 15 μL of Nafion® solution (5 wt.%, Sigma-Aldrich). The suspension was sonicated for 15 min to ensure homogenization. Then, 10 μL of the ink was drop-cast onto the glassy carbon electrode and allowed to dry at room temperature.
The supporting electrolyte was a phosphate buffer solution (0.1 mol·L−1, pH 7), prepared from KH2PO4 and K2HPO4 (Sigma-Aldrich), with or without the addition of paracetamol (100 mg·L−1, ≥99.9%, Sigma-Aldrich). Prior to each measurement, the electrolyte was purged with high-purity nitrogen (99.999%) for 20 min.
Electrochemical and photoelectrochemical tests, including cyclic voltammetry (CV), chronoamperometry, and double-layer capacitance (Cdl) measurements, were conducted under static conditions. Photoelectrochemical experiments were conducted under simulated solar irradiation using a xenon lamp (XSS-5XD (Zolix Instruments, Beijing, China), 150–320 W, Radiant Output: 50 W). The light intensity at the electrode surface was 57,500 lx, measured using a digital lux meter. No significant temperature variation was observed during illumination.
Cdl was determined from CVs recorded in the non-faradaic region (0.80–0.90 V vs. RHE) at scan rates of 5, 10, 20, 50, 100, and 150 mV·s
−1. The capacitive current was estimated from the slope of the linear plot of current versus scan rate at a fixed potential using the following equation:
where
j is the average of anodic and cathodic current densities at a fixed potential (0.85 V vs. RHE) and
v is the scan rate. The electrochemically active surface area (ECSA) was then estimated by dividing the Cdl value by a standard specific capacitance of 40 µF·cm
−2, typically used for flat TiO
2 surfaces.
For kinetic analysis, linear sweep voltammetry (LSV) was carried out using a rotating disk electrode (RDE) system (Autolab RDE-2, (Metrohm Autolab B.V., Utrecht, The Netherlands)) with a glassy carbon disk electrode (0.071 cm2) at varying rotation speeds (750–2500 rpm). Levich plots were constructed from the LSV data, allowing the estimation of kinetic parameters such as the number of electrons transferred (n) under diffusion-controlled conditions.
Open-circuit potential (OCP) measurements were conducted under dark and illuminated conditions. Chronoamperometry tests were performed at potentials close to the OCP, alternating light ON/OFF cycles to evaluate the photocurrent response.
Mott–Schottky plots were obtained by electrochemical impedance spectroscopy (EIS) under dark conditions in 0.1 M phosphate buffer solution (pH 7) at a fixed frequency of 100 Hz, with an AC perturbation of 10 mV and a DC bias ranging from 0.6 to 1.2 V vs. RHE. Capacitance values were extracted from the real component of the impedance, and (1/C2) was plotted against the applied potential to estimate the flat-band potential and semiconductor type.
The carrier density (N
D for n-type and N
A for p-type) and flat-band potential (E
FB) were estimated from the linear region of the Mott–Schottky plots [
44], based on the following relation:
where C is the space-charge capacitance, ε is the dielectric constant of TiO
2 (ε = 80), ε
0 is the vacuum permittivity (8.854 × 10
−14 F·cm
−1), e is the elementary charge, E is the applied potential, and
is negligible at room temperature. The slope of the linear fit in the 1/C
2 vs. V plot was used to calculate N, and the intercept provided E
FB [
45].
4.5. Estimation of the Number of Electrons Transferred
The apparent number of electrons transferred (n) during the electrochemical oxidation of paracetamol was estimated using two independent methods: the Randles–Ševčík equation (based on cyclic voltammetry) and the Koutecký–Levich (KL) approach (based on hydrodynamic voltammetry).
For irreversible systems, the Randles–Ševčík equation is expressed as:
where I
peak is the peak current (A), A is the electroactive surface area (cm
2), α is the electron transfer coefficient (assumed as 0.5 for irreversible systems), A is the electrode area (cm
2), D is the diffusion coefficient of paracetamol (mol·cm
−3), and v is the scan rate (V·s
−1). The following values were employed: D = 6.1 × 10
−6 cm
2·s
−1, and C = 6.6 × 10
−7 mol·cm
−3.
Additionally, the number of electrons was also estimated using the Koutecký–Levich (KL) equation:
where I
DIF is the measured diffusional current (A), I
k is the kinetic current, ν is the kinematic viscosity of the electrolyte (assumed as 0.012 cm
2·s
−1), and ω is the electrode rotation rate (rad·s
−1). The slope of the KL plot (1/I vs. ω
−1/2) allows extraction of n.
5. Conclusions
This study demonstrates that copper incorporation into NiMo/TiO2 photocatalysts enhances both hydrogen evolution and pharmaceutical pollutant oxidation under simulated solar illumination. The photocatalytic performance is maximized in the catalyst calcined at 400 °C (NiMoCu400), which retains mesoporosity, high surface area, visible-light absorption, and a rich population of surface-active sites.
In contrast, calcination at 900 °C (NiMoCu900) induces structural densification, rutile phase formation, and oxidation of surface Cu+ species. These changes correlate with a significant decrease in electrochemical and photoelectrochemical activity, despite the material exhibiting a stronger photovoltage response. Mott–Schottky analysis confirmed an inversion from n-type to p-type semiconductor behavior in NiMoCu900, attributed to Cu migration, surface oxidation, and the anatase-to-rutile phase transition. Photocatalytic performance depends on the preservation of donor-type surface states, redox-active species, and efficient charge transfer pathways.
Under illumination, all active catalysts followed a two-electron oxidation pathway for paracetamol, indicating efficient transformation without external oxidants. RDE measurements confirmed that mass transport limitations influence performance, particularly for NiMoCu400, where diffusion-controlled behavior was observed.
Among the materials tested, NiMoCu400 with a low copper content (0.6 wt.%) exhibited the most favorable balance of structural, electronic, and functional properties. Its superior bifunctional activity confirms that optimizing both surface composition and calcination conditions is key to designing cost-effective, low-noble-metal photocatalysts for integrated hydrogen generation and wastewater treatment.
