Article

Removal of a Mixture of Pollutants in Air Using a Pilot-Scale Planar Reactor: Competition Effect on Mineralization

1
Laboratoire Matériaux Énergétiques et Propulsion, Direction de Recherche Scientifique et Technologique, Ecole Supérieure du Matériel, ESM, BP 188, Beau-Lieu, Alger 16004, Algeria
2
ENSCR, CNRS, ISCR–UMR 6226, University Rennes, F-35000 Rennes, France
3
College of Sciences, Imam Mohammad Ibn Saud Islamic University (IMSIU), Riyadh 11623, Saudi Arabia
4
College of Engineering, Imam Mohammad Ibn Saud Islamic University (IMSIU), Riyadh 11432, Saudi Arabia
*
Author to whom correspondence should be addressed.
Catalysts 2025, 15(6), 595; https://doi.org/10.3390/catal15060595
Submission received: 23 April 2025 / Revised: 5 June 2025 / Accepted: 10 June 2025 / Published: 16 June 2025

Abstract

:
This study investigated the remediation of organic acid pollutants, specifically butyric acid (C4H8O) and valeric acid (C5H10O2), as well as their binary mixtures in the vapor phase at various ratios. The remediation process involved the use of a continuous pilot-scale reactor. A TiO2 catalyst was deposited on glass fiber tissue (GFT) and ultraviolet (UV) irradiation with an intensity of 20 W/m2. The main objective of this study was to assess the effectiveness of the photocatalytic process by oxidizing and mineralizing a mixture of carboxylic acids in a rectangular reactor at pilot scale. This was achieved by calculating the removal efficiency and the selectivity of CO2 (SCO2). Each individual compound was treated separately, followed by the treatment of binary mixtures with molar fractions of 0.25, 0.5, and 0.75. The concentration of pollutants at the inlet varied between 50, 100, 150, and 200 mg/m3, while the flowrate ranged from 2 to 6 m3/h. The obtained results for the removal efficiency of butyric acid, the binary acid mixture (25% butyric acid + 75% valeric acid), and valeric acid were satisfactory, with percentages of 58%, 32%, and 41%, respectively. It is evident that the selectivity toward CO2 is better for butyric acid compared to valeric acid and the binary carboxylic acid mixture, with values of 43.70%, 33.49%, and 21.96%, respectively, across all concentrations. A simulation model based on mass transfer and catalytic oxidation mechanisms was developed and successfully validated against the experimental data for each pollutant. Reusability tests conducted on the TiO2 on GFT, both in its initial (clean) state and after 50 h of the photocatalytic treatment of butyric acid, showed a 15% decrease in photocatalytic efficiency.

1. Introduction

Butyric and valeric acids, like other organic acids, pose significant environmental hazards [1]. Primarily, they are toxic to aquatic organisms such as fish, invertebrates, and algae, potentially disrupting aquatic ecosystems and lowering dissolved oxygen levels in water bodies [2]. Spills or leaks of these acids may contaminate soil and groundwater, impairing soil fertility and threatening drinking water quality. When released into the atmosphere, butyric and valeric acids can undergo reactions forming volatile organic compounds (VOCs), which contribute to smog formation and degrade air quality [3]. Additionally, their corrosive nature means improper handling and storage can cause infrastructure damage and increase risks of environmental contamination [4]. Exposure to high concentrations of these acids can cause irritation to the eyes, skin, and respiratory system in humans and animals, with systemic toxicity possible upon ingestion or absorption in large amounts. Therefore, stringent handling, storage, and disposal protocols are essential to minimize their environmental and health impacts [5,6,7,8,9,10]. The pharmaceutical and chemical industries often use carboxylic acids as intermediates or by-products in their manufacturing processes [11,12]. By implementing photocatalysis, these acids can be removed from production waste streams, minimizing environmental impact and optimizing process efficiency [13]. In the food and beverage industry, photocatalysis can be applied to treat effluents that contain carboxylic acids [14]. This treatment ensures compliance with regulatory standards and prevents contamination [15].
The photocatalytic process has a wide range of applications for the removal of carboxylic acids in various fields. These fields include environmental remediation, wastewater treatment, air purification, pharmaceutical and chemical industries, food and beverage industry, and odor control [7]. In environmental remediation, photocatalysis can be used to eliminate carboxylic acids from contaminated air or water sources, thereby reducing pollution and improving the overall quality of the environment [8].
For wastewater treatment, photocatalysis efficiently breaks down carboxylic acids commonly present in industrial effluent, ensuring treated water meets safety standards for discharge or reuse [9,10]. In air purification, photocatalysis converts vapor phase carboxylic acids to harmless by-product [11]. Lastly, photocatalysis can help control unpleasant odors caused by carboxylic acids in various settings such as wastewater treatment plants or waste storage facilities. By oxidizing the acids into odorless compounds, photocatalysis effectively eliminates these odors [16]. Overall, photocatalysis offers a sustainable, efficient approach for the removal of carboxylic acids in environmental and industrial contexts [17].
Numerous studies have demonstrated the photocatalytic treatment of aliphatic carboxylic acid mixtures in the atmosphere using titanium dioxide (TiO2) and other catalysts such as metal oxides (e.g., ZnO, CuO, CeO2) and zeolites in presence of external UV light at laboratory scale [2,5,18]. This technique is favored due to its non-toxicity, environmental friendliness, ease of preparation, cost-effectiveness, and high stability and efficiency [19]. Pilot-scale photocatalysis has also proven effective for treating hazardous pollutants and low-VOC gas streams at an ambient temperature [20]. Laboratory investigations have explored the degradation of VOCs such as dimethylamine, acetylene, benzene, and the removal of nitrogen oxides (NOx) from combustion gases [21]. However, the inherently slow reaction kinetics of photocatalysis may limit complete degradation within practical contact times unless reactor design is optimized [22]. Scaling up and applying photocatalysis to real industrial effluents containing a mixture of complex pollutants remains challenging but essential for validating its industrial applicability [23].
Existing studies have not addressed the continuous vapor-phase photocatalytic degradation of binary mixtures of C4 and C5 acids under pilot-scale conditions. Thus, in this study, butyric acid and valeric acid were chosen as representative carboxylic acids to evaluate removal efficiency in a rectangular pilot-scale reactor. Butyric acid is found in esterified form in animal fats and plant oils [24]. It is also used as a food and perfume additive due to its pleasant aroma or taste [25]. Valeric acid is a straight-chain saturated fatty acid with five carbon atoms and plays a role as a plant metabolite [26,27,28,29,30]. The pollutants were treated as binary mixtures in a continuous pilot reactor. The study systematically investigated the effects of key operating parameters on pollutant removal, with a particular focus on mineralization rates and mass transfer phenomena. Photocatalytic kinetics were modeled using a Langmuir–Hinshelwood (L–H) approach that incorporates mass transfer effects.

2. Results and Discussion

The performance evaluation of the photocatalytic oxidation process involved calculating several parameters. These parameters include the removal efficiency (RE%), which quantifies how effectively pollutants are removed, and the selectivity of CO2 ( S CO 2 ), which indicates the preference for producing carbon dioxide during the oxidation process. These parameters were calucalted using the equations defined in (Equations (1) and (2)):
RE % = C inlet C oulet C inlet × 100 ,
S CO 2 % = CO 2 formed n × C inlet   Conv × 100 .
Here, [C]inlet and [C]outlet represent the inlet and outlet concentrations of the pollutant in (mmol/m3), [C]inlet conv represents the amount of pollutant converted, and n is the carbon number in each pollutant molecule.
To better understand the photocatalytic elimination process of organic acid mixtures, experiments began by treating each pollutant individually. Subsequently, mixture with various compositions were studied.

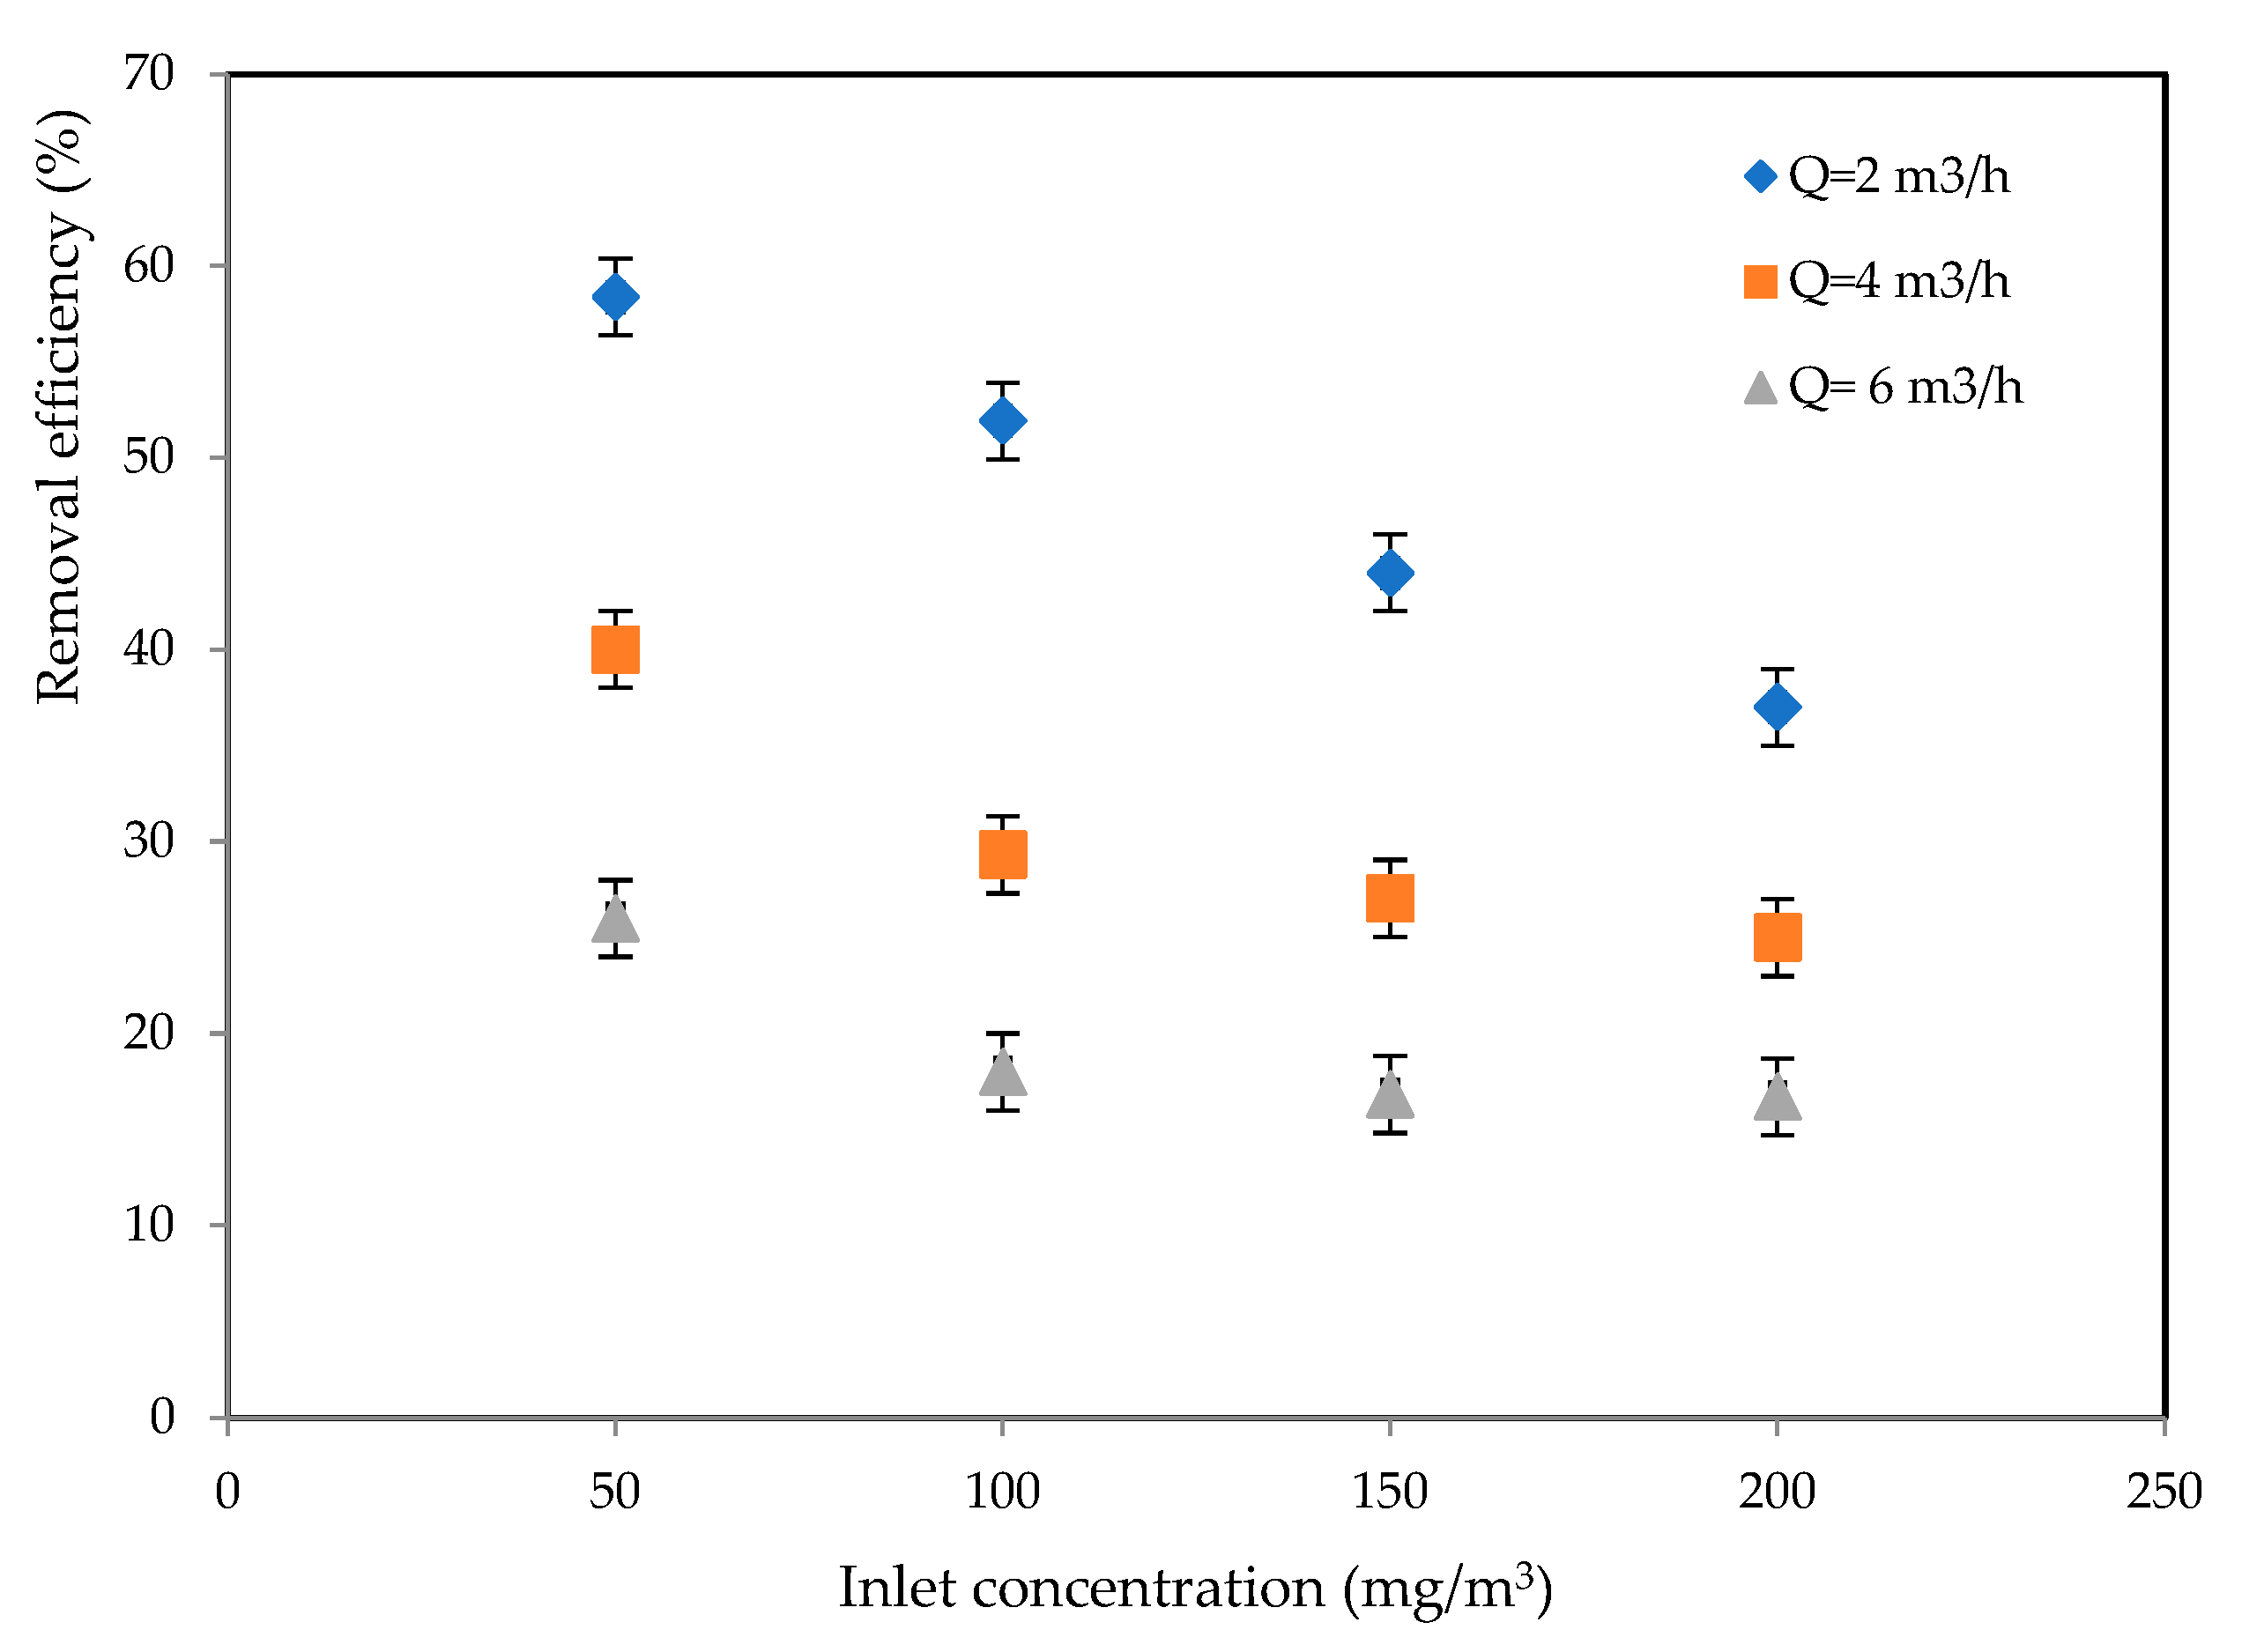
2.1. Oxidation of Butyric Acid

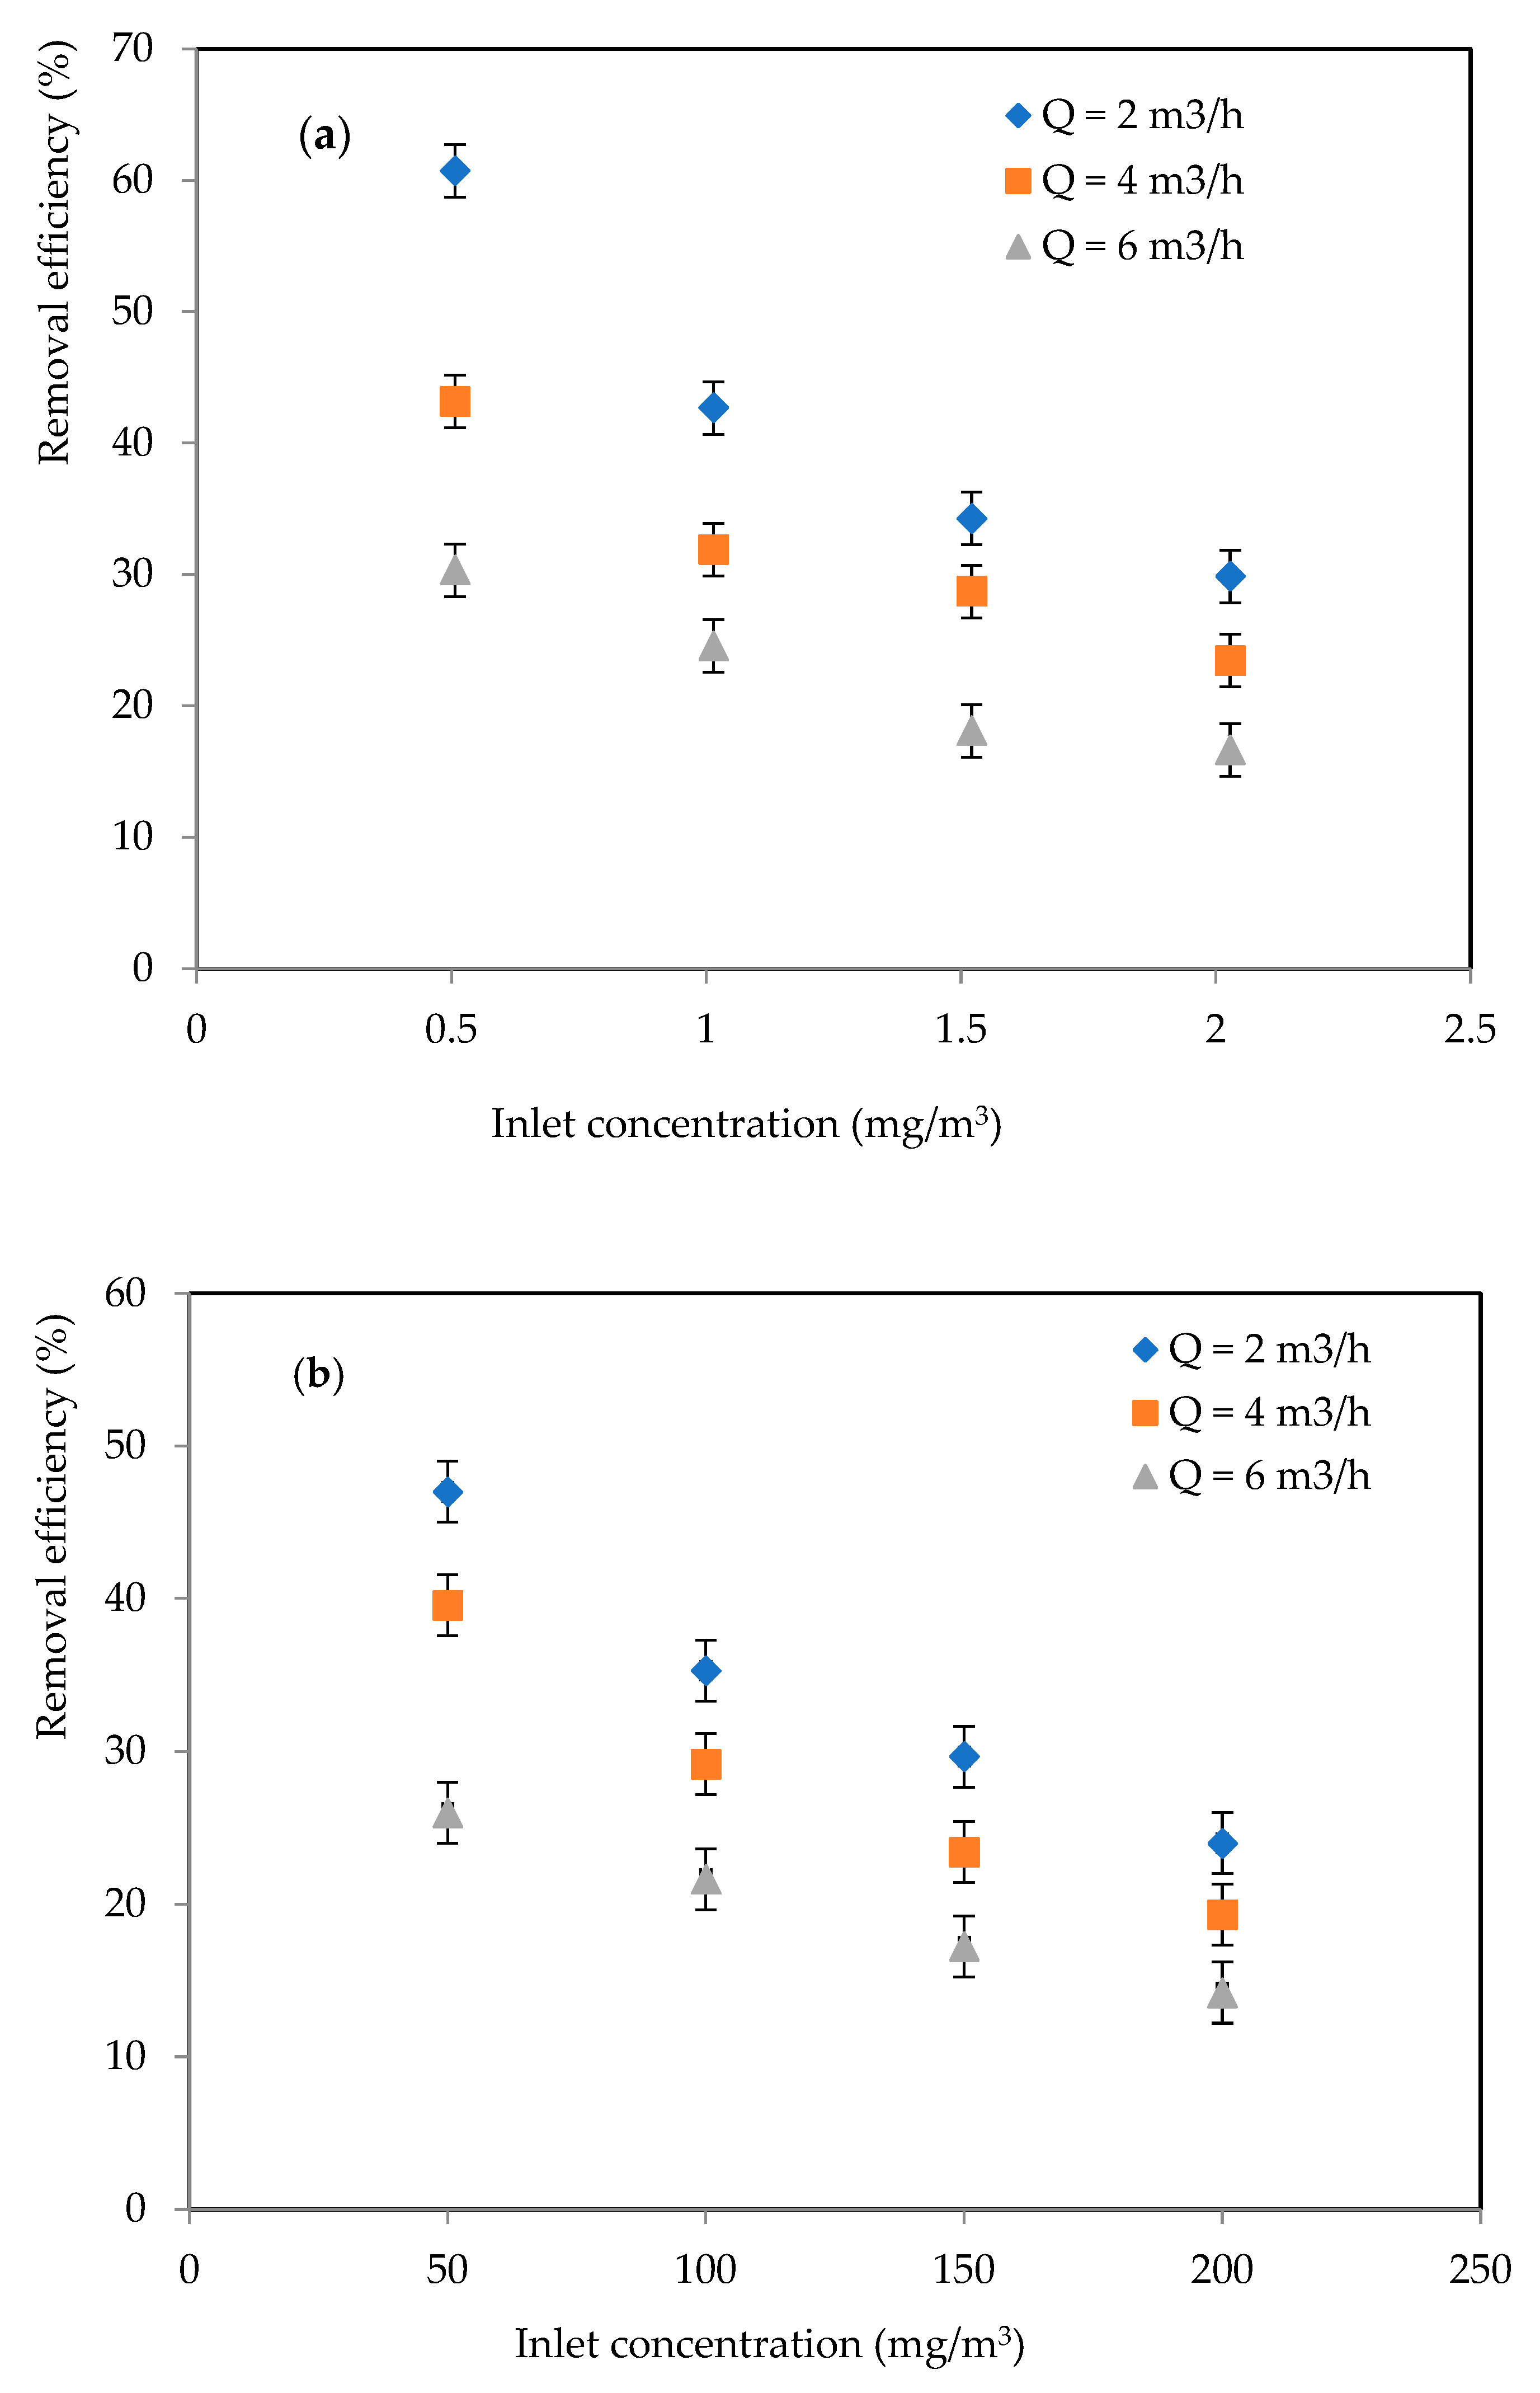
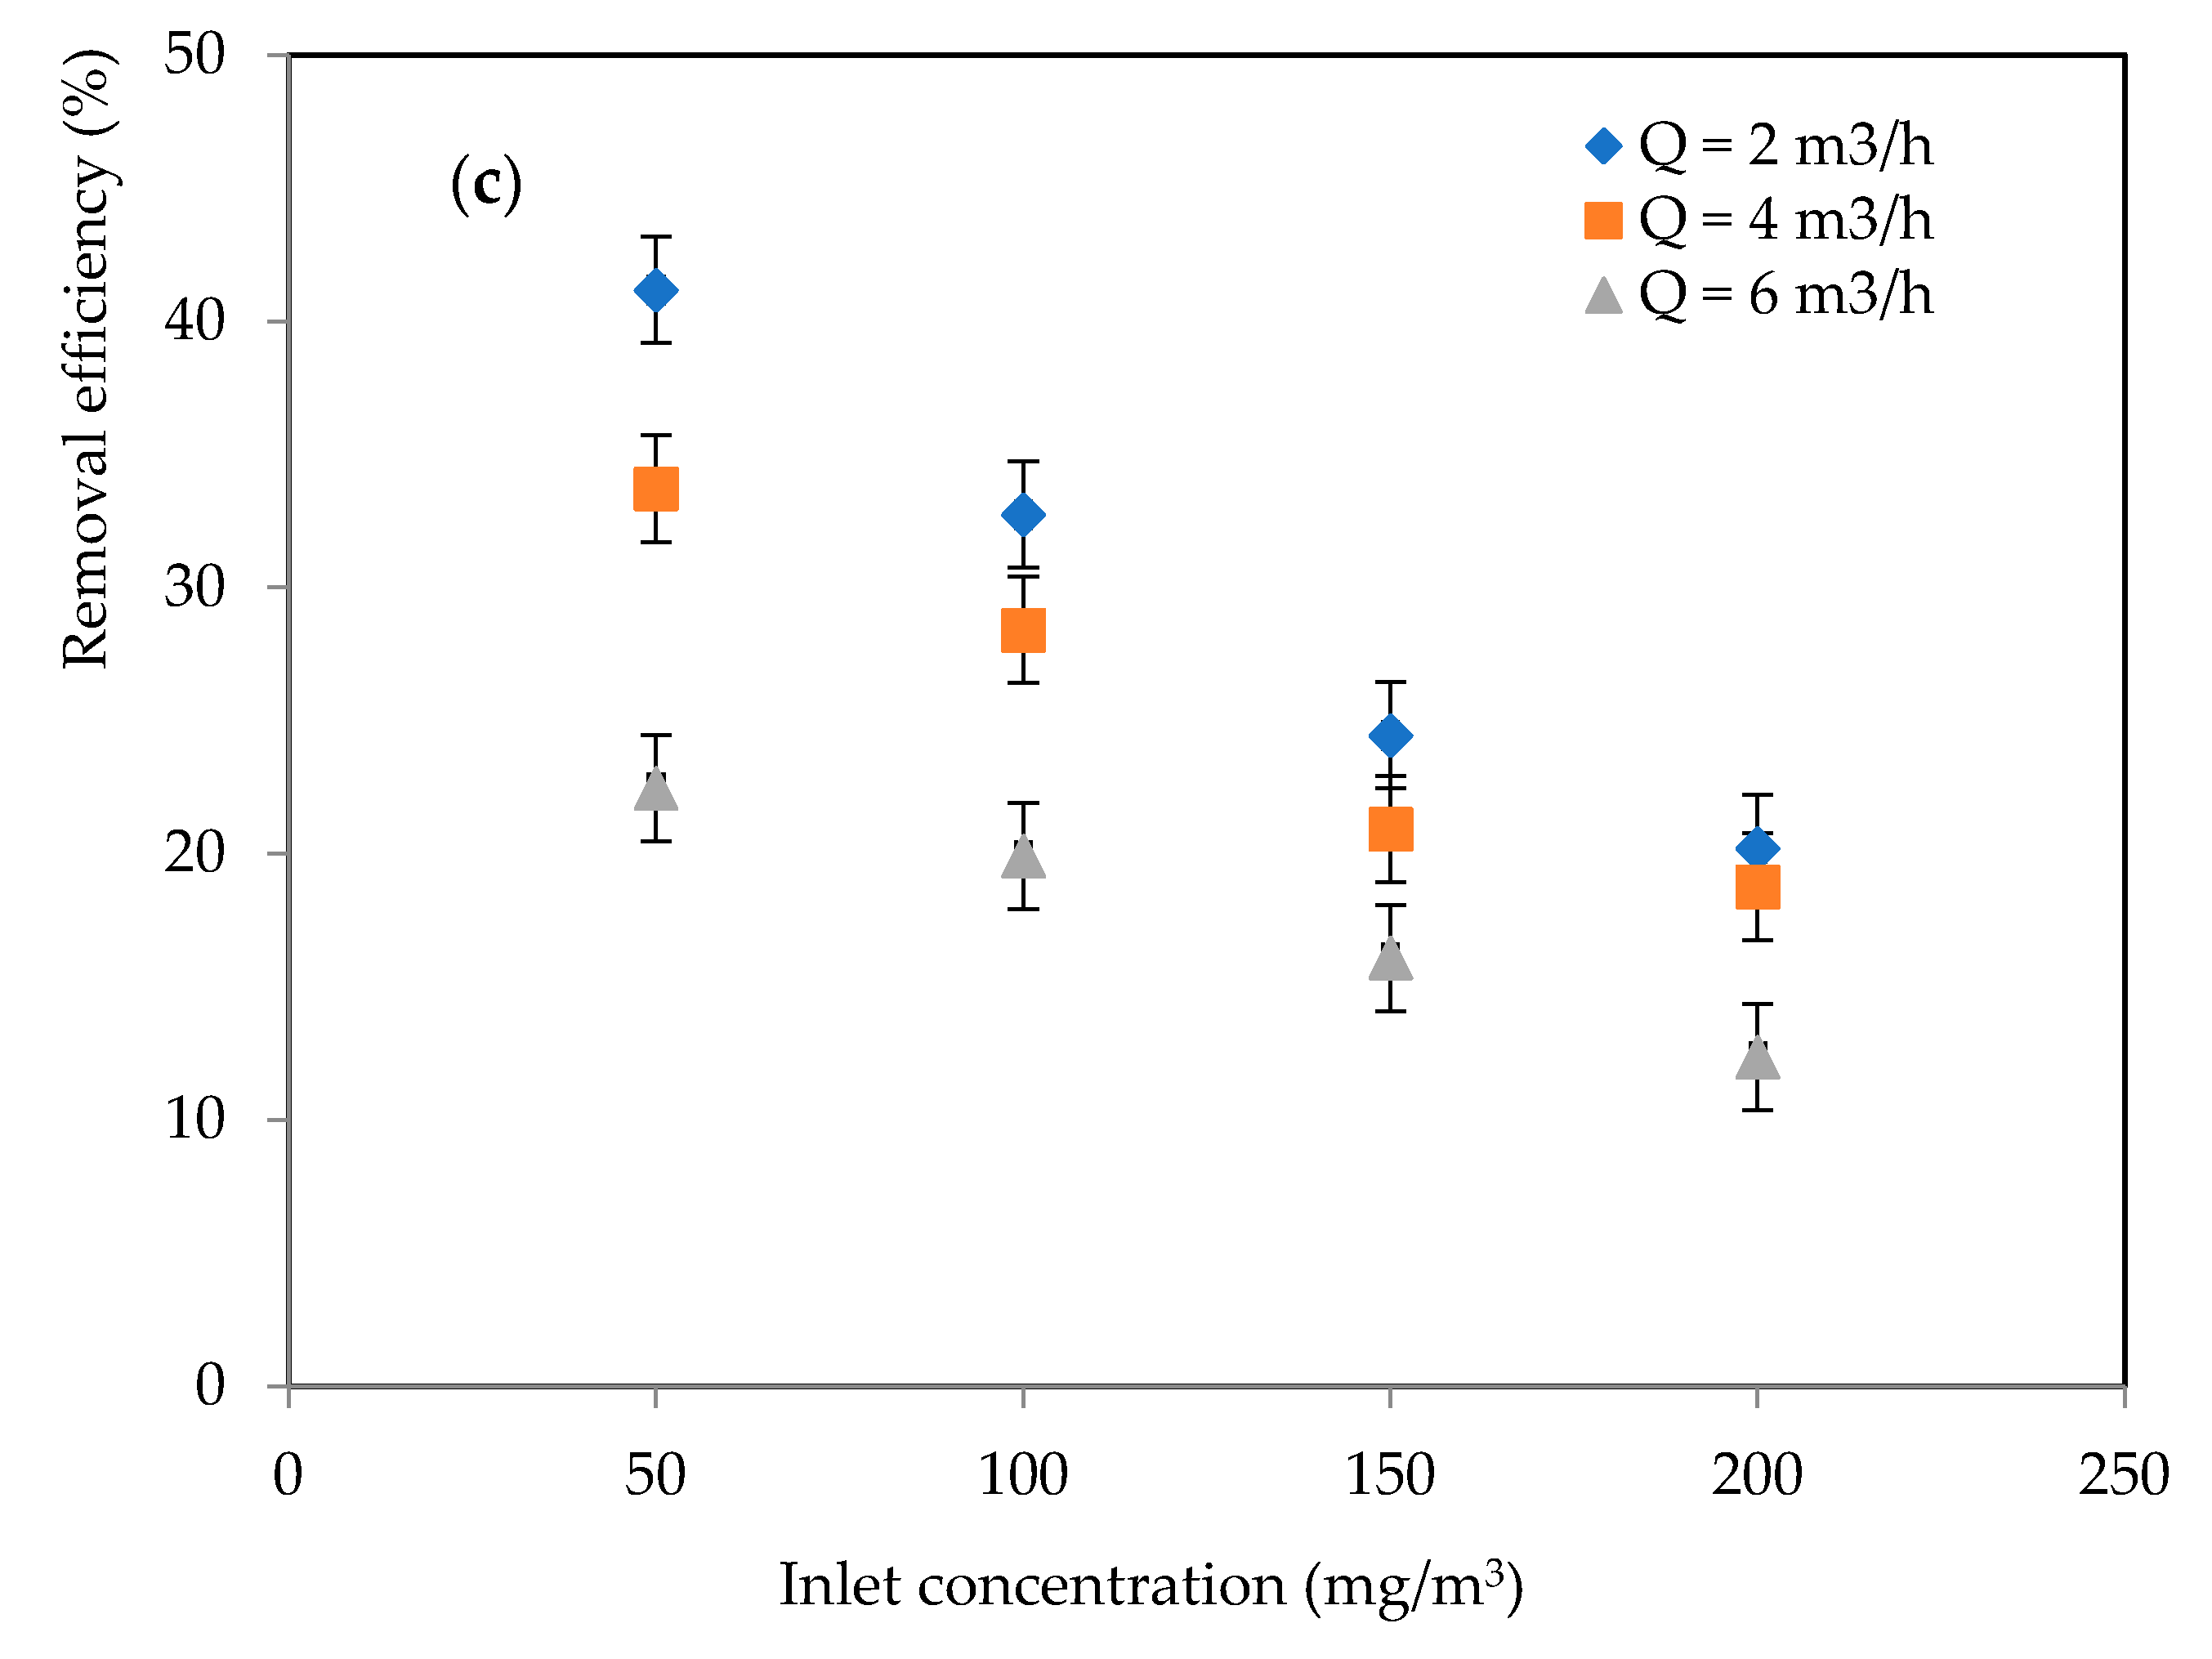
2.1.1. Effects of Inlet Concentration and Flowrate

Two operating parameters—the initial concentration of butyric and valeric acids (or their binary mixtures) and the air flow rate—were varied to assess their effects on removal efficiency and CO2 selectivity.
To evaluate the performance of the rectangular reactor, the inlet concentration of butyric acid was varied from 50, 100, 150, and 200 mg/m3, while the flow rate was set at 2, 4, and 6 m3/h. Removal efficiency (RE) under these conditions was calculated using Equation (1) and is presented in Figure 1.
The results show that the removal efficiency of butyric acid significantly decreases as both inlet concentration and air flow rate increase. At a fixed flow rate of Q = 2 m3/h, RE dropped from 58.36% at 50 mg/m3 to 37% at 200 mg/m3. At a flow rate of Q = 6 m3/h, RE declined from 26% to 16.71% over the same concentration range. The removal efficiency followed the order: 2 m3/h > 4 m3/h > 6 m3/h. This decrease at higher flow rates is attributed to reduced contact time between the pollutant and the catalyst surface [15,16,17,18,19,20].

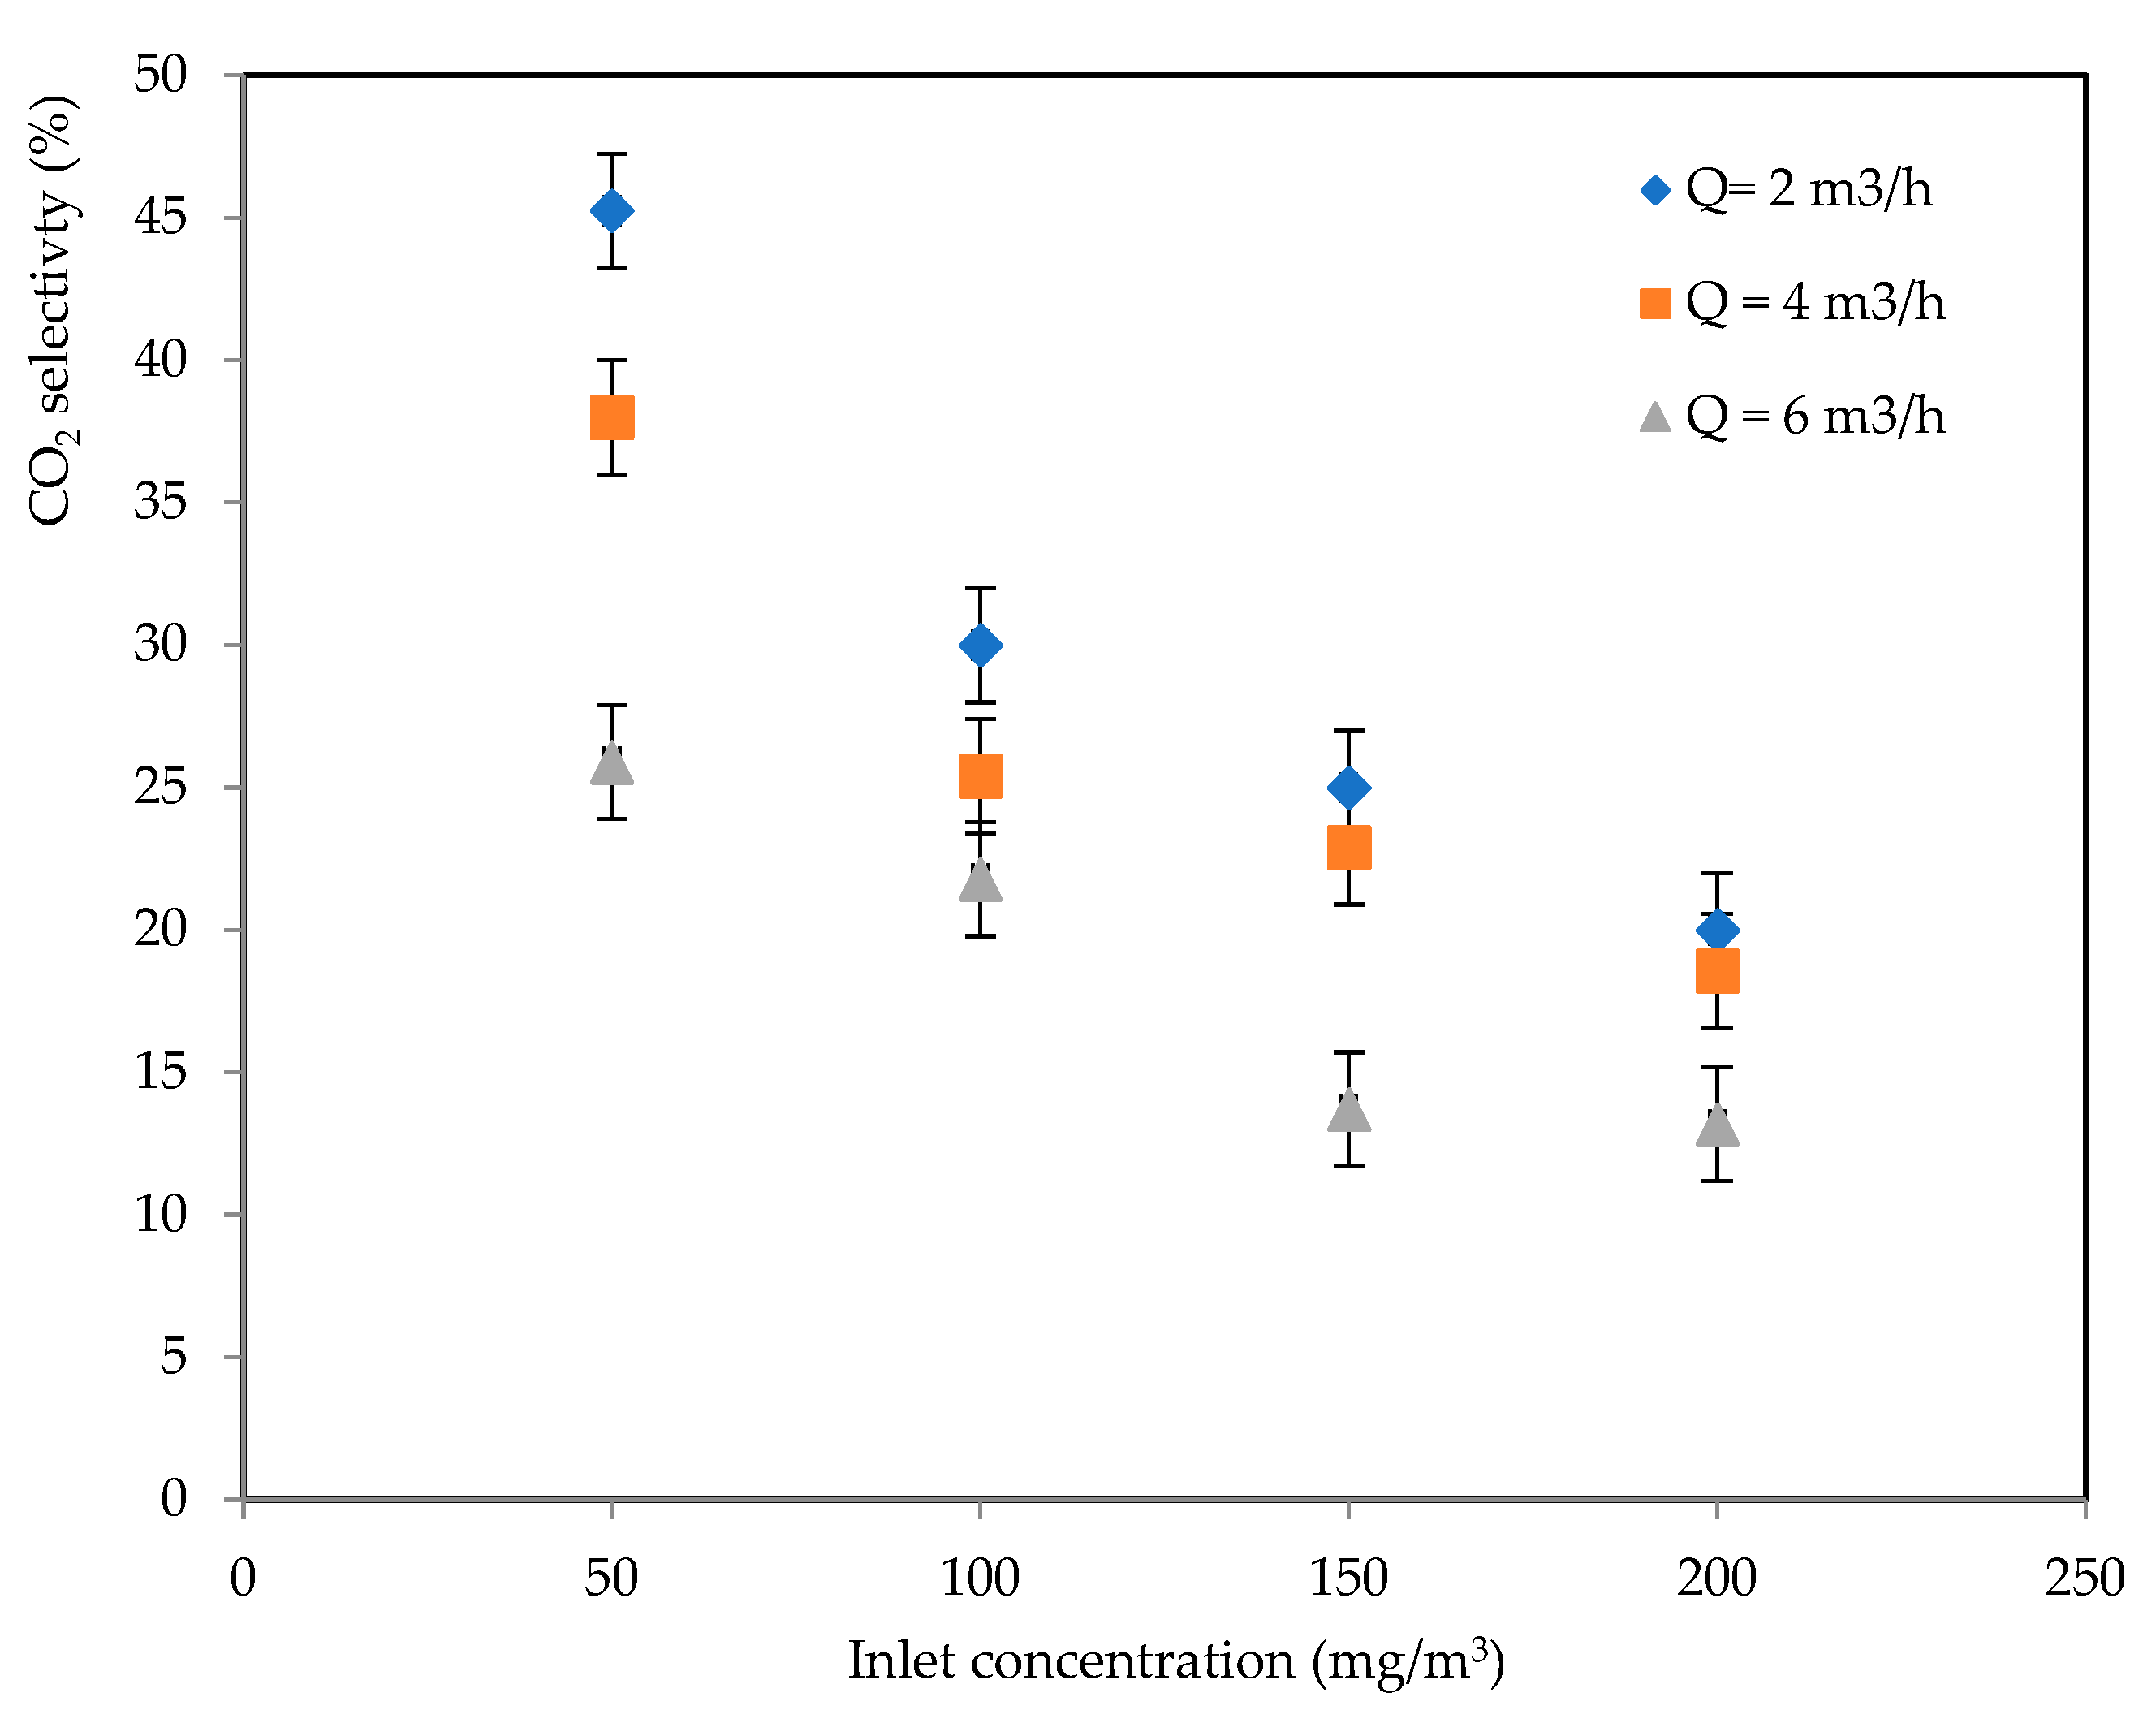
2.1.2. CO2 Selectivity

The performance of the photocatalytic reactor in terms of VOC degradation and mineralization rate can be evaluated by calculating the selectivity of CO2. The evolution of CO2 selectivity, as produced during photocatalysis, can be derived using Equation (2) and is shown in Figure 2. It was observed that the CO2 selectivity exhibited a similar behavior to the removal efficiency, with respect to the operating parameters. The CO2 selectivity decreased with increasing values of both the inlet concentration (ranging from 50 to 200 mg/m3) and the air flow rate (Q = 2, 4, and 6 m3/h). For a flow rate of Q = 2 m3/h, the CO2 selectivity decreased from 45.24% at an inlet concentration of 50 mg/m3 to 20% at an inlet concentration of 200 mg/m3.
Similarly, for a flow rate of Q = 6 m3/h, the selectivity reduced from 25.9% at an inlet concentration of 50 mg/m3 to 13.18% at an inlet concentration of 200 mg/m3. The values of CO2 selectivity (SCO2) followed the sequence: Q = 2 m3/h > Q = 4 m3/h > Q = 6 m3/h.

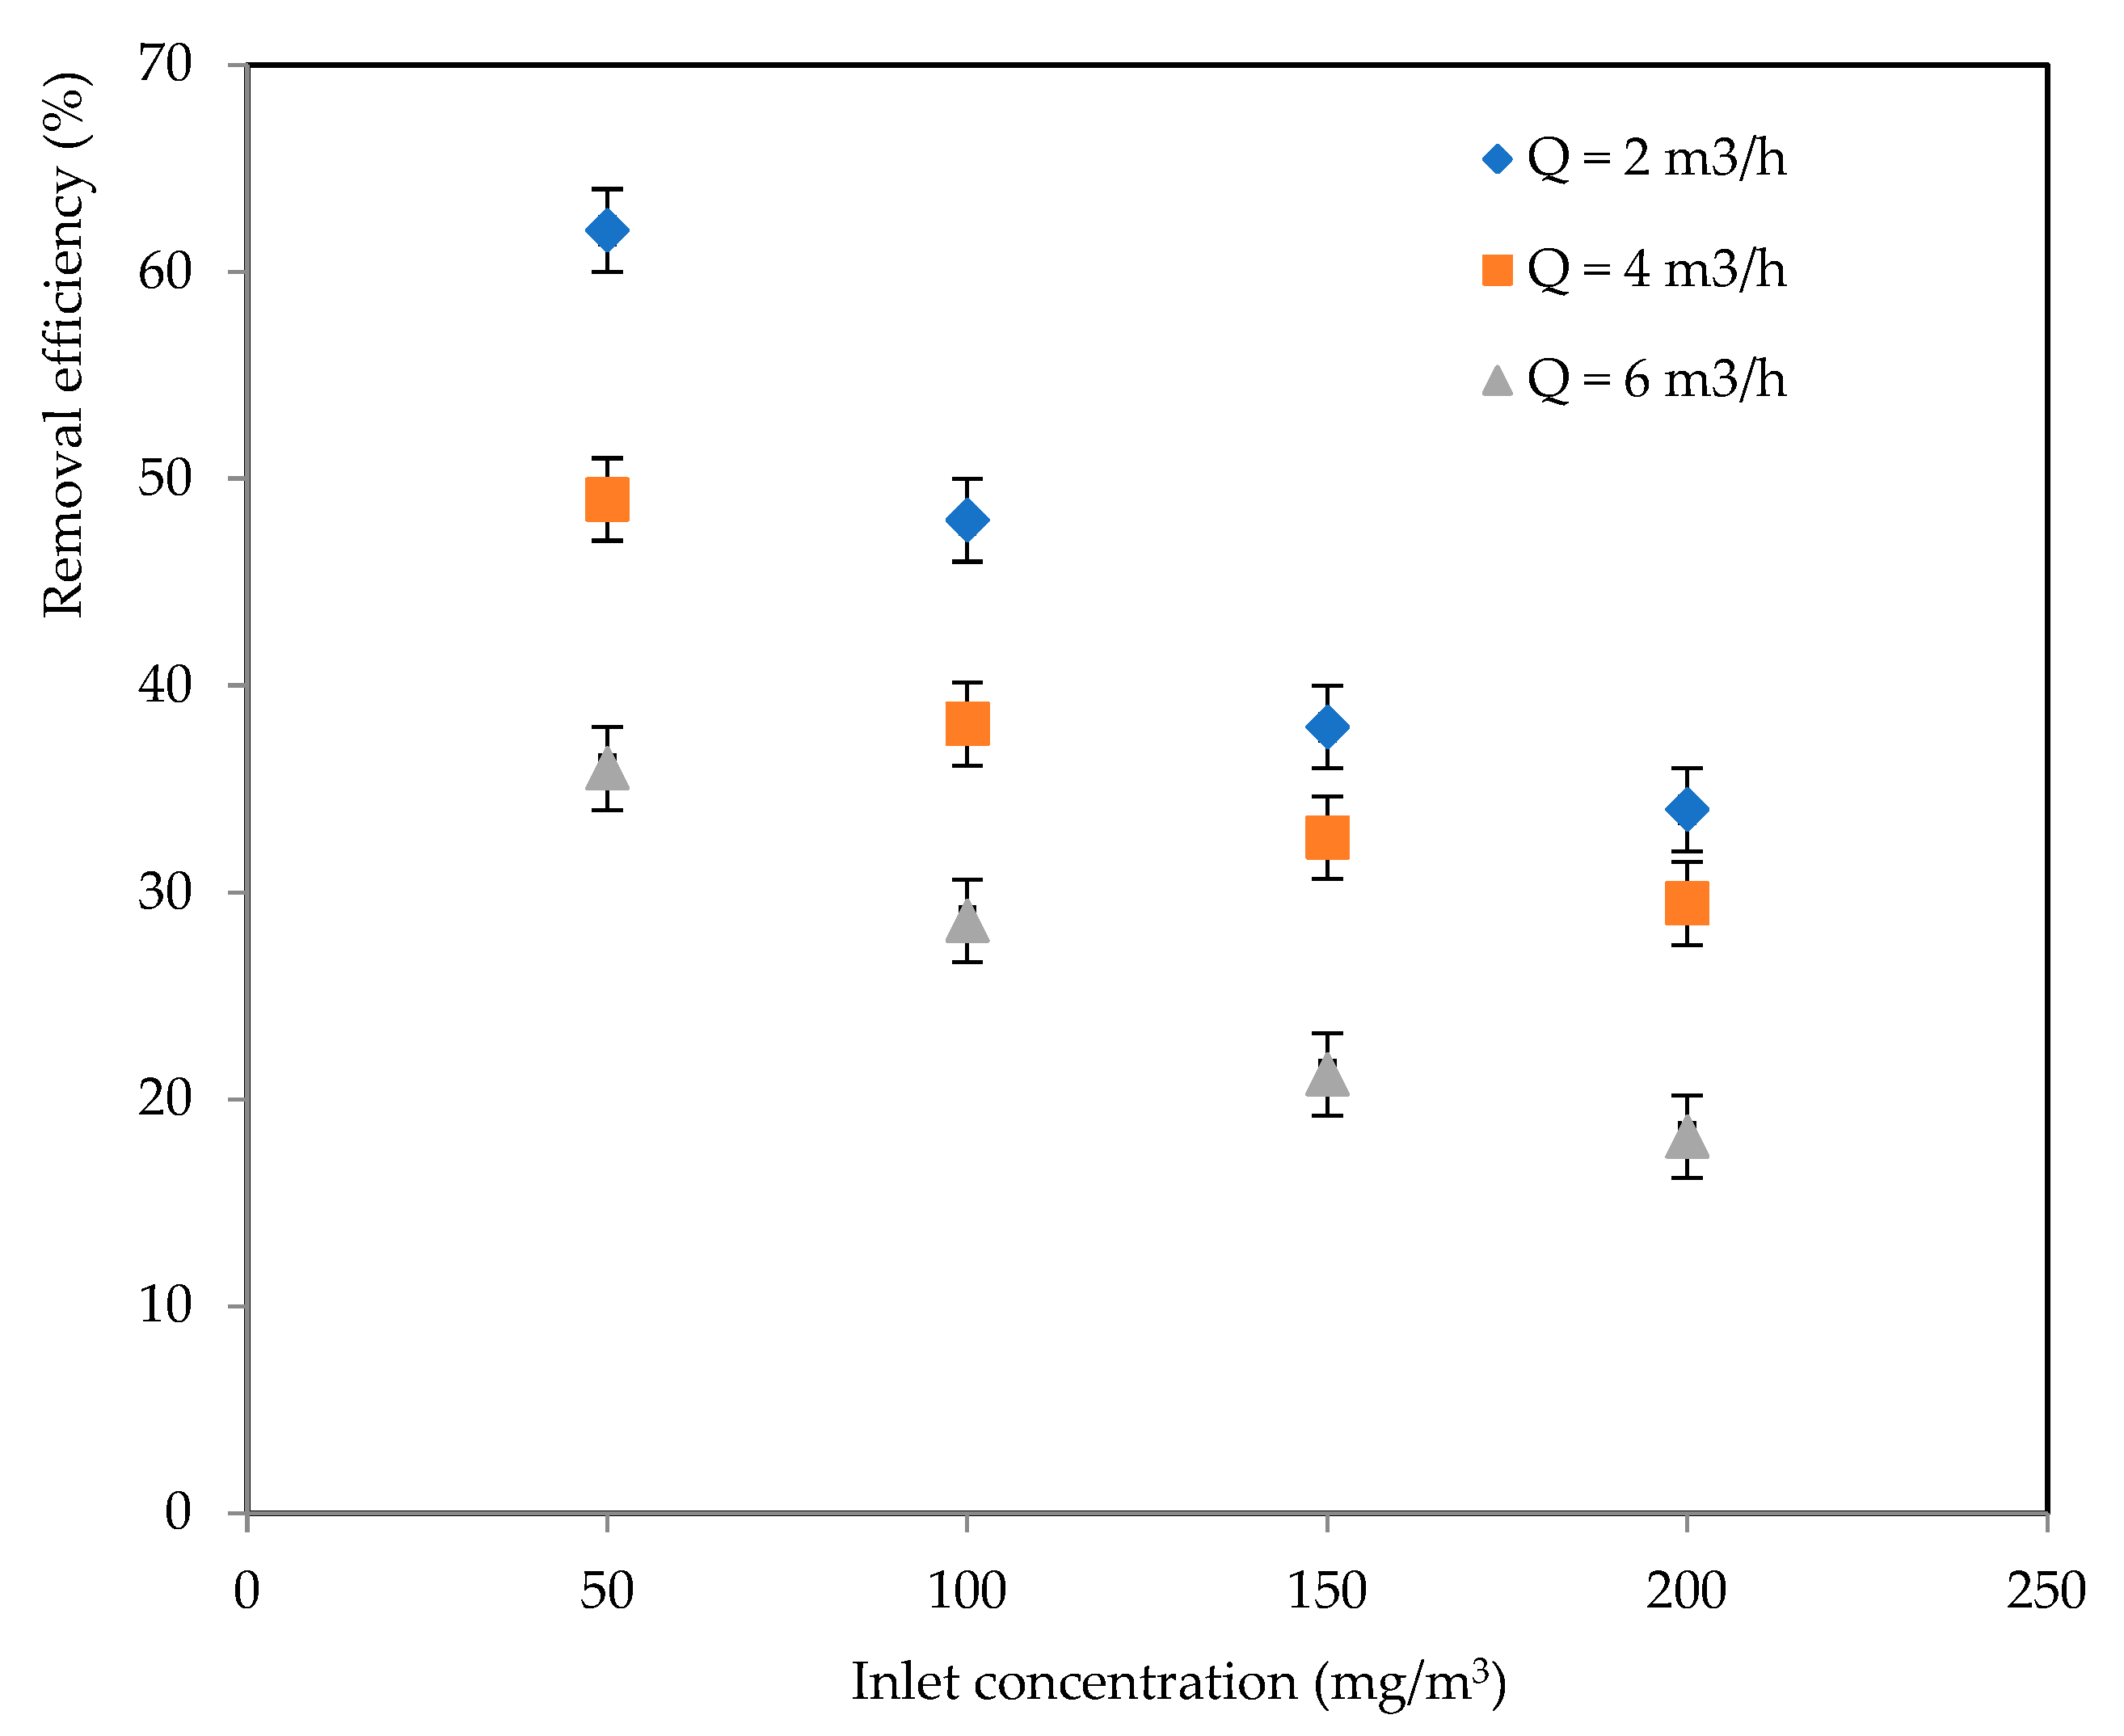
2.2. Oxidation of Valeric Acid

2.2.1. Effects of Inlet Concentration and Flowrate

In the same way, we proceeded with the valeric acid treatment conditions. The removal efficiency (RE%) of valeric acid pollutant was calculated at different inlet concentrations (50, 100, 150, and 200 mg/m3) and gas flow rates (2, 4, and 6 m3/h) using Equation (1). The results are presented in Figure 3.
A similar behavior to that observed with butyric acid was noted. Indeed, the removal efficiency of valeric acid significantly decreased with increasing values of both operating parameters, i.e., inlet concentration and air flow rate. For a flow rate of Q = 2 m3/h, the removal efficiency decreased from 62% at an inlet concentration of 50 mg/m3 to 34% at an inlet concentration of 200 mg/m3. Similarly, for a flow rate of Q = 6 m3/h, the removal efficiency decreased from 36% at an inlet concentration of 50 mg/m3 to 18.21% at an inlet concentration of 200 mg/m3.
The values of removal efficiency (RE) followed the sequence: Q = 2 m3/h > Q = 4 m3/h > Q = 6 m3/h. Additionally, it was observed that as the inlet concentration increased, the degradation rate of valeric acid decreased.
Furthermore, it is evident that the removal efficiency of valeric acid decreased with increasing flow rate, as seen with butyric acid. This is attributed to the decreased contact time between the carboxylic acid and the catalytic active sites.
It can be observed that both butyric acid and valeric acid pollutants exhibited similar behavior in terms of the decrease in removal efficiency with increasing inlet concentration and flow rate. However, it is worth noting that the removal efficiency for valeric acid was slightly higher than that of butyric acid. This could be due to differences in the reactivity and adsorption capacity of the two acids on the catalyst surface.

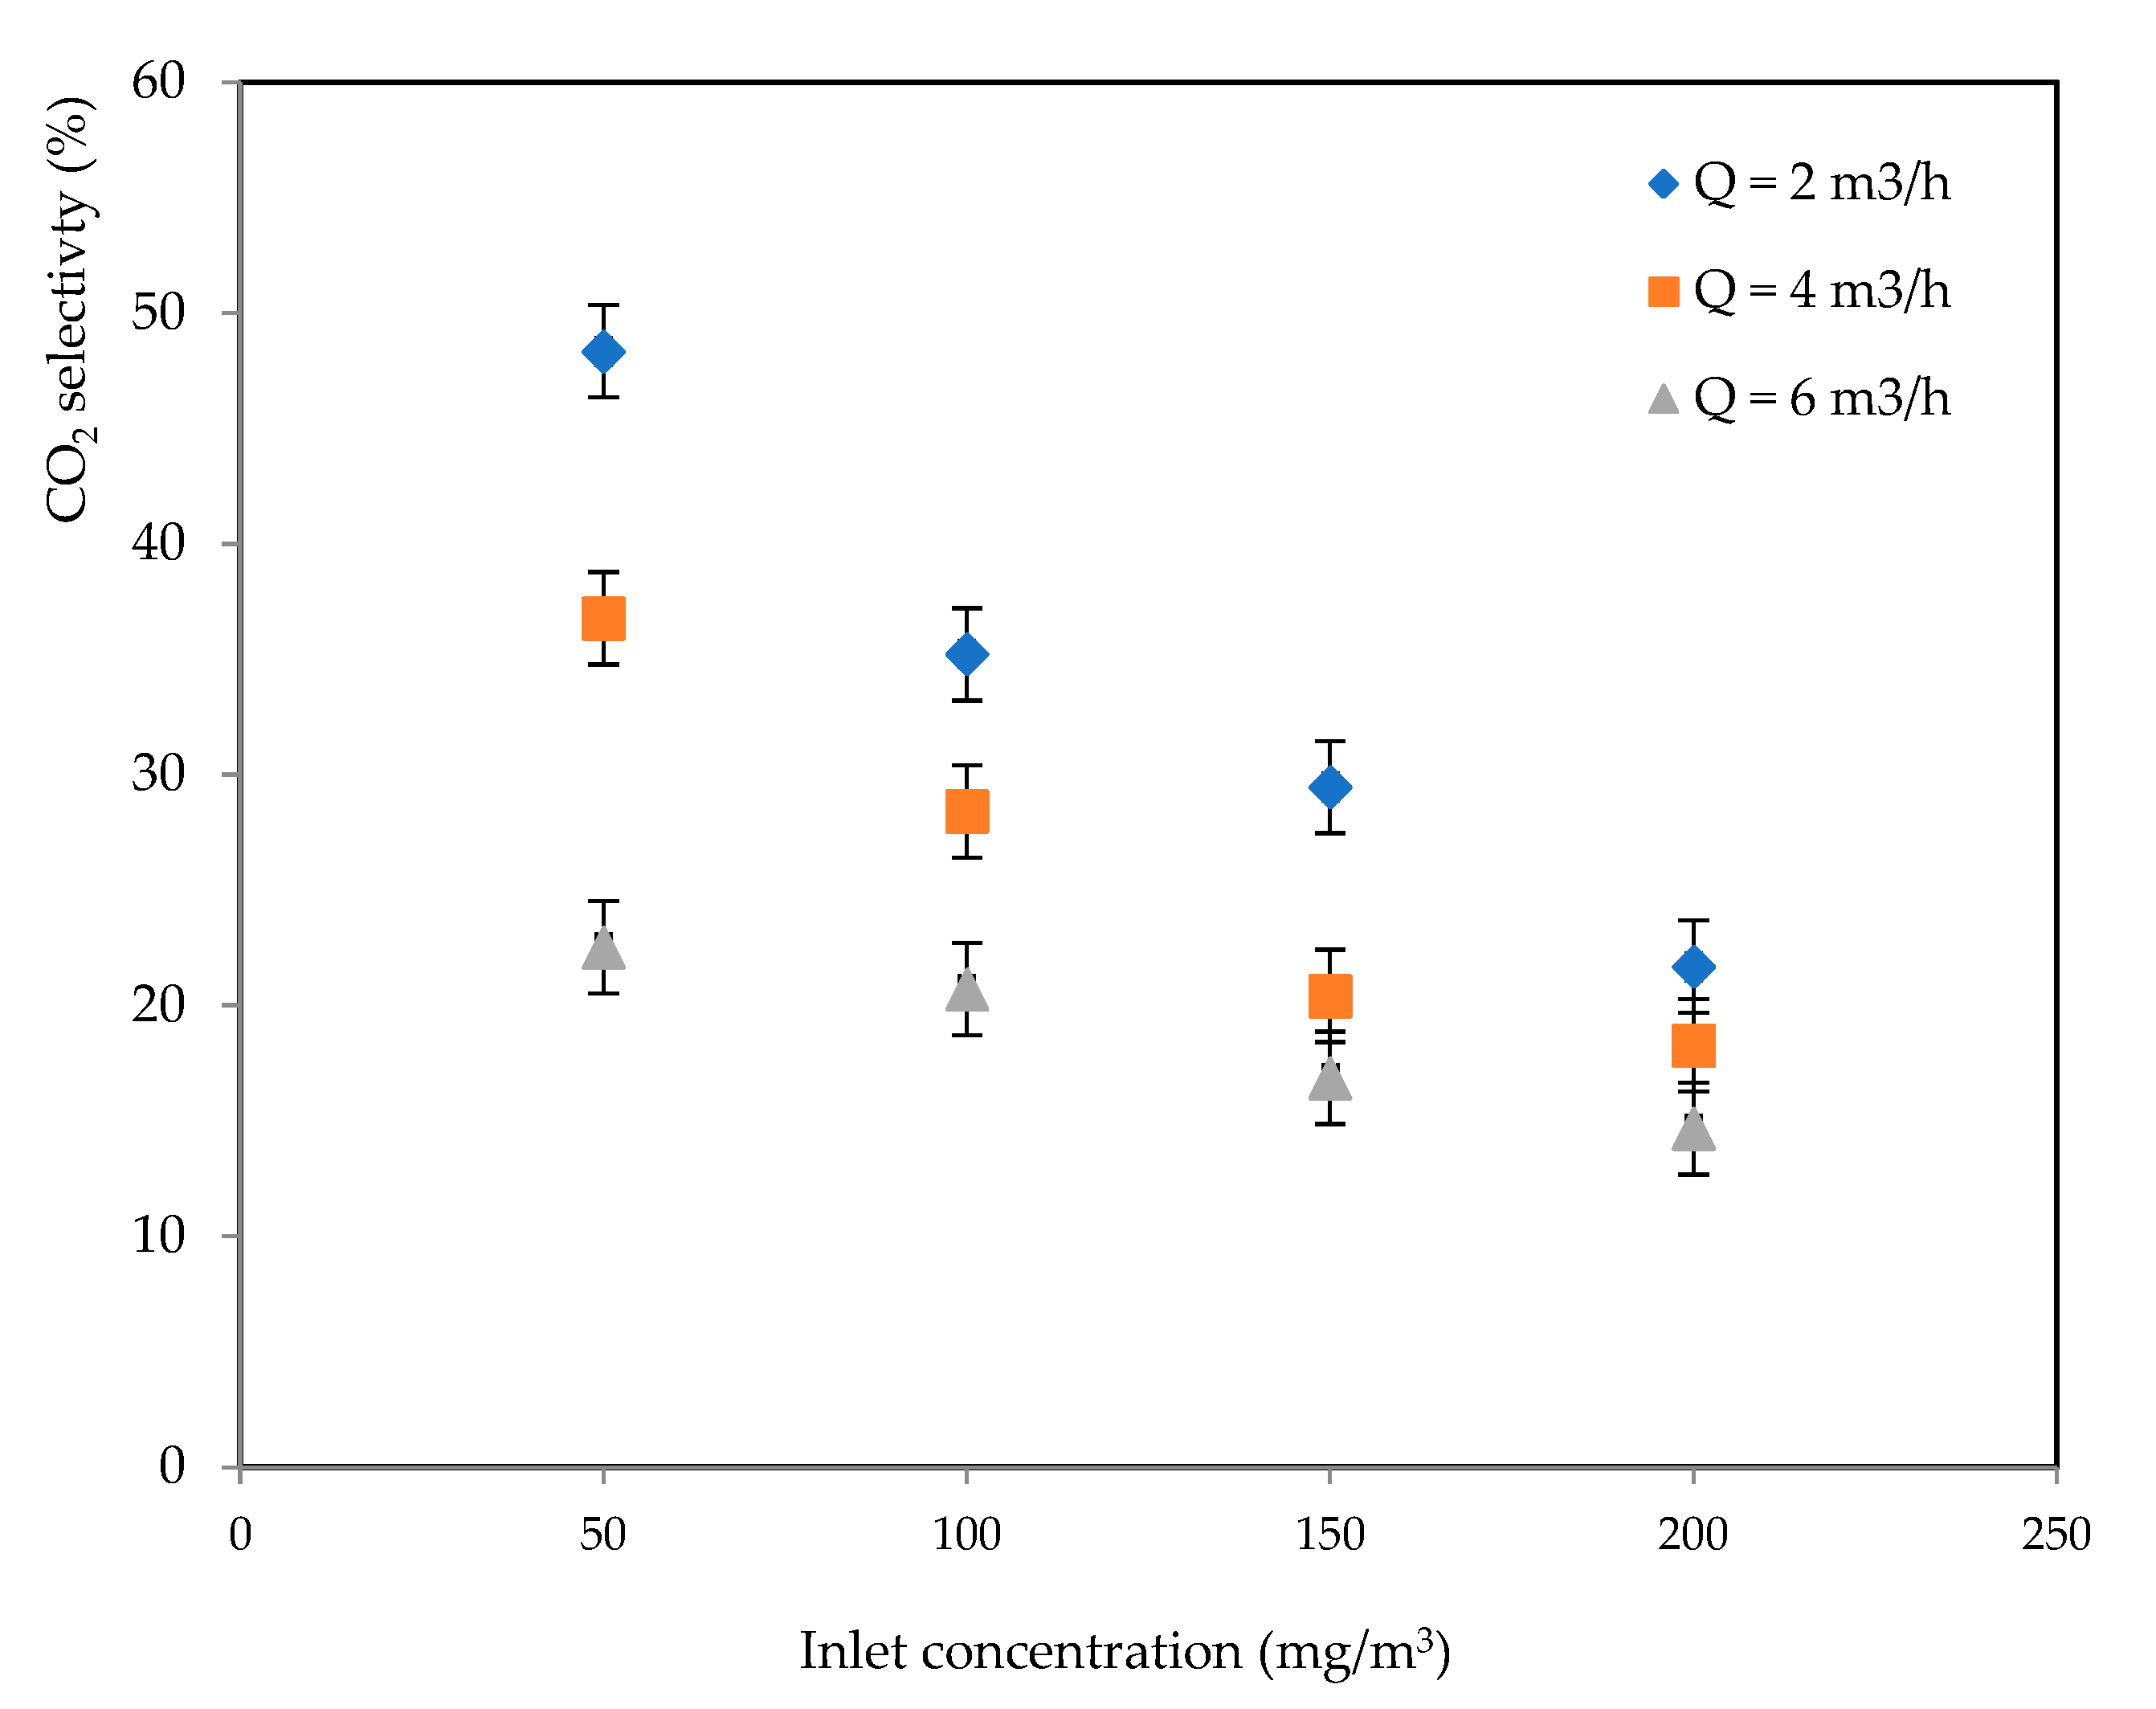
2.2.2. CO2 Selectivity

The performance of the photocatalytic rectangular reactor during the oxidation of valeric acid can be evaluated by calculating the selectivity of CO2. The evolution of CO2 selectivity, as produced during photocatalysis, can be derived using Equation (2) and is shown in Figure 4. It was observed that the variation of CO2 selectivity was inversely proportional to the inlet concentration. A similar behavior was also observed for CO2 selectivity with the same operating parameters for butyric acid.
The selectivity of CO2 decreased with increasing inlet concentration (ranging from 50 to 200 mg/m3) and air flow rate (Q = 2, 4, and 6 m3/h). For a flow rate of Q = 2 m3/h, the CO2 selectivity decreased from 48.34% at an inlet concentration of 50 mg/m3 to 21.68% at an inlet concentration of 200 mg/m3. Similarly, for a flow rate of Q = 6 m3/h, the selectivity decreased from 22.52% at an inlet concentration of 50 mg/m3 to 14.66% at an inlet concentration of 200 mg/m3.

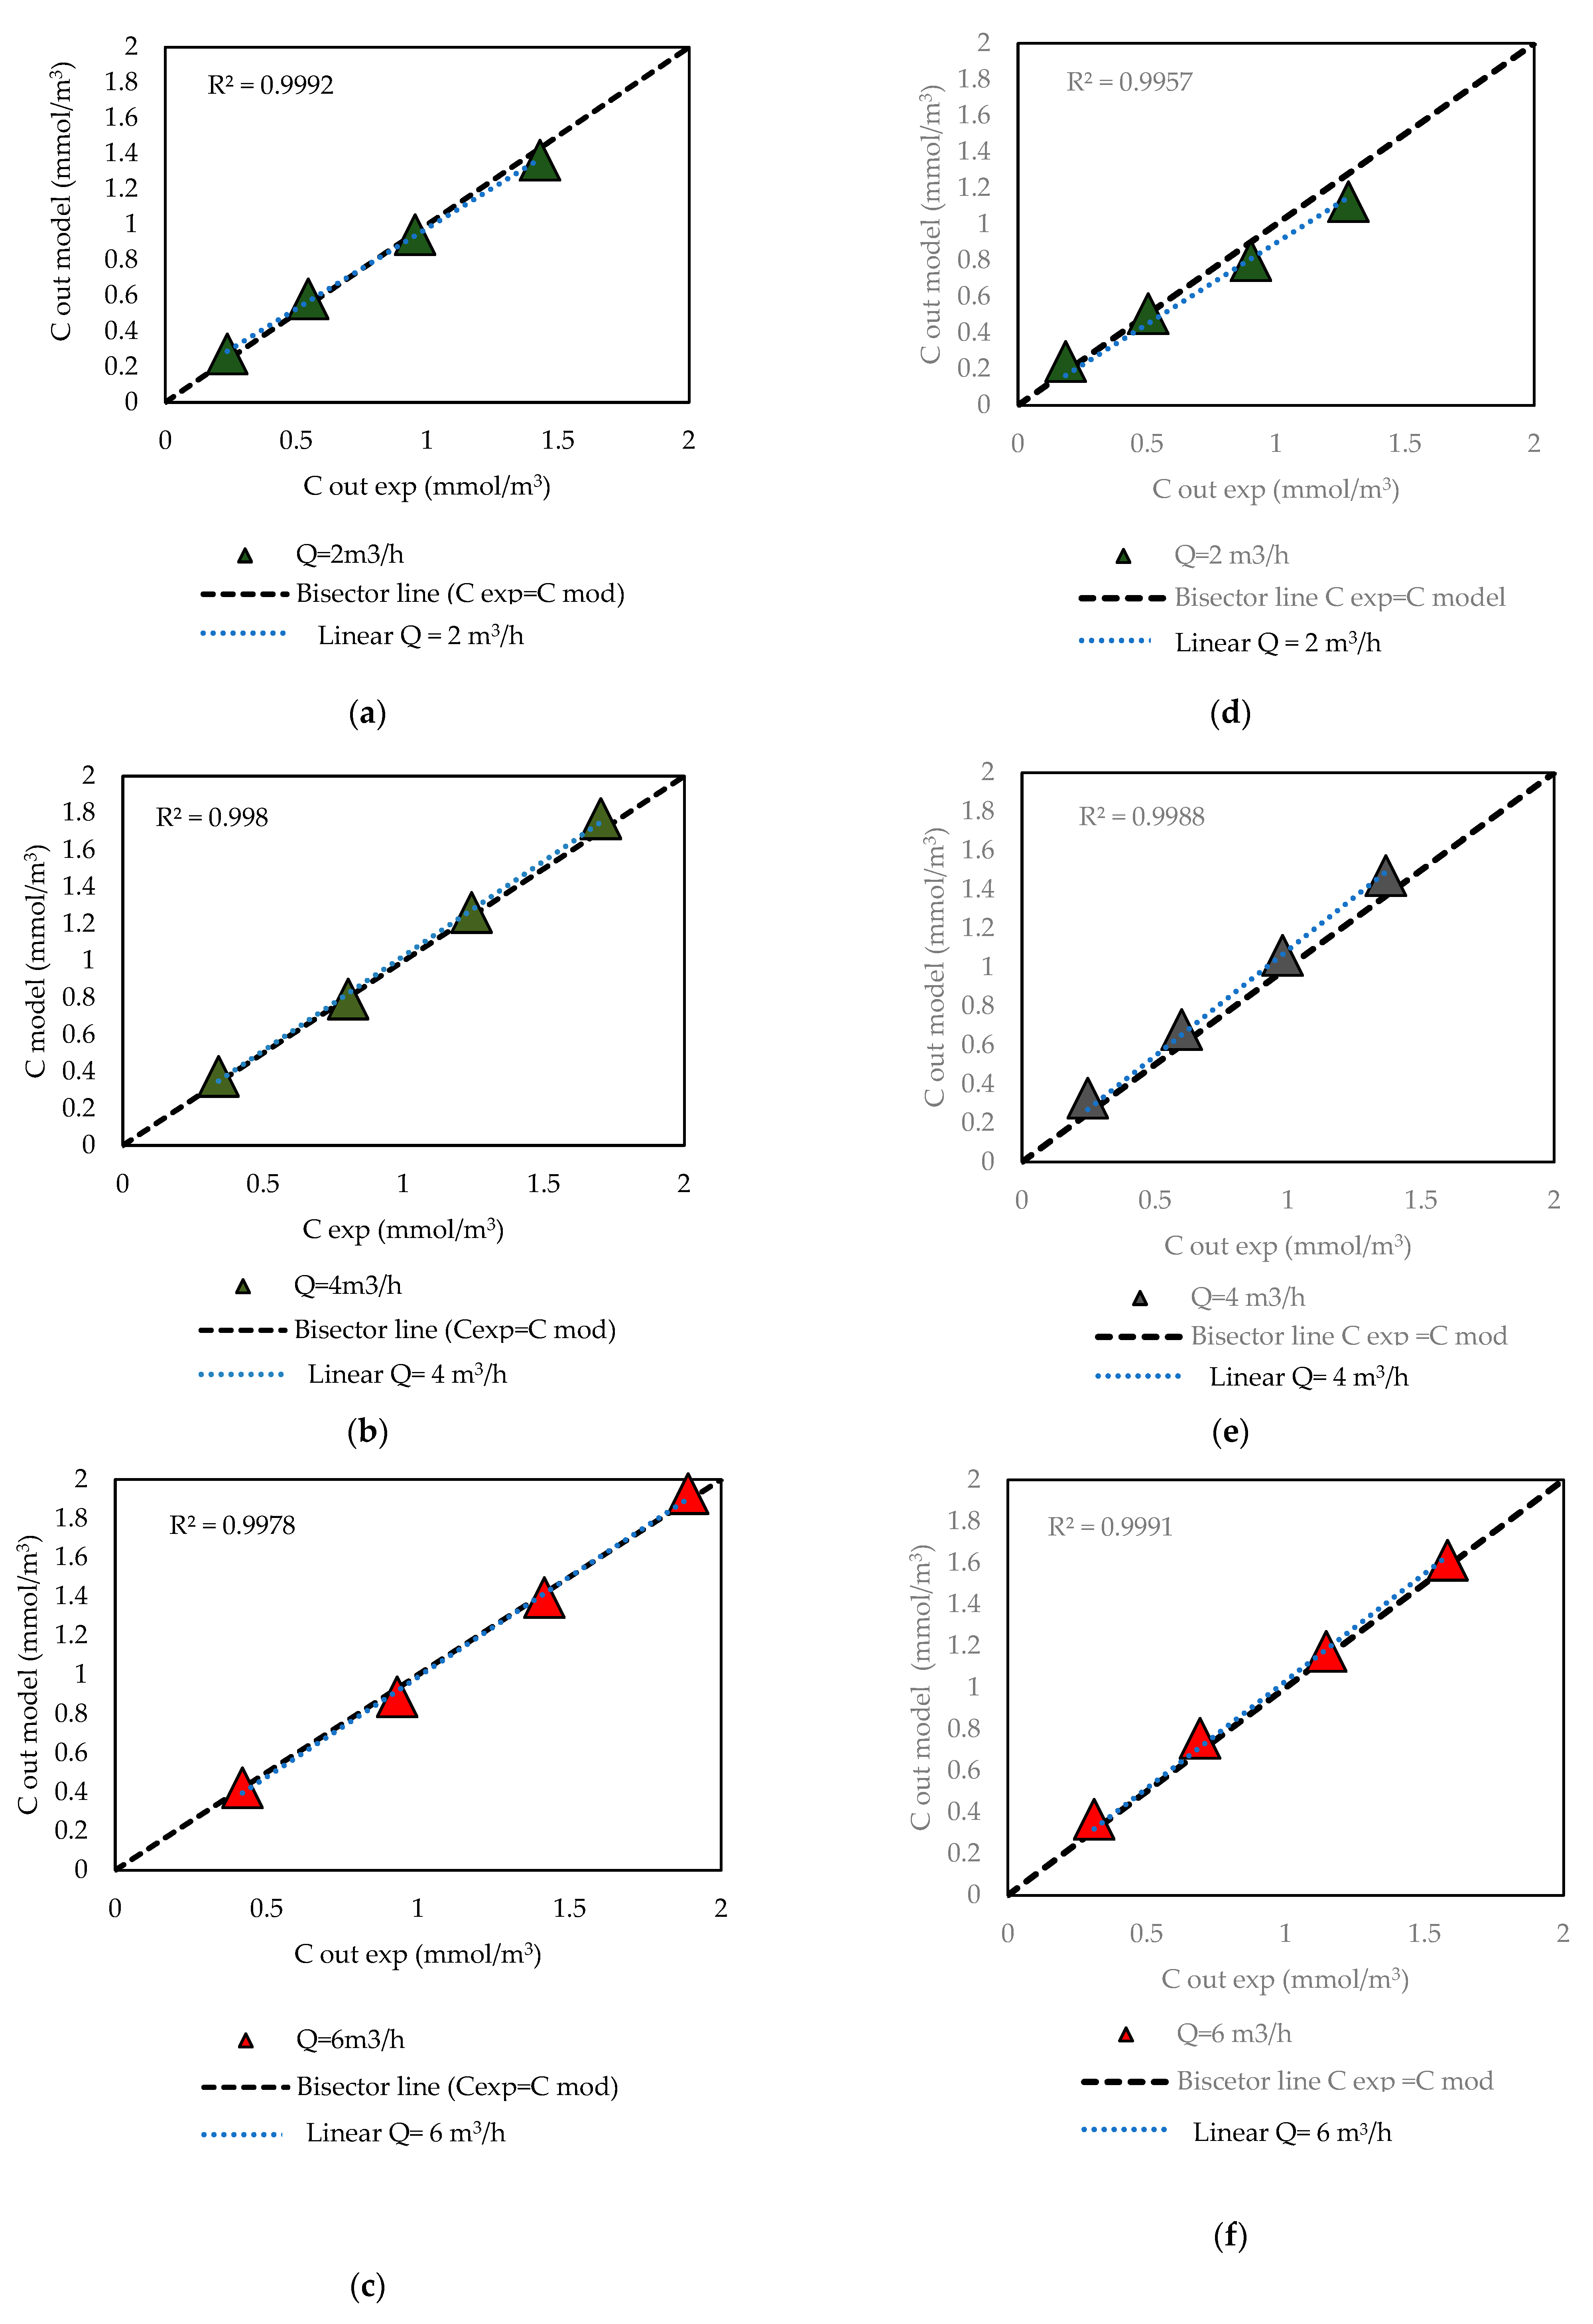
2.3. Kinetic Modeling of Reaction Kinetics with Mass Transfer Consideration

The kinetics of heterogenous photocatalytic reactions of butyric acid and valeric acid can be studied by applying the Langmuir–Hinshelwood (L–H) model with external mass transfer consideration. The model assumes that the pollutants are first adsorbed on the active sites of the catalyst before the reaction occurs, and the competition effect between by-products can be neglected. Many authors have formulated the kinetics of VOC photocatalysis following this model [28,29,30].
Mass balance in gas phase:
u d C b d z + k m a v C b C s = 0 .
Mass balance in solid phase:
k m a v C b C s = k K C s 1 + K C s ,
where Cb and Cs (mmol/m3) are the bulk and surface concentrations in (mmol/m3) respectively; u is the gas flow velocity (m/s); km is the mass transfer coefficient (m/s); and a v is the specific area per unit volume of the reactor (m2/m3).
This reactor is assumed to behave as a continuous plug flow reactor, a hypothesis confirmed in our previous study [7].
The mass transfer coefficient km was determined using a semi-empirical correlation based on Sherwood (Sh), Schmidt (Sc), and Reynolds (Re) numbers.
The molecular diffusivity (Dm) of the pollutants in air can be expressed as follows (5) according to Perry et al.
D m = 1.013 × 10 7 × T 1.75 [ ( v ) a i r 1 3 + ( v ) p o l 1 3 ] ² × ( 1 M a i r   + 1 M p o l ) 0.5 ,
where T is the temperature in K; (∑υ)air and (∑υ)pol are the molecular volumes of air and the pollutant, respectively; and Mair and MPol are the molecular weights of air and pollutant (g/mol).
The diffusivity coefficients are calculated and presented in Table 1.
Mass transfer coefficients and Reynolds numbers are summarized in Table 2.
After a second-order development of Equations (3) and (4), Equation (6) was obtained.
C i n C o u t = L k m a v 2 u × [ C i n + 1 K + k k m a v k k m a v C i n + 1 K ² + 4 C i n K ] .
The values of k and K are summarized in Table 3.
In this equation, the unknown parameters are k and K, which are determined using Excel Solver (version 16.0). A good fit with the experimental results was achieved (Figure 5a–f).

2.4. Oxidation of Binary Mixture Pollutants

The experiment involved injecting a mixture of butyric and valeric acids with different molar proportions (25%, 50%, and 75%) into the inlet air. The inlet concentration was varied (50, 100, 150, and 200 mg.m−3), and the air flow rate was set at 2, 4, and 6 m3/h. The photocatalysis process, which used TiO2 as catalyst and UV light was employed, and the results of mixture removal are shown in Figure 6.
For the first binary mixture pollutant (25% butyric acid + 75% valeric acid), the highest removal efficiency of 60.71% was achieved at an inlet concentration of 50 mg.m−3 and a flow rate of 2 m3/h. However, at higher pollutant concentrations (Cinlet = 200 mg.m−3) and a flow rate of 6 m3/h, the removal efficiency was significantly reduced to less than 17%.
For the second binary mixture pollutant (50% butyric acid + 50% valeric acid), the maximum removal efficiency of 47% was obtained at an inlet concentration of 50 mg.m−3 and a flow rate of 2 m3/h. Similarly, at higher pollutant concentrations (Cinlet = 200 mg.m−3), the removal efficiency dropped to approximately 14.5%.
For the third binary mixture pollutant (75% butyric acid + 25% valeric acid), the maximum removal efficiency of 41.18% was achieved at an inlet concentration of 50 mg.m−3 and a flow rate of 2 m3/h. Conversely, the lowest removal efficiency was recorded at higher pollutant concentrations (Cinlet = 200 mg.m−3), reaching 12.37%.

2.5. CO2 Selectivity

Flow rates of 2, 4, and 6 m3/h were applied to investigate their influence on the performance of the photocatalytic rectangular reactor. The CO2 selectivity of the tested binary mixture pollutants, consisting of butyric and valeric acids, at different inlet concentrations (0%, 25%, 50%, 75%, and 100% of valeric acid) using the photocatalysis process in the rectangular reactor, is presented in Figure 7.
The photocatalysis process proved effective in mineralizing organic acids, including butyric, valeric, and their mixtures at different concentrations of valeric acid (0, 25, 50, 75 and 100%). Based on our conditions, it is important to note that previous studies show that each carboxylic acid (butyric or isovaleric acid) is not a by-product of the other during photocatalytic degradation processes [7,28,30].
It is observed that at higher concentrations of mixture pollutants and flowrate of 6 m3/h, the CO2 selectivity was less than 15%. This can be attributed to the limited availability of active sites and competition effects.
Moreover, Figure 7 revealed an interesting trend: with increasing percentages of the pollutant mixture, the mineralization rates were reduced compared to the selectivity observed for pure pollutants. This phenomenon can be attributed to the recombination of intermediate products, which hinders complete mineralization. Optimal results were achieved at lower flow rates, specifically at an inlet flow rate of 2 m3/h and a concentration of 0.56 mmol/m3. For each percentage of pollutant mixture, increasing the flow rate led to a decline in mineralization. This reduction is likely due to shorter residence times within the reactor, which limit the time available for pollutant molecules to react.

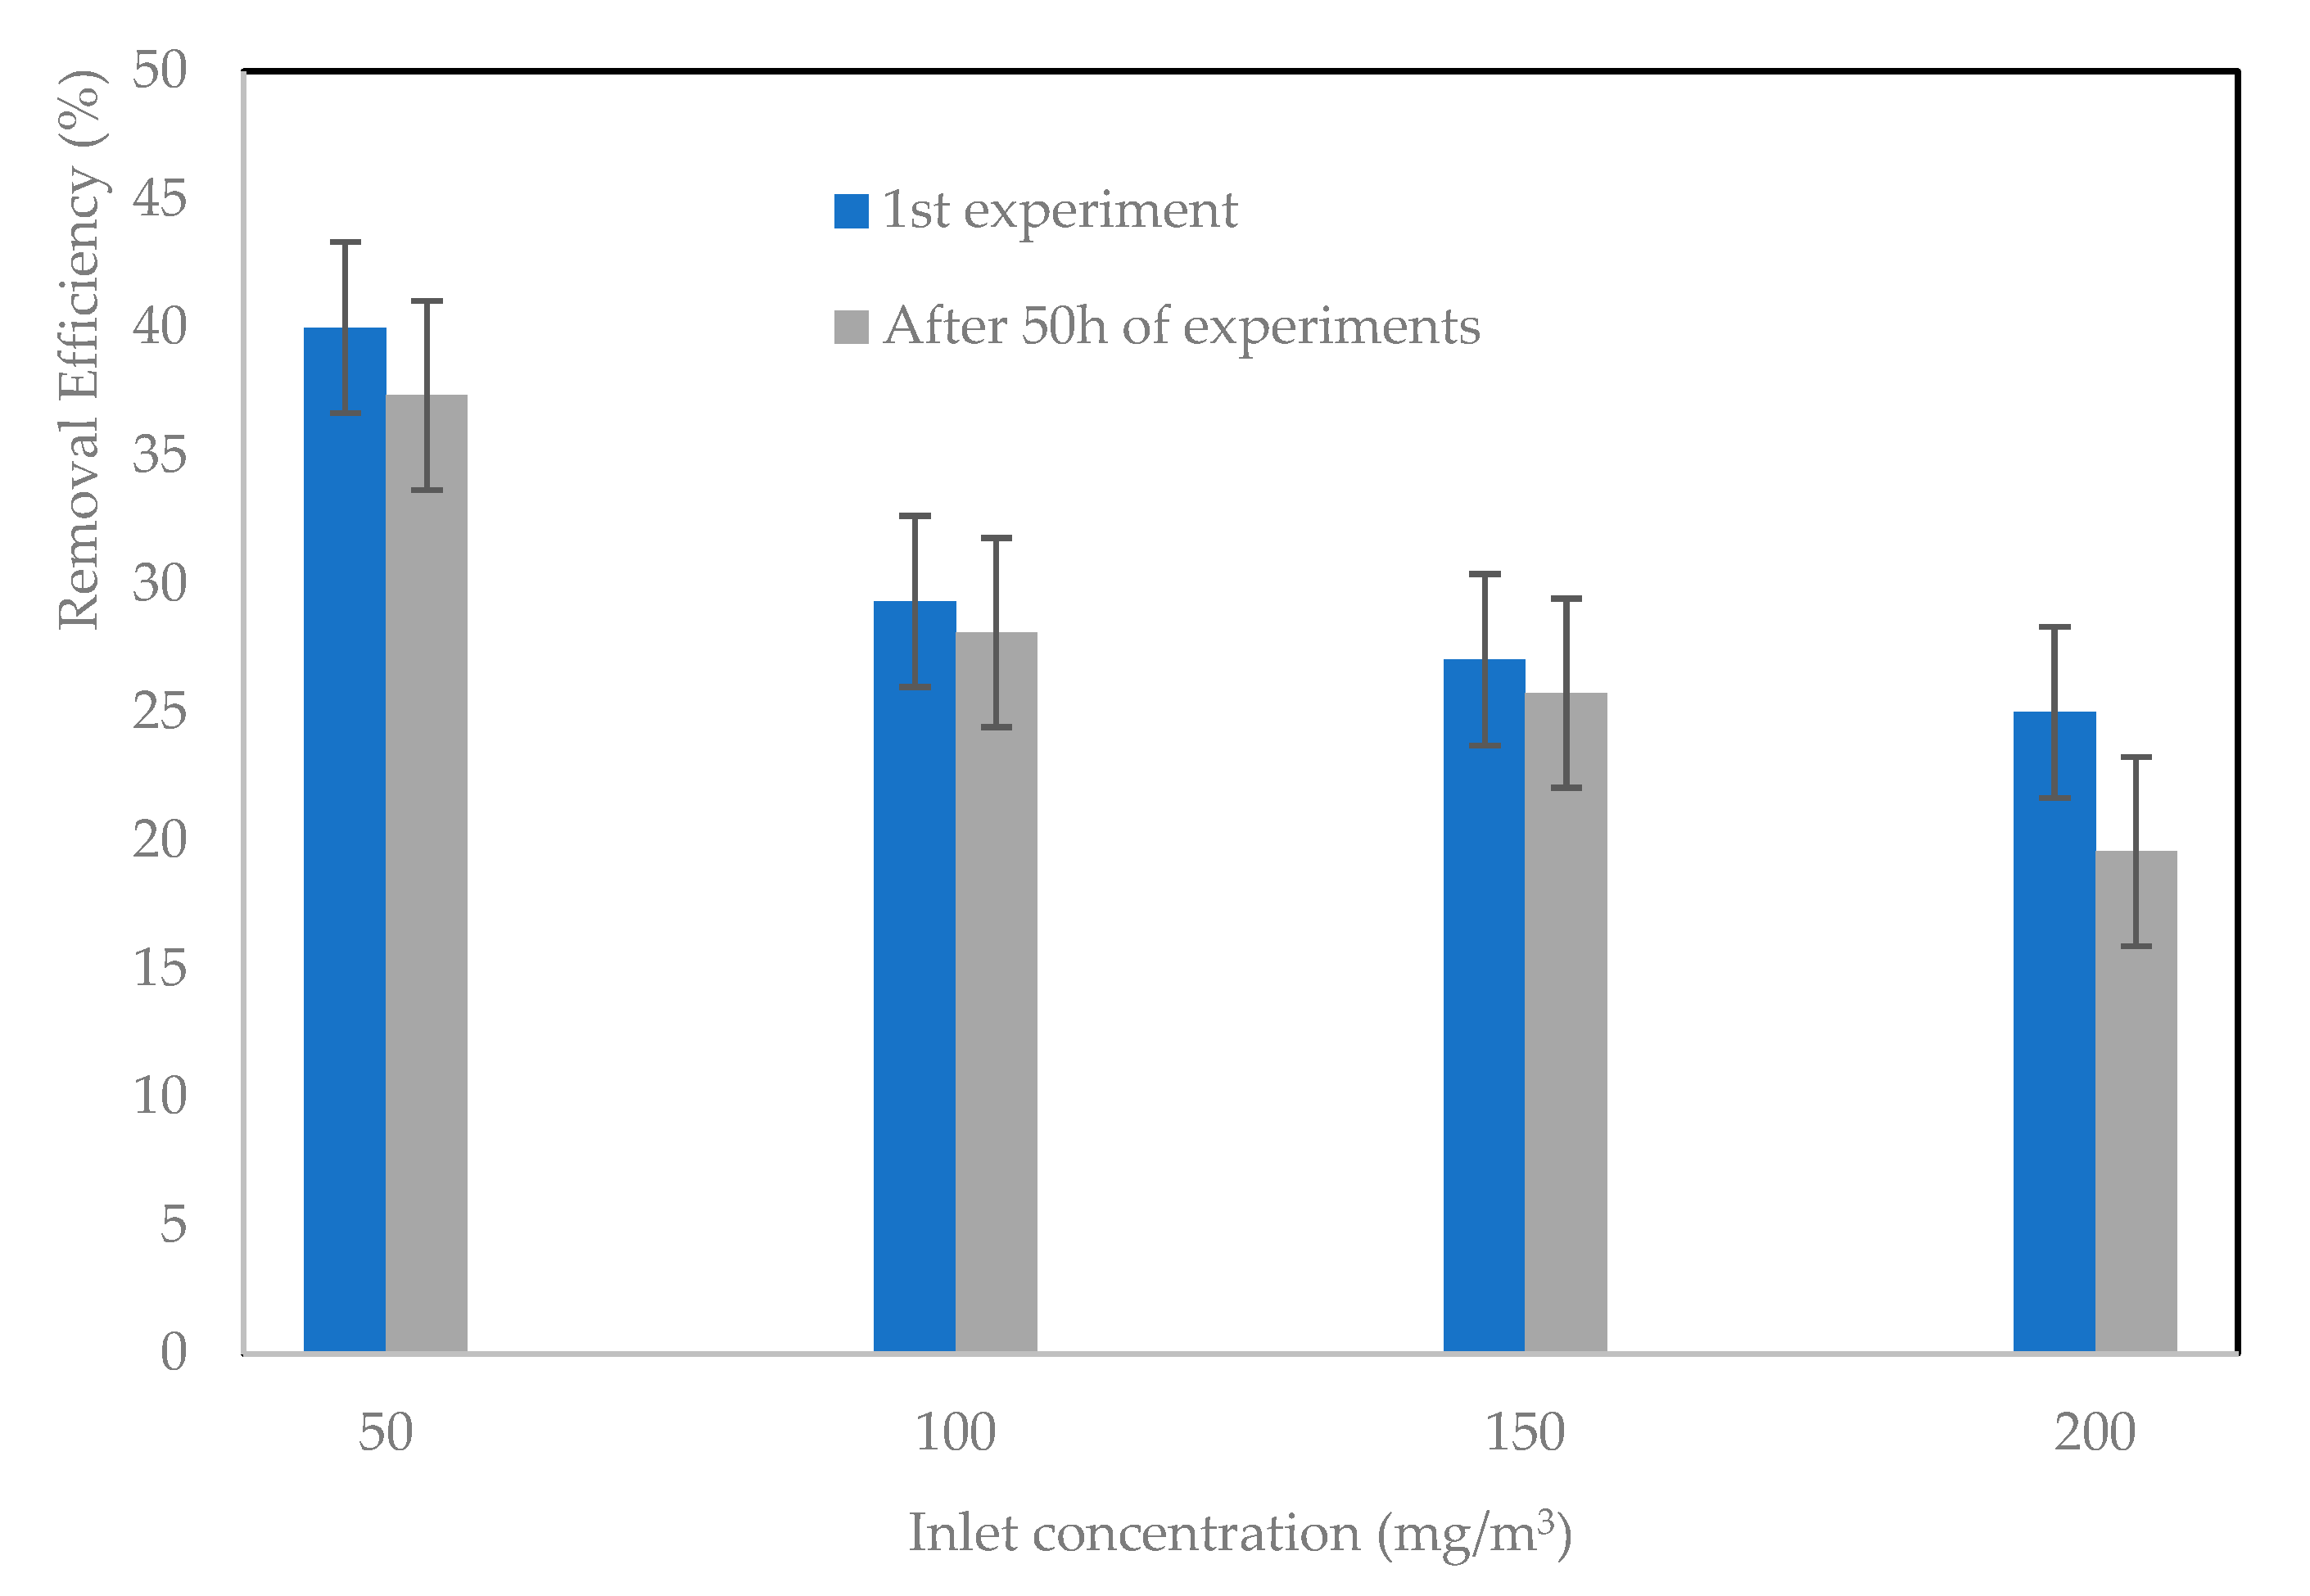
2.6. Reusability and Catalyst Stability

Tests conducted on the TiO2 on GFT, both in its initial (clean) state and after 50 h of the photocatalytic treatment of butyric acid, showed a 15% reduction in efficiency (Figure 8). A significant reduction was observed at high concentrations.
This decline in performance is partially attributed to the accumulation of by-products on the catalyst surface, which initiates the poisoning of the catalytic material. Despite periodic regeneration of the catalyst using an air flow every 8 h during operation, this process proved insufficient to fully remove the deposited residues, thereby affecting its overall efficiency. These findings underscore the challenges associated with maintaining photocatalyst performance when treating pollutant mixtures over extended periods.

3. Materials and Methods

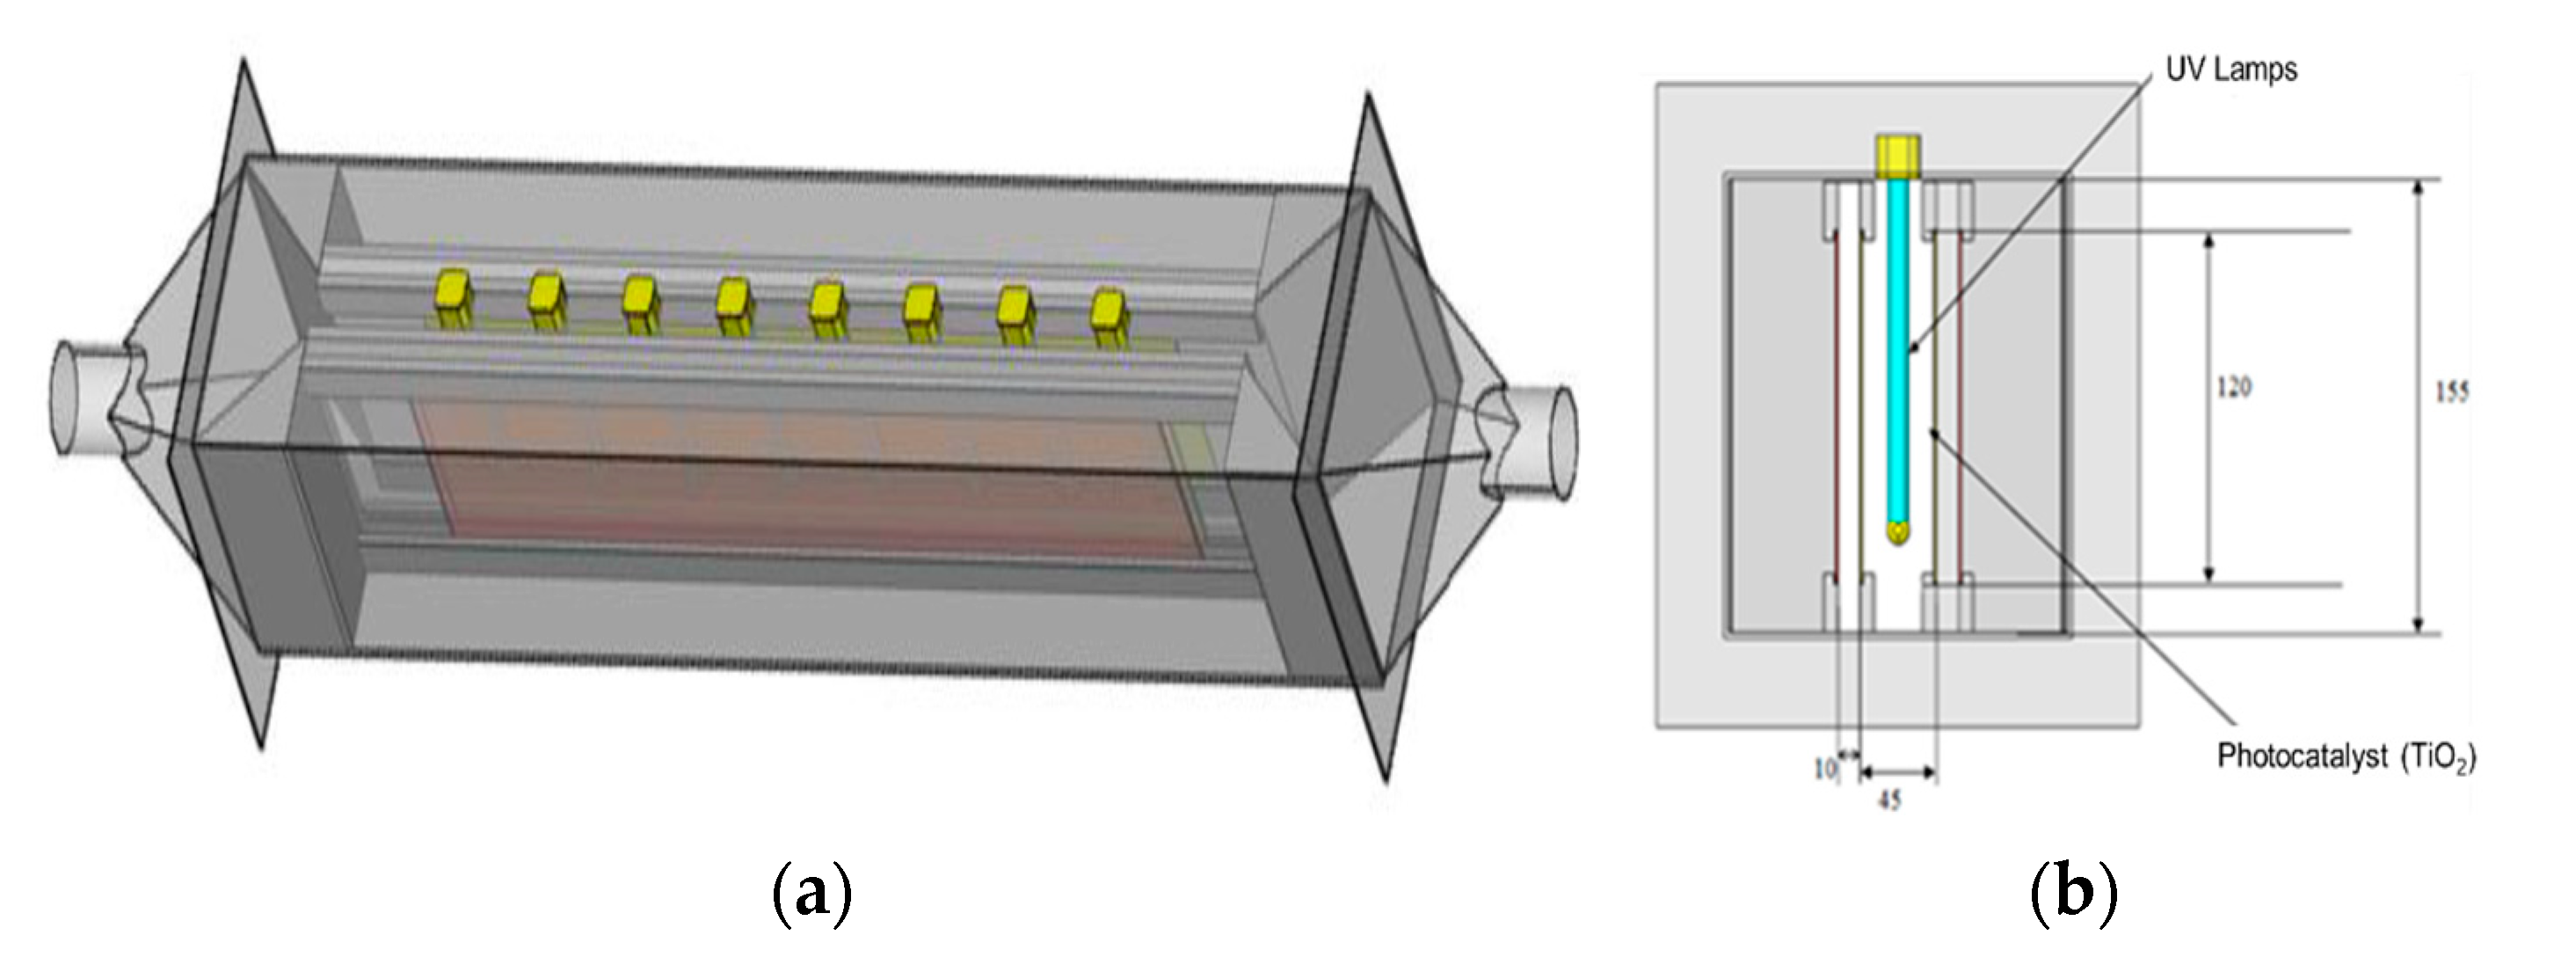
3.1. Rectangular Reactor
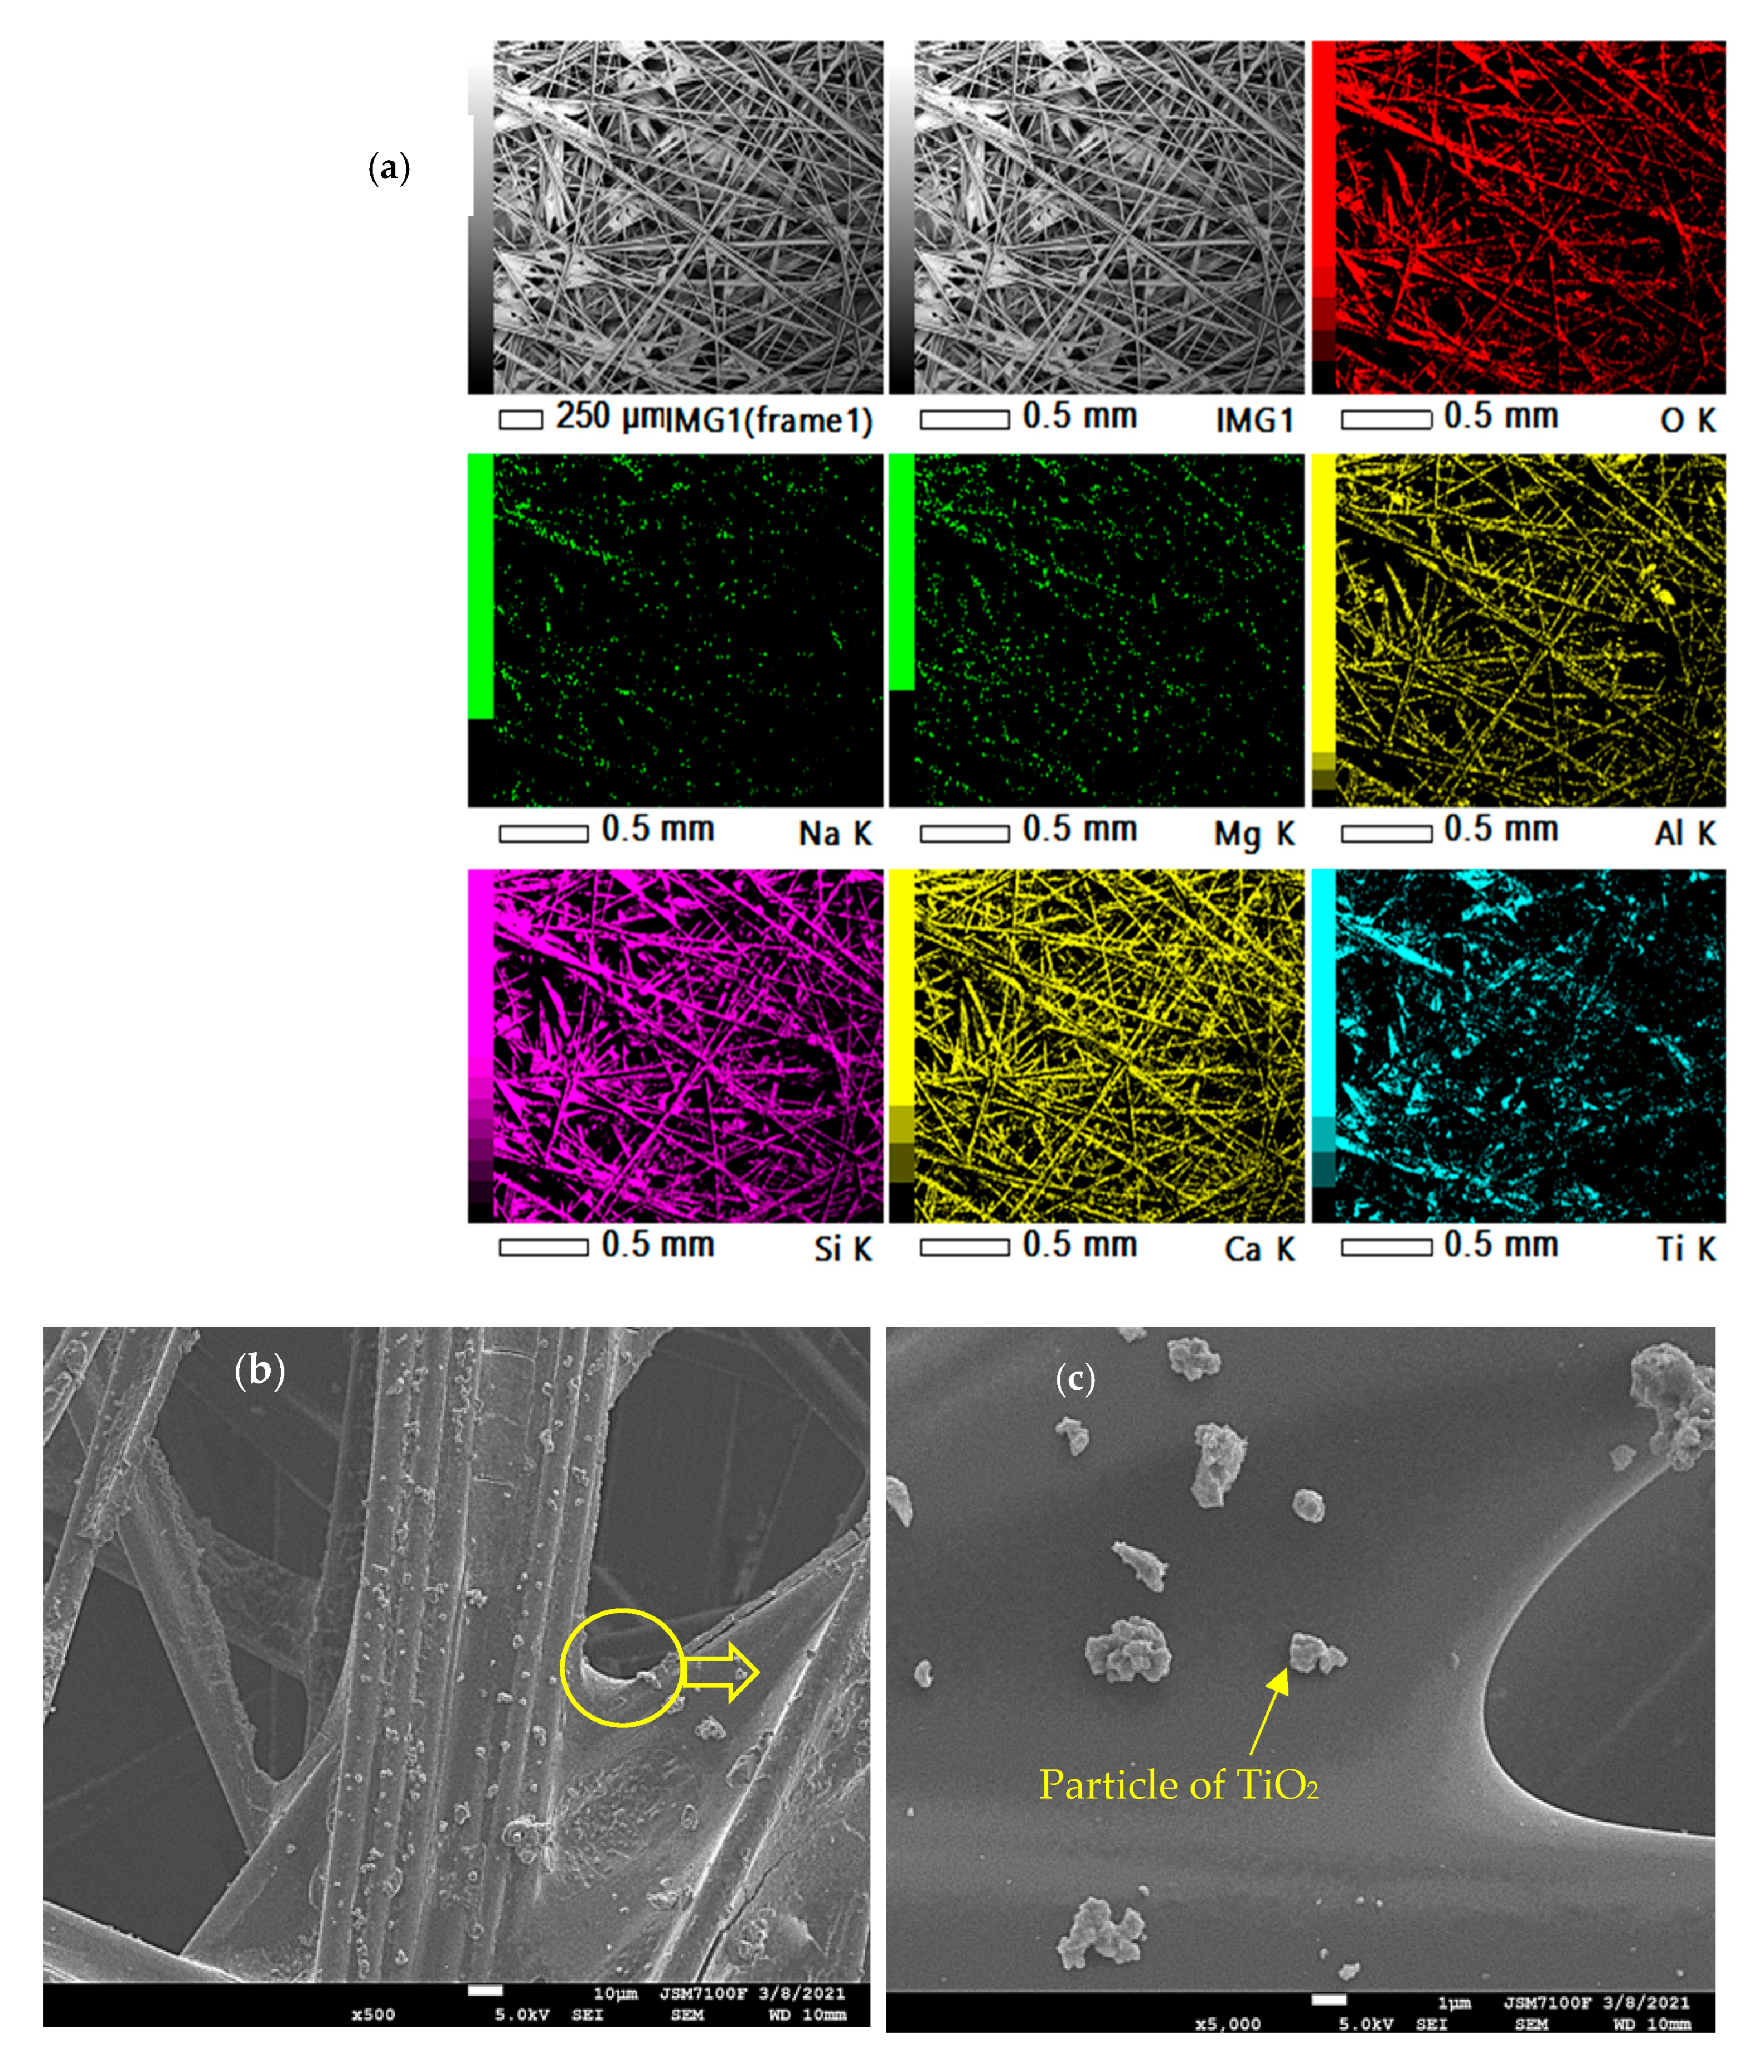
The reactor consists of a rectangular glass chamber (length L = 1000 mm, width l = 135 mm and height H = 135 mm). Two glass plates are installed parallel to the length of the reactor to support the catalyst (Figure 9). UV lamps arranged inside the reactor activate the photocatalyst. The TiO2 catalyst and eight lamps (Philips under reference PL-S 9W/10/4P) are separated by an air gap within the reactor and are positioned to ensure optimal radiation distribution [7].
The rectangular reactor has two openings, one upstream and one downstream, each fitted with a septum. These openings allow sampling of the inlet and outlet gases using a 1 mL syringe [8].

3.2. Catalyst

The supported material used in this study is called Glass Fiber Tissue (GFT), which contains 13 g/m2 of titanium dioxide nanoparticles along with inorganic fibers. The coating process involves impregnating the glass fibers with a suspension of TiO2 nanoparticles in pure water. This impregnation is performed using an industrial size-press called PC500 Millennium. The TiO2 nanoparticles used, which were purchased from Sigma-Aldrich (Saint Louis, MO, USA), have a specific surface area of 300 m2/g [3,27]. In fact, the two rollers resting on each other rotate in opposite directions. A sheet made of fibers to be coated can be introduced and pulled between the rollers. The particles to be deposited are suspended in water. The GFT microfibers + liquid TiO2 passes with the fibrous supports between the rollers, which promotes its penetration into the material. The suspension of TiO2 particles allows for deposition on the surface of the fibers, but this coating has poor mechanical strength. To improve this, and thus facilitate handling, colloidal silica particles are added to the suspension. By coating the fibers, they act as a binder and allow better adhesion of the TiO2 particles to the surface of the fibrous materials.
Scanning Electron Microscopy (SEM-Hitachi, Tokyo, Japan) was used to analyze the morphology and composition of the GFT material. The SEM image (Figure 10) revealed the fibrous structure and the deposited TiO2 nanoparticles. Energy Dispersive X-ray (EDX) mapping confirmed the presence of different components of the flexible substrate (GFT) and showed the dispersion of titanium and oxygen nanoparticles, which are components of TiO2 [7]. SEM images illustrate the deposition of TiO2 nanoparticles with different sizes onto the fibrous support.

3.3. Polluted Flow Generation

The mass flow rate of the generated flow is regulated using a Bronkhorst In-Flow mass flow meter (Gelderland, The Netherlands), with flow rates set at 2, 4, and 6 m3/h. The pollutants, butyric and valeric acids, were injected simultaneously and continuously as a binary mixture into the gas stream. Different molar fractions (0.25, 0.5, and 0.75) of the pollutants in liquid form were introduced using a syringe/syringe driver system (KdScientific Model 100, Holliston, MA, USA) through a septum. To ensure the effective evaporation of each pollutant, a heating tape was wrapped around the injection zone of the pipe. A static mixer was used to homogenize the upstream effluent (Figure 11). All experiments were conducted at room temperature and atmospheric pressure [7].

3.4. Analysis System

The analysis of the binary mixture of butyric and valeric acids was carried out using a gas chromatograph (Focus GC, Thermo Electron Corporation, Waltham, MA, USA) equipped with a flame ionization detector (FID) and a Chrompact FFAP-CB column. Nitrogen was used as a carrier gas, serving as the mobile phase. The temperature conditions in the oven, the injection chamber and the detector are, respectively, 100, 120, and 200 °C. All injections were manually performed using a 1 mL syringe, with each injection repeated at least twice for accuracy. The syringe was cleaned by pressurized air to avoid cross-contamination.

3.5. Experimental Protocol

The photocatalytic degradation by UV light irradiation starts after an adsorption operation. During this phase, compressed ambient air transports two organic acids or their binary mixture at different concentrations through the rectangular reactor, which contains 0.2 m2 of GFT support. This phase, which is operated under continuous flow, ensures that the catalyst reaches equilibrium with the gas phase charged with volatile organic compounds. After 30 min, the photocatalytic degradation begins. The catalyst is irradiated by eight UV lamps with a constant intensity of 20 W/m2. Input and output concentrations are measured three times to ensure a steady state. Four initial concentrations of organic compounds are set, ranging from 50 to 200 mg/m3, while air flow rates vary from 2 to 6 m3/h.

4. Conclusions

This study investigates the remediation of a pollutant mixture containing butyric and valeric acids using photocatalysis (TiO2 + UV) and examines the influence of inlet concentration, flow rate, and CO2 selectivity in a rectangular reactor. The removal efficiency of the mixture follows the sequence: (75 Butyric + 25 Valeric) < (50 Butyric + 50 Valeric) < (25 Butyric + 75 Valeric), and the removal efficiency decreases with higher flow rates. Moreover, with the increasing percentage of the pollutant mixture, the mineralization rates were reduced compared to the selectivity observed for pure pollutants. Optimal results were achieved at lower flow rates, specifically at an inlet flow rate of 2 m3/h and a concentration of 0.56 mmol/m3. A simulation model based on the mass transfer and catalytic oxidation steps was developed and validated the experimental data for of each pollutant.
Despite the stability and efficiency, the results show that the performance cannot be maintained at the same level over a 50 h operating period, even with air regeneration every 8 h. To enhance catalytic activity, a plausible association is combining titanium dioxide photocatalysis with other processes such plasma treatment, which generates additional reactive species and promotes catalyst surface regeneration, thereby reducing poisoning.

Author Contributions

Conceptualization, A.A.A.; writing—original draft preparation, A.A.T., M.A., N.B. and M.-A.H.; writing—review and editing, A.A.A. and W.E.; supervision, A.A.A.; project administration, A.A.A.; funding acquisition, A.A.A. All authors have read and agreed to the published version of the manuscript.

Funding

This work was supported and funded by the Deanship of Scientific Research at Imam Mohammad Ibn Saud Islamic University (IMSIU) (grant number IMSIU-DDRSP2502).

Data Availability Statement

The datasets used and/or analyzed during the current study are available from the corresponding author on reasonable request.

Conflicts of Interest

The authors declare no conflicts of interest.

References

  1. Binjhade, R.; Mondal, R.; Mondal, S. Continuous photocatalytic reactor: Critical review on the design and performance. J. Environ. Chem. Eng. 2022, 10, 107746. [Google Scholar] [CrossRef]
  2. Kovalevskiy, N.S.; Lyulyukin, M.N.; Selishchev, D.S.; Kozlov, D.V. Analysis of air photocatalytic purification using a total hazard index: Effect of the composite TiO2/zeolite photocatalyst. J. Hazard. Mater. 2018, 358, 302–309. [Google Scholar] [CrossRef]
  3. Guo, H.; Su, Y.; Yang, X.; Wang, Y.; Li, Z.; Wu, Y.; Ren, J. Dielectric Barrier Discharge Plasma Coupled with Catalysis for Organic Wastewater Treatment: A Review. Catalysts 2023, 13, 10. [Google Scholar] [CrossRef]
  4. Li, X.; Wang, S.; Zhang, X.; Mei, D.; Xu, Y.; Yu, P.; Sun, Y. Nonthermal plasma catalysis enhances simultaneous removal of toluene and ozone over TiO2@ZIF-8. J. Clean. Prod. 2022, 332, 130107. [Google Scholar] [CrossRef]
  5. Rosa, D.; D’Agostino, F.; Bavasso, I.; Di Palma, L. An Innovative and Easy Method for Iron-Doped Titania Synthesis. Chem. Eng. Trans. 2023, 101, 13–18. [Google Scholar]
  6. Karoui, S.; Saoud, W.A.; Ghorbal, A.; Fourcade, F.; Amrane, A.; Assadi, A.A. Intensification of non-thermal plasma for aqueous Ciprofloxacin degradation: Optimization study, mechanisms, and combined plasma with photocatalysis. J. Water Process Eng. 2022, 50, 103207. [Google Scholar] [CrossRef]
  7. Saoud, W.A.; Belkessa, N.; Azzaz, A.A.; Rochas, V.; Mezino, V.; Presset, M.A.; Lechevin, S.; Genouel, A.; Rouxel, S.; Monsimert, D.; et al. Pilot scale investigation of DBD-Plasma photocatalysis for industrial application in livestock building air: Elimination of chemical pollutants and odors. Chem. Eng. J. 2023, 468, 143710. [Google Scholar] [CrossRef]
  8. Xue, Y.; Sun, W.; Shao, P.; Yuan, Y.; Cui, F.; Shi, W. Degradation of contaminants of PPCPs by photocatalysis for water purification: Kinetics, mechanisms, and cytotoxicity analysis. Chem. Eng. J. 2023, 454, 140505. [Google Scholar] [CrossRef]
  9. Wang, J.; Huang, D.; Chen, F.; Chen, J.; Jiang, H.; Zhu, Y.; Chen, C.; Zhao, J. Rapid Redox Cycling of Fe(II)/Fe(III) in Microdroplets during Iron-Citric Acid Photochemistry. Environ. Sci. Technol. 2023, 57, 4434–4442. [Google Scholar] [CrossRef]
  10. Yu, H.; Wang, M.; Yan, J.; Dang, H.; Zhu, H.; Liu, Y.; Wen, M.; Li, G.; Wu, L. Complete mineralization of phenolic compounds in visible-light-driven photocatalytic ozonation with single-crystal WO3 nanosheets: Performance and mechanism investigation. J. Hazard. Mater. 2022, 433, 128811. [Google Scholar] [CrossRef]
  11. Lyulyukin, M.N.; Kolinko, P.A.; Selishchev, D.S.; Kozlov, D.V. Hygienic aspects of TiO2-mediated photocatalytic oxidation of volatile organic compounds: Air purification analysis using a total hazard index. Appl. Catal. B Environ. 2018, 220, 386–396. [Google Scholar] [CrossRef]
  12. Mota, H.P.; Quadrado, R.F.N.; Iglesias, B.A.; Fajardo, A.R. Enhanced photocatalytic degradation of organic pollutants mediated by Zn(II)-porphyrin/poly(acrylic acid) hybrid microparticles. Appl. Catal. B Environ. 2020, 277, 119208. [Google Scholar] [CrossRef]
  13. de Oliveira, R.; Sant’Ana, A.C. Plasmonic photocatalytic degradation of tebuconazole and 2,4-dichlorophenoxyacetic acid by Ag nanoparticles-decorated TiO2 tracked by SERS analysis. Chemosphere 2023, 338, 139490. [Google Scholar] [CrossRef]
  14. Pavel, M.; Anastasescu, C.; State, R.N.; Vasile, A.; Papa, F.; Balint, I. Photocatalytic Degradation of Organic and Inorganic Pollutants to Harmless End Products: Assessment of Practical Application Potential for Water and Air Cleaning. Catalysts 2023, 13, 380. [Google Scholar] [CrossRef]
  15. Milani, H.M.; Van Neste, B.; Cosaert, E.; Poelman, D. Assessing the Stability and Photocatalytic Efficiency of a Biodegradable PLA-TiO2 Membrane for Air Purification. Adv. Sustain. Syst. 2024, 9, 2400594. [Google Scholar] [CrossRef]
  16. Mbrouk, O.; Hafez, H.; Mozia, S.; Othman, A.M.; Mottaleb, M.S.A.A. Stimulated generation of photobiogas by morphologically tuned nanostructured ZnO and ZnO/TiO2. BMC Chem. 2022, 16, 74. [Google Scholar] [CrossRef]
  17. Baaloudj, O.; Assadi, I.; Nasrallah, N.; El Jery, A.; Khezami, L.; Assadi, A.A. Simultaneous removal of antibiotics and inactivation of antibiotic-resistant bacteria by photocatalysis: A review. J. Water Process Eng. 2021, 42, 102089. [Google Scholar] [CrossRef]
  18. Serhane, Y.; Belkessa, N.; Bouzaza, A.; Wolbert, D.; Assadi, A.A. Chemosphere Continuous air purification by front flow photocatalytic reactor: Modelling of the influence of mass transfer step under simulated real conditions. Chemosphere 2022, 295, 133809. [Google Scholar] [CrossRef] [PubMed]
  19. Kumar, S.; Kaushik, R.D.; Purohit, L.P. RGO supported ZnO/SnO2 Z-scheme heterojunctions with enriched ROS production towards enhanced photocatalytic mineralization of phenolic compounds and antibiotics at low temperature. J. Colloid Interface Sci. 2023, 632, 196–215. [Google Scholar] [CrossRef]
  20. Belkessa, N.; Serhane, Y.; Bouzaza, A.; Khezami, L.; Assadi, A.A. Gaseous ethylbenzene removal by photocatalytic TiO2 nanoparticles immobilized on glass fiber tissue under real conditions: Evaluation of reactive oxygen species contribution to the photocatalytic process. Environ. Sci. Pollut. Res. 2023, 30, 35745–35756. [Google Scholar] [CrossRef]
  21. Mahmoud, M.A.; Tayeb, A.M.; Abdel-Wahab, M.Z.; Ahmed, Z.A.; Bakather, O.Y.; Eldoma, M.A.; Abouatiaa, A.F.F. Degradation of oily effluents using immobilized photocatalyst: Laboratory experimentation and plant design. Alex. Eng. J. 2023, 65, 295–305. [Google Scholar] [CrossRef]
  22. Huang, W.H.; Lin, C.J.; Huang, T.H.; Chang, C.Y.; Haw, S.C.; Sheu, H.S.; Chen, S.Y.; Dong, C.L.; Kumar, K.; Hwang, B.J.; et al. Mechanistic study for enhanced photocatalytic degradation of acetaminophen by Fe(III) doped TiO2 hollow submicrospheres. Appl. Surf. Sci. 2023, 611, 155634. [Google Scholar] [CrossRef]
  23. Serhane, Y.; Bouzaza, A.; Wolbert, D.; Assadi, A.A. New UV-LED frontal flow photocatalytic reactor for VOCs treatment: Compactness, intensification and optimization studies. Chem. Eng. J. 2023, 451, 138784. [Google Scholar] [CrossRef]
  24. Armaković, S.J.; Savanović, M.M.; Armaković, S. Titanium Dioxide as the Most Used Photocatalyst for Water Purification: An Overview. Catalysts 2023, 13, 26. [Google Scholar] [CrossRef]
  25. Lv, X.; Lam, F.L.Y.; Hu, X. Developing SrTiO3/TiO2 heterostructure nanotube array for photocatalytic fuel cells with improved efficiency and elucidating the effects of organic substrates. Chem. Eng. J. 2022, 427, 131602. [Google Scholar] [CrossRef]
  26. Abutalib, M.M.; Alghamdi, H.M.; Rajeh, A.; Nur, O.; Hezma, A.M.; Mannaa, M.A. Fe3O4/Co3O4-TiO2S-scheme photocatalyst for degradation of organic pollutants and H2production under natural sunlight. J. Mater. Res. Technol. 2022, 20, 1043–1056. [Google Scholar] [CrossRef]
  27. ZZango, U.; Khoo, K.S.; Garba, A.; Kadir, H.A.; Usman, F.; Zango, M.U.; Da Oh, W.; Lim, J.W. A review on superior advanced oxidation and photocatalytic degradation techniques for perfluorooctanoic acid (PFOA) elimination from wastewater. Environ. Res. 2023, 221, 115326. [Google Scholar] [CrossRef]
  28. Assadi, A.A.; Bouzaza, A.; Wolbert, D. Photocatalytic oxidation of trimethylamine and isovaleraldehyde in an annular reactor: Influence of the mass transfer and the relative humidity. J. Photochem. Photobiol. A Chem. 2012, 236, 61–69. [Google Scholar] [CrossRef]
  29. Huang, Y.; Ho, S.S.H.; Niu, R.; Xu, L.; Lu, Y.; Cao, J.; Lee, S. Removal of indoor volatile organic compounds via photocatalytic oxidation: A short review and prospect. Molecules 2016, 21, 56. [Google Scholar] [CrossRef]
  30. Bouzaza, A.; Vallet, C.; Laplanche, A. Photocatalytic degradation of some VOCs in the gas phase using an annular flow reactor: Determination of the contribution of mass transfer and chemical reaction steps in the photodegradation process. J. Photochem. Photobiol. A Chem. 2006, 177, 212–217. [Google Scholar] [CrossRef]
Figure 1. Effect of gas flow rates and inlet concentration on the removal efficiency of butyric acid by photocatalysis.
Catalysts 15 00595 g001
Figure 2. Influence of gas flow rates and inlet concentrations on the CO2 selectivity (%) of butyric acid by photocatalysis (TiO2 + UV, I = 20 W/m2).
Catalysts 15 00595 g002
Figure 3. Influence of gas flow rates and inlet concentrations on the removal efficiency of valeric acid by photocatalysis.
Catalysts 15 00595 g003
Figure 4. Influence of gas flow rates and inlet concentrations on the CO2 selectivity (%) of valeric acid by photocatalysis (TiO2 + UV, I = 20 W/m2).
Catalysts 15 00595 g004
Figure 5. Comparison between the experimental and the predicted outlet concentration by the model at different flow rates for butyric acid (ac) and valeric acid (df).
Catalysts 15 00595 g005
Figure 6. Influence of gas flow rates and inlet concentrations on the removal efficiency of binary mixtures (butyric and valeric acids) by photocatalysis. (a) First binary mixture (75% C4H8O2 + 25% C5H10O2); (b) second binary mixture (50% C4H8O2 + 50% C5H10O2); (c) third binary mixture (25% C4H8O2 + 75% C5H10O2).
Catalysts 15 00595 g006aCatalysts 15 00595 g006b
Figure 7. Influence of gas flow rates and inlet concentrations on the CO2 selectivity (%) of binary mixtures (butyric and valeric acids) by photocatalysis.
Catalysts 15 00595 g007
Figure 8. Influence of experiment number on the removal efficiency of butyric acid.
Catalysts 15 00595 g008
Figure 9. Schematic representation of the planar reactor on a laboratory scale: (a) front view, (b) side view.
Catalysts 15 00595 g009
Figure 10. (a) Energy dispersive X-ray analysis of Mg, O, Na, Al, Si, Ca, and Ti for Glass Fiber Tissue (GFT); (b,c) Scanning Electron Microscopy micrograph.
Catalysts 15 00595 g010
Figure 11. Schematic illustration of the setup for VOC degradation via a continuous photocatalytic reactor.
Catalysts 15 00595 g011
Table 1. Diffusivity coefficients of butyric and valeric acids.
CompoundsDiffusivity in Air (D, m2/s)
Butyric acid8.71 × 10−6
Valeric acid7.87 × 10−6
Table 2. Mass transfer coefficients and Reynolds numbers calculated from correlation 5.
Flow Rates (m3/h)ReynoldsMass Transfer Coefficient (m/s)
Butyric AcidValeric Acid
24340.001960.00183
48680.002770.00259
613030.003400.00318
Table 3. Rate constant (k) and adsorption constant (K) values approached with the solver.
Butyric AcidValeric Acid
k (mmol/m3.s)K (m3/mmol)Correlation (%)k (mmol/m3.s)K (m3/mmol)Correlation (%)
0.132.60990.142.1399
Disclaimer/Publisher’s Note: The statements, opinions and data contained in all publications are solely those of the individual author(s) and contributor(s) and not of MDPI and/or the editor(s). MDPI and/or the editor(s) disclaim responsibility for any injury to people or property resulting from any ideas, methods, instructions or products referred to in the content.

