Article

Study on the Surface Structure of Nano-ZnO Desulfurizers and Their Performance and Mechanism in H2S Removal at Room Temperature

College of Chemical and Materials Engineering, Hainan Vocational University of Science and Technology, Haikou 571126, China
*
Authors to whom correspondence should be addressed.
These authors contributed equally to this work.
Catalysts 2025, 15(6), 547; https://doi.org/10.3390/catal15060547
Submission received: 29 March 2025 / Revised: 13 May 2025 / Accepted: 16 May 2025 / Published: 30 May 2025

Abstract

This study investigates the performance and underlying mechanism of nano-ZnO desulfurizers with varying particle sizes for hydrogen sulfide (H2S) removal at room temperature. Nano-ZnO samples with different particle sizes were synthesized via the homogeneous precipitation method. The surface structure of the synthesized nano-ZnO was characterized by X-ray diffraction (XRD), transmission electron microscopy (TEM), and X-ray photoelectron spectroscopy (XPS). The desulfurization performance of nano-ZnO improves significantly as the particle size decreases, with the primary mechanism being closely related to oxygen vacancies. Oxygen vacancies enhance H2S adsorption on the ZnO surface and facilitate redox reactions that produce elemental sulfur. MS-H2S-TPSR analysis revealed the formation of polysulfides and the redox processes involving sulfur. The effects of particle size, surface oxygen vacancies, and the distribution of oxidized sulfur species on desulfurization performance are also analyzed.

1. Introduction

Hydrogen sulfide (H2S) is a toxic gas with a strong odor, posing significant risks to both the environment and human health. It is commonly found in natural gas, petroleum refining, coal gasification, and various industrial processes [1,2,3]. H2S not only causes air pollution but also leads to equipment corrosion and contamination of water and soil. Therefore, developing efficient and cost-effective desulfurization technologies is essential for protecting the environment, reducing energy consumption, and improving the sustainability of industrial production. Desulfurization technology has evolved from traditional high-temperature [4]. Methods to low-temperature techniques over time. Traditional high-temperature desulfurization methods face several challenges, including high energy consumption, severe equipment corrosion, and secondary pollution. As a result, low-temperature desulfurization technologies have emerged and gained increasing attention [5]. Low-temperature desulfurization technology reduces both operating temperature and energy consumption, while minimizing secondary pollution, making it a key focus in current research. Nanomaterials, due to their excellent physical and chemical properties, such as large surface area, surface effects, and quantum size effects, show great potential in desulfurization. Nano-ZnO, an inorganic semiconductor material, exhibits high chemical stability, excellent adsorption properties, and effective desulfurization, making it a leading material in low-temperature desulfurization research. Studies indicate that the particle size and surface structure of nano-ZnO significantly affect its desulfurization performance.
Current research on nano-ZnO desulfurizers focuses on key aspects, including synthesis methods like the sol-gel, coprecipitation, and chemical vapor deposition methods. These methods enable control over the size and morphology of ZnO particles, thus modifying their properties. The sol-gel and coprecipitation methods are particularly popular due to their simplicity and low cost. Nano-ZnO’s desulfurization performance has been extensively studied. Nano-ZnO effectively removes H2S at low temperatures, with desulfurization performance improving as particle size decreases. The high specific surface area and surface defects (such as oxygen vacancies) of nano-ZnO enhance its ability to adsorb and decompose H2S molecules. However, existing research mainly examines the effect of particle size on desulfurization, with limited attention to the surface structure of nano-ZnO and its impact on performance. Oxygen vacancies play a key role in the desulfurization performance of nano-ZnO. The presence of oxygen vacancies significantly enhances the catalytic activity and desulfurization efficiency of ZnO. Recent studies indicate that oxygen vacancies not only increase the adsorption capacity of H2S on the ZnO surface but also promote redox reactions that generate sulfur or polysulfides. The surface structure of nano-ZnO greatly affects its desulfurization performance. Surface defects, oxygen vacancies, and the coordination of surface atoms all affect its desulfurization ability. For instance, oxygen vacancies serve as active sites for oxygen molecule adsorption on ZnO surfaces, promoting H2S decomposition and generating polysulfides or elemental sulfur. Despite numerous studies on nano-ZnO desulfurization, several challenges persist in current research. First, while the desulfurization efficacy of nano-ZnO has been established, the effect of particle size on its performance at room temperature warrants further investigation. It is crucial to determine whether changes in particle size significantly affect the number and distribution of oxygen vacancies and their role in the desulfurization mechanism. Second, while much research focuses on the desulfurization efficiency of nano-ZnO, less attention has been paid to the sulfur species produced and their transformation mechanisms. The evolution of sulfur species and the formation of polysulfides under different reaction conditions need further exploration.
In addition to nano-ZnO-based desulfurization, other low-temperature desulfurization methods have been widely investigated. Common desulfurization agents include iron-based, zinc-based, and modified activated carbon sorbents. Thermodynamic studies have shown that materials with higher affinity energy and more negative free energy toward H2S tend to possess better desulfurization capabilities. Among them, zinc oxide (ZnO) exhibits high desulfurization accuracy and operational flexibility under medium to high temperatures (200–400 °C and 600–700 °C), outperforming iron oxide and activated carbon. However, ZnO shows limited sulfur capacity at low temperatures (≤200 °C). Thus, enhancing the low-temperature sulfur capacity of ZnO is critical for expanding its application. Nanomaterials, with their unique surface, electronic, and quantum size effects, have been widely applied to improve material performance. Although some research has focused on low-temperature desulfurization using nano-ZnO, studies on its room-temperature performance and related mechanisms are still relatively scarce, motivating further investigation in this work.
This study aims to fill gaps in current research by systematically investigating the performance and mechanism of nano-ZnO for removing H2S at room temperature. The specific objectives include examining how particle size affects the desulfurization performance of nano-ZnO, as well as the impact of particle size changes on the surface structure, oxygen vacancy distribution, and overall desulfurization efficiency of ZnO. Role of oxygen vacancies in desulfurization: This study examines the interaction between oxygen vacancies on the nano-ZnO surface and H2S, investigating their catalytic effect on room temperature desulfurization and their influence on sulfur species transformation. Formation and transformation of sulfur species: This research explores the formation mechanisms of sulfur species, particularly polysulfides and elemental sulfur, and their relationship with the surface structure of ZnO and oxygen vacancies. By addressing these issues, this paper aims to provide a theoretical basis for optimizing nano-ZnO as a low-temperature desulfurizer and promoting its widespread application in environmental protection.

2. Results and Discussion

2.1. Particle Size and Surface Structure Analysis of ZnO

Figure 1 shows TEM images of nano-ZnO samples calcined at different temperatures. These images clearly illustrate how calcination temperature affects the morphology and size of ZnO particles. Figure 1a Roasted at 260 °C: The ZnO particles in this sample have an average size of 14.3 nm. The particles are evenly distributed, with a regular shape and smooth surface. At this temperature, ZnO shows low grain aggregation and significant particle spacing, indicating low crystallinity and the presence of numerous surface defects and active sites. Figure 1b Roasted at 360 °C: The average particle size of ZnO increased to 21.2 nm, with slight particle aggregation. The increased temperature promotes further lattice growth of ZnO particles, reducing crystal defects and surface active sites. Figure 1c Roasted at 460 °C: After calcination, the ZnO particle size increased to 24.1 nm, with more pronounced aggregation and irregular particle morphology. Higher calcination temperatures improve the crystallinity of ZnO, promoting grain growth and significantly reducing surface active sites. Figure 1d Roasted at 550 °C: At 550 °C, the ZnO particle size increased to 35.3 nm, with noticeable agglomeration and increased irregularity. At this stage, the grain size of ZnO increases, and the number of oxygen vacancies decreases, reducing catalytic performance. The TEM images in Figure 1 clearly show that higher calcination temperatures increase the ZnO particle size and promote grain growth, thereby reducing surface active sites. This phenomenon affects the desulfurization performance of ZnO, as larger ZnO particles exhibit lower desulfurization efficiency.
In addition to changes in particle size, the effect of calcination temperature on the specific surface area and pore structure of nano-ZnO was also evaluated using nitrogen adsorption-desorption measurements at 77 K. As shown in Table 1, the specific surface area of nano-ZnO decreased significantly with increasing calcination temperature. Specifically, the BET surface area declined from 46.86 m2/g at 260 °C to 6.86 m2/g at 550 °C. This substantial decrease is primarily attributed to particle growth and aggregation induced by higher calcination temperatures, which reduces the overall surface area and active sites available for H2S adsorption. A lower specific surface area may consequently lead to reduced desulfurization performance, highlighting the importance of optimizing calcination conditions to maintain high surface activity.
The surface area measurements were conducted using a Quantachrome NOVA gas adsorption analyzer, with nitrogen as the adsorbate and BET method applied for data analysis. Prior to measurement, the samples were degassed at 200 °C for over 2 h to remove moisture and contaminants.
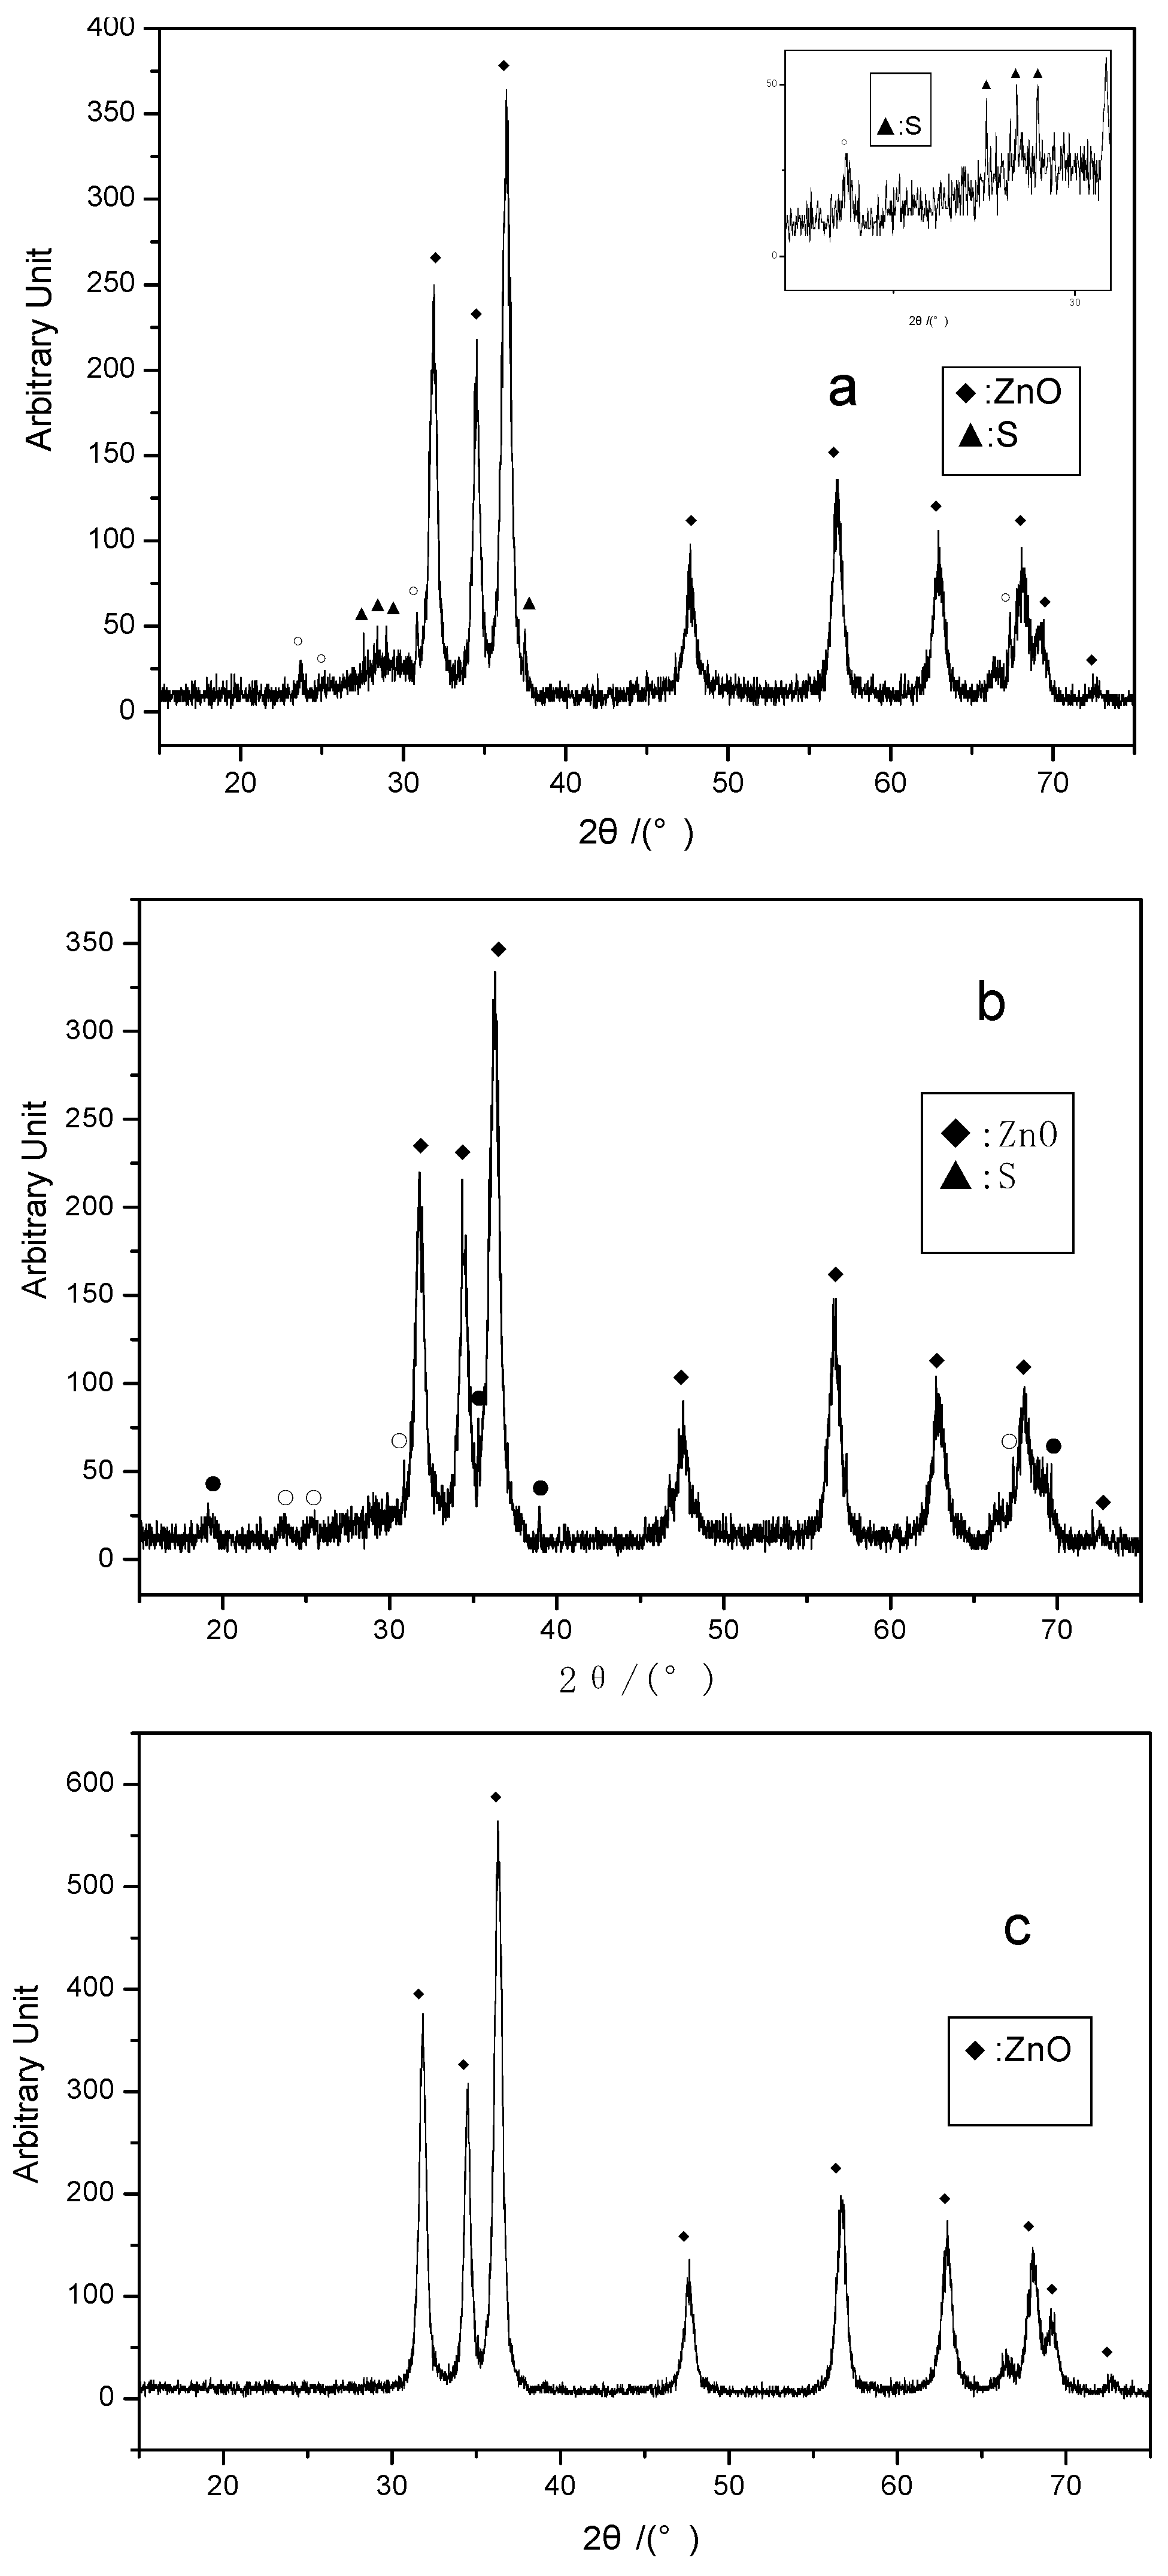
Figure 2 shows the XRD diffraction patterns of nano ZnO prepared at different calcination temperatures, including the patterns before and after the desulfurization reaction. The XRD patterns provide information about the structural changes of ZnO during the desulfurization process. Figure 2a (Before Reaction, 260 °C calcination): The XRD pattern of the sample calcined at 260 °C shows a strong diffraction peak, indicating that the ZnO crystal structure is well-formed with no apparent impurities or other compounds. Figure 2b (After Reaction, O: 1.23%): After the reaction, the diffraction peaks of ZnO shift slightly, and a diffraction peak for ZnS appears. The presence of oxygen promotes the formation of oxygen vacancies on the ZnO surface, facilitating the reaction between ZnO and H2S, leading to the formation of ZnS. This change indicates that a structural transformation occurred in ZnO during the desulfurization process. Figure 2c (After Reaction, O: 0%): Under oxygen-free conditions, the XRD pattern of ZnO shows significant changes. The diffraction peak for ZnS increases noticeably, while the ZnO diffraction peak decreases. This suggests that under oxygen-free conditions, more ZnS forms on the surface of ZnO, and the increase in oxygen vacancies promotes the formation of ZnS. The XRD analysis in Figure 2 reveals the crystallographic changes in ZnO during the desulfurization process, particularly the reaction between ZnO and sulfur to form ZnS under different conditions. This suggests that oxygen vacancies play a catalytic role in the desulfurization process.

2.2. Desulfurization Performance Analysis

Figure 3 shows the XPS spectrum of Zn2P for nano-ZnO calcined at 260 °C, both before and after the desulfurization reaction. XPS analysis provides detailed information on the chemical state of the ZnO surface. Figure 3(a) Before the reaction: The Zn2P spectrum shows the presence of Zn, with the Zn2p3/2 peak at 1021.75 eV, indicating that the ZnO surface is primarily composed of Zn, with no significant reaction. Figure 3(b) After the reaction (O: 1.23%): After the reaction under aerobic conditions, the Zn2P peak shifted slightly, indicating the reduction of Zn and its transformation into ZnS. Oxygen participation promotes the formation of oxygen vacancies on the ZnO surface, which facilitates the formation of ZnS. Figure 3(c) After the reaction (O: 0%): In the absence of oxygen, the Zn2P peak shifted significantly, indicating that Zn was transformed into ZnS, along with the formation of other oxides. The XPS results in Figure 3 show that oxygen vacancies and reaction conditions significantly affect the chemical state and desulfurization performance of the ZnO surface. Changes in oxygen concentration and reaction atmosphere can alter the valence state of Zn on the ZnO surface, thereby affecting desulfurization efficiency.
Table 2 presents the XPS data for Zn and O elements on the nano-ZnO surface at different calcination temperatures. The data show that the calcination temperature significantly affects the surface oxygen vacancies and the chemical state of ZnO. Roasting at 260 °C: The Zn binding energy is high, and the Zn-O binding energy is strong, indicating fewer oxygen vacancies on the surface and a more stable ZnO surface. Roasting at 550 °C: The binding energies of Zn and Zn-O decreased, indicating an increase in oxygen vacancies on the ZnO surface, which enhances the role of oxygen vacancies in promoting desulfurization. The results in Table 2 further confirm the effect of calcination temperature on the chemical state of the ZnO surface. Higher temperatures lead to more oxygen vacancies, which, in turn, affect the desulfurization performance of ZnO.
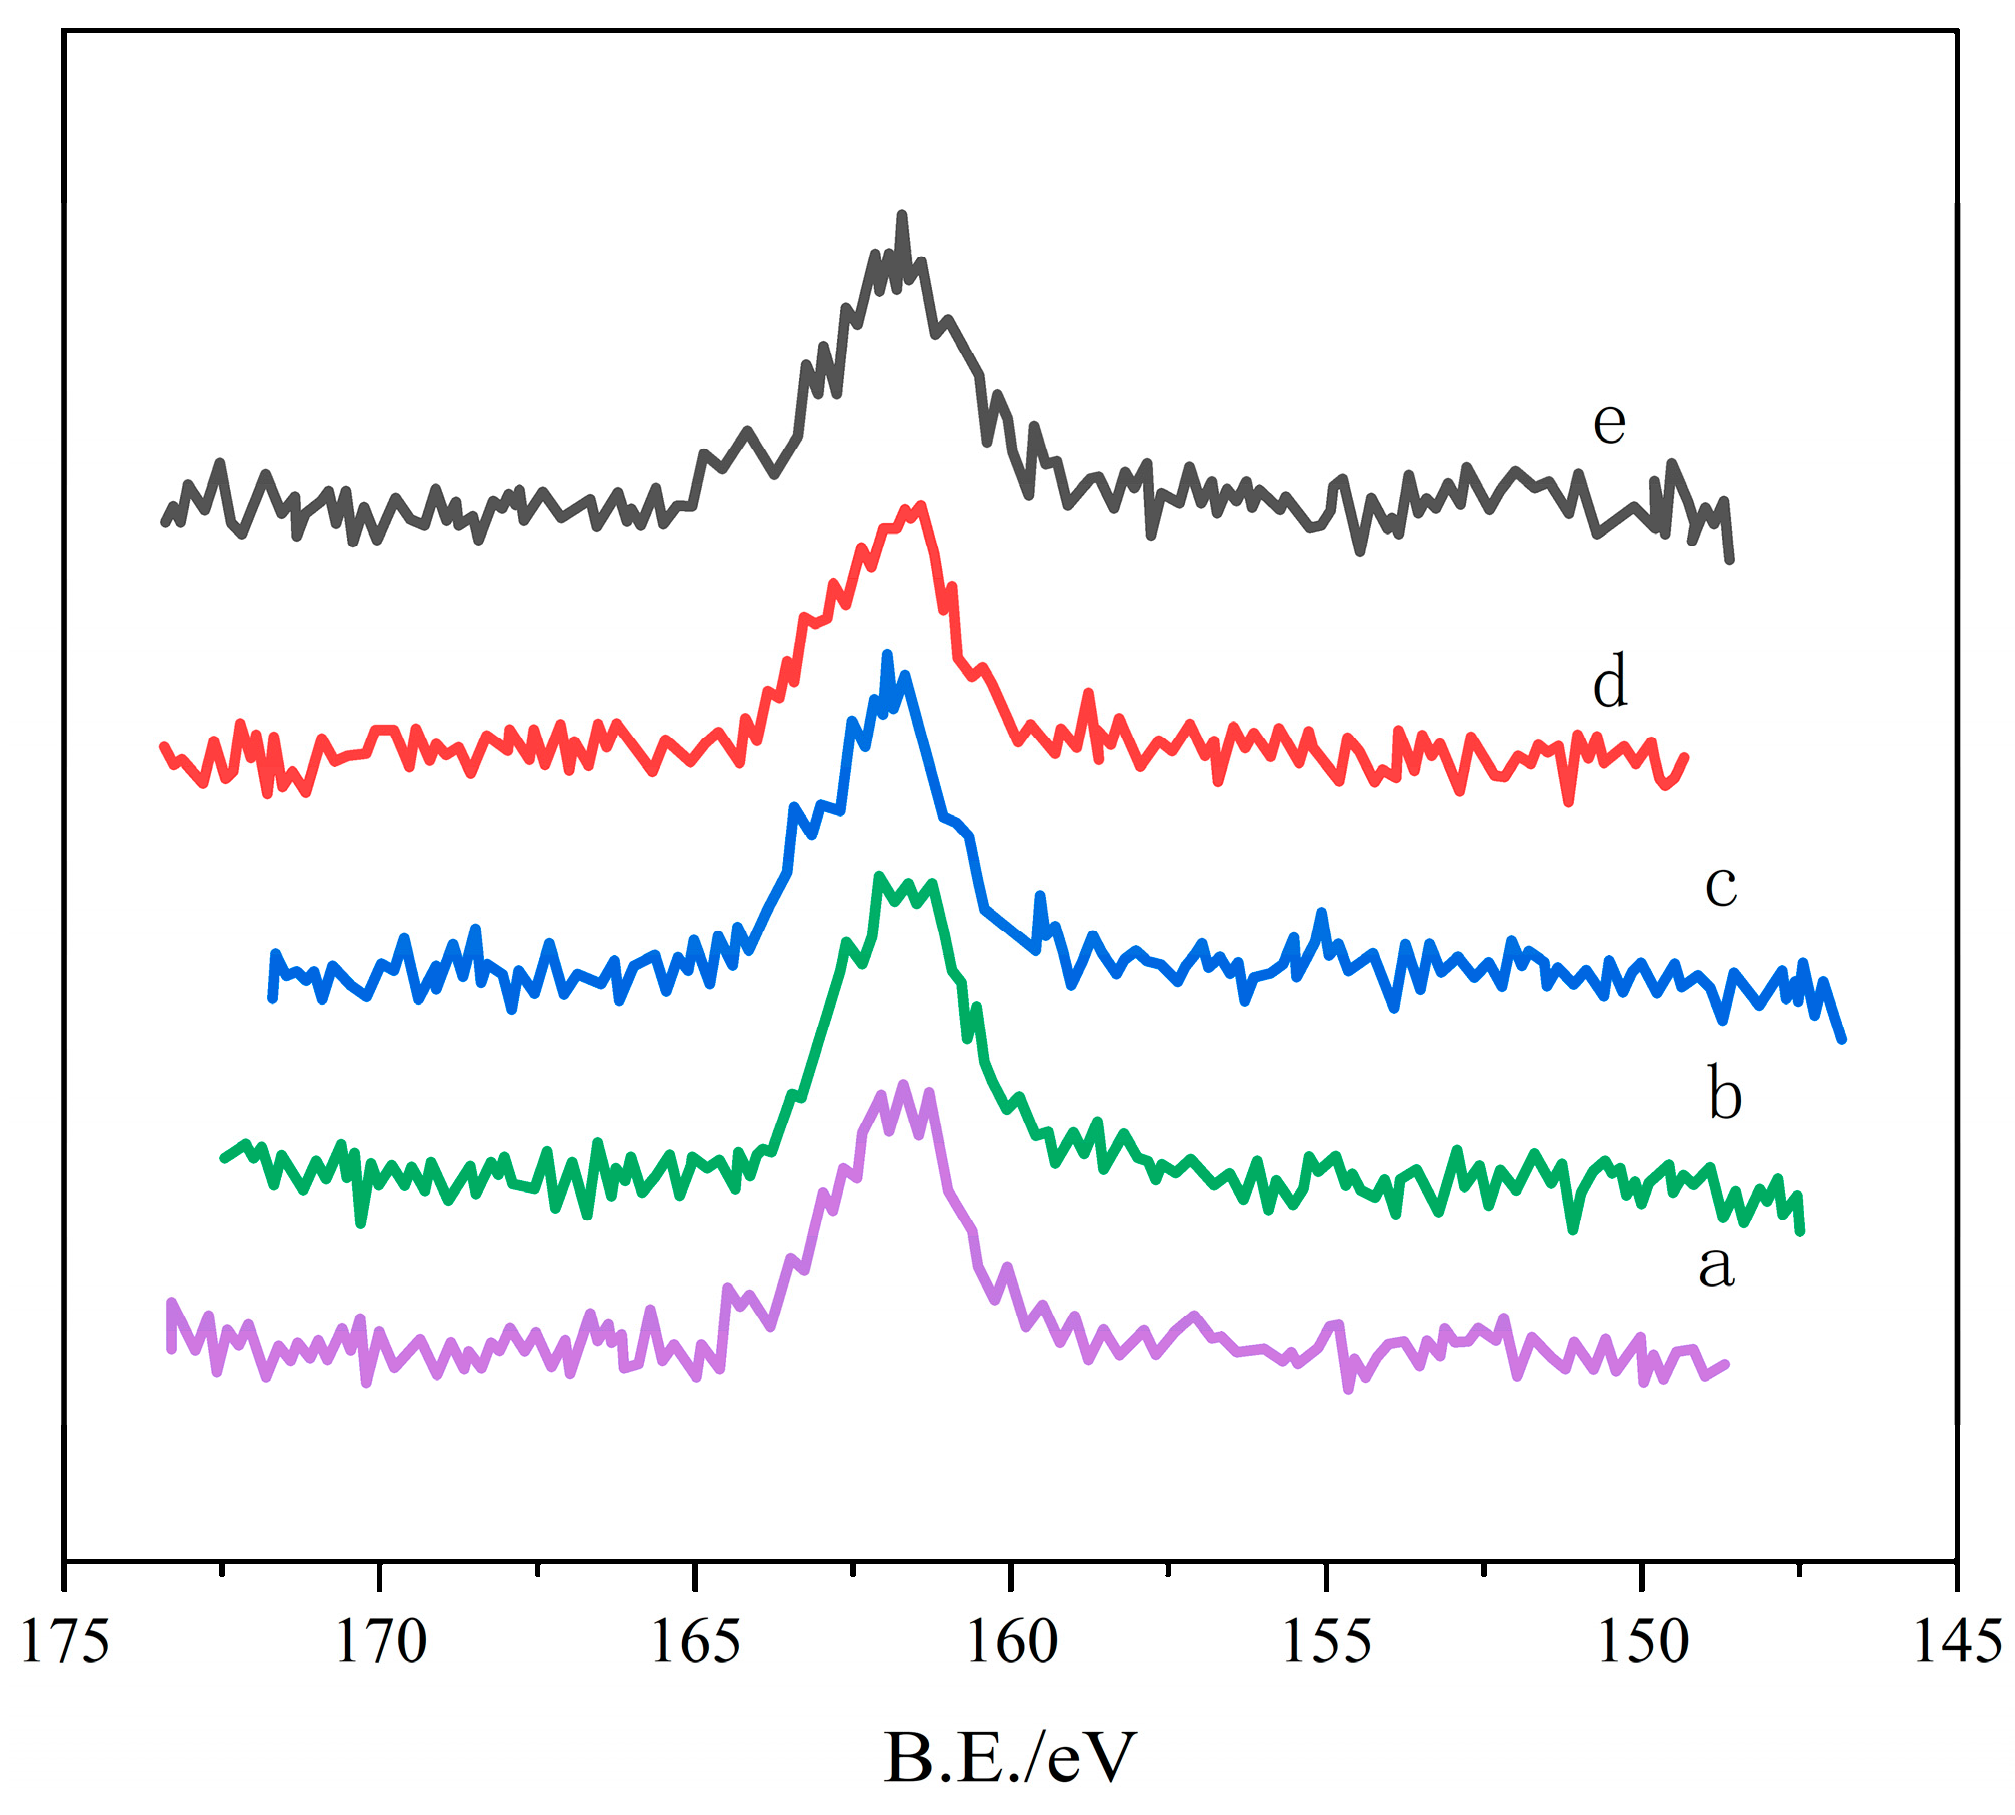
Figure 4 shows the S2P XPS spectrum of nano-ZnO after desulfurization, indicating the formation of sulfides on the ZnO surface. Analysis of the S2P peak reveals the chemical states of sulfur species generated during the ZnO desulfurization reaction [6,7]. Zinc polysulfide is unstable and easily oxidized Figure 4(b) After the reaction (O: 1.23%): After the reaction in oxygen, the S2P peak shifted, indicating the formation of ZnS on the ZnO surface. Figure 4(c) After the reaction (O: 0%): Under anaerobic conditions, the S2P peak shifted significantly, indicating the formation of polysulfides. The XPS analysis in Figure 4 reveals the types and quantities of sulfides on the ZnO surface, with oxygen concentration playing a crucial role in sulfide formation [8,9,10].
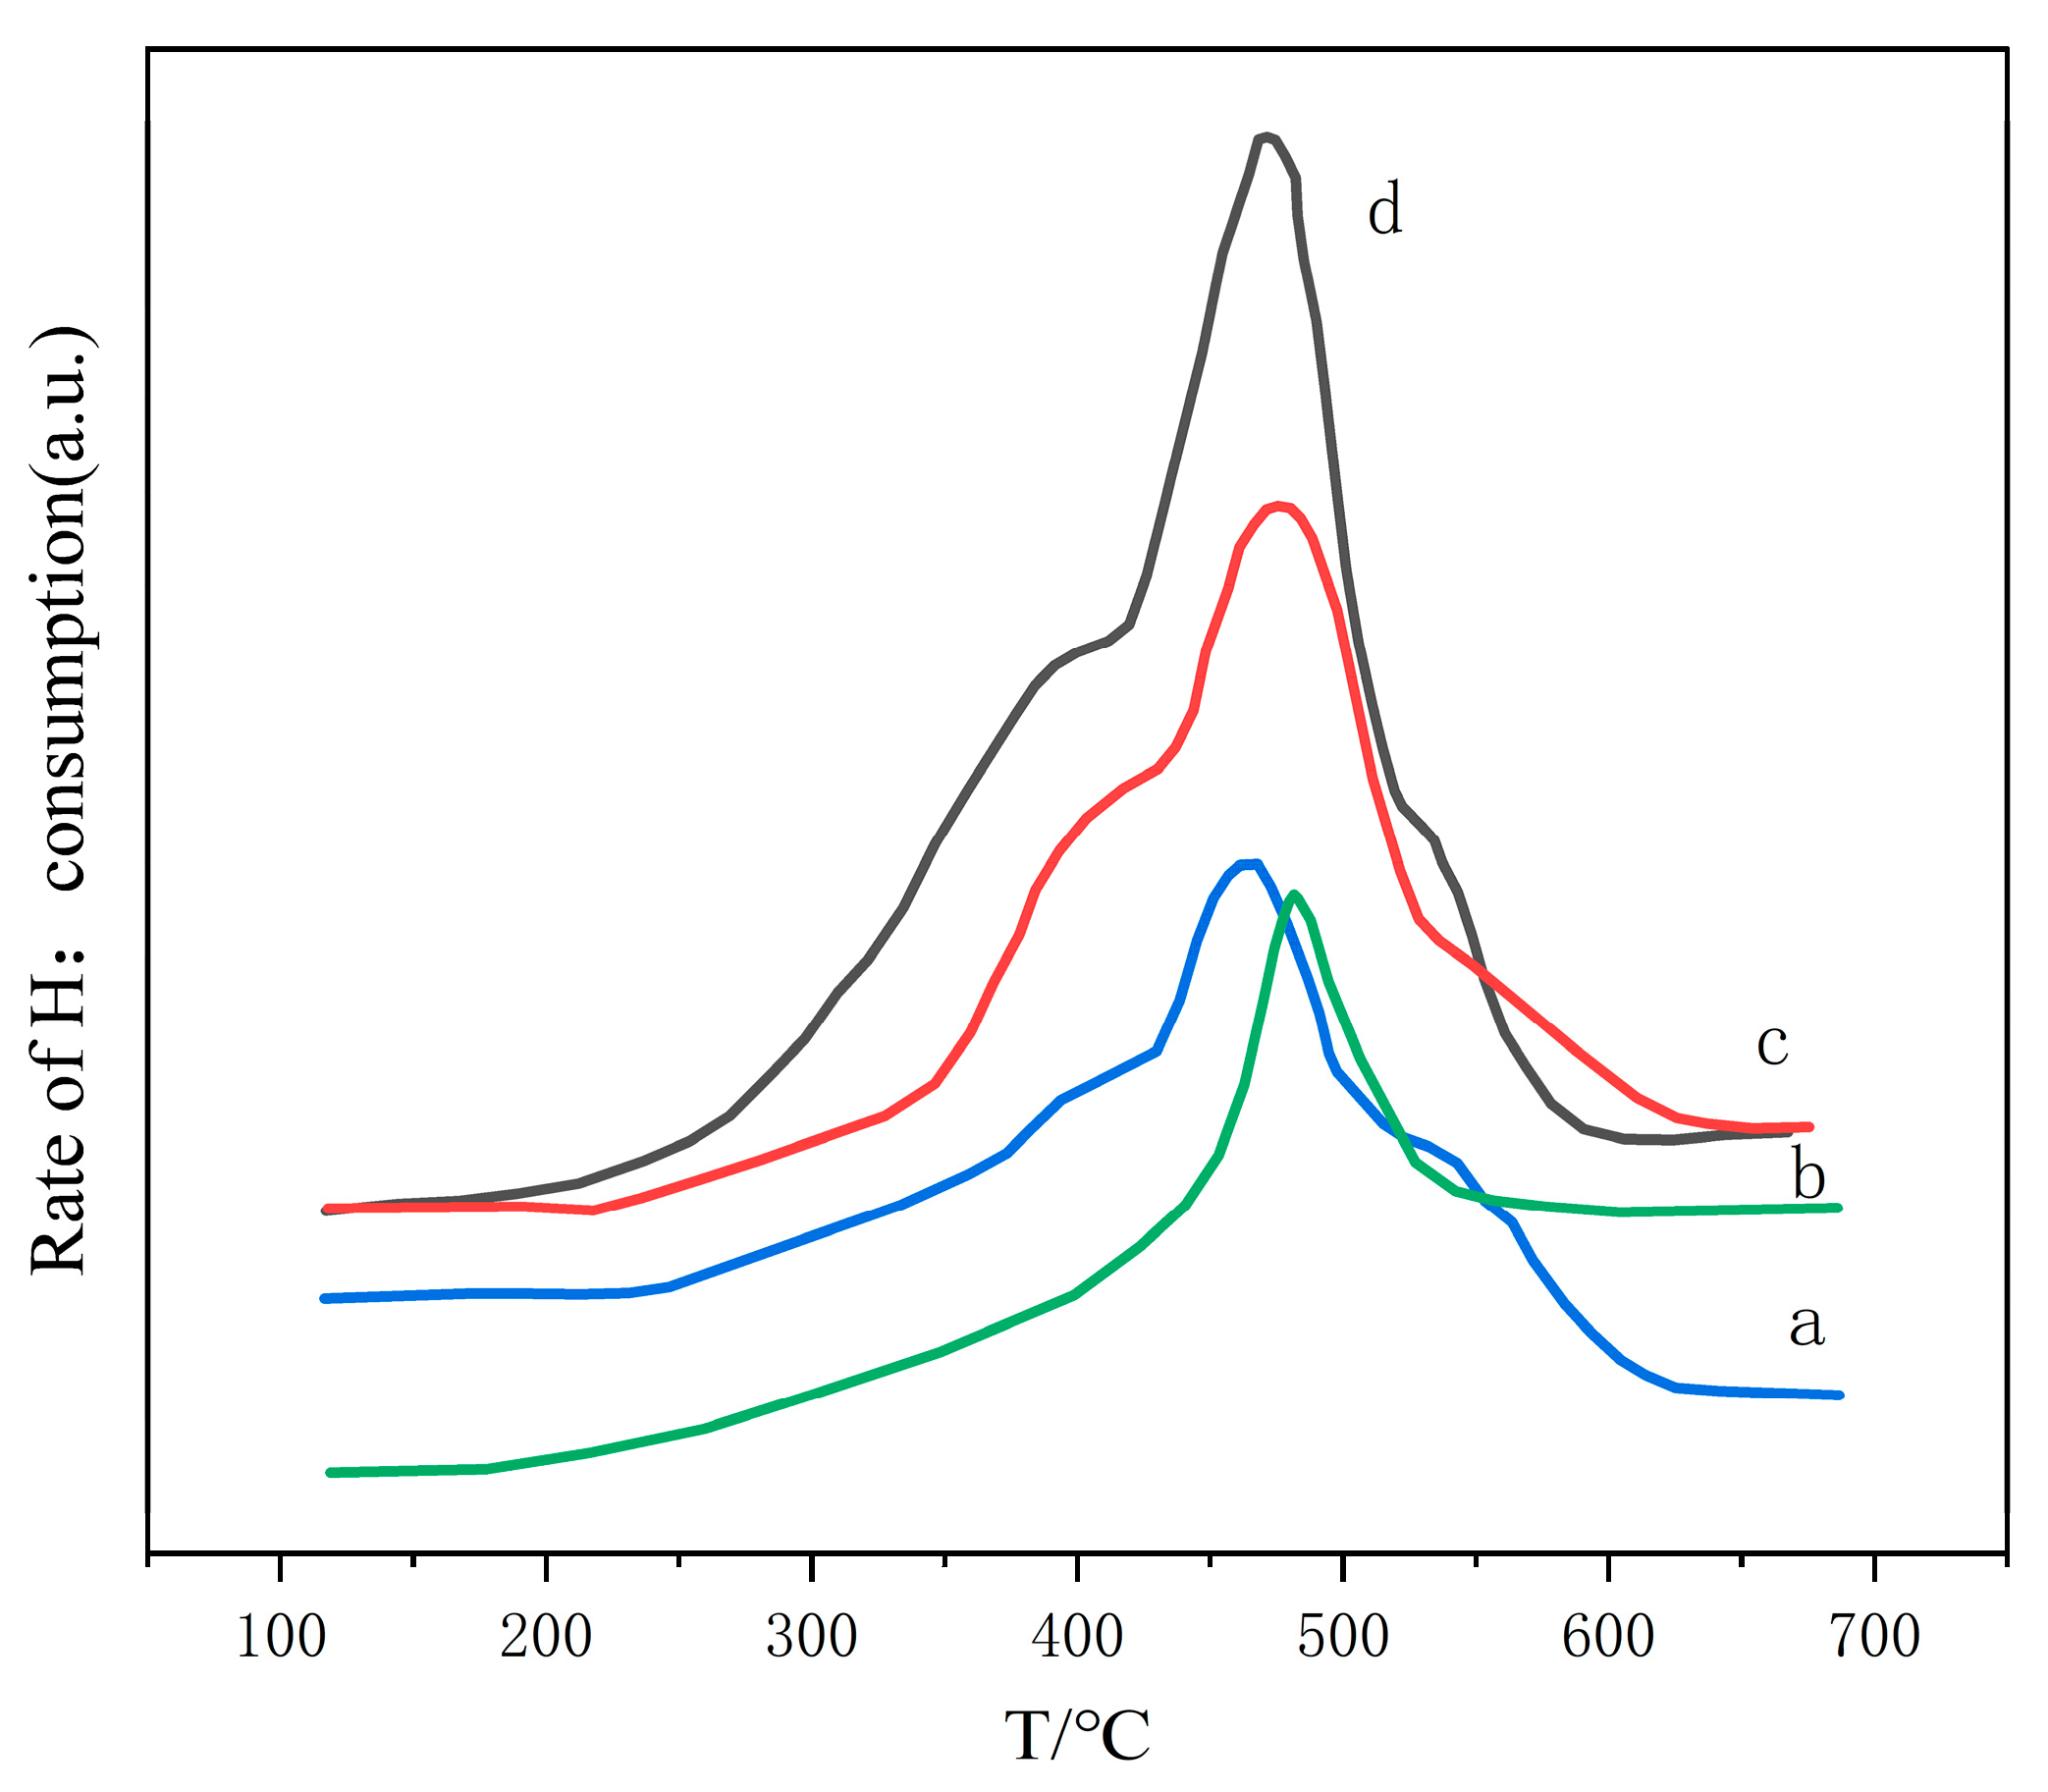
Figure 5 shows the H2-TPR (hydrogen temperature-programmed reduction) diagram of nano-ZnO at different calcination temperatures. The figure illustrates the effect of calcination temperature on the reduction performance of ZnO. Figure 5(a) Roasted at 260 °C: The reduction peak of ZnO is low, indicating weak reduction at this temperature. Figure 5(b) Roasted at 360 °C: The ZnO reduction peak shifts to a higher temperature, indicating enhanced reduction. Figure 5(c) Roasted at 550 °C: The ZnO reduction peak shifts significantly to higher temperatures, indicating that high-temperature roasting enhances ZnO’s reducibility. Figure 5 H2-TPR analysis shows that calcination temperature significantly affects the reduction performance of ZnO. High-temperature roasting enhances the reduction performance of ZnO, thereby promoting its desulfurization efficiency.
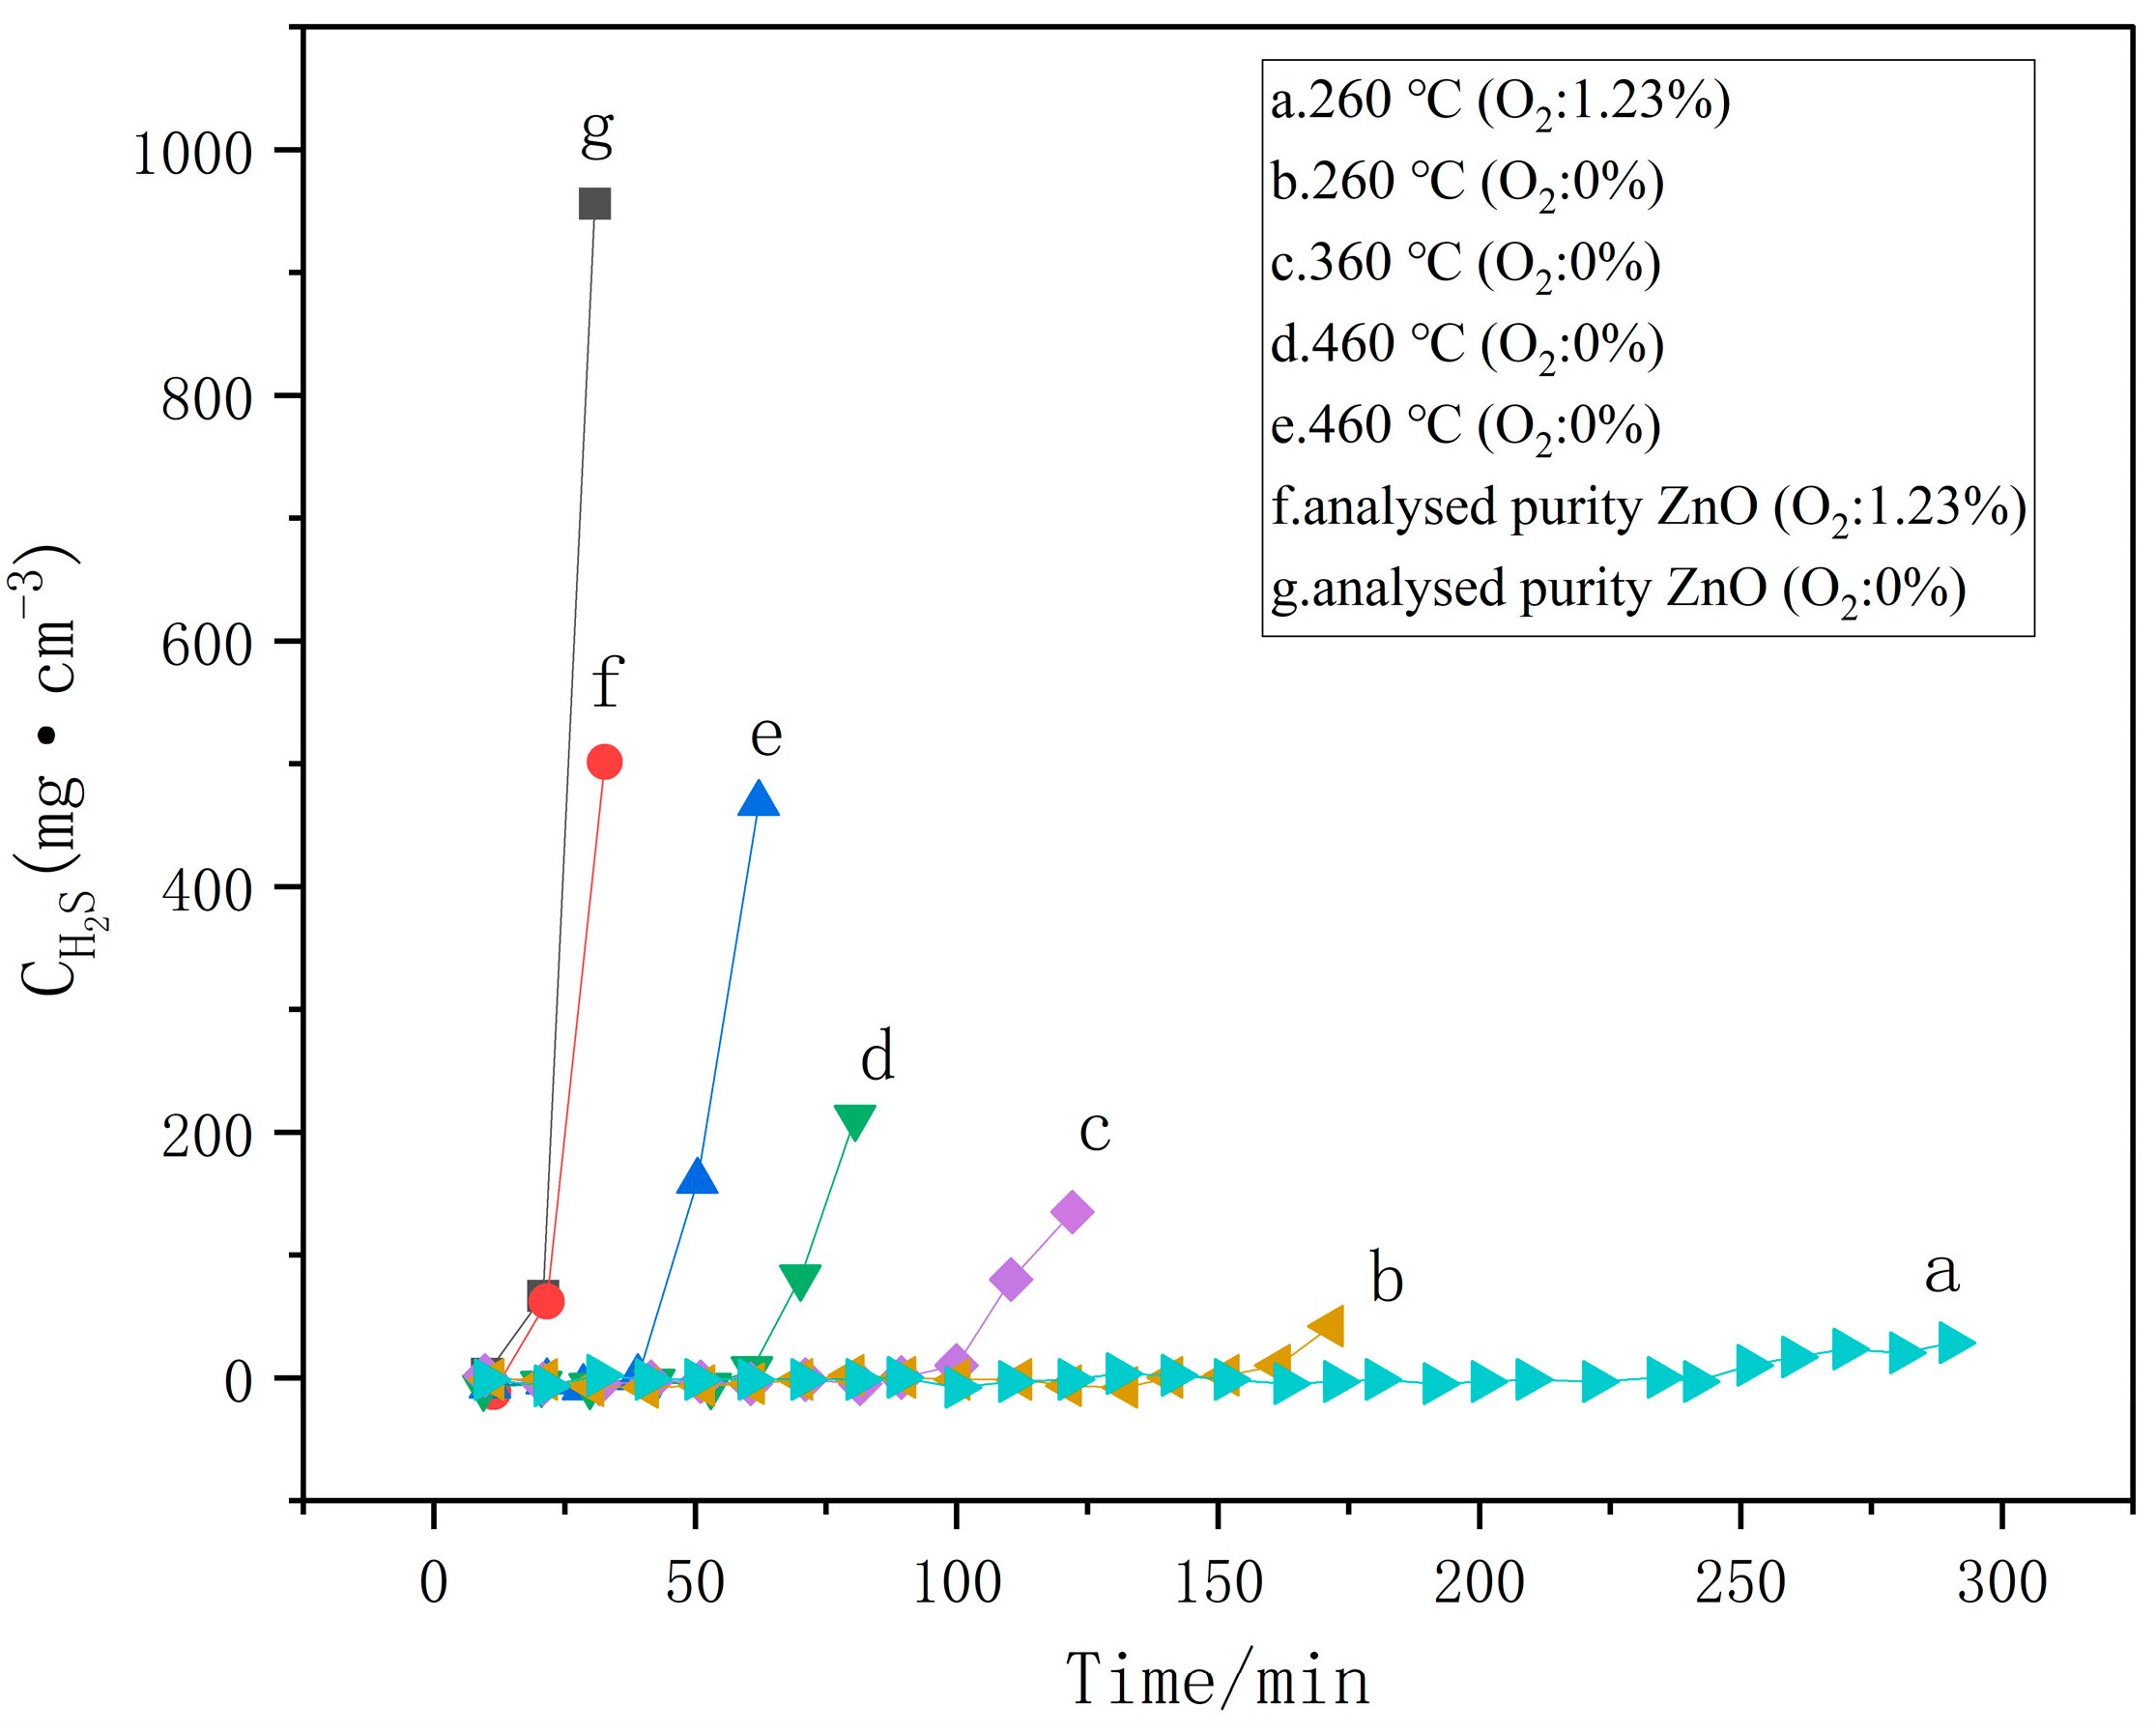
Figure 6 shows the desulfurization activity of nano-ZnO, further confirming the effect of calcination temperature on ZnO’s desulfurization performance. Figure 6(a) ZnO with a particle size of 14.3 nm: This sample demonstrates the highest desulfurization efficiency and the shortest reaction time. Figure 6(b) ZnO with a particle size of 35.3 nm: This sample shows the lowest desulfurization efficiency and the longest reaction time. The results in Figure 6 further demonstrate that ZnO with smaller particle sizes has higher desulfurization activity, due to its larger specific surface area and more oxygen vacancies.
Table 3 shows the color changes of ZnO after the desulfurization reaction at various calcination temperatures. The color change is closely related to the types of sulfides formed on the ZnO surface. Roasting at 260 °C: After desulfurization, the product is reddish-brown, indicating the formation of polysulfides. Roasting at 550 °C: The product after desulfurization is white ZnS, indicating the formation of ZnS. The results in Table 3 further confirm the effect of calcination temperature on the desulfurization reaction products. At lower temperatures, the products formed by ZnO are more complex and may include polysulfides, whereas at higher temperatures, ZnO primarily produces ZnS. This further confirms that calcination temperature and particle size significantly influence the desulfurization performance of nano-ZnO. An increase in calcination temperature promotes ZnO grain growth, reduces oxygen vacancies, and subsequently lowers desulfurization performance. ZnO with smaller particle sizes provides more active sites due to its larger specific surface area and higher number of oxygen vacancies, leading to higher desulfurization efficiency [11,12].
Figure 7 shows the color changes in products after the desulfurization reaction of nano-ZnO with different particle sizes. As shown in Figure 1, as the particle size of nano-ZnO increases, the color of the desulfurization products lightens, and products formed by ZnO with different particle sizes exhibit varying colors [13]. Figure 7a ZnO with a particle size of 14.3 nm: The desulfurization product is reddish-brown, indicating a high sulfur content and a darker product color. Figure 7b After exposure of the 14.3 nm product: Over time, the reddish-brown product gradually turns light yellow, indicating that the sulfur species are unstable and oxidize in air to form stable polysulfides. Figure 7c ZnO with a particle size of 21.2 nm: The desulfurization product is orange-red, indicating a lighter color and lower polysulfide content. Figure 7d ZnO with a particle size of 24.1 nm: The desulfurization product is orange-yellow, indicating that as the particle size increases, the color lightens and the polysulfide content decreases. Figure 7e ZnO with a particle size of 35.3 nm: The desulfurization product is light ochre, indicating further reduction in polysulfide content, with ZnS as the main product. Figure 7f ZnS (white): As the desulfurization product of pure ZnO, ZnS is white, confirming that ZnO primarily produces ZnS under standard conditions, with the product being stable elemental sulfur. The results in Figure 7 show that the smaller the particle size of nano-ZnO, the darker the color of the desulfurization products, resembling polysulfides. As ZnO particle size increases, the color of the desulfurization products lightens and approaches stable ZnS, indicating a decrease in polysulfide formation during the reaction. ZnO desulfurization products with different particle sizes exhibit varying colors, closely related to their surface structure and oxygen vacancy count. More oxygen vacancies and surface active sites lead to more complex sulfur species, resulting in darker product colors.
To further verify the composition of nano-ZnO desulfurization products with different particle sizes, the researchers reacted the products with a small amount of dilute HCl solution. After adding HCl to the desulfurization products of ZnO with different particle sizes, the products gradually dissolved, producing an H2S odor and causing the solution to turn turbid, indicating the presence of ZnS and elemental sulfur. As particle size increases, the solubility of the products decreases, indicating that larger particles contain less elemental sulfur and more ZnS. This phenomenon shows that the particle size of nano-ZnO directly affects the types and quantities of sulfides produced. ZnO with smaller particle sizes produces more polysulfides due to more surface active sites, while larger particles primarily generate ZnS.
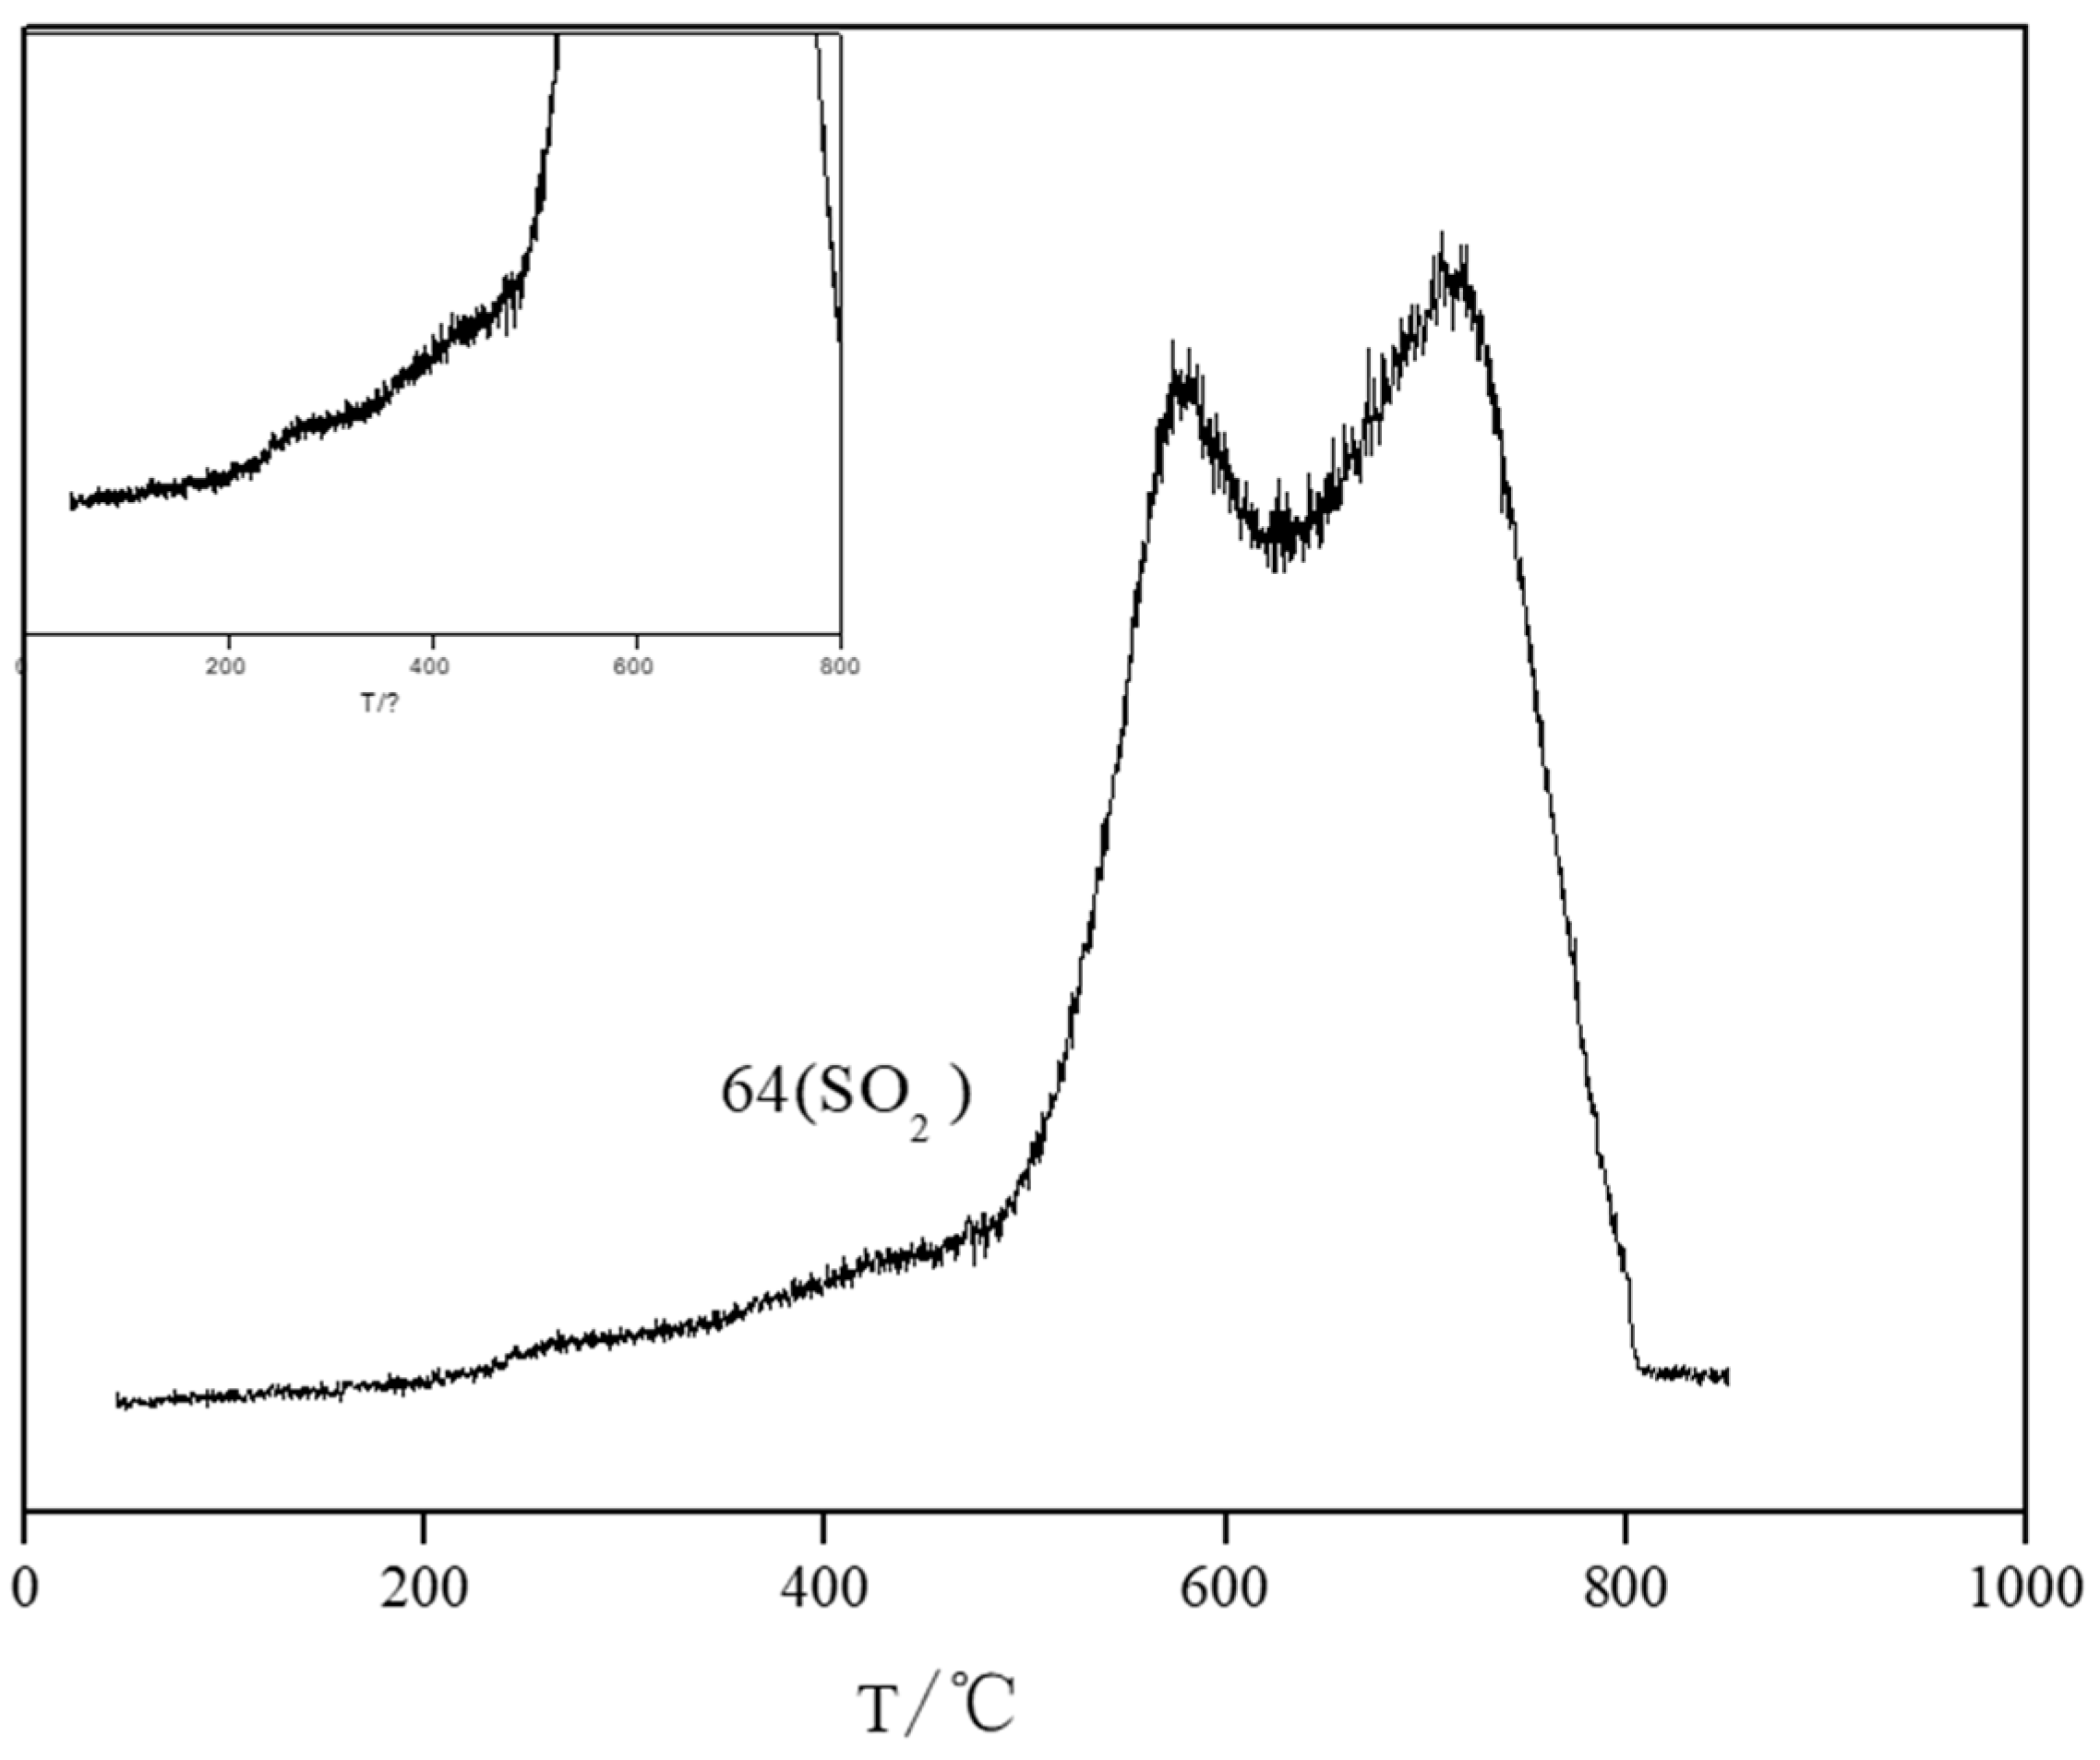
Figure 8 shows the MS-H2S-TPSR spectrum of nano-ZnO during the desulfurization reaction, enabling the analysis of sulfur species generation and transformation. Figure 8 shows that at 200 °C, the SO desorption peak begins to appear, indicating that at lower temperatures, the ZnO surface releases oxygen-containing sulfides. These sulfur species are likely intermediates in an oxidized state, such as sulfate or polysulfides. Figure 8 shows a small shoulder peak around 260 °C, indicating increased SO release from the ZnO surface, further confirming sulfide oxidation during low-temperature desulfurization. Figure 8 shows that at 580 °C and 711 °C, the SO desorption peak becomes more prominent, with two overlapping peaks, indicating that the sulfur species generated in the reaction may exist in different chemical states (e.g., ZnS and sulfur coordinated with Zn). These peaks indicate that the ZnO desulfurization reaction not only produces ZnS but also generates polysulfides or other oxidized sulfur species. Figure 8 analysis of the MS-H2S-TPSR spectrum reveals that at least three different chemical states of sulfur species are generated by HS adsorption on the ZnO surface. These intermediates react with oxygen vacancies on the ZnO surface to form polysulfides or elemental sulfur. At higher temperatures, these sulfur species gradually transform into stable ZnS and SO2.

2.3. Desulfurization Mechanism Analysis

Many studies suggest that the desulfurization products of commercial ZnO are ZnS, independent of temperature. Under aerobic conditions, ZnS undergoes the following regeneration reaction between 700 °C and 800 °C:
2ZnS + 3O2 = 2ZnO + 2SO2
The SO2 desorption peaks at 580 °C and 711 °C on the SO2 mass chromatographic curve are inferred to correspond to sulfur coordinated with Zn in the surface phase and sulfur in ZnS in the bulk phase, respectively. These species are oxidized by active oxygen separated from lattice oxygen or oxygen from water at higher temperatures [14].
ZnS with spinel and non-spinel structures can be transformed into ZnO at 480 °C and 600 °C, respectively, with SO2 desorbed [15]. This indicates that the SO2 desorption peak in the 200 °C to 282 °C range is due to sulfur that is more easily oxidized than the sulfur in ZnS. Room-temperature desulfurization of nano-ZnO with different particle sizes produces products of varying colors, with instability resembling that of polysulfides. XPS analysis shows that the desulfurization products contain sulfur species similar to those in polysulfides [13]. This paper presents MS-H2S-TPD (TPSR) analysis, which shows that sulfur species desorbing SO2 at 200 °C are considered to have polysulfide bonds. The observed reddish-brown coloration, the low-temperature SO2 desorption peaks, and the broadening of the S2p XPS peaks suggest the likely presence of zinc polysulfide (ZnSx), which is known to be thermodynamically unstable and prone to oxidation, forming elemental sulfur.
S + O2 = SO2
The Gibbs free energy of reaction (2) is −300.37 kJ/mol, which is lower than that of reaction (1), at −14.84 kJ/mol. This suggests that reaction (2) is more likely to occur. Consequently, the temperature range of the SO2 desorption peak for sulfur species in zinc polysulfide is lower than that in ZnS.
Zn2+, Zn+, and other zinc species are present in nano-ZnO. When oxygen vacancies are present, they capture electrons, forming “Catalysts 15 00547 i001”. To maintain electrical neutrality in the crystal, adjacent Zn2+ ions are reduced to Zn+, while oxygen vacancies lower the binding energy of lattice oxygen. This promotes the reduction of metals from higher to lower oxidation states [16] and aids the oxidation desulfurization reaction. A surface reaction between sulfur species and ZnO lattice oxygen is unlikely. However, sulfur species can occupy or adsorb oxygen vacancies [17]. The room temperature desulfurization mechanism of nano-ZnO was analyzed based on the characteristics of its desulfurization products under anaerobic conditions. These include the large specific surface area of nano-materials and the abundance of oxygen vacancies.
Oxygen vacancies, which are bound to electrons, preferentially adsorb surface oxygen on nano-ZnO, forming highly reactive oxidation species such as O22− and O2− [18]. These highly reactive particles collide with H2S adsorbed on nano-ZnO or sulfur coordinated to zinc atoms, initiating a rapid redox reaction that oxidizes sulfur from a valence of −2 to oxidation states of −1, 0, or fractional values. These neutral sulfur species adsorb onto the ZnO surface and oxygen vacancies, where they are unstable. The generated sulfur exhibits catalytic activity, oxidizing H2S to elemental sulfur [19]. Unstable active intermediates react with H2S or sulfur coordinated to adjacent zinc atoms, forming compounds that contain S-S bonds. As the size of nano-ZnO particles increases and the specific surface area and oxygen vacancies decrease, the formation of S-S bonds decreases, while the replacement of lattice oxygen by sulfur increases. This indicates that oxygen vacancies and surface area are key internal factors influencing the desulfurization performance of the desulfurizer.
Alkali metal sulfides (or ammonium sulfides) react with elemental sulfur at room temperature, producing polysulfides [20].
(NH4)2S + (x − 1)S = (NH4)2Sx
It can be concluded that particles with high oxidation activity, such as O22− and O2−, oxidize H2S to elemental sulfur, which then reacts with sulfur coordinated to zinc atoms, forming zinc polysulfide. The reaction is as follows:
2O2− (or O22−) + 2H2S = 2S + 2H2O + O22−
ZnS + (x − 1)S = ZnSx
Under oxygen-free conditions, a large amount of reddish-brown desulfurization products are produced during the ZnO desulfurization reaction at 14.3 nm, consistent with the proposed reaction mechanism. Additionally, during the vulcanization reaction, some bonds break while others form. The reddish-brown desulfurization products are likely zinc oxysulfides (ZnSxOy) or ZnSxOyH, which contain polysulfide bonds.

3. Experimental Section

3.1. Chemicals and Instruments

The chemical reagents used in this study are of analytical grade, and no additional purification was performed. The specific reagents and their sources are as follows: Zinc nitrate (Zn(NO3)2·6H2O) for nano-ZnO synthesis, provided by Sigma-Aldrich (St. Louis, MO, USA). Urea (CO(NH2)2), provided by Sigma-Aldrich (St. Louis, MO, USA), was used as the precipitant. Hydrogen sulfide (H2S), supplied by a standard gas generator, was used as the reaction gas to evaluate desulfurization performance. Oxygen (O2), supplied by high-purity gas suppliers, was used for the oxidation reaction. Other reagents, including high-purity nitrogen, hydrogen chloride, and sodium chloride, were supplied by standard chemical suppliers.
Main instruments: X-ray diffractometer (XRD), Rigaku D/MAX-2500 (Rigaku Corporation, Tokyo, Japan), used for characterizing the crystal structure of nano-ZnO. Transmission electron microscope (TEM), JEOL JEM-2100 (JEOL Ltd., Tokyo, Japan), was used to observe the sample’s morphology and particle size. X-ray photoelectron spectroscopy (XPS), PHI 5000 (Physical Electronics, Chanhassen, MN, USA), was used to analyze the sample’s surface chemical state. Thermogravimetric analyzer (TGA), Shimadzu DTG-60 (Shimadzu Corporation, Kyoto, Japan), was used to measure the desulfurizer’s thermal stability at different temperatures. Gas chromatograph (GC), Agilent 7890A (Agilent Technologies, Santa Clara, CA, USA), equipped with a thermal conductivity detector (TCD), was used to analyze changes in H2S concentration in the reaction gas. Mass spectrometer (MS-H2S-TPSR), Autochem 2910 (Micromeritics, Norcross, GA, USA), combined with the Ominister mass spectrometer (Balzers QMG, Balzers, Liechtenstein), was used for mass spectrometry analysis to identify intermediate products in the desulfurization reaction.

3.2. Sample Preparation

3.2.1. Synthesis of Nano-ZnO Particles

Nano-ZnO particles were synthesized through the homogeneous precipitation method. The procedure is as follows: Dissolve zinc nitrate and urea in deionized water at a molar ratio of Zn:urea = 1:3 to obtain a clear, transparent solution. The concentration of zinc nitrate is 0.1 mol/L, and urea is dissolved at a concentration of 0.3 mol/L. Uniform precipitation: After thoroughly mixing the solution, transfer it to a high-pressure reaction vessel, heat to 80 °C, and maintain the temperature for 2 h. During the reaction, urea acts as a precipitant, promoting the interaction between Zn2+ and OH ions, resulting in the formation of zinc hydroxide (Zn(OH)2) precipitate. Filtering and washing: After the reaction, filter the solid precipitate from the solution and washed repeatedly with deionized water to remove soluble impurities. Drying and roasting: The filtered zinc hydroxide precipitate was dried at 60 °C for 12 h to obtain a white powder. The dried powder was placed in a tube furnace and roasted at 500 °C, 600 °C, and 700 °C for 4 h. Nano-ZnO with varying particle sizes was obtained after roasting. Nano-ZnO samples with particle sizes of 14.3 nm, 21.2 nm, 35.3 nm, and 50.1 nm were obtained by controlling the calcination temperature.

3.2.2. Surface Modification of Nano-ZnO

To enhance the desulfurization performance of nano-ZnO, various surface modification techniques were employed in this experiment. The procedure involved treating nano-ZnO samples with hydrogen chloride solution to alter their surface chemical state and promote the formation of oxygen vacancies. The surface of nano-ZnO was modified under different atmospheres, such as nitrogen and oxygen, and the impact of the surface chemical state on desulfurization performance was examined.

3.3. H2S Removal Performance Test

3.3.1. Desulfurization Reaction System

A schematic diagram of the fixed-bed continuous-flow reactor used to evaluate the desulfurization activity of nano-ZnO. As shown in Figure 9, the desulfurization activity was evaluated using a custom-built fixed-tube continuous reaction apparatus. Nano-ZnO powders were pressed, crushed, and sieved to 40–60 mesh, and 0.5 g of the sample was packed into the center of a quartz tube reactor (450 mm in length, 10 mm in inner diameter). Under high-purity nitrogen protection, the reactor was heated to a set temperature at atmospheric pressure. A reaction gas mixture of H2S and N2 with a controlled H2S concentration of 1852 ± 0.1 mg/m3 was introduced at a constant flow rate. Gas samples were taken every 10 min for GC analysis to evaluate the desulfurization activity based on breakthrough time. Component list (as labeled in the schematic): (1) Pressure-reducing valve, (2) Flow stabilizer, (3) Flow meter, (4) Desiccant, (5) Mixing chamber, (6). Tube furnace, (7). Tail gas absorption bottle, (8). Gas chromatograph, (9). Temperature controller, (10). Data acquisition system.
The desulfurization performance was evaluated using a custom-designed fixed-tube continuous reaction system. The system includes a reactor, a gas flow control system, and a gas analyzer. The procedure is as follows: Sample preparation and loading: Nano-ZnO desulfurizer samples with varying particle sizes are pressed into sheets. A specific mass (0.5 g) is weighed and placed into a Shi Ying reaction tube with a diameter of 10 mm and a length of 450 mm. The sample in the reaction tube is maintained at a thickness of 1 cm to ensure full contact between the reactants and the sample. Gas flow and reaction gas: A specific concentration of H2S gas is introduced into a constant-flow, high-purity nitrogen atmosphere, with the gas flow set at 20 mL/min and the H2S concentration at 1852 ± 0.1 mg/m3, ensuring a stable concentration during the reaction. The reaction is conducted at room temperature (approximately 25 °C) for desulfurization. Desulfurization reaction time definition: After initiating the reaction, the H2S concentration in the reaction gas is regularly monitored using a gas chromatograph. When the H2S concentration in the outlet gas drops to 1.00 mg/m3, the desulfurization reaction is deemed complete, and the desulfurization time is recorded.

3.3.2. Reaction Product Analysis

The reaction products were primarily analyzed using gas chromatography to determine the H2S removal rate. Additionally, X-ray diffraction (XRD) and X-ray photoelectron spectroscopy (XPS) were employed to characterize the desulfurized nano-ZnO samples, analyzing sulfide formation on the surface and the distribution of sulfur species in the reaction products. The formation and transformation mechanisms of reaction products in the desulfurization process were studied in detail by combining temperature-programmed reaction (TPSR) with mass spectrometry (MS-H2S-TPSR). Specifically, MS-H2S-TPSR monitors the real-time release of intermediates during the reaction and reveals the catalytic role of oxygen vacancies in the desulfurization process.

3.4. Data Processing and Analysis

All experimental data were collected from three independent experiments, and standard error analysis was performed for data processing. Key indices, such as desulfurization efficiency and reaction time, are presented as experimental averages. The concentration-time curve of reactants is used to further analyze the desulfurization mechanism.

4. Conclusions

This study investigated the performance and mechanism of H2S removal at room temperature using nano-ZnO desulfurizers with different particle sizes. The effects of particle size, oxygen vacancies, and surface chemical state on the desulfurization performance of nano-ZnO were analyzed using XRD, TEM, XPS, and MS-HS-TPSR, revealing its desulfurization mechanism. The experimental results show that the particle size of nano-ZnO significantly affects its desulfurization performance. As particle size decreases, the specific surface area and surface active sites increase, enhancing ZnO’s ability to adsorb H2S. Nano-ZnO with smaller particle sizes has more oxygen vacancies, activating H2S molecules. Nano-ZnO with a particle size of 14.3 nm shows the best desulfurization performance, with higher efficiency than larger particles. Oxygen vacancies are crucial factors influencing the desulfurization performance of nano-ZnO. The primary products during desulfurization are elemental sulfur and polysulfides. This study investigates the desulfurization performance of nano-ZnO with varying particle sizes, revealing the critical role of oxygen vacancies. In summary, nano-ZnO demonstrates excellent H2S removal performance, with particle size, oxygen vacancies, and surface chemical state as key factors affecting efficiency. This study provides a theoretical basis for optimizing nano-ZnO desulfurizers and lays the groundwork for their low-temperature desulfurization application.

Author Contributions

Material preparation, catalytic experiments and writing—original draft, Y.G.; writing—review & editing, C.S.; data analysis and theoretical investigation, X.Q.; formal analysys, writing—review & editing, X.Y. All authors have read and agreed to the published version of the manuscript.

Funding

The study was supported by the university-level team research project of Hainan Vocational University of Science and Technology in 2024 “Research on Polyionic Liquid Materials and Their Catalytic Properties (HKKY2024-TD-17)”; Hainan Province 2025 Higher Education Teaching Reform Research Project: Research on the Ideological and Political Teaching Model of the “Principles of Chemical Engineering” Course Based on Target Problem-Oriented Approach (Hnjg2025ZC-127), Hainan Province 2025 Higher Education Scientific Research Project: Study on Polyionic Liquid Materials and Their Photocatalytic Performance (Hnky2025-66), Research on Teaching Methods of Mechanical Manufacturing Courses under Informationization Conditions (HKJG2024-35). The Hainan University of Science and Technology Vocational College Innovation and Entrepreneurship Training Program for College Students also provided support (20240703).

Data Availability Statement

The data that support the findings of this study are available from the corresponding author upon reasonable request.

Conflicts of Interest

The authors declare no conflict of interest.

References

  1. Wang, W.; Duong-Viet, C.; Truong-Phuoc, L.; Truong-Huu, T.; Nguyen, H.M.; Nguyen-Dinh, L.; Liu, Y.; Pham-Huu, C. Improving catalytic performance via induction heating: Selective oxidation of H2S on a nitrogen-doped carbon catalyst as a model reaction. New J. Chem. 2023, 47, 1105–1116. [Google Scholar] [CrossRef]
  2. Zhang, F.; Chen, W.; Li, W. Recent advances in the catalytic conversion of CO2 to chemicals and demonstration projects in China. Mol. Catal. 2023, 541, 113093. [Google Scholar] [CrossRef]
  3. Liu, H.-F.; Li, Y.; Wang, G.-A.; Chen, K.-W.; Tang, H.-T.; Pan, Y.-M.; He, M.-X.; Yang, K.; Huang, Y.-L. Electrochemical Three-Component Reaction to Construct N-(α-alkoxyalkyl)benzotriazoles. Adv. Synth. Catal. 2023, 365, 3586–3590. [Google Scholar] [CrossRef]
  4. Wu, M.; Guo, E.; Li, Q.; Mi, J.; Fan, H. Mesoporous Zn-Fe-based binary metal oxide sorbent with sheet-shaped morphology: Synthesis and application for highly efficient desulfurization of hot coal gas. Chem. Eng. J. 2020, 389, 123750. [Google Scholar] [CrossRef]
  5. Araujo, L.G.M. ZnO nanoparticles as a potential biolabel for bioimaging applications. Master’s Thesis, Universidade NOVA de Lisboa, Lisbon, Portugal, 2021. [Google Scholar]
  6. Dearden, B.R.; Edwards, A.C.; Evans, Z.T.; Woolsey, B.; Blair, C.R.; Harrison, N.G.; Harrison, R.G. Synthesis of zinc oxide nanoplates and their use for hydrogen sulfide adsorption. J. Sol-Gel Sci. Technol. 2021, 101, 279–286. [Google Scholar] [CrossRef]
  7. Xin, X.; Gao, P.; Li, S. Mechanism and structure–activity relationship of H2 and CO2 activation at the ZnO/Cu catalyst interface. Catal. Sci. Technol. 2024, 14, 5439–5449. [Google Scholar] [CrossRef]
  8. Klöffel, T.; Kozlowska, M.; Popiel, S.; Meyer, B.; Rodziewicz, P. Adsorption of sulfur mustard on clean and water-saturated ZnO (1010): Structural diversity from first-principles calculations. J. Hazard. Mater. 2021, 402, 123503. [Google Scholar] [CrossRef] [PubMed]
  9. Khairulin, S.; Kerzhentsev, M.; Salnikov, A.; Ismagilov, Z.R. Direct selective oxidation of hydrogen sulfide: Laboratory, pilot and industrial tests. Catalysts 2021, 11, 1109. [Google Scholar] [CrossRef]
  10. Zhang, X.; Deng, Z.; Yan, Z.; Wei, C.; Zhu, M. Effect of TiO2 addition on the viscosity of ladle refining slags. Metall. Mater. Trans. B 2024, 55, 1656–1667. [Google Scholar] [CrossRef]
  11. Shoshina, I.; Isajeva, E.; Mukhitova, Y.; Tregubenko, I.; Khan’ko, A.; Limankin, O.; Simon, Y. The internal noise of the visual system and cognitive functions in schizophrenia. Procedia Comput. Sci. 2020, 169, 813–820. [Google Scholar] [CrossRef]
  12. Balmeo, M.M.; Dizon, J.S.C.; Empizo, M.J.F.; Solibet, E.J.C.D.; Agulto, V.C.; Salvador, A.A.; Sarukura, N.; Nakanishi, H.; Kasai, H.; Padama, A.A.B. Density functional theory-based investigation of hydrogen adsorption on zinc oxide (101¯0) surface: Revisited. Surf. Sci. 2021, 703, 121726. [Google Scholar] [CrossRef]
  13. Li, T.; Zhu, H.; Yu, Z.; Shi, N.; Ma, Q.; Yu, J.; Ren, H.; Pan, Y.; Liu, Y.; Guo, W. Promotion effects of Ni-doping on H2S removal and ZnO initial sulfuration over ZnO nanowire by first-principle study. Mol. Catal. 2022, 519, 112148. [Google Scholar] [CrossRef]
  14. Yang, C.; Yang, S.; Fan, H.L.; Wang, J.; Wang, H.; Shangguan, J.; Huo, C. A sustainable design of ZnO-based adsorbent for robust H2S uptake and secondary utilization as hydrogenation catalyst. Chem. Eng. J. 2020, 382, 122892. [Google Scholar] [CrossRef]
  15. Peng, B.; Zou, K.; Song, Y.; Xin, M.; Yang, X.; Lu, L.; Liu, J.; Lin, W. Development of Ni/ZnO desulfurization adsorbent with high stability: Formation of Zn2SiO4 and the impact from substrate. Chem. Eng. J. 2021, 409, 127374. [Google Scholar] [CrossRef]
  16. Wang, C.; Xu, Y.; Tang, J. Catalytic methane removal to mitigate its environmental effect. Sci. China Chem. 2023, 66, 1032–1051. [Google Scholar] [CrossRef]
  17. Arts, I.; Saniz, R.; Baldinozzi, G.; Leinders, G.; Verwerft, M.; Lamoen, D. Ab initio study of the adsorption of O, O2, H2O and H2O2 on UO2 surfaces using DFT+ U and non-collinear magnetism. J. Nucl. Mater. 2024, 599, 155249. [Google Scholar] [CrossRef]
  18. Du, Q.; Niu, H.; Xu, Y.; Zhang, J.; Lan, X.; Huang, Y.; Tan, Y.; Chen, X.; Fang, Y. Mechanism of Molecular Oxygen Activation Mediated by Hydroxyl Groups on the Surface of Red Clay. Chem. J. Chin. Univ.-Chin. 2024, 45, 20230422. [Google Scholar]
  19. Watanabe, S. Chemistry of H2S over the surface of common solid sorbents in industrial natural gas desulfurization. Catal. Today 2021, 371, 204–220. [Google Scholar] [CrossRef]
  20. Porterfield, W.W. Inorganic Chemistry; Academic Press: Cambridge, MA, USA, 2013. [Google Scholar]
Figure 1. TEM Microphotographs of Nano ZnO Calcined at Different Temperature. (a) 260 °C; (b) 360 °C; (c) 460 °C; (d) 550 °C.
Catalysts 15 00547 g001
Figure 2. XRD diffraction patterns of the desulfurizer before and after the desulfurization reaction. (a) After reaction (O2: 1.23%); (b) After reaction (O2: 0%); (c) Before reaction (calcined at 260 °C). The symbols “●” or “O” appear in Figure 2b, indicating that in the N2-H2S-nano ZnO system under oxygen-free conditions, new substances are formed during the desulfurization process. Based on the composition of the reaction system, it is inferred that the new substances are likely zinc sulfides. When 1.23% (Vol) of O2 is introduced into the system, some unknown diffraction peaks still appear in diffraction pattern a (indicated by the symbol “O”).
Catalysts 15 00547 g002
Figure 3. XPS spectrum of Zn2P before and after the desulfurization reaction of nano-ZnO (260 °C) (a) after desulfurization reaction (O2: 0%), (b) after desulfurization reaction (O2: 1.23%), (c) before desulfurization reaction.
Catalysts 15 00547 g003
Figure 4. XPS spectrum of S2P after desulfurization of nano-ZnO. (a) 14.3 nm ZnO (O2: 1.23%), (b) 14.3 nm ZnO, (c) 21.2 nm ZnO, (d) 24.1 nm ZnO, (e) 35.3 nm ZnO.
Catalysts 15 00547 g004
Figure 5. H2-TPR diagram of nano-ZnO at various calcination temperatures. (a) 35.3 nm; (b) 24.1 nm; (c) 21.2 nm; (d) 14.3 nm.
Catalysts 15 00547 g005
Figure 6. Desulfurization activity of nano-ZnO, (a) 260 °C (O2: 1.23%), (b) 260 °C (O2: 0%), (c) 360 °C (O2: 0%), (d) 460 °C (O2: 0%), (e) 460 °C (O2: 0%), (f) Analytically pure ZnO (O2: 1.23%), (g) Analytically pure ZnO (O2: 0%).
Catalysts 15 00547 g006
Figure 7. Color of products after room-temperature desulfurization of nano-ZnO with different particle sizes. (a) 14.3 nm (reddish-brown product); (b) The reddish-brown product turns light yellow after standing (14.3 nm); (c) 21.2 nm (orange-red); (d) 24.1 nm (orange-yellow); (e) 35.3 nm (light ochre); (f) ZnS (white).
Catalysts 15 00547 g007
Figure 8. MS-H2S-TPSR spectrum of nano-ZnO during the desulfurization reaction.
Catalysts 15 00547 g008
Figure 9. Desulfurization Device for Reaction.
Catalysts 15 00547 g009
Table 1. Surface Area of Nano-ZnO Calcined at Different Temperatures.
Calcination Temperature (°C)260 °C360 °C460 °C550 °C
Specific Surface Area (m2/g)46.8639.5821.756.86
Table 2. XPS Data of Surface Elements of the Desulfurizer after Desulfurization.
Sample After DesulfurizationZn2p Binding Energy (eV)Binding Energy of Two Types of Oxygen (eV)Proportion of Two Types of Oxygen (%)X Value (S:Zn)
a. (14.3 nm, O2:1.23%)1021.4530.153, 531.62166.83, 33.177.11
b. (14.3 nm, O2:0%)1021.2530.204, 531.60859.66, 40.342.69
c. (21.2 nm, O2:0%)1021.5530.312, 531.71664.27, 35.731.52
d. (24.1 nm, O2:0%)1021.7530.332, 531.72467.15, 32.851.24
e. (35.3 nm, O2:0%)1021.6530.378, 531.80274.78, 25.221.09
Table 3. Color Changes of Nano-ZnO after Desulfurization.
Bed LayerColor of Bed Layer After ZnO DesulfurizationAnalytically Pure
260 °C360 °C460 °C550 °C
upper layerorangeorangeLight orangeLight ochrewhite
Middle layerReddish BrownorangeLight orangeLight ochrewhite
Lower layeryellow and whiteyellow and whitewhitewhitewhite
Disclaimer/Publisher’s Note: The statements, opinions and data contained in all publications are solely those of the individual author(s) and contributor(s) and not of MDPI and/or the editor(s). MDPI and/or the editor(s) disclaim responsibility for any injury to people or property resulting from any ideas, methods, instructions or products referred to in the content.

