Article

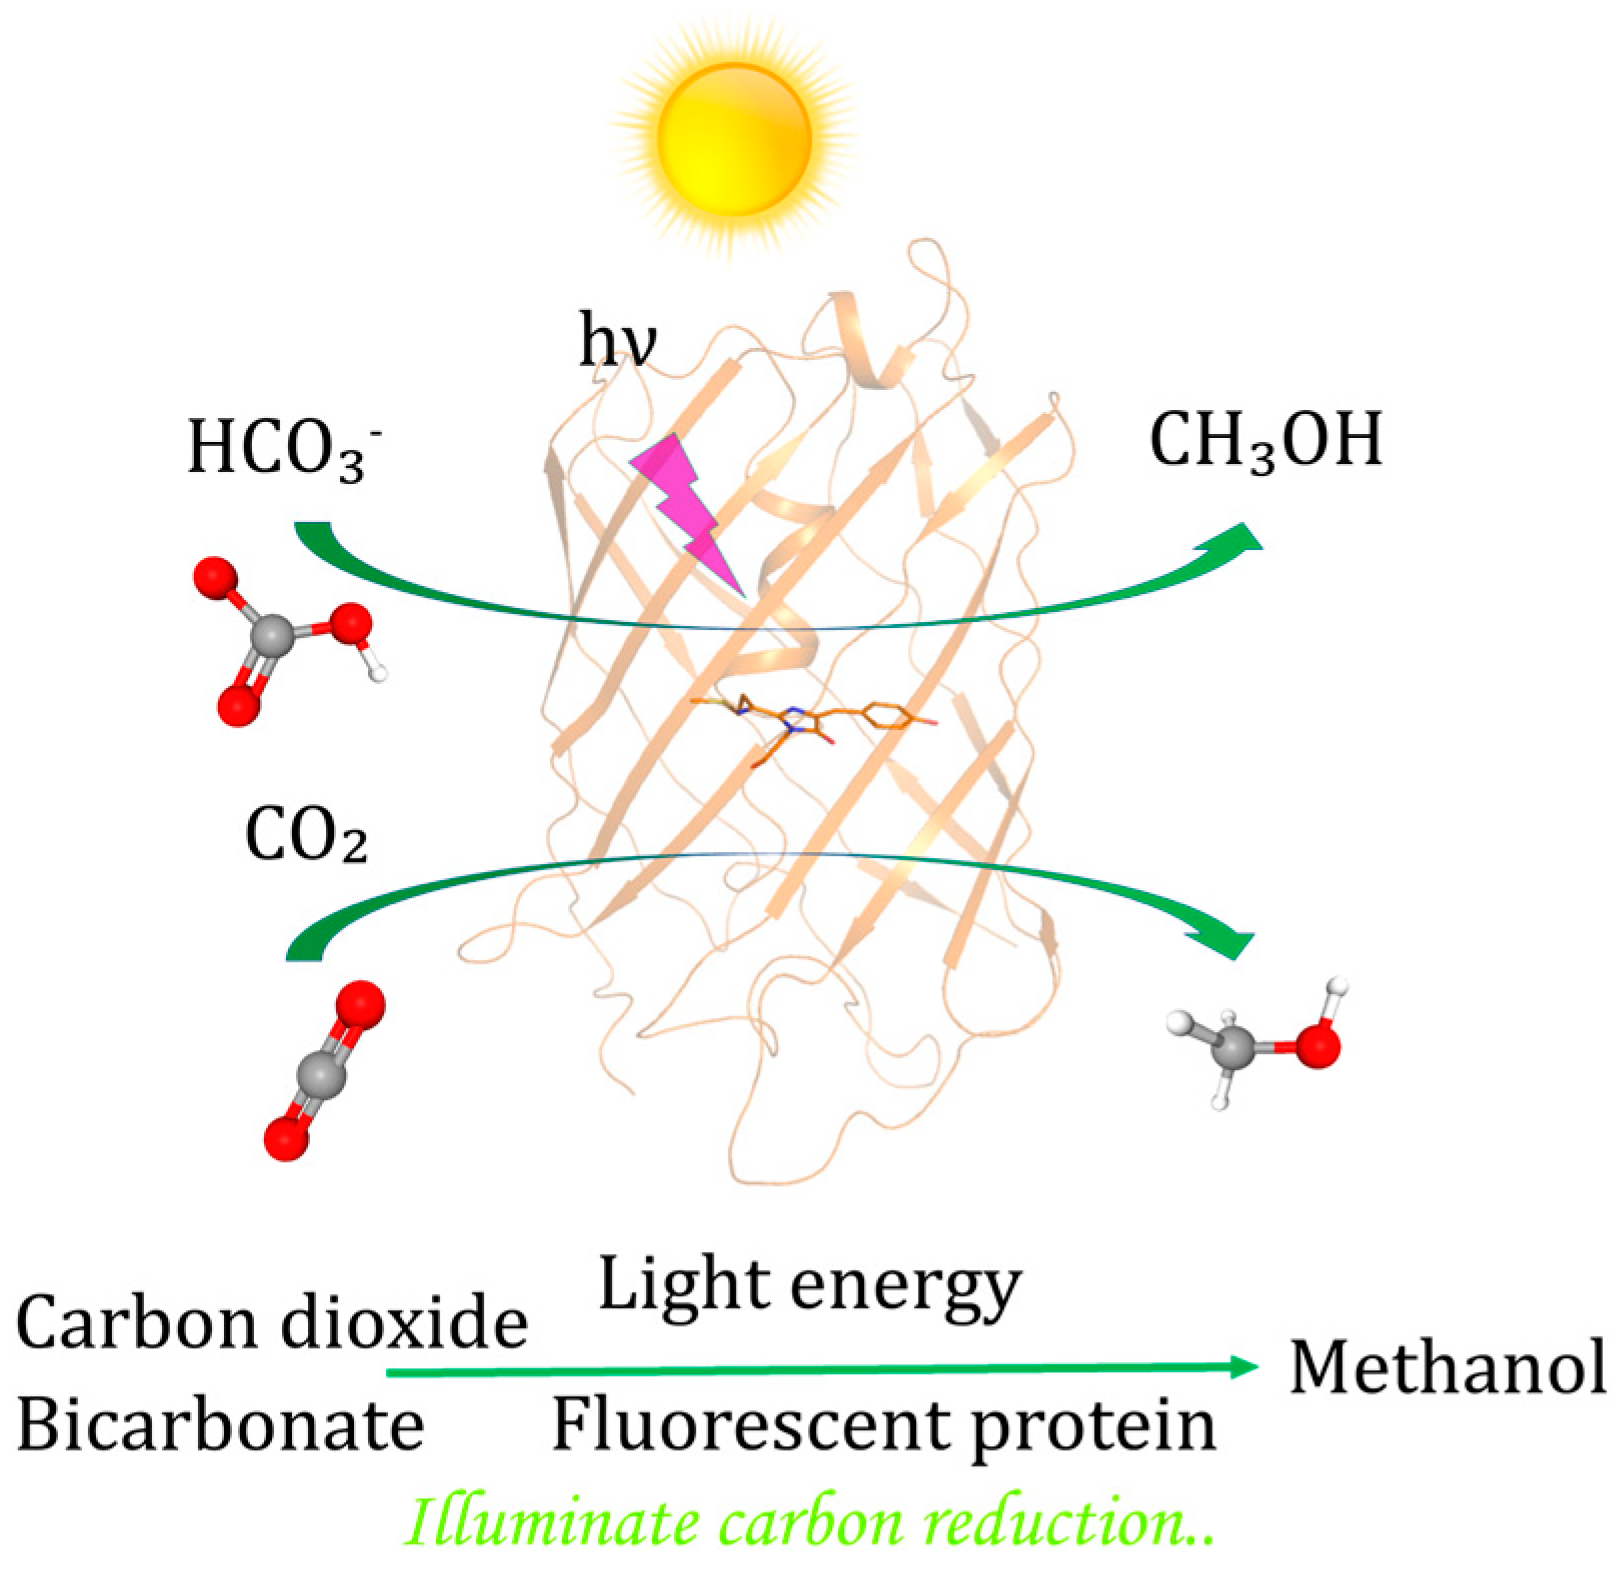
Observation of Light-Driven CO2 Photoreduction by Fluorescent Protein mRuby

1
School of Pharmaceutical Sciences, Zhengzhou University, Zhengzhou 450001, China
2
Institute of Drug Discovery and Development, Zhengzhou University, Zhengzhou 450001, China
3
Key Laboratory of Advanced Drug Preparation Technologies, Ministry of Education of China, Zhengzhou University, Zhengzhou 450001, China
4
Key Laboratory of Henan Province for Drug Quality control and Evaluation, Zhengzhou University, Zhengzhou 450001, China
5
Collaborative Innovation Center of New Drug Research and Safety Evaluation of Henan Province, Zhengzhou University, Zhengzhou 450001, China
6
University of Chinese Academy of Sciences, Beijing 100864, China
*
Author to whom correspondence should be addressed.
Catalysts 2025, 15(6), 535; https://doi.org/10.3390/catal15060535
Submission received: 12 April 2025 / Revised: 15 May 2025 / Accepted: 22 May 2025 / Published: 27 May 2025
(This article belongs to the Collection Catalytic Conversion and Utilization of Carbon-Based Energy)

Abstract

:
As one of the key processes of photosynthesis, carbon fixation and reduction is one of the most important biochemical reactions on planet Earth. Yet, reducing oxidized carbon elements through directly harnessing solar energy by using water-soluble, simple enzymes continues to be challenging. Here, CO2 and bicarbonate were found to be transformed into methanol by fluorescent protein mRuby by using light as the single energy input. The binding of substrates to mRuby chromophore was supported by crystallography and light spectrometry. Gas chromatography showed the generation of methanol in mRuby-bicarbonate aqueous solution upon sunlight illumination. Atomic-resolution serial structures of mRuby showed snapshots of the step-by-step reduction of bicarbonate and CO2. The amino, imino, or carboxylate group of residues near the chromophore was within hydrogen bonding distances of the substrates, respectively. A decrease in fluorescence was observed upon binding of bicarbonate, and the energy liberated from fluorescence was presumably utilized for methanol production. This research represents an exciting example of sunlight-driven photobiocatalysis by water-soluble small proteins. The new, green, and sustainable mechanisms uncovered here indicated great promises to harness solar energy straightforwardly, for, i.e., fuel production and green chemistry.

1. Introduction

Fluorescent proteins (FP) are famous labeling tools for microscopic imaging in biological scientific research [1,2,3,4,5,6], including advanced super-resolution technologies, and FPs can be useful for digital writing and optogenetic tools [7,8], etc. For long-term photographing purposes, bright and photostable fluorescent protein mutants were selected, for which electron leakage and electron transfer were kept at a minimum level, so that less energy was diverted from fluorescence. The energy can be guided either way; however, the sum of energy of fluorescence and photon-induced electron transfer is limited by the total amount of energy of photons accepted. Photoinduced chemistry of fluorescent proteins was common [9,10,11,12,13,14,15], which could affect imaging limits, but this might be employed for other purposes.
Scientists are trying to pave new ways for sustainable energy through biological, physical, chemical, and combined technologies [16,17,18,19,20,21,22]. Some proteins have been modified to transform solar energy into electricity [23,24], and photosystems I/II have been engineered to catalyze reactions to produce fuels, etc. [23,24,25]. Commonly, the conjugated photoactive cofactors are the active site for the acceptance of photons [26,27,28,29,30,31]. The electrochemical character of FPs [32,33] was similar to photosystems. Fluorescent protein was capable of receiving the energy from incident photons. FPs can transmit electrons upon photon acceptance. Imagine the chromophore becomes the active site, electron transfer efficiency, energy transformation efficiency, and reducing power should be high enough to reduce several substances. Converting and storing solar energy into fuel-like molecules by using fluorescent proteins would be interesting and valuable. In that case, the energies required for carbon fixation should be provided by solar energy, and the reducing power required for the reduction of oxidized carbon should be satisfied by the sunlight.
The standard reduction potential E0′ ≈ −0.39 V for 2Acetate + 10H+ + 8e = >2Ethanol + 2H2O, versus the standard hydrogen electrode—all reduction potentials here are versus this electrode. The standard reduction potential E0’ ≈ −0.37 V for 4/3 HCO3 + 28/3H+ + 8e = >4/3Methanol + 8/3H2O. The reduction potential required for bicarbonate reduction is slightly lower than that of acetate, and probably both acetate and bicarbonate could be reduced by solar energy.
In this study, mRuby-bound bicarbonate and CO2 were found to be transformed into methanol after light irradiation. CO2 and bicarbonate (HCO3) are inorganic, carrying little energy, while as an alcohol, the product methanol (CH3OH) is a sort of fuel. The reducing power and the energy were from the incident light here, because no artificial or sacrificial reagents were provided, except light. Complicated activities of photosystems were now performed by a single subunit protein of merely ~27 kDa, integrating substrate binding, light harvesting, carbon fixation, green catalysis, and organic production in one.

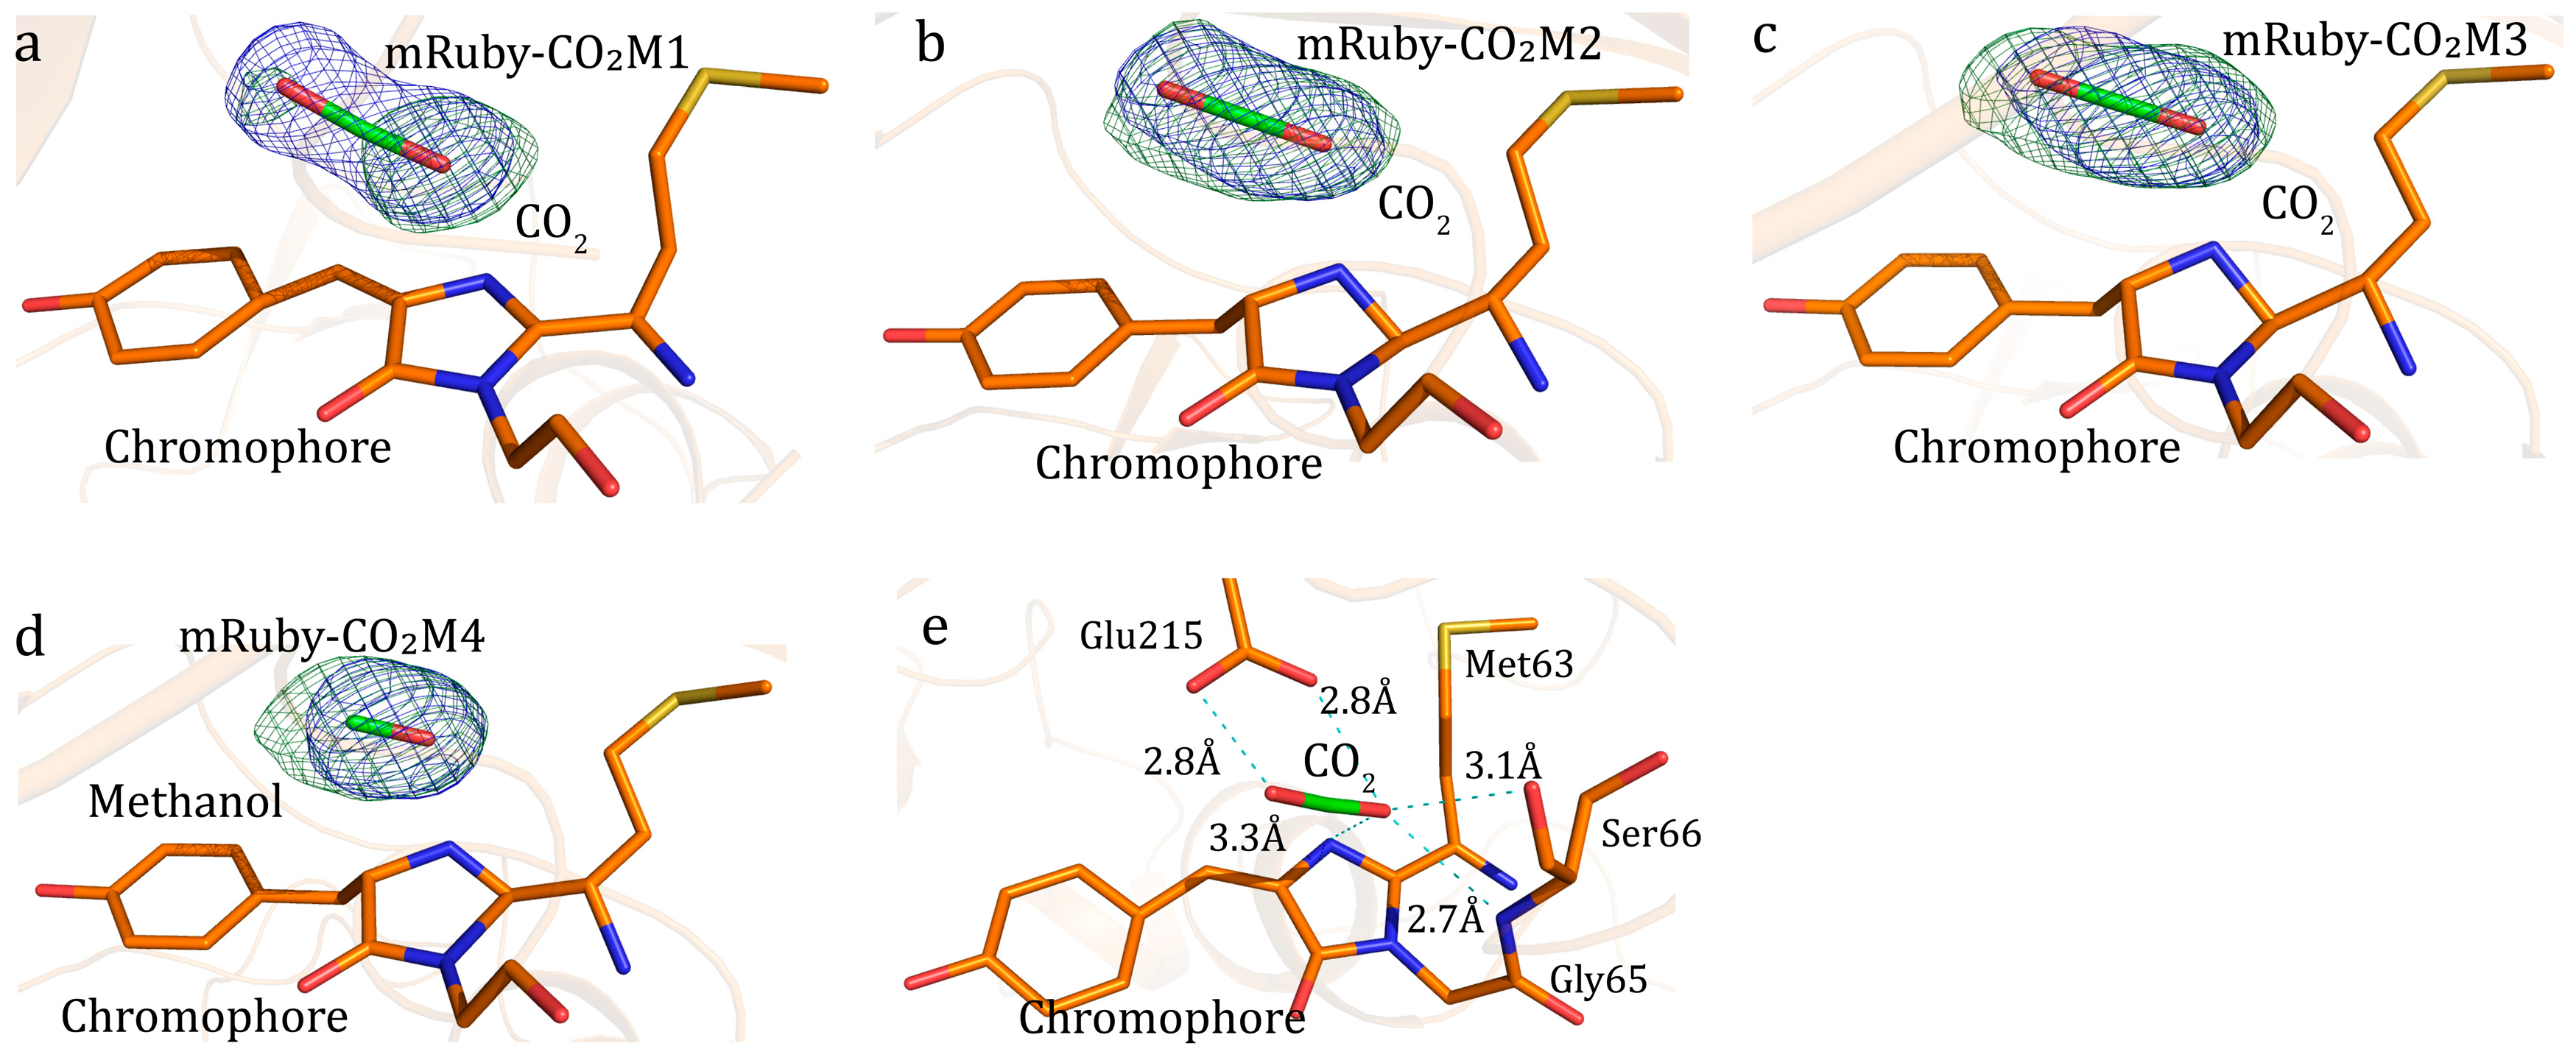
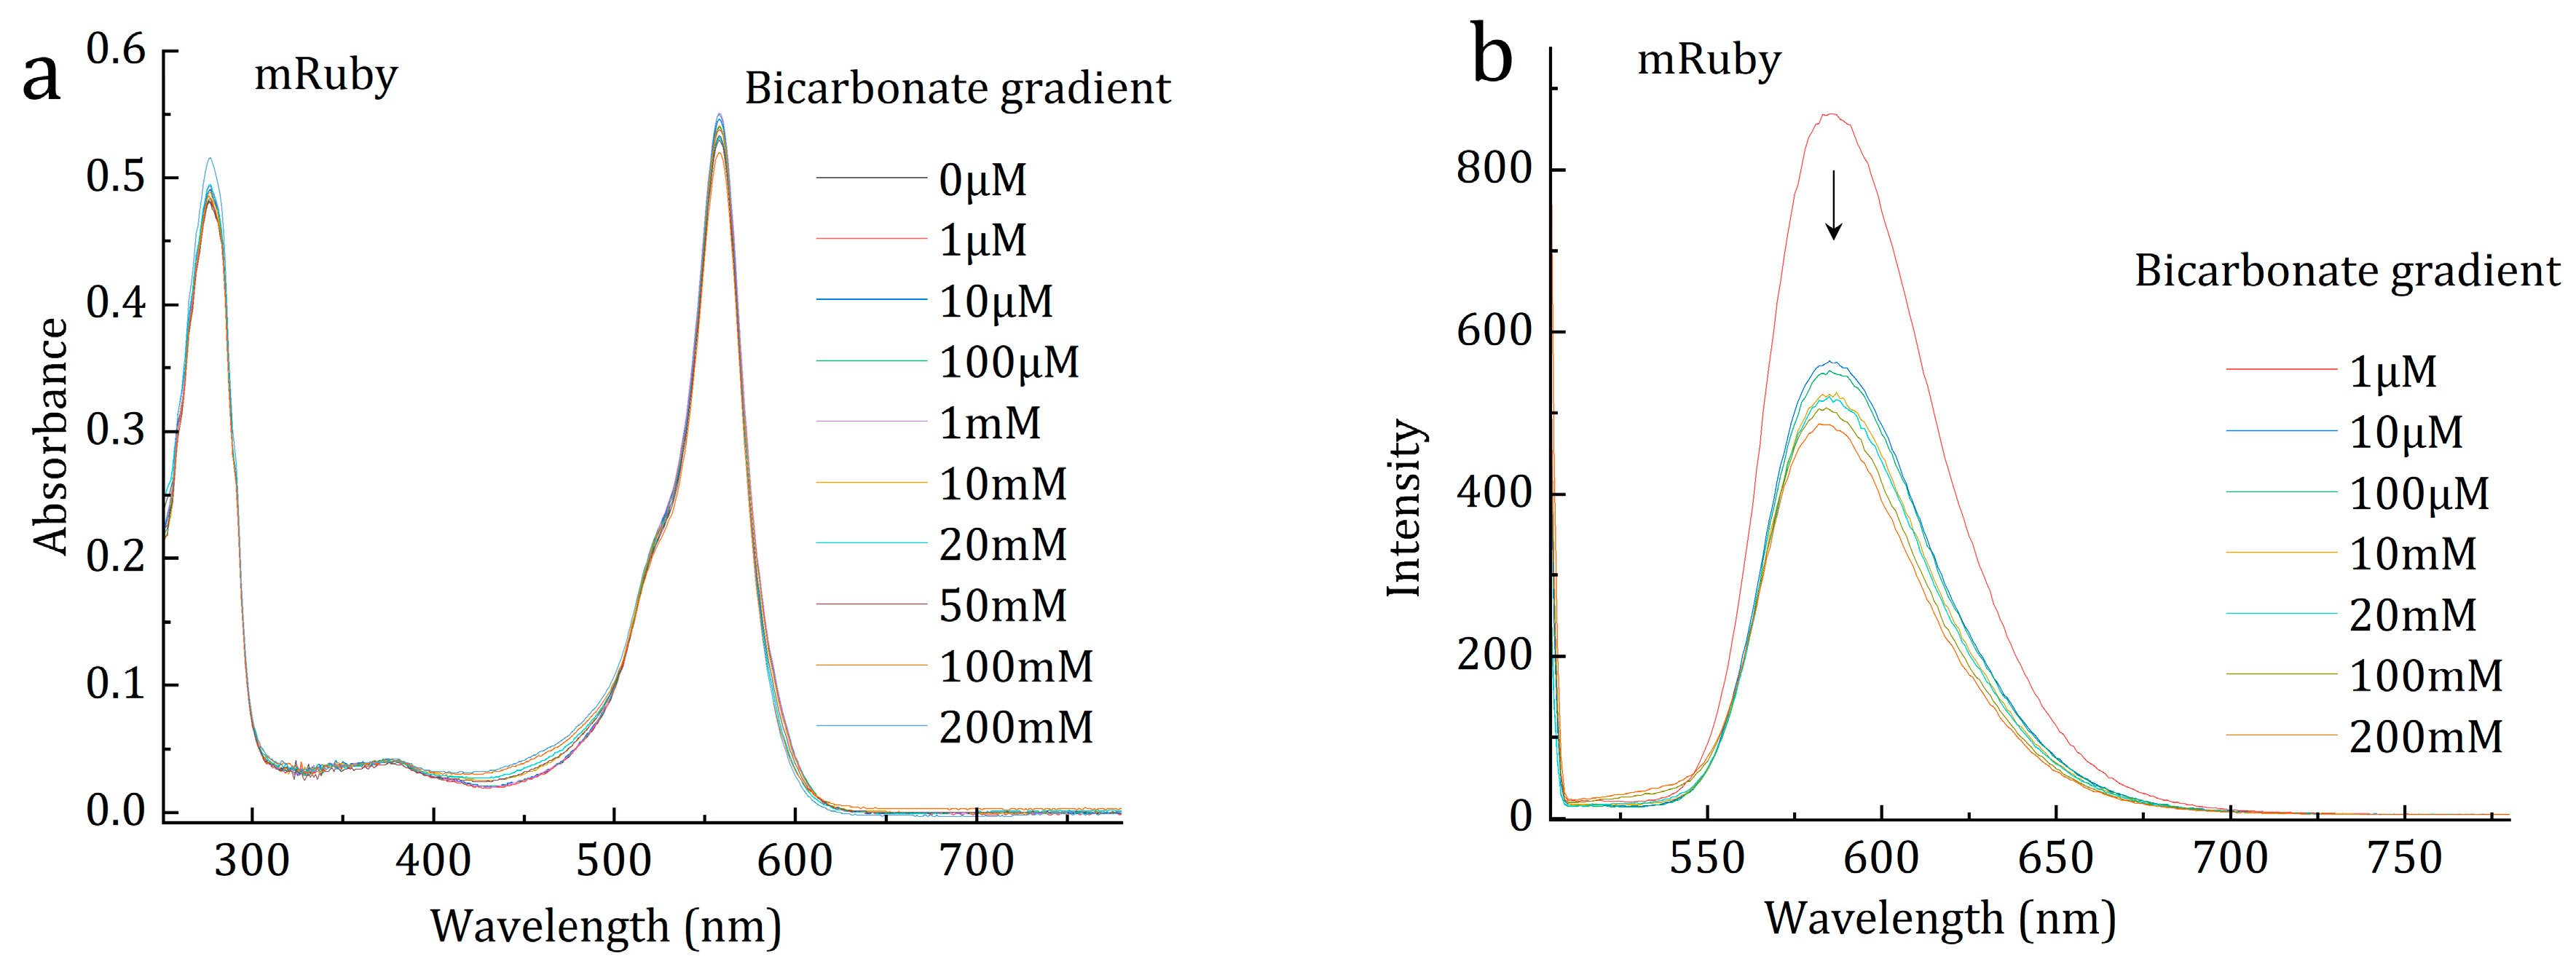
2. Photo Reduction of Bicarbonate and CO2 by mRuby

Efforts have been endeavored in the research of the reduction of carbon dioxide or bicarbonate into organic molecules. Crystallography showed the binding of bicarbonate to the chromophore of mRuby (Figure 1a, Tables S1 and S2). One light illuminated crystal of mRuby-bicarbonate complex showed a product-bound structure; the product was presumably methanol (Figure 1b, Table S3). The generation of methanol from bicarbonate, with the presence of mRuby, was also supported by gas chromatography (Figure S1). Serial structures of the transformation process indicated the conversion mechanism (Figure 1c–f, Table S4). The hydrogen atom required for bicarbonate reduction was probably obtained from the carboxylate group of Glu215 residue, the backbone imino group of Ser66, the guanidine group of Arg67, or the α-carboxyl group of Ser66, which were within hydrogen bonding distances with the substrate bicarbonate (Figure 1f). Although crystalized with NH4HCO3, the product methanol may be converted from the protonated bicarbonate, in the form of CO2, as well (Figure 2). CO2 formed hydrogen bonds with the carboxylate group of Glu215, the backbone imino group of Ser66, the chromophore, and the α-carboxyl group of Ser66 (Figure 2). The interaction between bicarbonate and mRuby was also supported by light spectrophotometry (Tables S5–S7). Photon-induced electron transfer was probably responsible for the decrease in fluorescence upon the binding of substrate bicarbonate (Figure 3), and the energy liberated from fluorescence was presumably utilized for methanol production. Here, the fluorescent protein mRuby was found to be able to transform HCO3 or carbon dioxide into methanol by using light energy as the only energy input, mimicking light-harvesting complex, photosystems I/II, and multiple other related enzymes combined. The ultimate H atoms probably originated from solvent water.

3. Discussion

This research observed the CO2 reduction by fluorescent protein mRuby. Visualization of the photoreduction processes of bicarbonate and CO2 to methanol in a step-by-step manner at atomic resolution was solid evidence. The turnover number (Kcat) of methanol production by mRuby was estimated to be around the level of 10−5 S−1. The reduction of bicarbonate or CO2 to methanol requires the input of both hydrogen atoms and electrons. The hydrogen atom required for substrate reduction, possibly in the form of the proton, was probably extracted from the amino, imino, or carboxylate group of nearby residues, which were within hydrogen bonding distances with the substrates, respectively (Figure 1f and Figure 2e). The X-ray, lamp light, and sunlight could all function as the light source to illuminate the fluorescent protein, or mRuby crystal, and induce electron transfer. The driving force for the conversion of bicarbonate or CO2 to methanol was probably photon-induced electrons. To summarize this research, a schematic diagram of the system used for this bicarbonate and CO2 fixation was made (Figure 4).
This work suggested the following: ① The chromophore can be the electron gathering center and H transfer site of the fluorescent protein. ② Electrons gathered at the chromophore are able to do work efficiently. ③ A very high conversion ratio can be attained in catalysis by using the chromophore of the fluorescent protein. ④ The active site of this catalysis was the chromophore of the fluorescent protein mRuby. ⑤ The electron was probably generated upon acceptance of incident photons, and the generated electrons were presumably transferred to the bound substrate. ⑥ The polypeptide chain, especially the chromophore, was durable and not damaged by the strong reducing power of the electrons generated upon the acceptance of photons (Figure S2). ⑦ The utilization of the chromophore rather than other parts of the protein as the catalytic center had its advantages, because energy would be converted more efficiently this way, and this probably minimized radiation and redox damage as well. ⑧ As the substrate binding site, light-harvesting center, electron transfer center, carbon fixation point, and green catalytic center, the chromophore could be the methanol product evolving center, as well. These features were virtually the essential function of photosynthetic machineries. To better portray the energy transformation nature and the photocatalytic property of these photoactive proteins, they would be referred to as photonzymes. Photonzyme, to be defined as, enzyme that can accept the energy of photons, can utilize the energy from photons to do work, can transform the energy from photons into some other kinds of energies, for example, in the form of electrochemical energy, or to transfer it to some other places. Additionally, photonzyme can usually convert substrate molecules into products as well.
The production of methanol fuel from bicarbonate (CO2) here was driven by light as the single input energy, and this was achieved through using purely biological fluorescent protein mRuby. The whole process could be clean, green, sustainable, and renewable, because fluorescent proteins like mRuby could be produced through a purely biological approach. This work indicated direct routes to produce clean and green fuels straightforwardly via utilizing renewable solar energy. Capturing the core essence of light-harvesting complexes and photosynthetic machineries, this miniature version of photosynthetic systems enriched the toolboxes to study light-induced electron transfer, carbon fixation, and CO2 reduction, etc. As a platform, the small water-soluble protein is potentially ready for engineering for multiple application purposes, including but not limited to advancing the development of carbon-fixation and green chemistry technologies. As the turnover number and catalytic efficiency improved, tiny versions of simple photosynthetic systems might be within reach in the future.

4. Experimental Procedures, Materials, and Methods

4.1. Fluorescent Protein (mRuby) Purification

mRuby gene was synthesized and a pET22b recombinant plasmid vector with the mRuby gene was purchased from GentleGen company (Suzhou, China). The mRuby-pET22b plasmid vector was transformed into BL21 competent cells. Target protein with C-terminal His × 6 tag was overexpressed after induction by IPTG at 37 °C. The harvested cell pellet was suspended in 20 mM Tris, pH 7.9, and 0.2 M NaCl, and stored at −20 °C. Cells were disrupted by sonication on ice in a buffer containing 20 mM Tris pH 7.9, 200 mM NaCl, 2 μg/mL lysozyme, and 1 mM PMSF. After centrifugation at 4 °C for 50 min, the target protein in the supernatant was captured by Ni-IDA resin and eluted with a gradient of imidazole solution. The protein sample was dialyzed against a buffer (20 mM Tris pH 7.9, 200 mM NaCl), to remove imidazole and concentrated. The purified mRuby protein was concentrated to about 0.01–0.06 g/mL and applied to a crystallization experiment, etc.

4.2. Crystallization, Diffraction Data Collection, and Structure Determination of mRuby Protein with the Presence of Bicarbonate

Crystal screening was performed mainly manually. To examine whether mRuby could bind bicarbonate or not, the freshly prepared protein sample was subjected to crystal screening, by using a partially home-designed matrix, and each of every condition from commercial crystallization kit was supplemented with Na2CO3 and NaHCO3 with a final concentration of about 0.15–0.2 M. However, high-quality crystals for diffraction data collection were not obtained. Then other carbonate or bicarbonate salts were tried, including NaHCO3 of various pH; (NH4)2CO3, pH 7.5, 0.15 M; and ammonia bicarbonate, NH4HCO3, 0.2 M. Initial screening of mRuby by using the kit formula supplemented with NH4HCO3 gave crystals big enough for diffraction data collection. Structure determination confirmed the binding of HCO3 at the chromophore of mRuby (Figure 1, Tables S1 and S2). To test whether this substrate molecule could be reduced by light, more crystals of mRuby-HCO3 complex were obtained. Some mRuby-HCO3 complex crystals were flash frozen for diffraction data collection and online photo reduction (Figure 1c–e, Table S4), some mRuby-HCO3 complex crystals were subjected to visible light illumination before flash frozen and diffraction data collection (Figure 1b, Table S3). Although crystallized with NH4HCO3, the mRuby-CO2M1 structure showed a CO2-bound form (Figure 2).
Crystallization condition of mRuby-Carb1 (mRuby-HCO3), complex was 0.2 M NH4HCO3, 0.1 M Bistris pH 6.5, 25% PEG3350, cryoprotectant was 0.25 M NH4HCO3, 0.12 M Bistris pH 6.5, 25% PEG3350, 18% Glycerol. Crystallization condition of mRuby-Carb2M (mRuby-HCO3), complex was 0.2 M NH4HCO3, 0.1 M Bistris pH 6.5, 25% PEG3350, cryoprotectant was 0.3 M NH4HCO3, 0.12 M Bistris pH 6.5, 30% PEG3350, 16% Glycerol. Crystallization condition of mRuby-methanol (mRuby-Metha1) complex was 0.2 M NH4HCO3, 0.1 M Bistris pH 6.5, 25% PEG3350, cryoprotectant was 0.3 M NH4HCO3, 0.12 M Bistris pH 6.5, 30% PEG3350, 16% Glycerol. Although crystallized with NH4HCO3, the structure showed a product-bound state. This mRuby-CO2M was crystallized in the presence of bicarbonate. Crystallization condition of mRuby-CO2M complex was 0.2 M NH4HCO3, 0.2 M (NH4)2SO4, 0.1 M Bistris pH 6.5, 24% PEG3350, cryoprotectant was 0.3 M NH4HCO3, 0.4 M (NH4)2SO4, 0.12 M Bistris pH 6.5, 30% PEG3350, 16% Glycerol. X-ray diffraction datasets of mRuby-CO2M1~4 were collected one after another over 6 h. X-ray diffraction data of mRuby-Carb2M1~4 were collected after about 7 h.
Data processing and reduction were carried out by using CCP4 (v7.1.018) [34], XDS [35], Porpoise, xia2 [34,36], Dials [37], Aimless (v0.7.7) [38], etc. [39,40] (Table S1). Those datasets that were collected at BL10U2 [41] or BL02U1 [42] by using Finback [43] were automatically processed by Aquarium [40], unless unsuccessful. The data reduction pipeline includes data integration, merging, scaling, etc., by AutoprocXDS (XDS Version 30 June 2023) [44], Porpoise_XDS [44], xia2_dials [37] or Porpoise_Dials [37], or xia2_3dii, in parallel. The collected diffraction images were integrated, merged, and scaled. For summarization, the software used for diffraction data integration, merging, scaling, refinement, and validation, etc., was listed in Table S1. Some datasets were integrated by using Mosflm [45] and scaled and merged by using Aimless [46] of the CCP4 suite [38,47,48]. Some datasets were integrated, scaled, and merged by using HKL3000 [49] at the beamlines.
The phase angle was solved by molecular replacement with Molrep [50] from CCP4 suite(v9.0) [47] by using the atomic coordinates of a GFP structure (PDB code: 4GES) as a search model. Molecular-replacement solutions were manually modified using Coot (v0.9.8) [51], and refined by using REFMAC5 [52] and phenix.refine of the Phenix suite [53]. The final models were checked for geometrical correctness with PROCHECK [54]. The electron densities for the side chains of some residues of some structures were invisible, and these residues were artificially replaced by Alanine in the final models. Data collection and structure refinement statistics were summarized in Tables S1–S9. The occupancy of all three non-hydrogen atoms (heavy atoms) of the CO2 molecule at the chromophore of mRuby-CO2M3 was 0.9, and the temperature factor (B factors) of the non-hydrogen atoms of CO2 was (C 40.59, O2 34.94, O1 43.66). Electron density maps for figures were generated by using the FFT program of the CCP4 suite [38]. Cartoon and other protein structure representations were generated by using PyMOL (Open-Source PyMOL 0.99rc6, http://www.pymol.org) or UCSF Chimera [55]. The atomic coordinates and the structure factors have been deposited in the Protein Data Bank (PDB access codes: 9V56, mRuby-Carb1; 9V58, mRuby-Carb2M1; 9V5A, mRuby-Carb2M2; 9V5B, mRuby-Carb2M3; 9V5C, mRuby-Metha1; 9V5J, mRuby-CO2M1; 9V5D, mRuby-CO2M2; 9V5L, mRuby-CO2M3; 9V5E, mRuby-CO2M4.). X-ray dosage estimation was performed by using a function summarized from previous research [56,57,58].

4.3. Light Spectrophotometry of mRuby-NH4HCO3 (Fluorescence Spectrometry and UV-Vis Spectrometry)

Fluorescence spectrometry and UV-Vis spectrometry were employed to examine the optical property of mRuby, with and without the presence of various HCO3 concentrations (Figure 3 and Figure S3). The concentration of HCO3 was set up in gradients. An equal amount of fluorescent proteins from the same batch was added to the same volume of the HCO3 gradients. The corresponding empty buffer (without fluorescent protein) was used as a reference, respectively.
Fluorescence spectrometry was tested by using an RF-5301PC fluorescence spectrometer from the Shimadzu company (Kyoto, Japan). UV-Vis spectrometry was tested by using a UV-2600 UV-Vis spectrophotometer from Shimadzu (Kyoto, Japan). Fluorescence spectrometry was collected by using LabSolutions RF software (V2.04). UV-Vis spectra were collected using Shimadzu LabSolutions UV-Vis software (UV Prob v2.70). Light spectrometry was carried out at ambient temperature. mRuby protein samples were diluted into NH4HCO3 gradient solutions before examination of fluorescence or UV-Vis spectra.
For fluorescence spectrometry of mRuby, the final protein concentration was about 1 mg/mL. The slit width was set to EX:5 nm, and EM:5 nm. The excitation wavelength was set to 500 nm, and the scanning speed was set to slow. The aqueous buffer solution used for fluorescence was 1 M Tris pH 7.5, 0.1 M NaCl with NH4HCO3 gradient of 1 μM, 10 μM, 100 μM, 10 mM, 20 mM, 100 mM, and 200 mM.
UV-Vis absorption spectra of mRuby at various NH4HCO3 concentrations were tested by using a buffer system of 50 mM Bis-Tris pH 6.7, 0.2 M NaCl, with NH4HCO3 gradient of 0 μM (without NH4HCO3), 1 μM, 10 μM, 100 μM, 1 mM, 10 mM, 20 mM, 50 mM, 100 mM, and 200 mM (Figure 3). The final protein concentration of mRuby was about 1 mg/mL. The scanning range was set to 220–780 nm. The corresponding empty buffer (without fluorescent protein) was used as a reference, respectively. To double-check the effect of NH4HCO3 on fluorescence, another buffer, 50 mM Tris pH 7.5, 0.2 M NaCl, was also tried; and a buffering system of Bis-tris pH 6.7 and Tris pH 7.5 at a final concentration of about 1 M was also used (Figure S3). Similar results were obtained. The HCO3 gradient solutions’ UV-Vis absorption spectra were examined as well (Tables S5 and S7). As expected, the HCO3 solution by itself had no absorption at 350–700 nm, and variation of the HCO3 concentration by itself did not affect absorption spectra above 350 nm.
Other details of experimental procedures, Materials and Methods were provided as Supplementary Files.

Supplementary Materials

The following supporting information can be downloaded at: https://www.mdpi.com/article/10.3390/catal15060535/s1, Figure S1: Gas chromatography of sunlight illuminated mRuby with the presence of bicarbonate. Figure S2. The chromophore of fluorescent protein mRuby was not damaged after transformation of substrate bicarbonate (a) or CO2 (b) to product methanol. Figure S3. UV-Vis absorption spectra of mRuby with the presence of various bicarbonate concentration in 1M Tris7.5 buffer(left) and in 50mM Tris7.5 buffer(right). Figure S4. Superimposition of bicarbonate bound and acetate bound mRuby structures solved here. Figure S5. Substrate bicarbonate was within hydrogen bonding distance with the minor conformation of guanidine group of Arg67 as well. Table S1: Data collection and integration, merge and scale summary. Table S2: Statistics of data collection at 0.979Å and model refinement of mRuby-bicarbonate complex structure, mRuby-bicarbonat-1. Table S3: mRuby crystalized with bicarbonat show product. Table S4: mRuby bicarbonat2 product, Statistics of data collection and model refinement of mRuby-bicarbonate complex structures mRuby-Carb2M1, mRuby-Carb2M2, mRuby-Carb2M3. Table S5: mRuby UV-Vis spectra in 50mM pH6.7 with the addition of bicarbonate gradients. Table S6: mRuby UV-Vis spectra at pH7.5 with the addition of bicarbonate gradients. Table S7: mRuby fluorescence at pH7.5 in 1M buffer system with the addition of bicarbonate gradients. Tables S8 and S9: mRuby CO2 Methanol, Statistics of data collection and model refinement of mRuby-carbon dioxide complex structures CO2M1, CO2M2, CO2M3, CO2M4.

Author Contributions

J.D. conceived and supervised the project. J.D. designed, and J.X. carried out protein crystallization; J.X. and Q.C. carried out protein purification. J.D. performed X-ray crystallography experiments (crystal fishing, diffraction data collection, structure determination). J.D. designed, and J.X. and Q.C. carried out spectroscopy characterization. J.D. designed, and Q.C. performed the gas chromatography experiment. J.D. wrote and revised the manuscript. All authors have read and agreed to the published version of the manuscript.

Funding

This project was supported by the National Natural Science Foundation of China (grant number 31900913) to J.D., and the Key Scientific Research Program for Universities of Higher Education in Henan Province, grant number 24A350017.

Data Availability Statement

All data supporting the findings of this study are available within the paper or its Supplementary Materials, and are also available from the authors upon reasonable request. Newly created materials are available from the authors upon reasonable request. Correspondence and requests for materials, etc., should be addressed to Jianshu Dong.

Acknowledgments

Thanks to the support from Shanghai Synchrotron Radiation Facility (SSRF) and National Facility for Protein Science Shanghai (NFPSS). Thanks to the staff members of beamline BL10U2, BL02U1, BL19U1, and BL18U1 of SSRF and NFPSS for assistance in data collection. The Beamline Identity Code of the SSRF BL02U1 Macromolecular X-ray Crystallography Beamline is 31124.02.SSRF.BL02U1. The Beamline Identity Code of SSRF BL10U2-P2 BSL-2 MX Beamline is 31124.02.SSRF.BL10U2. We acknowledge the staff of beamline BL10U2 at the Shanghai Synchrotron Radiation Facility for assistance during the data collection (https://cstr.cn/31124.02.SSRF.BL10U2 (accessed on 21 May 2025)). We acknowledge the staff of beamline BL02U1 at the Shanghai Synchrotron Radiation Facility for assistance during the data collection (https://cstr.cn/31124.02.SSRF.BL02U1 (accessed on 21 May 2025)). Thanks to the help from other members of the group, who have assisted with this project. Thanks to all those who have helped with this project. The assistance of the TTP Labtech Mosquito Crystal machine of Zhengzhou University, with asset number 1735810S, is acknowledged here, if there is any. Thanks to the support from the center of advanced analysis and gene sequencing of Zhengzhou University. Thanks to the support from the National Supercomputing Center in Zhengzhou.

Conflicts of Interest

The authors declare no competing interests. The authors have no known competing financial interests to declare. This article does not contain any studies with human or animal subjects performed by any of the authors.

References

  1. Huang, B.; Bates, M.; Zhuang, X. Super-resolution fluorescence microscopy. Annu. Rev. Biochem. 2009, 78, 993–1016. [Google Scholar] [CrossRef]
  2. Chudakov, D.M.; Matz, M.V.; Lukyanov, S.; Lukyanov, K.A. Fluorescent proteins and their applications in imaging living cells and tissues. Physiol. Rev. 2010, 90, 1103–1163. [Google Scholar] [CrossRef] [PubMed]
  3. Tsien, R.Y. The green fluorescent protein. Annu. Rev. Biochem. 1998, 67, 509–544. [Google Scholar] [CrossRef] [PubMed]
  4. Shimomura, O. The discovery of aequorin and green fluorescent protein. J. Microsc. 2005, 217 Pt 1, 3–15. [Google Scholar] [CrossRef]
  5. Hoyer, P.; de Medeiros, G.; Balazs, B.; Norlin, N.; Besir, C.; Hanne, J.; Krausslich, H.G.; Engelhardt, J.; Sahl, S.J.; Hell, S.W.; et al. Breaking the diffraction limit of light-sheet fluorescence microscopy by RESOLFT. Proc. Natl. Acad. Sci. USA 2016, 113, 3442–3446. [Google Scholar] [CrossRef]
  6. Wu, Y.; Han, X.; Su, Y.; Glidewell, M.; Daniels, J.S.; Liu, J.; Sengupta, T.; Rey-Suarez, I.; Fischer, R.; Patel, A.; et al. Multiview confocal super-resolution microscopy. Nature 2021, 600, 279–284. [Google Scholar] [CrossRef]
  7. Shcherbakova, D.M.; Shemetov, A.A.; Kaberniuk, A.A.; Verkhusha, V.V. Natural Photoreceptors as a Source of Fluorescent Proteins, Biosensors, and Optogenetic Tools. Annu. Rev. Biochem. 2015, 84, 519–550. [Google Scholar] [CrossRef]
  8. Grotjohann, T.; Testa, I.; Leutenegger, M.; Bock, H.; Urban, N.T.; Lavoie-Cardinal, F.; Willig, K.I.; Eggeling, C.; Jakobs, S.; Hell, S.W. Diffraction-unlimited all-optical imaging and writing with a photochromic GFP. Nature 2011, 478, 204–208. [Google Scholar] [CrossRef] [PubMed]
  9. Carpentier, P.; Violot, S.; Blanchoin, L.; Bourgeois, D. Structural basis for the phototoxicity of the fluorescent protein KillerRed. FEBS Lett. 2009, 583, 2839–2842. [Google Scholar] [CrossRef]
  10. Pletnev, S.; Gurskaya, N.G.; Pletneva, N.V.; Lukyanov, K.A.; Chudakov, D.M.; Martynov, V.I.; Popov, V.O.; Kovalchuk, M.V.; Wlodawer, A.; Dauter, Z.; et al. Structural basis for phototoxicity of the genetically encoded photosensitizer KillerRed. J. Biol. Chem. 2009, 284, 32028–32039. [Google Scholar] [CrossRef]
  11. Bulina, M.E.; Chudakov, D.M.; Britanova, O.V.; Yanushevich, Y.G.; Staroverov, D.B.; Chepurnykh, T.V.; Merzlyak, E.M.; Shkrob, M.A.; Lukyanov, S.; Lukyanov, K.A. A genetically encoded photosensitizer. Nat. Biotechnol. 2006, 24, 95–99. [Google Scholar] [CrossRef] [PubMed]
  12. Acharya, A.; Bogdanov, A.M.; Grigorenko, B.L.; Bravaya, K.B.; Nemukhin, A.V.; Lukyanov, K.A.; Krylov, A.I. Photoinduced Chemistry in Fluorescent Proteins: Curse or Blessing? Chem. Rev. 2017, 117, 758–795. [Google Scholar] [CrossRef] [PubMed]
  13. Bogdanov, A.M.; Mishin, A.S.; Yampolsky, I.V.; Belousov, V.V.; Chudakov, D.M.; Subach, F.V.; Verkhusha, V.V.; Lukyanov, S.; Lukyanov, K.A. Green fluorescent proteins are light-induced electron donors. Nat. Chem. Biol. 2009, 5, 459–461. [Google Scholar] [CrossRef] [PubMed]
  14. Vegh, R.B.; Bravaya, K.B.; Bloch, D.A.; Bommarius, A.S.; Tolbert, L.M.; Verkhovsky, M.; Krylov, A.I.; Solntsev, K.M. Chromophore photoreduction in red fluorescent proteins is responsible for bleaching and phototoxicity. J. Phys. Chem. B 2014, 118, 4527–4534. [Google Scholar] [CrossRef]
  15. Bogdanov, A.M.; Acharya, A.; Titelmayer, A.V.; Mamontova, A.V.; Bravaya, K.B.; Kolomeisky, A.B.; Lukyanov, K.A.; Krylov, A.I. Turning On and Off Photoinduced Electron Transfer in Fluorescent Proteins by pi-Stacking, Halide Binding, and Tyr145 Mutations. J. Am. Chem. Soc. 2016, 138, 4807–4817. [Google Scholar] [CrossRef]
  16. Lino, F.S.D.; Bajic, D.; Vila, J.C.C.; Sánchez, A.; Sommer, M.O.A. Complex yeast-bacteria interactions affect the yield of industrial ethanol fermentation. Nat. Commun. 2021, 12, 1498. [Google Scholar] [CrossRef]
  17. Wolff, C.M.; Frischmann, P.D.; Schulze, M.; Bohn, B.J.; Wein, R.; Livadas, P.; Carlson, M.T.; Jäckel, F.; Feldmann, J.; Würthner, F.; et al. All-in-one visible-light-driven water splitting by combining nanoparticulate and molecular co-catalysts on CdS nanorods. Nat. Energy 2018, 3, 862–869. [Google Scholar] [CrossRef]
  18. Ashida, Y.; Onozuka, Y.; Arashiba, K.; Konomi, A.; Tanaka, H.; Kuriyama, S.; Yamazaki, Y.; Yoshizawa, K.; Nishibayashi, Y. Catalytic nitrogen fixation using visible light energy. Nat. Commun. 2022, 13, 7263. [Google Scholar] [CrossRef]
  19. Maiti, S.; Ghosh, P.; Raja, D.; Ghosh, S.; Chatterjee, S.; Sankar, V.; Roy, S.; Lahiri, G.K.; Maiti, D. Light-induced Pd catalyst enables C(sp)-C(sp) cross-electrophile coupling bypassing the demand for transmetalation. Nat. Catal. 2024, 7, 285–294. [Google Scholar] [CrossRef]
  20. Fang, W.S.; Guo, W.; Lu, R.H.; Yan, Y.; Liu, X.K.; Wu, D.; Li, F.M.; Zhou, Y.S.; He, C.H.; Xia, C.F.; et al. Durable CO2 conversion in the proton-exchange membrane system. Nature 2024, 626, 86–91. [Google Scholar] [CrossRef]
  21. Liu, X.; Kang, F.; Hu, C.; Wang, L.; Xu, Z.; Zheng, D.; Gong, W.; Lu, Y.; Ma, Y.; Wang, J. A genetically encoded photosensitizer protein facilitates the rational design of a miniature photocatalytic CO2-reducing enzyme. Nat. Chem. 2018, 10, 1201–1206. [Google Scholar] [CrossRef] [PubMed]
  22. Kang, F.Y.; Yu, L.; Xia, Y.; Yu, M.L.; Xia, L.; Wang, Y.C.A.; Yang, L.; Wang, T.Y.; Gong, W.M.; Tian, C.L.; et al. Rational Design of a Miniature Photocatalytic CO-Reducing Enzyme. ACS Catal. 2021, 11, 5628–5635. [Google Scholar] [CrossRef]
  23. Zhang, J.Z.; Reisner, E. Advancing photosystem II photoelectrochemistry for semi-artificial photosynthesis. Nat. Rev. Chem. 2020, 4, 6–21. [Google Scholar] [CrossRef]
  24. Yehezkeli, O.; Tel-Vered, R.; Wasserman, J.; Trifonov, A.; Michaeli, D.; Nechushtai, R.; Willner, I. Integrated photosystem II-based photo-bioelectrochemical cells. Nat. Commun. 2012, 3, 742. [Google Scholar] [CrossRef]
  25. Efrati, A.; Lu, C.H.; Michaeli, D.; Nechushtai, R.; Alsaoub, S.; Schuhmann, W.; Willner, I. Assembly of photo-bioelectrochemical cells using photosystem I-functionalized electrodes. Nat. Energy 2016, 1, 15021. [Google Scholar] [CrossRef]
  26. Leverenz, R.L.; Sutter, M.; Wilson, A.; Gupta, S.; Thurotte, A.; de Carbon, C.B.; Petzold, C.J.; Ralston, C.; Perreau, F.; Kirilovsky, D.; et al. A 12 Å carotenoid translocation in a photoswitch associated with cyanobacterial photoprotection. Science 2015, 348, 1463–1466. [Google Scholar] [CrossRef]
  27. Ho, M.Y.; Shen, G.Z.; Canniffe, D.P.; Zhao, C.; Bryant, D.A. Light-dependent chlorophyll f synthase is a highly divergent paralog of PsbA of photosystem II. Science 2016, 353, aaf9178. [Google Scholar] [CrossRef]
  28. Sancar, A. Mechanisms of DNA Repair by Photolyase and Excision Nuclease (Nobel Lecture). Angew. Chem. Int. Ed. 2016, 55, 8502–8527. [Google Scholar] [CrossRef]
  29. Sorigué, D.; Légeret, B.; Cuiné, S.; Blangy, S.; Moulin, S.; Billon, E.; Richaud, P.; Brugière, S.; Couté, Y.; Nurizzo, D.; et al. An algal photoenzyme converts fatty acids to hydrocarbons. Science 2017, 357, 903–907. [Google Scholar] [CrossRef]
  30. Fu, H.G.; Cao, J.Z.; Qiao, T.Z.; Qi, Y.Y.; Charnock, S.J.; Garfinkle, S.; Hyster, T.K. An asymmetric cross-electrophile coupling using ‘ene’-reductases. Nature 2022, 610, 302–307. [Google Scholar] [CrossRef]
  31. Huang, X.Q.; Wang, B.J.; Wang, Y.J.; Jiang, G.D.; Feng, J.Q.; Zhao, H.M. Photoenzymatic enantioselective intermolecular radical hydroalkylation. Nature 2020, 584, 69–74. [Google Scholar] [CrossRef] [PubMed]
  32. Yang, Y.; Fan, S.J.; Webb, J.A.; Ma, Y.Q.; Goyette, J.; Chen, X.Q.; Gaus, K.; Tilley, R.D.; Gooding, J. Electrochemical fluorescence switching of enhanced green fluorescent protein. Biosens. Bioelectron. 2023, 237, 115467. [Google Scholar] [CrossRef] [PubMed]
  33. Tanwar, A.; Mukherjee, A.; Nath, D.; Das, I.; Moulick, R.G.; Bhattacharya, J. Electrochemical Impedance Spectroscopy for studying fluorescence loss in immobilized Green Fluorescent Protein. J. Photoch Photobio A 2023, 445, 115083. [Google Scholar] [CrossRef]
  34. Agirre, J.; Atanasova, M.; Bagdonas, H.; Ballard, C.B.; Baslé, A.; Beilsten-Edmands, J.; Borges, R.J.; Brown, D.G.; Burgos-Mármol, J.J.; Berrisford, J.M.; et al. The CCP4 suite: Integrative software for macromolecular crystallography. Acta Crystallogr. Sect. D-Struct. Biol. 2023, 79, 449–461. [Google Scholar] [CrossRef]
  35. Kabsch, W. Xds. Acta Crystallogr. D 2010, 66, 125–132. [Google Scholar] [CrossRef]
  36. Winter, G. xia2: An expert system for macromolecular crystallography data reduction. J. Appl. Crystallogr. 2010, 43, 186–190. [Google Scholar] [CrossRef]
  37. Winter, G.; Waterman, D.G.; Parkhurst, J.M.; Brewster, A.S.; Gildea, R.J.; Gerstel, M.; Fuentes-Montero, L.; Vollmar, M.; Michels-Clark, T.; Young, I.D.; et al. DIALS: Implementation and evaluation of a new integration package. Acta Crystallogr. Sect. D-Struct. Biol. 2018, 74, 85–97. [Google Scholar] [CrossRef]
  38. Winn, M.D.; Ballard, C.C.; Cowtan, K.D.; Dodson, E.J.; Emsley, P.; Evans, P.R.; Keegan, R.M.; Krissinel, E.B.; Leslie, A.G.W.; McCoy, A.; et al. Overview of theCCP4 suite and current developments. Acta Crystallogr. Sect. D Biol. Crystallogr. 2011, 67, 235–242. [Google Scholar] [CrossRef] [PubMed]
  39. Otwinowski, Z.; Minor, W. Processing of X-ray diffraction data collected in oscillation mode. Method Enzymol. 1997, 276, 307–326. [Google Scholar] [CrossRef]
  40. Yu, F.; Wang, Q.; Li, M.; Zhou, H.; Liu, K.; Zhang, K.; Wang, Z.; Xu, Q.; Xu, C.; Pan, Q.; et al. Aquarium: An automatic data-processing and experiment information management system for biological macromolecular crystallography beamlines. J. Appl. Crystallogr. 2019, 52, 472–477. [Google Scholar] [CrossRef]
  41. Xu, Q.; Kong, H.T.; Liu, K.; Zhou, H.; Zhang, K.H.; Wang, W.W.; Li, M.J.; Pan, Q.Y.; Wang, X.Y.; Wang, Y.Z.; et al. The biosafety level-2 macromolecular crystallography beamline (BL10U2) at the Shanghai Synchrotron Radiation Facility. Nucl. Sci. Tech. 2023, 34, 202. [Google Scholar] [CrossRef]
  42. Tai, R.Z.; Zhao, Z.T. Overview of SSRF phase-II beamlines. Nucl. Sci. Tech. 2024, 35, 137. [Google Scholar] [CrossRef]
  43. Yu, F.; Liu, K.; Zhou, H.; Li, M.; Kong, H.; Zhang, K.; Wang, X.; Wang, W.; Xu, Q.; Pan, Q.; et al. Finback: A web-based data collection system at SSRF biological macromolecular crystallography beamlines. J. Synchrotron Radiat. 2024, 31, 378–384. [Google Scholar] [CrossRef]
  44. Kabsch, W. Integration, scaling, space-group assignment and post-refinement. Acta Crystallogr. D 2010, 66, 133–144. [Google Scholar] [CrossRef] [PubMed]
  45. Powell, H.R.; Battye, T.G.G.; Kontogiannis, L.; Johnson, O.; Leslie, A.G.W. Integrating macromolecular X-ray diffraction data with the graphical user interface iMosflm. Nat. Protoc. 2017, 12, 1310–1325. [Google Scholar] [CrossRef]
  46. Evans, P.R.; Murshudov, G.N. How good are my data and what is the resolution? Acta Crystallogr. D 2013, 69, 1204–1214. [Google Scholar] [CrossRef]
  47. Collaborative Computational Project. The CCP4 suite: Programs for protein crystallography. Acta Crystallogr. Sect. D Biol. Crystallogr. 1994, 50 Pt 5, 760–763. [Google Scholar] [CrossRef] [PubMed]
  48. Potterton, E.; Briggs, P.; Turkenburg, M.; Dodson, E. A graphical user interface to the program suite CCP4. Acta Crystallogr. Sect. D-Struct. Biol. 2003, 59, 1131–1137. [Google Scholar] [CrossRef]
  49. Minor, W.; Cymborowski, M.; Otwinowski, Z.; Chruszcz, M. HKL-3000: The integration of data reduction and structure solution—From diffraction images to an initial model in minutes. Acta Crystallogr. Sect. D-Struct. Biol. 2006, 62, 859–866. [Google Scholar] [CrossRef]
  50. Vagin, A.; Teplyakov, A. An approach to multi-copy search in molecular replacement. Acta Crystallogr. Sect. D-Struct. Biol. 2000, 56, 1622–1624. [Google Scholar] [CrossRef]
  51. Emsley, P.; Cowtan, K. Coot: Model-building tools for molecular graphics. Acta Crystallogr. D 2004, 60, 2126–2132. [Google Scholar] [CrossRef] [PubMed]
  52. Kovalevskiy, O.; Nicholls, R.A.; Long, F.; Carlon, A.; Murshudov, G.N. Overview of refinement procedures within REFMAC5: Utilizing data from different sources. Acta Crystallogr. Sect. D-Struct. Biol. 2018, 74, 215–227. [Google Scholar] [CrossRef] [PubMed]
  53. Adams, P.D.; Afonine, P.V.; Bunkoczi, G.; Chen, V.B.; Davis, I.W.; Echols, N.; Headd, J.J.; Hung, L.W.; Kapral, G.J.; Grosse-Kunstleve, R.W.; et al. PHENIX: A comprehensive Python-based system for macromolecular structure solution. Acta Crystallogr. Sect. D Biol. Crystallogr. 2010, 66 Pt 2, 213–221. [Google Scholar] [CrossRef]
  54. Laskowski, R.A.; Macarthur, M.W.; Moss, D.S.; Thornton, J.M. Procheck—A Program to Check the Stereochemical Quality of Protein Structures. J. Appl. Crystallogr. 1993, 26, 283–291. [Google Scholar] [CrossRef]
  55. Pettersen, E.F.; Goddard, T.D.; Huang, C.C.; Couch, G.S.; Greenblatt, D.M.; Meng, E.C.; Ferrin, T.E. UCSF Chimera—A visualization system for exploratory research and analysis. J. Comput. Chem. 2004, 25, 1605–1612. [Google Scholar] [CrossRef]
  56. Sutton, K.A.; Black, P.J.; Mercer, K.R.; Garman, E.F.; Owen, R.L.; Snell, E.H.; Bernhard, W.A. Insights into the mechanism of X-ray-induced disulfide-bond cleavage in lysozyme crystals based on EPR, optical absorption and X-ray diffraction studies. Acta Crystallogr. Sect. D-Struct. Biol. 2013, 69, 2381–2394. [Google Scholar] [CrossRef]
  57. Atakisi, H.; Conger, L.; Moreau, D.W.; Thorne, R.E. Resolution and dose dependence of radiation damage in biomolecular systems. Iucrj 2019, 6, 1040–1053. [Google Scholar] [CrossRef]
  58. de la Mora, E.; Coquelle, N.; Bury, C.S.; Rosenthal, M.; Holton, J.M.; Carmichael, I.; Garman, E.F.; Burghammer, M.; Colletier, J.P.; Weik, M. Radiation damage and dose limits in serial synchrotron crystallography at cryo- and room temperatures. Proc. Natl. Acad. Sci. USA 2020, 117, 4142–4151. [Google Scholar] [CrossRef]
Figure 1. Reduction of bicarbonate by mRuby. Structures of (ac) here were from three distinct mRuby crystals. Structures (mRuby-Carb2M1~3, (cf) here) were from the same single mRuby crystal. For (ae), 2Fo–Fc map (blue colored mesh) contoured at 1.2σ. (a) Substrate bicarbonate bound to the chromophore of mRuby-Carb1 with resolution at 1.94 Å. Fo–Fc omit electron density map (green colored mesh) contoured at 5σ. (b) mRuby-Metha1, with product presumably methanol at the chromophore, with resolution at 1.68 Å. Fo–Fc omit electron density map (green colored mesh) contoured at 4σ. (c) mRuby-Carb2M1 with resolution at 1.55 Å. Fo–Fc omit electron density map (green colored mesh) contoured at 5σ. (d), mRuby-Carb2M2, with resolution at 1.67 Å. Fo–Fc omit electron density map (green colored mesh) contoured at 5σ. (e) Third dataset mRuby-Carb2M3, with resolution at 1.75 Å, with product at the chromophore. Fo–Fc omit electron density map (green colored mesh) contoured at 5σ. (f) Interaction between substrate bicarbonate and mRuby-Carb2M1. Explanation of Figure 1 colors, For stick models, Carbon element of ligands (bicarbonate and product) was colored in green, and carbon element from mRuby was colored orange; Nitrogen atoms were colored blue and oxygen atoms were colored red. Partially transparent cartoon was colored orange.
Catalysts 15 00535 g001
Figure 2. Reduction of CO2 by mRuby. Structures ((ae), Tables S8 and S9) here were from the same single mRuby-CO2M crystal. For (ad), 2Fo-Fc map (blue colored mesh) contoured at 1.2σ. (a) Substrate CO2 bound to the chromophore of mRuby-CO2M1 with resolution at 1.74 Å. Fo–Fc omit electron density map (green colored mesh) contoured at 3.5σ. (b) mRuby-CO2M2, with CO2 at the chromophore, with resolution at 1.89 Å. Fo–Fc omit electron density map (green colored mesh) contoured at 4.5σ. (c) mRuby-CO2M3 with resolution at 2.0 Å. Fo–Fc omit electron density map (green colored mesh) contoured at 4.5σ. (d), mRuby-CO2M4, with product at chromophore and resolution at 2.06 Å. Fo–Fc omit electron density map (green colored mesh) contoured at 4.8σ. (e) Interaction between substrate CO2 and mRuby-CO2M1. Explanation of Figure 2 colors, For stick models, Carbon element of ligands (CO2 and product) was colored in green, and carbon element from mRuby was colored orange; Nitrogen atoms were colored blue and oxygen atoms were colored red. Partially transparent cartoon was colored orange.
Catalysts 15 00535 g002
Figure 3. Spectrometry of mRuby at various bicarbonate concentrations. (a) UV-Vis absorption spectra of mRuby. (b) Fluorescence spectra of mRuby. The decrease of fluorescence with the increase of substrate bicarbonate was indicated by the arrow.
Catalysts 15 00535 g003
Figure 4. Schematic diagram of the system used for this research.
Catalysts 15 00535 g004
Disclaimer/Publisher’s Note: The statements, opinions and data contained in all publications are solely those of the individual author(s) and contributor(s) and not of MDPI and/or the editor(s). MDPI and/or the editor(s) disclaim responsibility for any injury to people or property resulting from any ideas, methods, instructions or products referred to in the content.

