Article

Synchronous Removal of Organic Pollutants and Phosphorus from Emergency Wastewater in Chemical Industry Park by Plasma Catalysis System Based on Calcium Peroxide

1
College of Safety Science and Engineering, Nanjing Tech University, Nanjing 211816, China
2
College of Natural Resources and Environment, Northwest A&F University, Yangling 712100, China
*
Authors to whom correspondence should be addressed.
Catalysts 2025, 15(5), 486; https://doi.org/10.3390/catal15050486 (registering DOI)
Submission received: 28 March 2025 / Revised: 9 May 2025 / Accepted: 10 May 2025 / Published: 16 May 2025
(This article belongs to the Special Issue Plasma Catalysis for Environment and Energy Applications)

Abstract

:
This study employs a plasma-coupled calcium peroxide (CaO2) system to degrade tetracycline (TC) and remove phosphorus from emergency wastewater in a chemical industry park. The plasma/CaO2 system achieves optimal performance when the CaO2 dosage reaches 0.13 g/L. Higher degradation efficiencies of TC were observed at increased discharge voltages, frequencies, and under weakly acidic and weakly alkaline conditions. Variations in discharge voltage and frequency have no significant impact on the phosphorus removal efficiency, but weakly alkaline conditions favor phosphorus removal. The reactive species (·OH, 1O2, O2·) within the plasma/CaO2 system were identified, and their roles were elucidated using radical scavengers. Subsequently, the degradation process was characterized by measuring changes in total organic carbon (TOC), chemical oxygen demand (COD), and ammonia nitrogen during the reaction, along with three-dimensional fluorescence analysis and ultraviolet-visible spectroscopy (UV-Vis). Eight intermediate products were identified through LC-MS, and two degradation pathways were clarified based on density functional theory. The toxicity analysis of the intermediate products demonstrated that the plasma/CaO2 system is an efficient, feasible, and environmentally friendly method for the synchronous removal of organic pollutants and phosphorus from emergency wastewater in a chemical industry park.

1. Introduction

The chemical industry serves as a vital pillar of China’s national economy. However, the wastewater produced during chemical manufacturing processes is often complex in composition, particularly the emergency wastewater from chemical industry parks, which typically contains high concentrations of organic pollutants and phosphorus [1]. This type of wastewater is highly toxic and hazardous. Organic pollutants can deplete dissolved oxygen in aquatic environments, leading to water blackening, foul odors, and severe disruption of aquatic ecosystems [2,3,4]. Meanwhile, phosphorus is a primary driver of water eutrophication, triggering algal blooms and further aggravating water pollution [5]. More critically, the coexistence of organic matter and phosphorus can form more stable composite pollutants, significantly increasing the difficulty of treatment and posing a serious threat to water environment safety and ecological health [6,7]. Therefore, the development of efficient, rapid, and synchronous technologies for the removal of organic pollutants and phosphorus from emergency wastewater in chemical industry parks is urgently needed.
Currently, the treatment of organic matter and phosphorus in chemical emergency wastewater primarily employs a step-by-step approach, where organic matter is first removed through chemical oxidation, adsorption, or biodegradation, followed by phosphorus removal through chemical precipitation or crystallization [8]. However, this stepwise treatment method suffers from several drawbacks, including complex processes, prolonged treatment cycles, high operational costs, and difficulties in achieving efficient simultaneous removal of organic matter and phosphorus [9]. Additionally, traditional methods may generate secondary pollution during the treatment process, such as toxic by-products from chemical oxidation and large amounts of sludge from chemical precipitation, making it challenging to meet green and environmental protection requirements.
To address these challenges, this study proposes the integration of plasma technology with calcium peroxide (CaO2) to develop a novel and efficient treatment strategy for the simultaneous removal of organic matter and phosphorus. Plasma technology can generate highly reactive species, such as hydroxyl radicals (·OH) and ozone (O3), which rapidly degrade organic compounds [10,11,12,13,14]. CaO2, as an environmentally friendly oxidant, can release hydrogen peroxide (H2O2) to further oxidize organic matter and react with phosphate ions in water to form precipitates, thereby achieving simultaneous phosphorus removal [15,16,17,18]. The advantages can be subscribed as follows: Firstly, the physicochemical effects induced by plasma can enhance the generation of hydroxyl radicals (·OH) from hydrogen peroxide (H2O2) released by CaO2. Secondly, the alkaline environment created by CaO2 dissolution facilitates the conversion of ozone generated from plasma into additional ·OH radicals. These coupled effects collectively promote the degradation of organic pollutants while improving the energy utilization efficiency of the plasma system. Meanwhile, the calcium ions (Ca2+) released from CaO2 react with phosphate anions (PO43−) in the aqueous solution to form calcium phosphate precipitates (e.g., Ca5(PO4)3OH), thereby achieving synchronous removal of organic contaminants and phosphorus.
Accordingly, a plasma–CaO2 coupled system was established to investigate the removal performance of tetracycline (TC) and phosphorus, which frequently coexist in industrial wastewater [19]. The effects of CaO2 dosage, discharge voltage, and discharge frequency on the degradation and removal efficiencies of TC and phosphorus were systematically investigated. Furthermore, the influence of the initial solution concentration and initial pH on the degradation efficiency of tetracycline and phosphorus was examined. To elucidate the role of reactive species in the degradation process, a free radical scavengers experiment was employed. Based on liquid chromatography-mass spectrometry (LC-MS) analyses and density functional theory (DFT), the specific degradation pathways of tetracycline by plasma-coupled calcium peroxide were elucidated. Additionally, the toxicity of the intermediate products was evaluated using T.E.S.T software (Version 4.1).

2. Results and Discussion

2.1. Effects of Various Parameters

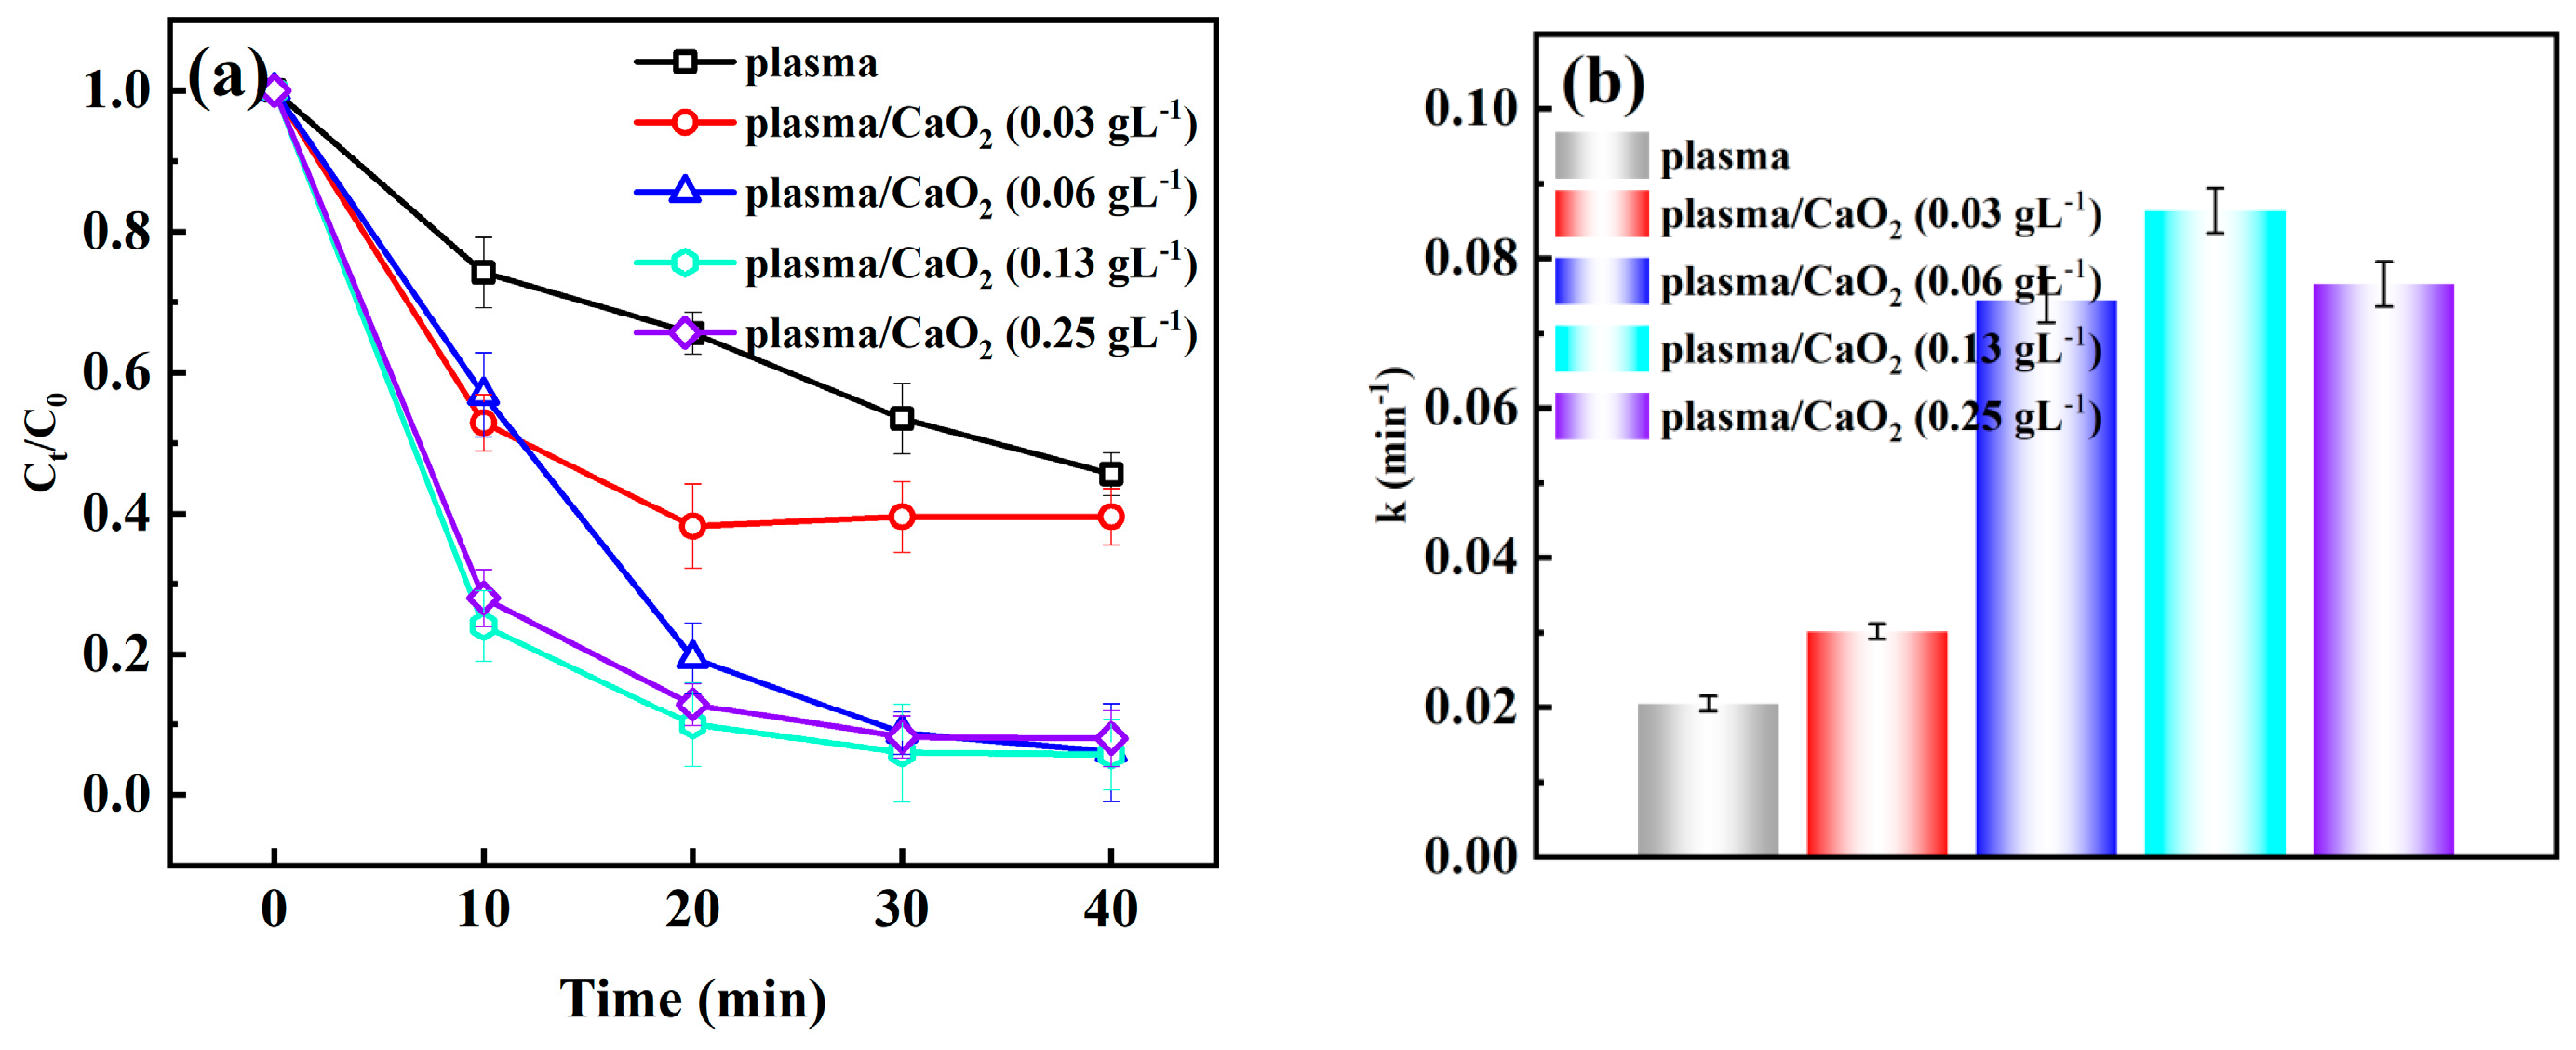
2.1.1. Effect of CaO2 Addition

The effect of CaO2 addition on the removal of TC and phosphorus was first investigated. As shown in Figure 1a, the addition of CaO2 promotes the degradation efficiency of TC compared to the plasma system alone, and the efficiency increases with higher CaO2 dosages. When the dosage reaches 0.25 g/L, the degradation efficiency of TC reaches its peak at 94.3%. From Figure 1b, it is evident that as the CaO2 dosage increases, the kinetic constant also increases. When the concentration increases from 0 g/L to 0.25 g/L, the kinetic constant rises from 0.0205 min−1 to 0.0864 min−1, after which it tends to decline. Clearly, the variation in the kinetic constant is consistent with the trend in the TC degradation efficiency. This phenomenon can be attributed to the fact that CaO2 releases a large amount of H2O2 in water, which reacts with O3 generated by the plasma system. The mutual consumption of H2O2 and O3 leads to a reduction in the concentration of both reactive species, ultimately decreasing the TC degradation efficiency at higher CaO2 dosages [13].
As illustrated in Figure 1c, it was observed that the standalone plasma system is incapable of phosphorus removal. With the addition of CaO2, the removal efficiency of phosphorus escalates with increasing dosages of CaO2. When the dosage reaches 0.25 g/L, the removal efficiency can attain 85.7%, and the kinetic constant progressively increases, reaching a maximum of 0.0491 min−1 (Figure 1d). The observed phosphorus removal trends can be attributed to the synergistic effects of plasma-driven oxidation and calcium peroxide (CaO2)-induced precipitation [20]. CaO2 hydrolyzes in water to release Ca2+ and H2O2 (Equation (1)):
CaO2 + 2H2O → Ca2+ + 2OH + H2O2
The generated Ca2+ reacts with phosphate (PO43−) to form insoluble calcium phosphate precipitates (e.g., hydroxyapatite, Ca5(PO4)3OH), which predominantly contribute to phosphorus removal. The alkaline environment (OH) from CaO2 hydrolysis further enhances phosphate precipitation. While plasma alone generates reactive oxygen species (ROS) for organic degradation, it lacks Ca2+ sources for phosphorus immobilization. In the hybrid system, plasma may enhance CaO2 activation by: (i) accelerating H2O2 decomposition to produce more ·OH, thereby facilitating organic oxidation [21]; and (ii) electrostatic interactions between plasma-generated ions and phosphate, promoting Ca2+-PO43− collision efficiency [22]. Higher CaO2 dosages provide more Ca2+ for precipitation, explaining the efficiency escalation. Excess CaO2 may saturate the system, causing marginal gains (e.g., a pH > 10 could redissolve precipitates). The pseudo-first-order kinetic constant reflects rapid phosphorus removal, likely attributable to the fast nucleation and growth of calcium phosphate particles under plasma-catalyzed conditions.

2.1.2. Effect of Initial Concentration

The effect of the initial concentration of TC and phosphorus in the solution on the degradation efficiency was then evaluated. A certain concentration of TC and phosphorus was added to pure water to simulate real polluted water bodies. As shown in Figure S2a,b, both the TC degradation efficiency and the kinetic constant increased with the initial TC concentration, reaching maxima of 84.6% and 0.0581 min−1, respectively, at 0.4 g/L. Subsequently, due to the increase in TC concentration, more TC adheres to the surface of CaO2, reducing its active sites and the amount of H2O2 released, leading to a decrease in the TC degradation efficiency as its concentration increases [23]. In contrast, as shown in Figure S2c,d, the removal efficiency of phosphorus and the corresponding kinetic constant remained relatively unchanged with increasing initial TC concentrations, suggesting that the initial concentration of TC had no significant effect on phosphorus removal.
As illustrated in Figure S3a,b, the degradation efficiency of TC decreases with the increase in phosphorus concentration, and the kinetic constant also declines as the phosphorus concentration rises, gradually decreasing from 0.0923 min−1 to 0.0613 min−1. This is because excess phosphorus decreased the released amount of H2O2, leading to a lower degradation efficiency of TC. From Figure S3c,d, it can be observed that the removal efficiency of phosphorus increases with its initial concentration, and the kinetic constant also gradually rises. This is because the increase in phosphorus concentration increases the collision probability with Ca2+ and improves its removal efficiency [24].

2.1.3. Effect of Discharge Voltage

The discharge voltage of plasma influences the degradation efficiency of TC and the removal efficiency of phosphorus. The discharge voltage of plasma affects the electric field strength between the electrodes and determines the input energy of the reactor, which in turn influences the intensity of ultraviolet light and the energy and velocity of free electrons during the discharge process. As shown in Figure S4a,b, the degradation efficiency of TC increased with increasing discharge voltages. At input voltages of 160, 180, 200, 220, and 240 V, the degradation efficiencies of TC can reach 72.2%, 76.6%, 86.8%, 89.7%, and 93.2%, respectively, with the kinetic constant increasing from 0.0355 min−1 to 0.0707 min−1. This enhancement is attributed to the higher electrical energy provided at elevated voltages, which generates more reactive species. The increased production of reactive species promotes the oxidation of TC, thereby improving its degradation efficiency [25]. From Figure S4c,d, it can be seen that the removal efficiency of phosphorus and the kinetic constant change very little, indicating that the discharge voltage has a minor effect on phosphorus removal.

2.1.4. Effect of Discharge Frequency

The effect of the discharge frequency on the degradation efficiency of TC and the removal efficiency of phosphorus was examined. As depicted in Figure S5a,b, the higher the discharge frequency, the greater the degradation efficiency of TC. At discharge frequencies of 160, 180, 200, 220, and 240 Hz, the degradation efficiencies of TC can reach 70.4%, 76.5%, 82.7%, 85.1%, and 87.4%, respectively, with the kinetic constant increasing from 0.0337 min−1 to 0.0567 min−1. This is because an increase in discharge frequency leads to a higher number of high-energy electrons generated in the system per unit time, resulting in an increased production of reactive species with strong oxidizing properties, such as ·OH and O3, and the oxidation of more TC, thus enhancing the degradation efficiency [25]. From Figure S5c,d, it can be observed that the removal efficiency of phosphorus and the kinetic constant remain almost unchanged, indicating that variations in the discharge frequency do not affect the removal of phosphorus.

2.1.5. Effect of Solution pH

The influence of solution pH on the degradation efficiency of TC and the removal efficiency of phosphorus was investigated. As shown in Figure S6a,b, as the pH increases from 3 to 11.7, both the TC degradation efficiency and the kinetic constant initially rise and then decline, reaching their highest values at a pH of 9.6, which are 91.1% and 0.0648 min−1, respectively. It is evident that TC degradation is less efficient under strongly acidic or strongly alkaline conditions, while higher efficiency is observed under mildly acidic to mildly alkaline conditions. This behavior can be attributed to the fact that the degradation of TC involves acidification reactions. Extreme pH conditions are unfavorable for further acidification and mineralization processes, thereby inhibiting the overall degradation efficiency of TC.
As depicted in Figure S6c, the phosphorus removal efficiency reaches its peak at 96.51% when the pH is 9.2. In Figure S6d, the kinetic constant at a pH of 3 is infinitely close to zero, indicating that phosphorus is almost not removed under strong acidic conditions. Under alkaline conditions, the phosphorus removal efficiency is higher, but it is inhibited under strong alkaline conditions. This is mainly because pH can alter the surface charge characteristics of the adsorbent, the dissociation state of the solute, and the dissolution equilibrium, thereby affecting the adsorption efficiency of the adsorbent [26]. Since CaO2 slowly releases OH in water, changing the environmental pH, it creates conditions for phosphorus removal. When the environment is strongly acidic, OH is consumed by H+. Under strong alkaline conditions, the release of Ca+ is inhibited [27]. Both conditions are unfavorable for phosphorus removal, hence the decrease in the phosphorus removal efficiency.

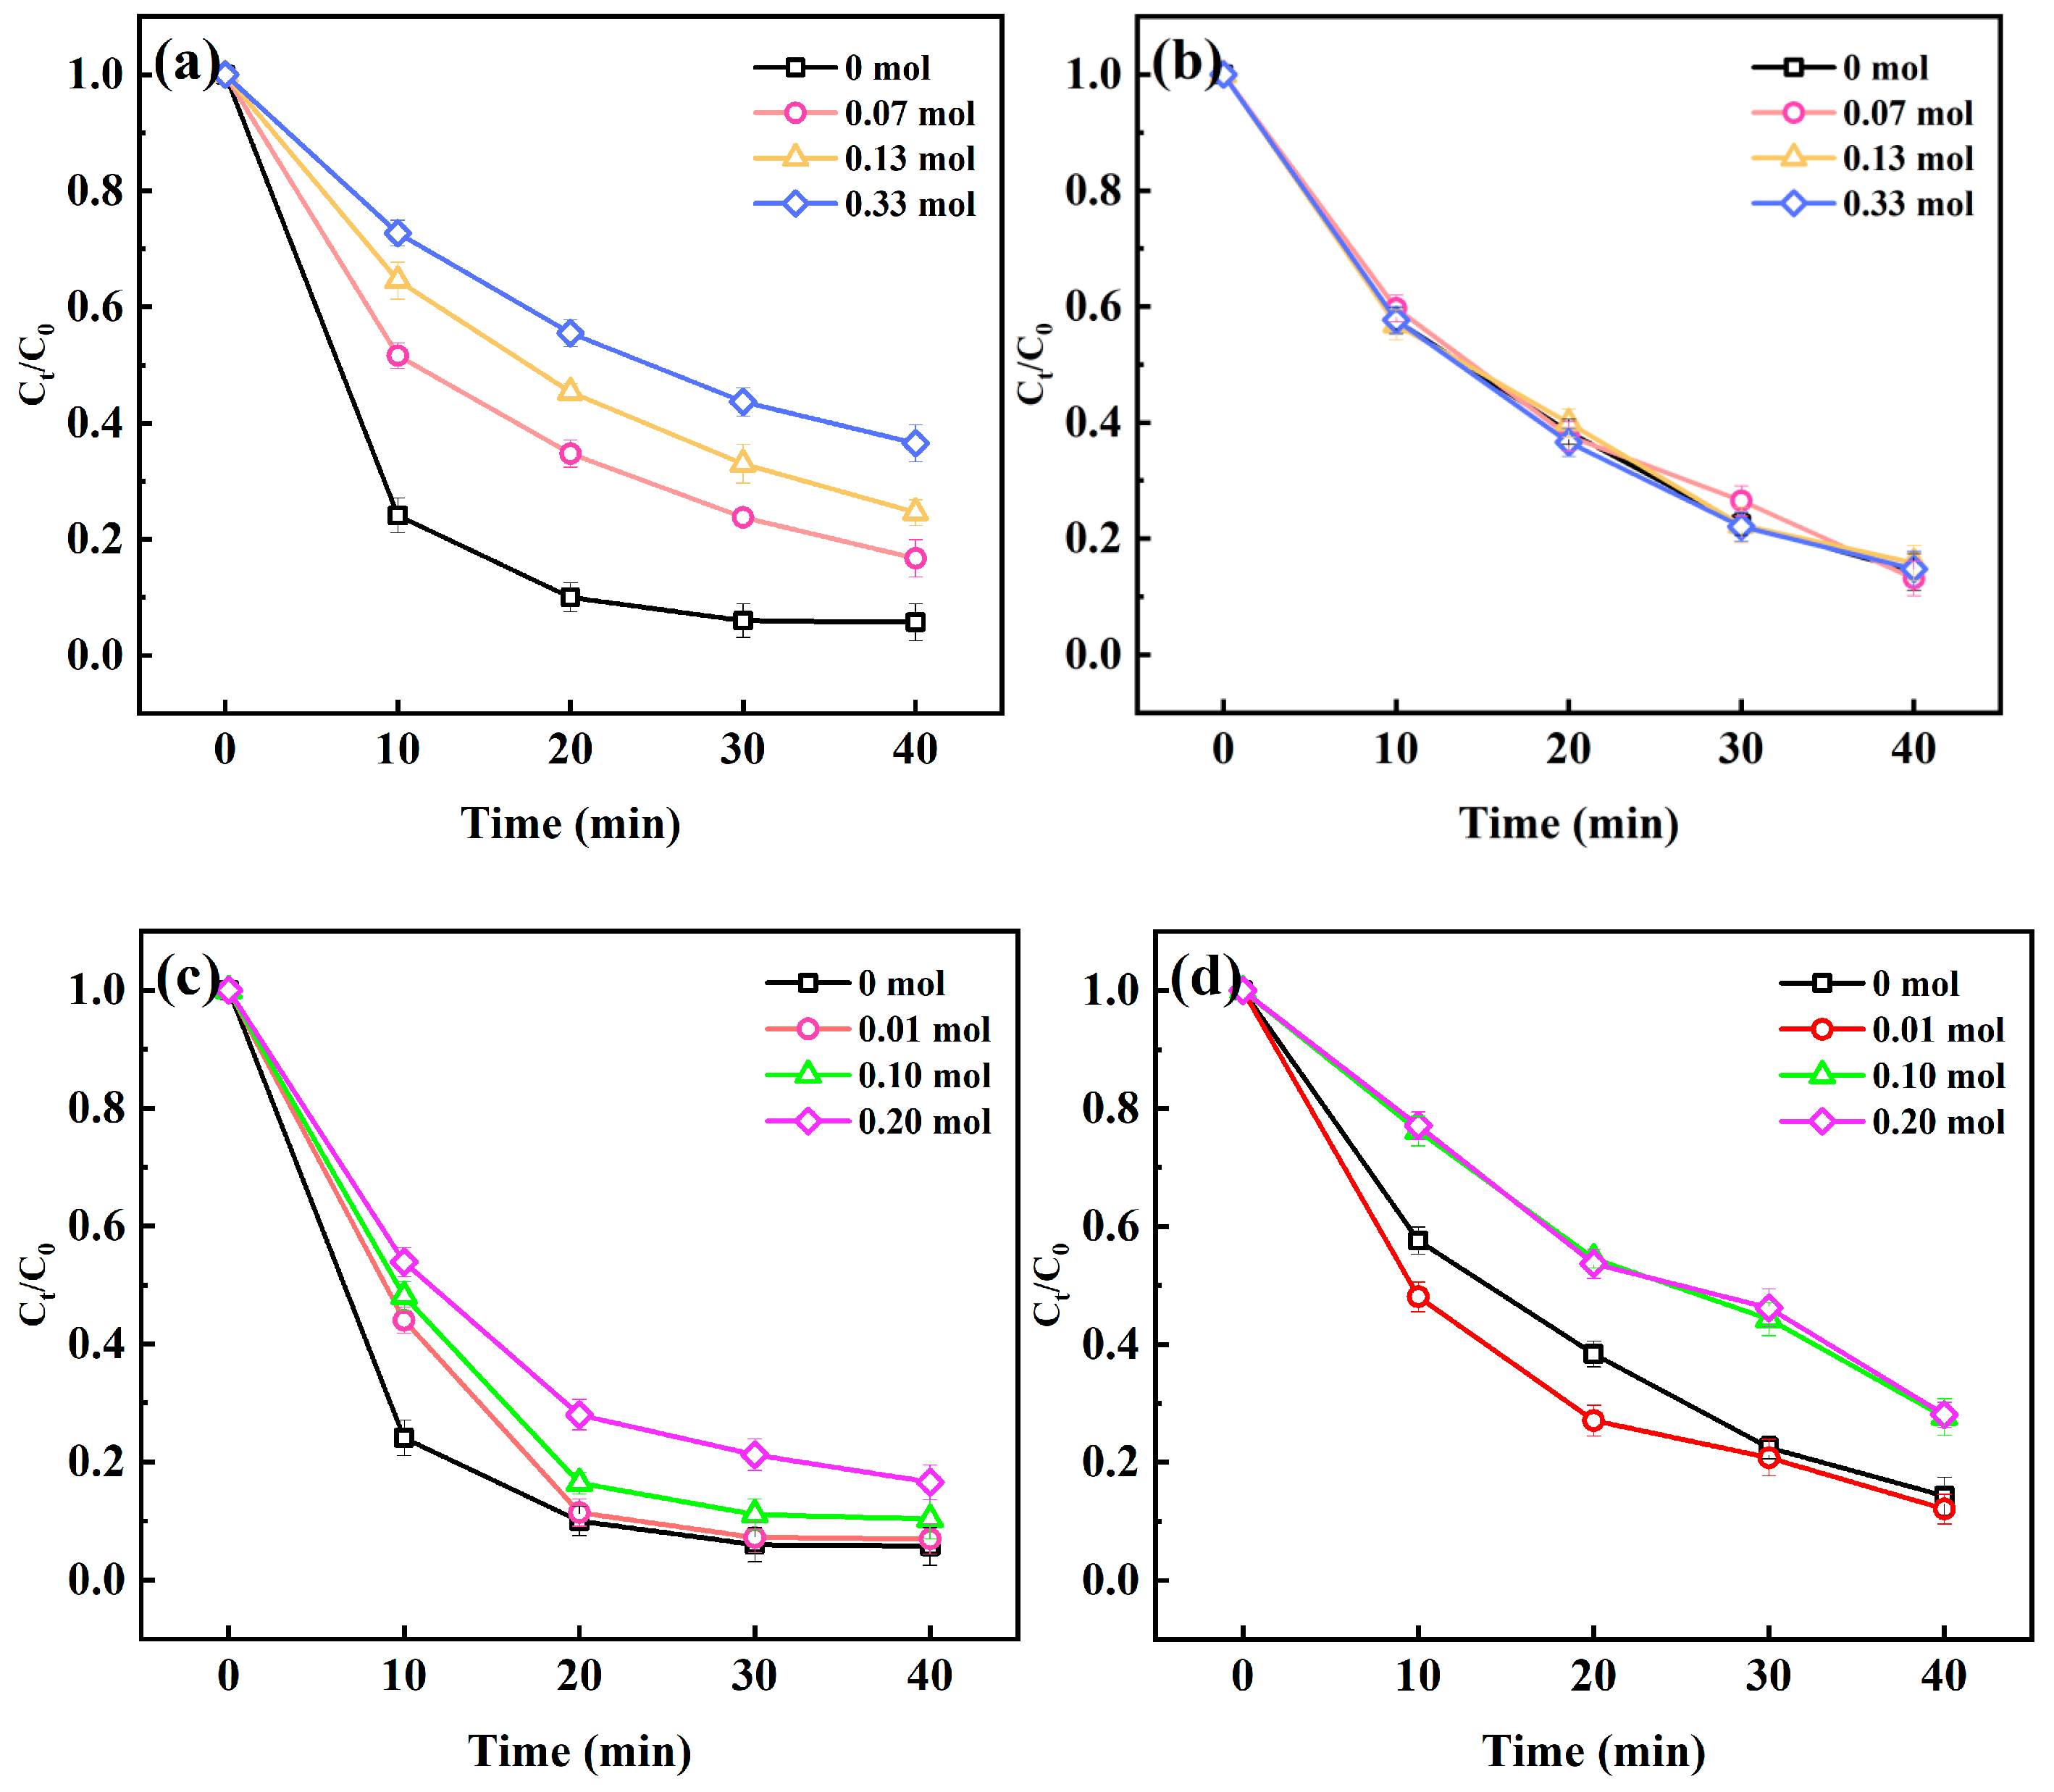
2.2. Effect of Reactive Species

To explore the role of reactive species in the degradation of TC within the plasma/CaO2 system, this study employed three scavengers: Isopropyl Alcohol (IPA), Triethylene Diamine (TEDA), and P-Benzoquinone (p-BQ), to investigate the contributions of ·OH, 1O2, and O2·, respectively.
The ·OH generated by plasma possesses extremely strong oxidizing power and can rapidly react with organic compounds in aqueous solutions to achieve degradation. By utilizing the scavenging effect of IPA on ·OH [28], the roles of ·OH in the degradation of TC and the removal of phosphorus in the plasma/CaO2 system were investigated. As shown in Figure 2a, the addition of 0.07, 0.13, and 0.33 mol of IPA reduced the degradation efficiency of TC from 94.3% to 94.1%, 83.3%, 75.4%, and 63.5%, respectively. This is because ·OH produced in the system reacts preferentially with IPA, reducing the amount of ·OH available to degrade TC, thereby decreasing the degradation efficiency. These results indicate that ·OH plays a significant role in the degradation of TC in the plasma/CaO2 system. From Figure 2b, it can be seen that the addition of IPA has almost no effect on the removal of phosphorus.
1O2 is molecular oxygen in an excited state with high reactivity, capable of rapidly reacting with organic substances in water [29]. The role of 1O2 in the degradation of TC and the removal of phosphorus in the plasma/CaO2 system was investigated. As shown in Figure 2c, the addition of 0.01, 0.1, and 0.2 mol of TEDA reduced the degradation efficiency of TC from 94.3% to 92.8%, 89.7%, and 83.4%, respectively. This is because the 1O2 generated in the system reacts with TEDA, leading to a decrease in the amount of 1O2 available to react with TC, thus lowering the degradation efficiency. This indicates that 1O2 plays a certain role in the degradation of TC in the plasma/CaO2 system. From Figure 2d, it can be observed that the addition of a small amount of TEDA promotes phosphorus removal. This enhancement is attributed to the increased system alkalinity caused by TEDA dissolution, which favors phosphate precipitation. However, as the TEDA concentration further increases, phosphorus removal is inhibited. This is because excessive alkalinity suppresses the release of Ca2+ from CaO2, thereby reducing the efficiency of phosphorus removal.
O2· is an oxygen atom with one unpaired electron, and atoms with unpaired electrons are more prone to react [30]. The role of O2· in the degradation of TC and the removal of phosphorus in the plasma/CaO2 system was investigated. As shown in Figure 2e, increasing the amount of p-BQ from 0 to 0.02 mol reduced the degradation efficiency of TC from 94.3% to 62.2%. This indicates that O2· plays a certain role in the degradation of TC in the plasma/CaO2 system. From Figure 2f, it can be seen that p-BQ has almost no effect on the removal of phosphorus.

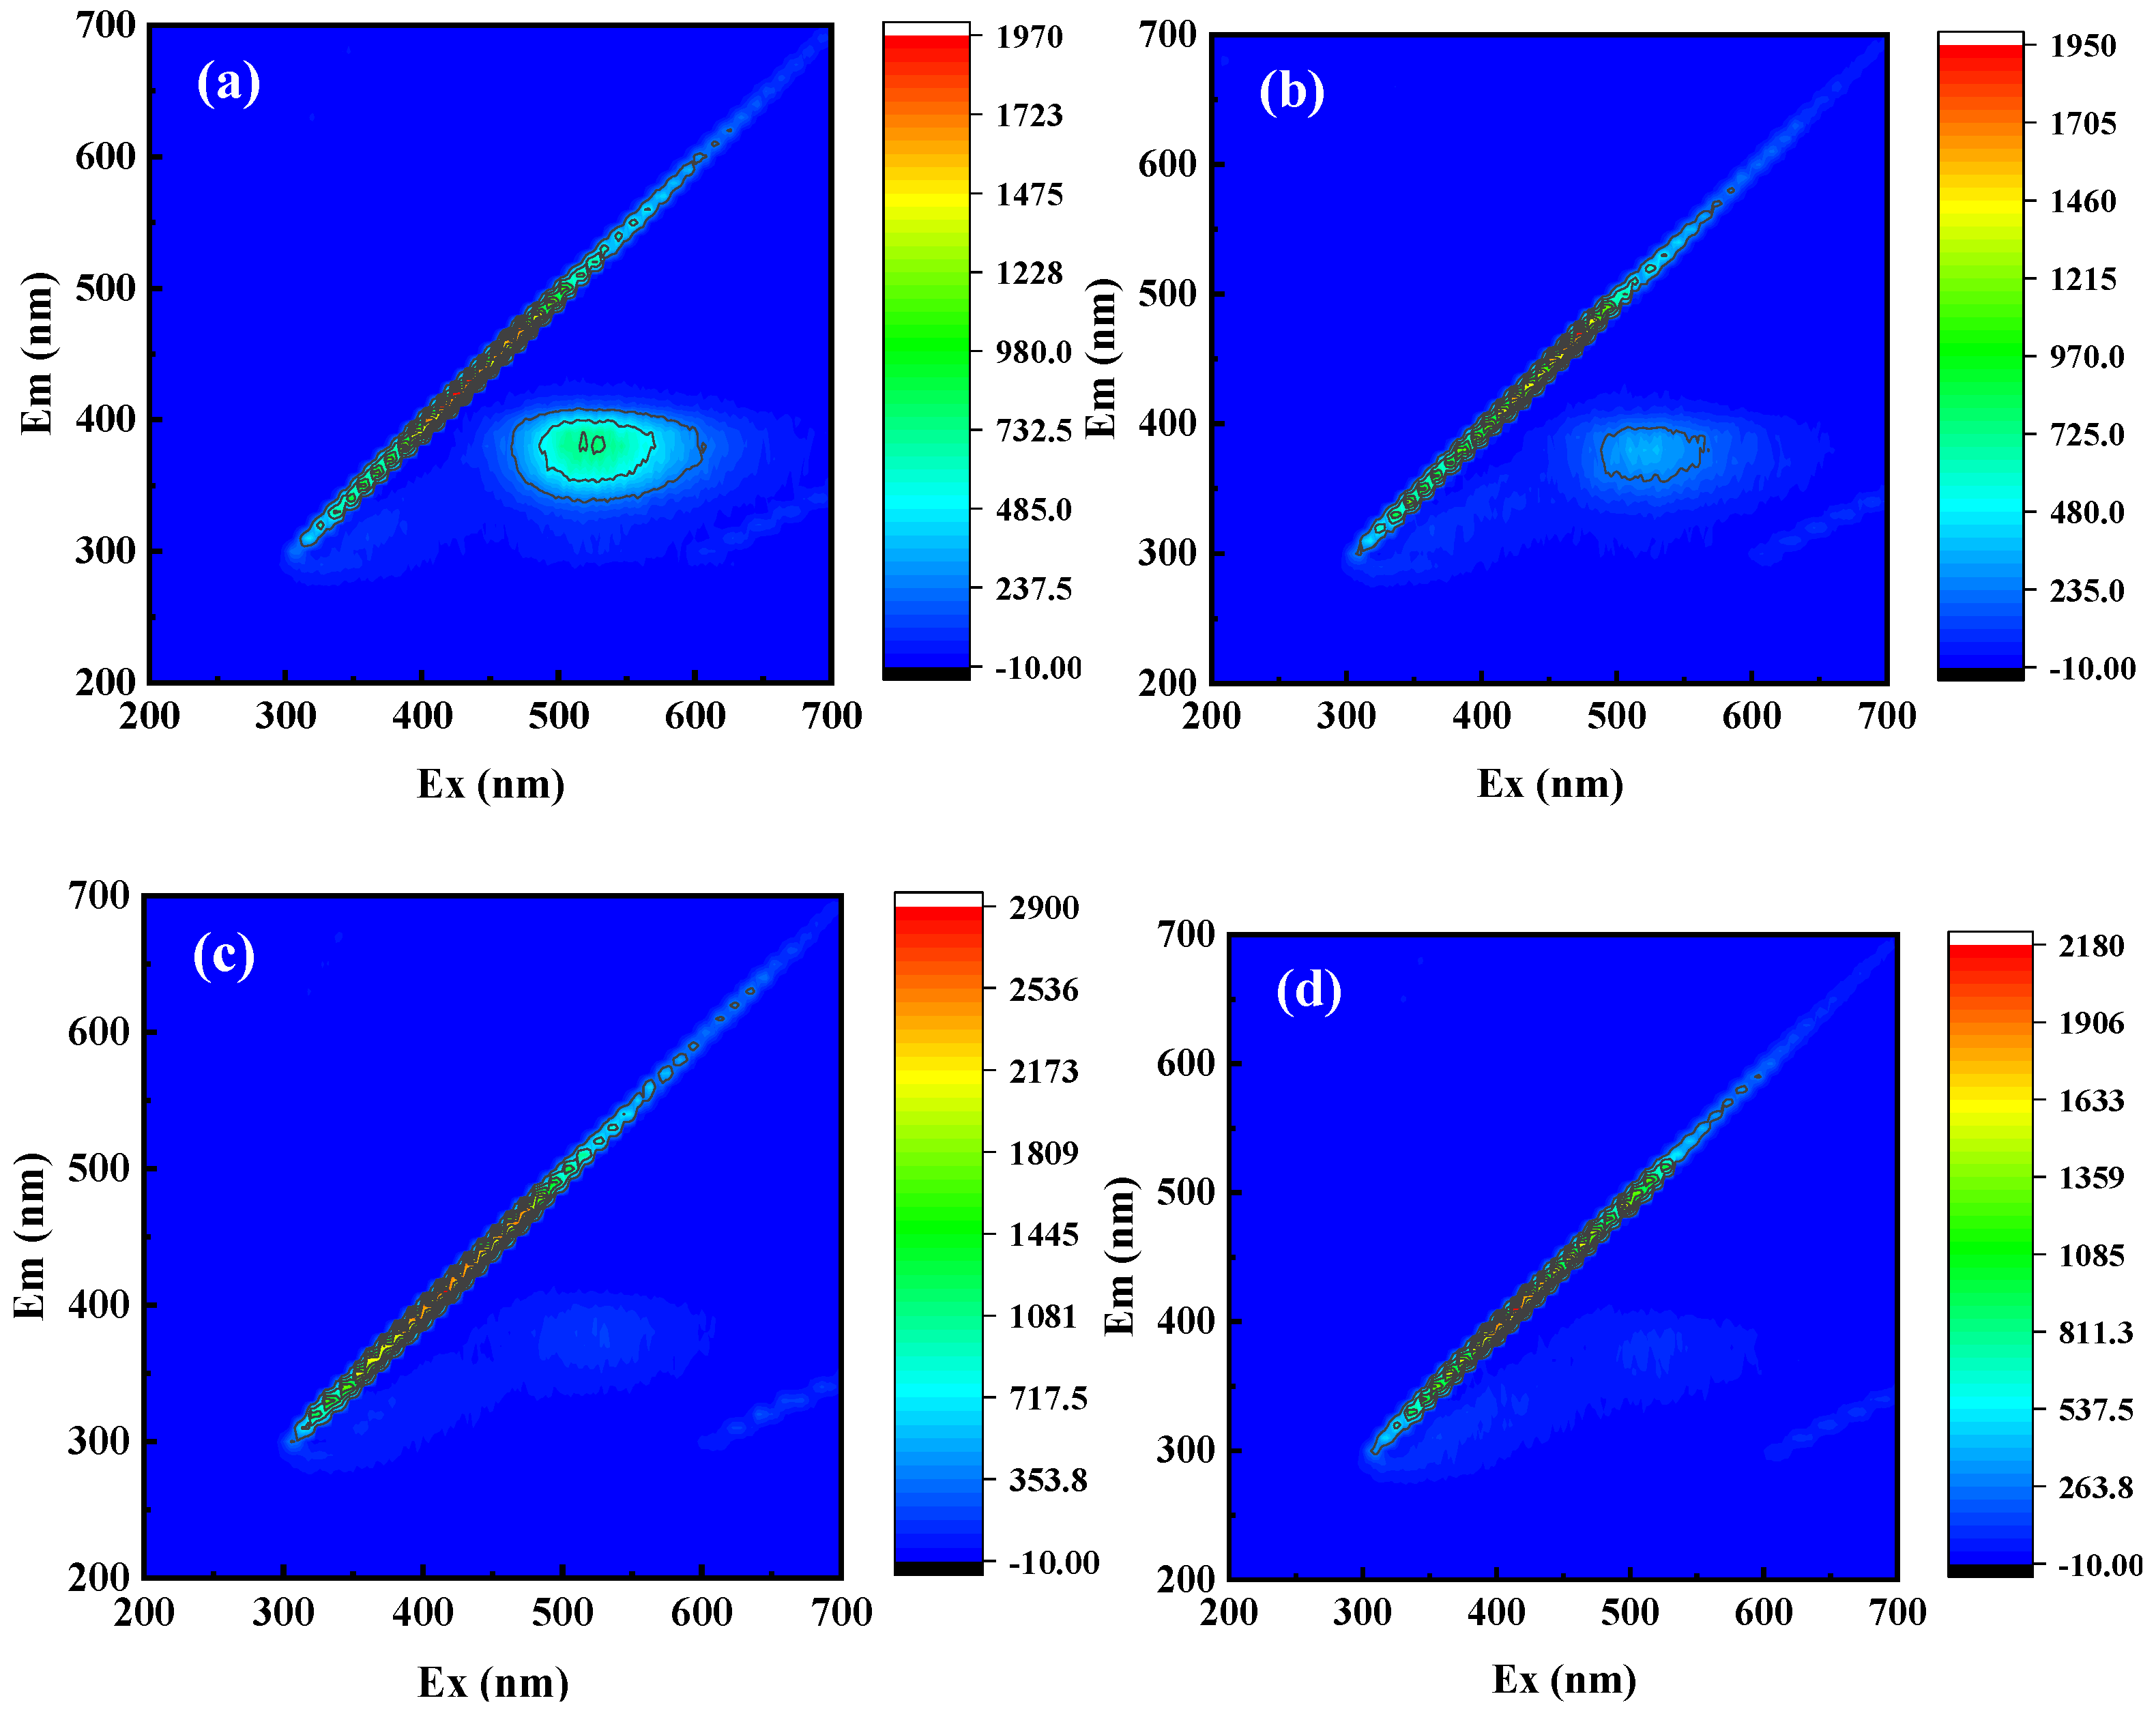
2.3. Detection of Active Substance Production

During the degradation of TC in the plasma/CaO2 system, the discharge process generates a variety of reactive species that serve as oxidants, including O3, ·OH, and H2O2. O3 possesses strong oxidative properties, and is capable of directly oxidizing TC within the system. Additionally, O3 can react with H2O to produce other oxidizing species, such as ·OH and H2O2, thereby further promoting TC degradation [31]. As shown in Figure 3a, the concentration of O3 in the system continuously increases during the degradation process. Compared to the standalone plasma system, the concentration of O3 in the plasma/CaO2 system is lower. This is because CaO2 can release H2O2 in the system, which consumes O3, leading to a reduction in its concentration.
·OH is formed by the loss of an electron from OH and possesses extremely strong oxidizing power [32], playing a significant role in the degradation of TC within the system. The concentration of ·OH during the reaction process is shown in Figure 3b. As TC degrades, the absorbance of the reaction solution containing terephthalic acid continuously increases, indicating that the content of ·OH in the system is also continuously rising. Compared to the standalone plasma system, the plasma/CaO2 system generates more ·OH, suggesting that CaO2 promotes the formation of ·OH.
H2O2 is a potent oxidant, not only exhibiting strong oxidative properties itself but also synergizing with O3 to produce ·OH, which possesses even stronger oxidative capabilities [33]. As illustrated in Figure 3c, the concentration of H2O2 in the system continuously increases during TC degradation. Compared to the standalone plasma system, the plasma/CaO2 system generates more H2O2, indicating that CaO2 promotes the production of H2O2. However, upon the addition of phosphorus, the amount of H2O2 in the system significantly decreases. This is because CaO2 can release H2O2 in the system, and the addition of phosphorus consumes or adsorbs CaO2, leading to a reduction in the amount of H2O2.

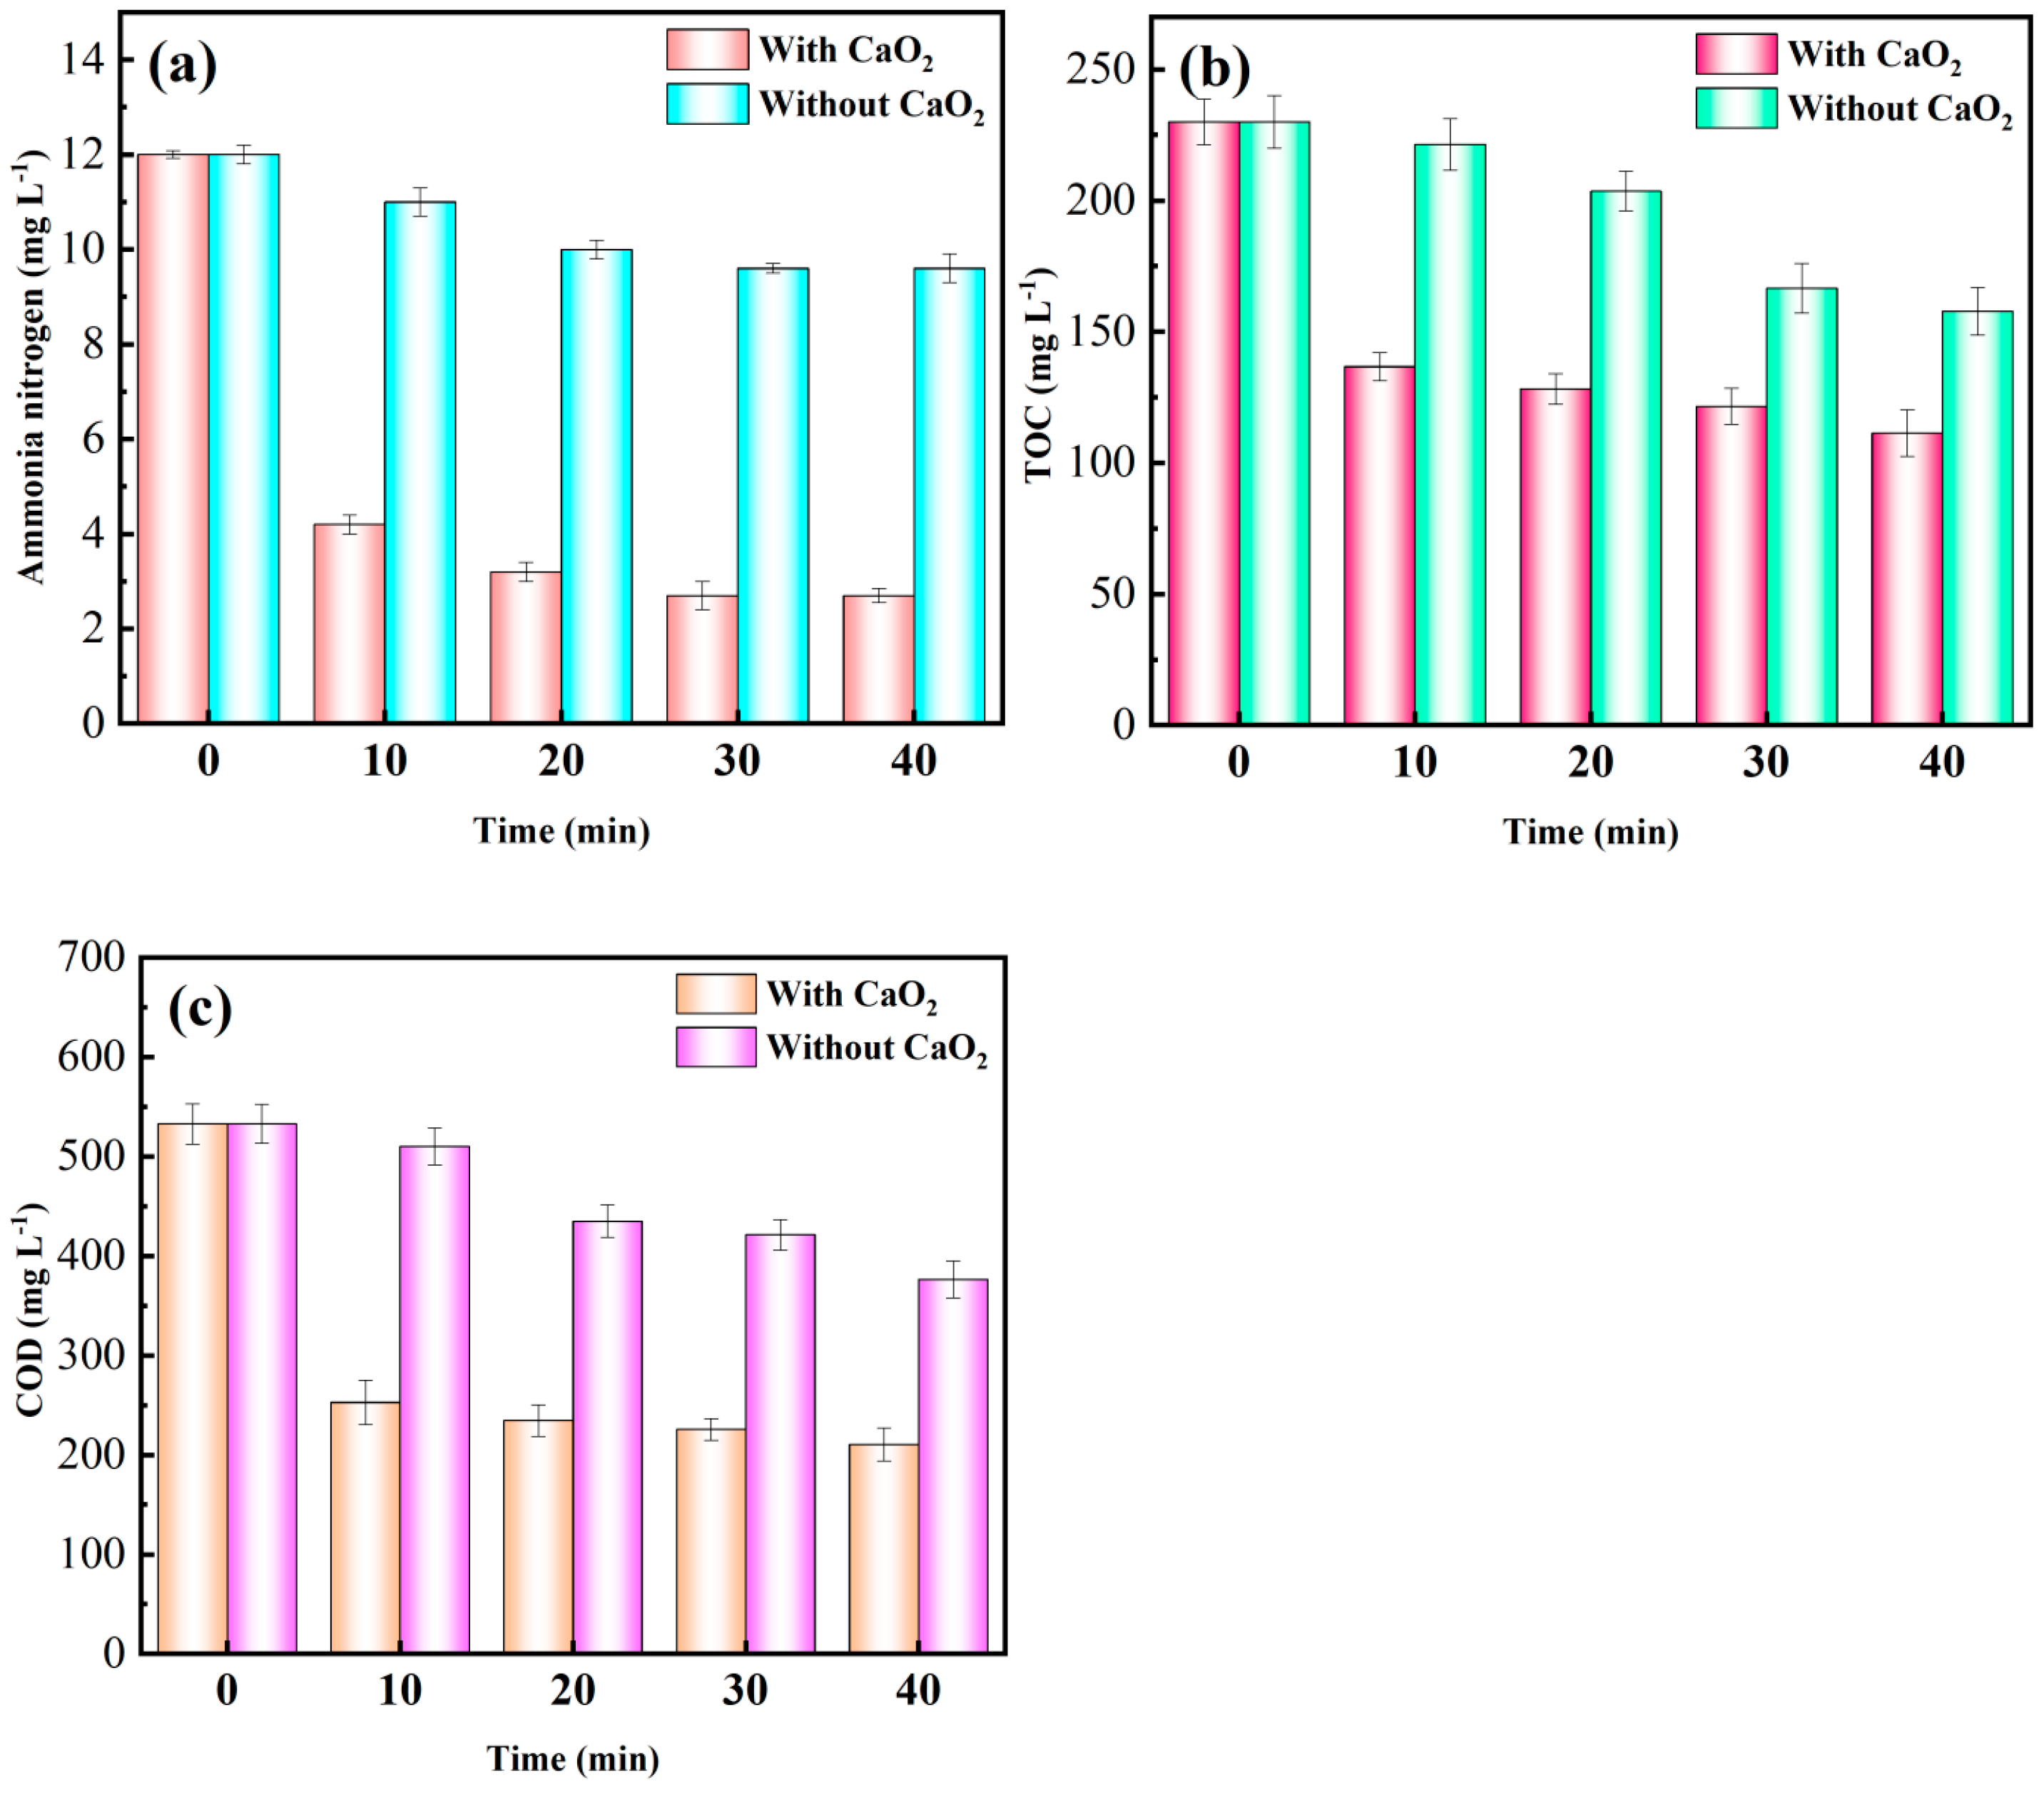
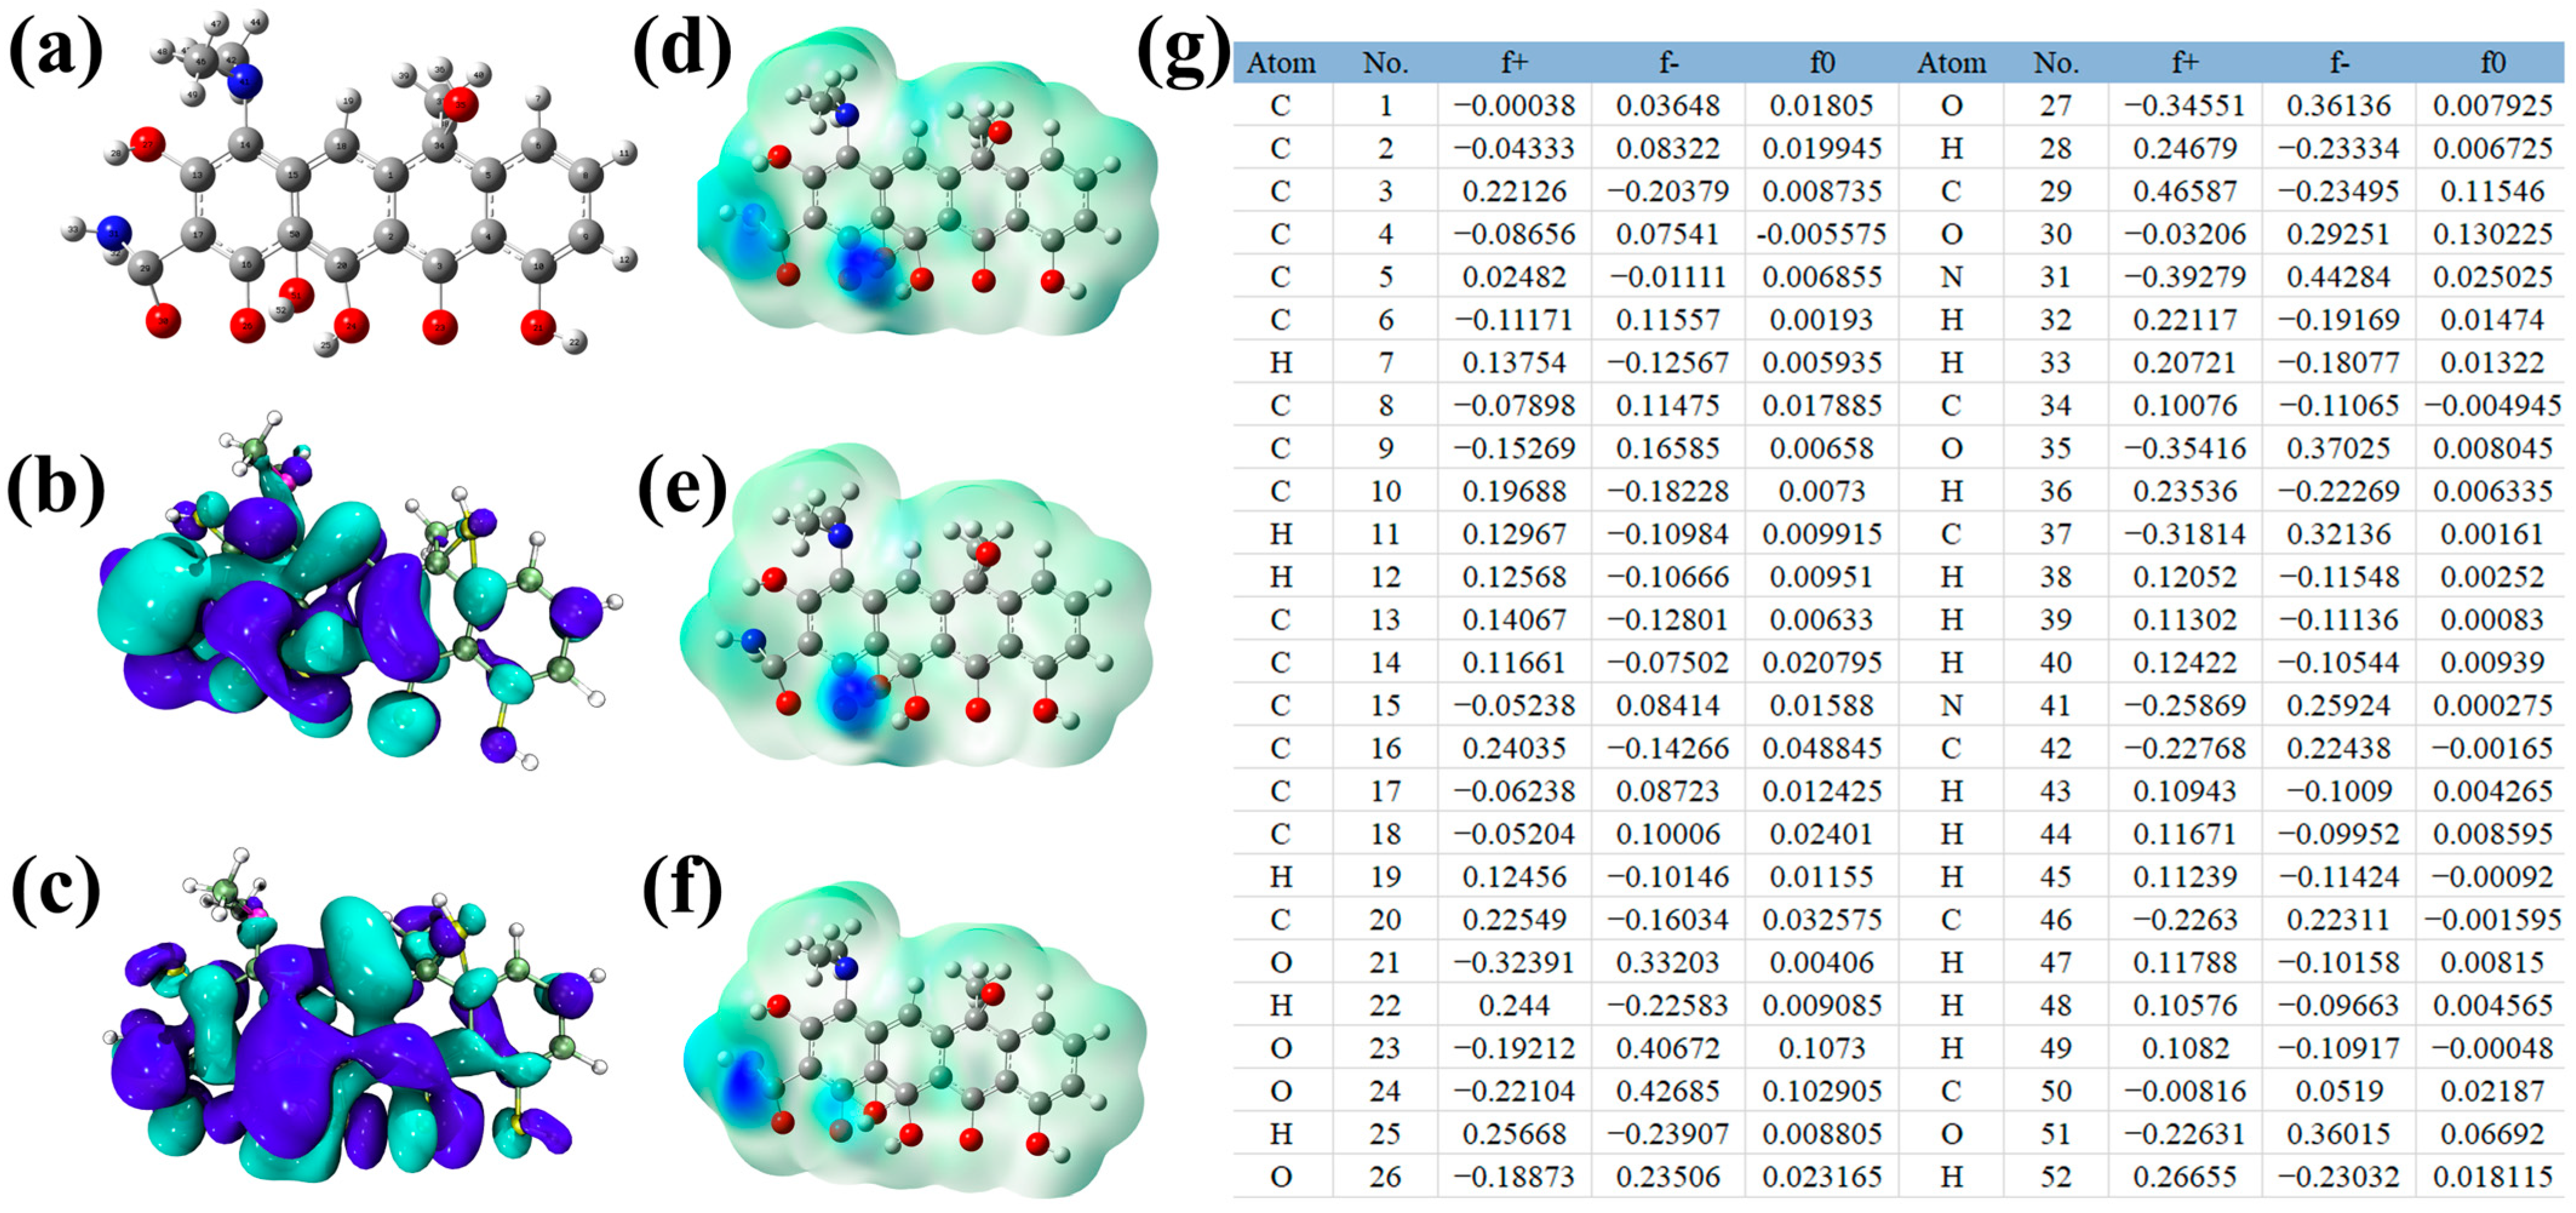
2.4. Analysis of TC Degradation Process

As shown in Figure S7a, during the degradation of TC by the standalone plasma system, the pH gradually decreases. In contrast, in the plasma/CaO2 system, the pH rises from 7.1 to 8 before gradually decreasing back to 7. This phenomenon can be attributed to the release of OH from CaO2 in water, which initially raises the environmental pH. However, as TC is oxidized, some simple organic acids are generated, acidifying the system and subsequently lowering the pH. As depicted in Figure S7b, the conductivity increases with the reaction time, reaching a maximum of 36.7 μS·cm−1. Compared to the standalone plasma system, the plasma/CaO2 system exhibits higher conductivity, indicating that the addition of CaO2 promotes the generation of free radicals in the system.
TC features a conjugated heterocyclic structure, and three-dimensional fluorescence spectroscopy was employed to analyze its fluorescence characteristics, thereby characterizing changes in both molecular structure and concentration during the degradation process. As shown in Figure 4a, the fluorescence peak of the initial TC solution before degradation is distinctly observed within the range of Ex/Em = (500~550 nm)/(350~400 nm). From Figure 4b,c, it is evident that the fluorescence effect significantly weakens, indicating that TC is gradually degraded [34,35]. Figure 4d shows that the fluorescence effect around Ex/Em = (500~550 nm)/(350~400 nm) has become very faint. Simultaneously, a new fluorescence region can be observed within the range of Ex/Em = (300~400 nm)/(300~350 nm), suggesting the generation of intermediate products during the degradation process.
Ultraviolet-visible spectrophotometry (UV-Vis) is a method that utilizes the absorption of radiation in the 200~800 nm spectral region by molecular substances for analytical determination [36]. As shown in Figure S8, compared to the standalone plasma system, the addition of CaO2 promotes the degradation of TC. The shift of characteristic peaks during the degradation process indicates that TC generates other intermediate products during degradation.
This section investigates the changes in ammonia nitrogen, TOC, and COD during the degradation of TC by the plasma/CaO2 system. As shown in Figure 5, the concentrations of ammonia nitrogen, TOC, and COD gradually decrease over time. Compared to the standalone plasma system, the plasma/CaO2 system achieves higher removal efficiencies for ammonia nitrogen, TOC, and COD, with maximum removal efficiencies of 77.5%, 51.6%, and 60.5%, respectively. This indicates that the addition of CaO2 promotes the removal and degradation of ammonia nitrogen, TOC, and COD in the reaction system.

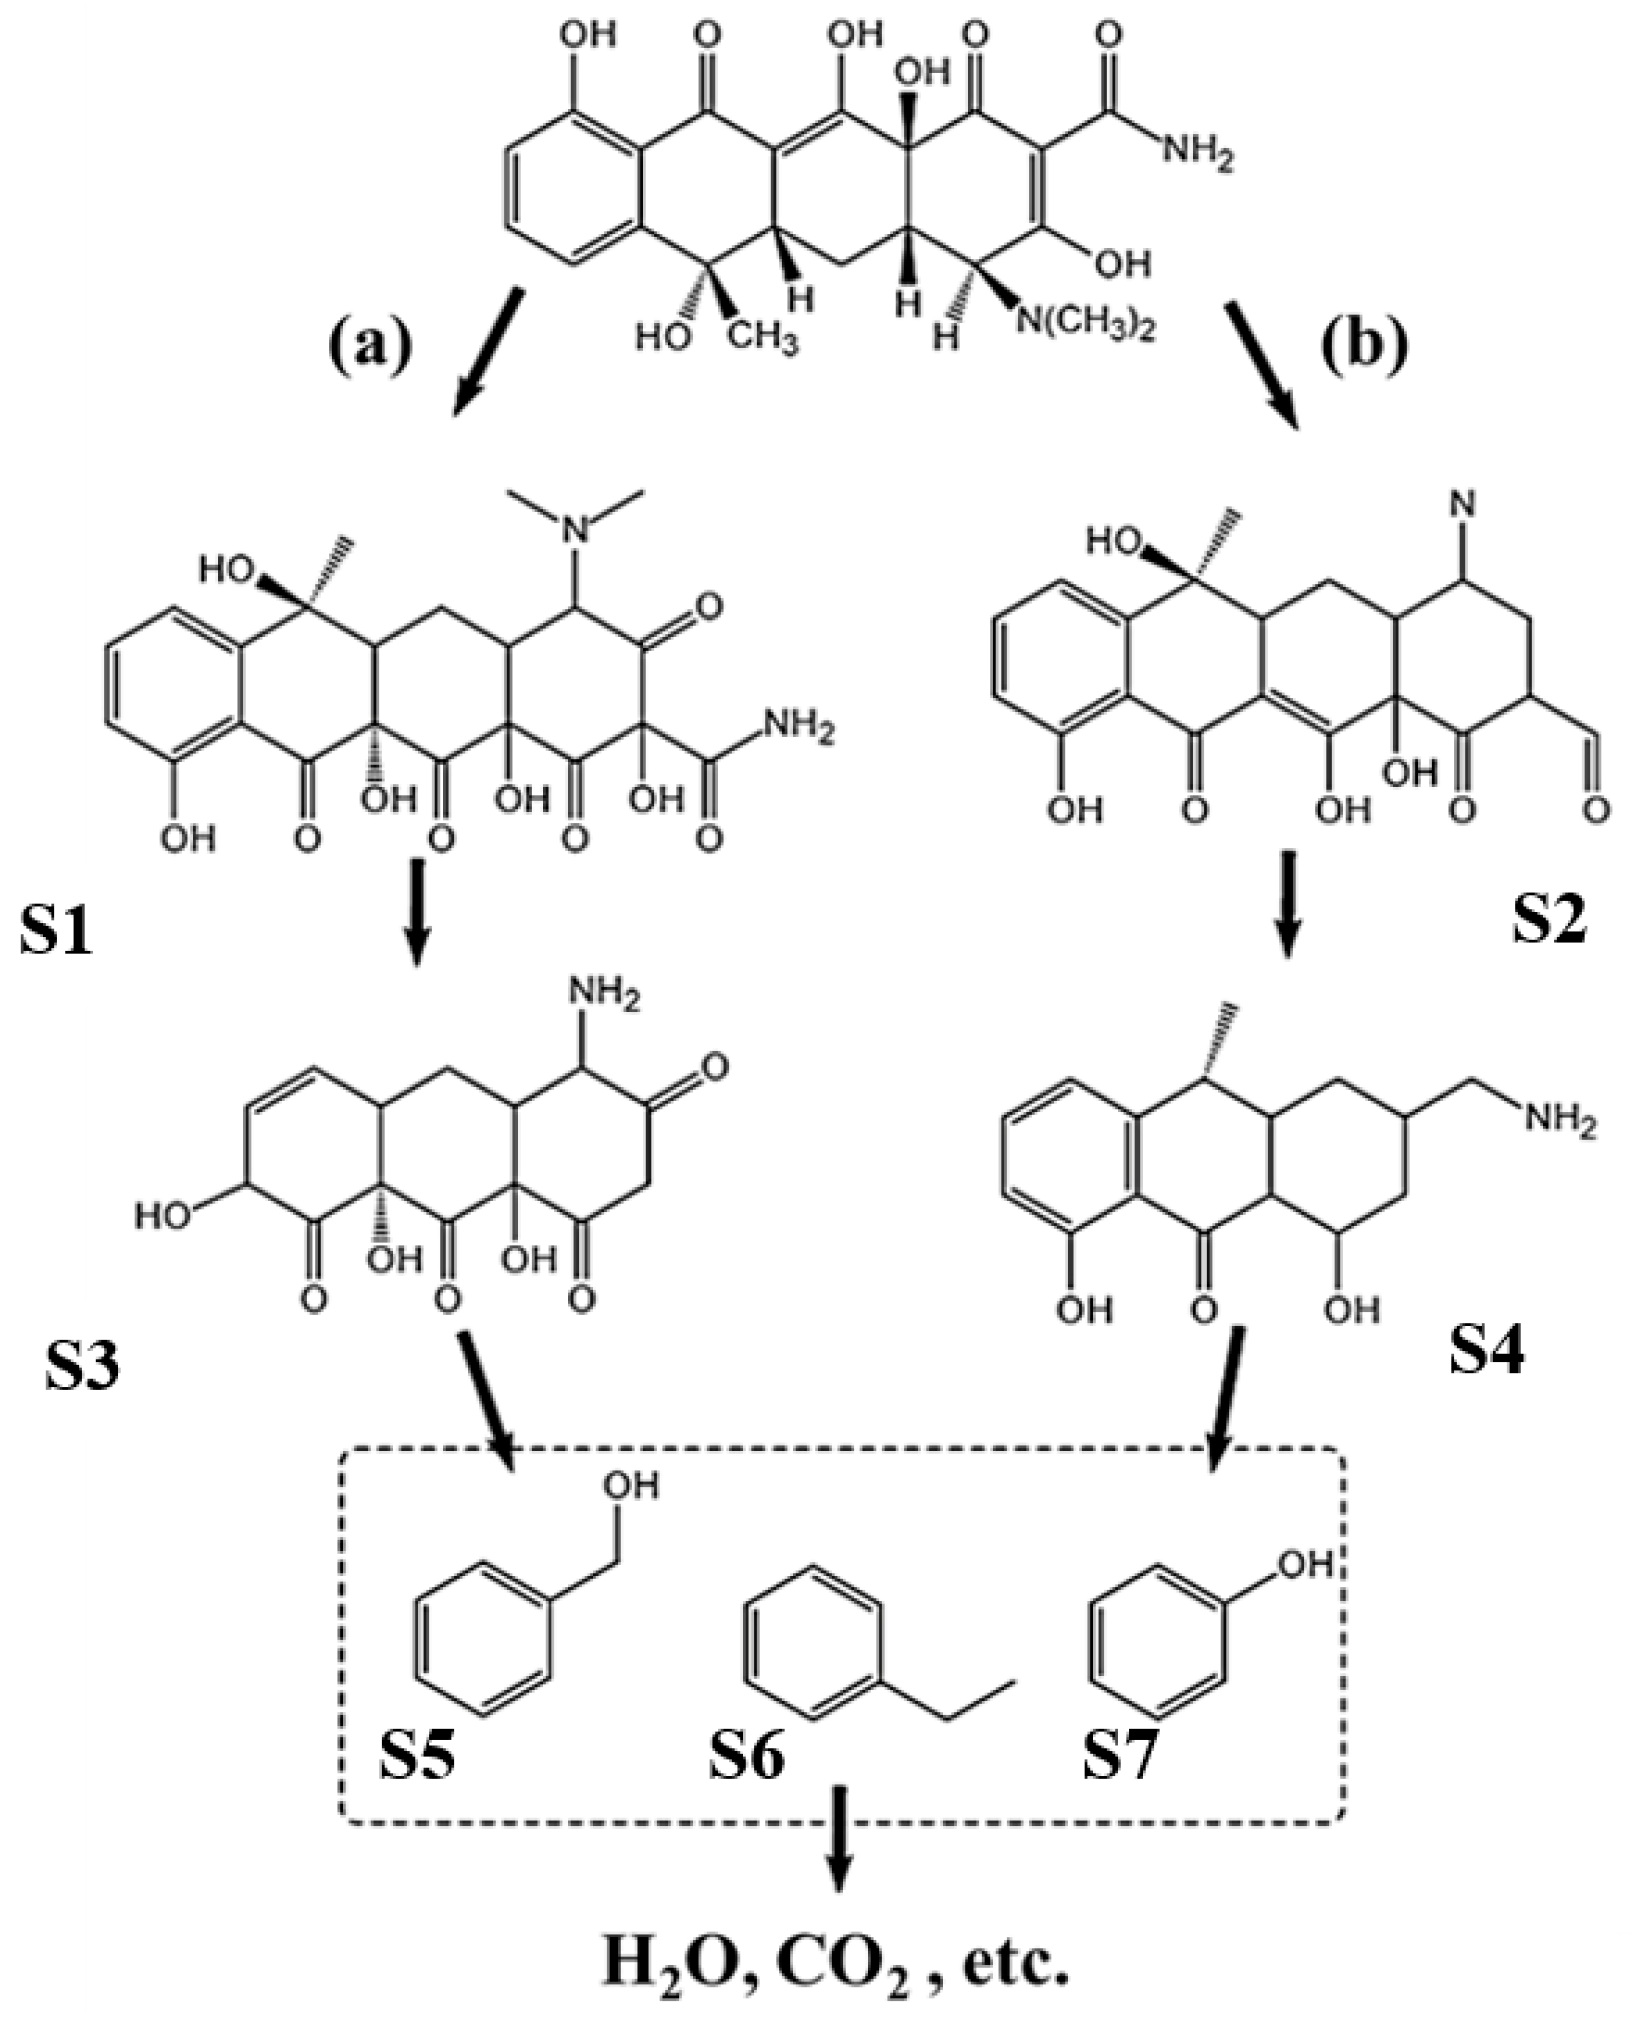
2.5. Analysis of Degradation Products and Pathways

Density Functional Theory (DFT) calculations can provide critical insights into predicting the degradation pathways of TC. The molecular structure of tetracycline is shown in Figure 6a. The lowest unoccupied molecular orbital (LUMO) (Figure 6b), associated with the electron-accepting capacity of the molecule, highlights regions that are prone to nucleophilic attack. The highest occupied molecular orbital (HOMO) (Figure 6c), representing the highest-energy electron-rich regions, reflects the molecule’s electron-donating ability. Both orbitals are pivotal for identifying reactive sites in chemical reactions. Color-coded distributions in these orbitals visualize spatial variations in electron density. The Fukui function further predicts susceptibility to electrophilic or nucleophilic attacks: f0 corresponds to radical reactivity (Figure 6d), f identifies nucleophilic attack sites (Figure 6e), and f+ marks electrophilic hotspots (Figure 6f). The complete mineralization of TC proceeds through two distinct pathways, driven by the synergistic interaction between its intramolecular electronic characteristics and the surrounding environmental conditions. Pathway (a) initiates with hydroxyl group rearrangement in TC molecules, driven by the high electron-donating capacity of hydroxyl and amino regions. This rearrangement optimizes intramolecular hydrogen bonding via proton transfer, forming the stable intermediate S1. Subsequent hydroxylation occurs at electron-deficient sites, specifically the LUMO-vacant carbonyl (C=O) and conjugated double bond regions, where ·OH attack to generate polyhydroxylated intermediate S3 (Figure 7a). Further oxidative cleavage of the tetracyclic skeleton and aromatic rings produces short-chain carboxylic acid derivatives (S5, S6, and S7). Pathway (b) involves hydroxyl group elimination at high f+ electrophilic sites, forming the dehydrated intermediate S2 under acidic or electrophile-rich conditions (Figure 7b). Subsequent radical-mediated ring-opening at conjugated carbon atoms generates the linear intermediate S4, which undergoes oxidative degradation to S5, S6, and S7. Both pathways converge at these terminal intermediates, ultimately mineralizing via β-oxidation and decarboxylation into CO2 and H2O. The complete transformation of TC from macrocyclic organic compounds to inorganic molecules demonstrates the chemical versatility and environmental compatibility of its degradation mechanism, underpinned by DFT-calculated frontier molecular orbitals (HOMO/LUMO) and Fukui function-based reactive site analyses. The mass spectra of all intermediate products can be viewed in Figure S9.

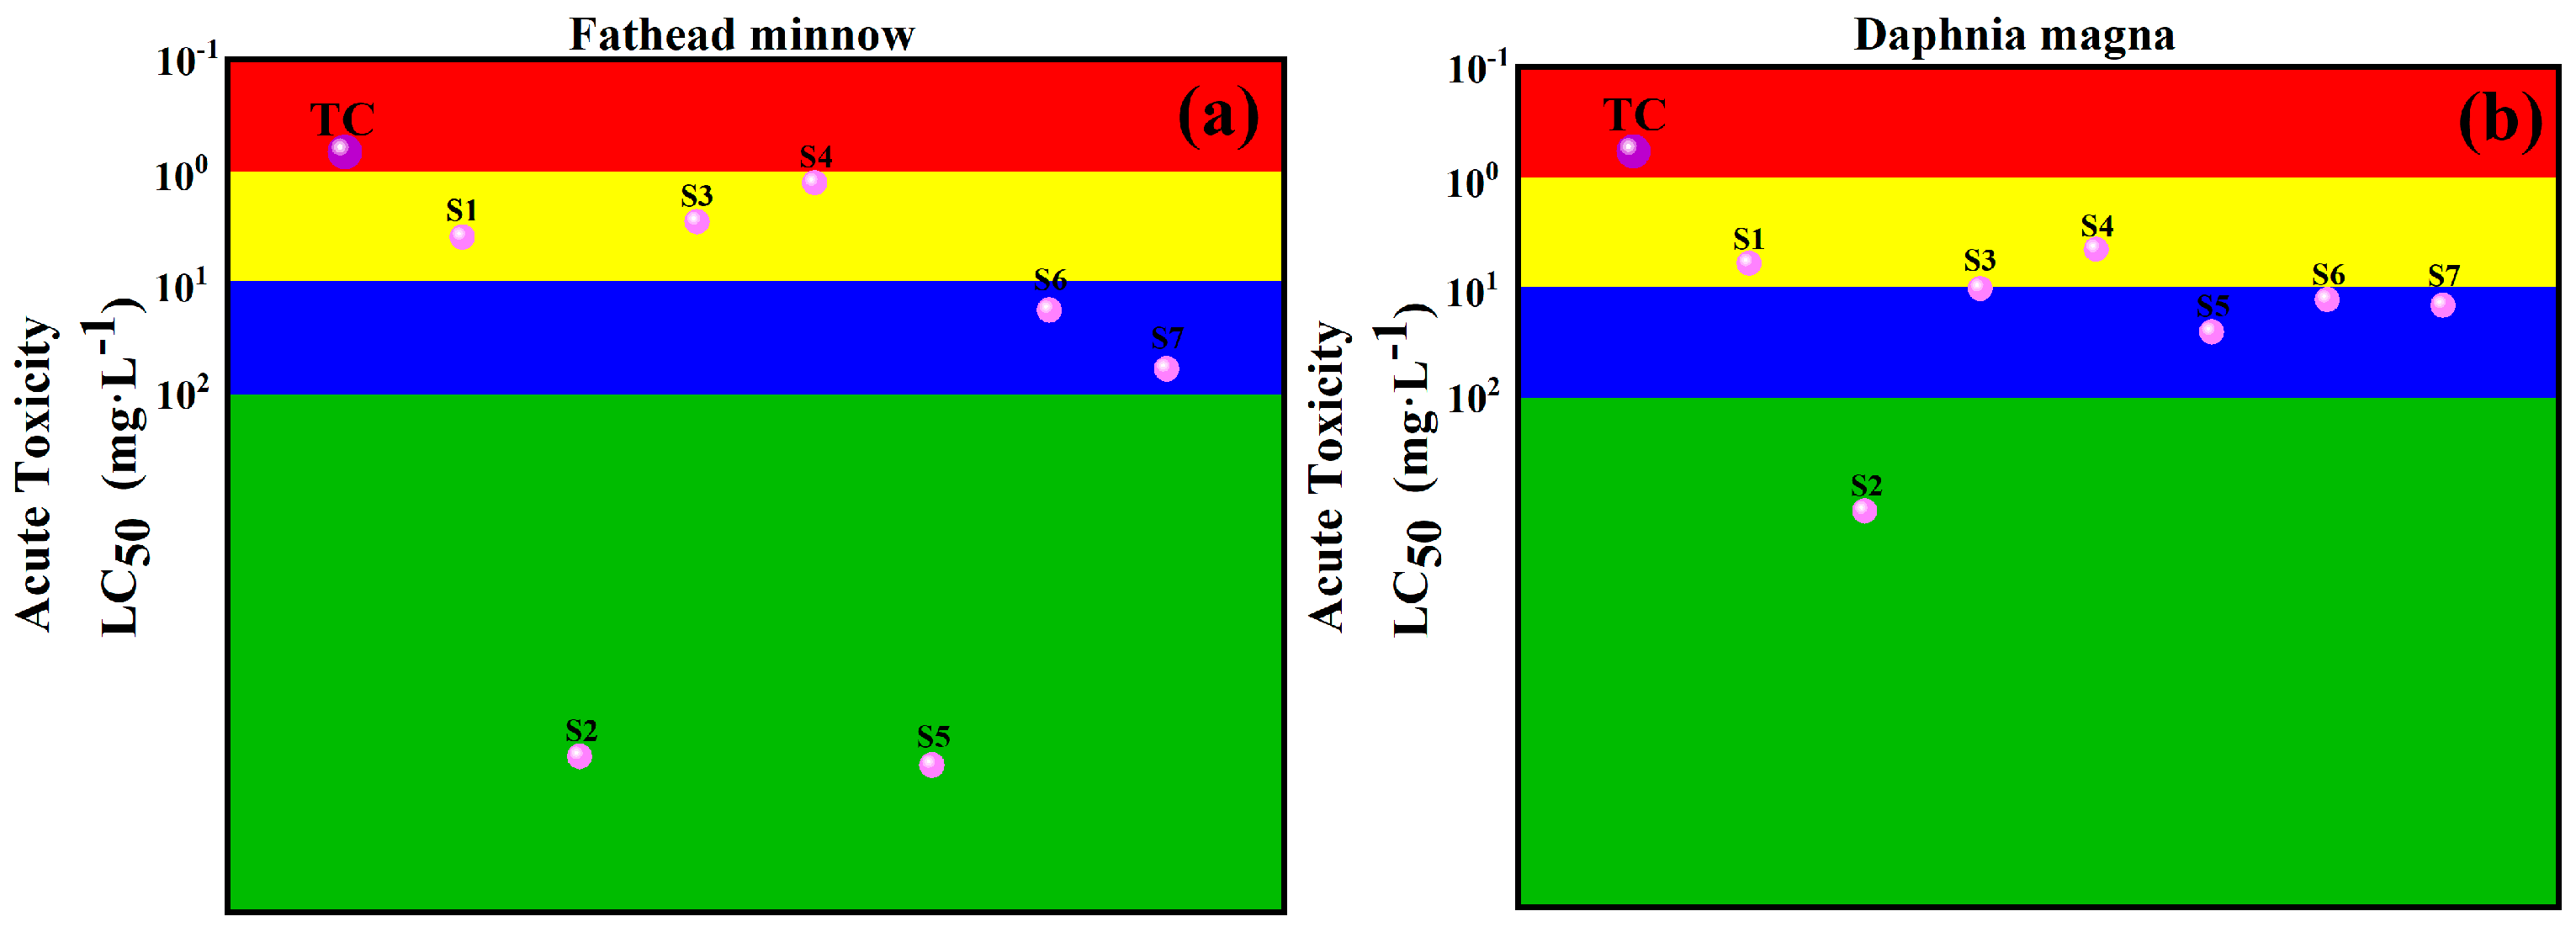
2.6. Toxicity Analysis of Intermediates

During the degradation of TC, various intermediate products are generated. To evaluate the biotoxicity of these intermediates, the Toxicity Estimation Software Tool (T.E.S.T, version 4.1) was employed [37], using the 96 h median lethal concentration (LC50) for Fathead Minnows and the 48 h median lethal concentration (LC50) for Daphnia Magna as indicators. This evaluation serves to demonstrate the environmental friendliness of the plasma/CaO2 system in degrading TC.
As can be seen from Figure 8, the LC50 (96 h) for Fathead Minnows and the LC50 (48 h) for Daphnia Magna for the intermediate products of TC are both lower than those of TC itself, indicating that the toxicity of TC diminishes during the degradation process. Therefore, the utilization of plasma coupled with a CaO2 system to degrade TC is a feasible and environmentally friendly method.

3. Experimental

3.1. Chemicals and Experimental Setup

Detailed reagent information are shown in Table S1. All solutions were prepared with deionized water. The primary instruments and equipment utilized in the experiments are listed in Table S2. The liquid chromatograph and the ultraviolet spectrophotometer were employed for the detection of tetracycline, phosphorus, and active substances. A multi-parameter water quality analyzer (5B-6C, Lianhua, Shanghai, China) was used to measure COD and TOC.

3.2. Experimental Setup

Figure 9 illustrates the diagram of the experimental setup, which primarily consists of a power supply and a plasma reaction device.
Unless specifically noted, all experiments in this study were carried out under conditions where the initial TC was 0.4 g/L and the initial phosphorus concentration was 40 mg/L.

3.3. Calculation and Analysis

The molecular structure of TC was first built using the GaussView 6.0.16 software [38]. Geometry optimization and frequency calculations were then performed using the Gaussian 16 software with the B3LYP functional and 6-31G(d) basis set to obtain the ground-state structure [39]. Wavefunctions and energy information for the neutral molecule (N), cationic species (N − 1 electrons), and anionic species (N + 1 electrons) were generated during this process. The frontier molecular orbitals (HOMO and LUMO) and Fukui functions (f0, f, and f+) were subsequently calculated using the Multiwfn 3.8 software package, based on the obtained wavefunctions [40]. These analyses provided insights into the reactive sites and electronic properties of tetracycline, facilitating the prediction of its degradation pathways. All computational tasks were completed on a computer platform equipped with two XEON Platinum 8360Y CPUs and 256 GB of RAM.
The concentration of TC was determined using Liquid Chromatography (LC). The chromatographic column used was a C18 column (C18, Syncronis, Waltham, MA, USA, Ø4.6 mm × 250 mm). The mobile phase consisted of methanol, water, and phosphoric acid with a volume ratio of 55:45:0.3, and the flow rate was set at 1.0 mL/min. The detection wavelength was 356 nm, injection volume was 20 μL, and retention time was 6 min. The degradation efficiency of TC was calculated as Equation (2):
η = (C0 − Ct)/C0
where η is the degradation efficiency of TC, %, C0 is the initial concentration of TC, mg/L, and Cₜ is the TC concentration at t min of treatment, mg/L. The kinetics of TC degradation were analyzed according to the first-order kinetic model as in Equation (3):
Ln(C0/Ct) = kt
where C0 and Cₜ are defined as above, k is the reaction rate constant, min−1, and t is the reaction time, min.
The concentrations of H2O2 and O3 were determined using the titanium oxysulfate method [41] and the indigo method [42], respectively. The resulting standard curves are illustrated in Figure S1a,b. Based on the standard curve, the H2O2 concentration and absorbance are calculated as in Equation (4):
C (g/L) = 4.79A + 1.85
The O3 concentration and absorbance are calculated as in Equation (5):
C (mg/L) = 18.43A
Due to the vigorous and rapid reaction between terephthalic acid and ·OH, this study assessed the variation in the quantity of ·OH by measuring the change in absorbance before and after mixing terephthalic acid with the reaction solution [43].
The concentration of phosphorus was determined using the phosphomolybdenum blue method [44]. The resulting standard curve is shown in Figure S1c. Based on the standard curve, the phosphorus concentration and absorbance are calculated as in Equation (6):
C (mg/L) = 5.26A + 0.07
All final data are the average of three experiments.

4. Conclusions

This study demonstrates that the plasma/CaO2 system achieves 94.3% tetracycline TC degradation and 85.7% phosphorus removal within 40 min under optimal conditions, significantly outperforming the standalone plasma system. The pseudo-first-order kinetic constant of TC degradation (0.0864 min−1) was 4.2-fold higher than that of plasma alone (0.0205 min−1), indicating the critical role of CaO2 in enhancing oxidation efficiency through synergistic effects. The radical quenching experiments and ESR analysis revealed that ·OH, 1O2, and ·O2 dominated TC degradation. The alkaline environment generated by CaO2 hydrolysis promoted the conversion from O3 to ·OH, while released Ca2+ immobilized phosphorus via hydroxyapatite precipitation. The DFT calculations elucidated two TC degradation pathways: hydroxylation-driven ring-opening and electrophilic attack-induced dehydroxylation, both culminating in complete mineralization to CO2 and H2O. The toxicity evaluation using the T.E.S.T software (version 4.1) and zebrafish embryo tests confirmed that the LC50 of the intermediates increased from 8.6 mg/L (raw TC) to 100 mg/L, demonstrating effective detoxification. This study proposes an efficient treatment plan for acute pollution with organic matter and phosphorus. Future work will focus on pilot-scale verification and a long-term stability assessment.

Supplementary Materials

The following supporting information can be downloaded at https://www.mdpi.com/article/10.3390/catal15050486/s1, Table S1: Chemical reagent; Table S2: Experimental apparatus; Table S3: Intermediate products of TC degradation; Figure S1: Standard curve: (a) H2O2; (b) O3; (c) phosphorus solution; Figure S2: Effect of initial concentration of TC: (a) TC degradation curve; (b) TC kinetic constant; (c) phosphorus removal curve; (d) phosphorus kinetic constant; Figure S3: Effect of initial phosphorus concentration: (a) TC degradation curve; (b) TC kinetic constant; (c) phosphorus removal curve; (d) phosphorus kinetic constant; Figure S4: Effect of discharge voltage: (a) TC degradation curve; (b) TC kinetic constant; (c) phosphorus degradation curve; (d) phosphorus kinetic constant; Figure S5: Effect of discharge frequency: (a) TC degradation curve; (b) TC kinetic constant; (c) phosphorus removal curve; (d) phosphorus kinetic constant; Figure S6: Effect of pH: (a) TC degradation curve; (b) TC kinetic constant; (c) phosphorus removal curve; (d) phosphorus kinetic constant; Figure S7: Changes of (a) pH; (b) Conductivity during degradation; Figure S8: UV-Vis spectra: (a) without CaO2; (b) with CaO2; Figure S9: Mass spectrum of the intermediate products (ES+).

Author Contributions

Methodology, A.L. and C.Q.; Formal analysis, A.L.; Data curation, A.L.; Writing—original draft, A.L. and J.W.; Project administration, T.W. All authors have read and agreed to the published version of the manuscript.

Funding

This research received no external funding.

Data Availability Statement

Data are contained within the article and Supplementary Materials.

Conflicts of Interest

The authors declare no conflicts of interest.

References

  1. Escher, B.I.; Stapleton, H.M.; Schymanski, E.L. Tracking complex mixtures of chemicals in our changing environment. Science 2020, 367, 388–392. [Google Scholar] [CrossRef]
  2. Waheed, A.; Baig, N.; Ullah, N.; Falath, W. Removal of hazardous dyes, toxic metal ions and organic pollutants from wastewater by using porous hyper-cross-linked polymeric materials: A review of recent advances. J. Environ. Manag. 2021, 287, 112360. [Google Scholar] [CrossRef] [PubMed]
  3. Kamenická, B.; Weidlich, T. A Comparison of Different Reagents Applicable for Destroying Halogenated Anionic Textile Dye Mordant Blue 9 in Polluted Aqueous Streams. Catalysts 2023, 13, 460. [Google Scholar] [CrossRef]
  4. Hegedus, M.; Lacina, P.; Plotěný, M.; Lev, J.; Kamenická, B.; Weidlich, T. Fast and efficient hydrodehalogenation of chlorinated benzenes in real wastewaters using Raney alloy. J. Water Process Eng. 2020, 38, 101645. [Google Scholar] [CrossRef]
  5. Jia, Y.Q.; Sun, S.H.; Wang, S.; Yan, X.; Qian, J.S.; Pan, B.C. Phosphorus in water: A review on the speciation analysis and species specific removal strategies. Crit. Rev. Environ. Sci. Technol. 2023, 53, 435–456. [Google Scholar] [CrossRef]
  6. Li, X.M.; Huang, S.R.; Li, H.; Huang, H.M. The construction of Fe foam-based catalytic filter for the synchronous removal of organic pollutants and phosphorus: Performance, mechanism and applicability. J. Environ. Chem. Eng. 2025, 13, 116112. [Google Scholar] [CrossRef]
  7. Gottschall, N.; Edwards, M.; Craiovan, E.; Frey, S.K.; Sunohara, M.; Ball, B.; Zoski, E.; Topp, E.; Khan, I.; Clark, I.D.; et al. Amending woodchip bioreactors with water treatment plant residuals to treat nitrogen, phosphorus, and veterinary antibiotic compounds in tile drainage. Ecol. Eng. 2016, 95, 852–864. [Google Scholar] [CrossRef]
  8. Zhang, H.C.; Zhou, C.; Shangguan, M.H.; Peng, Z.Y.; An, Z.Y. Simultaneous removal of organic pollutants and nutrients from mariculture wastewater using a rotating algal biofilm system. J. Water Process Eng. 2024, 57, 104598. [Google Scholar] [CrossRef]
  9. Chen, S.Y.; Habib, Z.; Wang, Z.W.; Zhao, P.; Song, W.L.; Wang, X.H. Integrating anaerobic acidification with two-stage forward osmosis concentration for simultaneously recovering organic matter, nitrogen and phosphorus from municipal wastewater. Water Res. 2023, 245, 120595. [Google Scholar] [CrossRef]
  10. Wang, Y.S.; Song, J.L.; Zhu, R.T.; Peng, M.B.; Long, J.; Bao, T. Degradation of pharmaceutical contaminants in wastewater by non-thermal plasma technology: A comprehensive Review. J. Environ. Chem. Eng. 2025, 13, 116150. [Google Scholar] [CrossRef]
  11. Guo, H.; Pan, S.; Hu, Z.X.; Wang, Y.W.; Jiang, W.X.; Yang, Y.X.; Wang, T.C.; Han, J.G.; Wu, Y.F.; Wang, T.C. Persulfate activated by non-thermal plasma for organic pollutants degradation: A review. Chem. Eng. J. 2023, 470, 144094. [Google Scholar] [CrossRef]
  12. Guo, H.; Wang, Y.W.; Liao, L.N.; Li, Z.; Pan, S.J.; Puyang, C.D.; Su, Y.Y.; Zhang, Y.; Wang, T.C.; Ren, J.Y.; et al. Review on remediation of organic-contaminated soil by discharge plasma: Plasma types, impact factors, plasma-assisted catalysis, and indexes for remediation. Chem. Eng. J. 2022, 436, 135239. [Google Scholar] [CrossRef]
  13. Zhang, A.; Zhou, Y.Q.; Li, Y.M.; Liu, Y.B.; Li, X.; Xue, G.; Miruka, A.C.; Zheng, M.; Liu, Y.N. Motivation of reactive oxygen and nitrogen species by a novel non-thermal plasma coupled with calcium peroxide system for synergistic removal of sulfamethoxazole in waste activated sludge. Water Res. 2022, 212, 118128. [Google Scholar] [CrossRef]
  14. Nippatlapalli, N.; Ganta, A. Recent progress on application of nonthermal plasma for the degradation of aqueous emerging contaminants: A review on mechanism, reactor strategies, integrated systems and future perspective. Process Saf. Environ. Prot. 2024, 187, 1454–1470. [Google Scholar] [CrossRef]
  15. Hou, Z.; Wang, W.; Dong, N.; Chen, P.; Ge, L.; Tan, F.; Wang, X.; Qiao, X.; Wong, P.K. A dual-oxidant advanced oxidation process system containing CaO2 and peroxymonosulfate for organic pollutant degradation: High adaptability and synergistic effect. Sep. Purif. Technol. 2023, 308, 122909. [Google Scholar] [CrossRef]
  16. Xu, Q.X.; Huang, Q.S.; Wei, W.; Sun, J.; Dai, X.H.; Ni, B.J. Improving the treatment of waste activated sludge using calcium peroxide. Water Res. 2020, 187, 116440. [Google Scholar] [CrossRef]
  17. Wang, H.F.; Zhao, Y.S.; Li, T.Y.; Chen, Z.; Wang, Y.N.; Qin, C.Y. Properties of calcium peroxide for release of hydrogen peroxide and oxygen: A kinetics study. Chem. Eng. J. 2016, 303, 450–457. [Google Scholar] [CrossRef]
  18. Lapointe, M.C.; Martel, R.; Cassidy, D.P. RDX degradation by chemical oxidation using calcium peroxide in bench scale sludge systems. Environ. Res. 2020, 188, 109836. [Google Scholar] [CrossRef]
  19. Wu, L.; Wei, Q.; Zhang, Y.; Fan, Y.; Li, M.; Rong, L.; Xiao, X.; Huang, X.; Zou, X. Effects of antibiotics on enhanced biological phosphorus removal and its mechanisms. Sci. Total Environ. 2021, 774, 145571. [Google Scholar] [CrossRef]
  20. Aggelopoulos, C.A.; Meropoulis, S.; Hatzisymeon, M.; Lada, Z.G.; Rassias, G. Degradation of antibiotic enrofloxacin in water by gas-liquid nsp-DBD plasma: Parametric analysis, effect of H2O2 and CaO2 additives and exploration of degradation mechanisms. Chem. Eng. J. 2020, 398, 125622. [Google Scholar] [CrossRef]
  21. Jiang, N.; He, J.; Zhang, A.; Zhou, Y.; Zheng, M.; Xu, X.; Miruka, A.C.; Li, X.; Liu, Y.; Xue, G. Synergistic improvement of short-chain fatty acid production from waste activated sludge via anaerobic fermentation by combined plasma-calcium peroxide process. Bioresour. Technol. 2022, 361, 127754. [Google Scholar] [CrossRef] [PubMed]
  22. Guo, H.; Wang, Y.; Yang, Y.; Xu, F.; Yang, C.; Guo, H.; Hou, J.; Han, J. Simultaneous removal of organic matters and phosphorus by a novel dielectric barrier discharge coupled with CaO2 system: Feasible and mechanism. Sep. Puriϧcation Technol. 2025, 354, 129519. [Google Scholar] [CrossRef]
  23. Lu, S.; Zhang, X.; Xue, Y. Application of calcium peroxide in water and soil treatment: A review. J. Hazard. Mater. 2017, 337, 163–177. [Google Scholar] [CrossRef] [PubMed]
  24. Zhou, L.; Qian, Y.; Chen, J.; Zhang, Y.; Zhou, X. A critical review of solid peroxides in environmental remediation and water purification: From properties to field applications. Chem. Eng. J. 2023, 465, 142424. [Google Scholar] [CrossRef]
  25. Sanito, R.C.; You, S.J.; Wang, Y.F. Degradation of contaminants in plasma technology: An overview. J. Hazard. Mater. 2022, 424, 127390. [Google Scholar] [CrossRef]
  26. Yan, L.G.; Xu, Y.Y.; Yu, H.Q.; Xin, X.D.; Wei, Q.; Du, B. Adsorption of phosphate from aqueous solution by hydroxy-aluminum, hydroxy-iron and hydroxy-iron-aluminum pillared bentonites. J. Hazard. Mater. 2010, 179, 244–250. [Google Scholar] [CrossRef]
  27. Ma, M.; Duan, W.; Huang, X.; Zeng, D.; Hu, L.; Gui, W.; Zhu, G.; Jiang, J. Application of calcium peroxide in promoting resource recovery from municipal sludge: A review. Chemosphere 2024, 354, 141704. [Google Scholar] [CrossRef]
  28. Butxon, G.V.; Greenstock, C.L.; Helman, W.P.; Ross, A.B. Critical review of rate constants for reactions of hydrated electrons, hydrogen atoms and hydroxyl radicals (·OH/·O) in aqueous solution. J. Phys. Chem. Ref. Data 1988, 17, 513–886. [Google Scholar]
  29. Wang, X.W.; Wang, Y.D.; Zhu, Z.Y.; Jin, L.; Li, J.H.; Liu, X. Research progress of pathways of the production of singlet oxygen in water treatment. Ind. Water Treat. 2023, 43, 1–15. [Google Scholar]
  30. Schweikl, H.; Godula, M.; Petzel, C.; Bolay, C.; Hiller, K.A.; Buchalla, W. Critical role of superoxide anions and hydroxyl radicals in HEMA-induced apoptosis. Dent. Mater. 2016, 33, 110–118. [Google Scholar] [CrossRef]
  31. Wang, S.H.; Zhou, L.L.; Li, Z.J.; Han, J.L.; Liu, R.J.; Yun, J. Research progress on degradation of organic pollutants in water by catalytic ozonation. Chin. J. Process Eng. 2022, 22, 586–600. [Google Scholar]
  32. Chou, Y.F.; Yang, Z.Y.; Song, W.F.; Chen, S.Q.; Ma, S.N.; Bai, X.Y. Preparation of Fe3O4-CeOx/AC magnetic catalyst and degradation of tetracycline hydrochloride by catalytic ozonation. Acta Sci. Circumstantiae 2022, 42, 146–155. [Google Scholar]
  33. Xu, Z.L.; Qi, W.X.; Gu, P.C.; Guo, W.Z.; Zhao, L. Kinetics of Degradation of Unsymmetrical Dimethylhydrazine in Water by Hydrogen Peroxide Enhanced Ultraviolet Photocatalytic Ozone. Chem. Eng. Des. Commun. 2019, 45, 146. [Google Scholar]
  34. Chen, Y.S.; Zhang, X.S.; Chang, S.; Dai, Y.C.; Yuan, W.K. Study on the degradation mechanism of organic compounds in the aqueous solution by pulsed high-voltage discharge plasma. Acta Sci. Circumstantiae 2005, 25, 113–116. [Google Scholar]
  35. Wang, Y.W.; Huang, J.W.; Guo, H.; Puyang, C.D.; Han, J.G.; Li, Y.; Ruan, Y.X. Mechanism and process of sulfamethoxazole decomposition with persulfate activated by pulse dielectric barrier discharge plasma. Sep. Purif. Technol. 2022, 287, 120540. [Google Scholar] [CrossRef]
  36. Li, Q.B.; Wei, Y.; Cui, H.X.; Feng, H.; Lang, J.Y. Quantitative Analysis of TOC in Water Quality Based on UV-Vis Spectroscopy. Spectrosc. Spectr. Anal. 2022, 42, 376–380. [Google Scholar]
  37. U.S. Environmental Protection Agency (EPA). Toxicity Estimation Software Tool (T.E.S.T.), Version 4.1.; National Center for Computational Toxicology, Office of Research and Development, EPA: Washington DC, USA, 2012.
  38. Dennington, R.; Keith, T.A.; Millam, J.M. GaussView, Version 6.0.16; Semichem Inc.: Shawnee Mission, KS, USA, 2016.
  39. Frisch, M.J.; Trucks, G.W.; Schlegel, H.B.; Scuseria, G.E.; Robb, M.A.; Cheeseman, J.R.; Scalmani, G.; Barone, V.; Petersson, G.A.; Nakatsuji, H.; et al. Gaussian 16, Revision B.01; Gaussian, Inc.: Wallingford, CT, USA, 2016.
  40. Lu, T.; Chen, F. Multiwfn: A multifunctional wavefunction analyzer. J. Comput. Chem. 2012, 33, 580–592. [Google Scholar] [CrossRef]
  41. Wang, H.J.; Guo, H.; Wu, Q.S.; Zhou, G.S.; Yi, C.W. Effect of activated carbon addition on H2O2 formation and dye decoloration in a pulsed discharge plasma system. Vacuum 2016, 128, 99–101. [Google Scholar] [CrossRef]
  42. Bander, H.; Hoigné, J. Determination of ozone in water by the indigo method. Ozone Sci. Eng. 1982, 4, 449–456. [Google Scholar]
  43. Guo, H.; Li, D.S.; Li, Z.; Lin, S.Y.; Wang, Y.W.; Pan, S.J.; Han, J.G. Promoted elimination of antibiotic sulfamethoxazole in water using sodium percarbonate activated by ozone: Mechanism, degradation pathway and toxicity assessment. Sep. Purif. Technol. 2021, 266, 118543–118545. [Google Scholar] [CrossRef]
  44. Kang, J.Y. Study of improved method for determination of orthophosphate in water. Electr. Power Technol. Environ. Prot. 2020, 36, 27–30. [Google Scholar]
Figure 1. Effect of CaO2 dosage: (a) TC degradation curve; (b) kinetic constant; (c) phosphorus removal curve; and (d) kinetic constant.
Catalysts 15 00486 g001aCatalysts 15 00486 g001b
Figure 2. Effects of IPA: (a) TC degradation curve; (b) phosphorus removal curve; effects of TEDA: (c) TC degradation curve; (d) phosphorus removal curve; effects of p-BQ: (e) TC degradation curve; and (f) phosphorus removal curve.
Catalysts 15 00486 g002aCatalysts 15 00486 g002b
Figure 3. (a) Changes in O3 concentration during degradation; (b) Change in absorbance of solution; (c) Changes in H2O2 concentration during degradation.
Catalysts 15 00486 g003
Figure 4. 3DEEFMS of TC solution after different treatment times: (a) 0 min; (b) 10 min; (c) 20 min; and (d) 30 min.
Catalysts 15 00486 g004
Figure 5. Removal efficiency under various reaction systems: (a) ammonia nitrogen; (b) TOC; and (c) COD.
Catalysts 15 00486 g005
Figure 6. (a) Model of TC; (b) LUMO of TC; (c) HOMO of TC; (d) f0; (e) f; (f) f+; (g) Fukui index of TC.
Catalysts 15 00486 g006
Figure 7. Prediction of degradation pathway (a,b) of TC.
Catalysts 15 00486 g007
Figure 8. Toxicity assessment: (a) Fathead minnow; and (b) Daphnia magna.
Catalysts 15 00486 g008
Figure 9. Experimental device diagram.
Catalysts 15 00486 g009
Disclaimer/Publisher’s Note: The statements, opinions and data contained in all publications are solely those of the individual author(s) and contributor(s) and not of MDPI and/or the editor(s). MDPI and/or the editor(s) disclaim responsibility for any injury to people or property resulting from any ideas, methods, instructions or products referred to in the content.

