1. Introduction
Skin hyperpigmentation disorders, such as melasma, post-inflammatory hyperpigmentation, ephelides, and lentigines, are common dermatological conditions that can significantly impact individuals’ quality of life and self-esteem [
1,
2]. Such conditions are primarily a result of the overproduction and/or distribution of melanin, the natural pigment responsible for skin color, hair, and eyes in humans [
3,
4]. The melanin pigment is synthesized through a well-known physiological process called melanogenesis, a combination of enzymatically catalyzed and chemical reactions involving three specific enzymes, namely, TYR, tyrosinase-related protein 1, and tyrosinase-related protein 2 [
5]. Nevertheless, although three enzymes are involved in the melanin biosynthesis pathway, only TYR is exclusively necessary as it is the rate-limiting enzyme, catalyzing the hydroxylation of the amino acid L-tyrosine to L-3,4-dihydroxyphenylalanine (L-DOPA) and further oxidation to DOPAquinone (DQ), being the remainder of the reaction sequence processed spontaneously at physiological pH value [
6,
7,
8,
9]. Compounds that can inhibit TYR catalytic activity are, therefore, considered a key strategy for treating or mitigating skin hyperpigmentation-related disorders. Inhibitors such as KA, hydroquinone, and arbutin have been considered the gold-standard TRY inhibitors and were extensively used in cosmetic applications; however, despite their efficacy, many of these agents are often associated with adverse side effects, including skin irritation, contact dermatitis, transient erythema, and potential mutagenic effect to cells [
10,
11,
12,
13]. Consequently, a growing demand for safer alternatives with fewer secondary effects emerged. Specifically, plant sources offer a promising avenue for developing novel treatments with fewer secondary effects due to their richness in natural bioactive compounds. Polyphenols, which are secondary metabolites in plants, are particularly notable as the largest group of TYR inhibitors, as many of them are accepted as substrates by the enzyme [
14]. Several studies have demonstrated the efficacy and mechanisms behind naturally driven compounds on the modulation of TYR activity, making this approach increasingly appealing to consumers [
15,
16,
17,
18].
Beyond the selection of bioactive compounds, the choice of extraction solvent is critical to ensuring an efficient recovery of these metabolites. Conventional solvents such as ethanol and methanol have been widely used [
19]; however, their toxicity and environmental impact have driven the search for more sustainable alternatives. NADES have emerged as an innovative and eco-friendly approach, offering high solubility for phenolic compounds and enabling the selective extraction of bioactives with minimal environmental impact [
20,
21]. Their effectiveness has been demonstrated in various plant matrices; for instance, Freitas et al. [
22] reported 3 to 5-fold higher extraction yields on the extraction of cork (
Quercus suber) bioactives using NADES, highlighting their potential as efficient green alternatives.
Nevertheless, the stability and bioavailability of the extracted bioactive compounds can be limited. These challenges have led to growing interest in the oligo/polymerization of phenolic compounds, which create novel materials with valuable properties and applications in various fields, including cosmetics [
23,
24]. In this regard, polymer synthesis via enzymatic-catalyzed reactions has received great attention in recent years since this process enables the formation of polymeric structures with higher efficiency and selectivity under mild conditions [
24,
25]. An example is laccase, a multicopper oxidoreductase enzyme, found in many plants and fungi, capable of catalyzing the oxidation of various compounds, including polyphenols, leading to the formation of high-molecular-weight compounds with enhanced properties such as antioxidant activity [
26,
27].
To our knowledge, no specific studies have investigated the laccase-assisted polymerization of bioactive compounds with the aim of evaluating their impact on TYR catalytic activity and/or melanogenesis signaling pathways. However, some studies have reported the laccase-catalyzed oxidation of natural compounds already known to modulate TYR activity, without assessing the functional impact of the polymerized products [
24,
25,
28,
29]. For instance, Li et al. [
29] successfully used laccase to oxidize bioactive compounds extracted from cork and grapes, producing polymers with enhanced anti-aging properties. In line with the present study’s objectives, such oligo/polymers may also exhibit enhanced TYR modulation, which may be due to their increased affinity for the enzyme’s active site, as larger molecules with multiple functional groups can enable stronger or more specific interactions with the enzyme.
Despite the growing interest in natural sources for TYR inhibition, many potential plant sources remain underexplored, creating a gap in the discovery of novel bioactive compounds with enhanced efficacy. Therefore, in this study, we aimed to address this gap by evaluating the TYR inhibitory potential of bioactive-rich extracts from four natural sources—acorn (
Quercus suber spp.), cocoa (
Theobroma cacao), cork (
Quercus suber L.), and eucalyptus (
Corymbia citriodora)—extracted using both HE and NADES. These natural sources were selected based on their documented richness in polyphenolic compounds and traditional use in health-related applications, as well as their promising antioxidant, anti-inflammatory, and dermatologic benefits [
17,
30,
31,
32,
33,
34]. Many of these bioactive compounds have been reported to modulate TYR activity, making them promising candidates for skin depigmentation agents [
14,
35,
36]. In addition, to enhance the sustainability of this work, TYR was extracted from the edible mushroom
Agaricus bisporus, a widely available and low-cost source that shares high similarity with mammalian TYR [
14]. Consequently, this source of enzyme is commonly used in TYR inhibition studies due to its commercial availability and relevance, as compounds that modulate mushroom TYR are generally considered compatible with human TYR [
14].
Furthermore, we investigated whether the laccase-assisted polymerization of these extracts could enhance their TYR inhibitory activity, potentially offering a more effective approach to treating hyperpigmentation disorders. Additionally, we compared the efficiency of NADES versus conventional HE solvents in both the extraction and polymerization processes, aiming to establish a more sustainable and eco-friendly methodology for obtaining bioactive compounds with improved properties.
By combining green chemistry principles with enzymatic catalysis, this work not only explores the potential of natural sources but also provides insights into the development of novel, eco-friendly strategies for modulating TYR activity and, consequently, skin hyperpigmentation disorders.
2. Results and Discussion
2.1. Extraction Yields
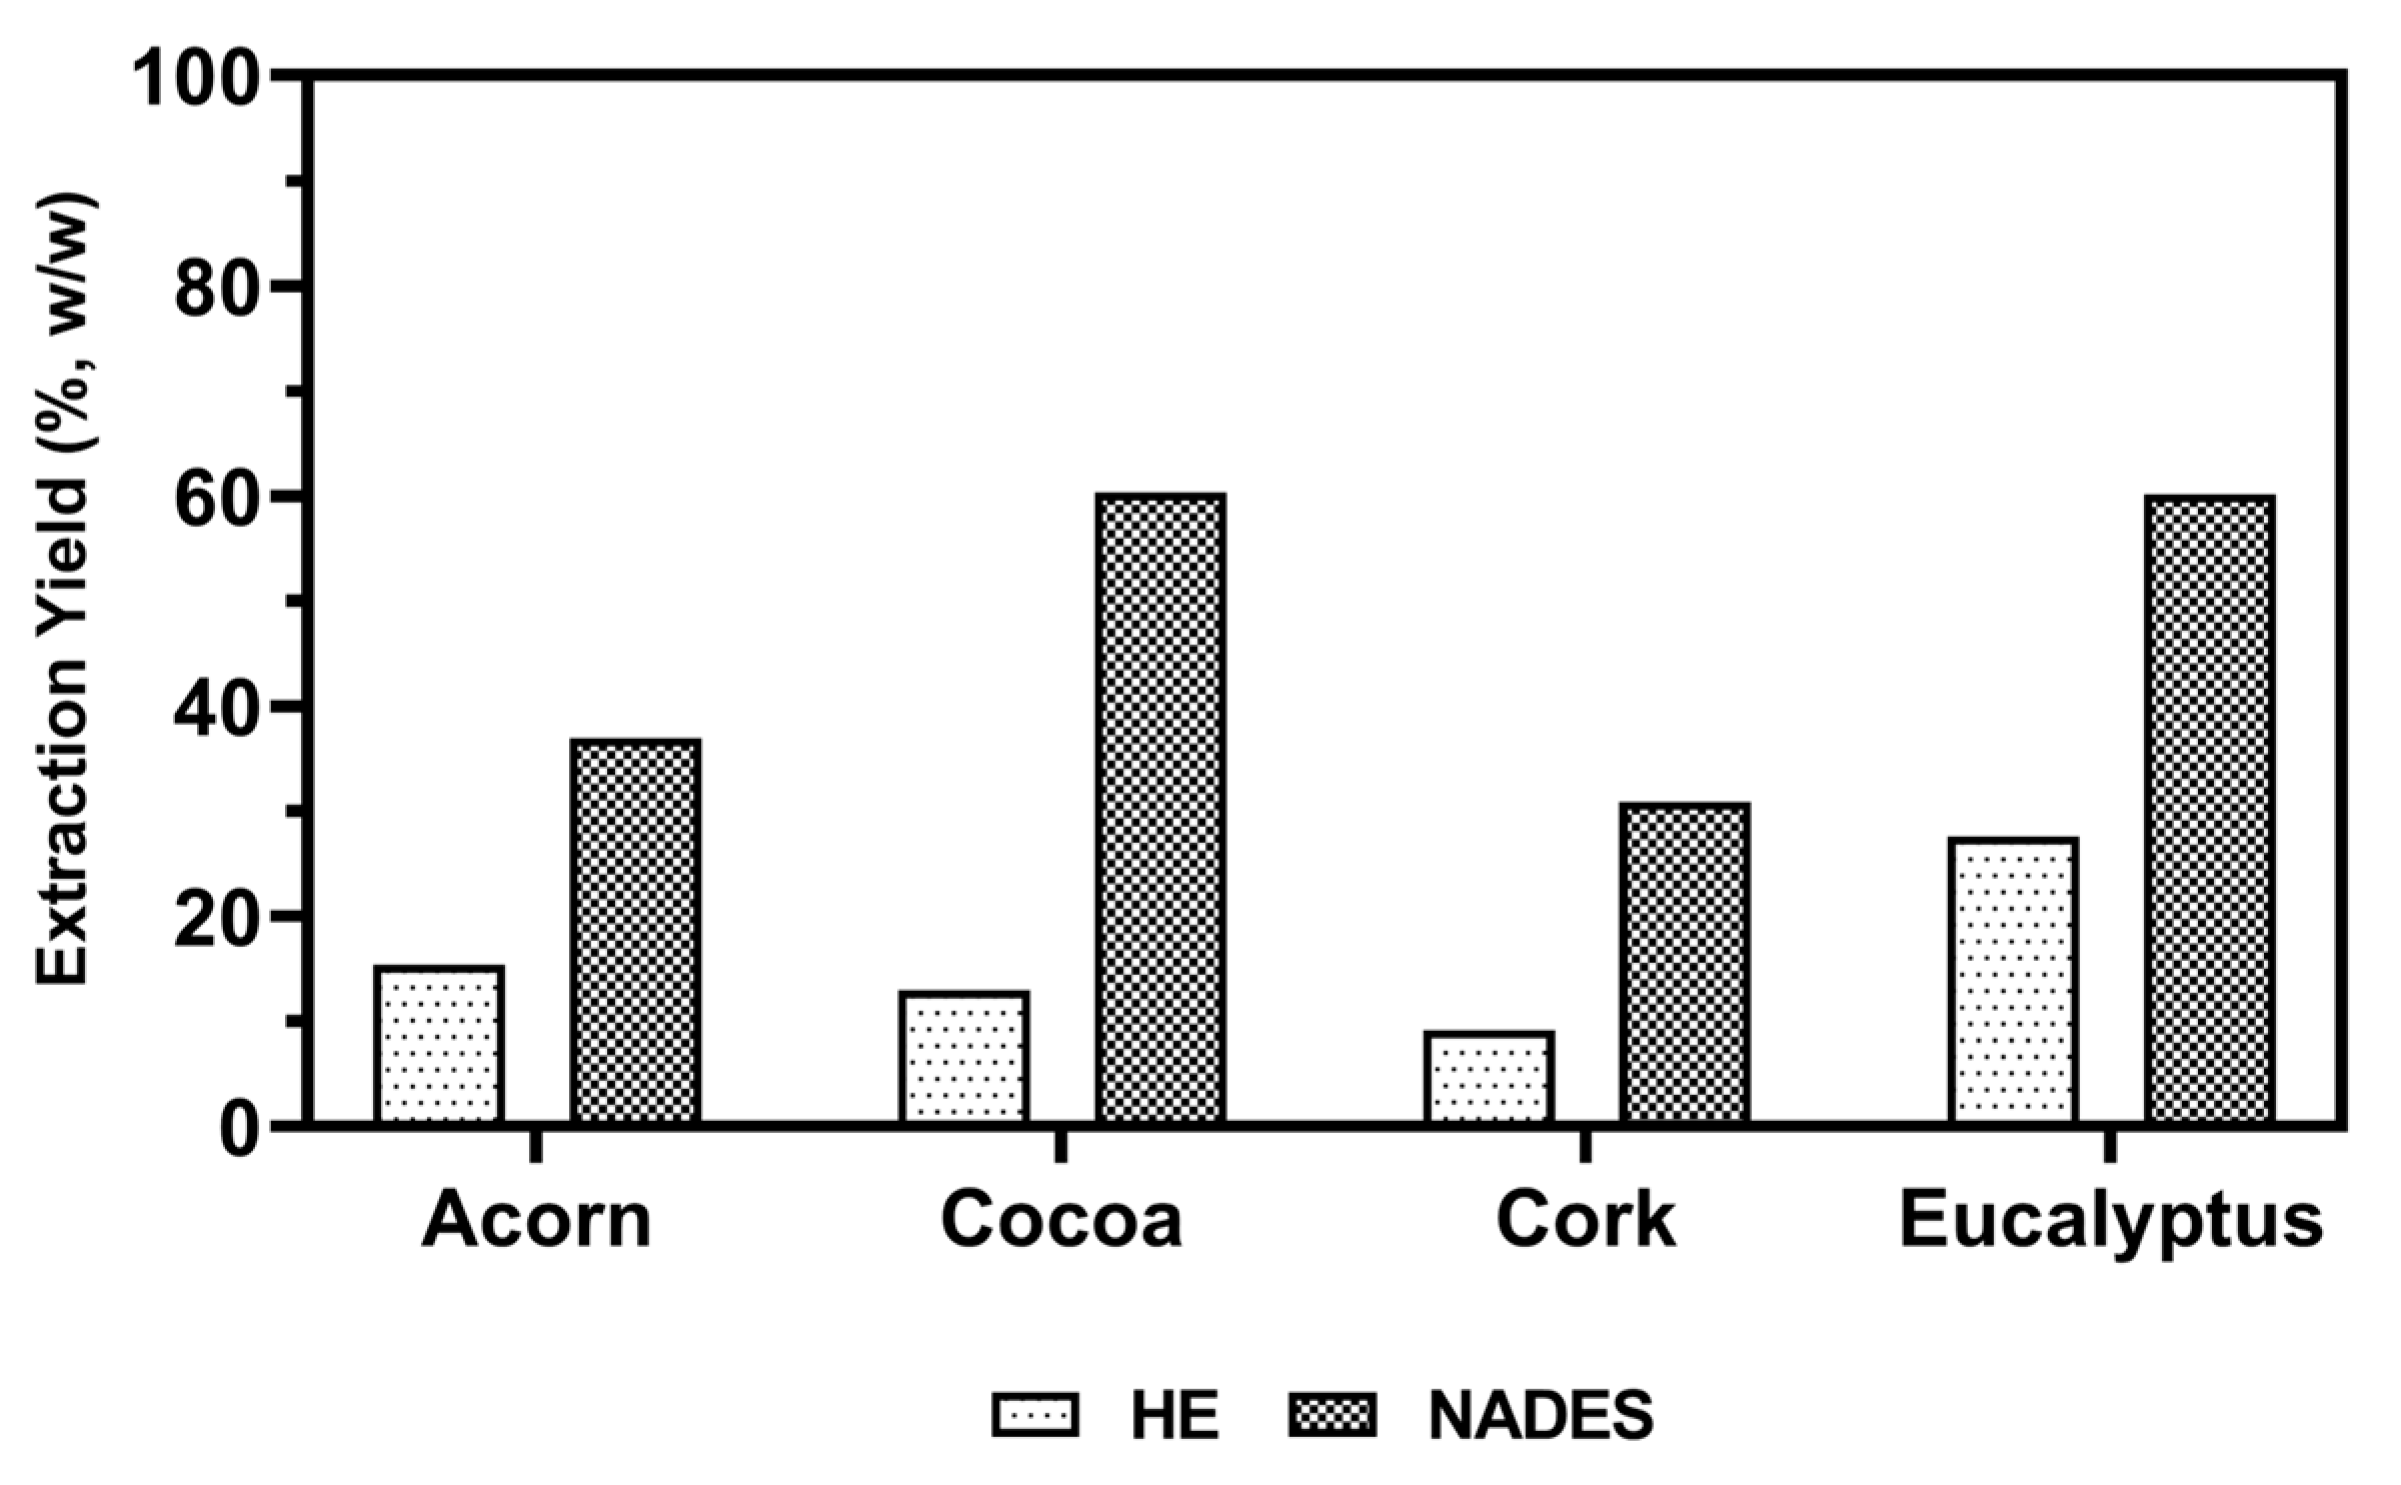
Bioactive compounds were extracted from natural sources such as acorn, cocoa, cork, and eucalyptus using conventional organic solvents (HE) and NADES. This study aimed to evaluate the effectiveness of NADES in comparison to a HE solution for enhancing the extraction of bioactive molecules. The HE solution in a ratio of 50% (
v/
v) was chosen as a benchmark due to its established efficiency in extracting bioactive compounds, especially phenolic compounds, from plant materials [
29]. The extraction yields obtained are presented in
Figure 1.
The results demonstrated that NADES significantly improved extraction yields compared to HE, highlighting their potential as sustainable alternatives for industrial applications. Specifically, the yields obtained with NADES were 2.2 to 4.7-fold higher than those obtained with HE, with cocoa showing the highest yield, 60.3%. This improvement can be attributed to the properties of the NADES used in this study, which consisted of a eutectic mixture of glycerol and DL-lactic acid in a 4:1 ratio, chosen for its natural origin, low cost, non-toxicity, and high polarity [
22]. The acidic nature of lactic acid in the mixture acted as a catalyst, improving the extraction of a wide range of bioactive compounds, which is particularly useful for applications in cosmetics and pharmaceuticals. Additionally, the superior solubilizing ability of NADES, which forms hydrogen bonds, enhances dissolution capacity and extraction efficiency. Despite their high viscosity, which can hinder mass transfer, this limitation was mitigated by conducting the extraction at 70 °C, reducing viscosity and improving diffusivity.
NADES offer a sustainable and cost-effective alternative to traditional solvents, eliminating the need for additional sample preparation steps and reducing environmental impact. These findings highlight the potential of NADES in the efficient extraction of bioactive compounds for various industrial applications, reinforcing their role in promoting green chemistry and sustainable practices.
2.2. Total Phenolic Content (TPC) and Total Flavonoid Content (TFC)
Polyphenols represent the largest group of compounds known to modulate TYR activity, as many of them act as substrates for the enzyme, influencing both polymerization and inhibition processes [
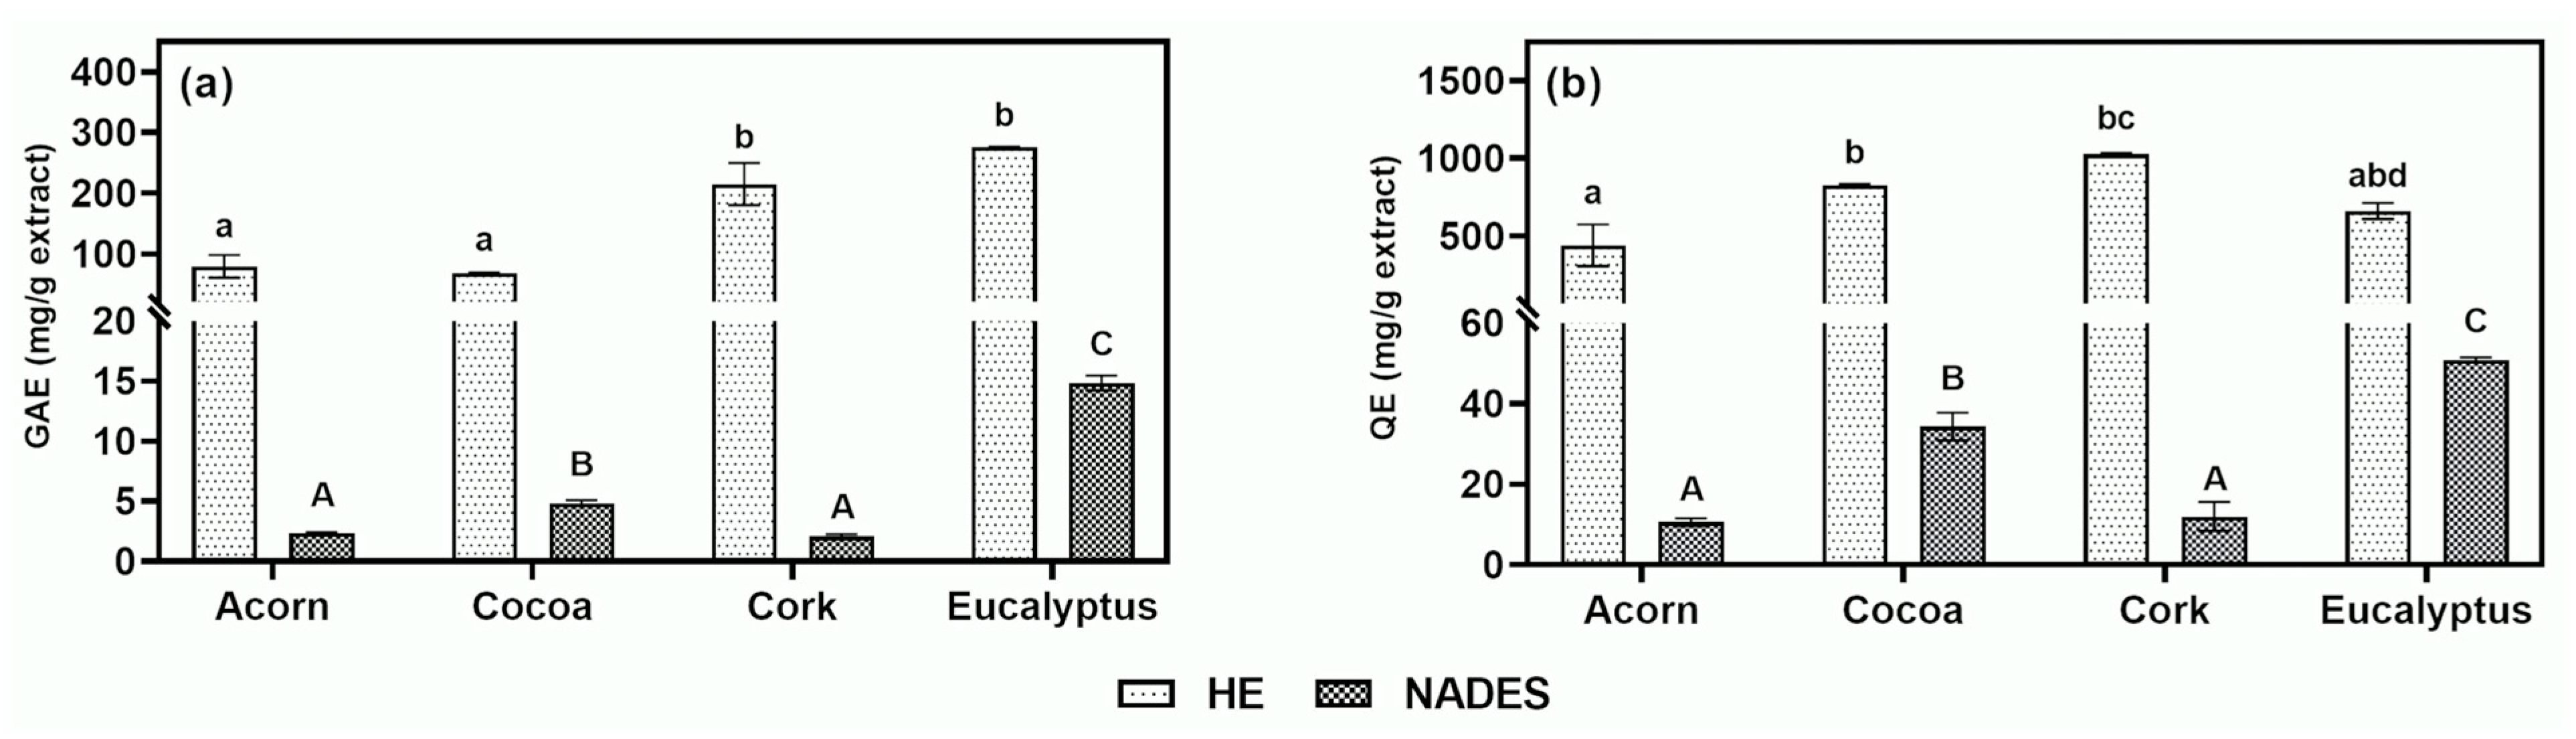
14]. Therefore, the evaluation of the TPC and TFC in acorn, cocoa, cork, and eucalyptus extracts obtained using HE and NADES was assessed. The results were expressed in terms of gallic acid equivalents (GAE) for TPC and quercetin equivalents (QE) for TFC and are presented in
Figure 2a,b, respectively.
Regarding HE extraction, eucalyptus (276.259 ± 0.568 mg GAE/g extract) and cork (215.020 ± 34.575 mg GAE/g extract) exhibited significantly higher TPC compared to acorn (79.405 ± 18.913 mg GAE/g extract) and cocoa (67.930 ± 0.862 mg GAE/g extract). These findings align with previous studies, which reported TPC values of 235.870 ± 4.380 mg GAE/g extract for eucalyptus and 200–350 mg GAE/g extract for cork, confirming their richness in phenolic compounds. The high TPC values suggest that these extracts are promising candidates for TYR inhibition and laccase-mediated polymerization, as polyphenols are known to interact with these enzymes.
In contrast, NADES extraction yielded lower TPC values, with eucalyptus (14.840 ± 0.616 mg GAE/g extract) and cocoa (4.856 ± 0.233 mg GAE/g extract) showing the highest concentrations. The reduced TPC values in NADES extracts may be attributed to the residual presence of the eutectic solvent after lyophilization, which dilutes the bioactive concentration. Additionally, the acidic nature of NADES, due to lactic acid, may interfere with the Folin–Ciocalteu assay by hindering the electron transfer required for the colorimetric reaction [
37], further contributing to lower measured TPC values. Despite these limitations, some extracts still demonstrated considerable phenolic content, which is relevant for TYR modulation and polymerization applications.
Flavonoids, a subclass of polyphenols with well-documented activity against TYR [
14], were also quantified. HE extraction yielded the highest TFC for cork (1026.533 ± 10.156 mg QE/g extract) and cocoa (827.899 ± 6.768 mg QE/g extract), while NADES extraction showed the highest TFC for eucalyptus (50.864 ± 0.618 mg QE/g extract). Similar to TPC, TFC values were lower in NADES extracts, likely due to the acidic pH interfering with the aluminum chloride assay. Nevertheless, although lower than those from HE extraction, the results obtained for acorn and cocoa extracts obtained by NADES extraction are in line with those found in literature, where studies conducted on
Quercus suber L. acorns from Algeria and Tunisia by Tizemmour et al. [
38] found TFC values of 10.590 and 8.990 mg QE/g extract, respectively, and for cocoa, Setiyoningrum et al. [
39] found values ranging from 24.440 to 64.330 mg QE/g extract. Moreover, despite the lower absolute values, NADES maintained consistent trends between TPC and TFC, highlighting their potential as a green alternative for extracting bioactive compounds. The high flavonoid content in HE extracts, particularly in cork and cocoa, further supports their potential for TYR inhibition and laccase-mediated polymerization, as flavonoids are known to interact with these enzymes through competitive or non-competitive mechanisms [
14,
24].
Overall, the results demonstrate that HE extraction is more effective for obtaining higher concentrations of phenolic compounds, while NADES extraction, despite lower absolute values, preserves the relative abundance of bioactives across different natural sources. The significant TPC and TFC values observed in eucalyptus, cork, acorn, and cocoa extracts suggest their potential for applications in modulating skin pigmentation disorders via TYR inhibition and in the polymerization process mediated by laccase. This highlights the dual relevance of these extracts in both cosmetic and industrial applications while also positioning NADES as a promising, eco-friendly solvent for the targeted extraction of bioactive compounds.
2.3. Antioxidant Activity of Extracts
Natural compounds with high antioxidant activity play a crucial role in mitigating skin pigmentation disorders, such as melasma, by reducing oxidative damage induced by environmental factors. Excessive oxidative stress can disrupt melanin synthesis and damage melanocytes, highlighting the importance of antioxidants in protecting skin health [
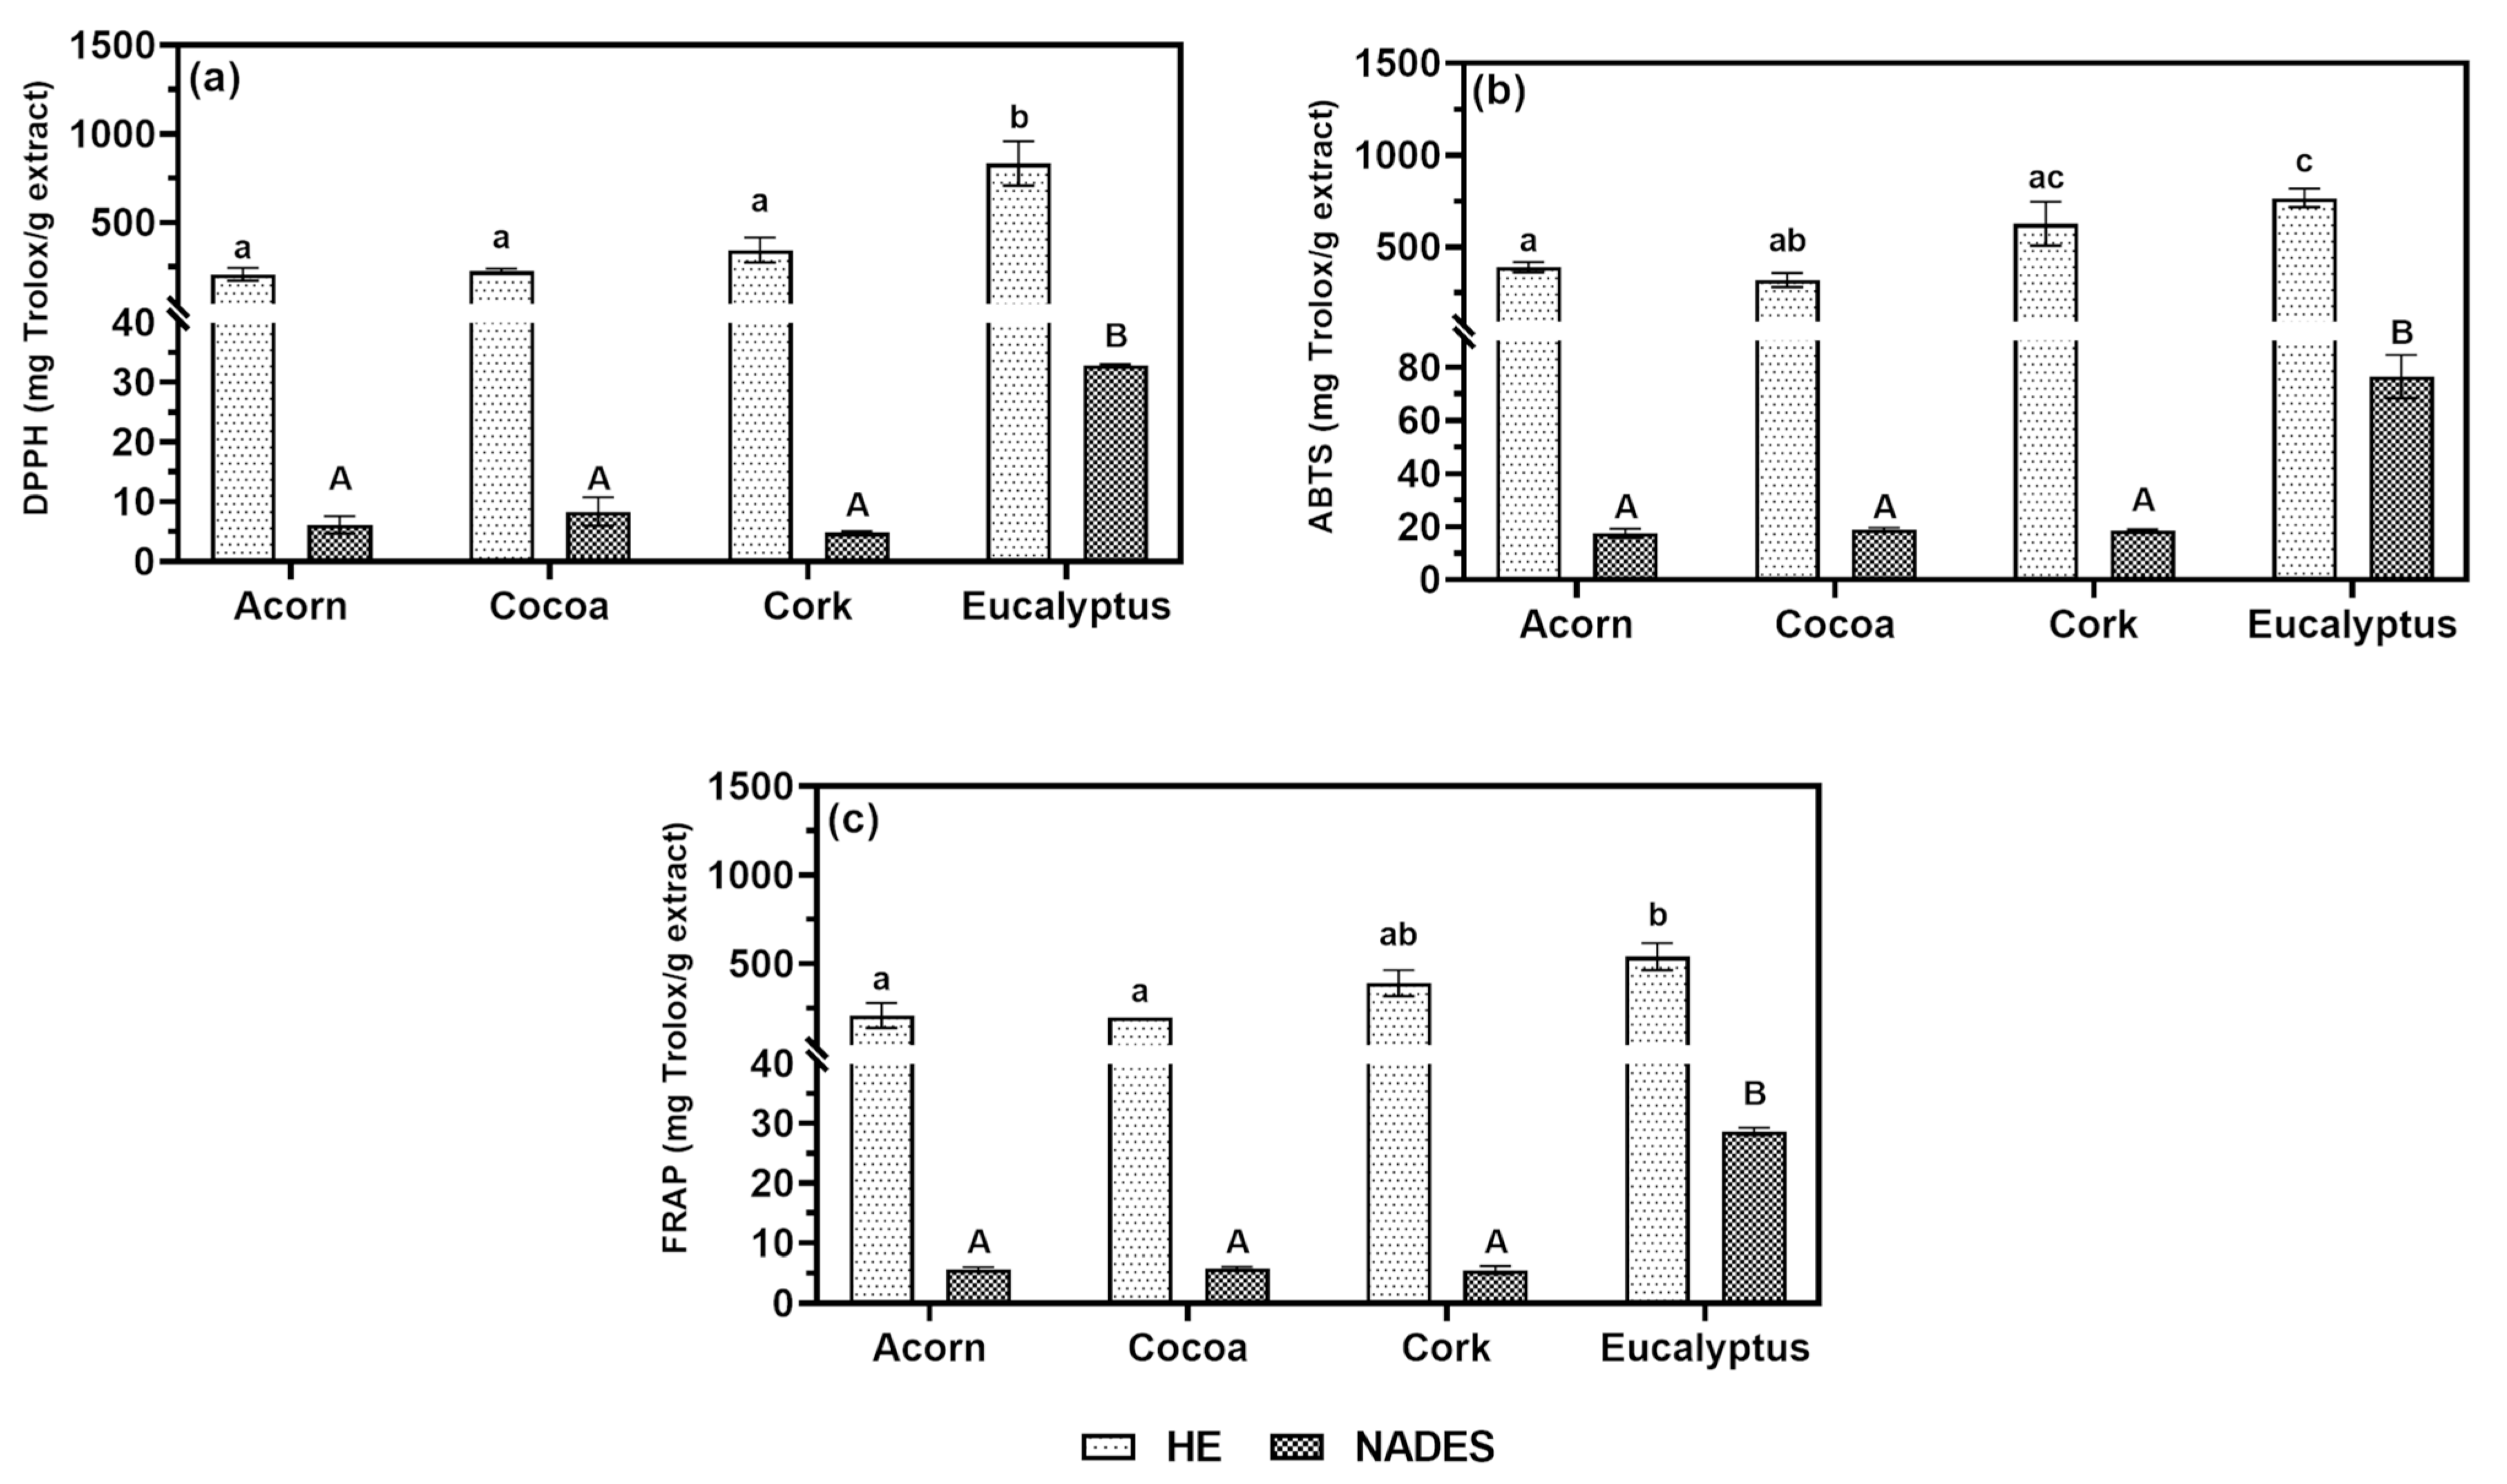
40]. In this study, the antioxidant activity of acorn, cocoa, cork, and eucalyptus extracts, obtained using HE and NADES extraction, was evaluated through three assays: DPPH and ABTS radical scavenging, and FRAP. The data are presented in
Figure 3 in terms of Trolox equivalents (TE) (mg TE/g extract).
A strong correlation was observed between the TPC and antioxidant activity, confirming that extracts rich in phenolic compounds exhibit potent antioxidant properties [
41]. For HE extracts, eucalyptus and cork demonstrated the highest TPC values and the strongest antioxidant activity. In the ABTS and FRAP assays, eucalyptus (767.236 ± 50.853 mg TE/g extract for ABTS; 539.686 ± 75.933 mg TE/g extract for FRAP) and cork (627.054 ± 119.455 mg TE/g extract for ABTS; 390.702 ± 73.179 mg TE/g extract for FRAP) stood out as the most effective antioxidants. However, in the DPPH assay, eucalyptus (832.195 ± 124.502 mg TE/g extract) showed significantly higher activity than cork (345.367 ± 69.959 mg TE/g extract), emphasizing the importance of using multiple assays to capture the diverse mechanisms of antioxidant action.
For NADES extracts, eucalyptus consistently exhibited the highest antioxidant activity across all assays (32.885 ± 0.220 mg TE/g extract for DPPH; 76.567 ± 8.106 mg TE/g extract for ABTS; 28.700 ± 0.617 mg TE/g extract for FRAP), aligning with its superior TPC values. Despite lower absolute values compared to HE extracts, the consistent antioxidant trends in NADES extracts highlight their potential as a green alternative for bioactive extraction. As previously mentioned, the reduced antioxidant capacity of NADES extracts may be attributed to the residual presence of the eutectic solvent, which dilutes bioactive concentrations, and the acidic pH of NADES, which may interfere with the accuracy of the assays. Nevertheless, it means that a higher concentration is required to achieve the same values as the HE extracts.
The strong antioxidant activity of eucalyptus and cork HE extracts is supported by previous studies. For instance, essential oils from
Eucalyptus citriodora leaves have demonstrated potent antioxidant and anticancer properties [
42], while
Quercus suber cork extracts have shown antioxidant activity comparable to ascorbic acid [
43]. These findings suggest that eucalyptus and cork extracts are promising candidates for modulating melanin synthesis as their antioxidant properties can scavenge free radicals, protect melanocytes from oxidative stress, and potentially influence the oxidation reactions catalyzed by TYR during melanogenesis.
The antioxidant activity of the extracts, particularly eucalyptus and cork, underscores their potential for addressing skin pigmentation disorders. The use of multiple assays provided a comprehensive evaluation of their antioxidant capacity, while the consistent trends observed in NADES extracts highlight their viability as a sustainable alternative to conventional solvents.
2.4. Identification of Bioactive Molecules on the Extracts
The chemical composition of natural extracts is a critical factor in their potential for enzymatic polymerization and TYR activity modulation, which is directly linked to the development of advanced skincare formulations. A liquid chromatography-mass spectrometry (LC-MS) analysis was performed on the extracts obtained using HE and NADES to better understand the bioactives profile of acorn, cocoa, cork, and eucalyptus. The results revealed differences in the extraction efficiency between the two solvents, providing insights into the types of compounds that could serve as substrates for laccase-mediated polymerization. The main compounds identified in each source are present in
Table 1, while the complete compound profile is available in
Tables S1–S4 and the chronograms of each bioactive in
Figures S1–S17.
HE extraction demonstrated higher efficiency for polar compounds, such as phenolic acids (e.g., gallic acid) and hydrolyzable tannins (e.g., castalagin). For instance, gallic acid was more abundant in HE extracts of acorn (58.4% vs. 33.3% in NADES) and cork (10.3% vs. 8.2% in NADES;
Table S3). Similarly, castalagin, a hydrolyzable tannin, was predominantly extracted by HE in cork (48.2% vs. 36.5% in NADES), likely due to the presence of water facilitating hydrolysis. These polar compounds are excellent candidates for laccase-mediated polymerization as they contain multiple phenolic groups that can be oxidized and cross-linked by the enzyme.
In contrast, NADES showed superior extraction efficiency for less polar and complex compounds, such as flavonoids (e.g., catechin, epicatechin) and monoterpenes (e.g., limonene). For example, catechin and epicatechin were more efficiently extracted by NADES in acorn as shown in
Table S1 (8.7% and 11.3%, respectively, compared to 0.9% for both in HE). Flavonoids, with their multiple hydroxyl groups and aromatic rings, are also promising substrates for laccase as they can undergo oxidative coupling to form polymeric structures with enhanced biological activities. Additionally, limonene, a monoterpene, was significantly more abundant in NADES extracts of eucalyptus (72.7% vs. 49.8% in HE). While monoterpenes are less likely to be directly polymerized by laccase, their presence may influence the polymerization process of other phenolic compounds by modulating the reaction environment.
In addition to the main compounds discussed above, the LC-MS analysis identified a range of other bioactive compounds in the extracts, including syringic acid, quercetin, and other phenolic derivatives. Although not the main focus of this discussion, these compounds may contribute to the overall biological activity of the extracts, as outlined in the
Supporting Information. The bioactive profiles identified by LC-MS provide valuable insights into the potential of these extracts to undergo enzymatic polymerization. Phenolic acids like gallic acid and ellagic acid, abundant in HE extracts, are known substrates for laccase and can form stable polymeric networks. Similarly, flavonoids such as catechin and epicatechin, which NADES more efficiently extract, are also excellent candidates for laccase-mediated polymerization due to their polyphenolic structures. These findings highlight the importance of solvent selection in optimizing the extraction of target bioactives for polymerization applications. Beyond their potential for laccase-mediated polymerization, the bioactive compounds identified in acorn, cocoa, cork, and eucalyptus extracts are also known to exhibit inhibitory activity against TYR, as many of these compounds are recognized as substrates by the enzyme [
14,
35,
44]. The dual functionality of these bioactive compounds—serving as substrates for laccase-mediated polymerization and as TYR inhibitors—highlights their potential in the development of advanced skincare formulations.
By combining the structural benefits of enzymatic polymerization with the biological activities of natural extracts, these formulations can offer enhanced efficacy in addressing skin concerns such as uneven skin tone and hyperpigmentation.
2.5. Laccase-Assisted Polymerization of the Extracts
2.5.1. Polymerization Products—Evaluated by TPC and UV-Visible Spectra
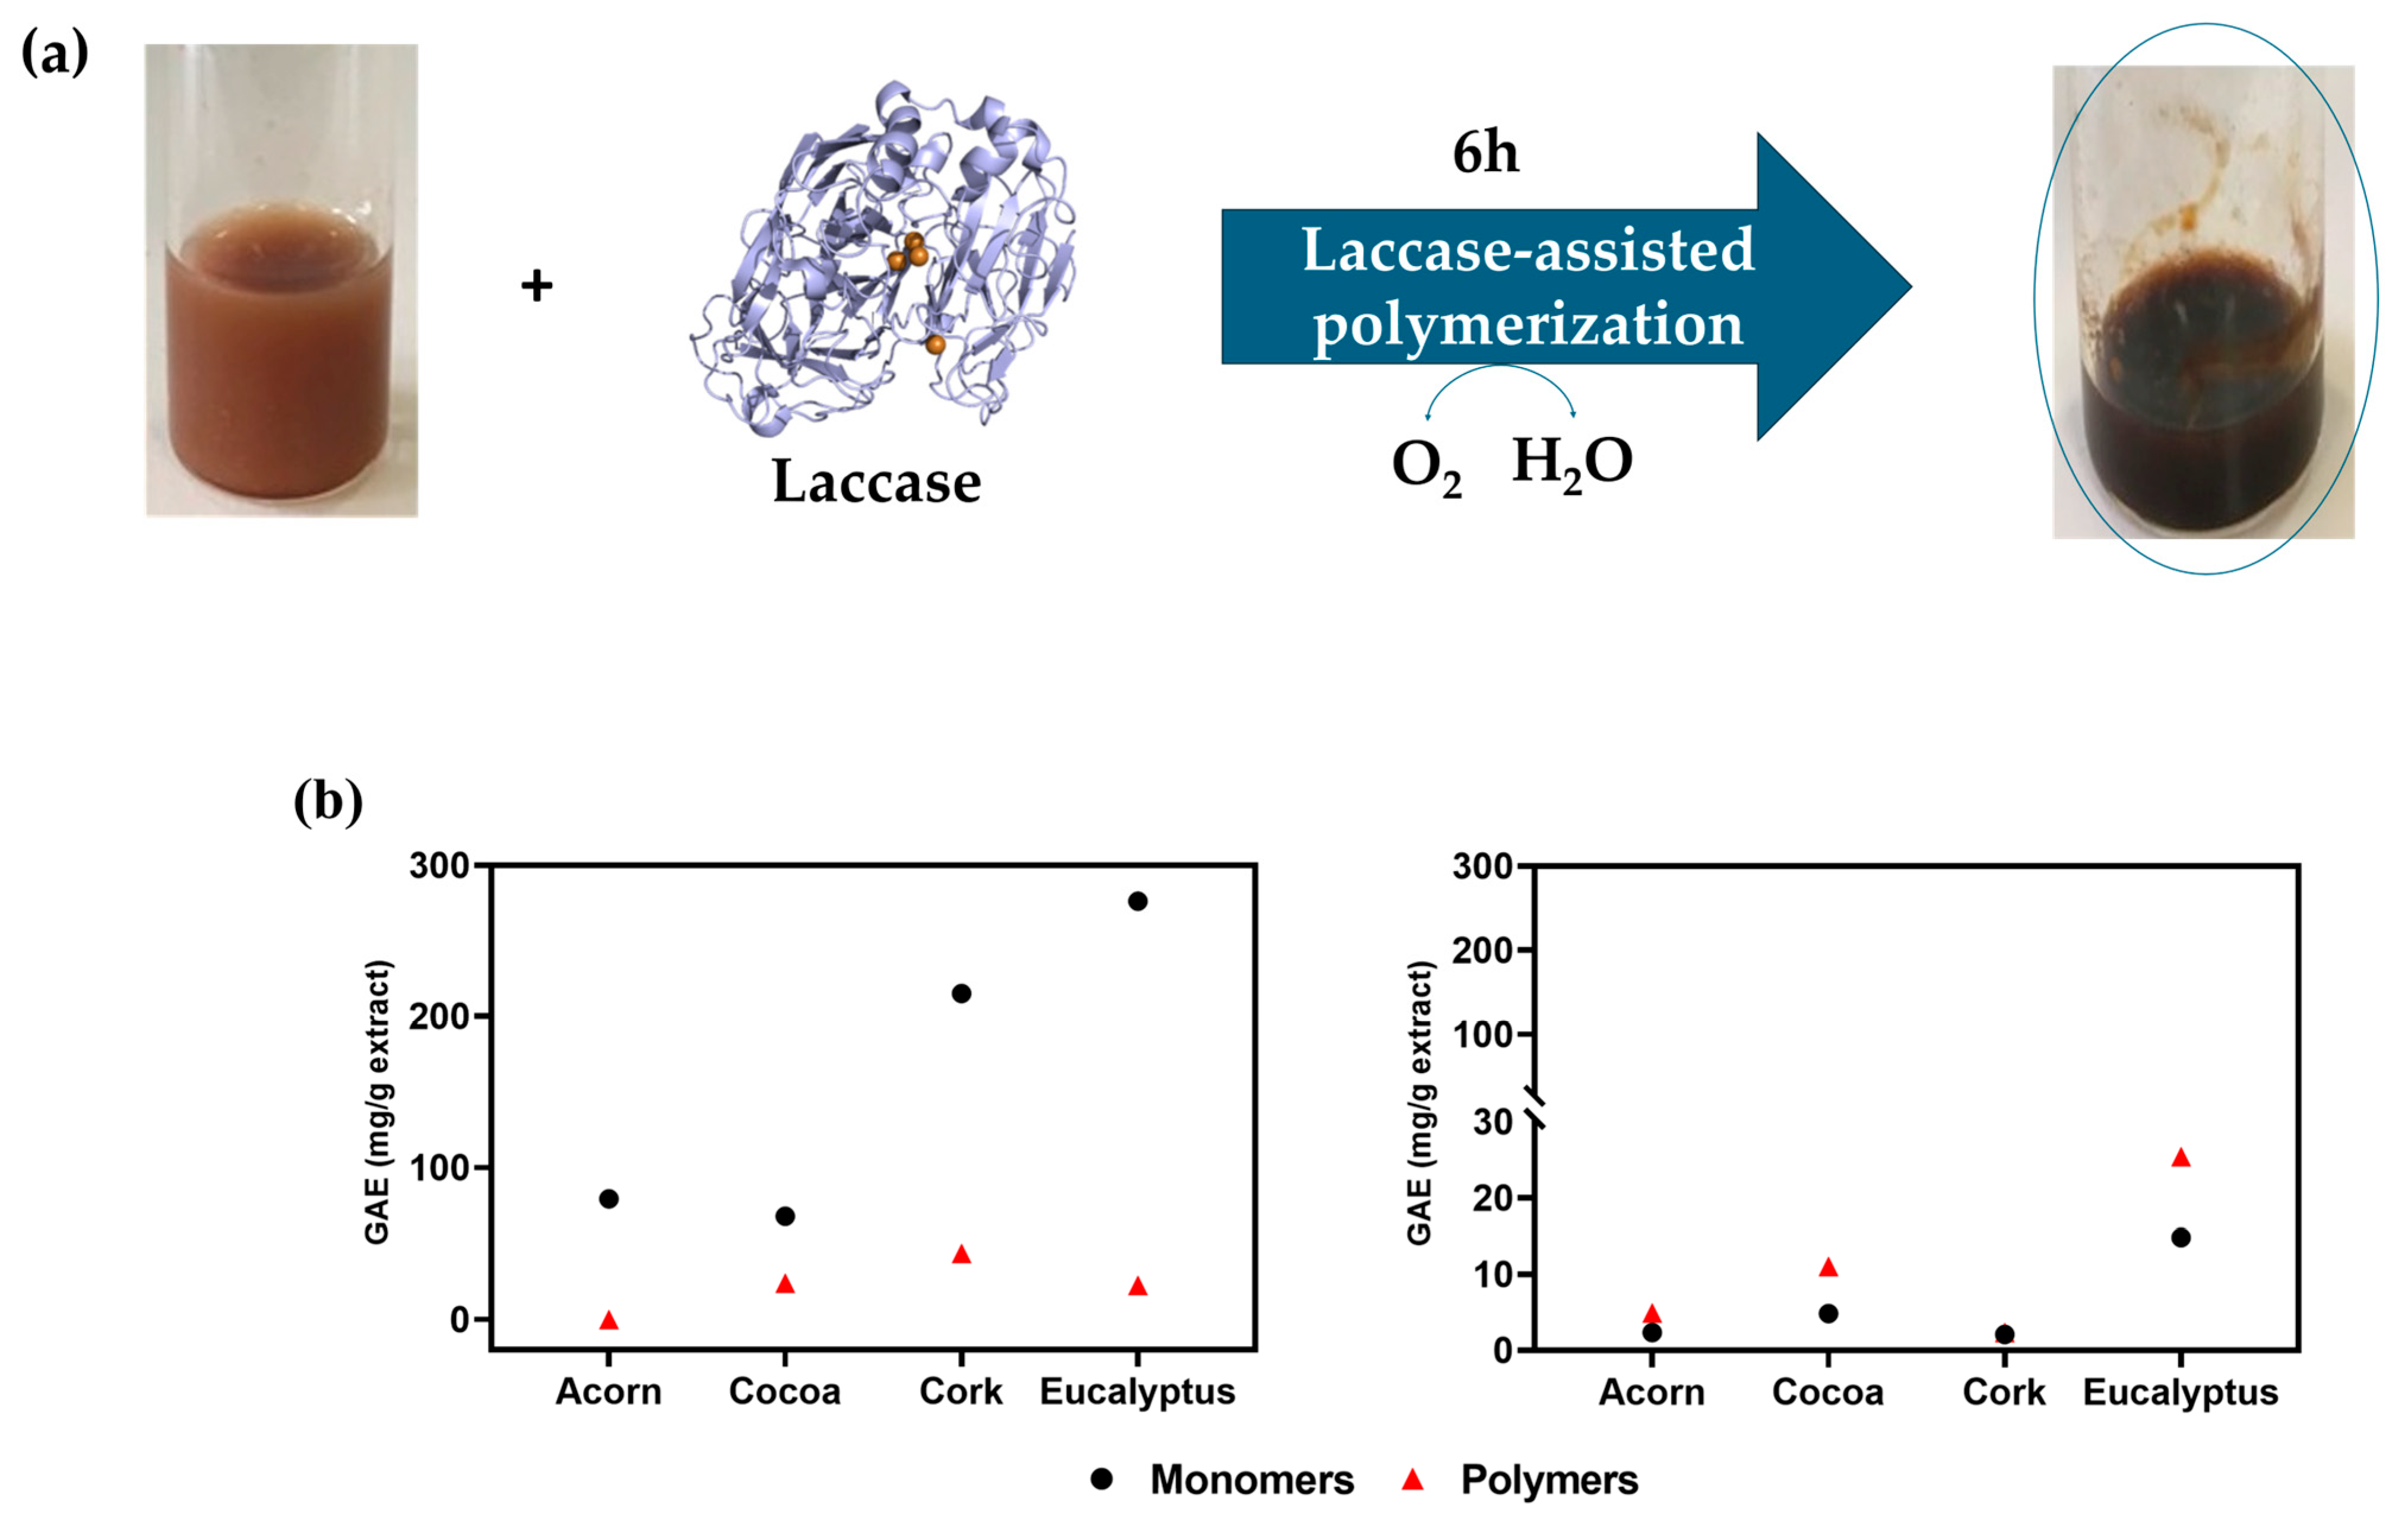
The enzymatic polymerization of phenolic compounds using laccase is a promising approach for modifying natural extracts, enabling the formation of complex polymeric structures with enhanced bioactivity and stability. As illustrated in
Figure 4a, laccase catalyzes the oxidation of phenolic monomers in the presence of molecular O
2, producing water (H
2O) as a byproduct. This oxidative process facilitates the formation of polymers primarily through ether linkages (C-O bonds) at the
para position of the phenolic monomers. The
para position is generally favored over the
ortho position due to lower steric hindrance and higher reactivity, which promotes the formation of stable polymeric networks [
24,
25,
45,
46].
The progress of the polymerization reaction can be monitored by quantifying the reduction in free hydroxyl groups (OH) in the resulting oligomers or polymers, compared to the control (monomers). This decrease serves as a strong indicator of successful polymerization, confirming the formation of larger polymeric structures. The free OH content can be assessed using the Folin–Ciocalteu assay, which measures the TPC. A reduction in TPC after laccase treatment indicates that phenolic monomers have been consumed to form polymeric structures. In this regard, the efficiency of laccase-mediated polymerization was evaluated by measuring the TPC of the extracts before and after laccase oxidation, as shown in
Figure 4b. For HE extracts, a significant decrease in TPC was observed after laccase oxidation, confirming the successful polymerization of phenolic compounds. These results align with the UV-visible spectroscopy data (
Figure S18), where an increase in absorbance due to the formation of colored species during the reaction, indicates the formation of oligo/polymeric structures, as also evidenced by the intensified coloration of the solutions (
Figure 4a). The UV spectra revealed a peak at around 280 nm, characteristic of phenolic hydroxyl groups, and a broad rise between300–500 nm, suggesting the formation of new products with extended π-conjugated structures, such as oligomers and polymers.
In contrast, NADES extracts exhibited different trends, where an increase relative to the control group (monomers) in the TPC was observed (
Figure 4b). This apparent inconsistency can be attributed to the poor solubility of high molecular-weight polymeric structures. Laccase-catalyzed polymerization often results in the formation of insoluble aggregates, which can interfere with the Folin–Ciocalteu assay, leading to higher TPC readings despite successful polymerization. This phenomenon was particularly evident in the eucalyptus extract, which exhibited the highest TPC value after oxidation. Nevertheless, the UV spectra (
Figure S18) of the NADES-extracted polymers showed a clear increase in absorbance, which contradicts the TPC results. Further elucidation of these new products and confirmation of the generation of new high-molecular-weight compounds will be given in the next section (MALDI-TOF mass spectra analysis).
In summary, the reduction in TPC observed for HE extracts, combined with the increase in absorbance in the UV-visible spectra and the visible color change, confirms the successful polymerization of phenolic compounds mediated by laccase. While NADES extracts showed higher TPC values after oxidation, this can be explained by the formation of insoluble polymeric aggregates that interfere with the Folin–Ciocalteu assay. However, these results do not imply that polymerization did not occur. A more detailed analysis of the efficiency of oligo/polymerization will be presented in the MALDI-TOF mass spectrometry section.
2.5.2. Polymerization Products—Evaluated by MALDI-TOF Mass Spectra
The MALDI-TOF mass spectra of acorn, cocoa, cork, and eucalyptus extracts, obtained using both HE and NADES extraction methods, were analyzed to confirm the formation of oligomers and polymers after laccase-assisted polymerization. The spectra revealed distinct patterns depending on the extraction method and the natural source (
Figures S19–S26), providing insights into the molecular weight distribution and polymerization efficiency. The results are summarized in
Table 1, which includes the number-average and weight-average molecular weights (M
n and M
w), dispersity (
D), and maximum and average degree of polymerization (DP
max and DP
avg) calculated from MALDI-TOF analysis. It is important to note that these parameters were only calculated for samples exhibiting a clear polymerization pattern in the MALDI-TOF spectra.
For acorn extracts, the HE-extracted samples showed evidence of oligomer formation, with the MALDI-TOF spectra (
Figure S19) revealing peaks corresponding to the progressive addition of gallic acid units (
Table S5). Additionally, the data in
Table 1 suggest that the acorn HE extract has formed relatively modest oligomers, with an average chain length of about six monomers (DP
avg) and some chains reaching up to 12 monomers (DP
max). Although the DP
max is less commonly reported than the DP
avg, it provides additional insights into the upper limit of chain growth under the tested conditions. In addition, the low
D value observed in
Table 1 further indicates a relatively uniform size distribution. In contrast, the NADES-extracted samples (
Figure S20) did not show clear evidence of polymerization, which contrasts with the UV-visible results (
Figure S18). This discrepancy may be due to the formation of low molecular weight oligomers that are not easily detected by MALDI-TOF or structural modifications that increase UV absorbance without significant changes in molecular weight.
In the case of cocoa extracts, the HE-extracted samples revealed the formation of trimers of catechin/epicatechin or quercetin (
Figure S21 and Table S6), while the NADES-extracted samples, although did not exhibit a clear polymerization pattern in the MALDI-TOF spectra, showed a more complex profile with the formation of trimers and tetramers of catechin/epicatechin, suggesting a higher degree of polymerization (
Figure S22 and Table S7).
For cork extracts, the HE-extracted samples indicated the formation of dimers and trimers of quercetin, or trimers and hexamers of protocatechuic acid (
Figure S23 and Table S8), while the NADES-extracted samples showed a more extensive oligomerization of protocatechuic acid (
Figure S24 and Table S9). The controlled polymerization observed in the NADES-extracted samples, presented in
Table 1, suggests the formation of uniform oligomers with a DP
avg and DP
max value of 4 and 8, respectively, reflecting a moderate degree of the polymerization process, which could be beneficial for applications that require a more specific and consistent molecular weight.
Finally, for the eucalyptus extracts, although gallic acid was not one of the main bioactive compounds found in the LC-MS analysis (
Table S4), the polymerization patterns are consistent with the formation of oligomers of this compound. The HE-extracted samples showed evidence of tetramer formation (
Figure S25 and Table S10) while the NADES-extracted samples revealed more extensive oligomerization (
Figure S26 and Table S11), with low
D values indicating a narrow distribution of polymer sizes. The DP
max of 10 confirms the formation of some higher-order oligomers, although most species remain smaller, with an average of 4 monomeric units. This suggests controlled oligomerization, with limited chain length variability.
In summary, the MALDI-TOF analysis confirmed the successful polymerization of bioactive compounds in all extracts, with NADES generally promoting more extensive oligomerization compared to HE. The presence of the eutectic solvent in the reaction medium appears to enhance oxidation efficiency by laccase, with the formation of polymerization patterns being more readily observed in NADES extracts. Although few studies have explored this subject, it has been reported in the literature. Freitas et al. [
47] conducted research where eutectic solvents (Citric acid, oxalic acid, DL-lactic acid, glucose, glycerol, ethylene glycol, and sodium DL-lactate) were investigated as solvents for the laccase-assisted polymerization of catechol and phenolics from coffee. They verified that with the presence of NADES (10% (
w/
w)) solutions in acetate buffer, the conformational structure of the enzyme remained practically unchanged in the presence of all the eutectics tested. Additionally, the catalytic efficiency of laccase in the presence of a NADES composed of glycerol and lactic acid (as reported in this study) at 20 °C was the highest among all solvents, including the buffer. Also, the glycerol:lactic acid eutectic mixture promoted the highest degrees of polymerization compared to all solvents and buffers, meaning that more monomers were connected, and more polymeric chains were formed. This higher efficiency may be due to the great solubility of phenolic compounds and other substrates in NADES compared to water or buffer, where these compounds tend to have limited solubility. Studies on NADES composed of glycerol and lactic acid have shown high conductivity values, which may enhance the availability of electrons around the copper atoms in laccase, thereby increasing the efficiency of oxidation reactions that are crucial for polymerization [
47]. All these factors together create a more favorable environment for laccase activity, leading to a more efficient polymerization of bioactives. In this study, the laccase-assisted polymerization reaction media containing NADES-based extracts had a concentration of 9.1% (
w/
w) in buffer, which is close to the 10% (
w/
w) threshold. This suggests that the solvent may contribute to the higher efficiency of polymerization in the eutectic extracts. Furthermore, the incorporation of the eutectic extracts within the solvent may have increased the availability of bioactives, facilitating their polymerization by laccase. Nevertheless, despite the enhanced oligomerization patterns observed in NADES in comparison with the respective HE extracts, the highest DP values (both DP
avg and DP
max) were found in the HE extract of acorn, indicating that while NADES extracts promote more frequent polymerization patterns, HE may yield higher degrees of polymerization under the tested conditions.
The MALDI-TOF analysis, combined with the data presented in
Table 1, confirms the successful polymerization of bioactive compounds in all extracts (except the acorn NADES extract), where a clear polymerization pattern was observed for some compounds. NADES generally promoted more extensive and controlled oligomerization compared to HE, as evidenced by the formation of uniform oligomers with narrow molecular weight distributions, which is a good indication, as previous studies reported that the degree of π-conjugations plays a crucial role in the bioactivity of these compounds after polymerization. For extracts where polymerization patterns were not clearly detectable by MALDI-TOF, other analytical techniques, such as UV-visible spectroscopy, provided complementary evidence of polymerization. These findings highlight the potential of laccase-assisted polymerization to enhance the biological activity of natural extracts for applications in skin care and TYR modulation.
2.6. TYR from Mushroom–Extraction and Purification
Among the various sources of TYR, those from
Streptomyces glaucescens, the fungus
Neurospora crassa, and
Agaricus bisporus are the most extensively studied [
48]. Therefore, in this study, TYR was extracted and purified from
Agaricus bisporus, a natural and renewable source, rather than using a commercially available enzyme. This approach reduces the environmental footprint associated with enzyme production and leverages the inherent biocompatibility and bioactivity of naturally derived enzymes. The use of
Agaricus bisporus is particularly advantageous due to its widespread availability, high enzyme content, and structural similarity to human TYR, making it an ideal candidate for sustainable enzyme extraction [
14].
The purification process, which included precipitation, dialysis, and lyophilization, yielded 2.670 g of purified enzyme from 200 mL of crude extract, with an activity of 37 U and a specific activity of 18.500 U/mg of solid (
Table 2).
The enzymatic activity was determined by monitoring L-DOPA oxidation to dopachrome, measured spectrophotometrically at 475 nm, and a strong linear correlation (R
2 = 0.974 in
Figure S27) between absorbance and time, confirming TYR activity. Although the specific activity of TYR obtained in this work is lower than that of commercial products, such as those from Sigma–Aldrich™, which typically list activities around 1000 U/mg solid, this difference is expected, as commercial enzymes are highly purified, while our semi-purified extract contains non-enzymatic materials that reduce specific activity. Nevertheless, compared to literature values, our TYR extraction yielded a total activity of 37 U, significantly higher than the 8.25 U reported by Zaidi et al. [
49] for
Agaricus bisporus. This difference may be attributed to variations in mushroom growth conditions and the lyophilization process used in this study, which concentrates the enzyme. Moreover, the higher activity observed highlights the effectiveness of our extraction and purification protocol.
In summary, the extracted TYR exhibited stability and high activity, providing a reliable and cost-effective alternative to commercial preparations for screening TYR activity modulators. All subsequent assays were conducted using this extracted enzyme.
2.7. Mushroom TYR Inhibition Activity
Inhibiting TYR activity is a well-established strategy for managing hyperpigmentation conditions [
3,
14,
35,
36,
44], with natural extracts emerging as promising candidates due to their biocompatibility and multifunctional properties. In this study, the inhibitory effects of HE and NADES extracts from acorn, cocoa, cork, and eucalyptus, as well as their laccase-oxidized products, were evaluated to assess their potential as TYR inhibitors.
The inhibition profiles of the extracts were assessed at increasing concentrations, ranging from 0.003125 to 0.400 mg/mL (10-fold higher for NADES extracts). As shown in
Figure 5, the inhibition profiles varied significantly between the natural sources and their oxidized forms, with KA, the positive control, exhibiting the highest inhibitory capacity, consistent with its well-established role as a TYR inhibitor. Additionally, all the extracts, including both monomeric and polymeric forms, and the extraction solvent, inhibited the TYR’s catalytic activity in a dose-dependent manner, with the highest inhibition obtained at the highest concentration.
Cocoa extracts, rich in flavonoids such as catechin and epicatechin, demonstrated the highest inhibitory potential, both in their monomeric and oxidized forms, and for both extraction solvents. The laccase-oxidized products of cocoa showed a significant improvement in TYR inhibition, particularly in NADES extracts, where a 2.58-fold increase was observed compared to the monomeric form. This enhancement is likely due to the strengthened copper ion chelation of the bioactives at the TYR active site, facilitated by the increased molecular complexity of the oxidized products [
50]. The positive role of the eutectic solvent in the laccase reaction media further supported extensive oligomerization, as evidenced by the MALDI-TOF analysis (
Figure S22).
Interestingly, despite the higher antioxidant activities observed in eucalyptus and cork extracts, these properties did not directly correlate with stronger TYR catalytic inhibition. This suggests that the mechanism of action of these extracts may involve factors beyond antioxidant activity, such as direct interaction with the enzyme’s active site or modulation of melanogenesis signaling pathways. Further studies are needed to explore these potential mechanisms and their implications for intracellular TYR activity and melanin synthesis.
The inhibition profiles also highlight the influence of the extraction solvent on TYR inhibition. While HE extracts generally showed higher inhibitory activity at lower concentrations, NADES extracts required higher concentrations to achieve similar effects, likely due to the presence of the eutectic solvent. However, the laccase-oxidized products of NADES extracts still demonstrated significant improvements in TYR inhibition, particularly for cocoa, where the oxidized form achieved approximately 47% inhibition (at 4 mg/mL).
In summary, these findings highlight the potential of laccase-oxidized natural extracts, particularly cocoa, as effective TYR inhibitors. The enhanced inhibitory capacity of the oxidized products, resulting from increased molecular complexity and improved binding affinity, underscores their therapeutic and cosmetic relevance in addressing pigmentation disorders. The ability of these compounds to inhibit TYR activity more effectively suggests their potential as eco-friendly alternatives to conventional whitening agents in cosmetic formulations that may have limited interaction with the enzyme or cause adverse side effects like the gold-standard inhibitors. Future studies should focus on understanding the intracellular effects of these compounds on TYR activity and melanogenesis pathways, as well as optimizing the extraction and oxidation processes to further improve their efficacy.
3. Materials and Methods
3.1. Materials and Chemicals
The eucalyptus (Corymbia citriodora) leaves were purchased from Cantinho das Aromáticas, Portugal; cork (Quercus suber L.) was supplied by Cork Supply Portugal, S.A.; cocoa (Theobroma cacao) roasted beans were purchased from Chocolataria Ecuador, Portugal; Landratech supplied acorn (Quercus spp.). Agaricus bisporus mushrooms were purchased from the local supermarket in Portugal.
Folin–Ciocalteu reagent, gallic acid, quercetin (98%), sodium hydroxide (98%), sodium nitrate (97%), DPPH (2,2-diphenyl-1-picrylhydrazyl), trolox (6-hydroxy-2,5,7,8-tetramethylchroman-2-carboxylic acid) (97%), potassium persulphate (99.99%), ferric chloride (97%), sodium phosphate monobasic, potassium phosphate monobasic and dibasic (99%), L-DOPA, kojic acid, and potassium chloride (99.9%) were purchased from Sigma–Aldrich, Schnelldorf, Germany. Ethanol (99.8%), DMSO (dimethylsulfoxide), ABTS (2,2′-azino-bis(3-ethylbenzothiazoline-6 sulfonic acid)) (98%), TPTZ (2,4,6-Tripyridyl-s-triazine), hydrochloric acid, sodium phosphate dibasic, and sodium chloride were purchased from Fisher Scientific, Waltham, MA, USA. DL-lactic acid (80%) and sodium carbonate were purchased from LabKem, Barcelona, Spain and Riedel-de Haën, Hanover, Germany, respectively. Sodium acetate, acetic acid, and ammonium sulfate were purchased from Panreac Quimica SA, Barcelona, Spain. Laccase from the ascomycete Myceliophthora thermophila was supplied by Novoenzymes, Bagsværd, Denmark.
3.2. Preparation of the Solvents
Two extraction solvents were used in this work, hydroethanolic (HE) and NADES. First, the HE mixture was prepared in a ratio of 50:50 (v/v) with water and ethanol (EtOH) (99.8%)—(H2O:EtOH). The NADES was prepared using glycerol:lactic acid in a ratio of 4:1 (v/v) by mixing these components with continuous stirring at 100 °C until a clear solution was achieved.
3.3. Preparation of Plant Extracts
The extraction of bioactive compounds from acorn, cocoa, cork, and eucalyptus was accomplished using two extraction solvents, HE and NADES. Before extraction, cocoa and eucalyptus were ground until a fine powder was obtained. The extraction conditions, including temperature and time of extraction, were previously optimized to ensure the highest yield of bioactive compounds. The ratio of plant powder/solvent for both solvents was 10 g/75 mL for eucalyptus, acorn, and cocoa, and 10 g/150 mL for cork because of its lightweight, requiring a larger volume of solvent. Both extraction methods were carried out for 90 min using a mechanical impeller (Heidolph, Schwabach, Germany) at room temperature for HE extraction, while the extraction with NADES was performed at 70 °C.
After extraction, the resulting products were filtered through a vacuum filtration system (300 mbar) using a 100% cotton fabric. For the HE extracts, the filtrated liquid was transferred to a rotary evaporator (Heidolph) at 45 °C and 75 rpm to evaporate the remaining ethanol. After this process, both HE and NADES extracts were subjected to lyophilization to remove the water and stored for characterization. The resulting solids from the extraction filtration were collected, dried in the oven, and weighed to calculate the extraction yields (%,
w/
w) using Equation (1).
where w
1 is the initial weight of the samples in grams and w
2 is the weight of the remaining solid of the filtration in grams.
3.4. Determination of Total Phenolic Content (TPC) and Flavonoid Content (TFC)
The TPC of the extract samples before and after laccase oxidation was determined using the Folin–Ciocalteu method, previously described by Singleton and Rossi [
51]. First, the extracts were dissolved in pure DMSO until 1 mg/mL concentrations were achieved for the products obtained using HE solvent, and 100 mg/mL for NADES extracts. In a 96-well microplate, 2 µL of each sample was mixed with 10 µL of Folin–Ciocalteu reagent and 120 µL of distilled water. The mixture was vortexed, and 40 µL of 15% sodium carbonate (Na
2CO
3) and 28 µL of distilled water were added. The microplate was kept in the dark for 2 h at room temperature, following absorbance measurement at 750 nm (BioTek Synergy H1 microplate reader, Agilent, Winooski, VT, USA), taking DMSO as a blank. For quantification, a gallic acid calibration curve was prepared with the following concentrations: 0.0015, 0.015, 0.45, 0.9, 1.5, 2.5, and 5 mg/mL. The results were expressed as milligrams of gallic acid equivalents (GAE) per gram of dry weight sample (mg/g) using Equation (2). All determinations were performed in duplicate in two independent assays.
The TFC of the extracts before and after laccase oxidation was assessed as previously described by Zhishen et al. [
52] using the aluminum chloride assay. Firstly, the extracts were dissolved in pure DMSO to obtain 1 mg/mL concentrations for HE extraction and 100 mg/mL for NADES extracts. In a 96-well microplate, 17.5 µL of sample was mixed with 140 µL of distilled water and 5.25 µL of 10% sodium nitrite (NaNO
2). After 5 min, 5.25 µL of 20% aluminum chloride (AlCl
3), 70 µL of 1 M sodium hydroxide (NaOH), and 112 µL of distilled water were added to the mixture. The absorbance of the samples was measured at 510 nm at room temperature, taking DMSO as a blank. A calibration curve was performed using quercetin with the following concentrations: 0.1, 0.5, 1, 2, 3, 4, 6, 8, and 10 mg/mL. All determinations were performed in triplicate for two independent assays. The results were expressed as milligrams of quercetin equivalents (QE) per gram of dry weight sample (mg/g) using Equation (2).
where C
1 is the concentration of the extract interpolated from the calibration curve in mg/mL; V is the volume of the sample extract in mL; and m is the mass of the plant sample extract in grams.
3.5. Antioxidant Activity
3.5.1. 1,1-Diphenyl-2-picrylhydrazyl (DPPH) Radical Scavenging Assay
The assessment of the antioxidant activity by the DPPH-free radical scavenging assay followed the method described by Brand–Williams et al. [
53], with some modifications. First, the DPPH solution (200 µM, 99.8% ethanol) was prepared daily and stored at 4 °C, protected from light when not used between analyses. Both HE and NADES samples were dissolved in a solution of H
2O: EtOH mixed in a ratio of 50:50 (
v/
v) to achieve the following concentrations: 0.005, 0.01, 0.05, 0.1, 0.15, 0.2, and 0.5 mg/mL. For the NADES extracts, these concentrations were 10 times higher. In a 96-well microplate, 10 µL of extract sample from each concentration was mixed with 140 µL of DPPH solution, and, immediately after, the absorbance was monitored continuously for 1 h at 515 nm (BioTek Synergy H1 microplate reader), ensuring the reaction was complete at room temperature. Trolox was used as a standard to perform a calibration curve of DPPH reduction with the same concentrations used for the extracted samples and as a reference for comparison of the extracts’ antioxidant capacities. All determinations were performed in triplicate in two independent assays. Equation (3) was used to determine the percentage of reduced DPPH. The EC
50 was obtained from the DPPH reduced curves, representing the concentration of an extract required to reduce the concentration of the DPPH radical by 50%. The antioxidant capacity of the samples was expressed in terms of Trolox equivalents (TE) per g of dry weight sample (mg Trolox/g extract) using Equation (4).
3.5.2. 2,2′-Azino-bis-3-ethylbenzothiazoline-6-sulfonic Acid (ABTS) Assay
The performance of the ABTS assay followed the method described by Re et al. [
54] with some modifications. Firstly, the ABTS radical solution was prepared by mixing 5 mL of 7.4 mM ABTS solution with 88 µL of 2.6 mM potassium persulfate (K
2S
2O
8) solution, allowing a reaction time of 16 h at room temperature in the dark. If necessary, to reach an absorbance of 0.700 ± 0.100 at 734 nm, the ABTS radical solution was diluted with 99.8% EtOH. The HE and NADES extracts were dissolved in H
2O:EtOH in a ratio of 50:50 to achieve the following concentrations: 0.0005, 0.002, 0.01, 0.03, 0.125, and 0.5 mg/mL. The concentrations of the NADES samples were 10 times higher. In a 96-well microplate, 10 µL of sample was mixed with 140 µL of ABTS radical solution. The microplate was kept in the dark for 6 min at room temperature, following the measurement of the absorbance at 734 nm (BioTek Synergy H1 microplate reader), taking H
2O:EtOH (50:50) as a blank. Trolox was used as a standard antioxidant. All determinations were performed in triplicate in two independent assays. Through Equation (5), the percentage of antioxidant activity (AA%) was calculated. The EC
50 of the samples was obtained from the antioxidant activity curves, representing the concentration of an extract required to reduce the concentration of the ABTS radical solution by 50%. The results were expressed in terms of TE using Equation (4). All determinations were performed in triplicate in two independent assays.
3.5.3. Ferric Reducing Antioxidant Power (FRAP) Assay
For the evaluation of the antioxidant activity by FRAP assay, the method described by [
55] was followed with some modifications. The FRAP reagent was prepared by mixing 300 mM acetate buffer (pH 3.6) with 10 mM TPTZ solution in 40 mM hydrochloric acid and 20 mM ferric chloride (FeCl
3) solution in a 10:1:1 (
v/
v/
v) ratio. The HE and NADES extracts after extraction were dissolved in H
2O:EtOH in a ratio of 50:50 to achieve the following concentrations: 0.005, 0.01, 0.05, 0.1, 0.15, 0.2, and 0.5 mg/mL. Once again, for the NADES samples, these concentrations were ten times higher. In a 96-well microplate, 5 µL of the extracted sample was mixed with 145 µL of FRAP reagent. The microplate was then incubated for 10 min at 37 °C with constant agitation, following the measurement of the absorbance at 593 nm (BioTek Synergy H1 microplate reader), taking H
2O:EtOH (50:50) as a blank. Trolox was used as a standard antioxidant. All determinations were performed in triplicate in two independent assays. Using Equation (6), the percentage of antioxidant activity (AA%) was calculated. The EC
50 of the samples was obtained from the antioxidant activity curves, representing the concentration of a sample required to reduce the concentration of Fe
3+-TPTZ complex by 50%. The results were expressed in terms of Trolox equivalents using Equation (4).
3.6. Identification of Bioactive Molecules on the Extracts—Liquid Chromatography-Mass Spectrometry (LC-MS) Analysis
Detection and identification of the bioactives present in the acorn, cocoa, cork, and eucalyptus extracts were performed using a Thermo Scientific™ Vanquish™ Flex UHPLC system coupled to a Thermo Scientific™ Orbitrap Exploris™ 120 high-resolution accurate mass spectrometer (Thermo Fisher Scientific, Bremen, Germany). The instrument control and data processing were carried out by Xcalibur 4.5 software (Thermo Fisher Scientific). The UHPLC column* utilized was a YMC-Triart C18 column (150 × 2.1 mm i.d., 3 μm particle size) protected with a guard column of the same material (2.1 mm i.d.). The mobile phases consisted of A (water with 0.1% formic acid) and B (acetonitrile with 0.1% formic acid). The flow rate was 0.35 mL/min using the following linear gradient scheme (t in min; % A): 0 min, 95%; 5.4 min, 85%; 7.9 min, 80%; 9 min, 80%; 12.6 min, 70%; 16.2 min, 50%; 18 min, 5%; 19.8 min, 95%; and 22 min, 95%. The total run time was 27 min. The column temperature was 30 °C, the autosampler temperature was set at 15 °C, and the injection volume was 10 μL. The ion source (Thermo Scientific™ OptaMax™ NG ion source) was equipped with a heated electrospray ionization (HESI) probe. The external mass calibration of the Q-Orbitrap was performed once a week to ensure a working mass accuracy of <3 ppm. The Orbitrap Exploris 120 mass spectrometer was equipped with an HESI source. The optimized HESI temperature was set at 325 °C, the capillary temperature at 350 °C, and the electrospray voltage at 3.5 kV and 2.5 kV for positive and negative modes, respectively. Sheath and auxiliary gas were 50 and 10, respectively. All qualitative data in this study were acquired using SIM mode. In SIM mode, it is set up to selectively detect and capture particular ions instead of scanning the complete range of masses.
3.7. Laccase-Assisted Polymerization of the Extracts
The acorn, cocoa, cork, and eucalyptus extracts obtained by HE and NADES extraction were polymerized by laccase from the ascomycete Myceliophthora thermophila. For that, the extracts were dissolved in sodium acetate buffer 50 mM (pH 5) to obtain a concentration of 10 mg/mL for HE extracts and 100 mg/mL for NADES extracts. To start, a 20 mL extract sample diluted in buffer was subjected to enzymatic polymerization with an enzyme concentration of 100 U/mL. The incubation took place in open vessels to facilitate the entrance of oxygen in a water bath at 50 °C for 6 h, under continuous stirring (100 rpm). The solutions were then cooled in a refrigerator for 24 h at a temperature of 4 °C. A control group of samples was also prepared under identical conditions but without adding laccase for comparative purposes. The polymerization process was followed by UV-visible spectroscopy. Subsequently, after oxidation, the solutions were centrifuged at 9000 rpm for 1 h at 4 °C (Thermo Scientific Heraeus Multifuge X3R, Lisboa, Portugal). The isolated products were then carefully removed, and any non-polymerized compounds were washed out using distilled water and lyophilized for future characterization.
3.7.1. UV-Visible Spectroscopy
The UV-visible spectroscopy measurements were conducted using a microplate reader (BioTek Synergy H1 microplate reader), and the spectra of the extract samples and respective controls (without laccase) after 6 h of oxidation were read from 230 nm to 700 nm, using a 96-well quartz microplate with a path length of 10 nm.
3.7.2. MALDI-TOF Mass Spectra
MALDI-TOF mass spectra were performed using a Bruker Autoflex Speed instrument (Bruker Daltonics GmbH, Bremen, Germany) equipped with a 1 kHz solid-state smartbeam laser. The samples were analyzed using 2,5-dihydroxybenzoic acid and α-Cyano-4-hydroxycinnamic acid as the matrix (≥99.5%) and analyzed in the linear negative mode. The number-average molecular weight (M
n), weight-average molecular weight (M
w), dispersity (
D), and average and maximum degrees of polymerization (DP
avg and DP
max) were calculated using Equation (7)
where n
i is the relative abundance of each peak; M
i is the
m/
z corresponding to each peak;
D is the dispersity; M is the molecular weight of the monomer; and M
max is the maximum molecular weight of the polymer.
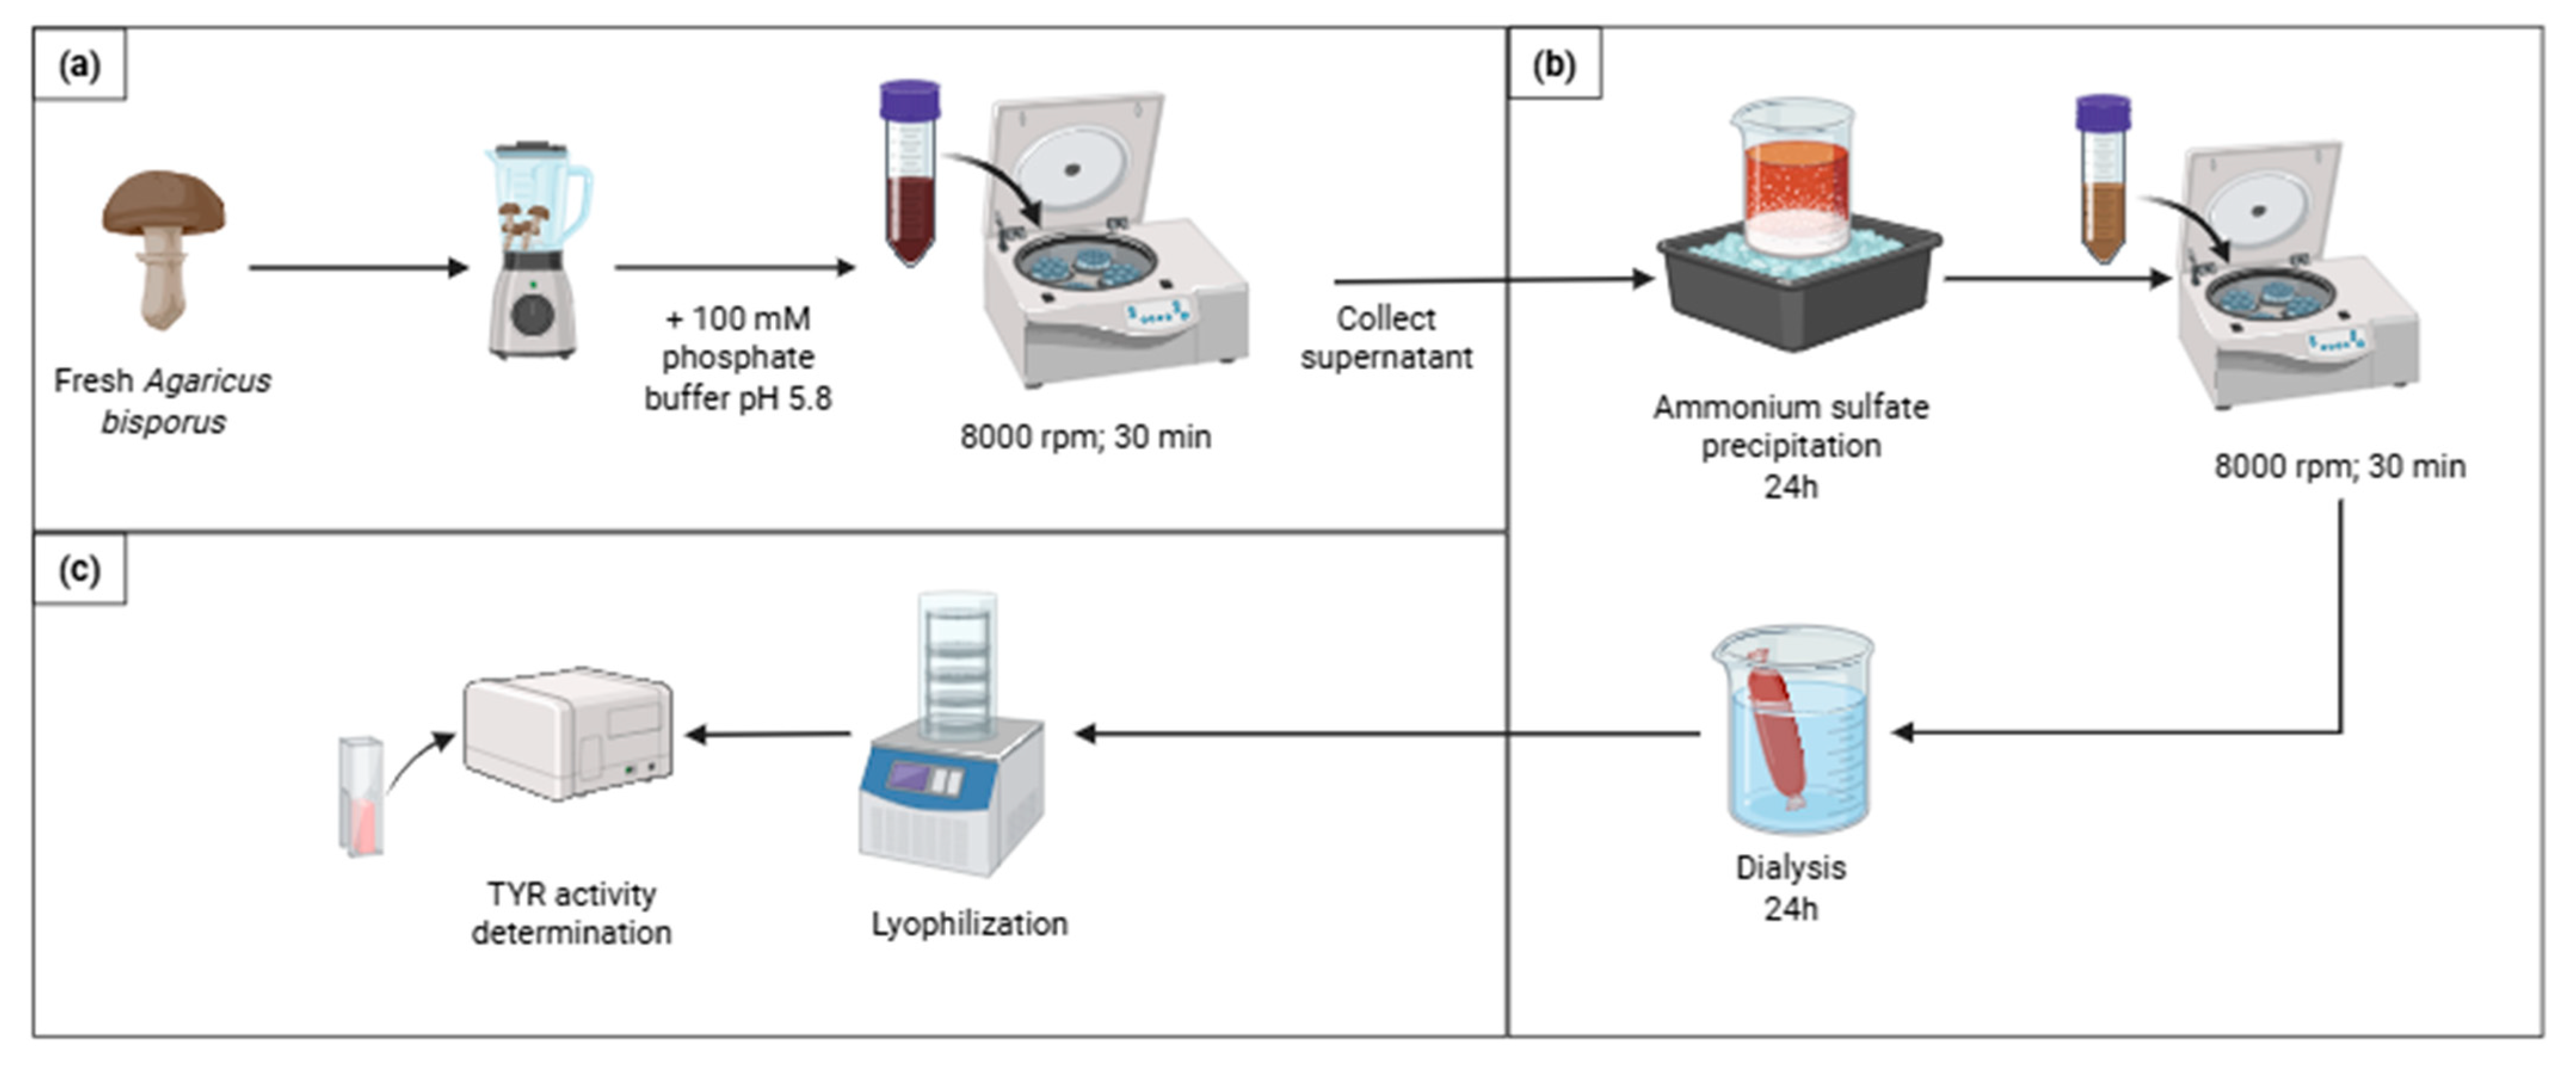
3.8. Mushroom TYR Extraction and Purification
To extract the TYR enzyme from
Agaricus bisporus mushrooms, the method described by Zaidi et al. [
49] was conducted with brief modifications (
Figure 6a). First, the mushrooms were carefully cut into small pieces and then homogenized in a grinder to obtain a uniform mixture. Subsequently, a cold 100 mM phosphate buffer (pH 5.8) was added to the mushroom mixture in a quantity of 500 mL for every 300 g of fresh mushrooms to facilitate the extraction process. The homogenized mushroom mixture was then subjected to centrifugation (Thermo Scientific Heraeus Multifuge X3R, Lisboa, Portugal ) at 8000 rpm for 30 min at 4 °C, and the supernatant containing the extracted enzyme was carefully collected. The remaining insoluble pellet was again resuspended in cold phosphate buffer and left to rest at 4 °C with occasional shaking overnight. The suspension was then centrifuged again, and the supernatant was collected, thereby completing the extraction process. For the purification of the crude mushroom extract, the method described by Zaidi et al. [
49], was conducted with brief modifications (
Figure 6b). To initiate, in an ice bath, 140 g of ammonium sulfate was slowly added for every 200 mL of mushroom extract (70% saturation) with continuous stirring to ensure complete solubility and left for precipitation overnight. Following this, the sample was subjected to centrifugation at 8000 rpm for 30 min at 4 °C (Thermo Scientific Heraeus Multifuge X3R centrifuge, Lisboa, Portugal), and the supernatant was discarded, resuspending the precipitated material in potassium phosphate buffer 100 mM (pH 7).
To remove the salt and undesired compounds, the resuspended precipitate was dialyzed for 24 h against 100 mM potassium phosphate buffer (pH 7), maintaining a constant temperature of 4 °C, as highlighted by Zaidi et al. [
49], changing the buffer thrice (
Figure 6b). The dialyzed fraction was lyophilized and stored at 4 °C between assays.
In Vitro L-DOPA Activity Assay
To assess the activity of the extracted TYR, an assay reported by Lopez-Tejedor et al. [
56] was performed (
Figure 6c). Initially, a 2 mL solution of 1 mM L-DOPA was prepared in 0.1 M phosphate buffer (pH 7). Subsequently, 40 µL of the enzyme was added to the L-DOPA solution with the immediate measurement of its absorbance at 475 nm in glass cuvettes (pg instruments UV/visible spectrophotometer T65 single beam). The increase in absorbance was monitored from 10 to 70 s after the reaction initiation. One unit of enzyme activity (U) was defined as the amount of enzyme that caused a 0.001 increase in absorbance per minute at a temperature of 25 °C. The enzyme activity was calculated in terms of U/mL enzyme, using Equation (8). Since the enzyme was lyophilized, its activity in U/mg solid was also calculated using Equation (9).
3.9. Mushroom TYR Inhibition Assay
The inhibition/stimulation of the tyrosinase extracted from
Agaricus bisporus mushroom was tested in the presence of the bioactive compounds using the methodology described by [
57,
58,
59] with some modifications. The extracts before and after laccase oxidation were initially diluted in pure DMSO to achieve a stock concentration of 10 mg/mL. NADES-extracted samples were diluted to obtain ten times higher concentrations than the HE samples. Subsequently, the samples were diluted in potassium phosphate buffer 50 mM (pH 6.5) to achieve the following concentrations: 0.003125, 0.01, 0.05, 0.2, 0.3, and 0.4 mg/mL, ten times higher for NADES extracts. In a 96-well microplate, 70 µL of each sample and concentration was mixed with 30 µL of the TYR-extracted enzyme (333 U/mL in phosphate buffer) and allowed to interact for 10 min at 30 °C. Subsequently, 110 µL of L-DOPA solution (12 mM) was added to each well of the microplate and incubated for 30 min at 30 °C, following the measurement of absorbance at 30 °C at 492 nm (BioTek Synergy H1 microplate reader). A positive control using kojic acid was prepared under the same conditions. Negative control was also prepared by repeating all previous steps but without plant/oxidized extracts; instead, 70 µL of phosphate buffer was added. Blank solutions without the enzyme were also prepared for all the samples (plant/oxidized extracts, positive and negative controls). All determinations were performed in triplicate in two independent assays.
The percentage of tyrosinase inhibition was based on the difference between the sample and the negative control (sample without extract) using Equation (10).
where A is the absorbance of the negative control solution, B is the absorbance of the blank solution, C is the absorbance of the test sample, and D is the absorbance of the blank test sample solution.
3.10. Statistical Analysis
Data are expressed as mean ± standard deviation (SD). The EC50 of the samples’ antioxidant activity was determined using Microsoft Excel software through the performance of linear regressions. Statistical analysis was performed using GraphPad Prism software (9.5.1). For the TPC, TFC, DPPH, ABTS, and FRAP assays, a one-way ANOVA for each solvent extraction was conducted to assess group differences, followed by Tukey’s post-hoc test. Results were considered significant at p < 0.05.


 ,
, 


