Article

Active Ag-, Fe-, and AC-Modified TiO2 Mesoporous Photocatalysts for Anionic and Cationic Dye Degradation

1
Institute of Physical Chemistry-Ilie Murgulescu, Romanian Academy, 060021 Bucharest, Romania
2
National Institute for Lasers, Plasma and Radiation Physics, 077125 Magurele-Ilfov, Romania
*
Authors to whom correspondence should be addressed.
Catalysts 2025, 15(5), 479; https://doi.org/10.3390/catal15050479
Submission received: 28 March 2025 / Revised: 30 April 2025 / Accepted: 6 May 2025 / Published: 13 May 2025

Abstract

:
TiO2 mesoporous supports were obtained by the sol–gel method from different precursors (titaniumethoxide, isopropoxide, or butoxide) in the presence of nonionic, cationic, and anionic surfactants. Among these samples, those obtained from Ti isopropoxide, Brij58 w/o activated carbon (AC), were selected as supports. Photocatalysts were obtained by modifying these supports with Ag, Fe, and AgFe (each metal around 1% mass). The characterization results showed a stronger influence of titania precursors, surfactants, and AC on the texture and an insignificant effect on the crystalline structure and morphology of the obtained materials. X-ray photoelectron spectroscopy revealed the effects of AC and Fe on the Ag0 concentration and of Ag on Fe-reduced species. Based on this information, the results obtained by H2-TPR, UV–Vis, Raman, and photoluminescence spectroscopy were explained. The performance of the photocatalysts was evaluated in the degradation of Congo Red (CR) and Crystal Violet (CV) dyes under UV and visible light. The Ag-TiO2 sample exhibited the best activity in degrading CR at acidic pH and in degrading CV under basic conditions. In visible light, we observed the significant effects of the surface plasmon resonance, AC, Ag, and Fe on the activity in CR photodegradation. The proposed kinetics and mechanisms complete the study of the reactions.

1. Introduction

Industrial development and urbanization have led to an increase in living standards, but they have also created a series of problems, particularly regarding water pollution caused by various organic compounds. Many of these compounds have high toxicity and low biodegradability. Among the most dangerous pollutants found in wastewater are dyes used in the textile, food, and pharmaceutical industries, which are carcinogenic and mutagenic [1,2,3,4]. Specifically, two widely used dyes in the textile industry are Crystal Violet (CV) and Congo Red (CR). The cationic dye CV is known to be mutagenic and acts as a mitotic poison [5], and CR contains benzene and naphthalene rings that are resistant to degradation by conventional methods and is also highly toxic and carcinogenic [6]. These characteristics raise significant environmental and health concerns regarding their presence in aquatic environments. Therefore, in recent years, scientific research has focused on finding effective solutions to remove these pollutants from wastewater [2,3]. In this regard, many methods have been developed, of which heterogeneous photocatalysis is of significant interest.
The removal of pollutants from wastewater using semiconductor photocatalysts in the presence of artificial or natural light has proven to be a promising approach [7,8,9,10,11,12,13,14]. Among the semiconductors used as photocatalysts, TiO2 is the most studied due to its high activity, stability, and nontoxicity [7,8,9,11,15,16]. However, the application of TiO2 in heterogeneous photocatalysis has been limited, particularly for larger organic molecules, such as dyes, as well as for visible light, due to its small surface area, small pore size, and wide band gap (3.2 eV for anatase and 3.0 eV for rutile). To improve the efficiency and expand the application area of TiO2 in photocatalytic reactions, many strategies have been employed. For instance, mesoporous TiO2 has been successfully synthesized by the surfactant-assisted sol–gel method [7,11,17,18,19], the hydrothermal method [20,21], or their combination [22,23,24]. The control of the structure, morphology, and texture is achieved by varying the working conditions (pH, solvent), titanium precursors, or surfactants. Therefore, sol–gel synthesis assisted by surfactants is the most widely used technique to obtain mesoporous titanium dioxide. For example, TiO2 with a spherical morphology was synthesized starting from isopropyl titanate in the presence of three different surfactants, at pH = 3 [11]. Cationic and nonionic surfactants (CTAB and PEG, respectively) produced anatase samples with mesopores and macropores, whereas the anionic surfactant SDS led to TiO2 with a larger specific surface area and only mesopores. Additionally, the effect of the hydrophilic chain length of the surfactant was investigated using the Brij series (Brij 52, Brij 56, and Brij 58) [25], and it was found that the size of the TiO2 particles increased with an increase in the surfactant molecule size.
On the other hand, to extend the application of TiO2 to the visible range, various non-metals and/or metals have been incorporated into its matrix [7,11,26,27,28,29,30,31]. In this way, the band gap energy was reduced and new active photocatalysts in visible light were obtained. Previous studies have demonstrated that adding activated carbon (AC) and metals, such as silver and iron, to TiO2 increases its photocatalytic performance [7,11,26,28,31]. This improvement is attributed to a reduction in the recombination rate of electric charges and the extent of light absorption into the visible domain. AC doping not only broadens the light absorption of TiO2 but also increases the specific surface area [7,31,32,33]. Furthermore, carbon species act as electron-trapping centers, and a synergistic effect between them and oxygen vacancies was observed in carbon–TiO2 heterostructures when exposed to visible irradiation [31,34].
Silver is frequently used to dope TiO2 because of its desirable optical properties [7,26,35,36,37]. Thus, Ag nanoparticles exhibit surface plasmon resonance, which contributes to electron generation in visible light [38,39]. These electrons are injected into the conduction band of the semiconductor and participate in the photocatalytic reaction [40,41,42,43]. On the other hand, iron weakens the Ti–O bonds in TiO2, leading to the formation of oxygen vacancies, which promote the adsorption of water and oxygen on the photocatalyst surface, thereby increasing the generation of reactive oxygen species (ROS) [31,43,44,45].
In this study, mesoporous TiO2 photocatalysts were synthesized using the sol–gel method and different precursors: titanium (IV) ethoxide (TTE), isopropoxide (TTIP), or butoxide (TTB). The synthesis process involved various surfactants, including a nonionic surfactant (polyethylene glycol hexadecyl ether—Brij 58), anionic surfactant (sodium dodecyl sulfate—SDS), and cationic surfactant (cetyltrimethylammonium bromide—CTAB), as well as the combination of Brij 58 with activated carbon (AC). The modified TiO2 and AC–TiO2 photocatalysts were prepared by impregnating them with silver (Ag) and/or iron (Fe) nitrates. The structure, morphology, texture, composition, optical properties, and photocatalytic properties in the degradation of CV and CR dyes from water were correlated with effects of the precursors, surfactants, activated carbon, and metals. Additionally, possible reaction mechanisms were proposed.
Although photocatalysts with Ag or Fe supported on TiO2 have been the subject of many studies, the effects of their association by immobilization on mesoporous TiO2 or TiO2–AC composites on the photocatalytic properties have not been studied. It can also be considered that this comparative study of the effects of anionic, cationic, and nonionic surfactants on the morphological, structural, and textural properties provides new information for the synthesis of mesoporous titanium dioxide.

2. Results

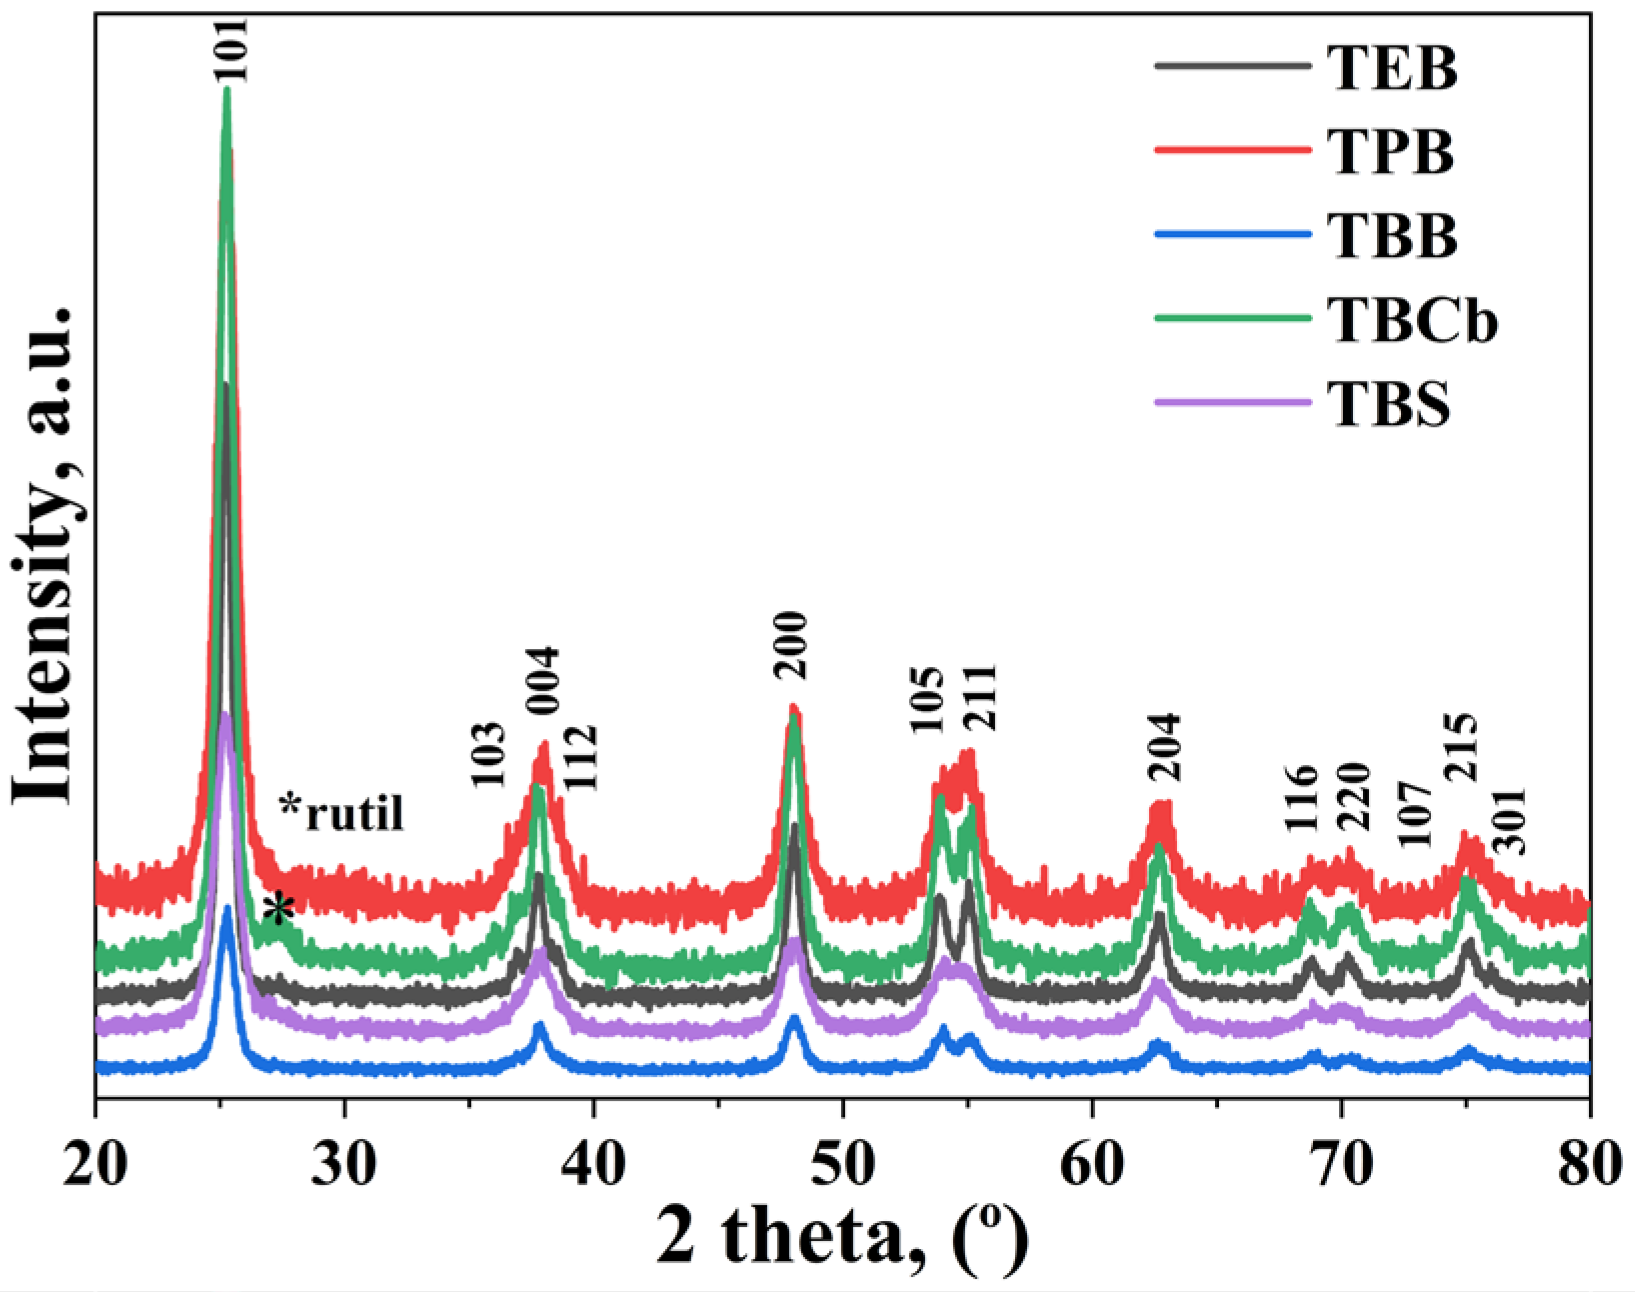
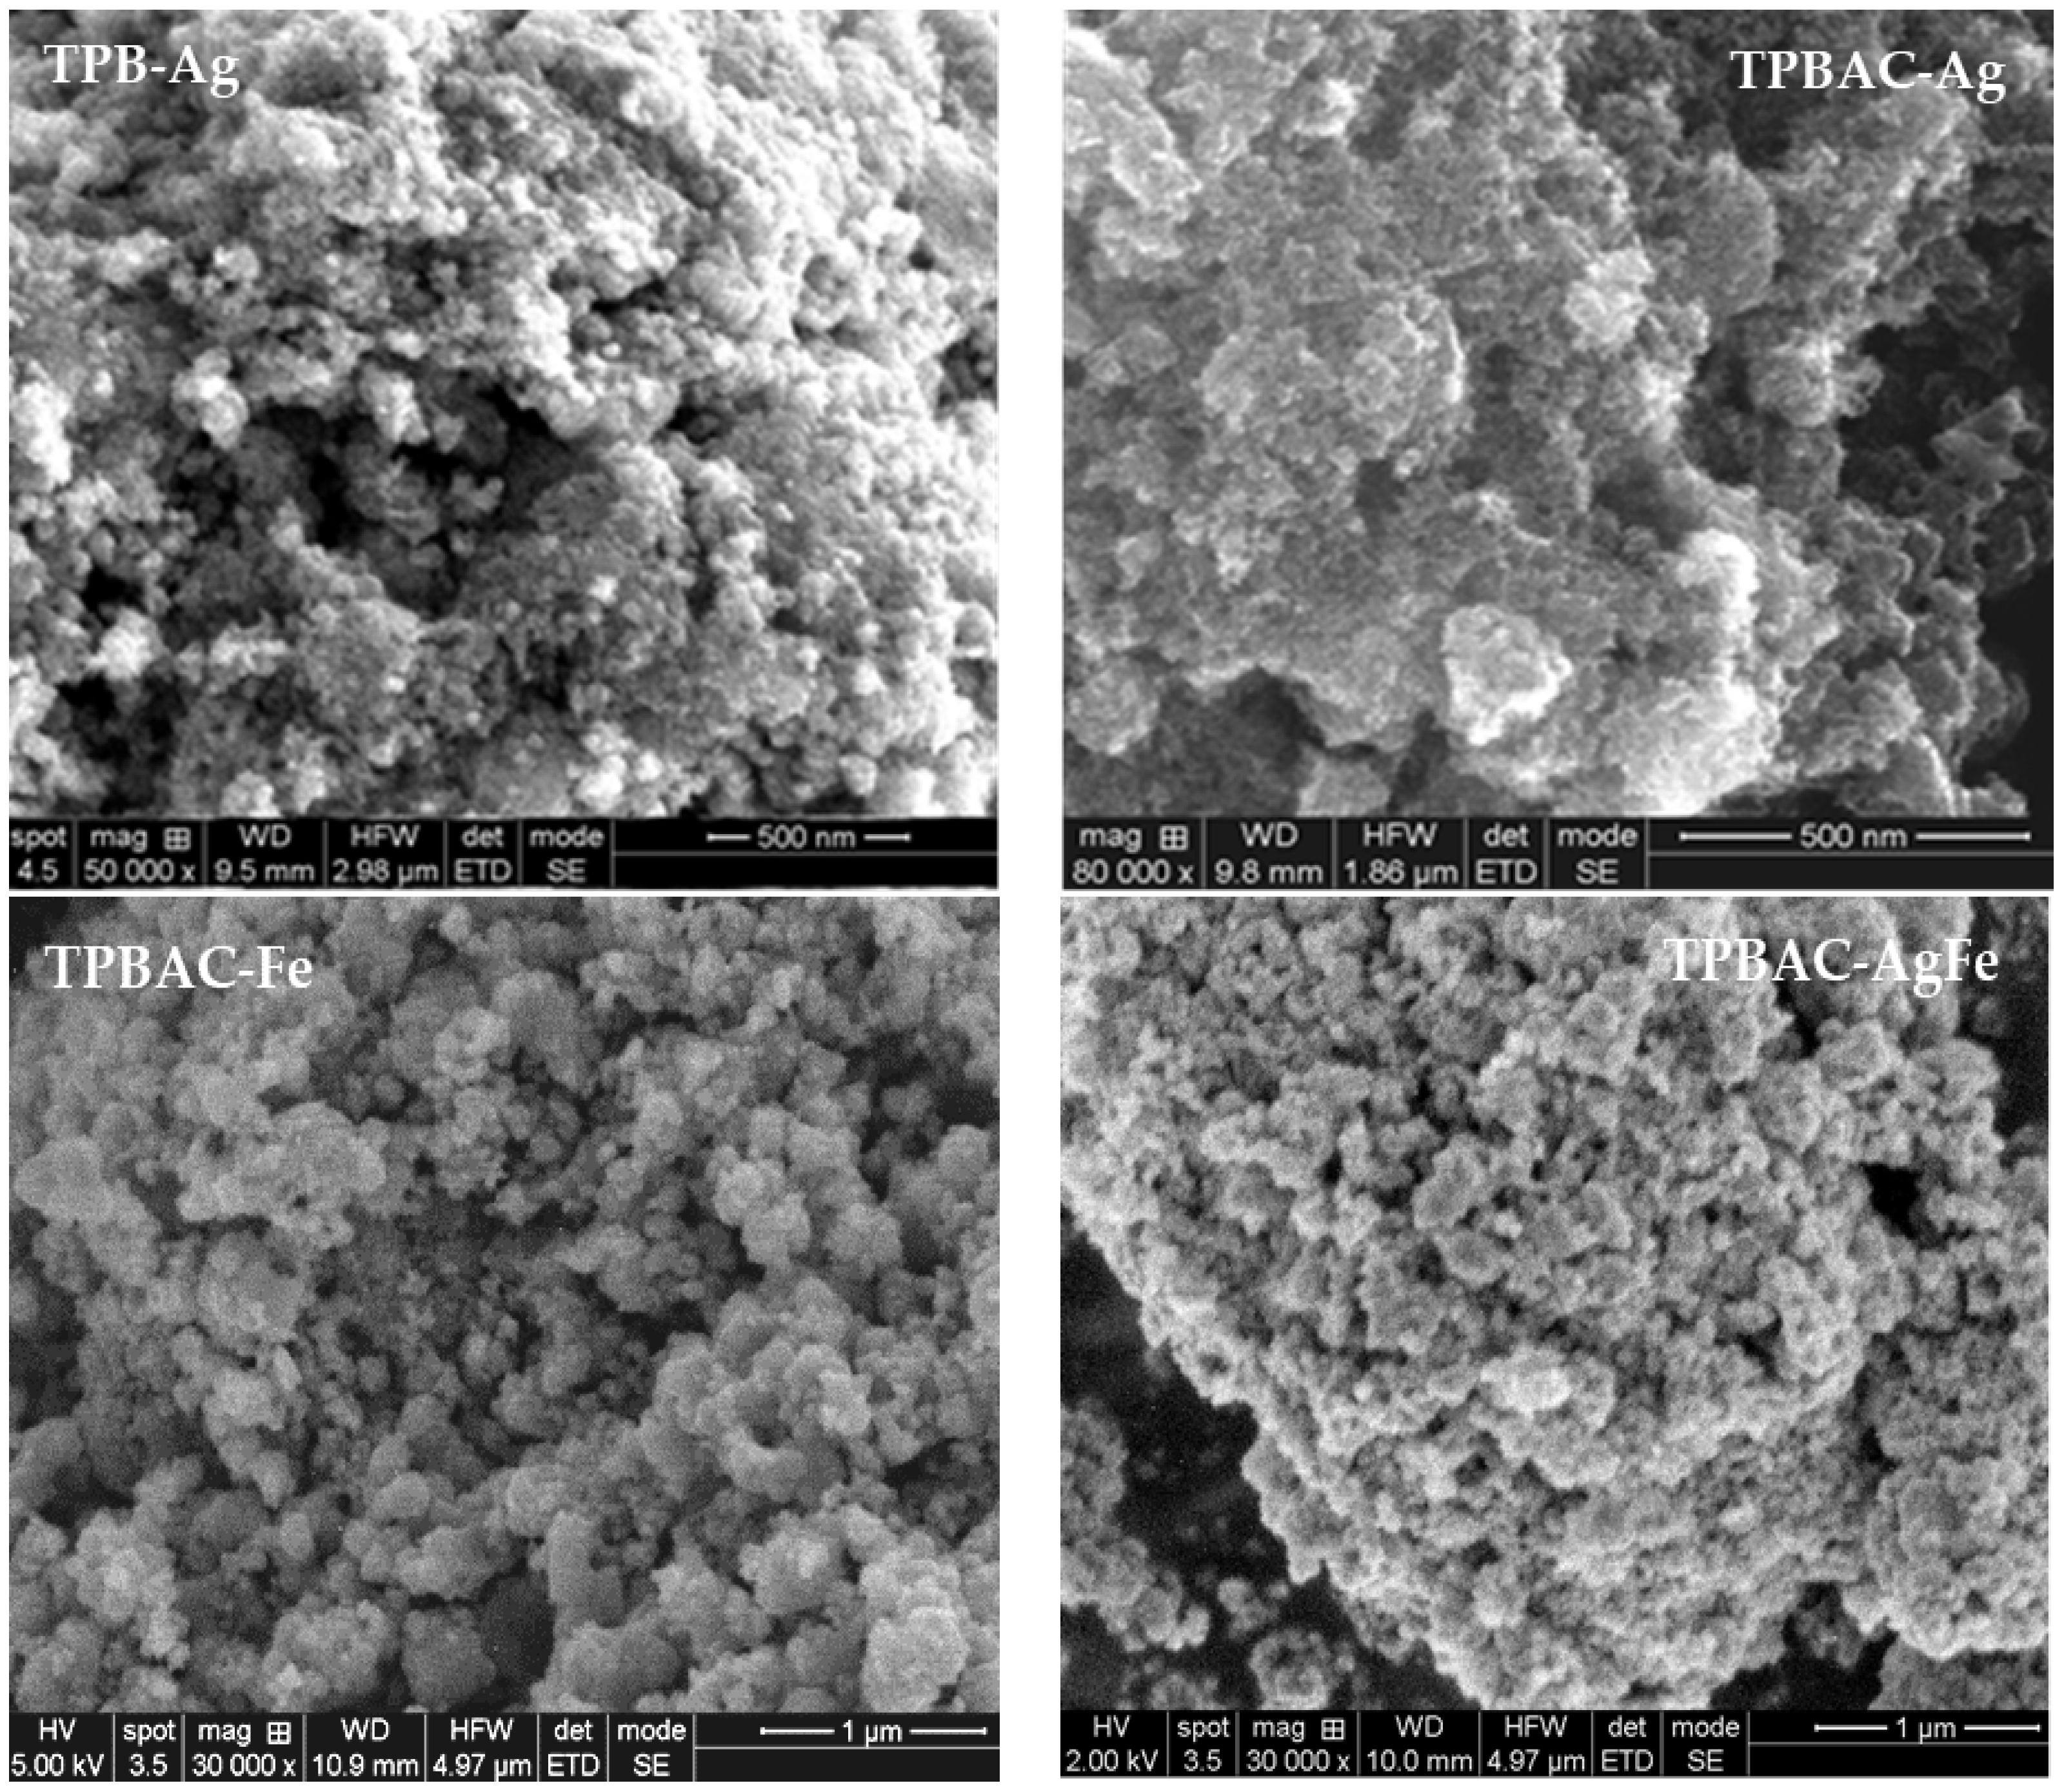
2.1. Structural, Textural, and Morphological Properties of Mesoporous TiO2 Before and After Modification with C, P, Ag, and/or Fe

Three samples of TiO2 were prepared using different precursors, TTE, TTIP, and TTB, while keeping all other synthesis conditions constant. The surfactant Brij 58 was used in each case. The samples were designated as follows: TEB (derived from titanium ethoxide), TPB (from titanium isopropoxide), and TBB (from titanium butoxide). Two other samples were synthesized using butoxide as a titanium precursor, along with SDS and CTAB as surfactants (Table 1). These samples were labeled TBS and TBCb, respectively.
The X-ray diffraction (XRD) results indicate that anatase was the only detected crystalline phase in all samples (Figure 1) except TBCb, which was obtained with cationic surfactant CTAB and exhibited a small fraction of the rutile phase (4.9%) at 2θ of 27.44° (JCPDS no. 021-1276). The observed diffraction peaks at 25.2°, 37.7°, 48.0°, 53.8°, 55.0°, 62.6°, 68.76°, 70.26°, and 75.02° correspond to the crystal planes of the anatase phase: (101), (004), (200), (105), (211), (204), (116), (220), and (215), respectively (JCPDS no. 021-1272). These results can be considered the effects of the nonionic surfactants, which decrease the content of the rutile phase [46]. Therefore, the crystallite size of anatase is influenced by the type of surfactant used and increases in the following order: TBS < TBCb < TBB.
The values for the lattice constants and particle sizes for this set of samples are given in Table 1. The ‘a’ lattice parameter ranges from 0.376 to 0.379 nm, while the ‘c’ values lie between 0.937 and 0.952 nm. Notably, the ‘a’ value is close to the JCPDS standard value for anatase (a = b = 0.3785 nm and c = 0.9514 nm). However, the ‘c’ value is smaller for TEB and TBB, indicating a contraction in the structure, with this effect being more pronounced in the TPB sample. Moreover, ethoxide seems to promote the formation of larger particles, likely due to the increased reactivity of the ethoxy group. The reactivity of the alkoxy group decreases as the steric hindrance increases, and it varies in the following order: ethoxy > butoxy > iso-propoxy (a branched alkoxy chain) [47,48].
The TiO2 samples synthesized using Brij 58 as a surfactant exhibit type IV adsorption isotherms with H1-type hysteresis (Figure 2a), which are characteristic of mesoporous materials with open pores and a relatively narrow pore size distribution (Figure 2b). A significant change in the pattern of the isotherms is observed for the samples prepared with AC or cationic (CTAB) and anionic (SDS) surfactants, as illustrated in Figure 2a. For these samples, the adsorption branch corresponds to the type II isotherm. However, the hysteresis loop for the samples with AC is classified as type H3, while TBS and TBCb exhibit H2-type hysteresis. The H2 loops can be attributed to the narrowing of the pores [49]. A very large variation in the pore size distribution is observed for these samples (Figure 2b). The average pore size values are in the range of 5–10 nm (Table 1). In particular, both the specific surface area (SBET) and pore volume increase with the length and branching of the organic radicals. This trend also correlates with the decrease in the precursors’ reactivity. The decrease in the condensation rate of the TiO2 precursors, induced by the lower reactivity of the alkoxy groups, results in a better defined mesoporous structure. The widest pore size distribution was obtained for the TBS sample, synthesized in the presence of an anionic surfactant. Smaller surface area and pore volume values were obtained for the samples prepared with anionic (TBS) and cationic (TBCb) surfactants. Therefore, in the presence of the nonionic surfactant Brij 58, TiO2 samples with textures typical of mesoporous materials and the highest specific surface area values were obtained. Among these mesoporous TiO2 samples, the one derived from titanium isopropoxide (TPB) was selected to be then modified in order to compare the results obtained with those previously published, where TiO2 was synthesized with the same precursor and surfactant [7,31]. In previous studies, the effects of activated carbon and the iron oxide concentration on the photocatalytic properties and activity were investigated. The TPB sample was doped with activated carbon (AC) by direct synthesis [31] and was further modified with Ag, Fe, and a combination of these two metals. The following samples were obtained: TPBAC, TPB-Ag, TPBAC-Ag, TPB-Fe, and TPBAC-AgFe. Their compositions, as measured by XRF, are detailed in Table 2.
The X-ray patterns of the modified samples show only the diffraction lines of anatase, which are specific to the TiO2 support. No crystalline phases were detected for the added species (Ag, Ag2O, FeOx), probably due to their small amounts, high dispersion on the TiO2 surface, or incorporation into the TiO2 framework [7,31]. The latter situation is particularly relevant for iron-modified TiO2, as Fe3+ and Ti4+ have similar ionic radii [50]. The variations in the diameters of the anatase crystallites, determined from XRD and the textural parameters, are presented in Table 2. The addition of AC in the sol–gel synthesis of TiO2 produces a material with a larger surface area and pore volume (Table 2), since it directs the growth of TiO2 crystallite phases.
Therefore, the textural properties are mainly influenced by the addition of activated carbon in the TiO2 synthesis process. However, previous studies have shown that the crystalline structure of TiO2 may [7] or may not be affected [31], depending on the preparation method. In the case of the TPBAC sample, no effects on the crystal structure were observed. The N2 adsorption–desorption isotherms of the modified TiO2 samples show significant differences (Figure 3a) compared to those of unmodified titanium dioxide (see TPB sample in Figure 2). The adsorption branch of the isotherm for samples with AC resembles a type II isotherm with a H3 hysteresis loop, according to the IUPAC classification [49]. These results indicate the blockage of small pores and the formation of larger pores. In contrast, the sample without AC (TPB-Ag) displays a type IV isotherm with H2-type hysteresis. The modification of mesoporous TiO2 with Ag does not lead to significant changes in the textural parameters. However, the presence of metals decreases the specific surface area when they are immobilized on the TiO2 support with AC. Additionally, narrow pore size distributions are observed for all samples containing AC (Figure 3b).
The data obtained indicate that metal-modified TiO2 materials preserve the characteristics of the mesoporous supports. This suggests that the textural properties are mainly influenced by the addition of AC during the TiO2 synthesis process. In contrast, the morphology was not significantly altered, regardless of whether activated carbon or metals were added. SEM images of the photocatalysts are presented in Figure 4, and no changes in morphology are observed.
The TEM images (Figure S1) confirmed the presence of crystalline formations of TiO2 and of Ag nanoparticles [7]. UV–Raman spectroscopy provides valuable insights into the surface characterization of materials, playing a key role in detecting structural changes caused by doping and enabling the highly sensitive identification of the phase composition on the sample’s surface. All samples were investigated by Raman spectroscopy, and the results are illustrated in Figure 5. The TPB- and TPB-Ag-doped samples’ spectra exhibit peaks at 400 cm−1, 513 cm−1, and 626 cm−1, corresponding to the Raman-active modes of the anatase phase with symmetries B1g, (A1g + B1g) and Eg, respectively, which is confirmed by the XRD measurements. The spectra of samples with activated carbon, TPBAC-Ag/Ag, and Fe/Fe display similar spectral features to the TPB/TPB-Ag samples, but, for these samples, there are some variations in the intensity of the bending band at 513 cm−1, attributed to O–Ti–O symmetric (B1g) and antisymmetric (A1g) vibrational modes due to titania doping [51]. Moreover, the 1075 cm−1 band is assignable to Ag–O vibrations in Ag2O [52]. Intriguingly, silver oxide vibrations were observed in the samples with activated carbon.
Activated carbon exhibits first-order characteristic bands in Raman spectra, primarily the D-band and G-band. The disorder band (D) exhibits dispersive behavior, meaning that its position and intensity depend on the excitation wavelength used. In UV-excited spectra, the D-band is less intense and is observed near 1400 cm−1. This band, in all activated carbon samples, is associated with breathing modes of sp2 ring units. Furthermore, the weak mode at 1400 cm−1 indicates that, in these samples, the sp2 carbon atoms are predominantly arranged in chain structures. The G-band, located at 1573 cm−1, corresponds to sp2 carbon atoms in ring or chain structures in the TPBAC-doped Fe, Ag, and Ag/Fe spectra [53]. The overtone band of anatase B1g mode [54], observed in both AC-free samples (TPB and TPB-Ag), is located at approximately 820 cm−1. Additionally, these spectra exhibit a band at 1633 cm−1, which might belong to the bending vibrations of adsorbed water molecules or hydroxyl groups on the surface of TiO2 [55].

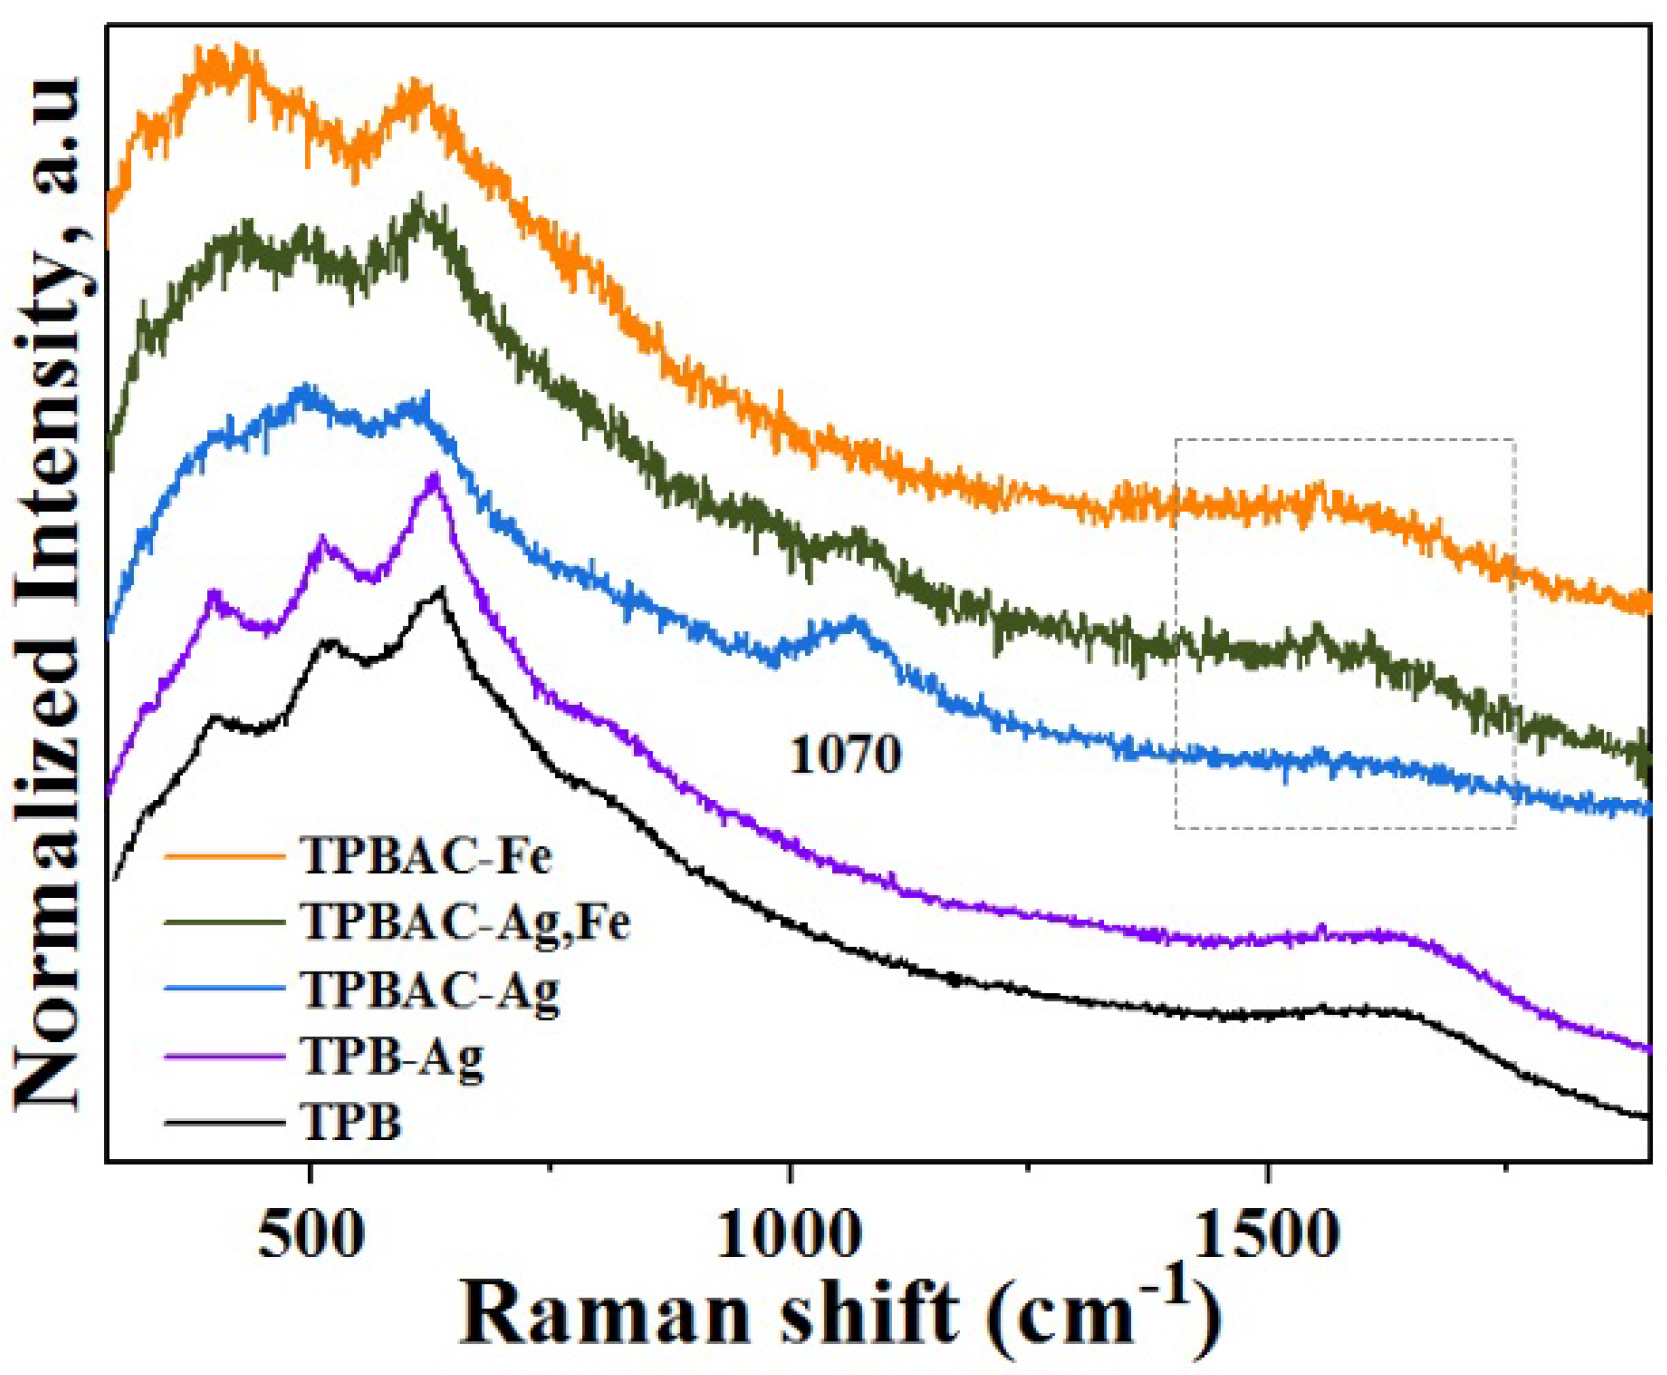
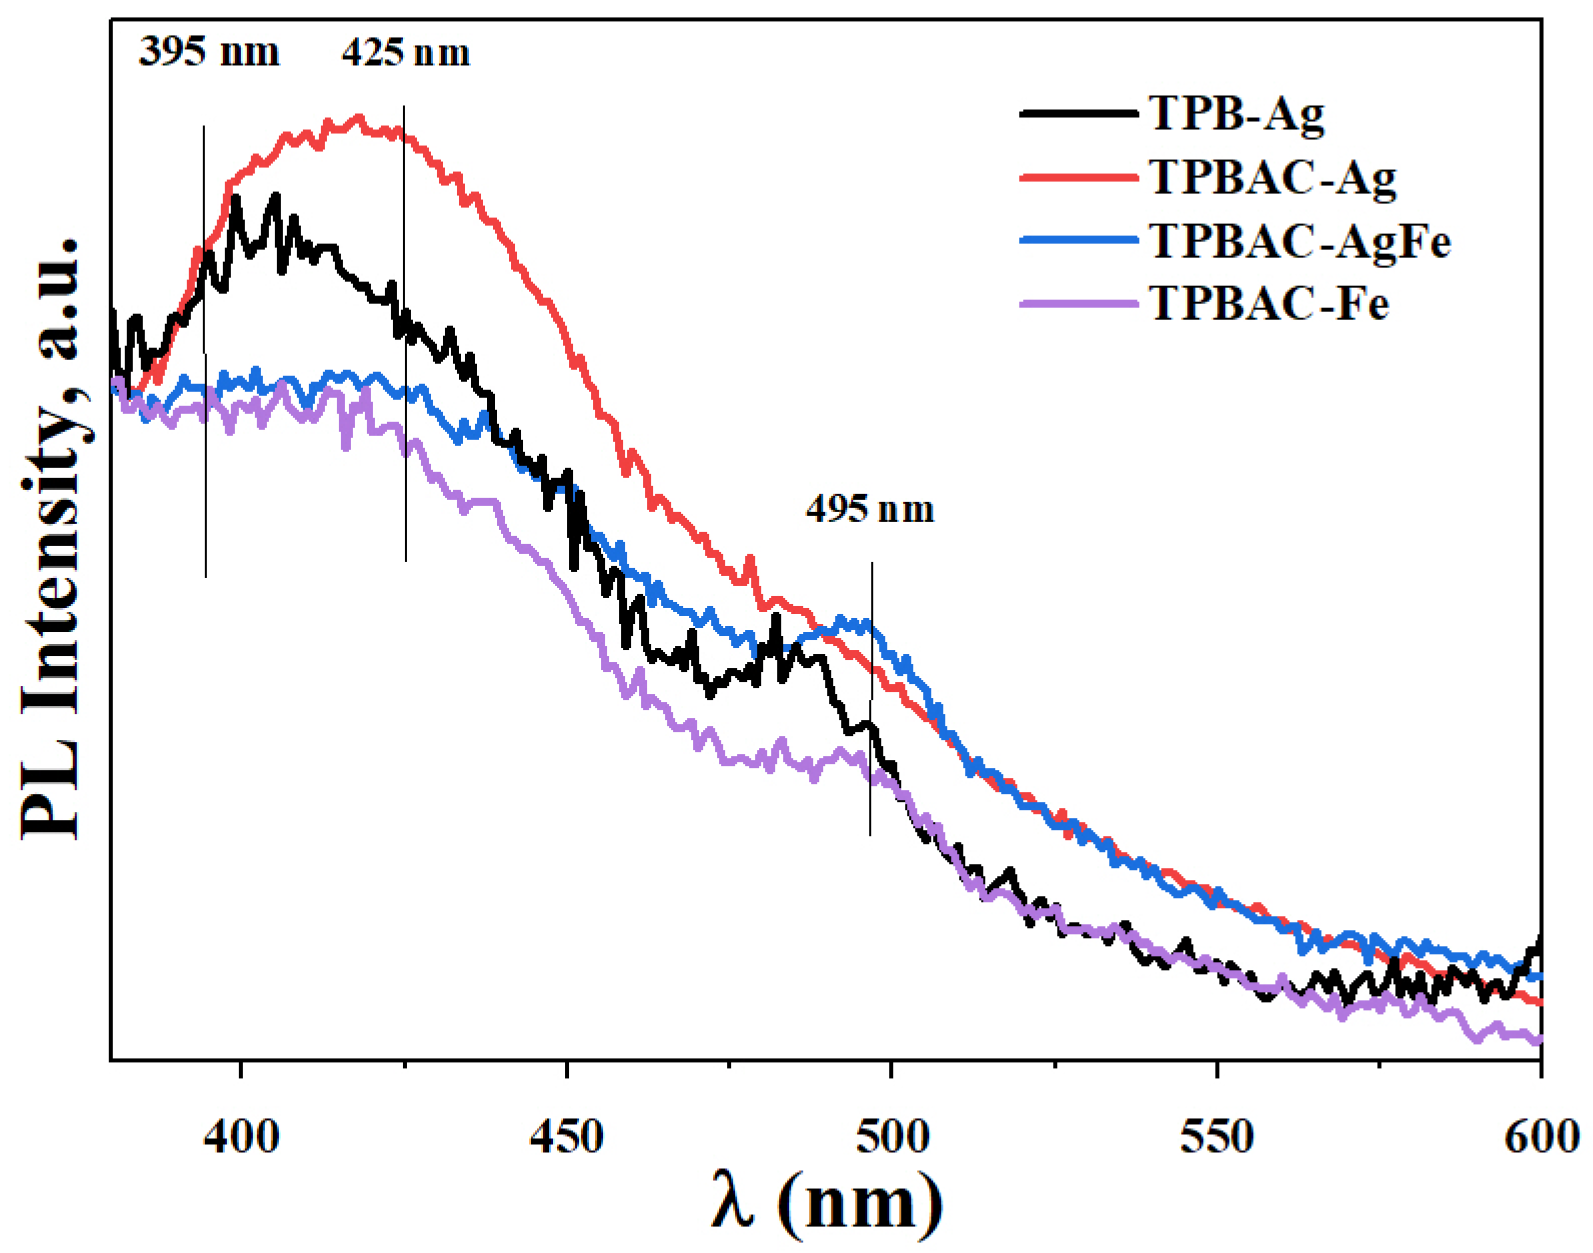
2.2. Surface Chemical Statesand Optical Properties of the Photocatalysts

All XPS high-resolution spectra consist of envelopes resulting from the superposition of multiple peaks. The main peak (458.8–459.8 eV) in the Ti2p spectra (Figure S2) is associated with the TiO2 phase, while the relatively large peak at lower energy is assigned to the sub-oxide TiO2−x phase. The presence of sub-oxide compounds of titanium is confirmed by the complex structure of the O1s spectral line, which is formed from three peaks (Figure S3). Carbon (C) and phosphorus (P) were also detected. The deconvolution of the C1s spectra (Figure S4) reveals the presence of sp2 graphitic carbon, typically found on the surfaces of the samples, as well as C–O bonds, probably Ti–O–C [31,56]. The P2p spectra (Figure S5) were fitted with two peaks at 134.2 eV and 133.2 eV, attributed to P–O in PO4 groups and P–C bonds, respectively [7].
The Ag3d spectra (Figure 6) display two peaks attributed to the Ag+ species and metallic Ag0. The TPBAC-Ag sample exhibits the highest Ag0/Ag+ ratio (see Table S1), while the TPBAC-AgFe sample has the lowest ratio. When iron and silver oxides are immobilized through the simultaneous impregnation of their precursors, competition is created between the reduction of Fe3+ to Fe2+ and that of Ag+ to Ag0, resulting from their interactions with the support during thermal treatment. The similar values of their reduction potentials justify the presence of a larger number of unreduced species for both silver and iron on the surface. As observed in the case of the TPBAC-Ag sample, the presence of activated carbon facilitates the reduction of Ag. For the Fe-containing samples, the Fe 2p3/2 spectra reveal a low-intensity peak on the low-binding-energy side of the envelope (Figure 7), followed by a well-defined peak associated with Fe ions in a lower-than-normal oxidation state [57]. The main part consists of multiplets corresponding to the FeO phase [31,57]. The Fe 2p3/2 peak located at 714 eV in the TPBAC-AgFe spectrum may indicate the presence of Fe3+ [56]. The reduction of Fe3+ ions may be facilitated by the presence of carbon. In contrast, the presence of silver has the opposite effect, due to the competition in their reductions by interaction with TiO2. In Table S1, a decrease in the Fe0/Fe2+ ratio is observed for the sample with Ag, as well as the existence of a similar number of Fe0 and Fe3+ species. Table S2 summarizes the values of the XPS binding energies corresponding to the main species observed.
The oxidation states of the active compounds in the modified TiO2 photocatalysts were analyzed using H2-TPR. The H2 consumption curves were fitted with a Gaussian function, as illustrated in Figure 8. The TPBAC-AgFe sample exhibited the highest hydrogen consumption (Table S3), which aligns with the XPS results, indicating the existence of most oxide species, such as Ag+, Fe3+, and Fe2+, on the surface. The weight percentages were calculated assuming that silver is present in the form of Ag2O and Fe in FeO, as the XPS results suggest that FeOx primarily exists in this form. The peaks observed at lower temperatures (~300 °C) are assigned to the reduction of surface Ag2O, while the Ag2O in the bulk is reduced at higher temperatures (396 °C for TPBAC-Ag and 382 °C for TPBAC-AgFe). The presence of Fe3+ species alongside Ag+ in the TPBAC-AgFe sample explains the existence of two reduction peaks for iron oxides. The first peak can be attributed to the reduction of surface Fe3+ ions to Fe2+. The second peak indicates the reduction of Fe2+ to metallic Fe, both on the surface and in the bulk. It can also be considered that Ag facilitates the reduction of iron oxide [58,59,60].
The optical properties were evaluated by photoluminescence (PL) and diffuse reflectance UV–Vis spectroscopy. PL spectroscopy showed the nature of the electron–hole recombination of Ag-doped TiO2. Figure 9 illustrates the PL spectra of the TiO2 (TPB) samples modified with AC, Ag, and Fe.
The photoluminescence is mainly attributed to oxygen vacancies or interstitial oxygen defects. The normalized spectra of the Fe-containing samples exhibit different pattern features compared with those of TPBAC and TPBAC-Ag. According to the literature, three emission bands are typically observed for TiO2 composites at approximately 380, 425, and 490 nm [61,62]. The first band is attributed to band-to-band transitions [63] associated with exciton annihilation, while the PL emission in the visible region can originate from the electron trap. The 425 nm band is generally linked to intrinsic unit cell defects, whereas the 495 nm band is associated with surface oxygen vacancies, which serve as electron trap states [62]. The spectra of the samples with Ag show higher intensities for the 425 nm peak. This suggests that silver may act as a trap for charge carriers or introduce different types of defects that enhance the suppression of charge carrier recombination. The oxygen vacancy emission, at the 495 nm band, is more pronounced in the Fe-containing samples. At the same time, the lower intensity of the peaks indicates a decrease in the rate of e/h+ recombination.
The diffuse reflectance UV–Vis spectra of the modified TiO2 samples (Figure 10) display a strong absorption band in the UV range due to electronic transitions from the valence band to the conduction band of TiO2 [31]. An additional absorption band in the visible range (between 500 and 700 nm) is attributed to the local plasmon surface resonance effect induced by Ag nanoparticles [41,42]. This effect is enhanced for sample TPB-Ag without AC, for which the lowest band gap energy value was also obtained (Table 2). When AC is added, the plasmon corresponding absorption is strongly diminished for the TPBAC-Ag sample and almost vanishes for TPBAC-FeAg. These findings are in agreement with the XPS data (Figure 7, Table S1), which indicate a high Ag0/Ag+ ratio on the surface of the TPB-Ag sample. Although the TPBAC-Ag sample has the highest value of this ratio, the presence of activated carbon in a higher concentration than Ag (Table 2) significantly reduces the plasmon surface resonance effect. The band gap values were calculated using the Tauc method for direct transitions and are presented in Table 2.

2.3. Photocatalytic Degradation of Dyes

To explore the potential applicability of the synthesized catalysts, photodegradation experiments using some textile dyes were performed. Congo Red (CR) and Crystal Violet (CV) were selected as model dyes. CR is an anionic azo dye that typically appears as a brownish red solid. Its color changes from dark blue at pH 4 to red at a higher pH. CV, commonly known as Gentian Violet due to its aqueous solution color resembling that of gentian flowers, turns yellow at extremely high pH levels. These color variations are attributed to pH-dependent structural changes [64,65]. At pH levels higher than 5, CR exists in its unprotonated (anionic) form, while, at a lower pH, it consists of two tautomeric (ammonium and azonium tautomers) and one azoic form [64]. In acidic, neutral, and slightly alkaline conditions, CV is found in its cationic form [65]. Above pH 10, carbinol, a base that can be strongly adsorbed on a support with a lower PZC value, is formed. The UV–Vis spectra of CR and CV, their molecular structures [23,43], and the color variations with the pH are illustrated in Figure 11.

2.3.1. UV Light Irradiation

The degradation of aqueous dye solutions, in the presence of TPB-Ag and under UV light irradiation, was studied, following the effects of the pH, photocatalyst loading, and time of irradiation.

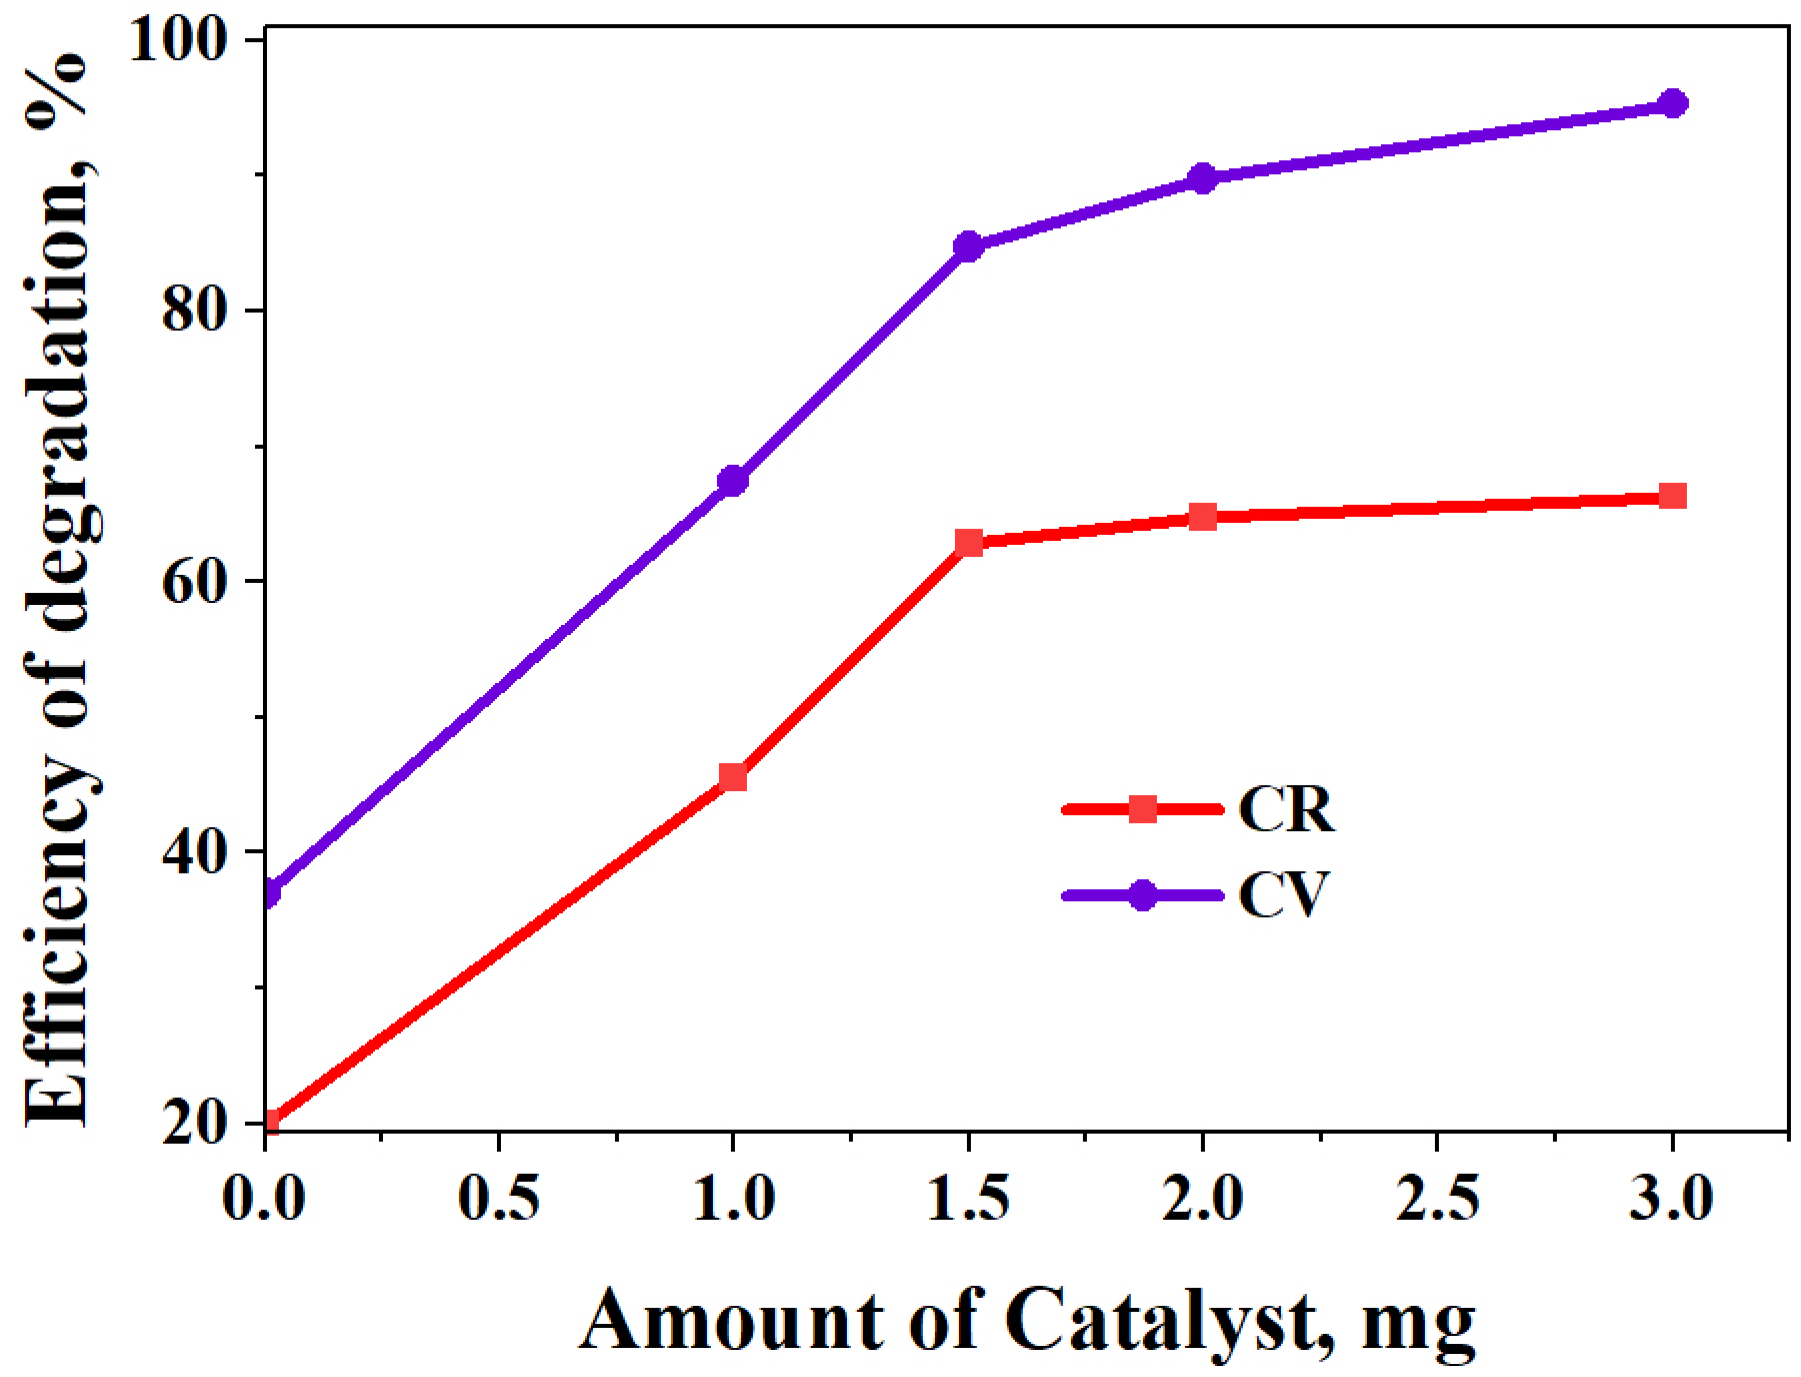
The Effect of the Catalyst Amount

The CV and CR solutions were irradiated in the presence of varying amounts of catalyst (0, 1 mg, 1.5 mg, 2 mg, and 3 mg). Figure 12 shows a significant increase in efficiency with the catalyst amount up to 1.5 mg. Above this value, the efficiency increases much more slowly in the case of CR degradation and almost not at all in the case of CV. At high catalyst concentrations, the penetration of UV light into the suspension may be hindered due to increased opacity and light scattering. Additionally, at high catalyst loading, overlapping of the adsorption sites and the deactivation of the catalyst may also occur [66,67].

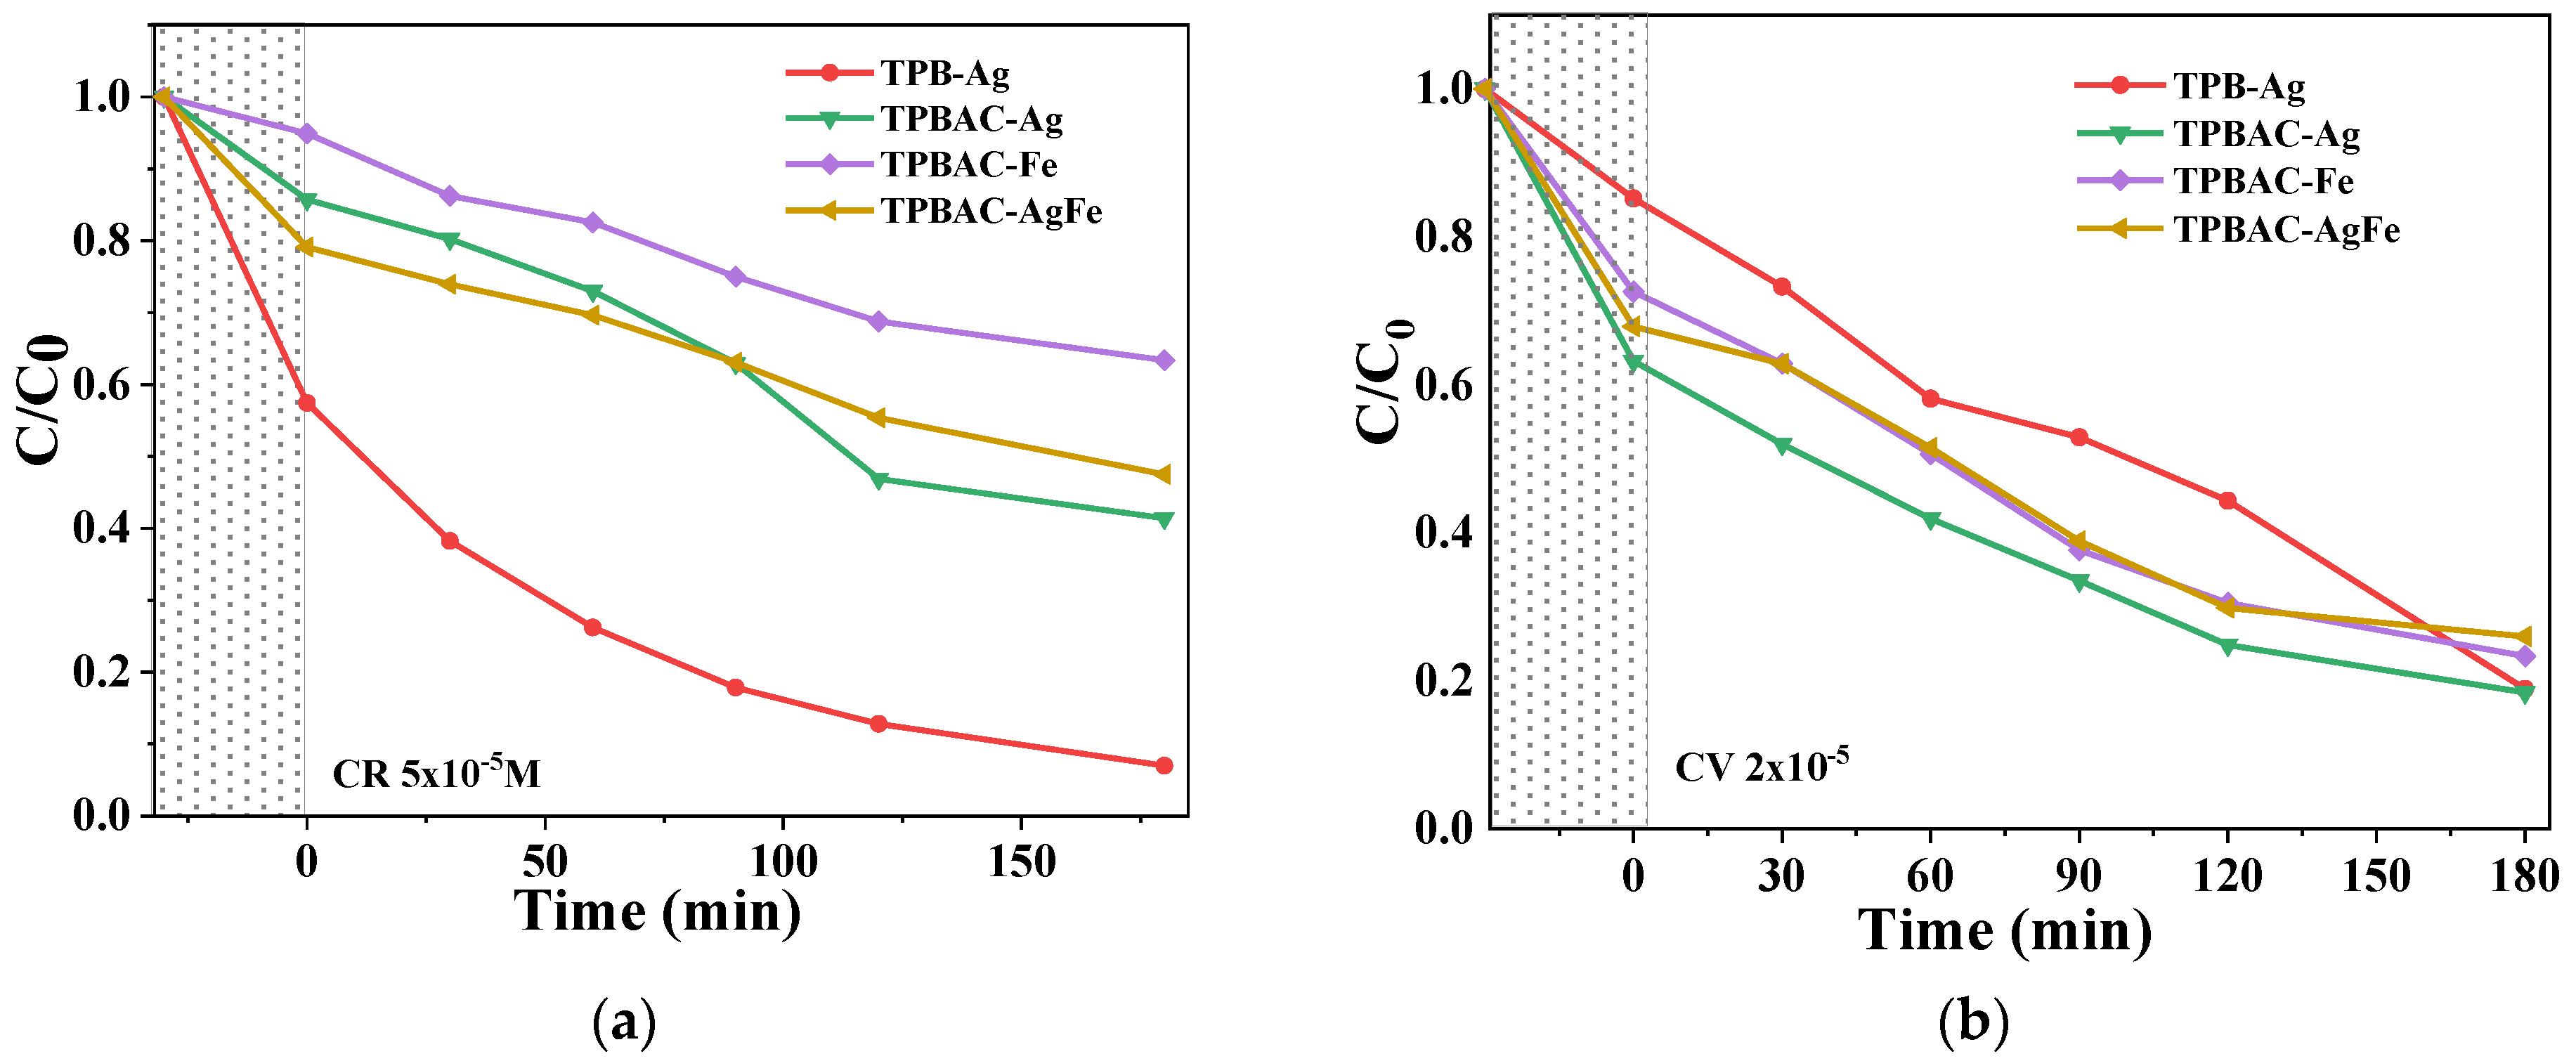
The Effect of the pH and Photodegradation Time

The pH of a solution can significantly influence the photodegradation efficiency since it modifies the electrical double layer at the solid–solution interface and, consequently, the adsorption–desorption processes [68]. The surface of a catalyst dispersed in a solution can be positively or negatively charged depending on the pH level. The pH value at which the surface of a photocatalyst becomes neutral is known as the point of zero charge (PZC). For TiO2, the pH at the PZC was reported to be 6.5 [69]. This means that, in acidic solutions (pH < 6.5), the TiO2 surface is positively charged due to protonation, with the predominant species being TiOH2+. Conversely, when the pH exceeds 6.5, the surface of TiO2 becomes negatively charged, as hydroxyl anions lead to the formation of TiO. As a result, when a cationic dye interacts with the photocatalyst, weak adsorption is expected at pH levels below the PZC because of the electrostatic repulsion between the positively charged TiO2 surface and the cationic amino groups of the dye. However, the adsorption of cationic dyes onto the photocatalyst surface increases at pH above the PZC value, due to favorable electrostatic interactions between the dye molecules and the negatively charged catalyst surface. In contrast, the adsorption of anionic dyes is more favorable at lower pH levels, as strong interactions occur between the negatively charged sulfonic groups of the dye and the positively charged TiO2 surface.
In order to study the effects of the initial pH on the photodegradation efficiency of the TiO2 samples, experiments were carried out in acidic, as-prepared, and alkaline dye solutions. The obtained data (Figure 13) indicate that higher degradation efficiency for CR dye is achieved in acidic conditions. As an anionic dye, CR is more effectively adsorbed on the surface of the photocatalyst at a low pH due to the electrostatic attraction between the positively charged TiO2 surface and the sulfonated groups of the dye, as can be observed in Figure 13a. At higher pH levels, the decrease in adsorption can be explained based on electrostatic repulsions between dye molecules and the negatively charged surface of TiO2. This trend also applies to photocatalytic degradation; increased dye adsorption enhances the efficiency of the entire process. In contrast, the highest CV removal efficiency was achieved at pH 9.5, reaching ~100% after only 90 min (Figure 13b). This result aligns with our expectations due to the cationic nature of the dye. Figure 14 compares the effects of the pH of the reaction medium on dye degradation in both the absence (photolysis) and presence of the photocatalyst. The presence of the photocatalyst significantly enhances the photodegradation efficiency due to the generation of reactive oxygen species (ROS) under light irradiation. This finding indicates a synergistic effect of the pH and light action.

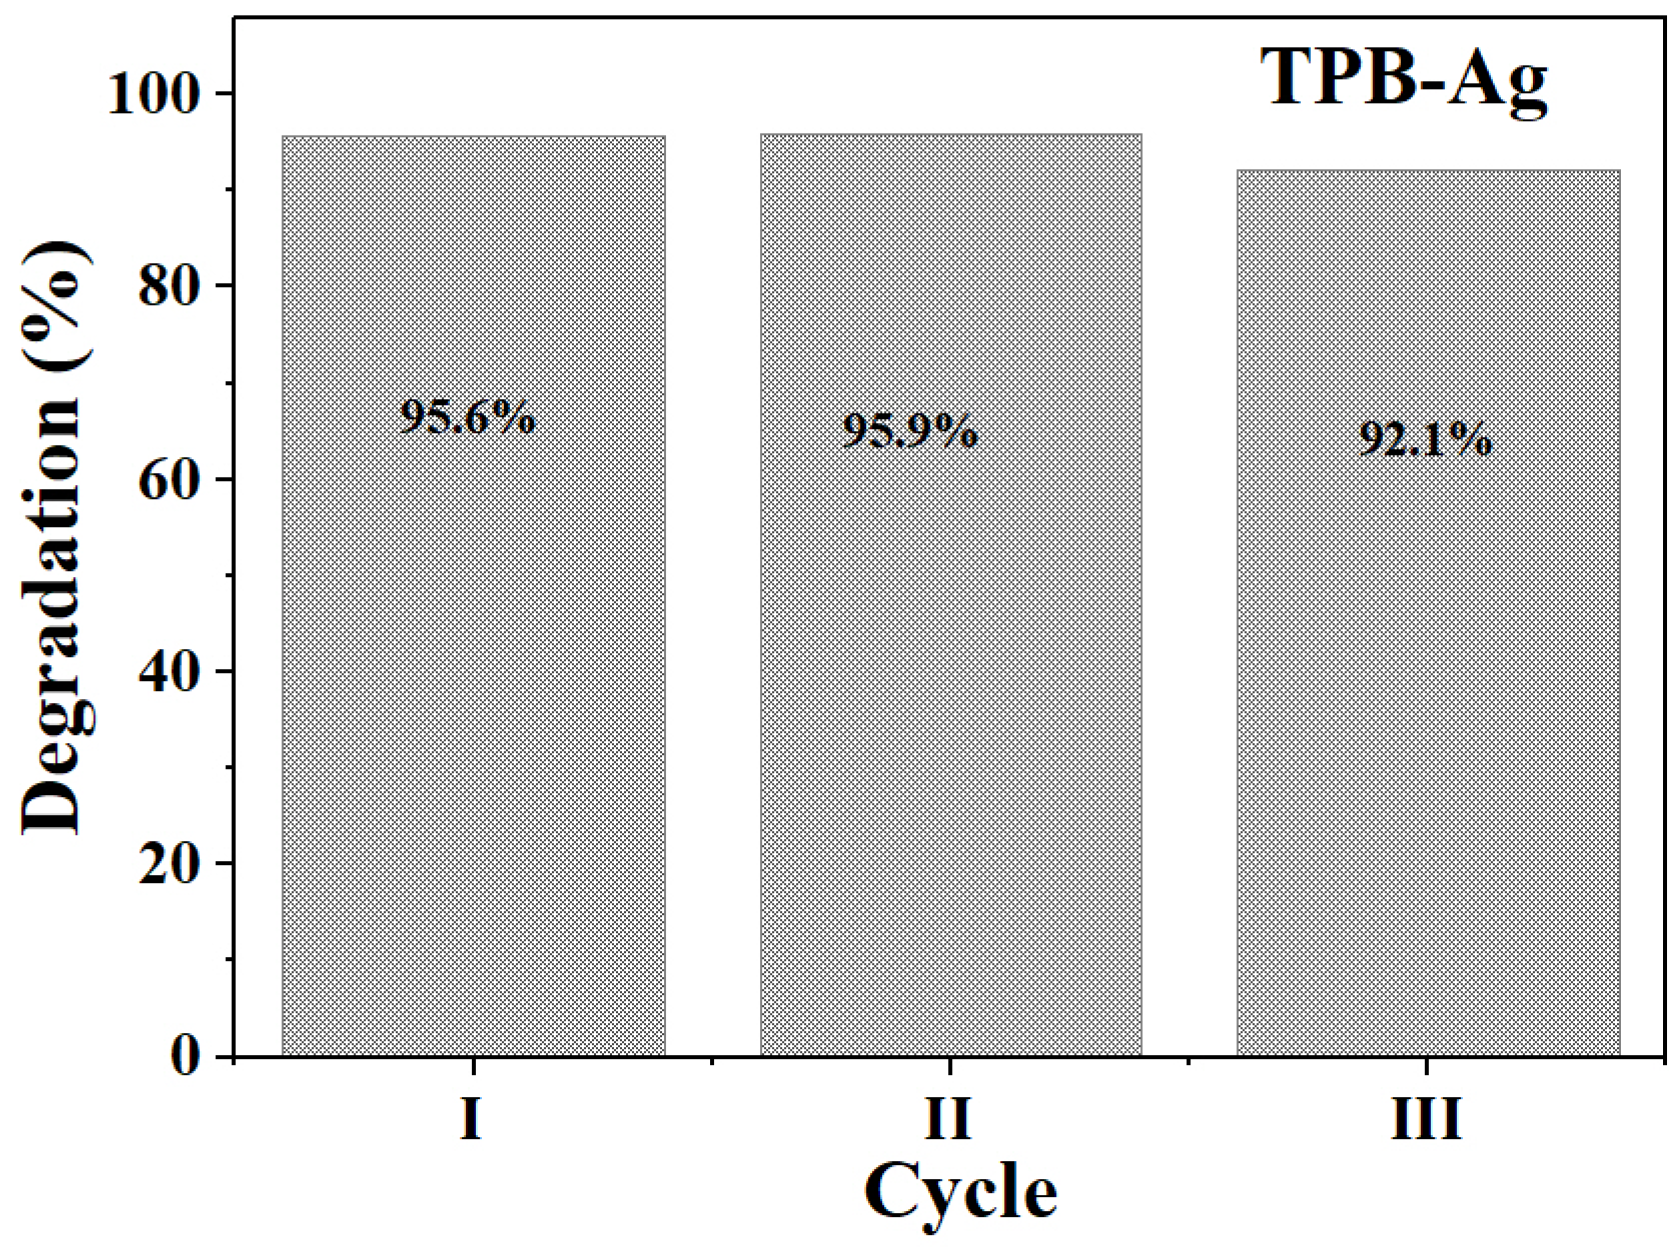
2.3.2. Visible Light Irradiation

The modification of TiO2 aimed to broaden its applicability. Thus, the obtained photocatalysts were also tested in the degradation of CV and CR from water by irradiation with visible light. A priori photolysis experiments were performed. It was found that CR did not experience degradation, while, in the degradation of CV, decolorization efficiency of 25% after 180 min was obtained. Figure 15 shows that, in CV photodegradation, all samples with AC presented similar behavior (with efficiencies in the range 74–81%), regardless of the induced modification in TiO2. The highest efficiency was also obtained when TPB-Ag was used (95%). In contrast, CR degradation is strongly influenced by the composition of the photocatalysts. Thus, it can be seen that silver considerably enhances the reaction efficiency, which varies in the order TPBAC-Fe < TPBAC-AgFe < TPBAC-Ag < TPB-Ag, and the values range from 52.5% to 93.0%. As can be seen from the XPS data (Table S1), the Ag0/Ag+ ratio is the highest in the TPBAC-Ag sample. However, in the absence of carbon, the plasmonic effect of silver is more pronounced in the UV–Vis spectrum of the TPB-Ag sample (Figure 10). The higher activity of the TPBAC-AgFe sample, compared to the TPBAC-Fe, is due to the presence of Fe3+. This effect was confirmed in previous studies [31]. In the case of the TPBAC-AgFe sample, silver facilitates the appearance of Fe3+, which is beneficial for the visible photocatalytic reaction; at the same time, iron prevents the reduction of silver, which is unfavorable for the reaction. Therefore, the high activity of the TPB-Ag sample may be due to the plasmonic photocatalytic reaction. Under visible light irradiation, the local surface plasmon resonance induced by silver can enhance the local electric field and therefore the photocatalytic performance of TiO2 in the visible range. (For exemplification, Figure S6 presents the absorbance spectra obtained during the photocatalytic degradation of dyes over TPB-Ag).
The kinetic analysis was performed considering a Langmuir–Hinshelwood mechanism and a pseudo-first-order reaction [70]. The data are plotted in Figure 16a,b, and the kinetic parameters as well as the half-time (for an easier comparison of the catalysts) are listed in Table 3.
It is observed that the results obtained are close to the best ones presented in the literature in the case of CV photodegradation (Table 4).
For the Ag-TiO2 sample, the removal efficiencies of both dyes are similar to the published values. In an acidic medium for CR and in a basic medium for CV, comparable or even better results are obtained regarding those reported for other photocatalysts. Taking into account the reaction parameters (amount of catalyst, concentration of the aqueous dye solution, reaction time), the performance obtained in the degradation of the CV dye (Figure 13) can be considered to be among the best.
The recyclability of the TPB-Ag sample, which presented the highest photodegradation efficiency, was determined in CV photodegradation by using it in three cycles (Figure 17). After every cycle, the material was separated and then reused in a new reaction. Only a slight decrease in efficiency was observed after three cycles. Thus, it can be considered that the proposed materials are not only efficient, but they are also stable in reaction conditions.

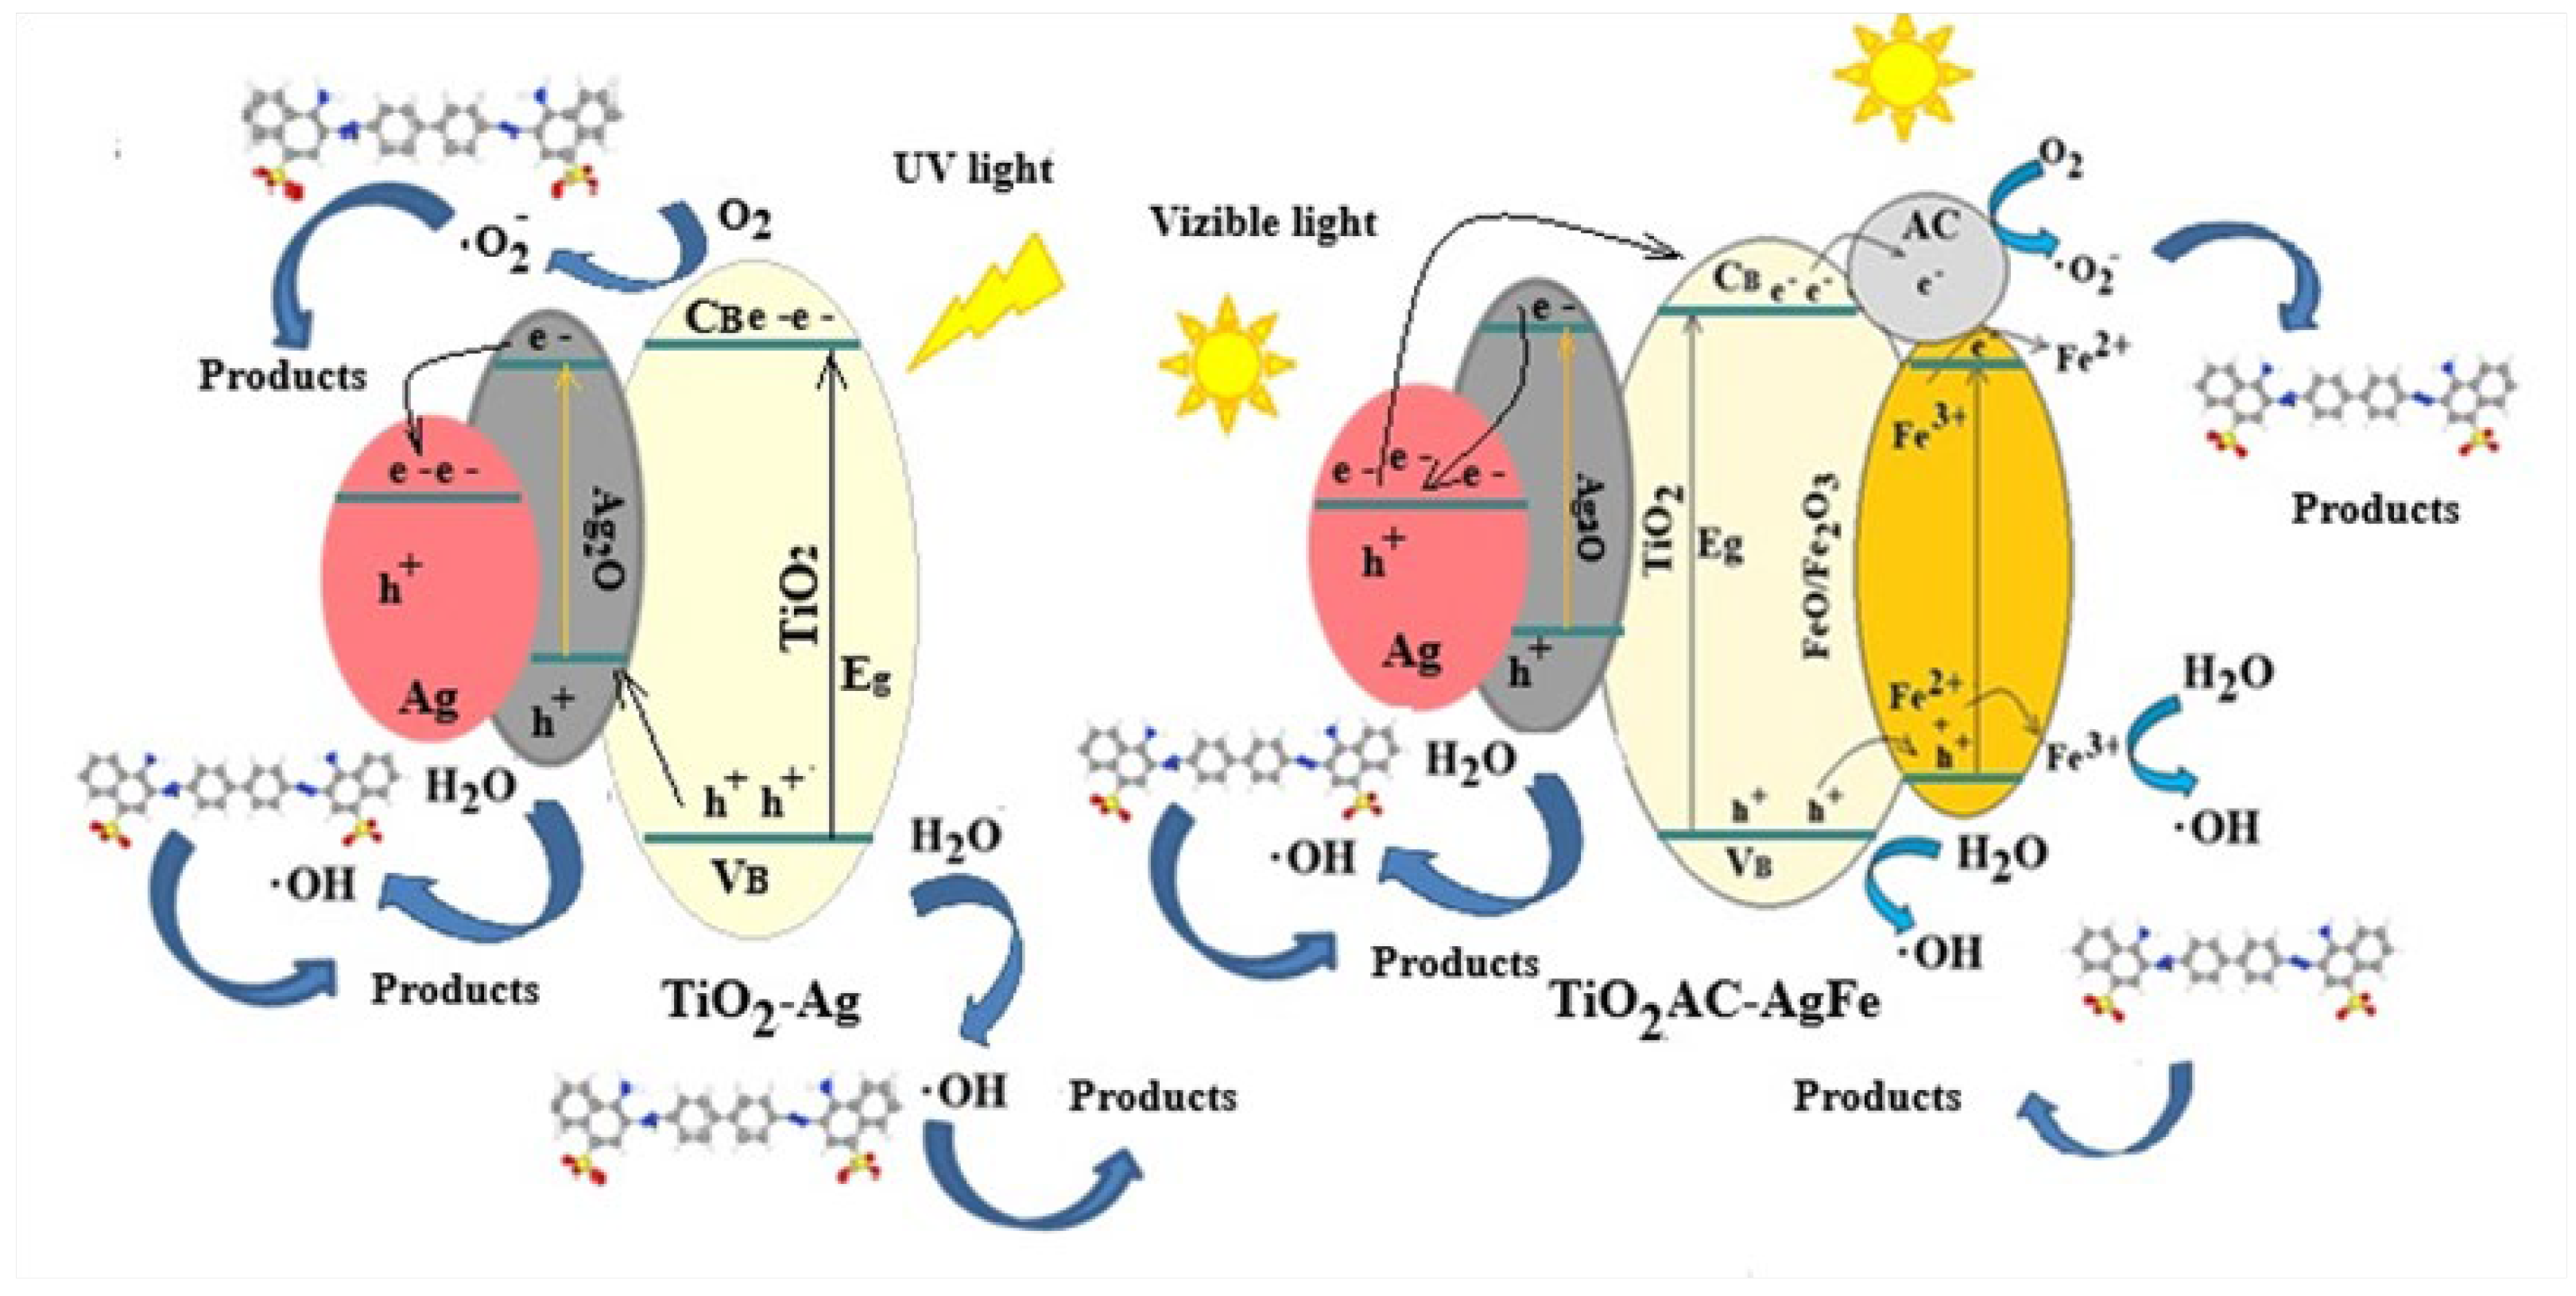
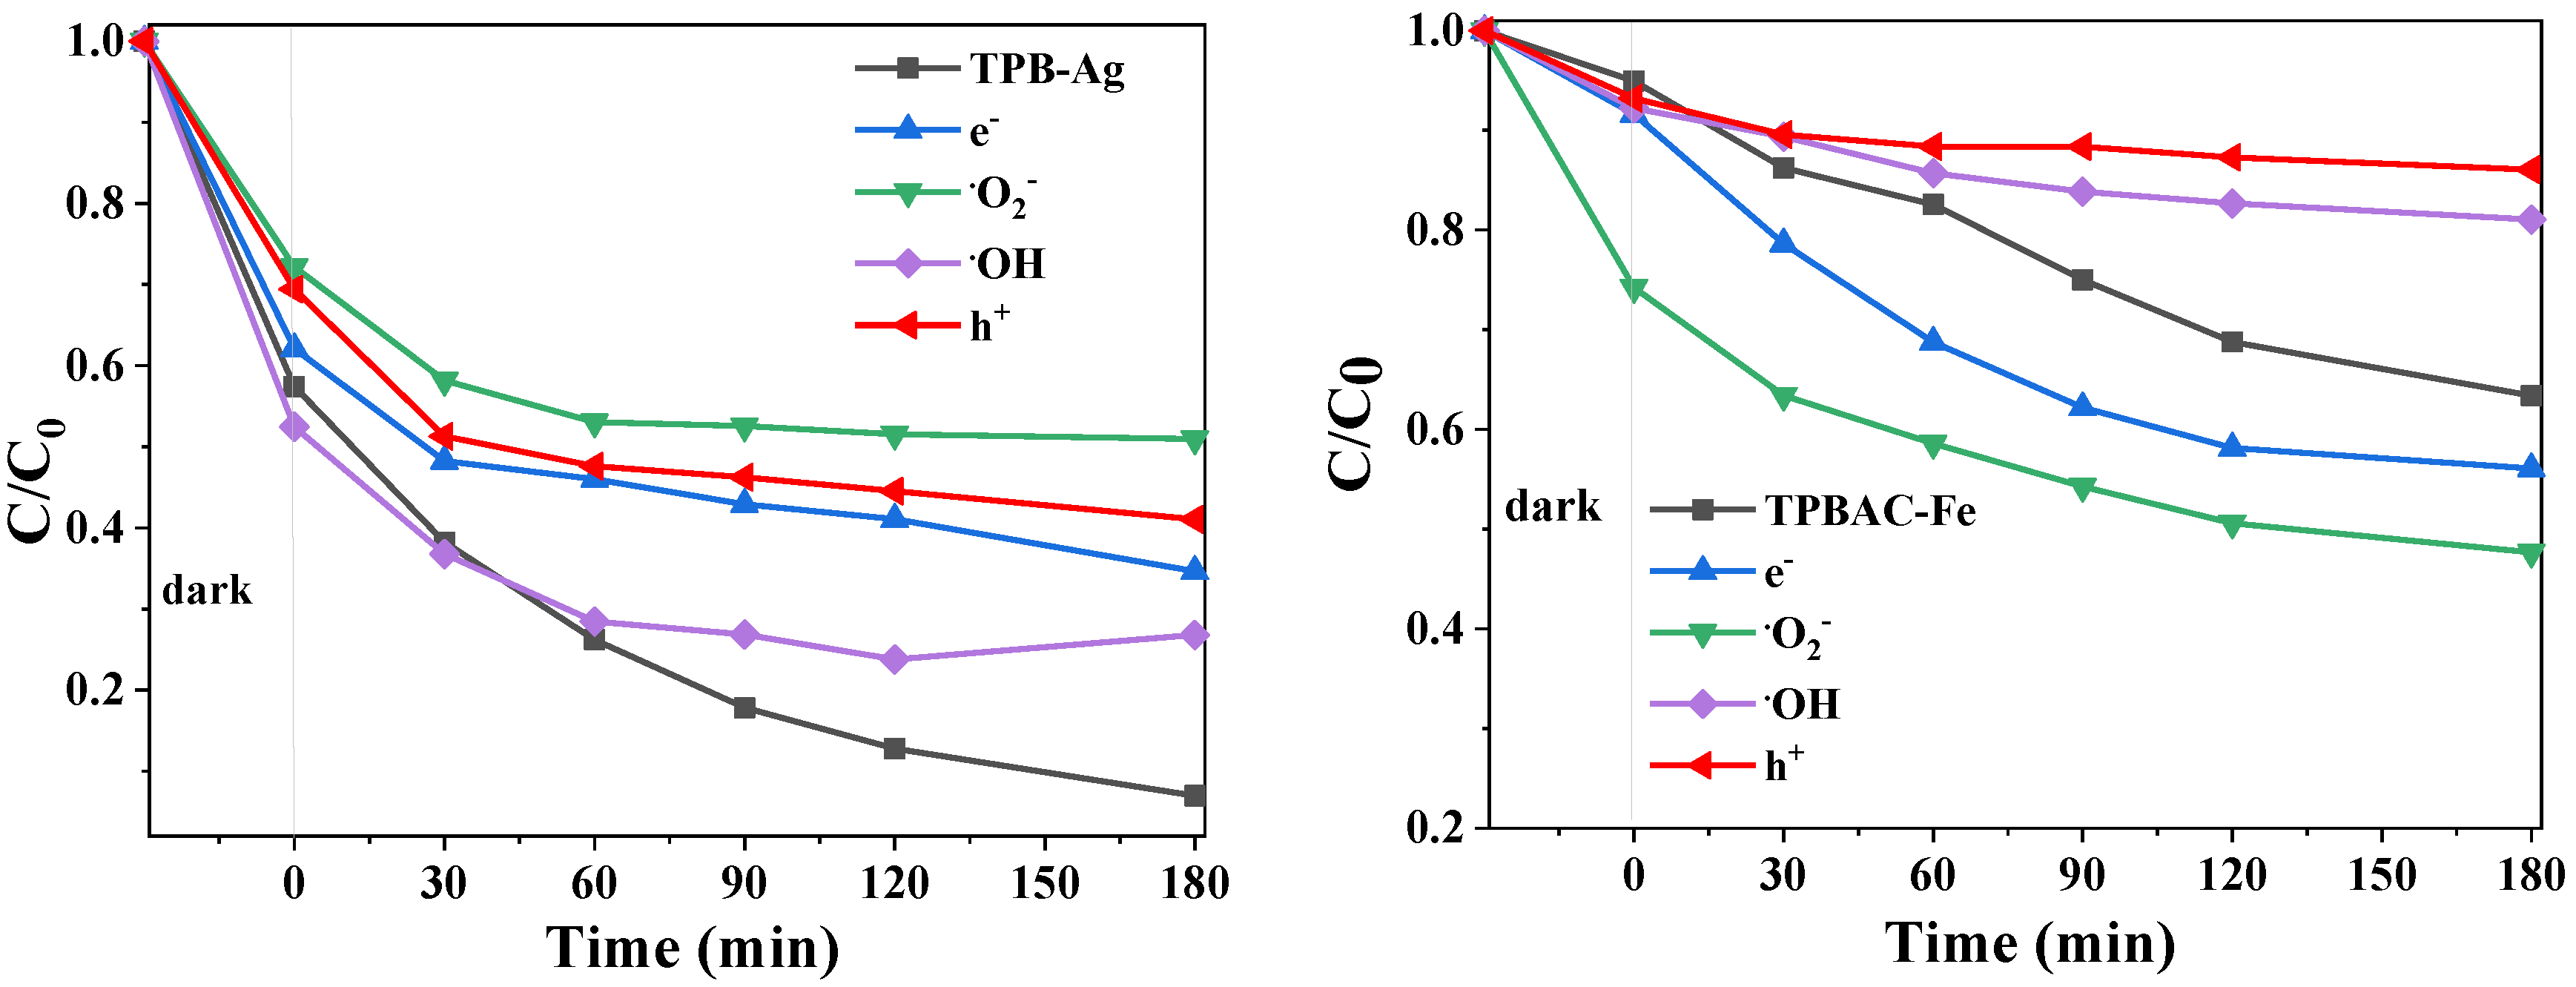
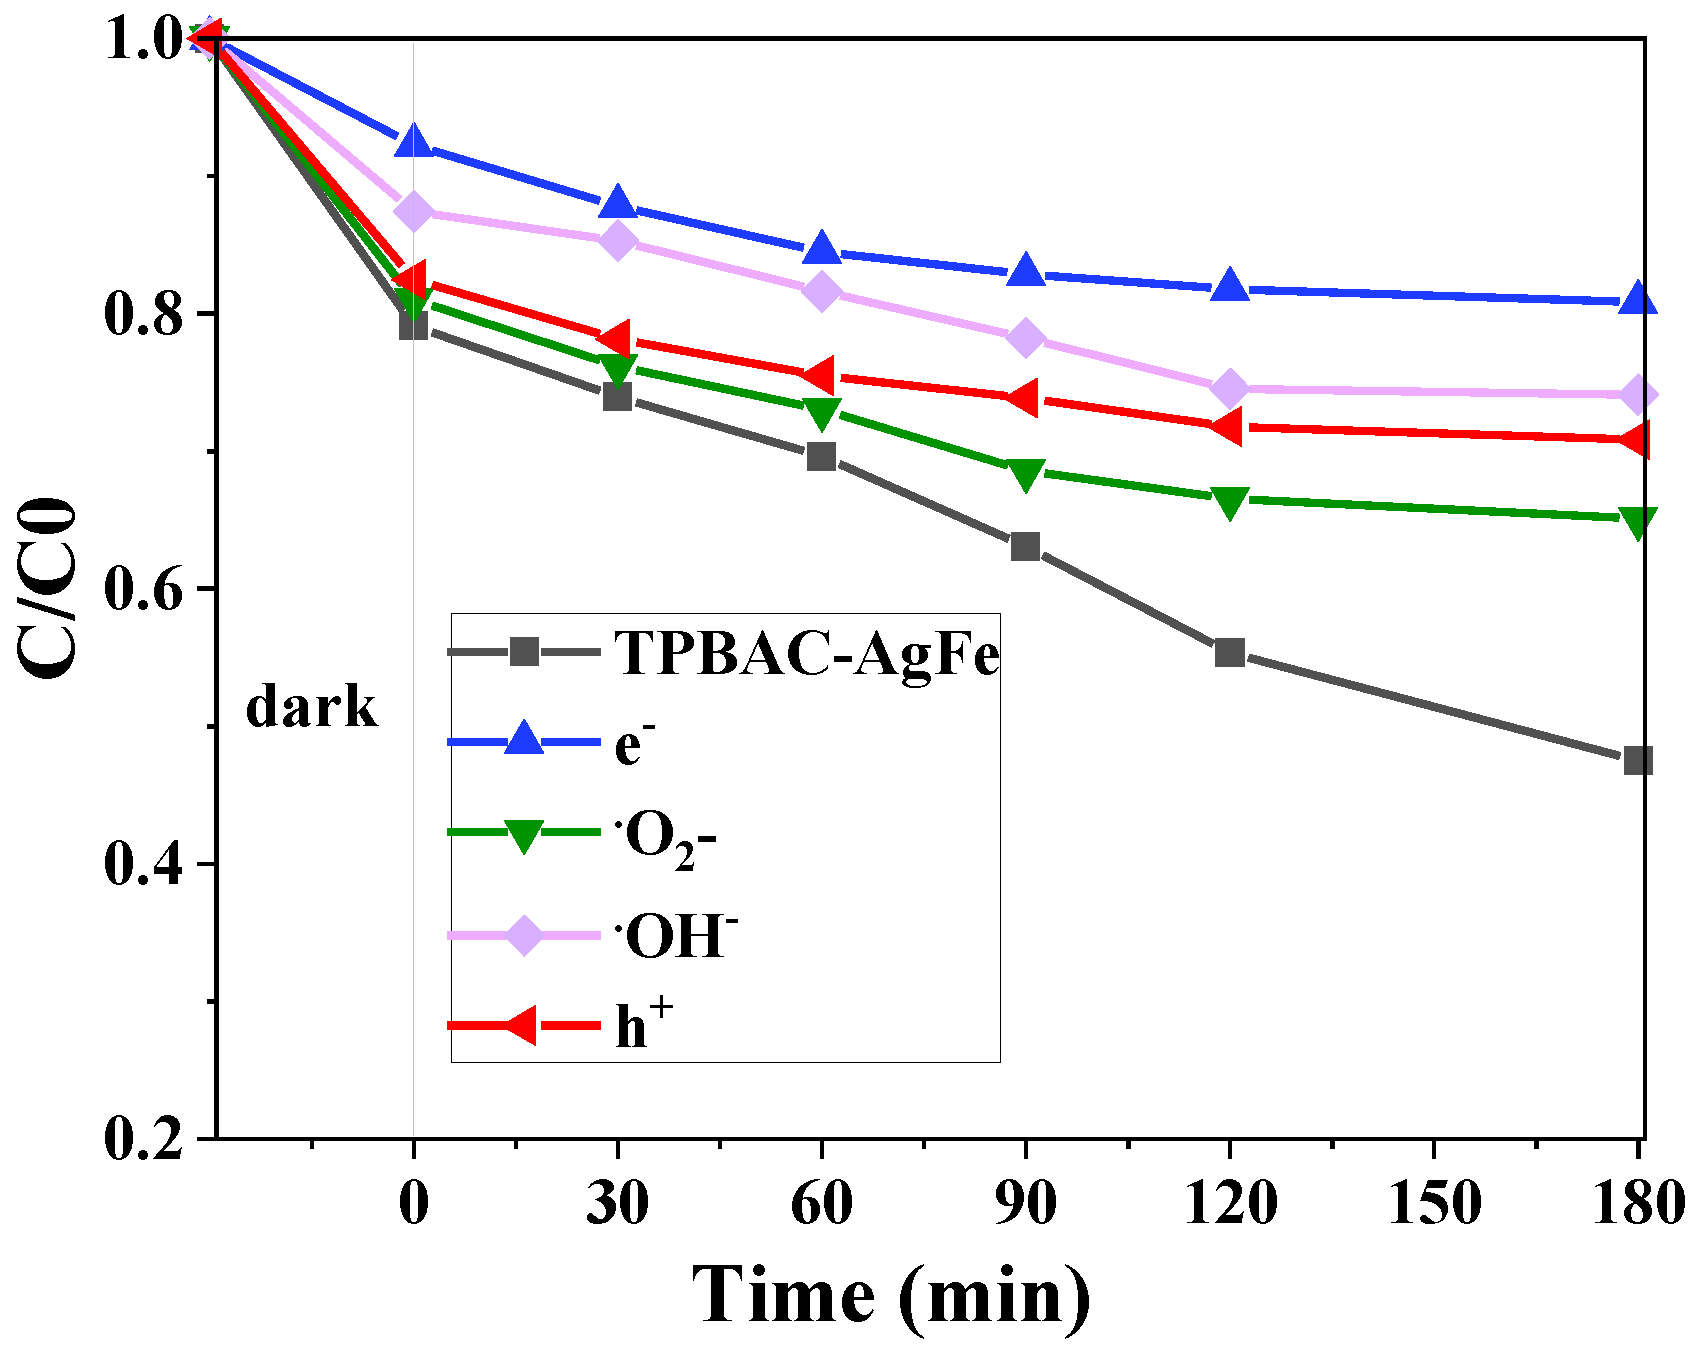
2.3.3. Mechanism of Photocatalytic Reaction

According to previous studies [7,79], Ag0 and AC, with outstanding electrical properties, could act as a bridge between Ag2O, FeOx, and TiO2 to facilitate the separation of photogenerated e-h+ pairs and the transfer process of interfacial electrons. The results of reactions conducted in the presence of scavengers (Figure 18) indicate different effects depending on the composition of the photocatalyst. The experiments utilized potassium iodide, silver nitrate, ethanol, and p-benzoquinone as scavengers for h+, e, •OH, and •O2, respectively. For TPB-Ag, the addition of scavengers for e and h+ resulted in a decrease in the photodegradation of CR dye. A significant reduction in degradation efficiency was observed when an •O2 scavenger was used, while the effect of the •OH scavenger was insignificant. This confirms that, in the case of this sample, the photodegradation reactions primarily occur via •O2 radicals generated by activated electrons, mainly facilitated by the plasmonic effect of Ag nanoparticles. In contrast, for the TPBAC-Fe sample, the introduction of e and •O2scavengers led to a significant increase in the photodegradation of CR dye. It can be considered that, in this case, the equilibrium is probably shifted in favor of the generation of h+ and •OH radicals, which activate the photodegradation process. The significant decrease in conversion when h+ and •OH scavengers are present further confirms that these species are involved in the reaction mechanism. In the case of the association of Ag and Fe on the TPBAC support, we observed a significant decrease in dye photodegradation in the presence of e and •OH scavengers. This suggests an interaction between the two metals and indicates that the presence of Fe3+ ions [31] and less Ag0 on the surface plays a role in the observed effects. Based on the results of reactions carried out in the presence of scavengers and of previous studies with scavengers for TiO2AC-FeOx samples [31], we propose a possible mechanism for CR and CV dye degradation using the Ag-TiO2, Ag-ACTiO2, and AgFe-ACTiO2 photocatalysts under visible light irradiation (Figure 19).The photogenerated electrons under UV irradiation are transferred from the valence band to the conduction band of TiO2. Moreover, photoinduced holes from the valence band of TiO2 can easily move to the valence band of Ag2O.
The photogenerated electrons from the TiO2, Ag2O, and Ag conduction bands arrive on the titanium dioxide surface. These transfers reduce eand h+ recombination, which favors the photocatalytic reaction. Thus, the photogenerated electrons can react with O2 to generate superoxide anion radicals (•O2), whose interaction with CV cationic dye is favored. The interaction of the CR anionic dye is favored by the electron-deficient active sites of the photocatalyst surface. The holes from the surface react with water to generate •OH radicals. Figure 18 indicates that •OH and •O2−are the active species involved in the photodegradation of dyes. The measurements of the PZC values and the corresponding pH levels, carried out in previous studies, indicated PZC values of 6.52 and 6.76, respectively, for the TPBAC and TPBAC-Fe samples [31]. Under these pH conditions, the strong adsorption of the dyes on the surface does not occur, with the reaction being driven by the formation and activity of reactive oxygen species (ROS) such as •OH and •O2−.However, the effect of the pH on CR and CV dye photodegradation (Figure 13) suggests the possibility of the dye’s interaction with different sites formed on the photocatalyst surface with a deficit or excess of electrons. At the same time, the involvement of reactive oxidizing species (•OH and •O2−) in the reactions is different. In the case of these reactions, the photocatalytic degradation efficiency of the dyes is determined by the differences in their adsorption on the acidic or basic centers of the surface.
Under irradiation with light with a wide wavelength range (400–750 nm), the e from the valence bands of iron or silver oxides are activated. These electrons, as well as those generated by plasmonic resonance, are transferred by metallic Ag and AC to the oxygen and water adsorbed on the surface, generating •O2− and •OH radicals.These active species cause the degradation of dyes. The holes from the VB of FeOx and Ag2O can migrate to their CBs, and electrons from the VB of TiO2 migrate to the VBs of the photoactivated oxides. The electrons from the CBs of TiO2, iron, and silver oxide can migrate to carbon or reduce Fe3+ ions, generating Fe2+ [80]. The electrons from the carbon surface and the superficial Fe2+ ions interact with the adsorbed oxygen molecules, forming •O2 radicals. Both the holes and the formed iron ions react with the adsorbed H2O to create •OH radicals. The presence of both Fe2+ and Fe3+ in the case of the TPBAC-AgFe sample favors the oxidation of both Fe2+ and water with the formation of •OH radicals.

3. Materials and Methods

3.1. Materials

Titanium (IV) ethoxide (Merck, Darmstadt, Germany), titanium (IV, Marion, NC, USA) isopropoxide (Fluka, Buchs, Switzerland), and titanium butoxide (Acros Organics, Waltham, MA, USA) were used as titania precursors; Brij-58 (polyethylene glycol hexadecyl ether) was used as a nonionic surfactant and cetyltrimethylammonium bromide (CTAB) as a cationic surfactant, both from Merck; and silver nitrate (Merck, Darmstadt, Germany) and iron nitrate (Sigma Aldrich, St. Louis, MO, USA) were used for silver and iron impregnation, respectively. Other materials used in the synthesis were hydrochloric acid (37%) and isopropanol from Sigma Aldrich (St. Louis, MO, USA), as well as 2-hydroxyterephthalic acid (Sigma Aldrich, St. Louis, MO, USA). The dyes degraded in the photocatalytic tests were Red Congo and Crystal Violet from Merck (Darmstadt, Germany).

3.2. Synthesis

TiO2 samples were obtained by the sol–gel method using titanium isopropoxide (TP), titanium ethoxide (TE), and titanium butoxide (TB) as Ti precursors. For the synthesis, a nonionic (polyethylene glycol hexadecyl ether—Brij58), cationic(cetyltrimethylammonium bromide—CTAB), or anionic (sodium dodecyl sulfate—SDS) surfactant was also used. Thus, three syntheses were carried out, using Brij58 as a surfactant and varying the precursor (Table 1). First, 4.5 g of Brij58 was dispersed in 20 mL of 0.1N HCl solution and stirred for 2 h at 40°C. In the obtained solution, a 180 mL solution of titanium alkoxide (0.07M) in isopropanol was added dropwise. After 4 h of stirring, the mixture was transferred into a Petri dish, where it was kept for 24 h at room temperature. The obtained gel was dried at 80°C and calcined in air at 450°C (rate: 2 °C/min) for 6 h. The obtained TiO2 samples were named TPB, TEB, and TBB. Two other samples were obtained using the same titanium precursor (TB) and 4 × 10⁻³ moles of surfactant (CTAB or SDS). The procedure was similar to that described above. The names of the samples obtained were TBCb and TBS.
The sample TPBAC was prepared with TP, Brij58, and AC using a procedure that was described previously [31].
The obtained supports, TPB and TPBAC, were then impregnated with aqueous solutions of AgNO3 and/or Fe(NO3)3, respectively. The concentrations of the solutions were calculated to obtain photocatalysts with around 1% of each metal. After impregnation, the materials were kept for 24 h at room temperature and dried for 24 h at 80 °C. The calcination program was similar to that indicated above. The names of the obtained samples were TPB-Ag, TPBAC-Ag, TPBAC-Fe, and TPBAC-AgFe.

3.3. Characterization Techniques

The crystalline structure was characterized using X-ray diffraction with a Rigaku Ultima IV diffractometer (Rigaku Corp., Tokyo, Japan) with a scintillation counter detector and CuKα radiation λ = 0.15418 nm, operating at 40 kV and 30 mA. The measurements were performed between 10° and 80°, with a step size of 0.02° and speed of 2°/min. XRD data were analyzed using the PDXL version 1.8 software (Rigaku, Tokyo, Japan). The crystallite size (DA) was calculated using the Scherrer equation along the (101) diffraction plane:
D = Kλ/βcos
where DA is the average crystallite size in nm, K is the shape factor (0.9), λ is the wavelength of the X-ray radiation (Cu Kα = 0.15406 nm), and β is the full width at half maximum (FWHM).
Textural features were obtained by nitrogen physisorption at −196 °C, performed with a Micromeritics ASAP 2020 automated gas adsorption analyzer. Prior to this, the samples were degassed at 200 °C for 4 h under a vacuum.
The morphologies and microstructures of the samples were explored by scanning electron microscopy (SEM) using an FEI Quanta 3D FEG.
X-ray photoelectron spectroscopy (XPS) measurements were carried out on the Thermo Fisher EscaLab 250Xi+ equipment (Waltham, MA, USA) with a thin anode (Al and Ag). A monochromatized 1486.6 eV Al Kα line was used as an X-ray source, with the beam diameter adjusted at 900 μm. The sample charging was compensated for using the supplied Ar+ flood gun of the Escalab system, and calibration for the residual electrostatic charge shift in the measured spectra was performed by using the Ag 3d3/2 363.4 eV and 3d5/2 367.4 eV (Ag2O) lines. The measured shift was smaller than 0.28 eV, comparable to the scan resolution.
The experimental UV resonance Raman spectra of the analyzed samples were recorded using a LABRAM HR800 spectrometer. The samples were excited with a 325 nm laser, focused through a 40× NUV/0.47 microscope objective.
PL spectra were recorded using a FLSP920 fluorimeter from Edinburgh Instruments (Livingston, UK). The excitation wavelength was 325 nm. The slits for all measurements were 10 nm for excitation and 10 nm for emission.
The optical properties of the samples were followed using a Perkin Elmer Lambda 35 spectrophotometer (Shelton, CT, USA). The reflectance measurements were transformed into absorbance using the Kubelka–Munk formalism.
To evaluate the reducibility of the photocatalysts using H2-temperature programmed reduction, 50 mg of the sample was heated from room temperature to 1073 K at a rate of 10 K·min−1 in a stream of 5% H2/Ar.

3.4. Photocatalytic Degradation Experiments

The photocatalytic activity of the synthesized materials was evaluated in the degradation of two different dyes: Congo Red (CR) and Crystal Violet (CV).
The UV experiments were carried out at room temperature in quartz mini-reactors containing 8 mL aqueous solutions of each dye (CR: 5 × 10⁻⁵ M; CV: 2 × 10⁻⁵ M concentration) and 1.5 mg photocatalyst. The mixture was stirred using a magnetic stirrer, kept for 30 min in the dark to reach the adsorption/desorption equilibrium, and then irradiated with a UV lamp for 180 min. Then,3 mL of the suspension was withdrawn at various time intervals, centrifuged, and analyzed using a Perkin Elmer Lambda 35 UV–Vis spectrophotometer. The same procedure was followed under visible irradiation (LED source: 400–750 nm, 24 W, luminous flux 2700 lm), except that the amount of catalyst was 10 mg in 20 mL of dye solution. The pH of the solution was adjusted using NaOH or HCl diluted solutions.
The photocatalytic activity of the samples was quantitatively evaluated by determining the efficiency (η%) of dye degradation, based on the equation
η = [(C0 − C)/C0]·100
where C0 represents the concentration of the dye solution measured before irradiation and C is the concentration of the dye solution at time t.
To obtain information regarding the reaction mechanism, 0.1 mmol each of potassium iodide, silver nitrate, ethanol, and p-benzoquinone was added to the CR solution as h+, e, •OH, and •O2 scavengers, respectively. The procedure was similar to that of the photocatalytic experiments.

4. Conclusions

The present study investigated the effects of titanium precursors and surfactants on the properties of the resulting TiO2 materials. A significant influence of these parameters on the texture was observed, while the crystalline structure and morphology remained unchanged.
Based on the characteristics of the synthesized titanium oxides, the one produced starting from titanium isopropoxide in the presence of the nonionic surfactant Brij 58 was chosen to serve as a support for Ag. Under similar synthesis conditions, but with the addition of activated carbon, another support for Ag, iron (Fe), and a combination of Ag and Fe was obtained. The XPS and TPR results of the obtained photocatalysts revealed the effect of interactions between Ag and Fe on their reducibility. Hence, higher values of the Ag0/Ag+ ratio were observed in the absence of iron, while the presence of Ag caused Fe3+ to not be reduced. In the sample containing both Ag and Fe, two iron oxide species (Fe2O3 and FeO) were identified, which were reduced at different temperatures. In contrast, the sample containing only Fe exhibited FeO that was reduced at a higher temperature (between 400 and 650 °C).
The UV–Vis spectra indicated a significant reduction in plasmonic absorption, characteristic of silver, for samples with activated carbon and Fe.
Under visible light irradiation, a significant increase in the efficiency of dye photodegradation was evidenced for the sample with the highest surface plasmon resonance absorption (TPB-Ag).
In conclusion, the activity of photocatalysts decreases in the presence of activated carbon and through the association of silver with iron on the TiO2-AC support. Compared to the results published in the literature for similar reactions, the results obtained in the photodegradation of the CV dye can be considered to be among the best. High activity was also obtained in the photodegradation of CR or CV under acidic and basic conditions, respectively, compared to published data.

Supplementary Materials

The following supporting information can be downloaded at: https://www.mdpi.com/article/10.3390/catal15050479/s1. Figure S1: TEM images of TPBAC-Ag sample; Figure S2: Ti2p XPS deconvoluted spectra of the modified TiO2 with activated carbon and Ag and AgFe; Figure S3: O1s XPS deconvoluted spectra of TiO2 samples modified with activated carbon and Ag or AgFe and of TiO2 modified with Ag; Figure S4: C1s XPS deconvoluted spectra of the modified TiO2 with activated carbon and Ag and AgFe; Figure S5: P2p XPS spectra of the modified TiO2 samples with activated carbon and Ag or AgFe; Figure S6: Absorbance spectra obtained during the photocatalytic degradation of dyes over TPB-Ag; Table S1: Atomic ratios obtained from XPS measurements for metal species in different oxidation states; Table S2: Binding energies of the main peaks obtained for Ag-, Fe-, and C-modified samples from XPS measurements; Table S3: Hydrogen consumption from TPR results.

Author Contributions

D.N.: Conceptualization, Investigation, Methodology, Validation, Writing—Original Draft; I.A.: Investigation, Formal Analysis, Validation, M.G.: Investigation, Formal Analysis; D.C.C.: Investigation, Formal Analysis, Validation; A.B.: Investigation, Formal Analysis; S.P.: Investigation, Formal Analysis, Validation; V.B.: Investigation, Methodology, Validation, Writing—Original Draft, Writing—Review and Editing; V.P.: Conceptualization, Methodology, Project Administration, Investigation Supervision, Validation, Formal Analysis, Writing—Original Draft, Writing—Review and Editing. All authors have read and agreed to the published version of the manuscript.

Funding

This research received no external funding.

Data Availability Statement

The data presented in this study are available on request from the corresponding author.

Conflicts of Interest

The authors declare no conflicts of interest.

References

  1. Wang, X.; Jiang, J.; Gao, W. Reviewing textile wastewater produced by industries: Characteristics, environmental impacts, and treatment strategies. Water Sci. Technol. 2022, 85, 2076–2096. [Google Scholar] [CrossRef] [PubMed]
  2. Periyasamy, A.P. Recent Advances in the Remediation of Textile-Dye-Containing Wastewater: Prioritizing Human Health and Sustainable Wastewater Treatment. Sustainability 2024, 16, 495. [Google Scholar] [CrossRef]
  3. Islam, T.; Repon, M.R.; Islam, T.; Sarwar, Z.; Rahman, M.M. Impact of textile dyes on health and ecosystem: A review of structure, causes, and potential solutions. Environ. Sci. Pollut. Res. 2023, 30, 9207–9242. [Google Scholar] [CrossRef]
  4. Zaharia, C.; Suteu, D. Textile organic dyes—Characteristics, polluting effects and separation/elimination procedures from industrial effluents—A critical overview. In Organic Pollutants Ten Years After the Stockholm Convention—Environmental and Analytical Update; Puzyn, T., Mostrag-Szlichtyng, A., Eds.; IntechOpen: Rijeka, Croatia, 2012; Volume 3, pp. 55–86. [Google Scholar]
  5. Sahoo, C.; Gupta, A.K.; Pal, A. Photocatalytic degradation of Crystal Violet (C.I. Basic Violet 3) on silver ion doped TiO2. Dye. Pigment. 2005, 66, e189–e196. [Google Scholar] [CrossRef]
  6. Naseem, K.; Farooqi, Z.H.; Begum, R.; Irfan, A. Removal of Congo red dye from aqueous medium by its catalytic reduction using sodium borohydride in the presence of various inorganic nano-catalysts: A review. J. Clean. Prod. 2018, 187, e296–e307. [Google Scholar] [CrossRef]
  7. Negoescu, D.; Atkinson, I.; Gherendi, M.; Culita, D.C.; Baran, A.; Petrescu, S.; Trica, B.; Pelinescu, D.; Ionescu, R.; Bratan, V.; et al. Brij 58–activated carbon assisted synthesis of Ag/Ag2O/TiO2-AC photocatalysts for efficient organic pollutants degradation. J. Alloys Compd. 2023, 931, 167528. [Google Scholar] [CrossRef]
  8. Hammud, H.H.; Traboulsi, H.; Karnati, R.K.; Bakir, E.M. Photodegradation of Congo Red by Modified P25-Titanium Dioxide with Cobalt-Carbon Supported on SiO2 Matrix, DFT Studies of Chemical Reactivity. Catalysts 2022, 12, 248. [Google Scholar] [CrossRef]
  9. Armaković, S.J.; Savanović, M.M.; Armaković, S. Titanium dioxide as the most used photocatalyst for water purification: An overview. Catalysts 2022, 13, 26. [Google Scholar] [CrossRef]
  10. Negoescu, D.; Culita, D.C.; Atkinson, I.; Bratan, V.; Petrescu, S.; Parvulescu, V. Ti-SBA-15 Mesoporous photocatalysts modified with lanthanides for degradation of dyes in aqueous solution. Rev. Roum. Chim. 2021, 66, 287. [Google Scholar] [CrossRef]
  11. Predoană, L.; Ciobanu, E.M.; Petcu, G.; Preda, S.; Pandele-Cușu, J.; Anghel, E.M.; Petrescu, S.V.; Culita, D.C.; Baran, A.; Surdu, V.-A.; et al. Photocatalytic Performance of Sn–Doped TiO2 Nanopowders for Photocatalytic Degradation of Methyl Orange Dye. Catalysts 2023, 13, 534. [Google Scholar] [CrossRef]
  12. Shabir, M.; Yasin, M.; Hussain, M.; Shafiq, I.; Akhter, P.; Nizami, A.-S.; Jeon, B.-H.; Park, Y.-K. A review on recent advances in the treatment of dye-polluted wastewater. J. Ind. Eng. Chem. 2022, 112, 1–19. [Google Scholar] [CrossRef]
  13. Katheresan, V.; Kansedo, J.; Lau, S.Y. Efficiency of various recent wastewater dye removal methods: A review. J. Environ. Chem. Eng. 2018, 6, 4676–4697. [Google Scholar] [CrossRef]
  14. Deng, Y.; Zhao, R. Advanced oxidation processes (AOPs) in wastewater treatment. Curr. Pollut. Rep. 2015, 1, 167–176. [Google Scholar] [CrossRef]
  15. Li, Z.; Wang, S.; Wu, J.; Zhou, W. Recent progress in defective TiO2 photocatalysts for energy and environmental applications. Renew. Sustain. Energy Rev. 2022, 156, 111980. [Google Scholar] [CrossRef]
  16. Chauke, N.M.; Mohlala, R.L.; Ngqoloda, S.; Raphulu, M.C. Harnessing visible light: Enhancing TiO2 photocatalysis with photosensitizers for sustainable and efficient environmental solutions. Front. Chem. Eng. 2024, 6, 1356021. [Google Scholar] [CrossRef]
  17. Niu, B.; Wang, X.; Wu, K.; He, X.; Zhang, R. Mesoporous Titanium Dioxide: Synthesis and Applications in Photocatalysis, Energy and Biology. Materials 2018, 11, 1910. [Google Scholar] [CrossRef]
  18. Zhang, K.; Wang, X.; Guo, X.; Dai, J.; Xiang, J. Fast Sol–Gel Method to Prepare Mesoporous TiO2 with High Photocatalytic Activity. Nano 2015, 10, 1550001. [Google Scholar] [CrossRef]
  19. Kachbouri, S.; Elaloui, E.; Moussaoui, Y. The Effect of Surfactant Chain Length and Type on the Photocatalytic Activity of Mesoporous TiO2 Nanoparticles Obtained via Modified Sol-Gel Process. Iran. J. Chem. Chem. Eng. 2019, 93, 17. [Google Scholar]
  20. Muniz, E.C.; Góes, M.S.; Silva, J.J.; Varela, J.A.; Joanni, E.; Parra, R.; Bueno, P.R. Synthesis and characterization of mesoporous TiO2 nanostructured films prepared by a modified sol–gel method for application in dye solar cells. Ceram. Int. 2011, 37, 1017. [Google Scholar] [CrossRef]
  21. Petronella, F.; Truppi, A.; Dell’Edera, M.; Agostiano, A.; Curri, M.L.; Comparelli, R. Scalable Synthesis of Mesoporous TiO2 for Environmental Photocatalytic Applications. Materials 2019, 12, 1853. [Google Scholar] [CrossRef]
  22. Velázquez-Martínez, S.; Silva-Martínez, S.; Pineda-Arellano, C.A.; Jiménez-González, A.; Salgado-Tránsito, I.; Morales-Pérez, A.A.; Peña-Cruz, M.I. Modified sol-gel/hydrothermal method for the synthesis of microsized TiO2 and iron-doped TiO2, its characterization and solar photocatalytic activity for an azo dye degradation. J. Photochem. Photobiol. A Chem. 2018, 359, 93. [Google Scholar] [CrossRef]
  23. Islam, M.T.; Roni, M.N.P.; Ali, M.Y.; Islam, M.R.; Hossan, M.S.; Rahman, M.H.; Zahid, A.A.S.M.; Alam, M.N.E.; Hanif, M.A.; Akhtar, M.S. Selectivity of Sol-Gel and Hydrothermal TiO2 Nanoparticles towards Photocatalytic Degradation of Cationic and Anionic Dyes. Molecules 2023, 28, 6834. [Google Scholar] [CrossRef]
  24. Cano-Casanova, L.; Amorós-Pérez, A.; Ángeles Lillo-Ródenas, M.; del Carmen Román-Martínez, M. Effect of the Preparation Method (Sol-Gel or Hydrothermal) and Conditions on the TiO2 Properties and Activity for Propene Oxidation. Materials 2018, 11, 2227. [Google Scholar] [CrossRef]
  25. Kao, L.H.; Hsu, T.; Lu, H. Sol–gel synthesis and morphological control of nanocrystalline TiO2 via urea treatment. J. Colloid Interface Sci. 2007, 316, 160–167. [Google Scholar] [CrossRef] [PubMed]
  26. Hou, J.; Zhou, J.; Liu, Y.; Yang, Y.; Zheng, S.; Wang, Q. Constructing Ag2O nanoparticle modified TiO2 nanotube arrays for enhanced photocatalytic performances. J. Alloys Compd. 2020, 849, 56493. [Google Scholar] [CrossRef]
  27. Patil, S.B.; Basavarajappa, P.S.; Ganganagappa, N.; Jyothi, M.S.; Raghu, A.V.; Reddy, K.R. Recent advances in non-metals-doped TiO2 nanostructured photocatalysts for visible-light driven hydrogen production, CO2 reduction and air purification. Int. J. Hydrogen Energy 2019, 44, 13022. [Google Scholar] [CrossRef]
  28. Yalçin, Y.; Kiliç, M.; Cinar, Z. The Role of Non-Metal Doping in TiO2 Photocatalysis. J. Adv. Oxid. Technol. 2010, 13, 281. [Google Scholar] [CrossRef]
  29. Kuo, C.-Y.; Jheng, H.-K.; Siang-En Syu, S.-E. Effect of non-metal doping on the photocatalytic activity of titanium dioxide on the photodegradation of aqueous bisphenol A. Environ. Technol. 2021, 42, 1603. [Google Scholar] [CrossRef]
  30. Sultana, M.; Mondal, A.; Islam, S.; Khatun, M.A.; Rahaman, M.H.; Chakraborty, A.K.; Rahman, M.S.; Rahman, M.M.; Nur, A.S.M. Strategic development of metal doped TiO2 photocatalysts for enhanced dye degradation activity under UV–Vis irradiation: A review. Curr. Res. Green Sustain. 2023, 7, 100383. [Google Scholar] [CrossRef]
  31. Negoescu, D.; Bratan, V.; Gherendi, M.; Atkinson, I.; Culita, D.C.; Neacsu, A.; Baran, A.; Petrescu, S.; Parvulescu, V. Iron Promoted TiO2-Activated Carbon Nanocomposites for Photocatalytic Degradation of Congo Red in Water. Catalysts 2024, 14, 844. [Google Scholar] [CrossRef]
  32. Peñas-Garzón, M.; Gómez-Avilés, A.; Belver, C.; Rodriguez, J.J.; Bedia, J. Degradation pathways of emerging contaminants using TiO2-activated carbon heterostructures in aqueous solution under simulated solar light. J. Chem. Eng. 2020, 392, 124867. [Google Scholar] [CrossRef]
  33. Ren, W.; Ai, Z.; Jia, F.; Zhang, L.; Fan, X.; Zou, Z. Low temperature preparation and visible light photocatalytic activity of mesoporous carbon-doped crystalline TiO2. Appl. Catal. B Environ. 2007, 69, 138. [Google Scholar] [CrossRef]
  34. Wang, X.; Xue, X.; Liu, X.; Xing, X.; Li, Q.; Yang, J. Synergistic effect of single-electron-trapped oxygen vacancies and carbon species on the visible light photocatalytic activity of carbon-modified TiO2. Mater. Chem. Phys. 2015, 153, 117. [Google Scholar] [CrossRef]
  35. Kanakaraju, D.; Diwvyaanak Kutiang, F.; Lim, Y.C.; Goh, P.S. Recent progress of Ag/TiO2 photocatalyst for wastewater treatment: Doping, co-doping, and green materials functionalization. Appl. Mater. Today 2022, 27, 101500. [Google Scholar] [CrossRef]
  36. Chakhtouna, H.; Benzeid, H.; Zari, N.; el kacem Qaiss, A.; Rachid Bouhfid, R. Recent progress on Ag/TiO2 photocatalysts: Photocatalytic and bactericidal behaviors. Environ. Sci. Pollut. Res. 2021, 28, 44638. [Google Scholar] [CrossRef]
  37. Gogoi, D.; Namdeo, A.; Golder, A.K.; Peela, N.R. Ag-doped TiO2 photocatalysts with effective charge transfer for highly efficient hydrogen production through water splitting. Int. J. Hydrogen Energy 2020, 45, 2729. [Google Scholar] [CrossRef]
  38. Kumar, M.K.; Bhavani, K.; Naresh, G.; Srinivas, B.; Venugopal, A. Plasmonic resonance nature of Ag-Cu/TiO2 photocatalyst under solar and artificial light: Synthesis, characterization and evaluation of H2O splitting activity. Appl. Catal. B Environ. 2016, 199, 282. [Google Scholar]
  39. Leong, K.H.; Gan, B.L.; Ibrahim, S.; Saravanan, P. Synthesis of surface plasmon resonance (SPR) triggered Ag/TiO2 photocatalyst for degradation of endocrine disturbing compounds. Appl. Surf. Sci. 2014, 319, 128. [Google Scholar] [CrossRef]
  40. Wu, F.; Hu, X.; Fan, J.; Liu, E.; Sun, T.; Kang, L.; Hou, W.; Zhu, C.; Liu, H. Photocatalytic Activity of Ag/TiO2 Nanotube Arrays Enhanced by Surface Plasmon Resonance and Application in Hydrogen Evolution by Water Splitting. Plasmon 2013, 8, 501. [Google Scholar] [CrossRef]
  41. Handoko, T.; Moustakas, N.G.; Peppel, T.; Springer, A.; Oropeza, F.E.; Huda, A.; Bustan, M.D.; Yudono, B.; Gulo, F.; Strunk, J. Characterization and effect of Ag(0) vs. Ag(I) species and their localized plasmon resonance on photochemically inactive TiO2. Catalysts 2019, 9, 323. [Google Scholar] [CrossRef]
  42. Awazu, K.; Fujimaki, M.; Rockstuhl, C.; Tominaga, J.; Murakami, H.; Ohki, Y.; Yoshida, N.; Watanabe, T.A. Plasmonic Photocatalyst Consisting of Silver Nanoparticles Embedded in Titanium Dioxide. J. Am. Chem. Soc. 2008, 130, 1676. [Google Scholar] [CrossRef] [PubMed]
  43. Chena, C.; Leic, X.F.; Xue, M.Z. A simple method to synthesise Ag-doped TiO2 photocatalysts with different Ag0:Ag2O atomic ratios for enhancing visible-light photocatalytic activity. J. Chem. Res. 2017, 41, 475. [Google Scholar] [CrossRef]
  44. Han, G.; Kim, J.Y.; Kim, K.-J.; Lee, H.; Kim, Y.-M. Controlling surface oxygen vacancies in Fe-doped TiO2 anatase nanoparticles for superior photocatalytic activities. Appl. Surf. Sci. 2020, 507, 144916. [Google Scholar] [CrossRef]
  45. Adormaa, B.B.; Darkwah, W.K.; Ao, Y. Oxygen vacancies of the TiO2 nano-based composite photocatalysts in visible light responsive photocatalysis. RSC Adv. 2018, 8, 33551. [Google Scholar] [CrossRef]
  46. Galkina, O.L.; Vinogradov, V.V.; Agafonov, A.V.; Vinogradov, A.V. Surfactant-assisted sol-gel synthesis of TiO2 with uniform particle size distribution. Int. J. Inorg. Chem. 2011, 2011, 108087. [Google Scholar] [CrossRef]
  47. Simonsen, M.E.; Søgaard, E.G. Sol–gel reactions of titanium alkoxides and water: Influence of pH and alkoxy group on cluster formation and properties of the resulting products. J. Solgel. Sci. Technol. 2010, 53, 485. [Google Scholar] [CrossRef]
  48. Pandele-Cusu, J.; Petrescu, S.; Preda, S.; Petcu, G.; Ciobanu, M.; Predoana, L. Comparative study of the TiO2 nanopowders prepared from different precursors and chemical methods for heterogeneous photocatalysis application. J. Therm. Anal. Calorim. 2022, 147, 13111. [Google Scholar] [CrossRef]
  49. Thommes, M.; Kaneko, K.; Neimark, A.V.; Olivier, J.P.; Rodriguez-Reinoso, F.; Jean Rouquerol, J.; Sing, K.S.W. Physisorption of gases, with special reference to the evaluation of surface area and pore size distribution (IUPAC Technical Report). Pure Appl. Chem. 2015, 87, 1051. [Google Scholar] [CrossRef]
  50. Ismail, M.A.; Hedhili, M.N.; Anjum, D.H.; Singaravelu, V.; Chung, S.H. Synthesis and Characterization of Iron-Doped TiO2 Nanoparticles Using Ferrocene from Flame Spray Pyrolysis. Catalysts 2021, 11, 438. [Google Scholar] [CrossRef]
  51. Tabakova, T.; Nikolova, D.; Ivanov, I.; Anghel, E.M.; Karashanova, D.; Karakirova, Y.; Venezia, A.M.; Vakros, J.; Crişan, M.; Tenchev, K.; et al. Study of ceria-doped Au/TiO2 catalysts for boosting hydrogen production by water-gas shift reaction. Int. J. Hydrogen Energy 2024, 70, 389. [Google Scholar] [CrossRef]
  52. Cui, Y.; Ma, Q.; Deng, X.; Meng, Q.; Cheng, X.; Xie, M.; Li, X.; Cheng, Q.; Liu, H. Fabrication of Ag-Ag2O/reduced TiO2 nanophotocatalyst and its enhanced visible light driven photocatalytic performance for degradation of diclofenac solution. Appl. Catal. B Environ. 2017, 206, 136. [Google Scholar] [CrossRef]
  53. Indudhar, P.V.; Anusha, B.S.; Pruthvija, M.; Savitha, S.; Ravindra, S.; Nagaveni, M.; Poojitha, P.S.; Swathi, N. Bamboo and coconut shell based activated carbon: A Raman spectroscopic study. Mater. Chem. Phys. 2024, 318, 129240. [Google Scholar]
  54. Vasquez, C.G.; Andrea Peche-Herrero, M.; Maestre, D.; Aleman, B.; Ramırez-Castellanos, J.; Cremades, A.; Gonzalez-Calbet, J.M.; Piqueras, J. Influence of Fe and Al doping on the stabilization of the anatase phase in TiO2 nanoparticles. J. Mater. Chem. C 2014, 2, 10377. [Google Scholar] [CrossRef]
  55. Yu, C.C.; Chiang, K.Y.; Okuno, M.; Seki, T.; Ohto, T.; Yu, X.; Korepanov, V.; Hamaguchi, H.; Nagata, Y. Vibrational couplings and energy transfer pathways of water’s bending mode. Nat. Commun. 2020, 11, 5977. [Google Scholar] [CrossRef] [PubMed]
  56. Gao, Z.; Fu, F.; Niu, L.; Jin, M.; Wang, X. Effect of support on hydrogen generation over iron oxides in the chemical looping process. RSC Adv. 2021, 11, 37552. [Google Scholar] [CrossRef] [PubMed]
  57. Grosvenor, A.P.; Kobe, B.A.; Biesinger, M.C.; McIntyre, N.S. Investigation of multiplet splitting of Fe 2p XPS spectra and bonding in iron compounds. Surf. Interface Anal. 2004, 36, 1564. [Google Scholar] [CrossRef]
  58. Xue, J.; Bao, J. Interfacial charge transfer of heterojunction photocatalysts: Characterization and calculation. Surf. Interfaces 2010, 25, 101265. [Google Scholar] [CrossRef]
  59. Zhang, L.; Mohamed, H.H.; Dillert, R.; Bahnemann, D. Kinetics and mechanisms of charge transfer processes in photocatalytic systems: A review. J. Photochem. Photobio. C Photochem. Rev. 2012, 13, 263–276. [Google Scholar] [CrossRef]
  60. State, R.-N.; Morosan, M.-A.; Cretu, L.; Straca, A.-I.; Vasile, A.; Bratan, V.; Culita, D.; Atkinson, I.; Balint, I.; Papa, F. The Effect of the Metal Oxide as the Support for Silver Nanoparticles on the Catalytic Activity for Ammonia Ozonation. Catalysts 2025, 15, 104. [Google Scholar] [CrossRef]
  61. Loan, T.T.; Long, N.N. Effect of Co2+ doping on Raman spectra and the phase transformation of TiO2: Co2+ nanowires. J. Phys. Chem. Solids 2019, 124, 336–342. [Google Scholar] [CrossRef]
  62. Ghamsari, M.S.; Gaeeni, M.R.; Han, W.; Park, H.H. Highly stable colloidal TiO2 nanocrystals with strong violet-blue emission. J. Lumin. 2016, 178, 89. [Google Scholar] [CrossRef]
  63. Rej, S.; Hejazi, S.H.; Badura, Z.; Zoppellaro, G.; Kalytchuk, S.; Kment, S.; Fornasiero, P.; Naldoni, A. Light-induced defect formation and Pt single atoms synergistically boost photocatalytic H2 production in 2D TiO2-bronze nanosheets. ACS Sustain. Chem. Eng. 2022, 10, 17286. [Google Scholar] [CrossRef]
  64. Csillag, K.; Emri, T.; Rangel, D.E.; Pócsi, I. pH-dependent effect of Congo Red on the growth of Aspergillus nidulans and Aspergillus niger. Fungal Biol. 2023, 127, 1180. [Google Scholar] [CrossRef] [PubMed]
  65. Abbas, M.; Harrache, Z.; Trari, M. Removal of gentian violet in aqueous solution by activated carbon equilibrium, kinetics, and thermodynamic study. Adsorpt. Sci. Technol. 2019, 37, 566. [Google Scholar] [CrossRef]
  66. Boulahbel, H.; Benamira, M.M.; Bouremmad, F.; Ahmia, N.; Kiamouche, S.; Lahmar, H.; Souici, A.; Trari, M. Enhanced photodegradation of Congo red dye under sunlight irradiation by p-n NiFe2O4/TiO2 heterostructure. Inorg. Chem. Commun. 2023, 154, 110921. [Google Scholar] [CrossRef]
  67. Wahab, H.S.; Hussain, A.A. Photocatalytic oxidation of phenol red onto nanocrystalline TiO2 particles. J. Nanostruct. Chem. 2016, 6, 261. [Google Scholar] [CrossRef]
  68. Reza, K.M.; Kurny, A.S.W.; Gulshan, F. Parameters affecting the photocatalytic degradation of dyes using TiO2: A review. Appl. Water Sci. 2017, 7, 1569. [Google Scholar] [CrossRef]
  69. Liu, D.; Wu, Z.; Tian, F.; Ye, B.C.; Tong, Y. Synthesis of N and La co-doped TiO2/AC photocatalyst by microwave irradiation for the photocatalytic degradation of naphthalene. J. Alloys Compd. 2016, 676, 489. [Google Scholar] [CrossRef]
  70. Shaban, M.; Abukhadra, M.R.; Ibrahim, S.S.; Shahien, M.G. Photocatalytic degradation and photo-Fenton oxidation of Congo red dye pollutants in water using natural chromite-response surface optimization. Appl. Water Sci. 2017, 7, 4743. [Google Scholar] [CrossRef]
  71. Elaziouti, A.; Ahmed, B. ZnO-Assisted Photocatalytic Degradation of Congo Red and Benzopurpurine 4B in Aqueous Solution. J. Chem. Eng. Process Technol. 2011, 2, 1. [Google Scholar]
  72. Fowsiya, J.; Madhumitha, G.; Al-Dhabi, N.A.; Arasu, M.V. Photocatalytic degradation of Congo red using Carissa edulis extract capped zinc oxide nanoparticles. J. Photochem. Photobiol. B Biol. 2016, 162, 395. [Google Scholar] [CrossRef] [PubMed]
  73. Ali, N.; Said, A.; Ali, F.; Raziq, F.; Ali, Z.; Bilal, M.; Reinert, L.; Begum, T.; Iqbal, H.M.N. Photocatalytic Degradation of Congo Red Dye from Aqueous Environment Using Cobalt Ferrite Nanostructures: Development, Characterization, and Photocatalytic Performance. Water Air Soil Pollut. 2020, 231, 50. [Google Scholar] [CrossRef]
  74. Hitkari, G.; Chowdhary, P.; Kumar, V.; Singh, S.; Motghare, A. Potential of Copper-Zinc Oxide nanocomposite for photocatalytic degradation of congo red dye. Clean. Chem. Eng. 2022, 1, 100003. [Google Scholar] [CrossRef]
  75. Turcu, E.; Coromelci, C.G.; Harabagiu, V.; Ignat, M. Enhancing the Photocatalytic Activity of TiO2 for the Degradation of Congo Red Dye by Adjusting the Ultrasonication Regime Applied in Its Synthesis Procedure. Catalysts 2023, 13, 345. [Google Scholar] [CrossRef]
  76. Magdalane, C.M.; Priyadharsini, G.M.A.; Kaviyarasu, K.; Jothi, A.I.; Simiyon, G.G. Synthesis and characterization of TiO2 doped cobalt ferrite nanoparticles via microwave method: Investigation of photocatalytic performance of congo red degradation dye. Surf. Interfaces 2021, 25, 101296. [Google Scholar] [CrossRef]
  77. Saeed, M.; Albalawi, K.; Khan, I.; Akram, N.; Abd El-Rahim, I.H.; Alhag, S.K.; Ahmed, A.E. Synthesis of pn NiO-ZnO heterojunction for photodegradation of crystal violet dye. Alex. Eng. J. 2023, 65, 561. [Google Scholar] [CrossRef]
  78. Habib, M.A.; Muslim, M.; Shahadat, M.T.; Islam, M.N.; Ismail, I.M.I.; Islam, T.S.A.; Mahmood, A.J. Photocatalytic decolorization of crystal violet in aqueous nano-ZnO suspension under visible light irradiation. J. Nanostruct. Chem. 2013, 3, 70. [Google Scholar] [CrossRef]
  79. Hu, X.; Zhu, Q.; Wang, X.; Kawazoe, N.; Yang, Y. Nonmetal-Metal-Semiconductor-Promoted P/Ag/Ag2O/Ag3PO4/TiO2 Photocatalyst with Superior Photocatalytic Activity and Stability. J. Mater. Chem. 2015, 3, 17858. [Google Scholar] [CrossRef]
  80. Wang, C.; Zhan, Z.; Liu, H.; Li, Y.; Wu, J.; Sun, P.; Shen, G. Single-atom iron cocatalyst for highly enhancing TiO2 photocatalytic degradation of antibiotics and antibiotic-resistant genes. Chem. Eng. J. 2024, 482, 148906. [Google Scholar] [CrossRef]
Figure 1. XRD patterns of the synthesized mesoporous TiO2 samples.
Catalysts 15 00479 g001
Figure 2. N2 adsorption–desorption isotherms (a) and pore size distributions (b) of TiO2 samples.
Catalysts 15 00479 g002
Figure 3. Nitrogen adsorption–desorption isotherms (a) and pore size distributions (b) of modified TiO2 samples with AC, Ag, and Fe.
Catalysts 15 00479 g003
Figure 4. SEM images of modified TiO2 samples.
Catalysts 15 00479 g004
Figure 5. Raman spectra of the modified samples based on TiO2.
Catalysts 15 00479 g005
Figure 6. Ag3d XPS spectra for TPB-Ag, TPBAC-Ag, and TPBAC-AgFe samples.
Catalysts 15 00479 g006
Figure 7. Fe2p XPS spectra for TPBAC-Fe and TPBAC-AgFe samples.
Catalysts 15 00479 g007
Figure 8. H2-TPR profiles for TiO2-AC samples modified with Ag and Fe.
Catalysts 15 00479 g008
Figure 9. PL spectra of the photocatalysts obtained by TiO2 modification.
Catalysts 15 00479 g009
Figure 10. UV–Vis spectra of doped TiO2 samples.
Catalysts 15 00479 g010
Figure 11. UV–Vis spectra and structures of unprotonated Congo Red (a) and Crystal Violet in cationic form (b); variations in their color with pH.
Catalysts 15 00479 g011
Figure 12. Effects of photocatalyst amount on photodegradation of CR or CV dye solutions (as-prepared solution of 5 × 10⁻⁵ M and 2 × 10⁻⁵ M conc. for CR and CV, respectively; irradiation time: 180 min for CR and 150 min for CV degradation).
Catalysts 15 00479 g012
Figure 13. Effects of pH on CR (a) and CV (b) dye photodegradation using TPB-Ag photocatalyst (187.5 mg/L catalyst amount; 5 × 10⁻⁵ M concentration of CR solution; 2 × 10⁻⁵ M concentration of CV solution).
Catalysts 15 00479 g013
Figure 14. Variations in the photocatalytic efficiency with the pH for CR (a) and CV (b) degradation with and without a photocatalyst (5 × 10⁻⁵ M concentration of CR solution; 2 × 10⁻⁵ M concentration of CV solution; 187.5 mg/L photocatalyst amount; time of reaction: 180 min for CR and 150 min for CV, respectively; for CV degradation over TPB-Ag at a basic pH, the time was considered 90 min, the time necessary to obtain almost total degradation).
Catalysts 15 00479 g014
Figure 15. Visible photodegradation of CR (a) and CV (b) dyes in the presence of the modified TiO2 photocatalysts (500 mg/g amount of catalyst; pH 5; irradiation time: 180 min).
Catalysts 15 00479 g015
Figure 16. Kinetic analysis of photodegradation over various catalysts considering first-order mechanism: (a) CR dye, (b) CV dye.
Catalysts 15 00479 g016
Figure 17. Reusability of the TPB-Ag sample in the photodegradation of a CV aqueous solution (2 × 10⁻⁵ M) under visible irradiation; 3 h per cycle.
Catalysts 15 00479 g017
Figure 18. Proposed mechanisms for dye photodegradation under UV and visible light.
Catalysts 15 00479 g018
Figure 19. CR photodegradation in the presence of scavengers.
Catalysts 15 00479 g019aCatalysts 15 00479 g019b
Table 1. Synthesis conditions, structural and textural parameters of the TiO2 samples from various precursors and surfactants.
SamplePrecursor/Surfactanta = bcDA 1
(nm)
SBET 2
(m2/g)
Vp 3
(nm3)
Dp 4
(nm)
TEBTET/Brij583.799.3912.284.40.185.9
TPBTTIP/Brij583.769.378.490.20.206.4
TBBTBT/Brij583.789.449.2105.60.236.1
TBCbTBT/CTAB3.789.448.974.20.249.8
TBSTBT/SDS3.789.428.225.00.089.8
1 DA—anatase crystallite diameter; 2 SBET—specific surface area; 3 Vp—volume of pores; 4 Dp—pore diameter.
Table 2. Composition, structural, textural, and optical properties of modified TiO2 samples.
SampleP
(%)
C
(%)
Ag
(%)
Fe
(%)
DA 1
(nm)
SBET 2
(m2/g)
Vp 3
(nm3)
Dp 4
(nm)
Eg 5
(eV)
TPB-Ag--1.1-10.081.80.206.93.08
TPBAC1.32.4--9.4185.60.3493.36
TPBAC-Ag12.11.3-6.199.90.2911.03.34
TPBAC-AgFe0.81.91.21.25.795.20.3112.03.13
TPBAC-Fe [31]11.9-0.85.1101.40.3311.963.29
1 DA—anatase crystallite diameter; 2 SBET—specific surface area; 3 Vp—volume of pores; 4 Dp—pore diameter; 5 Eg—band gap energy.
Table 3. Kinetic parameters of the CR and CV degradation over Ag-, C-, and Fe-modified TiO2.
SampleCRCV
k1·10−3 (min−1)t1/2 (min)R2k1·10−3 (min−1)t1/2 (min)R2
TPB-Ag12.256.80.989012.356.30.9890
TPBAC-Ag4.1169.10.99107.197.60.9863
TPBAC-AgFe2.8247.50.97665.7121.60.9633
TPBAC-Fe [31]2.1328.40.99106.6105.00.9733
Table 4. Comparison of the results for the photodegradation of CR and CV dyes with the literature data.
PhotocatalystLight Irradiation* Q (mg/L)* C mg/L)* T (min)* E %Ref.
Congo Red
ZnOUV500206095.02[71]
ZnOUV169713597[72]
CoFe2O4UV10109091[73]
CuO compositesXe lamp65505077[74]
ZnOXe lamp50505025[74]
TiO2UV50509098.28[75]
TiO2-CoFe2O4Vis801012085[76]
TPB-AgUV187.51418069.6This study
TPB-AgVis5001418093.0This study
TPBAC-AgVis5001418058.6This study
TPBAC-AgFeVis5001418052.5This study
Crystal Violet
AgTiO2UV10000.0210597[5]
AgTiO2Solar simulator10000.0260088[5]
10NiO-ZnOUV100100180100[77]
ZnOVis2500146070.57[78]
ZnOVis500076086.79[78]
TPB-AgUV187.51418090.2This study
TPB-AgVis5008.218095.6This study
TPBAC-AgVis5008.218081.6This study
TPBAC-AgFeVis5008.218074.0This study
* Q—catalyst concentration (mg/L); C—dye concentration (mg/L); T—time (min); E—efficiency of photodegradation (%).
Disclaimer/Publisher’s Note: The statements, opinions and data contained in all publications are solely those of the individual author(s) and contributor(s) and not of MDPI and/or the editor(s). MDPI and/or the editor(s) disclaim responsibility for any injury to people or property resulting from any ideas, methods, instructions or products referred to in the content.

