Article

Frequency-Resolved Modulation Excitation Spectroscopy Methodology for Identifying Surface Reaction Species in Ethanol Oxidation on Gold Catalysts

by
Bhagyesha S. Patil
1,2,
Alejandra Torres-Velasco
1,2 and
Juan J. Bravo-Suárez
1,2,*
1
Center for Environmentally Beneficial Catalysis, The University of Kansas, Lawrence, KS 66047, USA
2
Chemical & Petroleum Engineering Department, The University of Kansas, Lawrence, KS 66045, USA
*
Author to whom correspondence should be addressed.
Catalysts 2025, 15(4), 346; https://doi.org/10.3390/catal15040346
Submission received: 22 February 2025 / Revised: 23 March 2025 / Accepted: 28 March 2025 / Published: 1 April 2025
(This article belongs to the Special Issue Spectroscopy in Modern Materials Science and Catalysis)

Abstract

:
This study used in situ modulation excitation spectroscopy (MES) with varying frequencies in a single experiment to identify surface species during ethanol oxidation on Au/SiO2, Au/TiO2, Au/ZnO, and Au/SrTiO3. Fixed-bed reactor (FBR) tests (1 kPa ethanol, 1.5 kPa O2, 513 K) showed that Au/SiO2 and Au/SrTiO3 had higher ethanol conversions. Au/SiO2 favored acetaldehyde, while Au/SrTiO3 yielded more acetates (acetic acid and ethyl acetate). Operando modulation excitation (ME)–phase sensitive detection (PSD)–DRIFTS, with ethanol and oxygen modulation, identified surface ethanol, acetaldehyde, acetates, ethoxy, and hydroxyl species. Oxygen modulation showed charge transfer to supports in Au/TiO2 and Au/ZnO. At the fundamental frequency (f0 = 1/90 Hz), ME–PSD–DRIFTS showed minimal adsorbed ethanol on Au/SiO2, indicating high ethanol conversion. Au/SrTiO3 had higher acetaldehyde consumption, correlating with increased acetates, consistent with FBR results. ME–PSD–DRIFTS at lower frequencies (0.07f0, 0.5 f0) and higher harmonics (2f0, 3f0) showed rapid ethoxy formation/decomposition, and slower acetaldehyde reactions, confirming acetaldehyde as a primary product and acetates as secondary products. Oxygen modulation revealed rapid hydrogen spillover and hydroxyl changes. Overall, operando spectroscopy via mass spectrometry confirmed the FBR findings.

1. Introduction

The oxidative dehydrogenation of alcohols into valuable aldehydes or ketones is important in organic synthesis, especially at the industrial scale. Traditionally, this transformation has relied on stoichiometric oxidations using metal-based inorganic oxidants such as dichromate or permanganate, which generate substantial amounts of hazardous waste [1,2,3,4]. Modern methods employ heterogeneous catalysts with molecular oxygen, which is a more sustainable approach, yielding only water as a byproduct [1,5,6]. For this reaction, catalysts containing Ru [7,8,9], Ag [10,11,12], Cu [13,14], Au [15,16,17], or Pd [18,19,20] have shown promising results. The process is significant for green chemistry, offering an eco-friendly alternative to fossil fuels, and more so for the case of ethanol, given its role as a renewable feedstock and biofuel. Moreover, the selective oxidation of bioethanol can reduce dependency on fossil reserves and support the production of fine chemicals and specialty products. This aligns well with the principles of biorefineries and sustainable chemicals production. In 2023, the global ethanol market revenue reached USD 108 billion, with North America holding a substantial 40.0% share due to its well-established ethanol production infrastructure. With the global revenue projected to reach USD 164 billion by 2032, converting ethanol to value-added products continues to command a growing economic advantage. Under ideal circumstances, ethanol oxidation would lead to acetic acid (or acetaldehyde) in a single pass through a catalyst without feed additives or with minimal solvent to minimize downstream separation costs. Several catalysts have been studied for the continuous vapor-phase oxidation of ethanol including Pt/Al2O3 [21], V2O5/TiO2 [22], MoWVXNbYOZ/TiO2 [23], CeOX/SnO2 [24], and MoVXNbYTezO [25]. Most of these catalysts were tested at high O2 partial pressures and/or with water co-addition. After Haruta discovered the catalytic activity of Au nanoparticles towards CO oxidation [26], Au-based catalysts have been widely tested for CO oxidation [27,28], propylene oxidation [29,30], alcohol oxidation [31,32,33], and hydrogenation reactions [34,35]. Vapor-phase ethanol oxidation towards acetic acid in the presence of gold catalysts has only been studied recently. However, the effect of the Au particle size [36,37], nanoparticle structure [38], and catalyst preparation methods [39,40], and the effect of supports on this reaction have not been studied experimentally, systematically, and in-depth.
For the vapor-phase ethanol oxidation reaction over Au-based catalysts, Haruta’s work discussed that gold catalyst product selectivity could be tuned by selecting appropriate metal oxide supports [33]. For example, gold nanoparticles (NPs) on acidic or basic metal oxides achieved over 95% selectivity to acetaldehyde at temperatures above 473 K. On p-type metal oxide semiconducting supports, ethanol underwent complete oxidation to CO2 and H2O at temperatures below 473 K, whereas on n-type semiconductive metal oxides, gold NPs produced both acetaldehyde and acetic acid. This support effect was attributed to the stability of surface metal ethoxide and to the excess of active surface oxygen species [33]. This classification, however, has a major gap, as it does not provide a mechanistic understanding at the molecular level. This limits a proper understanding of the role of these supports, precluding the design of more active, selective, and robust catalysts. Another drawback in this previous report was the lack of comparison at similar ethanol and O2 partial pressures and temperatures.
To better understand support effects, catalyst requirements, and catalytic cycles, it is necessary to study catalysts through a combination of in situ and operando spectroscopic characterization, along with kinetic and computational studies [41,42,43]. Some of the most used in situ spectroscopic techniques in catalysis laboratories include UV–visible (UV–vis), Fourier transform infrared (FTIR), and Raman spectroscopies. Among these, in situ FTIR is perhaps the most widely used due to its moderate cost, relatively simple operation, and ability to probe the surface of powder catalysts for adsorbed species and active sites under reaction conditions [44,45]. However, assessing surface intermediates with steady-state in situ FTIR is challenging, because their spectral signals are present in small amounts and are difficult to distinguish from the catalyst background, spectator species, and noise [45]. Therefore, advanced in situ and operando characterization techniques and sensitive spectroscopic methods under dynamic conditions are required for studying not only active sites but also the intermediate species involved in the catalytic cycle.
To address the above issues, this work focuses on carrying out dynamic in situ/operando characterization following a modulation excitation–phase sensitive detection (ME–PSD) [46,47] methodology as recently developed in our laboratory [48]. Our ME–PSD approach follows the more familiar and widely used Fourier transform in engineering for signal processing, which is more robust and independent of the species modulation waveform. This general ME–PSD methodology is paired here with in situ DRIFTS and UV–Vis to characterize surface reaction species on Au nanoparticles supported on metal oxides (SiO2, TiO2, ZnO, and SrTiO3) during the vapor-phase oxidation of ethanol. More specifically, this research focuses on identifying fast and slow-reacting surface species at ethanol oxidation reaction conditions by resolving and screening different frequencies present in quasi-square waveform concentration perturbations in an ME–DRIFTS experiment. The aim is to establish relationships between identified surface species, reaction mechanisms, and/or kinetics to provide a better understanding of the activity and selectivity of a particular catalyst for the selective oxidation of ethanol.

2. Results and Discussion

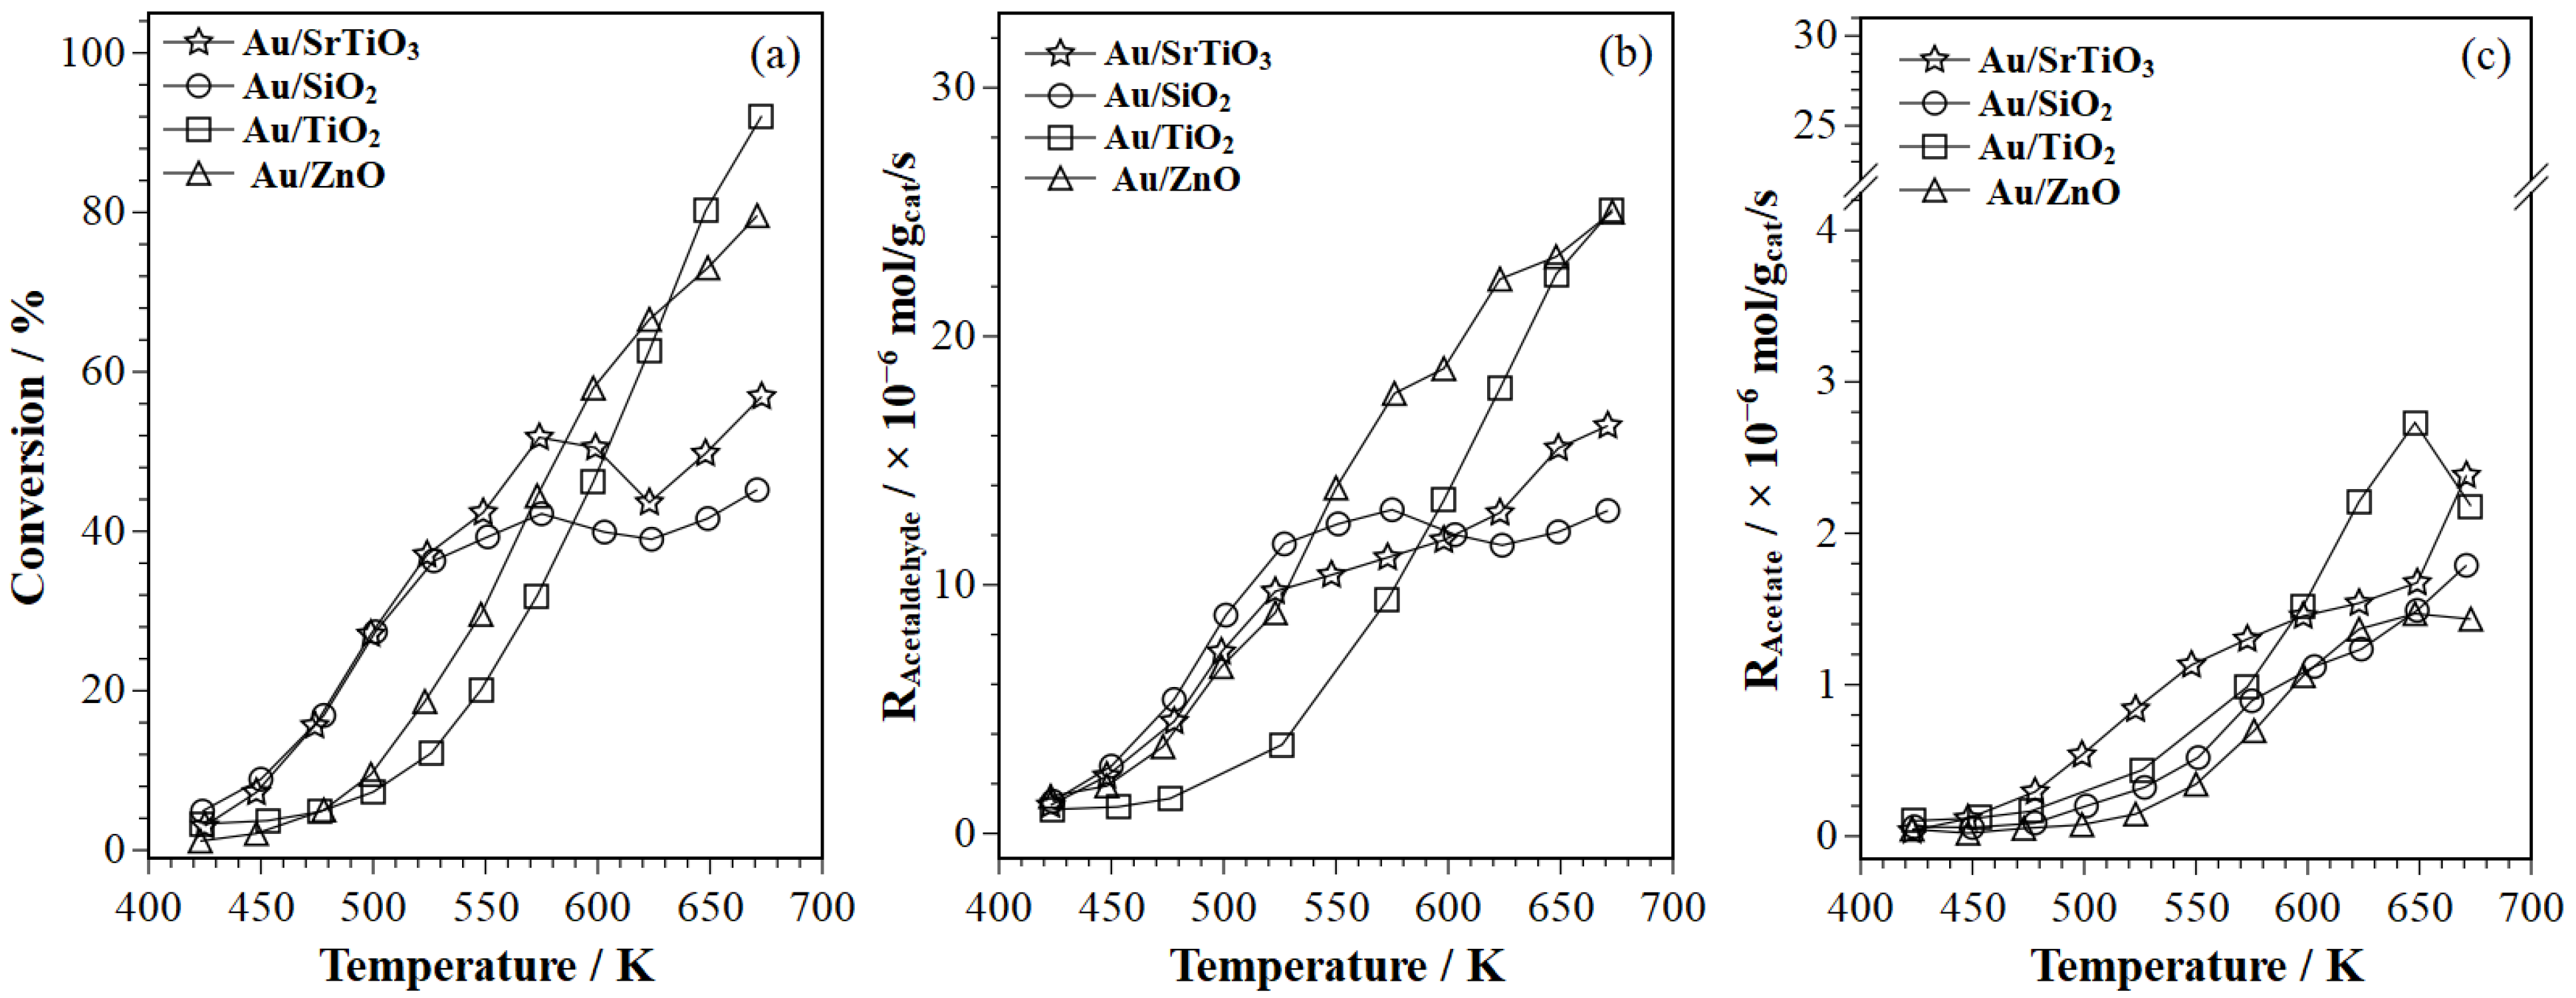
2.1. Ethanol Oxidation Catalytic Activity Results

The catalytic activity of Au/SiO2, Au/TiO2, Au/SrTiO3, and Au/ZnO were evaluated in a fixed bed reactor and their conversion and production rates of acetaldehyde and acetates are reported in Figure 1. The results in this figure show that, as expected, ethanol catalytic conversion increased with temperature for all catalysts at ethanol and O2 at partial pressures of 1 and 1.5 kPa, respectively, and a total pressure of 101 kPa. They also indicated that temperatures below 523 K were needed to achieve conversion values below about 20–30%, for adequate catalyst comparison. Consequently, for further in situ spectroscopic characterization of the catalysts, a temperature of 513 K was selected to balance low conversion with sufficient signal generation of surface species. Catalytic activity in the fixed-bed reactor (FBR) was also compared at 513 K to match the in situ characterization temperature. Table S1 presents a summary of the conversions, selectivities, and rates for all tested catalysts at 513 K.
At 513 K, it was found that the highest ethanol conversion corresponded to Au/SiO2 and Au/SrTiO3, followed by Au/ZnO and Au/TiO2. From the selectivity plots in Figure S1, we found that acetaldehyde was the major product with C2-carbon selectivities (SAcH) between 80 and 98%, while total acetate C2-carbon selectivity (acetic acid + ethyl acetate) ranged between 1 and 12% for all catalysts across the temperature range of 423 to 673 K. In general, at temperatures above ~470 K (where there was a measurable ethanol conversion), acetaldehyde selectivity decreased with temperature, while acetate selectivity remained steady or increased with temperature, suggesting that acetaldehyde converts into acetates via oxidation or esterification reactions. Since selectivity alone is insufficient to understand product formation, production rates normalized by catalyst weight were also used, as shown in Figure 1. At 513 K, the results in Figure 1 show that acetaldehyde production rates followed a descending order of Au/SiO2 > Au/SrTiO3 > Au/ZnO > Au/TiO2, while that for the total acetate production rate decreased in the order of Au/SrTiO3 > Au/TiO2 > Au/SiO2 > Au/ZnO at the given pressure and reactant concentrations. To account for potential differences in Au content and particle size in the catalysts, production rates were also expressed in terms of the amount of exposed Au in the catalysts (Table S1). Since the Au loading was nearly identical (~1 wt%) and the Au average particle size did not vary significantly, the order of reactivity for acetaldehyde (Au/SiO2 > Au/SrTiO3 > Au/ZnO > Au/TiO2) and acetate production rates (Au/SrTiO3 > Au/TiO2 ~ Au/SiO2 > Au/ZnO) per exposed Au remained the same. Overall, the results indicate that Au/SiO2 is an efficient catalyst for acetaldehyde formation, whereas Au/SrTiO3 also favors the conversion of ethanol to acetates. Later sections will demonstrate that Au/SiO2’s higher acetaldehyde formation is likely due to moderate ethanol adsorption and weak acetaldehyde adsorption, while Au/SrTiO3’s increased acetate formation stems from moderate acetaldehyde adsorption and weak acetate adsorption.

2.2. Operando Modulation Excitation–Diffuse Reflectance Infrared Spectroscopy–Phase Sensitive Detection (ME–PSD–DRIFTS)

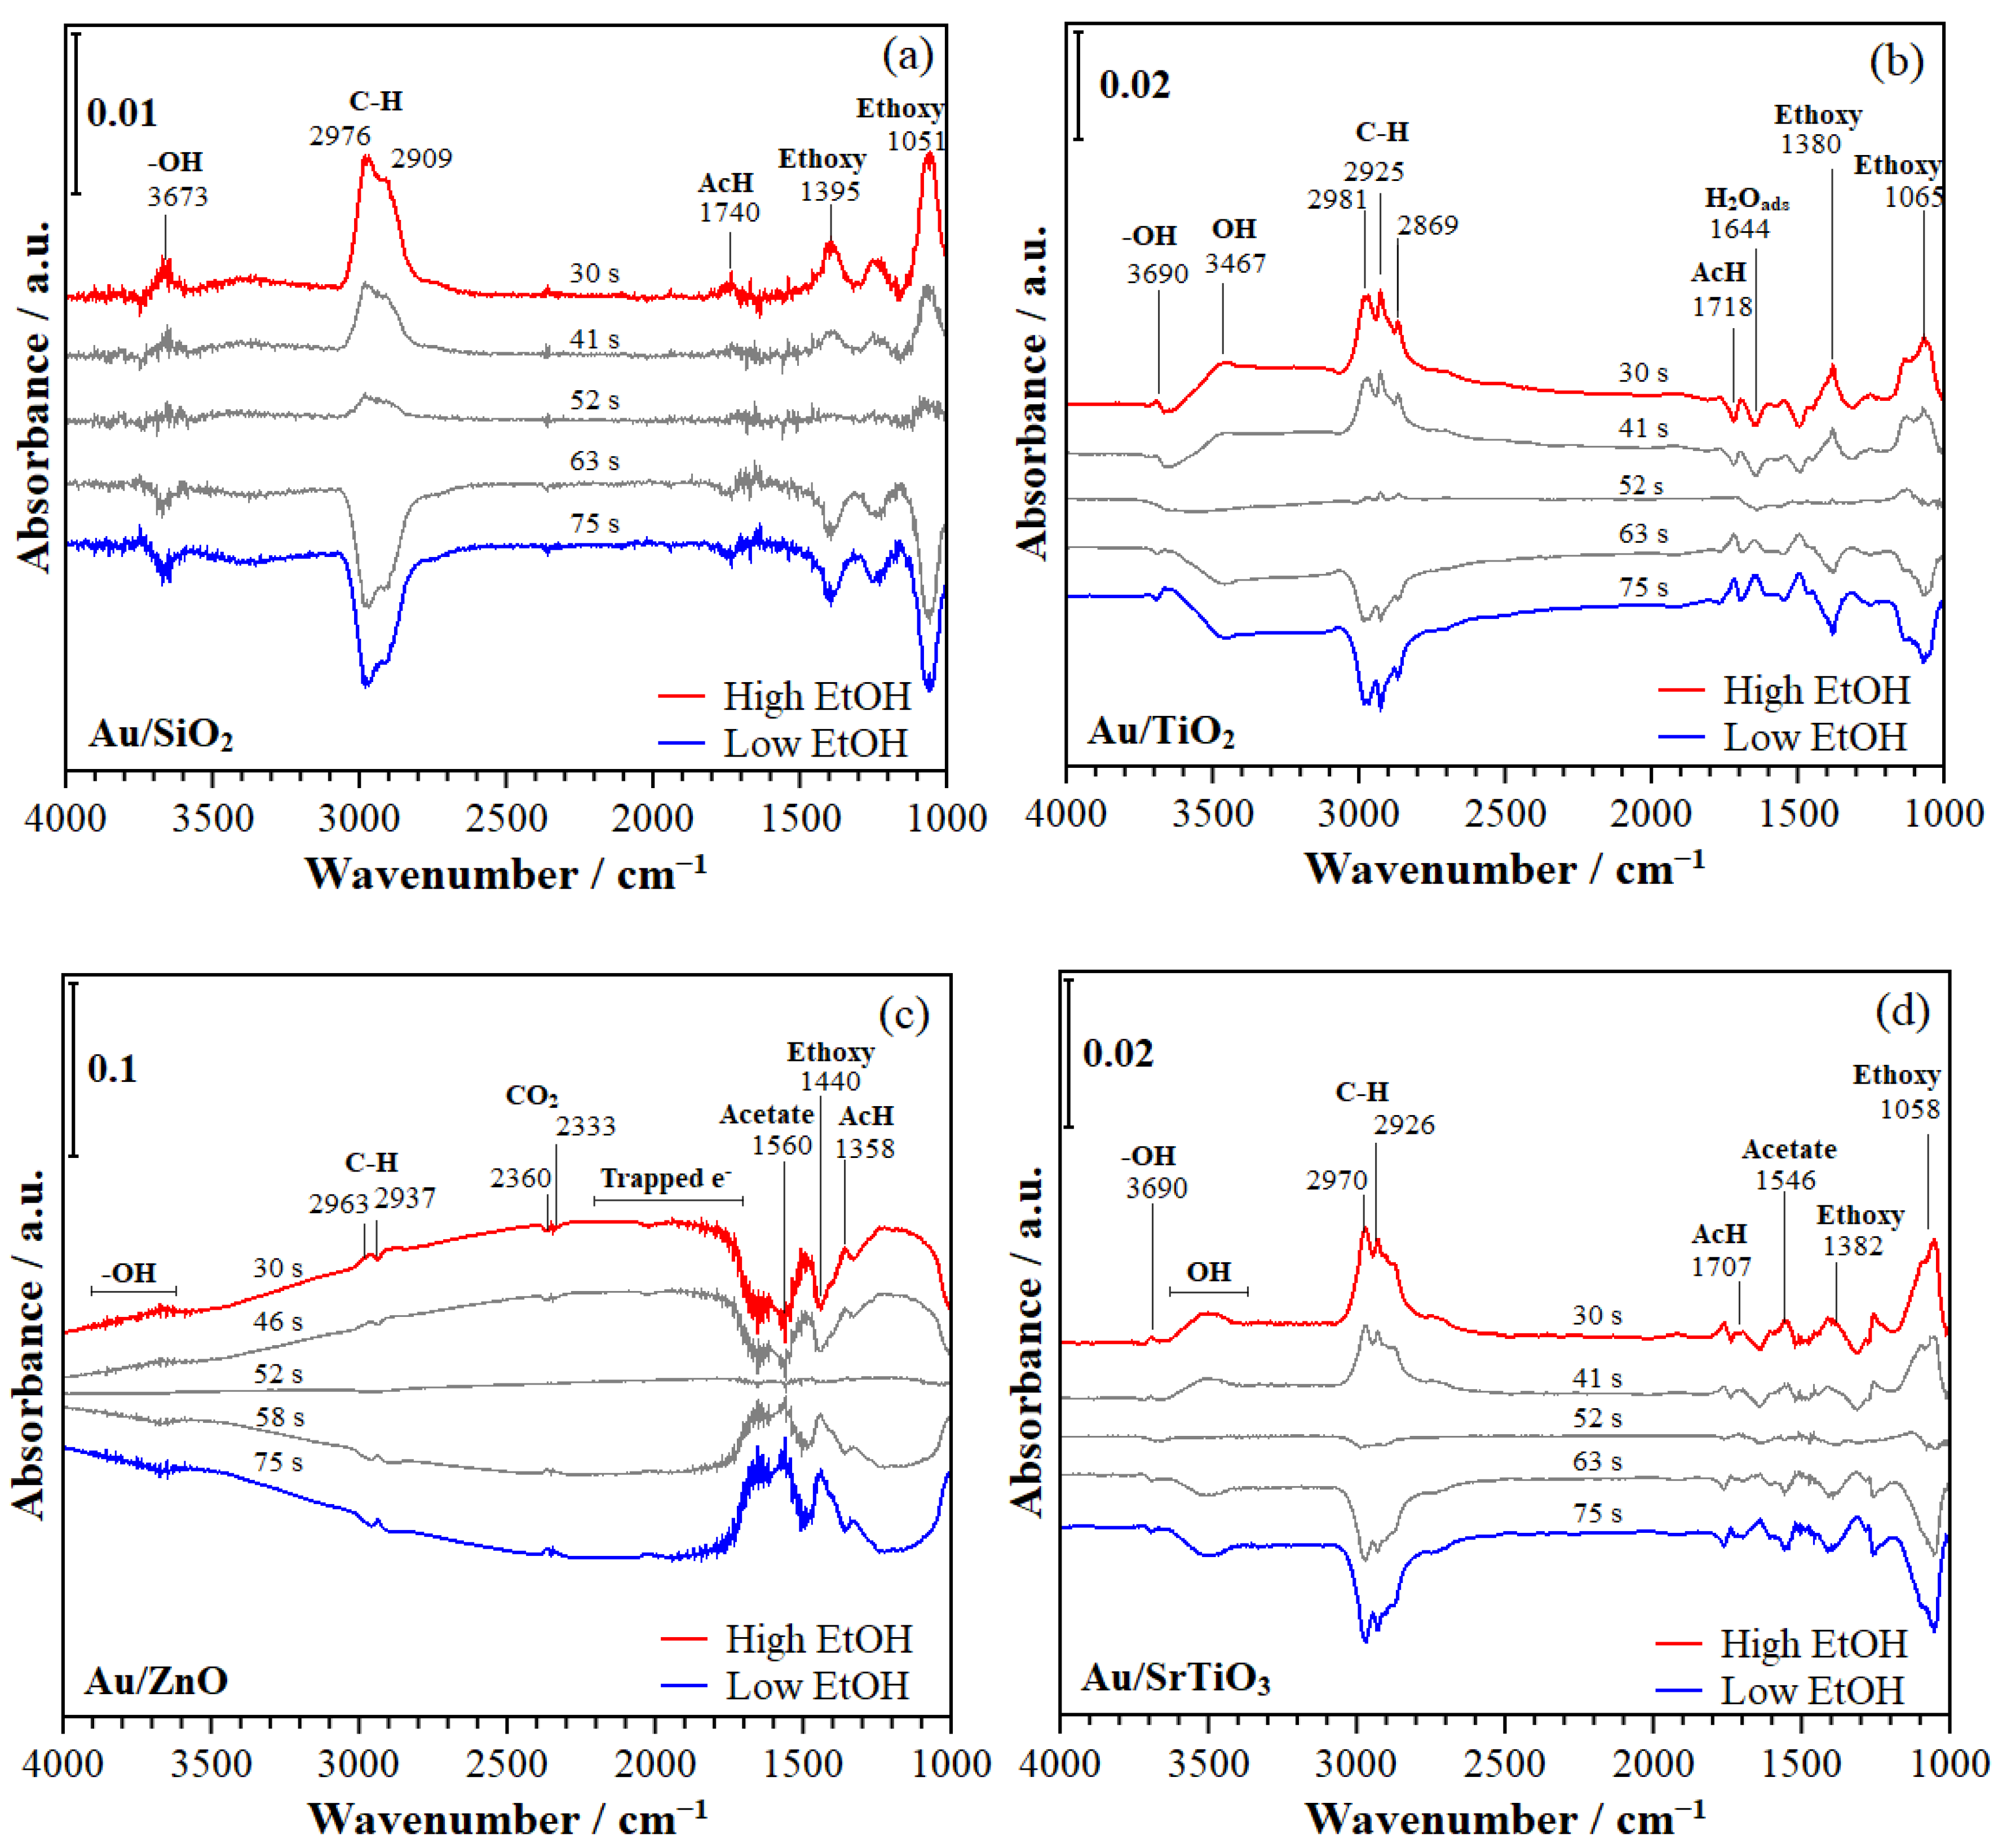
2.2.1. Time-Domain Spectra

Figure 2 presents the time-domain ME–DRIFTS spectra during ethanol oxidation over Au/SiO2, Au/TiO2, Au/ZnO, Au/SrTiO3, and silica sand at 513 K, a total pressure of 101 kPa, and ethanol and oxygen partial pressures of 1 and 1.5 kPa, respectively. Irrespective of ethanol or oxygen modulation conditions, the maximum concentration of any of the reactants during modulation is achieved between 0 and 45 s in 1 kPa EtOH + 1.5 kPa O2 + He, whereas in the second half of the modulation period (45–90 s), only 1.5 kPa O2 + He (in the case of ethanol MES) or 1 kPa EtOH + He (in the case of O2 MES) were present. Hence, all spectra in Figure 2 are shown after ~30 s. Although the concentration of reactants varied continuously throughout the modulation, only small changes in the time-domain spectra were present and hardly visible due to background, noise, and spectator species bands, whose intensity tends to dominate spectra and not respond to fast concentration modulations. The spectra in Figure 2 are characterized by a low signal-to-noise ratio above 3200 and below 1900 cm−1. These peaks arise from gas-phase species (primarily due to small changes in the instrument’s background CO and CO2) or ethanol, H2O, acetaldehyde, or strongly bound surface ethoxy species. Another notable feature of the time-domain spectra is the difficulty of distinguishing peaks associated with low concentration species, whether they are in the gas phase or adsorbed on the surface.

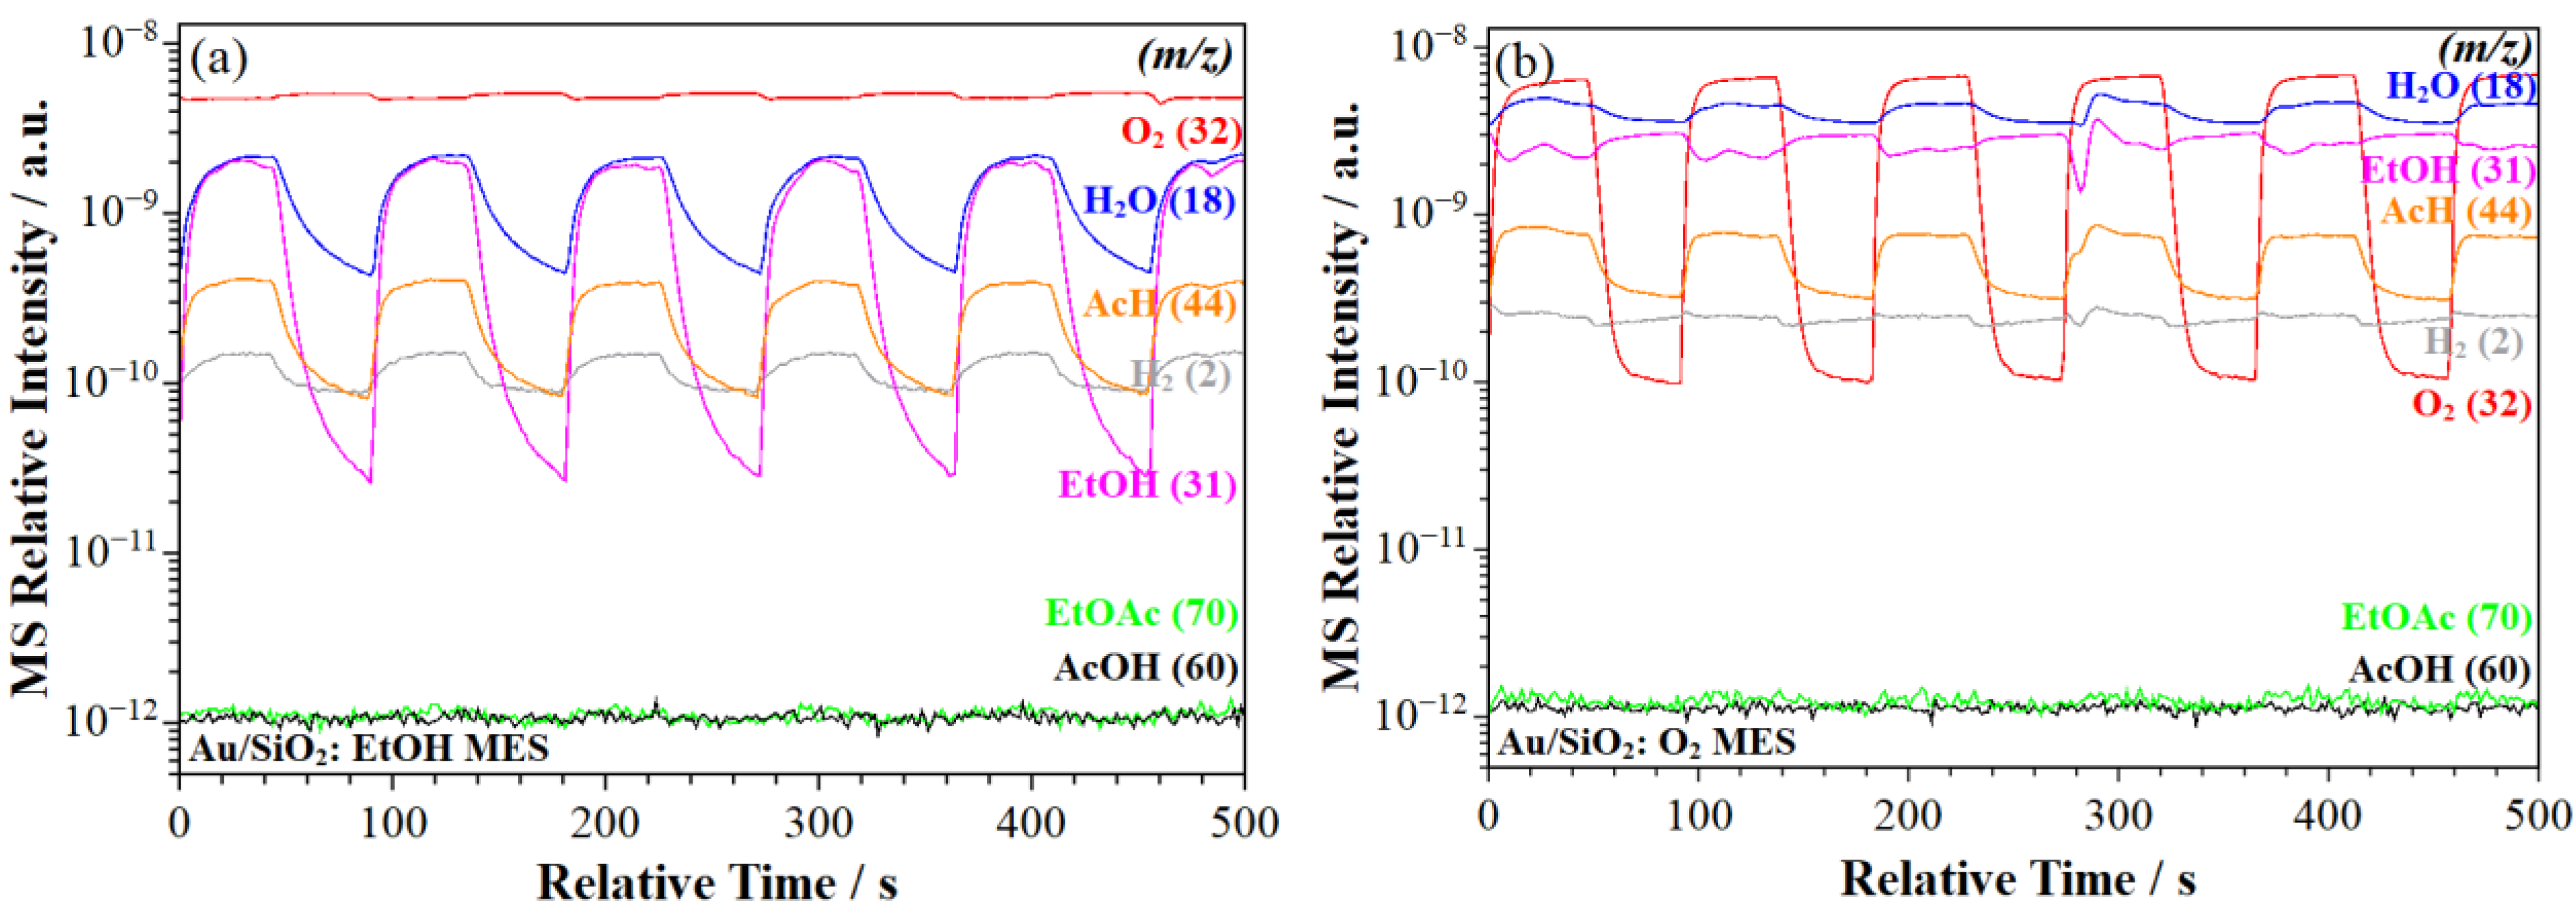
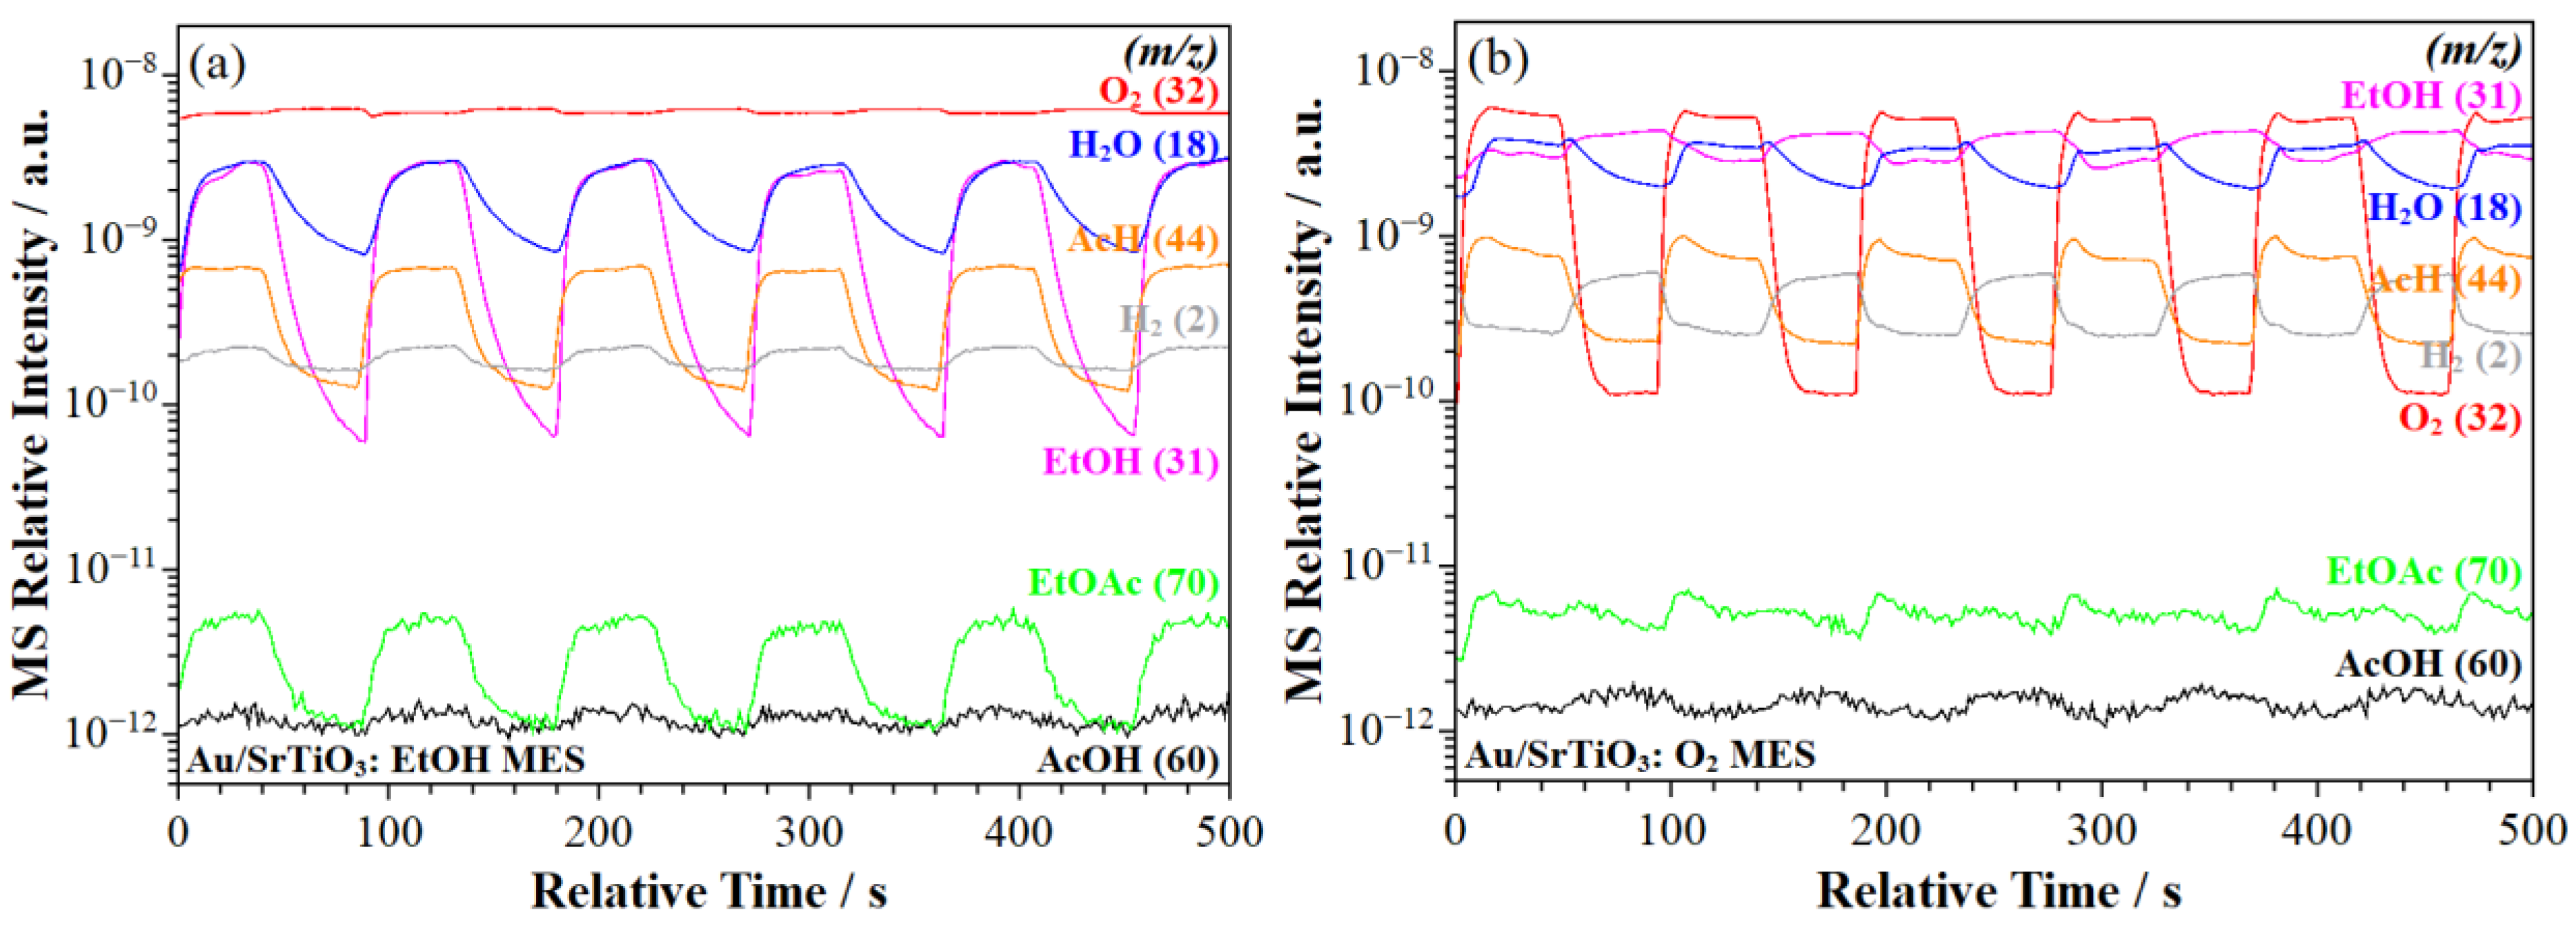
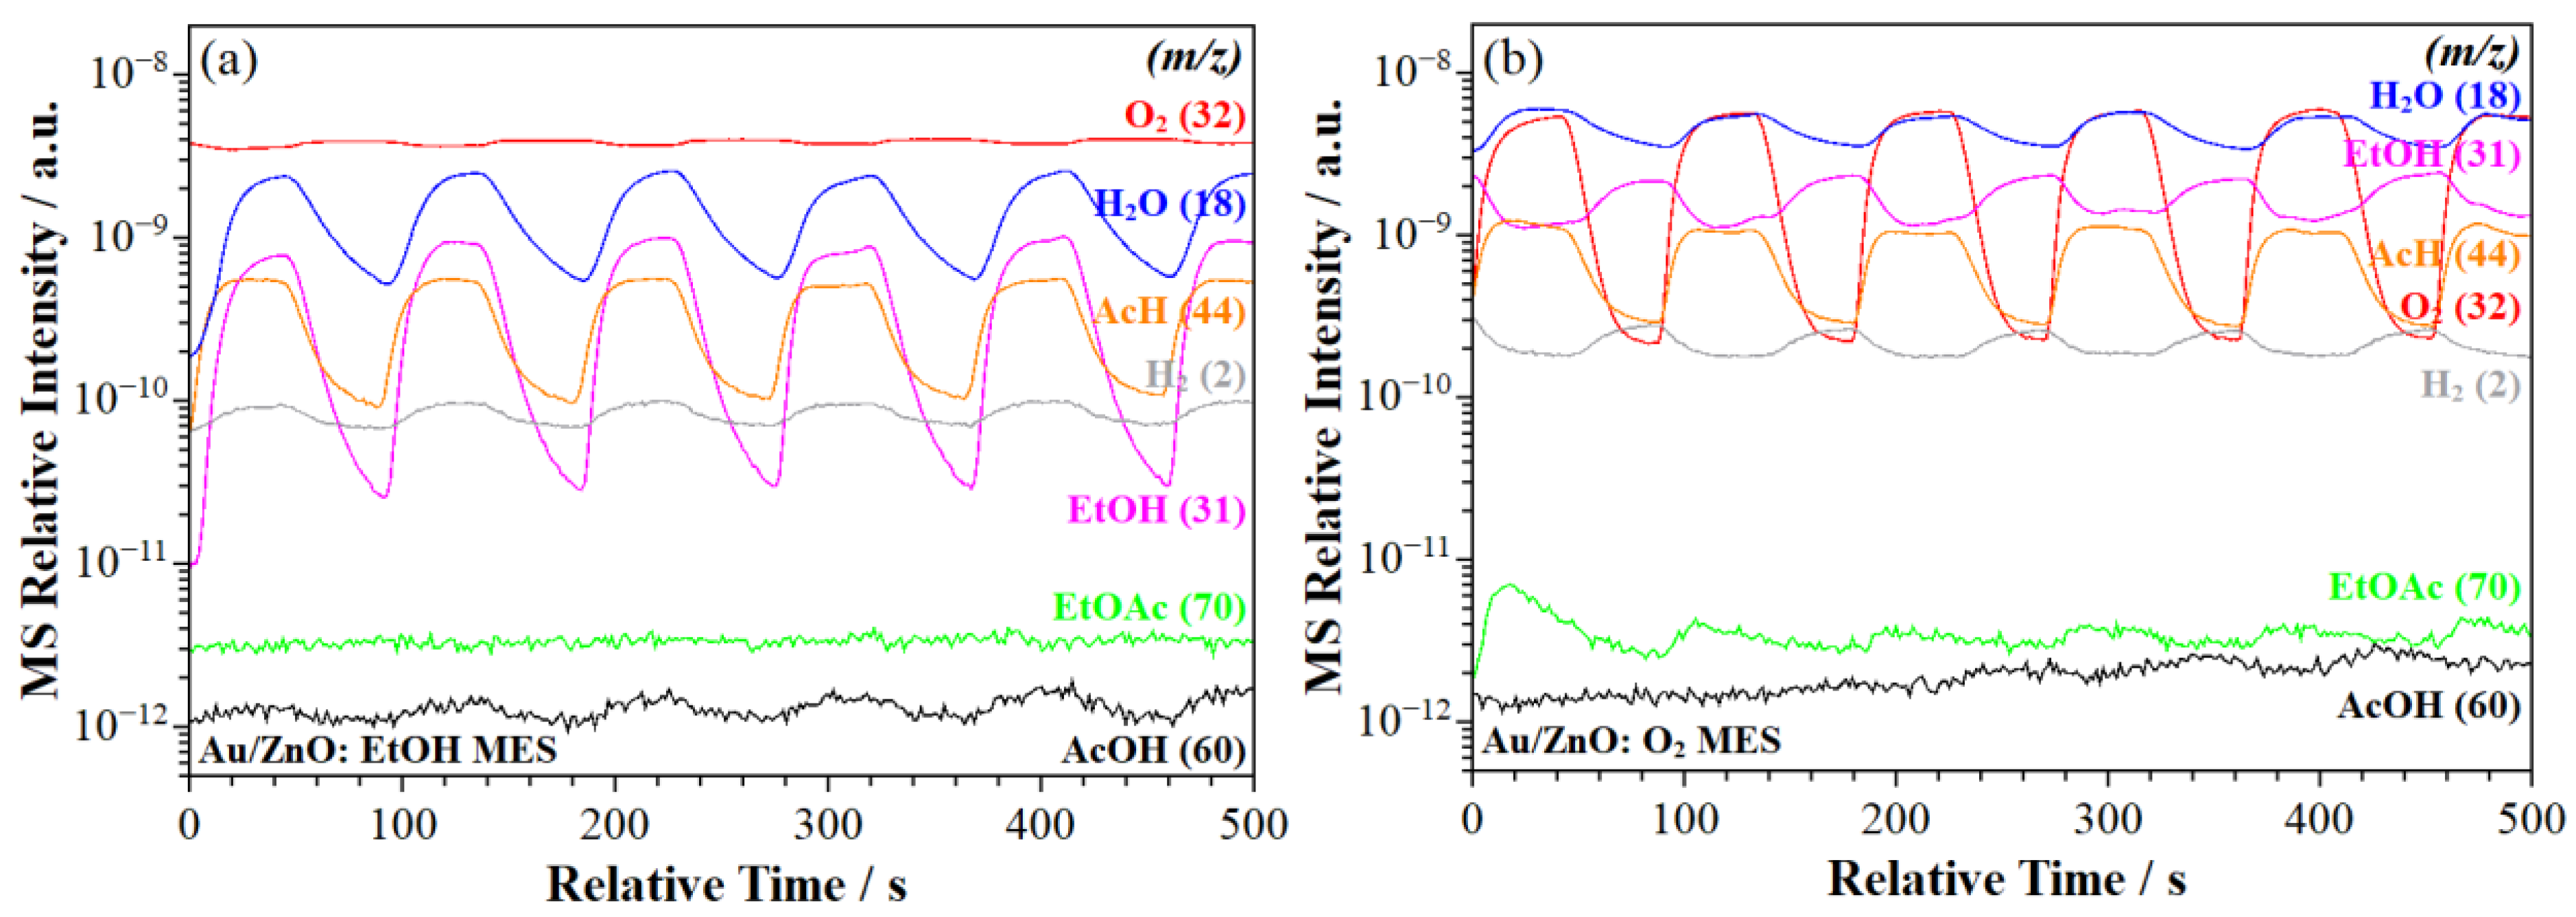
2.2.2. MS Signal Response

Figure 3, Figure 4, Figure 5 and Figure 6 correspond to the MS signal response of the in situ IR cell outlet during ethanol and oxygen modulation experiments at 513 K over Au/SiO2 (Figure 3), Au/TiO2 (Figure 4), Au/SrTiO3 (Figure 5), and Au/ZnO (Figure 6). They correspond to periodic changes from EtOH (1 kPa) + O2 (1.5 kPa) + He to O2 (1.5 kPa) + He (EtOH MES) or to EtOH (1 kPa) + He (O2 MES). The MS modulation patterns provide evidence that the signals of the input (reactant) and output (product) gases are dominated by a quasi-square waveform resembling the observed adsorbed species waveform (Figures S2–S9) and whose synchronization order depends on the modulation reactant. For example, the initial ethanol increase during EtOH MES was in sync with the C-H stretching peak (~2960–2980 cm−1), as expected from higher ethanol adsorption with ethanol partial pressure and described by typical adsorption isotherms (e.g., Langmuir). On the other hand, the initial O2 concentration increase during O2 MES was out of sync with the C-H stretching frequency due to adsorbed ethanol species reactions with O2 at higher O2 partial pressures. These results agree with expectations for oxidation reactions occurring via a Langmuir–Hinshelwood mechanism involving adsorbed species. The evolution of ethanol oxidation products such as acetaldehyde (m/z = 44), acetic acid (m/z = 60), ethyl acetate (m/z = 70), and water (m/z = 18) were found to track with reactant (EtOH or O2) modulation, suggesting positive reaction rate orders for both ethanol and O2. This is evident from the synchronization of MS signals between ethanol and acetaldehyde in both ethanol and O2 modulations (i.e., the acetaldehyde production rate is directly proportional to the ethanol and O2 concentrations) for all four catalysts in this study. These results show that ethanol oxidizes to acetaldehyde. For example, this can be noted from O2 MES data (at constant EtOH partial pressure), since acetaldehyde formation is in sync with O2 concentration, that is, the reaction is more favorable in the presence of oxygen. This is also observed from the decrease in H2 (m/z = 2) at the expense of water (m/z = 18) formation. Regarding possible surface species, it is worth noting the slower MS decay signal for water than for acetaldehyde (m/z = 44) for all catalysts. This indicates that water adsorbs much more strongly to the catalyst surface than acetaldehyde.
A semi-quantitative analysis of the MS signals for acetates (ethyl acetate + acetic acid) points out the enhanced acetate (m/z = 60 and 70) production over Au/TiO2 and Au/SrTiO3 (Figure 4 and Figure 5), more than on Au/SiO2 and Au/ZnO (Figure 3 and Figure 6), which also tracks with the FBR results at 513 K (Figure 1 and Figure S1). Ethyl acetate (EtOAc) modulations were also found to be in sync with ethanol and O2 modulations for all the catalysts. However, for acetic acid (AcOH), the MS signal was out of sync during O2 modulation on Au/SrTiO3 (Figure 5). These differences in EtOAc and AcOH concentration signals suggest the presence of different kinetics for the formation of acetic acid and ethyl acetate on this catalyst and are consistent with the presence of an esterification route by the reaction of ethanol and acetic acid or ethanol and acetaldehyde (i.e., Tischenko-type reaction). Additionally, acetate formation appeared more prominently on the Au/SrTiO3 (Figure 5) when compared to other catalysts. The same results are also backed up by the FBR observations noting the higher acetate rate on Au/SrTiO3 compared to other catalysts at 513 K (Figure 1).

2.2.3. Time and Frequency-Domain Absorbance IR Spectra

The in situ ME–PSD–DRIFTS time-domain plots (Figures S2–S9) showed the evolution of the C-H stretching derived from surface species as tracked by the signals at 2965, 2970, 2957, and 2965 cm−1 during ethanol modulation and at 2979, 2970, 2957, and 2960 cm−1 during O2 modulations over Au/SiO2, Au/TiO2, Au/ZnO, and Au/SrTiO3, respectively. The figures indicated that all the cycles are in a quasi-steady state. There is a slight shift in the baseline of the time-domain data, which will be evident in the frequency-domain plots as a broad peak at the zeroth frequency. The selected time-domain absorption spectra indicate that the waveform follows a pseudo-square pattern during ethanol modulation and a pseudo-sawtooth pattern during oxygen modulation, as observed for the wavenumbers belonging to the C-H stretching. The MS data show that during ethanol and oxygen modulation, ethanol shows similar pseudo-square and pseudo-sawtooth wave patterns, pointing that the peaks for C-H stretching likely arise from surface-adsorbed ethanol and/or fast-forming ethanol-derived intermediate species such as ethoxy species [32,49,50]. More detailed information on the same resulting trends can be deduced from the frequency-domain data (Figures S10–S17) corresponding to the peaks mentioned above. For example, consistent with the absorption spectra and MS data, the frequency-domain plots consist of 1f0, 3f0, 5f0, and 7f0 (characteristic of a square waveform) during ethanol modulation and 1f0, 2f0, 3f0, 4f0, and so on (characteristic of a saw tooth waveform) in the case of oxygen modulation. In this case, f0 is the fundamental frequency of modulation (1/90 Hz) matching that of the waveform [48]. The response at frequency 0 Hz arises from contributions of non-modulating signals due to strongly adsorbed spectator species and baseline shifts. The time-domain absorption spectra with MS data along with frequency-domain data showed that ethanol and oxygen modulation at the fundamental frequency of 1/90 Hz were characterized by frequency responses as high as f = 0.07 (7f0), depending upon the waveform. The pattern of the waveform can be matched to MS data, from which further information regarding the adsorbed species could be acquired.

2.2.4. Phase-Domain Contour Plots During ME–PSD–DRIFTS

In the Methods section (Section 3.3.4), it was described that spectra reconstruction after filtering out signals of a selected modulation frequency or frequency range can be effectively achieved using IDFT. Here, Figures S18–S25 present the in situ ME–PSD–DRIFTS phase-domain spectra in the form of contour plots after PSD filtering at the fundamental frequency (1f0 = 1/90 Hz) for ethanol and oxygen modulations during ethanol oxidation at 513 K on Au/SiO2, Au/TiO2, Au/ZnO, and Au/SrTiO3, respectively. These figures illustrate how the spectra change over the modulation period in units of time (0–90 s, left Y-axis) and phase angles (0–360°, right Y-axis). A quasi-square waveform was added to the plot to guide the eye and facilitate understanding of the gas-phase concentration of ethanol or oxygen during their respective modulation cycles. This plot is particularly useful for a quick visual assessment of the presence of potential peaks, their interrelations, and possible comparison amongst the catalysts. In the contour plot figures, the color contrast between blue and purple regions corresponds to the low and high surface coverage of species, relative to a midpoint (green) between the periodic modulation. At a high ethanol concentration during ethanol modulation (Figures S18–S21, ~20–45 s), there is an evident abundance of ethanol-derived species, inferred from the C–H stretching in the 3000–2800 cm−1 range [39,51,52,53,54,55,56]. A similar behavior is observed for M-OH species in the 3800–3700 cm−1 region [51,55,57,58,59]. Additionally, high concentrations of adsorbed carbonyl groups (e.g., in AcH, acetates) and adsorbed ethoxy species are evident at high ethanol (Figures S18–S21) and O2 (Figures S22–S25) concentrations, as shown by the orange region between 1700 and 1000 cm−1 [36,60]. A comparative analysis of the contour plots shows different relative absorbance scales across the catalysts, indicating that all catalysts have a different capacity to reversibly adsorb the species. A quick analysis points out that ethanol and reaction products such as H2O and carbonyl products are significantly adsorbed on the Au/ZnO surface as compared to other catalysts. Additionally, Au/TiO2 and Au/ZnO catalysts showed a significantly large number of trapped electrons in the range of 2000–2500 cm−1 wavenumbers (Figures S23–S24), but which are absent/negligible for Au/SiO2 and Au/SrTiO3 (Figures S22 and S25). Although the contour plots during oxygen modulation did not yield sufficient insights into adsorbed reaction species due to the lower adsorption of surface species (e.g., Au/SiO2) or due to clouding by trapped electron signals (e.g., Au/TiO2 and Au/ZnO), Au/SrTiO3 results were the exception. For this catalyst, at a high O2 concentration, the following was noticed: (i) higher concentration of metal bound hydroxyls (3700–3800 cm−1); (ii) lower concentration of -OH groups associated to adsorbed H2O or ethoxy (3300–3500 cm−1) and C-H bonds due to EtOH-derived species (3000–2800 cm−1); (iii) higher concentration of carbonyl products (1600–1250 cm−1); and (iv) lower concentration of ethoxy groups (1000–1200 cm−1).

2.2.5. Phase–Domain Trace Plots During ME–PSD DRIFTS with PSD at the Fundamental Frequency (1f0)

Further detailed observations can be made from the individual in situ ME–PSD–DRIFTS phase-domain (PD) traces with PSD at the fundamental frequency (1f0) in Figure 7 and Figure 8, which are captured at high and low concentrations (shown in contour plots, Figures S18–S25) during ethanol and oxygen modulation. Unlike the time-domain plot (e.g., Figure 2), the surface species in these PD trace plots respond to the fundamental frequency of feed concentration modulation. In this case, spectator species are eliminated, and the visible peaks are potential reaction intermediates. The PSD procedure effectively reduced noise, allowing for the clear identification of weak spectral features that were otherwise difficult to discern in the time-domain spectra.
The catalytic screening in the FBR revealed acetaldehyde as the primary product at 513 K, accompanied by smaller amounts of acetates (acetic acid + ethyl acetate). Therefore, the ME-PSD-DRIFTS spectra are expected to exhibit a variety of surface species with characteristic features as listed next.
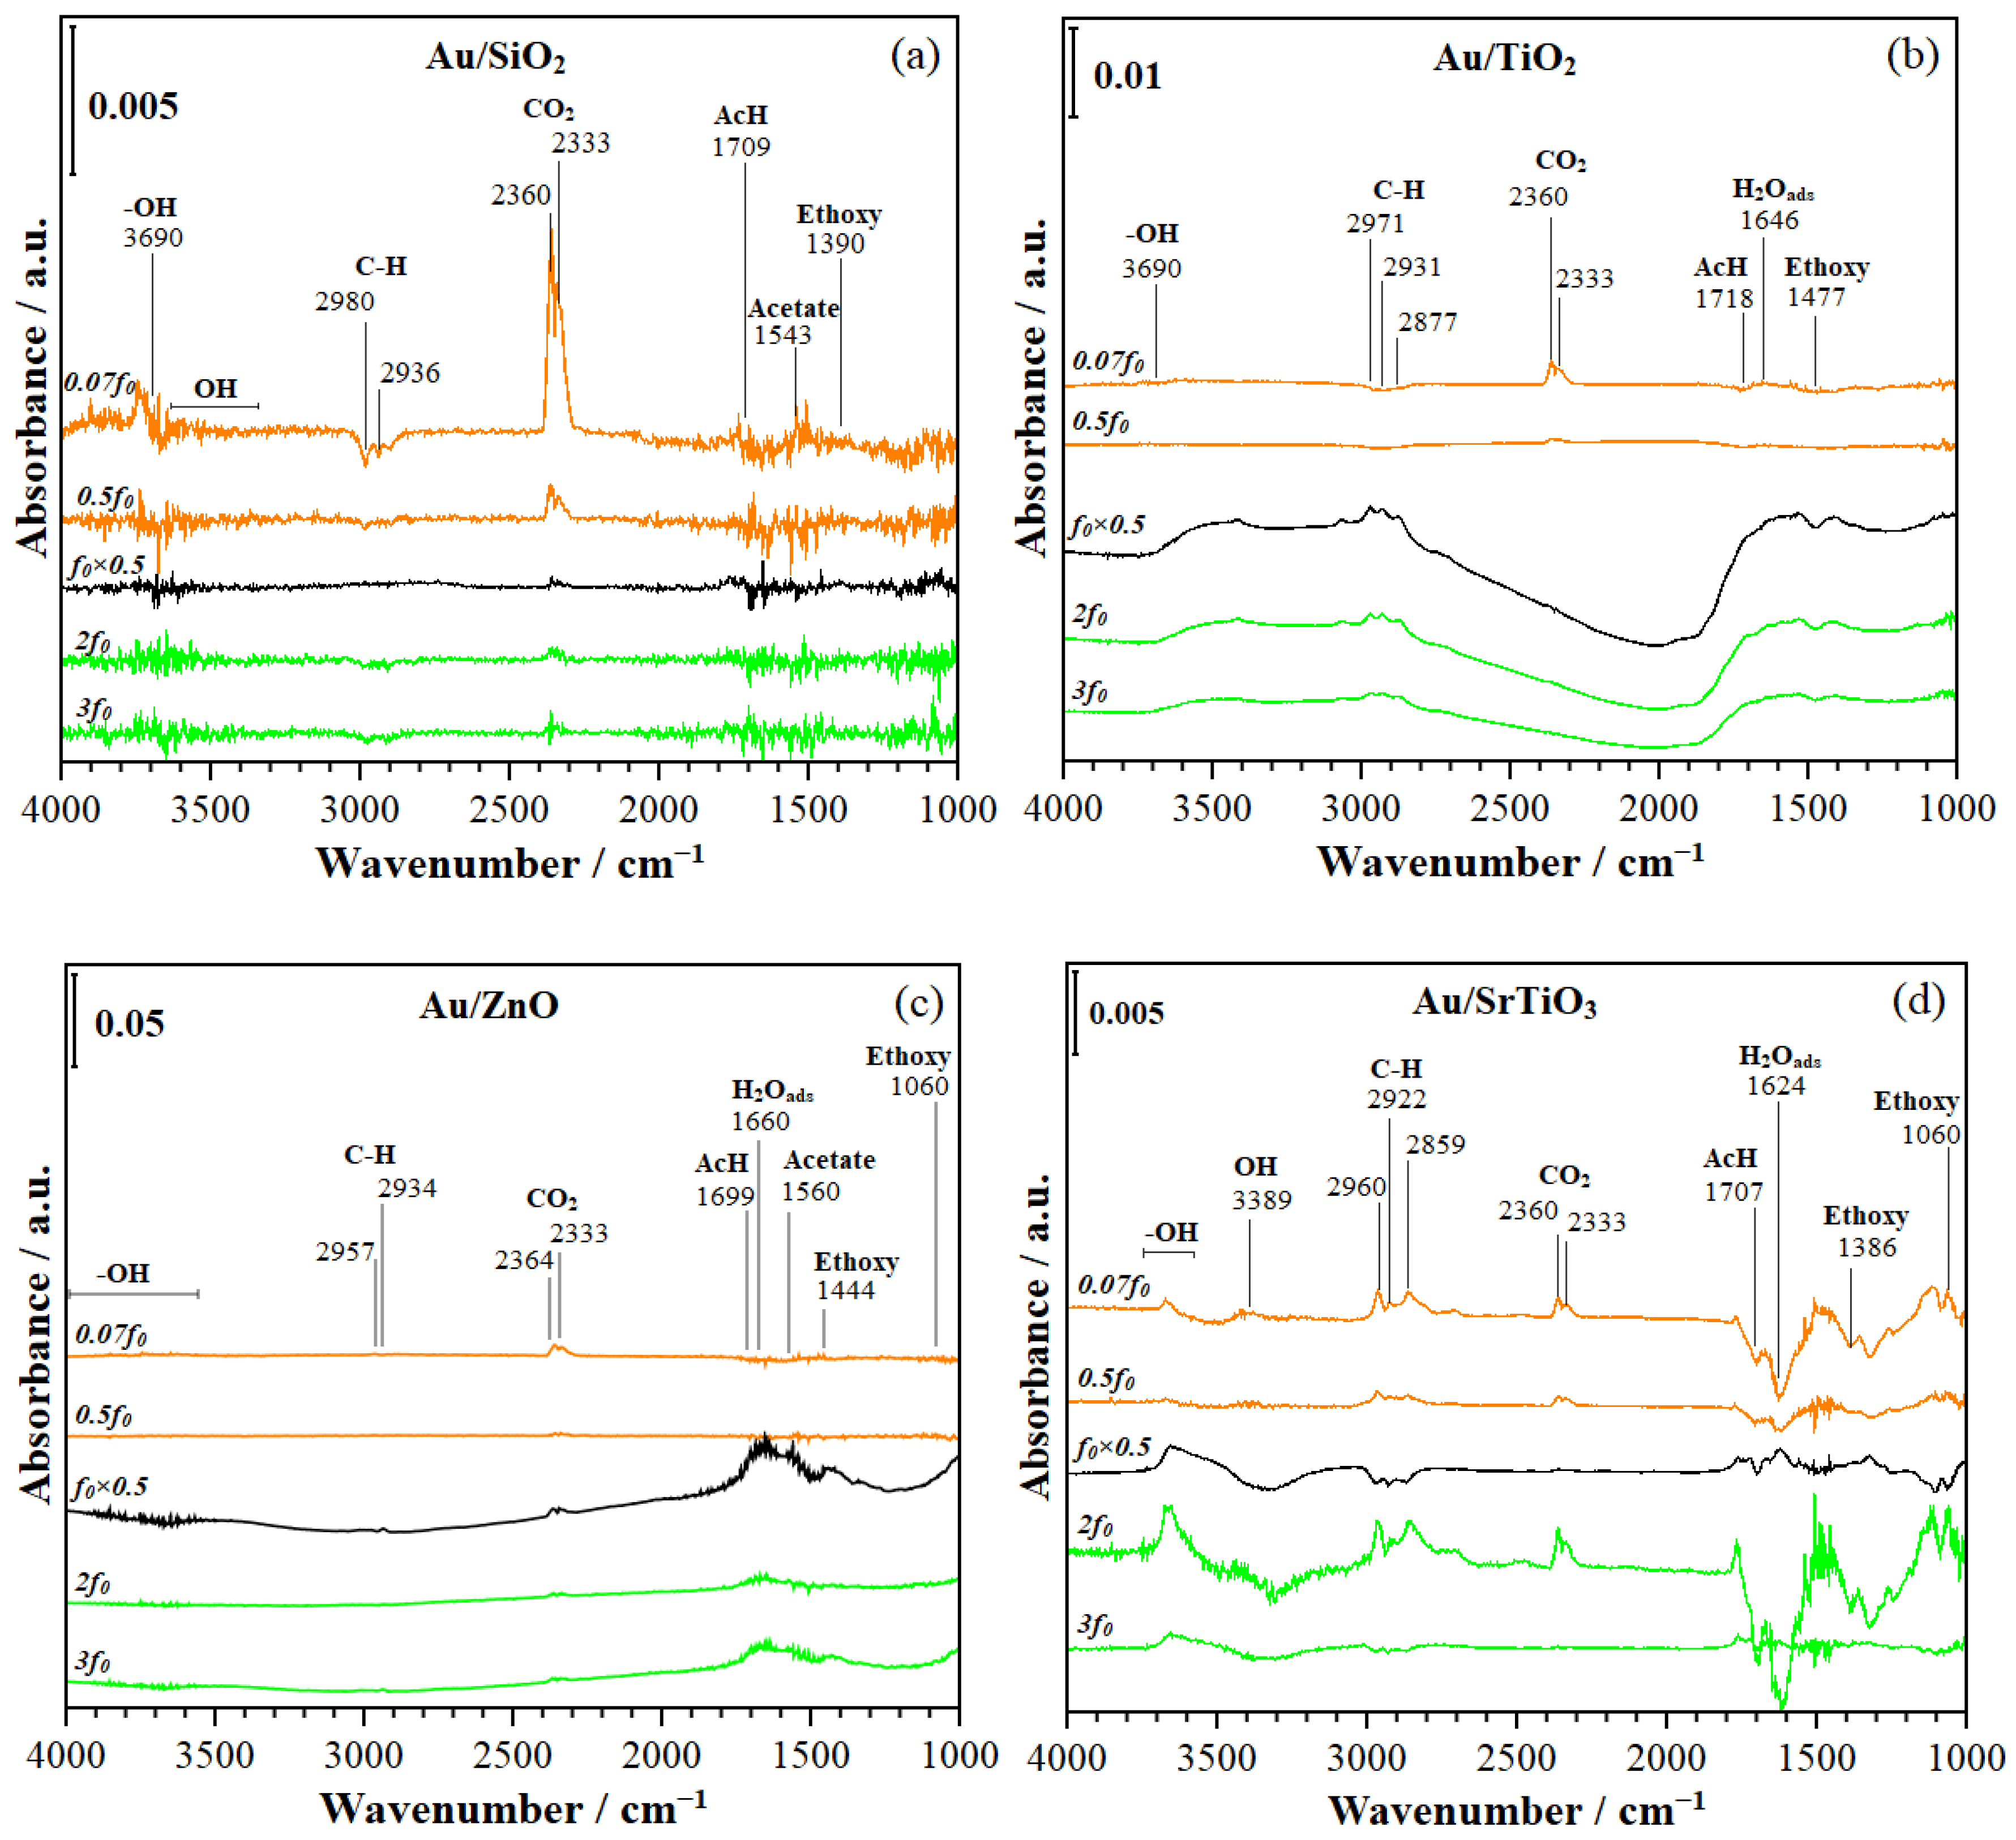
  • C-H stretching (C-H). (i) During EtOH modulation (Figure 7), 2976, 2909 cm−1 (on Au/SiO2); 2981, 2925, 2869 cm−1 (on Au/TiO2); 2963, 2937 cm−1 (on Au/ZnO); and 2870, 2926 cm−1 (on Au/SrTiO3). (ii) During O2 modulation (Figure 8), 2966, 2874 cm−1 (on Au/TiO2); 2963, 2896 cm−1 (on Au/ZnO); and 2960, 2873 cm−1 (on Au/SrTiO3).
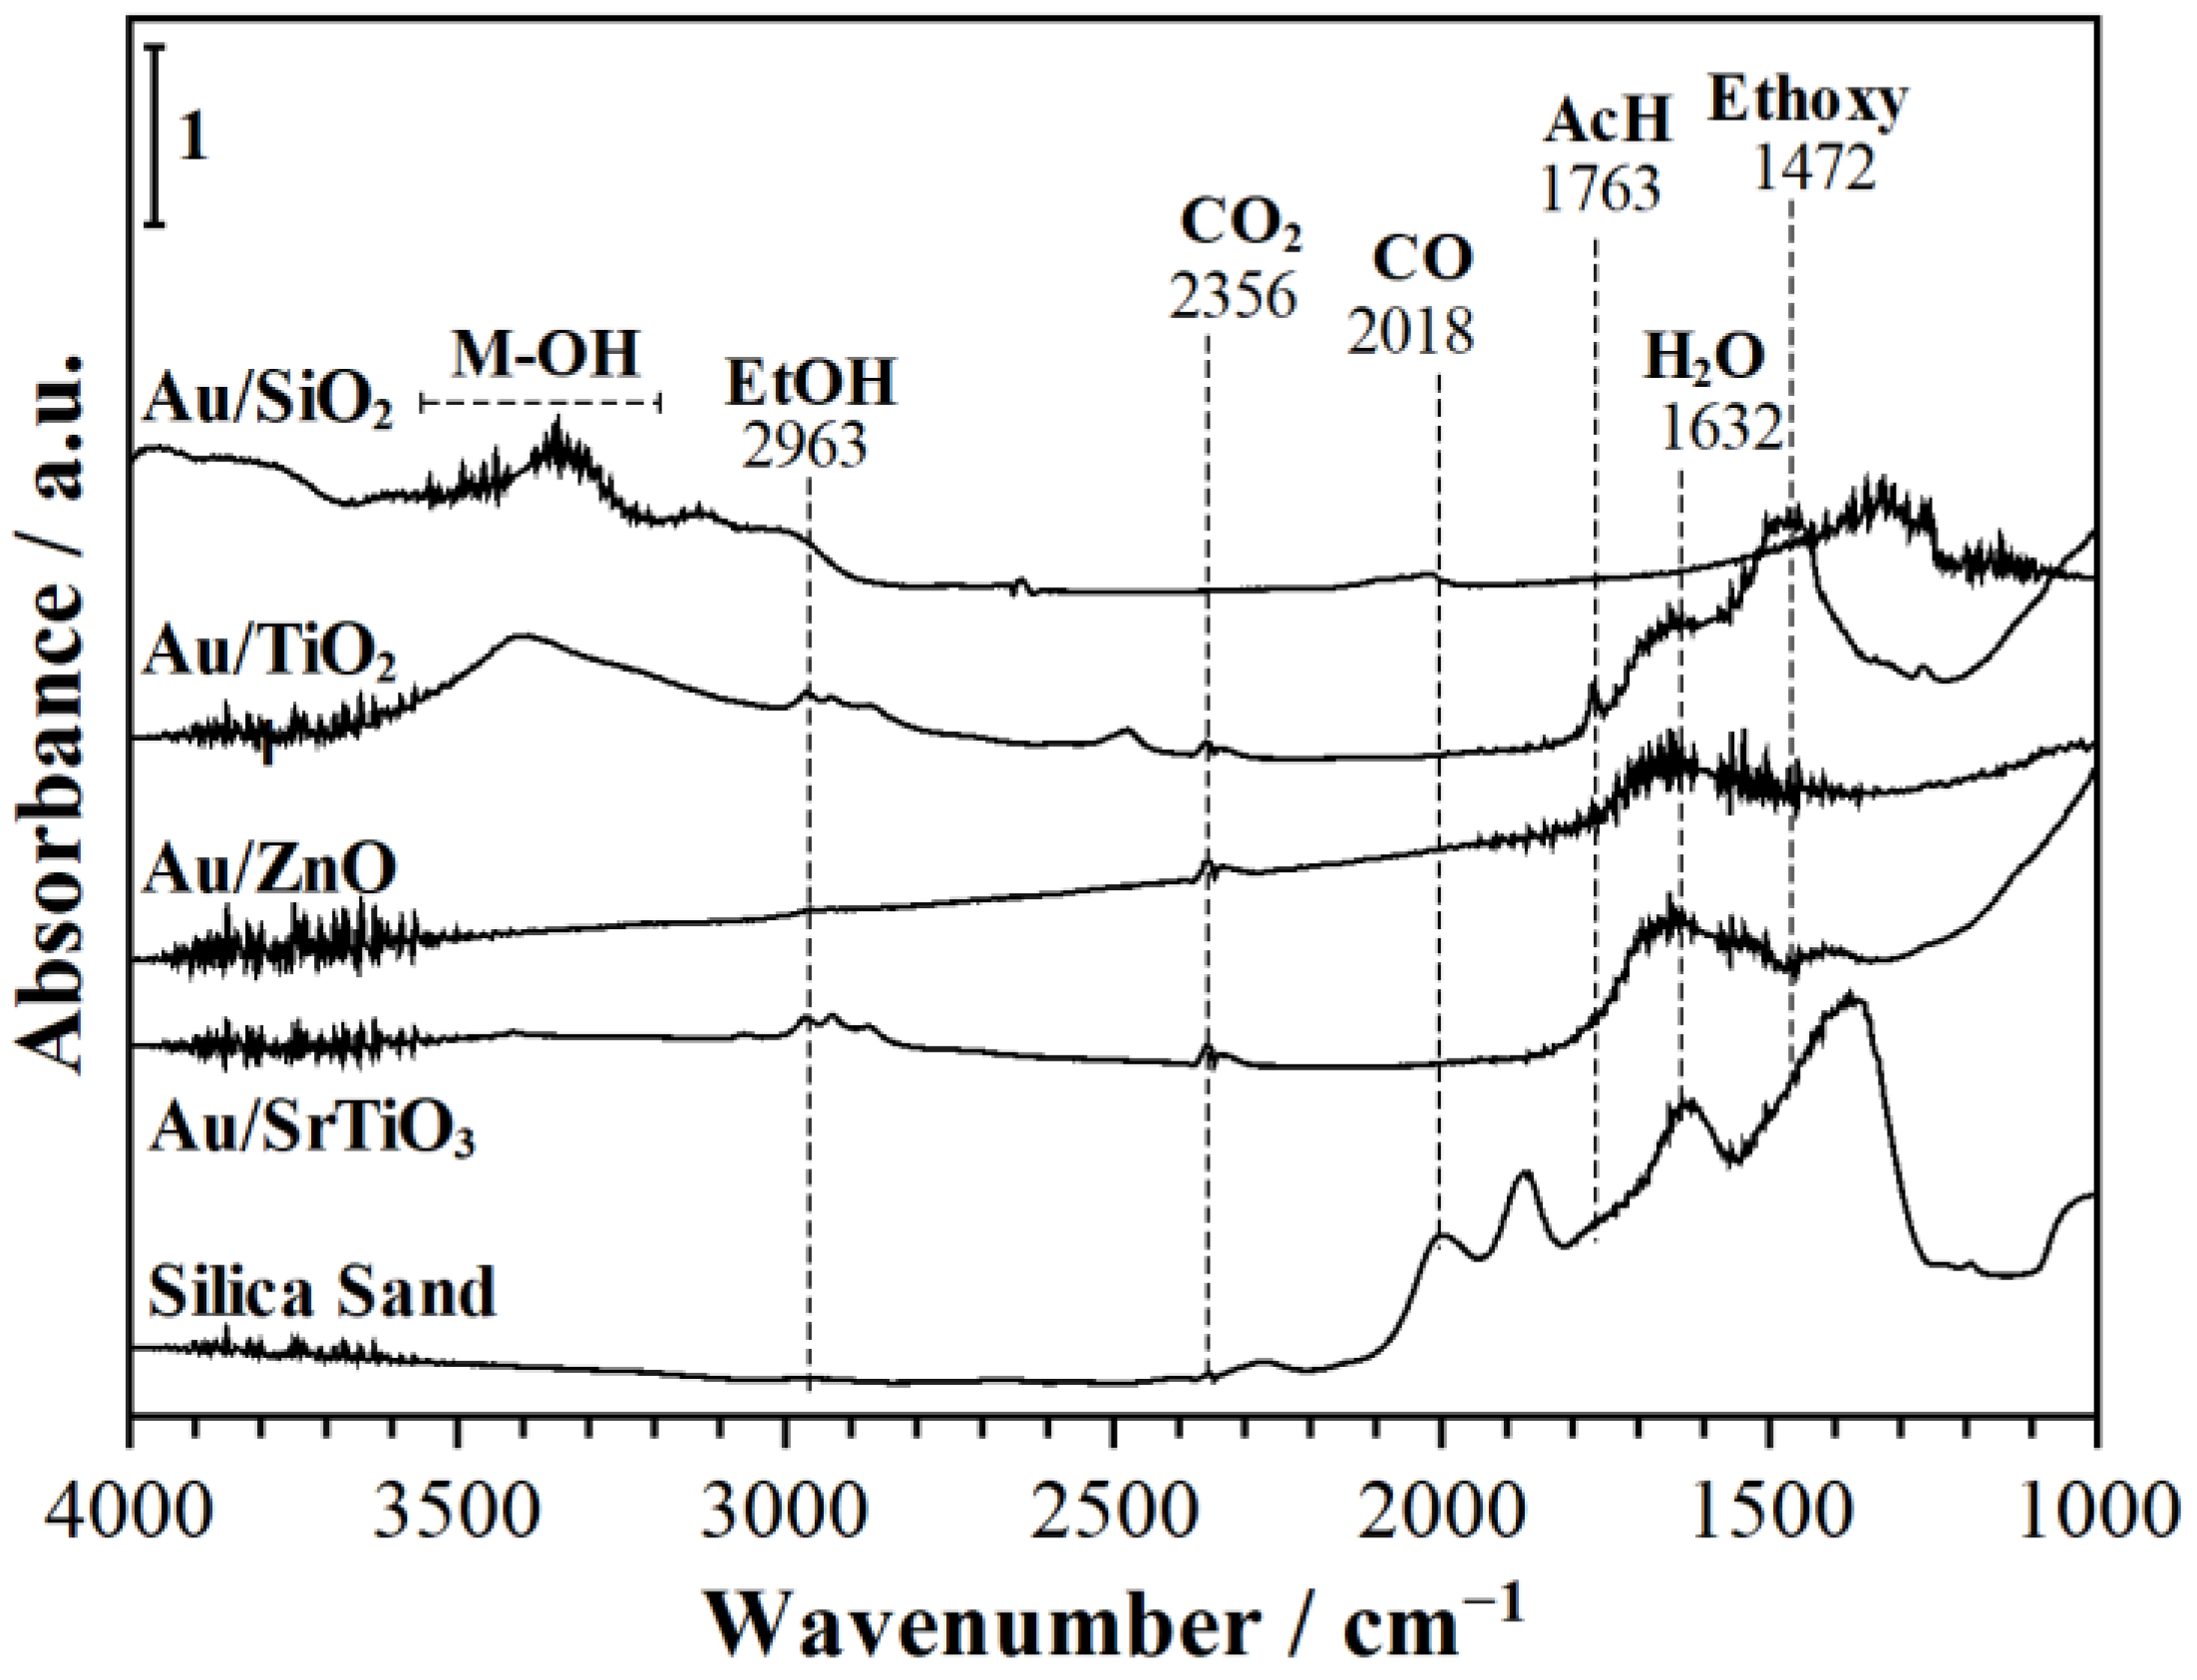
  • Hydroxyls stretching (-OH). (i) During EtOH modulation (Figure 7), 3673 cm−1 (on Au/SiO2); 3690 cm−1 (on Au/TiO2); and 3690 cm−1 (on Au/SrTiO3). (ii) During O2 modulation (Figure 8), ~3700 cm−1 (on Au/SiO2); 3690 cm−1 (on TiO2); ~3700 cm−1 (on Au/ZnO); and ~3700 cm−1 (on Au/SrTiO3). These signals could arise from adsorbed ethanol and/or support metal hydroxyls [52,53,54,55,56,61].
  • Adsorbed acetaldehyde (AcH). (i) During EtOH modulation (Figure 7), 1740, 1718, 1658, and 1707 cm−1. (ii) During O2 modulations (Figure 8), 1709, 1718, 1363, and 1700 cm−1 for Au/SiO2, Au/TiO2, Au/ZnO, and Au/SrTiO3, respectively [54,55,60,62].
  • Adsorbed acetate. (i) During EtOH modulation (Figure 7), 1560, 1546 cm−1. (ii) During O2 modulations (Figure 8), 1560 and ~1560 cm−1 for Au/ZnO, and Au/SrTiO3, respectively.
  • Surface ethoxy. (i) During EtOH (Figure 7), 1395 and 1051, 1380 and 1065, 1440, and 1382 and 1058 cm−1. (ii) During O2 modulations (Figure 8), 1382 and 1060, 1477, 1447, and 1386 and 1070 cm−1 for Au/SiO2, Au/TiO2, Au/ZnO, and Au/SrTiO3, respectively [51,56].
  • Among other relevant peaks, broad shoulders in the range of 3500–3000, 2500–2000, and ~1275 cm−1 are indicative of ethanol, water, and hydrogen being bonded to the surface hydroxyl groups (OH), trapped electrons (especially during O2 modulations on Au/TiO2 and Au/ZnO), and carbonates, respectively.
A summary of all peak assignments is listed in Table S2. These findings align with the conversion of ethanol into acetaldehyde and acetates via the oxidation of ethoxy species.
A qualitative comparison of the dissociatively adsorbed ethanol peak at ~1060 cm−1 during ethanol MES (Figure 7) shows that its peak intensity is relatively higher on Au/TiO2 when compared to Au/SiO2 and Au/SrTiO3. The catalytic activity results performed in the FBR also indicate that the Au/SiO2 and Au/SrTiO3 catalysts are more active towards ethanol oxidation than the Au/TiO2 and Au/ZnO catalysts. These results imply that the lower intensity of adsorbed ethanol on Au/SiO2 and Au/SrTiO3 catalysts is likely due to their higher ethanol conversion. In Au/SiO2, ethanol and oxygen MES phase-domain results lack peaks due to acetates. This is possibly due to this catalyst’s lower activity toward acetate formation, a result that is consistent with operando and catalytic activity studies. On the other hand, acetate peaks at ~1550–1560 cm−1 are observed on Au/ZnO and Au/SrTiO3 catalysts during both ethanol and O2 modulation. These results were consistent with acetate formation on Au/ZnO and Au/SrTiO3 [55,63,64] and with the modulation of the MS fragment (Figure 5 and Figure 6) for acetic acid (m/z = 60).
Along with previous observations, phase-domain plots obtained during O2 modulation (Figure 8) provide an insight into electron transfer into shallow traps in the support, which occurred during ethanol dehydrogenation near the gold–support interface. These shallow traps occur due to the presence of imperfections (e.g., vacancies), giving rise to various electronic states near the conduction band of the support. In the present experiments, these shallow traps are evident in the 2500–2000 cm−1 (0.30–0.25 eV) region and occurred during O2 modulation in the following decreasing order of intensity: Au/ZnO > Au/TiO2 > Au/SrTiO3 [65,66,67]. These results were also in line with electronic d-d transitions captured in the range of 800–1000 nm (1.55–1.24 eV) during O2 modulation in these catalysts [68].
Previous applications of the ME–PSD methodology largely emphasized the phase domain, examining the phase shift (argument) of spectral signals. This was achieved by performing an IDFT on frequency-domain data, isolating responses to the fundamental modulation frequency. As shown in earlier sections, the DFT analysis of the ME–DRIFTS data yields frequency-domain plots, facilitating data quality assessment and spectral response evaluation to feed modulation. The frequency domain can also allow an analysis of the spectral background, response waveforms, trends in decaying or growing spectral signals, and signal response to modulation. To gain further knowledge about these different species, spectral data were also filtered at lower frequencies (0.07f0, 0.5f0) and at higher harmonics (2f0, 3f0) of the fundamental frequency, as described in the next section. The analysis of phase-domain spectra at different low and high frequencies will help investigate spectators, slow, and fast-reacting surface species and/or surface coverage changes characterizing the spectrokinetic behavior of these catalysts.

2.2.6. Phase-Domain Trace Plots During ME-PSD-DRIFTS with PSD at 0.07f0, 0.5f0, 2f0, and 3f0

Figures S10–S17 present the frequency-domain plots for all ME–PSD–DRIFTS for the C-H stretching vibration during ethanol and oxygen modulation. This type of plot is useful, as it illustrates the different frequencies that constitute a waveform, which can be employed for frequency filter selection. Figure 9 and Figure 10 present the phase-domain spectra obtained at 0.07f0 (orange), 0.5f0 (orange), f0 (black), 2f0 (green), and 3f0 (green) for Au/SiO2, Au/TiO2, Au/ZnO, and Au/SrTiO3 during ethanol and oxygen modulation, respectively. To represent the spectra at the highest possible concentration of the modulating reactant, the spectra were acquired and reported at ~89 s (0.07f0), ~45 s (0.5f0), ~30 s (f0), ~13 s (2f0), and ~9 s (3f0) for all catalysts. Similar to the phase-domain spectra represented in Figure 7 and Figure 8, the spectra in Figure 9 and Figure 10 were obtained at 513 K, 101 kPa with ethanol feed modulation going from EtOH (1 kPa) + O2 (1.5 kPa) + Inert (balance) to O2 (1.5 kPa) + Inert (balance) and in O2 feed modulation going from EtOH (1 kPa) + O2 (1.5 kPa) + Inert (balance) to Ethanol (1 kPa) + Inert (balance). In the present work, the results at different frequencies for each catalyst in Figure 7, Figure 8, Figure 9 and Figure 10 came from a single experiment, which were possible due to the quasi-square waveform shape of the modulation.
Figure 9 confirms expectations for the presence of the C-H stretching bond modulation in the range of 3000–2800 cm−1, primarily during ethanol modulation. The constant appearance of these peaks at f0 and higher harmonics nf0 (n = integer number) indicate that the species involving these peaks are part of relatively fast reactions. A higher intensity of the peaks at odd harmonics 1f0, 3f0, and 5f0 along with lesser intensity signals at 2f0 further confirm that the discussed species followed a pseudo-square waveform (here, it was a combination of square + sawtooth waveforms) [48]. These results are consistent with time-domain absorption IR spectra (Figure S2–S5) and MS data obtained at the outlet of the reactor (ethanol modulation shown in Figure 3, Figure 4, Figure 5 and Figure 6) for all the catalysts. Also, the positive areas in these peaks indicate that they are formed during high concentrations of ethanol. Hence, these peaks indicate fast-forming species such as adsorbed ethanol or ethoxy species during ethanol oxidation. The adsorbed acetaldehyde peak observed at ~1710 cm−1 is present during both ethanol and O2 modulation over all the catalysts. However, its peak intensity is minimal for Au/SiO2 and nearly absent at higher harmonics, suggesting that the lowest concentration of adsorbed acetaldehyde on this catalyst is due to rapid desorption upon formation [36,55,60]. These results align with the MS and FBR catalytic screening results, which showed the highest selectivity for acetaldehyde formation and the lowest selectivity for its oxidation products (e.g., acetates) on Au/SiO2.
In the case of Au/TiO2, Au/ZnO, and Au/SrTiO3 catalysts, the acetaldehyde peak is observed not only at the fundamental modulation frequency but also at lower frequencies and higher harmonics of f0, implying the presence of two possible surface reactions on these catalysts. The downward pointing peak indicates that adsorbed acetaldehyde species undergo different processes such as (i) desorption from the catalysts’ surface (negative peak observed at higher harmonics); (ii) fast reaction such as decomposition; and/or (iii) slow oxidation to form products such as acetates (as evidenced from acetaldehyde reaction in the phase-domain plot at lower harmonics). A close inspection of the phase domain at the low frequencies revealed an upward-pointing peak for acetate (~1543 cm−1) paired with a downward-pointing peak for acetaldehyde (~1710 cm−1) during ethanol modulation. This indicates that acetaldehyde oxidation and acetate formation are slow reactions, and that acetaldehyde oxidation leads to acetate formation. This suggests that acetaldehyde and acetates are primary and secondary products, respectively, confirming the selectivity observed during the FBR catalytic studies.
Similar to adsorbed acetaldehyde, the behavior of surface acetates in Figure 9 suggests their involvement in distinct processes. In the first process, acetate desorption from the catalyst surface is faster (indicated by downward peaks at 2f0 and 3f0). The second process is the slow oxidation of acetates to CO2 (indicated by downward peaks at low frequencies of 0.07f0 and 0.5f0). The intensity of the upward-forming CO2 peaks (~2360 and 2333 cm−1) increased with a decreased modulation frequency, suggesting strong CO2 adsorption upon formation, with limited modulation at higher harmonics, except for a small portion on Au/SiO2. Phase-domain trace plots at various filtered frequencies (Figure 10) showed trapped electron movement during O2 modulation only at the fundamental frequency (f0) and at higher harmonics (2f0 and 3f0). These results confirm the fast kinetics of charge transfer during ethanol dehydrogenation on Au and its transfer to the support.

2.3. Modulation Excitation–Phase Sensitive Detection–Diffuse Reflectance UV–Vis Spectroscopy (ME–PSD–DRUV–Vis)

In situ UV–Vis spectroscopy was used to analyze Au maximum plasmon peak shifts (MaPPS) and d-d transition relative intensity changes (TRIC) to estimate species adsorption location and charge transfer [68,69]. The experimental setup for UV–Vis Au MaPPS and MES consisted of an in situ diffuse reflectance reaction cell with a high-temperature diffuse reflectance probe, along with deuterium and halogen lamps. This setup enabled data collection in the 200–1100 nm range with a relatively fast rate (~1 s/spectrum). Detailed experimental and data analysis procedures are described elsewhere [68,69]. These studies confirmed O2 species adsorption at the Au–support interface, regardless of the type of metal oxide support, and the prevalence of charge transfer at reaction conditions.
Modulation excitation–phase sensitive detection–diffuse reflectance UV–Vis spectroscopy (ME–PSD–DRUV–Vis) experiments with oxygen modulation were conducted following a similar protocol to ME–PSD–DRIFTS. ME–PSD–DRUV-Vis phase-domain trace plot results (with PSD at the fundamental frequency) are shown in Figure S26. The d-d transition region (~800–1000 nm) indicates the presence of charge transfer to/from the metal oxide support, while plasmon changes (~550–700 nm) reflect a charge transfer to/from the gold nanoparticle [68,69]. This charge transfer has been shown to be kinetically relevant for activating oxygen species at the gold–support interface. The decreasing order of charge transfer to/from the gold nanoparticle (inferred from the maximum intensity change in the plasmon region in Figure S26) was Au/SrTiO3 > Au/ZnO > Au/TiO2 > Au/SiO2. The d-d transition changes in Figure S26 also showed a decreasing order of support reducibility as follows: Au/ZnO > Au/TiO2 > Au/SrTiO3 > Au/SiO2. Similarly, ME–PSD–DRIFTS intensity changes (1600–2700 cm−1) indicated that the charge transfer to shallow traps in semiconducting supports (SrTiO3, ZnO, TiO2) followed the order Au/ZnO > Au/TiO2 > Au/SrTiO3 (Figure 10). Given the superior acetate formation activity of Au/SrTiO3 (Figure 1), catalyst reactivity appears to correlate with the overall charge transfer to Au nanoparticles and not with support reducibility or shallow trap charge transfer. This suggests that other factors, such as reactants/product adsorption and active site availability, likely also play a role in determining catalytic activity and selectivity.

2.4. Possible Reaction Intermediates and Reaction Scheme During Ethanol Oxidation

From all the results leading to the assessment of the adsorbed species on the catalyst surface (in Section 2.2.5) and their dynamic changes during MES conditions (in Section 2.2.6), it can be concluded that the studied Au catalysts exhibit similar reaction intermediate species, although the kinetics of these species are different. A sequence of reaction pathways can be then proposed:
  • Reactant adsorption. Ethanol oxidation reaction on metal oxide supported gold catalysts proceeds through the dissociative adsorption of ethanol on the catalyst surface (Figure 7 and Figure 8), more likely on Au. This was demonstrated by DFT calculations on Au5/TiO2(101) [68]. The preferable adsorption of O2 at the Au–support interface, as mentioned in Section 2.3, was also evidenced by an in situ gold maximum plasmon peak shift (MaPPS) methodology, described in Refs. [68,69] (Scheme 1, steps 1 and 5).
  • Ethanol dehydrogenation. Adsorbed ethanol dehydrogenates to form ethoxy species (at 1000–1200 cm−1 described in Section 2.2.4) in a fast elementary step, which is likely equilibrated and forms H species. This proton can transfer charge to Au, as evidenced from the signals due to trapped electrons at 2000–2500 cm−1 in Figures S23 and S24 (Scheme 1, step 2).
  • Oxygen reaction at the interface. The H species formed on gold can diffuse rapidly to the Au–support interface, where it can react with O2 (Section 2.3) to form hydroperoxyl species (OOH) in a fast step (Scheme 1, step 5), as proposed recently via a charge-transfer spectrokinetic analysis (CT–SKAn) methodology [68]. This fast reaction is also evidenced in phase-domain plots obtained during O2 modulation in Section 2.2.6. O2 activation at the metal-support interface in the presence of charge transfer from Au can also occur dissociatively to form On− and OH species (Scheme 1, step 6). The CT–SKAn methodology recently showed that Au/TiO2, OOH, On−, and OH are kinetically relevant reaction intermediates for ethanol oxidation [68].
  • Acetaldehyde formation. Adsorbed ethoxy species can be oxidized at the Au–support interface with activated O2 species, most likely with atomic oxygen [32,68] to form acetaldehyde and H2O, which are adsorbed at the surface, as evidenced from bands in the 1700–1740 cm−1 and 3300–3500 cm−1, respectively, as detailed in Section 2.2.6 (Scheme 1, steps 3, 9).
  • Acetic acid formation. The ME–PSD–DRIFTS results point to the further oxidation of acetaldehyde to acetic acid (Scheme 1, step 7), primarily on Au/SrTiO3, which more strongly adsorbs acetaldehyde (Scheme 1, step 3) on the catalyst surface. MES spectral dynamic changes point to adsorbed acetaldehyde undergoing different surface processes. In one process, weakly adsorbed acetaldehyde desorbs to the bulk phase via a fast elementary step (Scheme 1, step 4). In the second process, strongly bonded acetaldehyde is oxidized to acetic acid in a slow step, as evidenced from MS (Section 2.2.2) and discussed in Section 2.2.6 (Scheme 1, step 7). Au/SrTiO3, which exhibited the highest activity for acetate (acetic acid and ethyl acetate) formation, also showed the rapid desorption of these species (Scheme 1, steps 8 and 13), preventing combustion to CO2 (Section 2.2.6, Scheme 1, steps 10 and 11).
  • ME–PSD–DRIFTS also indicated strong CO2 adsorption on all catalysts, along with a strong affinity for water (Scheme 1, step 9), further evidenced by the slow water desorption (Scheme 1, step 12) detected by MS (Section 2.2.2).
Based on the above observations, Scheme 1 summarizes the reaction intermediate species identified through the spectroscopic analysis of MES measurements and proposes reaction pathways for ethanol oxidation on gold catalysts.

3. Materials and Methods

3.1. Materials

Four catalysts were employed in this study: Au/TiO2 (3 nm), Au/ZnO (2.9 nm), Au/SiO2 (4.8 nm), and Au/SrTiO3 (4.3 nm). The first two catalysts were purchased from Strem Chemicals Inc. (Newburyport, MA, USA), Au/TiO2 (AUROliteTM, 1.06 wt% Au as reported by vendor) and Au/ZnO (AUROliteTM, 0.99 wt% Au as reported by vendor). The Au/SiO2 and Au/SrTiO3 catalysts (each at 1.03 wt% Au as determined by XRF) were synthesized in-house. For this preparation, the following chemicals were used: chloroauric acid (HAuCl4·3H2O, 99.99%, Alfa Aesar now part of Thermo Fischer Scientific, Waltham, MA, USA), silica (SiO2, Davisil XWP 1000A, W.R. Grace Co., Columbia, MD, USA), strontium titanate (SrTiO3, 99%, Sigma-Aldrich, St. Louis, MO, USA), HPLC-grade water (Fisher Scientific, a subsidiary of Thermo Fischer Scientific, Waltham, MA, USA), and sodium hydroxide (NaOH, ≥97%, Sigma Aldrich, St. Louis, MO, USA). Other chemicals used for the experiments included ethanol (99.5%, Fisher Scientific, a subsidiary of Thermo Fischer Scientific, Waltham, MA, USA) and barium sulfate (99%, Sigma-Aldrich, St. Louis, MO, USA). All gases were procured from Matheson (Topeka, KS, USA) including helium (He, UHP, 99.999%), oxygen (O2, UHP, 99.98%), 10% oxygen in argon, and argon (Ar, UHP, 99.999%). All gas cylinders were equipped with moisture filters (450B series, type 451, Matheson, Topeka, KS, USA). Moreover, in the case of He and Ar gas cylinders, oxygen (P/N N9301179, Perkin Elmer, Shelton, CT, USA) and hydrocarbon traps (450B series, type 454, Matheson, Topeka, KS, USA) were employed.

3.2. Catalyst Preparation

Au/SiO2 and Au/SrTiO3 catalysts were synthesized by the deposition–precipitation (DP) method employing ammonia and NaOH as titrants, respectively. For Au/SiO2, 3 g of support was dispersed in 60 cm3 of water under constant stirring (150 rpm, MS-H-Pro Plus hotplate-stirrer, Scilogex, Rocky Hill, CT, USA). A 2.5 wt% solution of NH4OH was gradually added until the pH reached 9.5. Subsequently, 24.2 cm3 of 0.0063 M HAuCl4·3H2O was slowly added while maintaining the pH around 10 by the simultaneous co-addition of the NH4OH solution. The slurry was continuously stirred for 1 h (350 rpm), followed by filtration, extensive washing, and vacuum drying for 12 h at room temperature. In the case of Au/SrTiO3, 1 N NaOH was added dropwise to 150 cm3 of 1.03 mM HAuCl4·3H2O until a pH of ~6. Subsequently, 3 g of support was introduced under stirring (450 rpm), leading to a rise in pH to around 9.3. The mixture was stirred at 500 rpm and heated at 70 °C for 1 h. After cooling to room temperature for 30 min, the solution underwent filtration, washing, and drying as previously described. The Au/SiO2 and Au/SrTiO3 catalysts were then treated in static air at 673 K for 4 h (temperature ramp of 4 K/min) in a muffle furnace (Thermolyne 48000, Barnstead International, a subsidiary of Thermo Fischer Scientific, Waltham, MA, USA). Similarly, the commercial Au/TiO2 and Au/ZnO (~1 wt% Au) samples were calcined at 673 K (4 K/min) for 4 h. TEM characterization showed that the average gold nanoparticle sizes for Au/SiO2, Au/TiO2, Au/ZnO, and Au/SrTiO3 were 4.8 ± 2.9, 3.0 ± 0.9, 2.9 ± 1.1, and 4.3 ± 1.2 nm, respectively. Following the loading of samples into the reaction cell, all catalysts underwent a pretreatment in a O2–He mixture (20%) at 400 °C (10 °C/min) for 1 h.

3.3. Catalyst Characterization

Modulation excitation spectroscopy with phase sensitive detection (ME–PSD) was conducted using DRIFTS and DRUV–Vis spectroscopies at ethanol oxidation conditions. This approach aimed to assess the nature of adsorbed and active reaction intermediate species, the location of adsorbed active oxygen species, and to determine the differences in the surface species during the progression of ethanol oxidation reaction over Au/SiO2, Au/TiO2, Au/SrTiO3, and Au/ZnO catalysts.

3.3.1. ME–PSD Experimental Setup

In this work, modulation is achieved by periodically changing the concentration of one of the reactants between two different feed values. As shown in Figure 11, this is performed by passing feed 1 (high concentration) and feed 2 (low concentration) alternatively through the reaction cell (or bypass) with the help of a 6-way valve while simultaneously collecting the spectra with IR or UV–Vis.
Different reactant concentrations in feed 1 and feed 2 were used, while adjusting the remaining components concentrations for constant oxygen or ethanol partial pressures and total flow through the lines. Liquid ethanol is pumped to a heated injection port where it is vaporized. Vapor ethanol is then transferred to the reactor via insulated and heated lines to about 353–363 K to prevent condensation. The catalyst is placed in a low void volume (~1 cm3) reaction cell, providing a short residence time for the gases to roughly match the FTIR spectra sampling time (~1 s). Continuous spectra collection of the catalyst under in situ conditions is facilitated via a Praying Mantis mirror optics (Harrick Scientific, Pleasantville, NY, USA) for capturing diffuse reflectance IR and via optical fibers for capturing diffuse reflectance UV–Vis light.
Bulk gas-phase concentration tracking is performed with an online mass spectrometer (OmniStar GSD 320 O, Pfeiffer, Nashua, NH, USA) connected to the reaction cell outlet. In a typical experiment, approximately 45 mg of freshly calcined (623 K, 2 h, static air) and meshed (45–75 μm) catalyst particles were loaded into the reaction cell and heated to the reaction temperature in a 10% O2/Ar (25 NTP cm3/min) flow (feed 2, load mode, solid line in 6-port valve). Simultaneously, a mixture of 10% O2/Ar (1.5 kPa), ethanol (1 kPa, ~112 μL/h of liquid ethanol), and He balance is allowed to flow in feed 1, which is vented before the modulation experiment.
To initiate the feed concentration modulation, the 6WV is switched periodically between feed 2 and feed 1 every 45 s (via a LabVIEW 2018 VI program routine), leading to a period of 90 s (1/90 Hz), which is repeated at least 15 times. The fundamental modulation frequency (f0 = 1/90 Hz = 0.0111 Hz) falls within typical reaction turnover frequencies. DRIFTS spectra are collected approximately every 1 s (16 scans, 4 cm−1) using a rapid scan FTIR spectrometer (Vector 70, Bruker, Billerica, MA, USA) equipped with a mercury–cadmium–telluride detector (MCT D316/BP). Spectra are plotted as pseudo-absorbance, log(1/R), where R is the relative reflectance, but will be referred to as absorbance for simplicity. Next, we will describe the experiments carried out for the modulation excitation–phase sensitive detection–DRIFTS to assess the presence of surface reaction species.

3.3.2. ME–PSD–DRIFTS Experimental Conditions During Ethanol Modulation

To carry out a ME–PSD–DRIFTS experiment with ethanol modulation, the ethanol concentration varied at a specific periodic frequency while keeping the oxygen concentration, total flow rate, pressure, and temperature constant. To achieve this, feed 1 consisted of 1 kPa ethanol (~112 μL liquid ethanol/h injected into the lines), 1.5 kPa O2 (1.18 NTP cm3/min), and helium balance, resulting in a total flow rate of ~80 cm3/min. Meanwhile, feed 2 consisted of 1.5 kPa O2 (1.18 NTP cm3/min), 1 kPa Ar (~0.8 NTP cm3/min, to match ethanol partial pressure), and helium balance to maintain a constant total flow rate of 80 NTP cm3/min. Throughout the modulations, the pressure in the feed 1 and feed 2 lines were kept relatively constant, with valves installed in the 6WV vent line.

3.3.3. ME–PSD–DRIFTS Experimental Conditions During Oxygen Modulation

Similar to the ethanol modulation experiments, during ME–PSD–DRIFTS with oxygen modulation, the oxygen concentration was varied while keeping the ethanol concentration constant. In this case, feed 1 consisted of 1 kPa ethanol and 1.5 kPa O2, with the remainder being helium to maintain a total flow rate of 80 cm3/min. Feed 2 contained 1 kPa ethanol (~112 μL liquid ethanol/h), 1.5 kPa Ar (1.18 NTP cm3/min), and helium balance to maintain a total flow rate of 80 NTP cm3/min. Alternating between feed 1 (with O2) and feed 2 (without O2) ensured oxygen modulation while keeping the ethanol concentration constant.

3.3.4. Modulation Excitation–Phase Sensitive Detection Methodology

In situ infrared spectra are characterized by the presence of peaks, bands, and shoulders, which can originate from surface reaction intermediate and/or spectator species, noise, gases (or liquids), vibrations, and/or background baseline shifts. At high temperatures, pressures, and concentrations of reactants and/or products, the spectra can become increasingly crowded due to the above contributions. Distinguishing the peaks belonging to reactive surface intermediate species from those resulting from other factors requires methods capable of tracking dynamic changes during the reaction. To accomplish this, our preferred method for analyzing DRIFTS and UV–Vis spectra is modulation excitation spectroscopy combined with phase-sensitive detection techniques via a general Fourier transformation approach [48]. To carry out spectra analysis during reactant modulation, we applied the ME–PSD technique by means of an in-house Python code. The following general steps were followed to track down the surface-adsorbed reaction intermediate species that respond to a selected frequency of feed modulation.
  • The reactant concentration is varied in a periodic fashion while simultaneously collecting infrared or UV–Vis spectra.
  • IR and/or UV–Vis spectra are swiftly and consistently acquired at regular intervals (~1–2 spectra per second) to capture surface alterations coinciding with periodic changes in gas concentrations. The spectra are plotted in what is called the time domain.
  • These time-domain spectra are processed via the Fourier transform (FT) equation, transforming time-domain data, f(t), into the frequency domain, F(ω).
    F ( ω ) = 1 2 π f t e i ω t d t
    However, the above equation is solved in a form to deal with equally spaced spectral datasets, which is called the discrete Fourier transform (DFT). The solution to the DFT is performed with the fast Fourier transform (FFT) algorithm via the “fft” function in Python (https://www.python.org/). The resultant data will present the spectral response as a function of frequency, which is commonly referred to as the frequency domain.
  • At this stage, one sorts the frequencies in ascending order (i.e., with the fft shift function in Python) and selects a frequency or range of frequencies of interest to filter the different species contributions to the spectra. Usually, the fundamental frequency (e.g., 1/90 Hz) is chosen to filter out reactive species that respond to that modulation frequency.
  • Then, the filtered data in the frequency domain, F(ω), is processed via the inverse Fourier transform (IFT) to recreate the original data into an averaged f(t), where this t corresponds to the time of a single modulation period.
    f ( t ) = F ( ω ) e i ω t d ω
    Technically, this spectral response can be plotted against time (of a single period, in this case from 0 to 90 s), radians (0 to 2π), or degrees (0 to 360°). This is the reason why the data is said to be in the phase domain, and it contains spectral contributions from species that respond to modulation at the chosen frequency or frequencies.
    The above IFT equation is solved for discrete datasets via its inverse discrete Fourier transform (IDFT). We perform this transformation within Python using the “ifft” function, which effectively reverts the “filtered” data in the frequency domain back into the time domain of a single period (i.e., phase domain).
  • The resulting “phase domain” dataset represents an average across all periods and in this work, for simplicity, it is plotted in time units. The specificity of the spectral response will depend on the frequency or frequency range chosen for filtering. When the filtered frequency is the fundamental one, the data obtained in the “phase domain” correspond to the sinusoidal contribution to the waveform, irrespective of the waveform shape of the system species.
At modulation frequencies in the range of turnover frequencies or higher, the observed surface species in the infrared spectra will likely be fast reactive intermediate species, whereas features observed at low frequencies will contain contributions from slow reacting species.

3.4. Catalytic Activity Testing

The catalytic activity for ethanol oxidation was investigated using a fixed bed reactor made of 304 stainless steel (11 mm ID, 12.7 mm OD, 427 mm long) with VCR Swagelok end connections. To prevent direct contact between the reactants and products and the reactor metal surface, an inner concentric quartz tube (8 mm ID, 10 mm OD, 432 mm long) was used to house the catalyst. Silicone O-rings (1.5 mm thick, 10 mm diameter) compressed with the VCR gasket secured the quartz tube at both ends, forcing the gas flow exclusively through the quartz tube.
Approximately 20 mg of Au catalyst fine powder, with a meshed particle size less than 38 µm, was combined with about 80 mg of pre-calcined silica (Davisil XWP 1000A, W.R. Grace, Columbia, MD, USA). The silica had a meshed particle size below 38 µm and was calcined at 873 K for 5 h in static air using a muffle furnace. This mixture (total ~100 mg) was pelletized into larger meshed particles (125–250 µm). The catalyst bed was supported by a small piece of quartz wool and a hollow quartz tube to minimize dead volume and maintain its position in the vertical reactor.
The catalyst temperature was controlled using a high-temperature furnace equipped with a temperature controller (GSL-1000X-NT-110-LD, MTI Corp, Richmond, CA, USA) and monitored with a K-type thermocouple (1/16”, KMQXL-062G-18, Omega, Norwalk, CT, USA) placed within a thin quartz insert in direct contact with the catalyst. Before the reaction, the catalyst was treated in the reactor with a gas mixture of 20% O2 in He (50 cm3/min) at 673 K (1 K/min) and 101 kPa for 60 min to remove moisture, then cooled down to the reaction temperature. The reactor was then flushed with He (50 cm3/min) for 30 min to remove pretreatment gases.
Ethanol oxidation was initiated by injecting liquid ethanol with a syringe pump in a heated port to vaporize ethanol. This vapor was in contact with a flow of gases composed of the required concentration of O2 and balancing He. All lines to and from the reactor were heated to 353 K using electric heating tapes to maintain ethanol and products in the vapor phase. Reaction products and unreacted ethanol were analyzed using an online SRI 8610C GC equipped with an Rt-Q-Bond Plot column (30 m length, 0.53 mm diameter, P/N 19742–6850, Restek) and a methanizer coupled with a flame ionization detector (FID) for separating and identifying COX, hydrocarbons, and oxygenates. Quantification was performed by calibrating the GC with standard gas mixtures and conducting blank runs.

4. Conclusions

In conclusion, this study demonstrates the effectiveness of in situ modulation excitation spectroscopy techniques in identifying key surface intermediates and reaction pathways during the vapor-phase oxidation of ethanol on Au catalysts supported on various materials. The catalytic performance of Au/SiO2 and Au/SrTiO3 was higher than Au/ZnO and Au/TiO2. However, these catalysts had distinctive product selectivities; for example, Au/SiO2 favored acetaldehyde formation and Au/SrTiO3 had the highest acetate production among all the catalysts. The ME–PSD–DRIFTS analysis provided valuable insights into the surface species involved, including adsorbed ethanol, acetaldehyde, acetates, water, ethoxy, and hydroxyl groups. Similarly, charge transfer to support shallow traps during oxygen modulation suggested that hydrogen spillover and hydroxyl dynamics were prevalent on Au/TiO2 and Au/ZnO. The combination of catalytic activity tests and the analysis of MES spectra at low frequencies and high harmonics of the fundamental modulation frequency revealed that surface ethoxy species form and decompose rapidly, while acetaldehyde conversion to acetates and acetates into CO2 are slower secondary processes. A charge transfer occurs upon the Au spillover of hydrogen in a fast process along with the desorption of adsorbed acetaldehyde and acetates that reduce the formation of sequential products. A comparative analysis via the differentiation of the peak intensity of spectra in the phase domain also shed light on the reasons for the catalysts’ activity and/or selectivity. For example, the catalysts giving the highest ethanol conversion (Au/SiO2, Au/SrTiO3) showed the least intensity of the adsorbed ethanol peak. Similarly, the lowest activity towards acetates on Au/SiO2 was reflected on the weakest acetate peak on the catalyst surface. The charge transfer movement to the support shallow traps tracked via ME–PSD–DRIFTS and to Au via ME–PSD–DRUV–Vis indicated that the latter correlated with Au/SrTiO3, Au/ZnO, and Au/TiO2 catalysts’ acetates formation rate. This suggested that an effective selective oxidation gold catalyst towards acetaldehyde and acetate products will have a combined large charge transfer and weak adsorption ability for acetates. These findings will be useful in proposing ethanol oxidation reaction mechanisms on Au-based metal-oxide-supported catalysts and underscore the utility of MES techniques for advancing the understanding of catalytic processes. This work provided a comprehensive framework for correlating surface dynamics with catalytic activity and selectivity, offering new avenues for catalyst design and optimization including alcohol oxidation reactions.

Supplementary Materials

The following supporting information can be downloaded at: https://www.mdpi.com/article/10.3390/catal15040346/s1, Figure S1: Acetaldehyde and total acetates C2-selectivities during vapor-phase ethanol oxidation on Au/SiO2, Au/TiO2, Au/ZnO, and Au/SrTiO3; Figures S2–S5: Time-domain absorbance response at a wavenumber related to C-H stretching during ethanol ME-PSD-DRIFTS on Au/SiO2, Au/TiO2, Au/ZnO, and Au/SrTiO3, respectively; Figures S6–S9: Time-domain absorbance response at a wavenumber related to C-H stretching during oxygen ME–PSD–DRIFTS on Au/SiO2, Au/TiO2, Au/ZnO, and Au/SrTiO3, respectively; Figures S10–S13: Frequency-domain plot at a wavenumber related to C-H stretching for EtOH ME-PSD-DRIFTS experiment during EtOH oxidation at 513 K on Au/SiO2, Au/TiO2, Au/ZnO, and Au/SrTiO3, respectively; Figures S14–S17: Frequency-domain plot at a wavenumber related to C-H stretching for oxygen ME–PSD–DRIFTS experiment during EtOH oxidation at 513 K on Au/SiO2, Au/TiO2, Au/ZnO, and Au/SrTiO3, respectively; Figures S18–S21: Phase-domain contour plot of ME–PSD–DRIFTS for ethanol modulation with PSD at the fundamental frequency during the oxidation of ethanol on Au/SiO2, Au/TiO2, Au/ZnO, and Au/SrTiO3, respectively; Figures S22–S25: Phase-domain contour plot of ME–PSD–DRIFTS for oxygen modulation with PSD at the fundamental frequency during the oxidation of ethanol on Au/SiO2, Au/TiO2, Au/ZnO, and Au/SrTiO3, respectively; Figure S26: Phase-domain trace plot of O2 ME–PSD–DR–UV-Vis during EtOH oxidation on Au/TiO2 with PSD at the fundamental frequency; Table S1: Summary of catalysts’ conversion, selectivities, and production rates at 513 K; Table S2: Summary of relevant infrared peak assignments from the literature. Refs. [36,39,51,52,53,54,55,56,57,58,59,60,61,63,64,70,71].

Author Contributions

Conceptualization, B.S.P. and J.J.B.-S.; methodology, B.S.P., A.T.-V. and J.J.B.-S.; validation, B.S.P.; formal analysis, B.S.P. and A.T.-V.; investigation, B.S.P. and A.T.-V.; resources, J.J.B.-S.; writing—original draft preparation, B.S.P.; writing—review and editing, B.S.P. and J.J.B.-S.; visualization, B.S.P.; supervision, J.J.B.-S.; project administration, J.J.B.-S.; funding acquisition, J.J.B.-S. All authors have read and agreed to the published version of the manuscript.

Funding

This research was funded by the National Science Foundation under grant No CBET-1847655.

Data Availability Statement

Data will be made available on request.

Acknowledgments

The authors gratefully acknowledge the Center for Environmentally Beneficial Catalysis (CEBC) and the University of Kansas for their support of this research.

Conflicts of Interest

The authors declare no conflicts of interest. Also, the funders had no role in the design of the study; in the collection, analysis, or interpretation of data; in the writing of the manuscript; or in the decision to publish the results.

Abbreviations

The following abbreviations are used in this manuscript:
AcOHAcetic acid
DFTDiscrete Fourier Transform
EtOHEthanol
EtOAcEthyl acetate
FBRFixed Bed Reactor
FFTFast Fourier Transform
FTFourier Transform
FTIRFourier Transform Infrared
IDFTInverse Discrete Fourier Transform
IRInfrared
MaPPSMaximum Plasmon Peak Shifts
MEModulation Excitation
ME–PSD–DRIFTSModulation Excitation–Phase Sensitive Detection–Diffuse Reflectance Infrared Fourier Transform Spectroscopy
ME–PSD–DRUV–VisModulation Excitation–Phase Sensitive Detection–Diffuse Reflectance Ultraviolet Visible Spectroscopy
MESModulation Excitation Spectroscopy
MSMass spectrometry
NPNanoparticle
NTPNormal temperature and pressure
PDPhase Domain
PSDPhase Sensitive Detection
RAcetaldehydeProduction rate of acetaldehyde (mol/gcat/s)
RAcetatesProduction rate of acetates, acetic acid + ethyl acetate (mol/gcat/s)
SAcHC2-carbon selectivity to acetaldehyde
SAcetatesC2-carbon selectivity to acetates, acetic acid + ethyl acetate
TRICTransition Relative Intensity Changes
UV–VisUltraviolet-Visible

References

  1. Cherepakhin, V.; Williams, T.J. Direct oxidation of primary alcohols to carboxylic acids. Synthesis 2021, 53, 1023–1034. [Google Scholar]
  2. Morris, H.E. Reactions of ethyl alcohol. Chem. Rev. 1932, 10, 465–506. [Google Scholar]
  3. Chen, J.; Fang, W.; Zhang, Q.; Deng, W.; Wang, Y. A comparative study of size effects in the Au-catalyzed oxidative and non-oxidative dehydrogenation of benzyl alcohol. Chem.—Asian J. 2014, 9, 2187–2196. [Google Scholar]
  4. Evans, W.L.; Day, J.E. The oxidation of ethyl alcohol by means of potassium permanganate. J. Am. Chem. Soc. 1919, 41, 1267–1285. [Google Scholar]
  5. Mallat, T.; Baiker, A. Oxidation of alcohols with molecular oxygen on solid catalysts. Chem. Rev. 2004, 104, 3037–3058. [Google Scholar]
  6. Najafishirtari, S.; Friedel Ortega, K.; Douthwaite, M.; Pattisson, S.; Hutchings, G.J.; Bondue, C.J.; Tschulik, K.; Waffel, D.; Peng, B.; Deitermann, M. A perspective on heterogeneous catalysts for the selective oxidation of alcohols. Chem.-A Eur. J. 2021, 27, 16809–16833. [Google Scholar]
  7. Yamaguchi, K.; Kim, J.W.; He, J.; Mizuno, N. Aerobic alcohol oxidation catalyzed by supported ruthenium hydroxides. J. Catal. 2009, 268, 343–349. [Google Scholar]
  8. Markó, I.E.; Giles, P.R.; Tsukazaki, M.; Chellé-Regnaut, I.; Urch, C.J.; Brown, S.M. Efficient, aerobic, ruthenium-catalyzed oxidation of alcohols into aldehydes and ketones. J. Am. Chem. Soc. 1997, 119, 12661–12662. [Google Scholar]
  9. Ray, R.; Chandra, S.; Maiti, D.; Lahiri, G.K. Simple and efficient ruthenium-catalyzed oxidation of primary alcohols with molecular oxygen. Chem.- A Eur. J. 2016, 22, 8814–8822. [Google Scholar]
  10. Kolobova, E.; Pestryakov, A.; Bogdanchikova, N.; Corberán, V.C. Silver catalysts for liquid-phase oxidation of alcohols in green chemistry: Challenges and outlook. Catal. Today 2019, 333, 81–88. [Google Scholar]
  11. Solomon, J.; Madix, R.J. Kinetics and mechanism of the oxidation of allyl alcohol on silver (110). J. Phy. Chem. 1987, 91, 6241–6244. [Google Scholar]
  12. Pestryakov, A.N.; Bogdanchikova, N.; Knop-Gericke, A. Alcohol selective oxidation over modified foam-silver catalysts. Catal. Today 2004, 91, 49–52. [Google Scholar]
  13. Ryland, B.L.; McCann, S.D.; Brunold, T.C.; Stahl, S.S. Mechanism of alcohol oxidation mediated by copper (II) and nitroxyl radicals. J. Am. Chem. Soc. 2014, 136, 12166–12173. [Google Scholar]
  14. Silva, T.F.; Martins, L.M. Recent advances in copper catalyzed alcohol oxidation in homogeneous medium. Molecules 2020, 25, 748. [Google Scholar] [CrossRef]
  15. Boronat, M.; Corma, A.; Illas, F.; Radilla, J.; Ródenas, T.; Sabater, M.J. Mechanism of selective alcohol oxidation to aldehydes on gold catalysts: Influence of surface roughness on reactivity. J. Catal. 2011, 278, 50–58. [Google Scholar]
  16. Kilpiö, T.; Behravesh, E.; Russo, V.; Eränen, K.; Salmi, T. Physical modeling of the laboratory-scale packed bed reactor for partial gas-phase oxidation of alcohol using gold nanoparticles as the heterogeneous catalyst. Chem. Eng. Res. Des. 2017, 117, 448–459. [Google Scholar]
  17. Hui, Y.; Zhang, S.; Wang, W. Recent progress in catalytic oxidative transformations of alcohols by supported gold nanoparticles. ASC 2019, 361, 2215–2235. [Google Scholar]
  18. Muzart, J. Palladium-catalysed oxidation of primary and secondary alcohols. Tetrahedron 2003, 59, 5789–5816. [Google Scholar]
  19. Tamaru, Y.; Yamada, Y.; Inoue, K.; Yamamoto, Y.; Yoshida, Z. Oxidation of primary and secondary alcohols by the catalysis of palladium. J. Org. Chem. 1983, 48, 1286–1292. [Google Scholar]
  20. Privalov, T.; Linde, C.; Zetterberg, K.; Moberg, C. Theoretical studies of the mechanism of aerobic alcohol oxidation with palladium catalyst systems. Organometallics 2005, 24, 885–893. [Google Scholar]
  21. Avgouropoulos, G.; Oikonomopoulos, E.; Kanistras, D.; Ioannides, T. Complete oxidation of ethanol over alkali-promoted Pt/Al2O3 catalysts. Appl. Catal. B Environ. 2006, 65, 62–69. [Google Scholar]
  22. Kaichev, V.V.; Chesalov, Y.A.; Saraev, A.A.; Klyushin, A.Y.; Knop-Gericke, A.; Andrushkevich, T.V.; Bukhtiyarov, V.I. Redox mechanism for selective oxidation of ethanol over monolayer V2O5/TiO2 catalysts. J. Catal. 2016, 338, 82–93. [Google Scholar]
  23. Li, X.; Iglesia, E. Selective catalytic oxidation of ethanol to acetic acid on dispersed Mo-V-Nb mixed oxides. Chem.-A Eur. J. 2007, 13, 9324–9330. [Google Scholar]
  24. Yan, S.; Liang, X.; Song, H.; Ma, S.; Lu, Y. Synthesis of porous CeO2-SnO2 nanosheets gas sensors with enhanced sensitivity. Ceram. Int. 2018, 44, 358–363. [Google Scholar]
  25. Sadovskaya, E.; Goncharov, V.; Popova, G.; Ishchenko, E.; Frolov, D.; Fedorova, A.; Andrushkevich, T. Mo-V-Te-Nb oxide catalysts: Reactivity of different oxygen species in partial and deep oxidation. J. Mol. Catal. A Chem. 2014, 392, 61–66. [Google Scholar]
  26. Fujitani, T.; Nakamura, I.; Haruta, M. Role of water in CO oxidation on gold catalysts. Catal. Lett. 2014, 144, 1475–1486. [Google Scholar]
  27. Widmann, D.; Behm, R.J. Activation of molecular oxygen and the nature of the active oxygen species for CO oxidation on oxide supported Au catalysts. Accounts Chem. Res. 2014, 47, 740–749. [Google Scholar]
  28. Kung, M.C.; Davis, R.J.; Kung, H.H. Understanding Au-catalyzed low-temperature CO oxidation. J. Phys. Chem. C 2007, 111, 11767–11775. [Google Scholar]
  29. Min, B.K.; Friend, C.M. Heterogeneous gold-based catalysis for green chemistry: Low-temperature CO oxidation and propene oxidation. Chem. Rev. 2007, 107, 2709–2724. [Google Scholar]
  30. Deng, X.; Min, B.K.; Liu, X.; Friend, C.M. Partial oxidation of propene on oxygen-covered Au (111). J. Phys. Chem. B 2006, 110, 15982–15987. [Google Scholar]
  31. Liu, X.; Xu, B.; Haubrich, J.; Madix, R.J.; Friend, C.M. Surface-mediated self-coupling of ethanol on gold. J. Am. Chem. Soc. 2009, 131, 5757–5759. [Google Scholar] [PubMed]
  32. Behravesh, E.; Melander, M.M.; Wärnå, J.; Salmi, T.; Honkala, K.; Murzin, D.Y. Oxidative dehydrogenation of ethanol on gold: Combination of kinetic experiments and computation approach to unravel the reaction mechanism. J. Catal. 2021, 394, 193–205. [Google Scholar]
  33. Takei, T.; Iguchi, N.; Haruta, M. Support effect in the gas phase oxidation of ethanol over nanoparticulate gold catalysts. New J. Chem. 2011, 35, 2227–2233. [Google Scholar]
  34. Cárdenas-Lizana, F.; Keane, M.A. The development of gold catalysts for use in hydrogenation reactions. J. Mater. Sci. 2013, 48, 543–564. [Google Scholar]
  35. Pan, M.; Gong, J.; Dong, G.; Mullins, C.B. Model studies with gold: A versatile oxidation and hydrogenation catalyst. Accounts Chem. Res. 2014, 47, 750–760. [Google Scholar]
  36. Guan, Y.; Hensen, E.J. Ethanol dehydrogenation by gold catalysts: The effect of the gold particle size and the presence of oxygen. App. Catal. A General 2009, 361, 49–56. [Google Scholar]
  37. Sun, K.-Q.; Luo, S.-W.; Xu, N.; Xu, B.-Q. Gold nano-size effect in Au/SiO2 for selective ethanol oxidation in aqueous solution. Catal. Lett. 2008, 124, 238–242. [Google Scholar]
  38. Behravesh, E.; Kumar, N.; Balme, Q.; Roine, J.; Salonen, J.; Schukarev, A.; Mikkola, J.-P.; Peurla, M.; Aho, A.; Eränen, K. Synthesis and characterization of Au nano particles supported catalysts for partial oxidation of ethanol: Influence of solution pH, Au nanoparticle size, support structure and acidity. J. Catal. 2017, 353, 223–238. [Google Scholar]
  39. Li, J.; Yang, Y.; Wang, Q.; Cheng, X.; Luo, Y.; An, B.; Bai, J.; Wang, Y.; Xie, E. Design of size-controlled Au nanoparticles loaded on the surface of ZnO for ethanol detection. CrystEngComm 2021, 23, 783–792. [Google Scholar]
  40. Tabakova, T.; Boccuzzi, F.; Manzoli, M.; Sobczak, J.; Idakiev, V.; Andreeva, D. Effect of synthesis procedure on the low-temperature WGS activity of Au/ceria catalysts. Appl. Catal. B Environ. 2004, 49, 73–81. [Google Scholar]
  41. Tamaru, K. Dynamic Heterogeneous Catalysis; Academic Press: New York, NY, USA, 1978; pp. 1–140. [Google Scholar]
  42. Schlögl, R. Heterogeneous catalysis. Angew. Chem. Int. Ed. 2015, 54, 3465–3520. [Google Scholar]
  43. Satterfield, C.N. Heterogeneous Catalysis in Practice; McGraw-Hill: New York, NY, USA, 1980; pp. 1–416. [Google Scholar]
  44. Armaroli, T.; Bécue, T.; Gautier, S. Diffuse reflection infrared spectroscopy (DRIFTS): Application to the in situ analysis of catalysts. Oil Gas Sci. Technol.-Rev. 2004, 59, 215–237. [Google Scholar]
  45. Haw, J.F. In-Situ Spectroscopy in Heterogeneous Catalysis; Wiley-VCH: Weinheim, Germany, 2002; pp. 1–276. [Google Scholar]
  46. Baurecht, D.; Fringeli, U.P. Quantitative modulated excitation Fourier transform infrared spectroscopy. Rev. Sci. Instruments 2001, 72, 3782–3792. [Google Scholar]
  47. Baurecht, D.; Porth, I.; Fringeli, U. A new method of phase sensitive detection in modulation spectroscopy applied to temperature induced folding and unfolding of RNase A. Vib. Spectrosc. 2002, 30, 85–92. [Google Scholar]
  48. Srinivasan, P.D.; Patil, B.S.; Zhu, H.; Bravo-Suárez, J.J. Application of modulation excitation-phase sensitive detection-DRIFTS for in situ/operando characterization of heterogeneous catalysts. React. Chem. Eng. 2019, 4, 862–883. [Google Scholar]
  49. Pandey, R.K.; Lakshminarayanan, V. Ethanol electrocatalysis on gold and conducting polymer nanocomposites: A study of the kinetic parameters. Appl. Catal. B Environ. 2012, 125, 271–281. [Google Scholar]
  50. Li, J.; Kazakov, A.; Chaos, M.; Dryer, F.L. Chemical kinetics of ethanol oxidation. In Proceedings of the 5th US Combustion Meeting, San Diego, CA, USA, 25–28 March 2007. [Google Scholar]
  51. Gonzalez-Yañez, E.O.; Fuentes, G.A.; Hernández-Terán, M.E.; Fierro-Gonzalez, J.C. Influence of supported gold particles on the surface reactions of ethanol on TiO2. Appl. Catal. A Gen. 2013, 464, 374–383. [Google Scholar]
  52. Tan, T.H.; Scott, J.; Ng, Y.H.; Taylor, R.A.; Aguey-Zinsou, K.-F.; Amal, R. C–C cleavage by Au/TiO2 during ethanol oxidation: Understanding bandgap photoexcitation and plasmonically mediated charge transfer via quantitative in situ DRIFTS. ACS Catal. 2016, 6, 8021–8029. [Google Scholar]
  53. Cornejo-Romero, J.; Solis-Garcia, A.; Vega-Diaz, S.M.; Fierro-Gonzalez, J.C. Reverse hydrogen spillover during ethanol dehydrogenation on TiO2-supported gold catalysts. Mol. Catal. 2017, 433, 391–402. [Google Scholar]
  54. Green, I.X.; Tang, W.; Neurock, M.; Yates, J.T., Jr. Localized partial oxidation of acetic acid at the dual perimeter sites of the Au/TiO2 catalyst formation of gold ketenylidene. J. Am. Chem. Soc. 2012, 134, 13569–13572. [Google Scholar]
  55. Chang, C.-A.; Ray, B.; Paul, D.K.; Demydov, D.; Klabunde, K.J. Photocatalytic reaction of acetaldehyde over SrTiO3 nanoparticles. J. Mol. Catal. A Chem. 2008, 281, 99–106. [Google Scholar] [CrossRef]
  56. Gao, J.; Teplyakov, A.V. Surface species formed during thermal transformation of ethanol on ZnO powder. J. Catal. 2013, 300, 163–173. [Google Scholar] [CrossRef]
  57. Zheng, Y.; Qi, Y.; Tang, Z.; Tan, J.; Koel, B.E.; Podkolzin, S.G. Spectroscopic observation and structure-insensitivity of hydroxyls on gold. ChemComm. 2022, 58, 4036–4039. [Google Scholar] [CrossRef] [PubMed]
  58. Zhu, H.; Ma, Y.; Fan, Y.; Shen, J. Fourier transform infrared spectroscopy and oxygen luminescence probing combined study of modified sol–gel derived film. Thin Solid Films 2001, 397, 95–101. [Google Scholar]
  59. Bhatia, S.; Verma, N.; Bedi, R. Ethanol gas sensor based upon ZnO nanoparticles prepared by different techniques. Results Phys. 2017, 7, 801–806. [Google Scholar] [CrossRef]
  60. Pan, X.; Wang, L.; Ling, F.; Li, Y.; Han, D.; Pang, Q.; Jia, L. A novel biomass assisted synthesis of Au–SrTiO3 as a catalyst for direct hydrogen generation from formaldehyde aqueous solution at low temperature. Int. J. Hydrogen Energy 2015, 40, 1752–1759. [Google Scholar] [CrossRef]
  61. Horton, R.C.; Herne, T.M.; Myles, D.C. Aldehyde-terminated self-assembled monolayers on gold: Immobilization of amines onto gold surfaces. J. Am. Chem. Soc. 1997, 119, 12980–12981. [Google Scholar] [CrossRef]
  62. Hartadi, Y.; Widmann, D.; Behm, R.J. CO2 hydrogenation to methanol on supported Au catalysts under moderate reaction conditions: Support and particle size effects. ChemSusChem 2015, 8, 456–465. [Google Scholar] [CrossRef]
  63. Foo, G.S.; Hood, Z.D.; Wu, Z. Shape effect undermined by surface reconstruction: Ethanol dehydrogenation over shape-controlled SrTiO3 nanocrystals. ACS Catal. 2018, 8, 555–565. [Google Scholar]
  64. Wiberg, K.B.; Thiel, Y.; Goodman, L.; Leszczynski, J. Acetaldehyde: Harmonic frequencies, force field, and infrared intensities. J. Phys. Chem. 1995, 99, 13850–13864. [Google Scholar] [CrossRef]
  65. Su, X.; Yang, X.F.; Huang, Y.; Liu, B.; Zhang, T. Single-atom catalysis toward efficient CO(2) conversion to CO and formate products. Acc. Chem. Res. 2019, 52, 656–664. [Google Scholar]
  66. Tamaki, Y.; Hara, K.; Katoh, R.; Tachiya, M.; Furube, A. Femtosecond visible-to-IR spectroscopy of TiO2 nanocrystalline films: Elucidation of the electron mobility before deep trapping. J. Phys. Chem. C 2009, 113, 11741–11746. [Google Scholar] [CrossRef]
  67. Panayotov, D.A.; Burrows, S.P.; Morris, J.R. Infrared spectroscopic studies of conduction band and trapped electrons in UV-photoexcited, H-atom n-doped, and thermally reduced TiO2. J. Phys. Chem. C 2012, 116, 4535–4544. [Google Scholar]
  68. Torres-Velasco, A.; Patil, B.S.; Zhu, H.; Qi, Y.; Podkolzin, S.G.; Bravo-Suarez, J.J. A general method for studying reactive surface species, CT-SKAn: Charge-transfer spectrokinetic analysis. J. Catal. 2024, 434, 115508. [Google Scholar]
  69. Srinivasan, P.D.; Zhu, H.; Bravo-Suárez, J.J. In situ UV–vis plasmon resonance spectroscopic assessment of oxygen and hydrogen adsorption location on supported gold catalysts. Mol. Catal. 2021, 507, 111572. [Google Scholar] [CrossRef]
  70. Ahmadi Daryakenari, A.; Ahmadi Daryakenari, M.; Bahari, Y.; Omivar, H. Preparation and Ethanol Sensing Properties of ZnO Nanoparticles via a Novel Sol-Gel Method. Int. Sch. Res. Not. 2012, 2012, 879480. [Google Scholar] [CrossRef]
  71. Waheed, A.; Wang, X.; Maeda, N.; Meier, D.M.; Ishida, T.; Murayama, T.; Haruta, M.; Baiker, A. Influence of the support in aqueous phase oxidation of ethanol on gold/metal oxide catalysts studied by ATR-IR spectroscopy under working conditions. Catal. Comm. 2021, 148, 106183. [Google Scholar]
Figure 1. (a) Ethanol conversion (%); (b) production rate (mol/gcat/s) of acetaldehyde (RAcetaldehyde); and (c) production rate of total acetates (acetic acid + ethyl acetate) (RAcetates) during ethanol oxidation on Au/SiO2, Au/SrTiO3, Au/TiO2, and Au/ZnO catalysts. Reaction conditions: fixed bed reactor, 1 kPa of ethanol, 1.5 kPa O2, and 101 kPa total pressure (He balance), 100 NTP cm3/min of total flowrate, ~20 mg catalyst (interparticle dilution with 180 mg silica sand), temperature between 423 and 673 K.
Catalysts 15 00346 g001
Figure 2. Operando time-domain FTIR spectra during vapor-phase ethanol oxidation on Au/SiO2, Au/TiO2, Au/ZnO, and Au/SrTiO3. Reaction conditions: 1 kPa ethanol, 1.5 kPa O2, and He balance at 101 kPa total pressure, 80 NTP cm3/min total flowrate, 513 K, ~45 mg catalyst.
Catalysts 15 00346 g002
Figure 3. MS response during: (a) ethanol (EtOH MES, EtOH + O2 + He → Ar + O2 + He); and (b) O2 (O2 MES, EtOH + O2 + He → EtOH + Ar + He) modulations during EtOH oxidation on Au/SiO2 at 513 K, modulation frequency = 1/90 Hz.
Catalysts 15 00346 g003
Figure 4. MS response during: (a) ethanol (EtOH MES, EtOH + O2 + He → Ar + O2 + He); and (b) O2 (O2 MES, EtOH + O2 + He → EtOH + Ar + He) modulations during EtOH oxidation on Au/TiO2 at 513 K, modulation frequency = 1/90 Hz.
Catalysts 15 00346 g004
Figure 5. MS response during: (a) ethanol (EtOH MES, EtOH + O2 + He → Ar + O2 + He); and (b) O2 (O2 MES, EtOH + O2 + He → EtOH + Ar + He) modulations during EtOH oxidation on Au/SrTiO3 at 513 K, modulation frequency = 1/90 Hz.
Catalysts 15 00346 g005
Figure 6. MS response during: (a) ethanol (EtOH MES, EtOH + O2 + He Ar + O2 + He); and (b) O2 (O2 MES, EtOH + O2 + He EtOH + Ar + He) modulations during EtOH oxidation on Au/ZnO at 513 K, modulation frequency = 1/90 Hz.
Catalysts 15 00346 g006
Figure 7. In situ ME–PSD–DRIFTS spectra in phase-domain trace plots during ethanol oxidation and ethanol modulation on: (a) Au/SiO2; (b) Au/TiO2; (c) Au/ZnO; and (d) Au/SrTiO3 at different periodic times (phase angle = time in s × 360°/90 s). Conditions: 513 K, 101 kPa, ethanol feed modulation going from EtOH (1 kPa) + O2 (1.5 kPa) + Inert gas (balance) to O2 (1.5 kPa) + Inert gas (balance), fundamental modulation frequency = 1/90 Hz (period = 90 s), total gas flow ~80 NTP cm3 min−1, and catalyst weight ~45 mg. Spectra were analyzed at the PSD frequency of 1/90 Hz (1f0).
Catalysts 15 00346 g007
Figure 8. In situ ME–PSD–DRIFTS spectra in phase-domain trace plots during ethanol oxidation and oxygen modulation on: (a) Au/SiO2; (b) Au/TiO2; (c) Au/ZnO; and (d) Au/SrTiO3 at different periodic times (phase angle = time in s × 360°/90 s). Conditions: 513 K, 101 kPa, O2 feed modulation going from EtOH (1 kPa) + O2 (1.5 kPa) + Inert (balance) to Ethanol (1 kPa) + Inert (balance), fundamental modulation frequency = 1/90 Hz (period = 90 s), total gas flow ~80 NTP cm3 min−1, and catalyst weight ~45 mg. Spectra were analyzed at the PSD frequency of 1/90 Hz (1f0).
Catalysts 15 00346 g008
Figure 9. In situ ME–PSD–DRIFTS spectra in phase-domain trace plots during ethanol oxidation and ethanol modulation on: (a) Au/SiO2; (b) Au/TiO2; (c) Au/ZnO; and (d) Au/SrTiO3 with PSD at 0.07f0, 0.05f0, f0 (1/90 Hz), 2f0, and 3f0. Conditions: 513 K, 101 kPa, ethanol feed modulation going from EtOH (1 kPa) + O2 (1.5 kPa) + Inert (balance) to O2 (1.5 kPa) + Inert (balance), total gas flow ~80 NTP cm3 min−1, and catalyst weight ~45 mg. Spectra were collected at the maximum concentration of the modulating reactant at the given frequency.
Catalysts 15 00346 g009
Figure 10. In situ ME–PSD–DRIFTS spectra in phase-domain trace plots during ethanol oxidation and O2 modulation on: (a) Au/SiO2; (b) Au/TiO2; (c) Au/ZnO; and (d) Au/SrTiO3 with PSD at 0.07f0, 0.05f0, f0 (1/90 Hz), 2f0, and 3f0. Conditions: 513 K, 101 kPa, O2 feed modulation going from EtOH (1 kPa) + O2 (1.5 kPa) + Inert (balance) → EtOH (1.5 kPa) + Inert (balance), total gas flow ~80 NTP cm3 min−1, and catalyst weight ~45 mg. Spectra collected at the maximum concentration of the modulating reactant at the given frequency.
Catalysts 15 00346 g010
Figure 11. Schematics of the experimental setup for ME–PSD–DRIFTS or ME–PSD–DRUV–Vis. MFC = mass flow controller; 6WV = 6-port two position (dotted and solid lines) switching valve; MS = mass spectrometer; and a low void volume reaction cell for IR and UV–Vis spectroscopic measurements. The dashed lines indicate that transfer lines are heated and insulated to avoid unwanted condensation (adapted from Ref. [48]).
Catalysts 15 00346 g011
Scheme 1. Proposed reaction scheme for ethanol oxidation on Au supported on metal oxides. Adsorbed species detected via ME-PSD-DRIFTS are also noted: ◊ = ethanol, ♥ = ethoxy, ★ = acetaldehyde, ▲ = acetic acid, ◆ = CO2, Catalysts 15 00346 i001 = hydroxyls, and △ = water.
Catalysts 15 00346 sch001
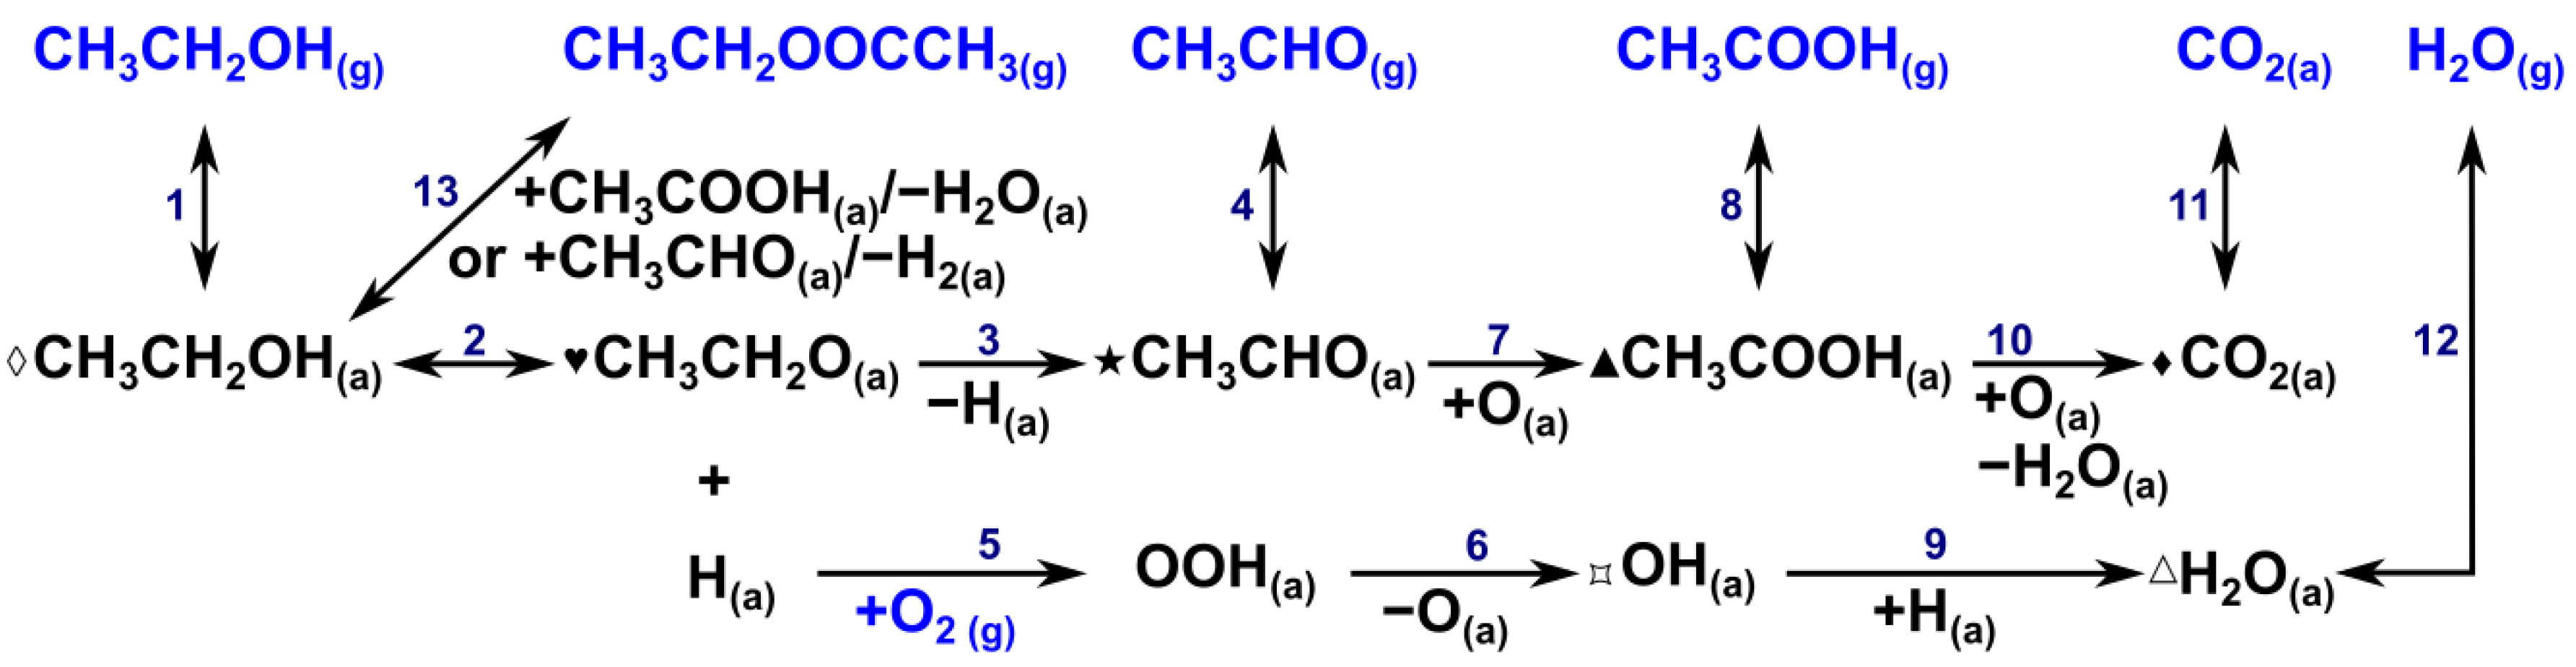
Disclaimer/Publisher’s Note: The statements, opinions and data contained in all publications are solely those of the individual author(s) and contributor(s) and not of MDPI and/or the editor(s). MDPI and/or the editor(s) disclaim responsibility for any injury to people or property resulting from any ideas, methods, instructions or products referred to in the content.

