Article

Tuning the Surface Oxophilicity of PdAu Alloy Nanoparticles to Favor Electrochemical Reactions: Hydrogen Oxidation and Oxygen Reduction in Anion Exchange Membrane Fuel Cells

1
Institute of Chemistry of Organometallic Compounds (ICCOM), National Research Council (CNR), Via Madonna del Piano 10, 50019 Sesto Fiorentino, Italy
2
Department of Chemistry “U. Schiff”, University of Florence, Via della Lastruccia 3-13, 50019 Sesto Fiorentino, Italy
*
Author to whom correspondence should be addressed.
Catalysts 2025, 15(4), 306; https://doi.org/10.3390/catal15040306
Submission received: 26 February 2025 / Revised: 21 March 2025 / Accepted: 22 March 2025 / Published: 24 March 2025

Abstract

:
Anion exchange membrane fuel cells (AEMFCs) are versatile power generation devices that can be fed by both gaseous (H2) and liquid fuels. The development of sustainable, efficient, and stable catalysts for the oxidation of hydrogen (HOR) and oxygen reduction (ORR) under alkaline conditions remains a challenge currently facing AEMFC technology. Reducing the loading of PGMs is essential for reducing the overall cost of AEMFCs. One strategy involves exploiting the synergistic effects of two metals in bimetallic nanoparticles (NPs). Here, we report that the activity for the HOR and the ORR can be finely tuned through surface engineering of carbon-supported PdAu-PVA NPs. The activity for both ORR and HOR can be adjusted by subjecting the material to heat treatment. Specifically, heat treatment at 500 °C under an inert atmosphere increases the crystallinity and oxophilicity of the nanoparticles, thereby enhancing anodic HOR performance. On the contrary, heat treatment significantly lowers ORR activity, highlighting how reduced surface oxophilicity plays a major role in increasing active sites for ORR. The tailored activity in these catalysts translates into high power densities when employed in AEMFCs (up to 1.1 W cm−2).

Graphical Abstract

1. Introduction

Fuel cells can exploit both liquid and gaseous fuels, transforming the energy stored in the chemical bonds directly into electrical energy. This process produces electricity with minimal byproducts, typically just water and heat, making fuel cells a compelling option for clean energy applications. Hydrogen, in particular, is a well-established fuel, already used in commercialized fuel cell systems, such as in transportation [1,2]. Fuel cell electric vehicles, such as cars, trucks, boats, and trains, rely on proton exchange membrane fuel cells (PEM-FCs), which deliver high efficiency and power density, along with cold-start capabilities [2]. However, the high cost of PEM-FCs limits their commercialization on a large scale. To address this issue, Anion Exchange Membrane Fuel Cells (AEMFCs) have recently emerged as promising alternative power sources for practical applications. Unlike PEM-FCs, which rely on acidic proton exchange membranes (PEMs), AEMFCs utilize alkaline anion exchange membranes (AEMs). This key difference enables AEMFCs to operate at a higher pH and under less corrosive conditions, allowing a significant reduction in the loadings of precious metal catalysts [3,4,5,6], which provides a notable advantage over PEMFCs [7,8,9,10,11]. Pd-CeO2/C and Pt/C materials [12,13] are currently the most effective electrocatalysts for the anodic hydrogen oxidation reaction (HOR) and cathodic oxygen reduction reaction (ORR), respectively, in AEMFCs. Over the past few decades, significant progress has been made in enhancing the efficiency and stability of these devices by developing innovative Pd-based electrocatalysts for both HOR [14,15,16,17,18] and ORR [19,20].
The catalytic activity for HOR and ORR is typically improved when nano-alloys are created by combining transition metals, such as PdAg [21,22], PdAu [23], PdCu [24], and PdFe [25].
Many studies have demonstrated that bimetallic PdAu materials are significantly more efficient for hydrogen oxidation and evolution reactions than pure Pd, with their activity increasing as the Pd content decreases. This effect has been observed in various PdAu catalysts, including alloys, submonolayers or overlayers on gold crystals, and Pd deposited on gold nanoparticles or Pd nano islands on Au single crystal substrates. The enhanced performance is primarily attributed to electronic effects on the Pd d-band, which shifts upwards closer to the Fermi level, leading to stronger hydrogen adsorption. Additionally, the stretching of the Pd lattice in Pd/Au layers further enhances hydrogen adsorption, boosting the overall HOR/HER electrocatalytic activity of the materials [26]. Post-synthesis treatment of alloy nanoparticles can enhance the crystallinity and degree of alloying, leading to modifications in the surface characteristics of the nanoparticles [25,27].
This study investigates the surface engineering of PdAu nanoparticles via heat treatment under an inert atmosphere, comparing the catalytic activity for HOR and ORR between two catalysts: the as-synthesized PdAu-PVA and the heat-treated PdAu-500 °C. The enhanced crystallinity and oxophilicity of the PdAu-500 °C surface, as revealed by X-ray analysis, contribute to improved hydrogen oxidation activity, leading to an increase in power density from 0.7 to 1.0 W cm−2 when used as an anode in hydrogen-fuelled AEMFCs. On the other hand, this surface structure shows lower activity for the ORR compared to the non-treated PdAu surface, suggesting that other factors may play a more significant role. The highly disordered and relaxed structure of PdAu at the initial stage creates numerous active sites for O₂ reduction, enhancing the catalyst’s surface activity and accessibility to oxygen. This structural arrangement may lower the energy required for oxygen adsorption, which is critical for improving the efficiency of the ORR process. The promising PdAu-PVA activity for ORR is highlighted by the impressive power density of 1.1 W cm⁻² achieved in AEMFC testing when employed as a cathode.
In conclusion, this work presents a simple method for preparing Pd-based electrocatalysts with tailored bifunctional properties, effectively demonstrating the various effects that enhance the key reactions crucial for AEMFCs.

2. Results and Discussion

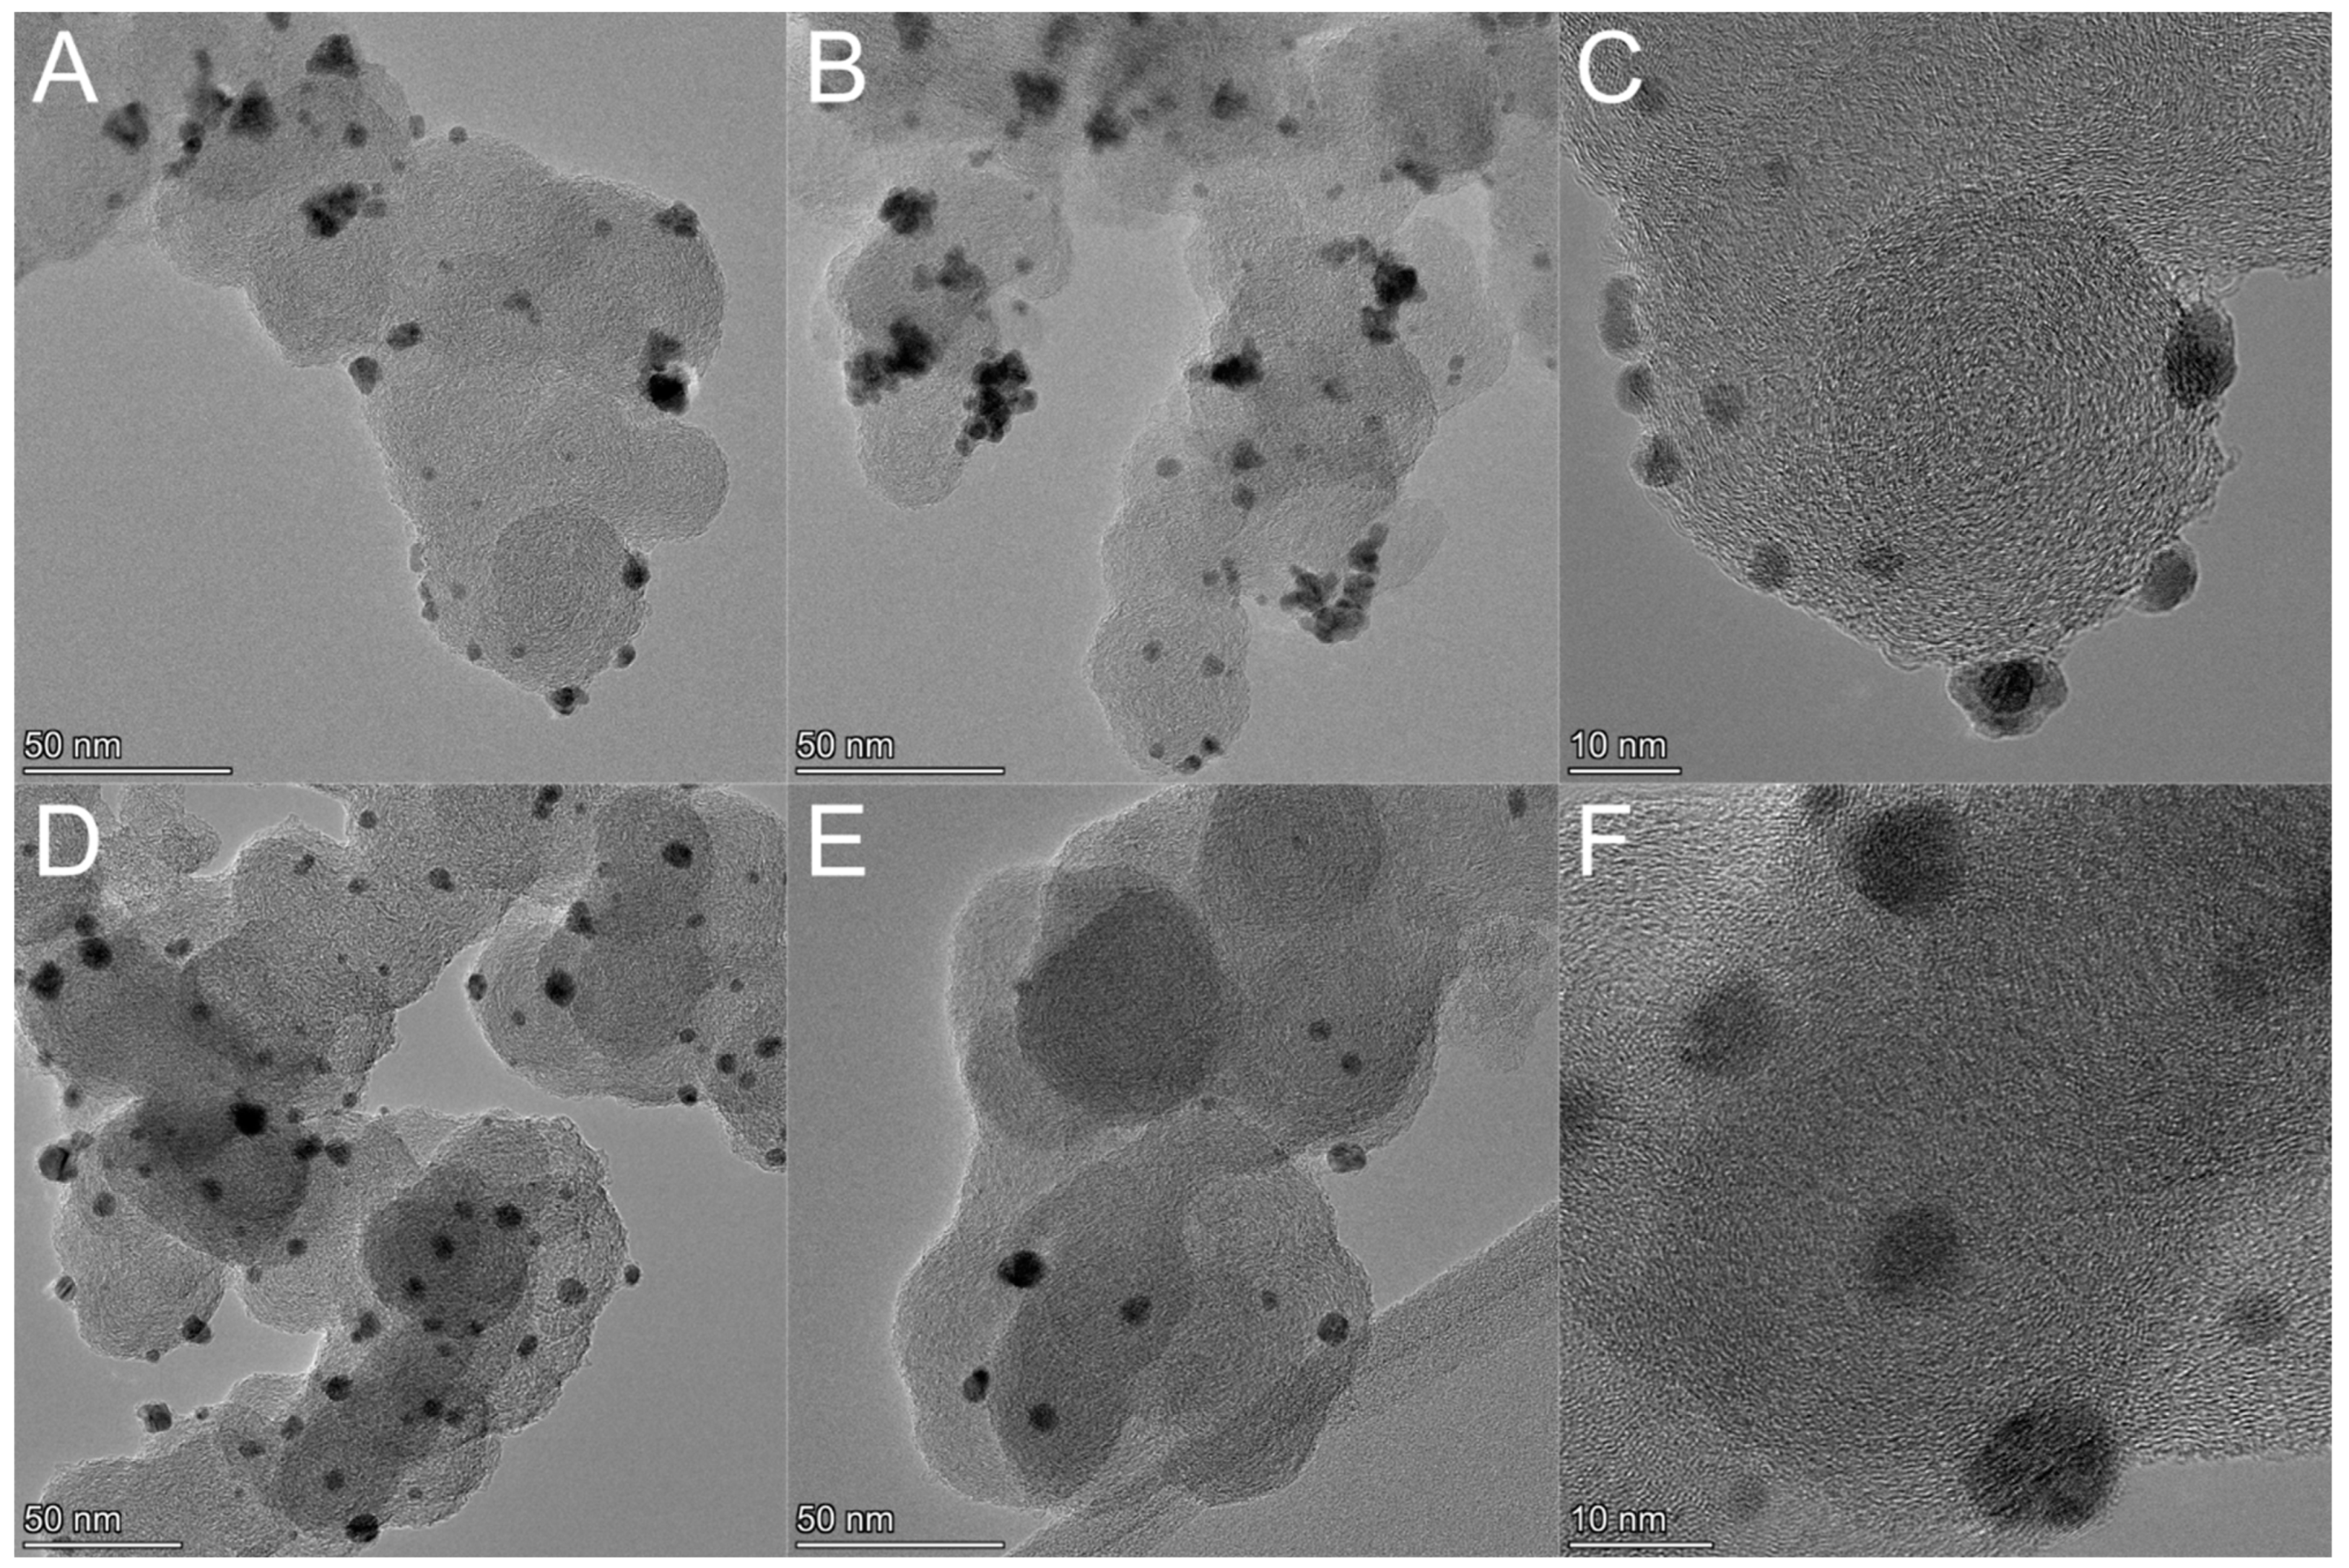
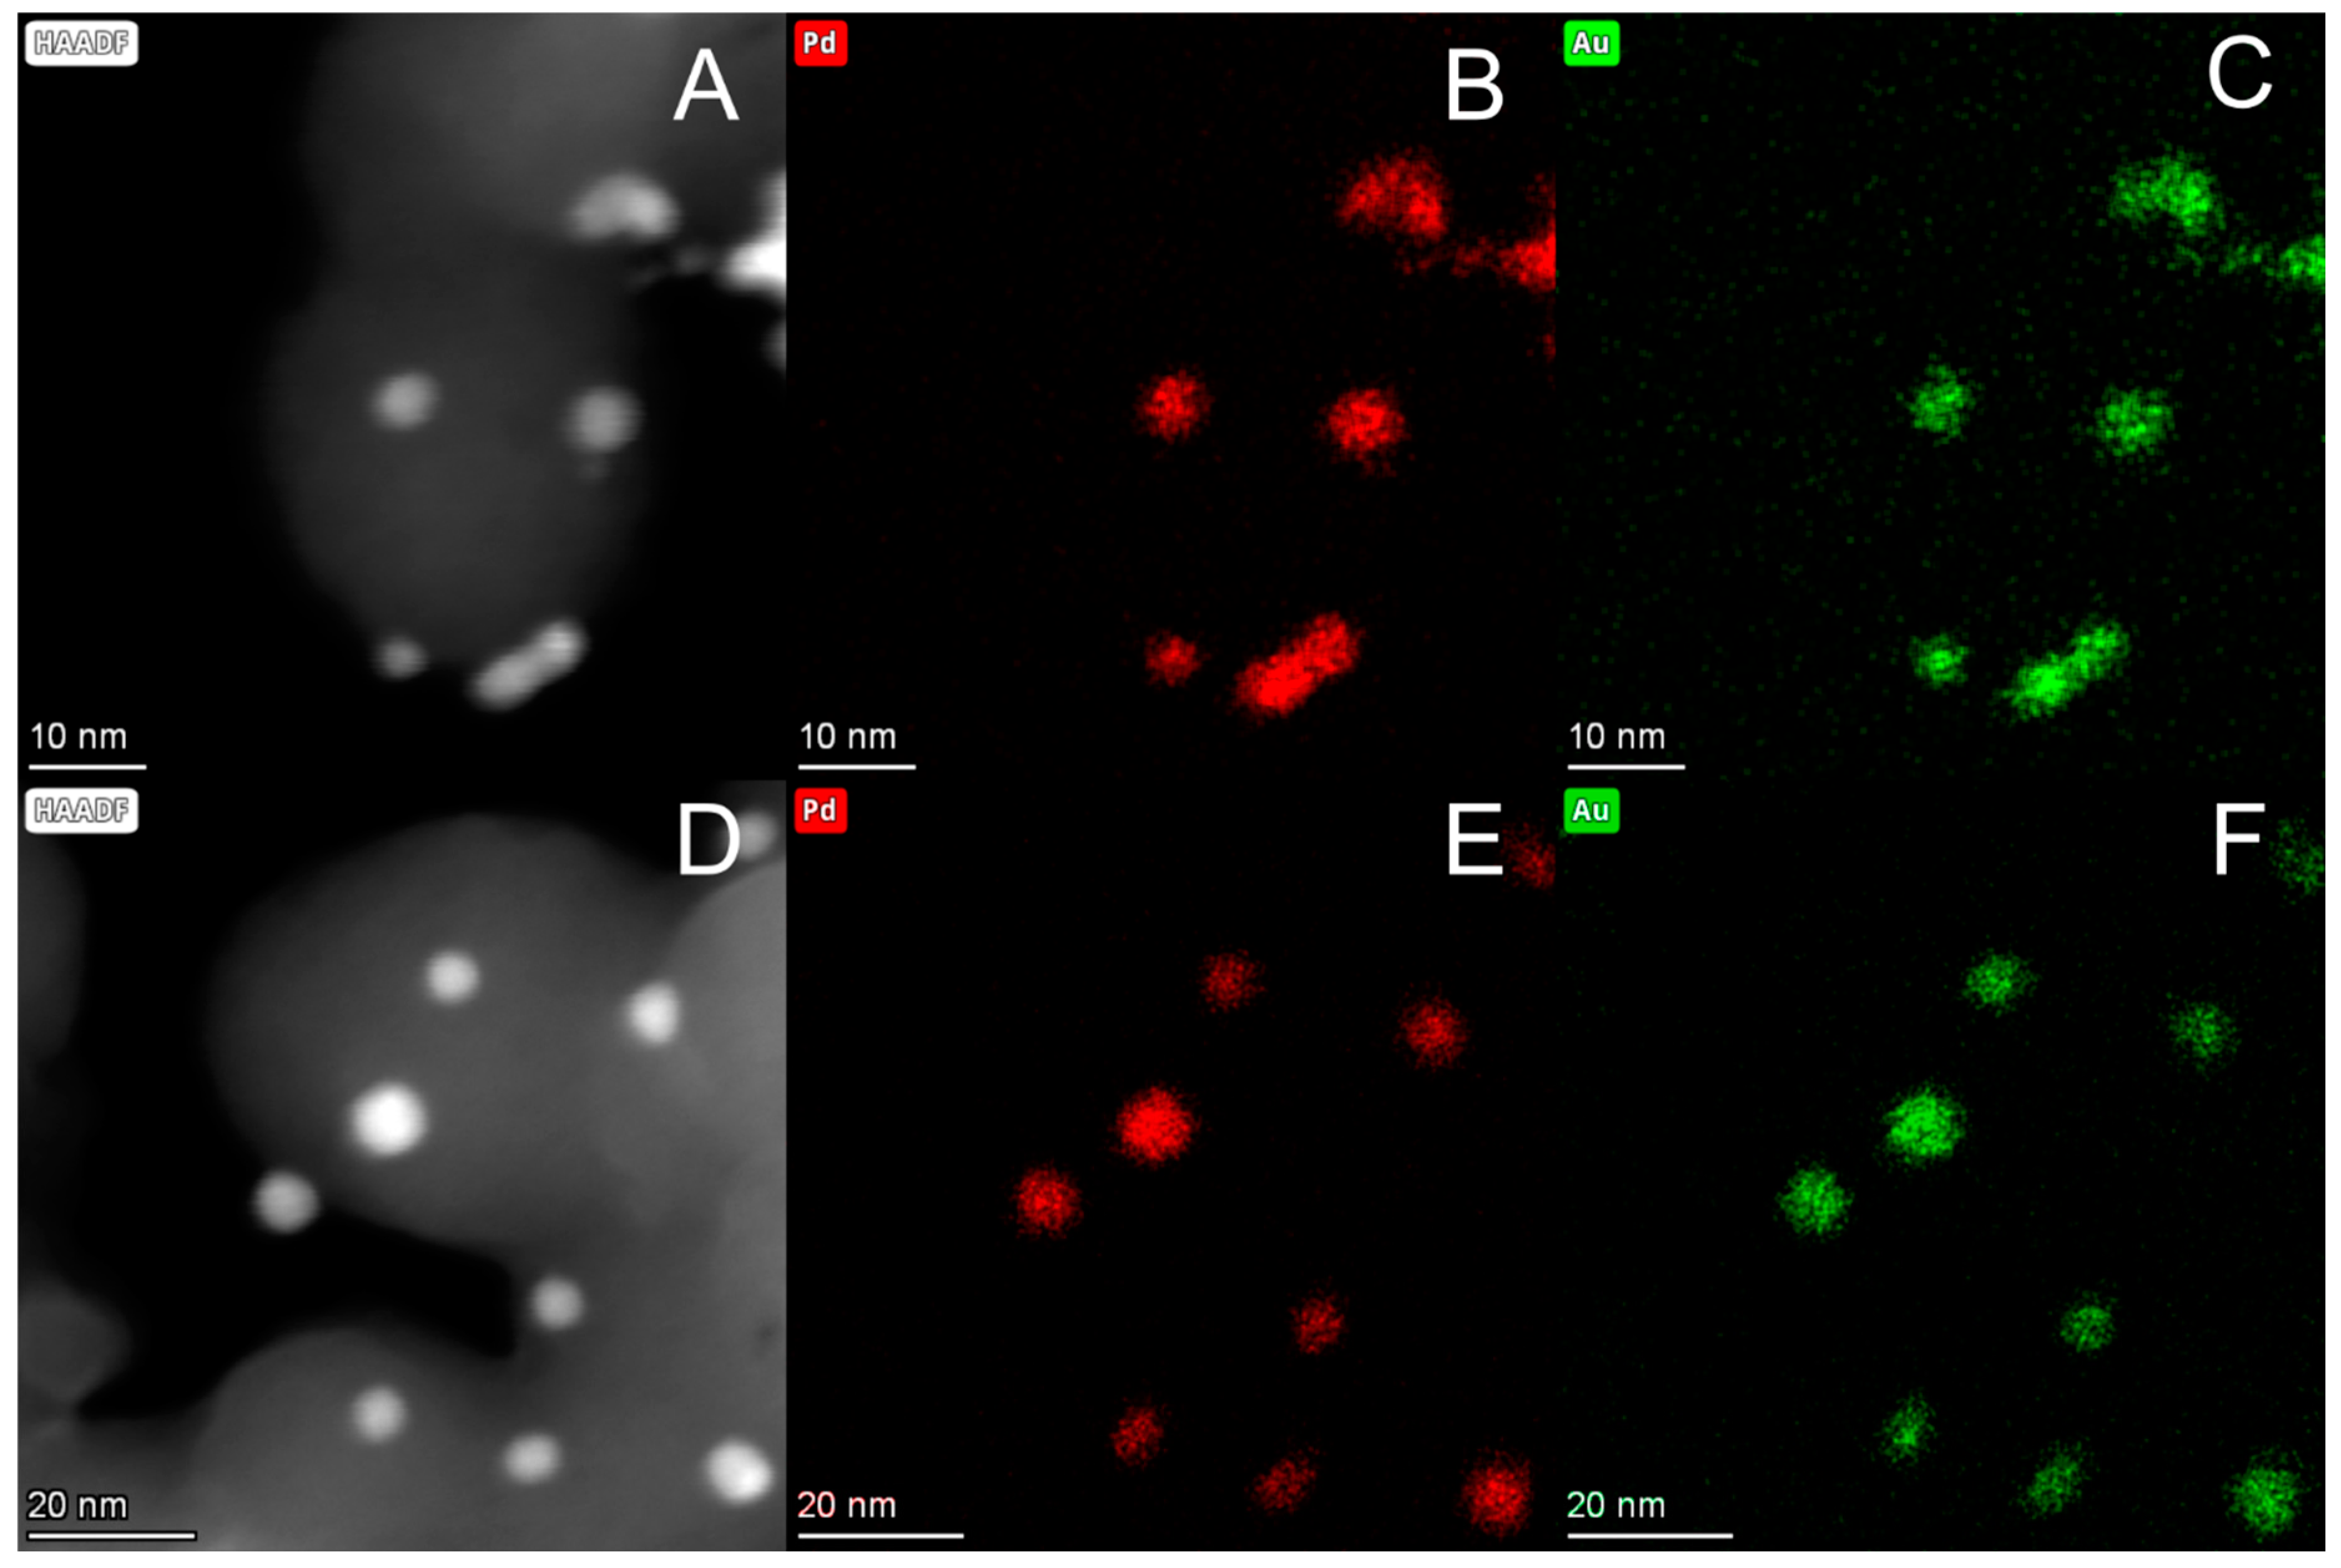
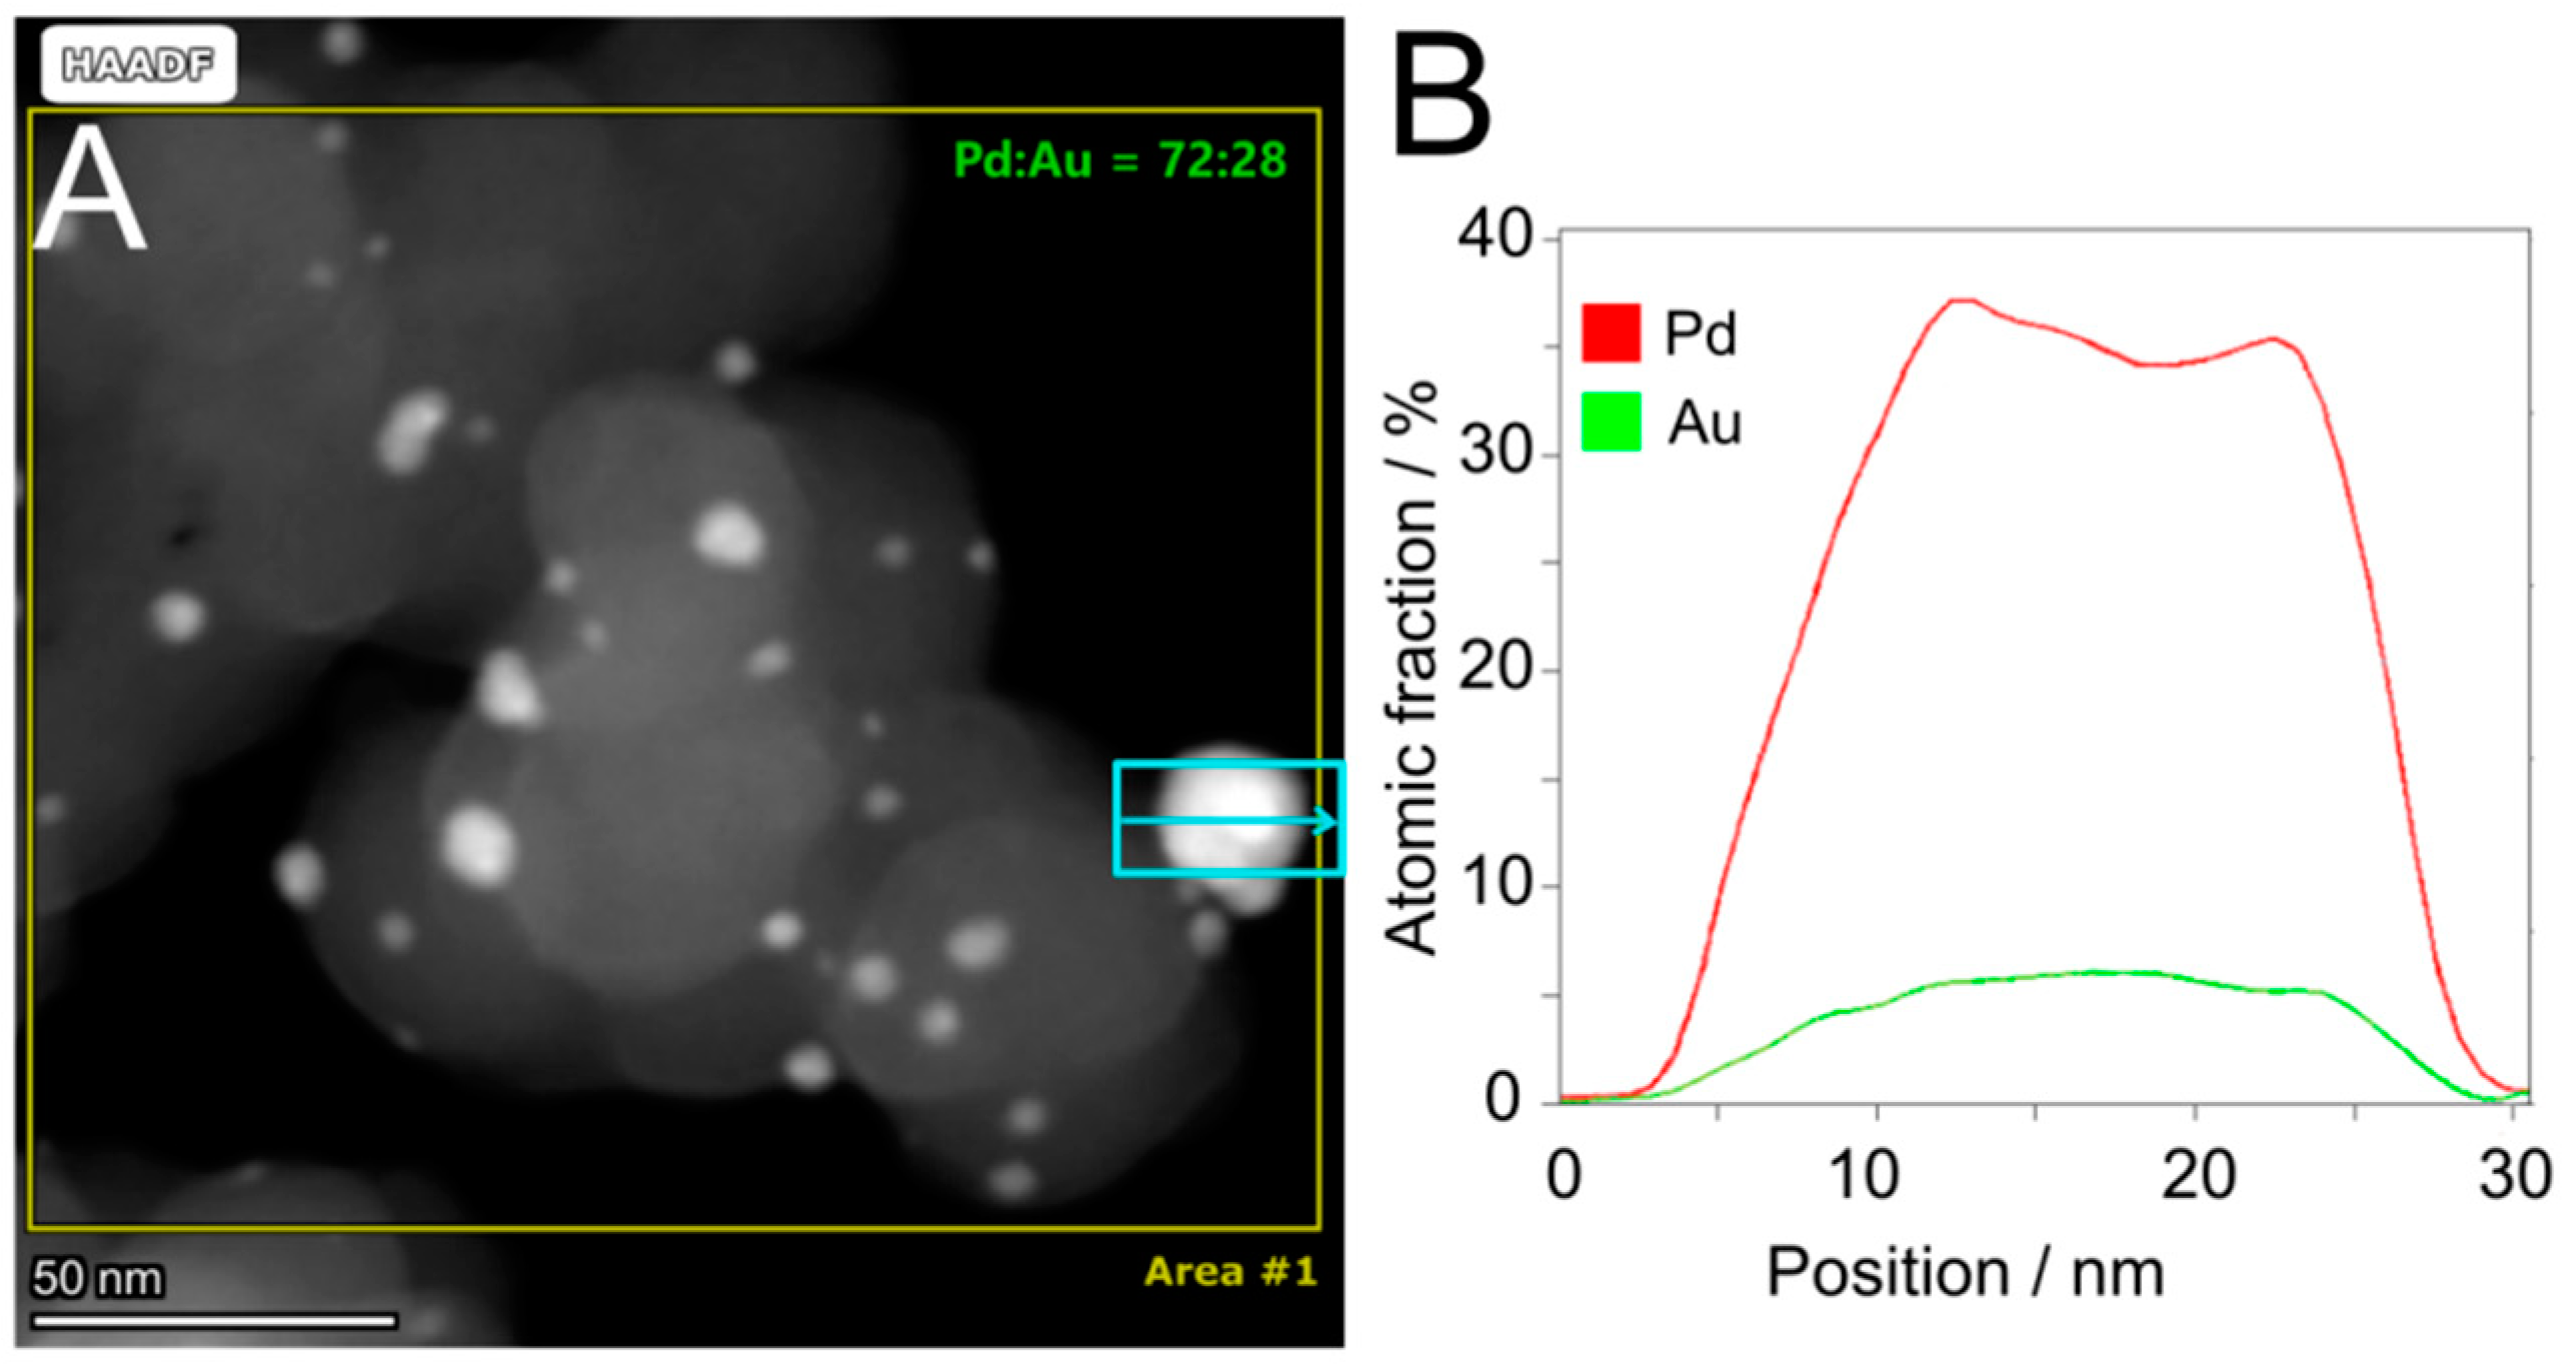
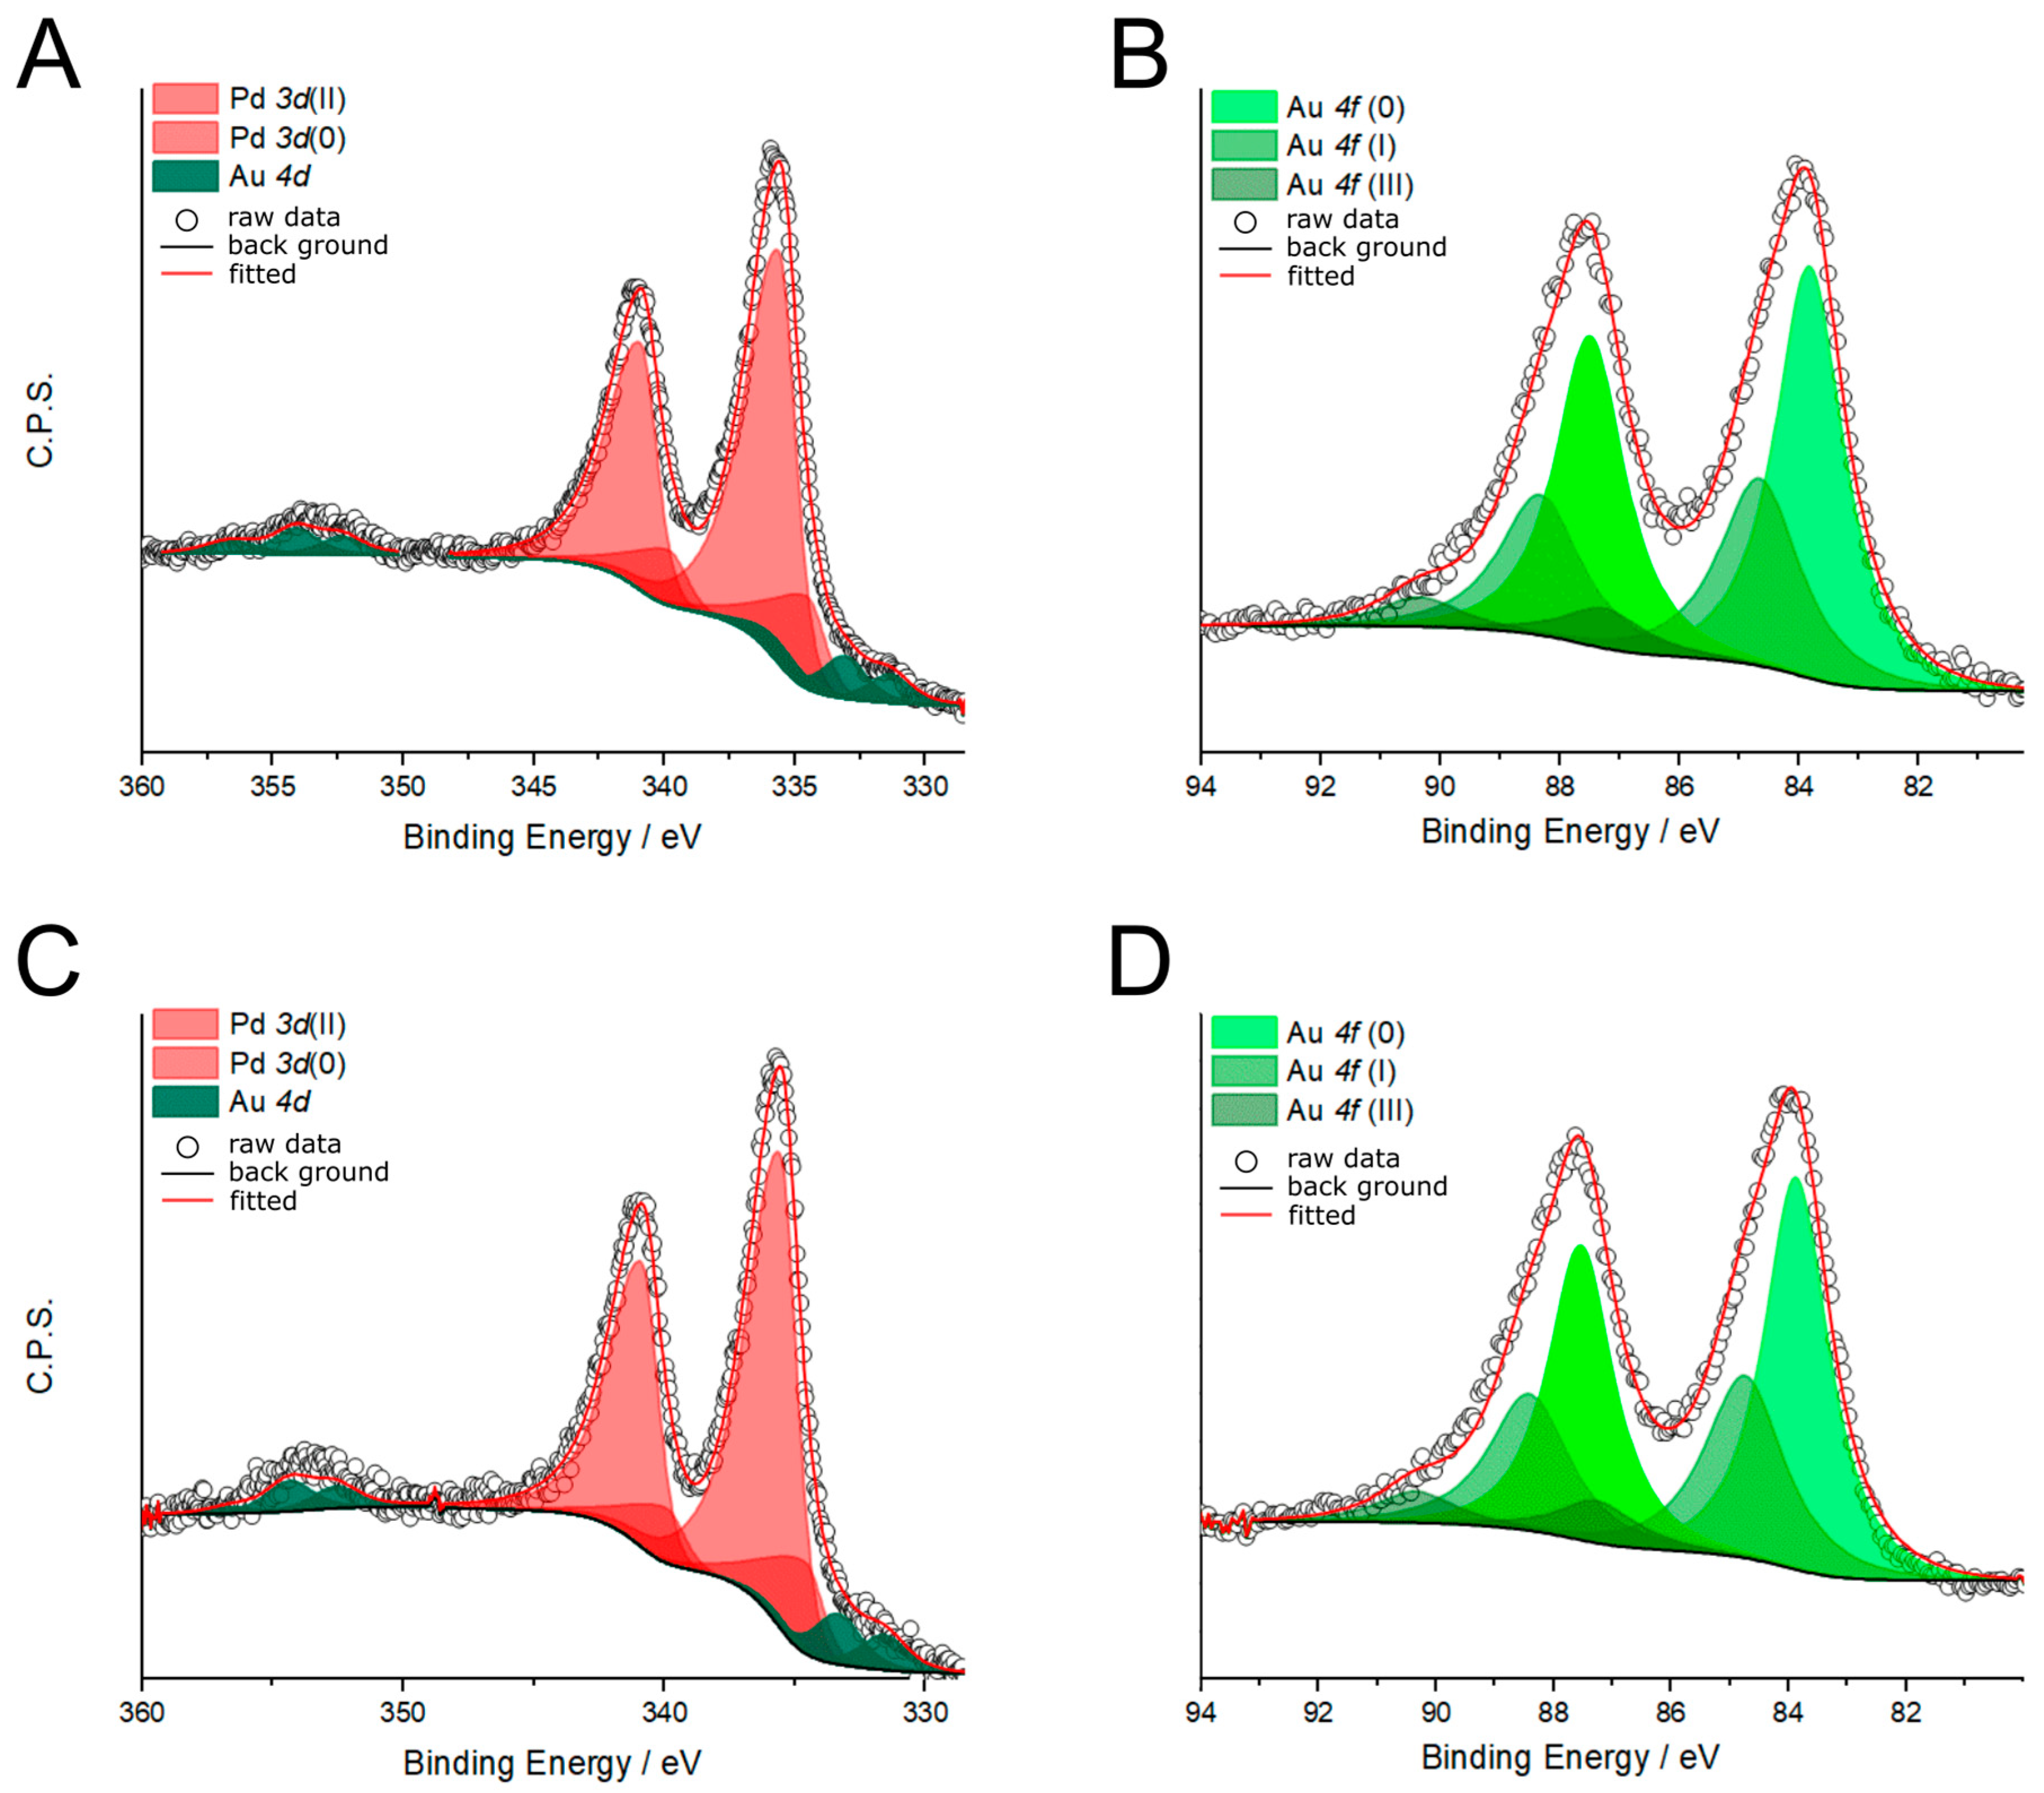
2.1. Synthesis and Chemical–Physical Characterization

Bimetallic PdAu alloy nanoparticles (NPs) were synthesized using a wet-chemical approach and a co-reduction method, employing NaBH4 as the reducing agent and PVA as the capping agent in an aqueous solution [28]. The resulting suspension of PdAu NPs was mixed with the high porous carbon support Vulcan XC-72 and filtered. The total metal loading was determined by ICP-OES analysis (7.4 wt%, with a mass ratio of circa 2:1 Pd:Au and atomic ratio of 4:1). XRD analysis of the PdAu-PVA catalyst, shown in the upper trace of Figure 1, reveals the presence of broad signals at 25°, which is assigned to the (002) reflex of the carbon-based support, while the other peaks at 39.4°, 45.2°, and 66.9° correspond to the crystallographic planes (111), (200), and (220) of face-centered-cubic (fcc) PdAu clusters. The mean diameter (dm) of PdAu-PVA nanoparticles was calculated using the Scherrer formula [29], which suggests the presence of small crystallites (4.6 nm). However, it is only through HR-TEM that the formation of clusters composed of these small nanoparticles is clearly observed (see Figure 2A,B). A portion of the sample was heated at 500 °C for 5 h under a flowing N2 atmosphere. After cooling to room temperature under a flow of nitrogen, the sample showed significant changes, as revealed by both the X-ray diffractogram (Figure 1, lower trace) and HR-TEM micrographs (Figure 2D,E). The XRD reflex associated with the PdAu-500 °C NPs increase in sharpness and shift to higher 2θ (°) angles (39.7°, 46.1°, and 67.2° for (111), (200), and (220) reflex, respectively). In this case, due to the sharper intensity of the (111) signal, the calculated particle diameter was larger, measuring 9.5 nm. Regarding the (111) peak shifting, as evidenced in Figure 1, we hypothesize that PdAu clusters synthesized at low temperatures tend to exhibit larger lattice parameters, which can be attributed to the presence of defects and impurities [30]. In contrast, heat treatment may promote better ordering of the crystalline structure, leading to the formation of well-defined and small nanoparticles. This process resulted in lattice contraction, as evidenced by X-ray diffraction analysis, along with the disappearance of larger clusters, as observed through microscopic investigations.
Representative HR-TEM micrographs of both samples at different magnifications are shown in Figure 2. As outlined above, PdAu-PVA exhibits the existence of NP clusters with varying sizes (up to 30 nm) and shapes. After treatment at high temperature, the NPs are more defined and better dispersed over the carbon support, although they present a wide distribution, with a diameter that ranges from 2 to 20 nm, a mean value (dm) of 6.6 ± 2.2 nm was calculated (Figure S1), in agreement with XRD results. STEM-HAADF and EDS mapping of portions of PdAu-PVA (Figure 3A–C) and PdAu-500 °C (Figure 3D–F) were acquired, confirming the bimetallic nature of NPs. Furthermore, a semiquantitative EDS analysis was carried out on a selected portion of the PdAu-500 °C sample and on a single NP of 20 nm, as shown in Figure 4. The initial analysis indicates a Pd:Au molar ratio of 2.6, which is close to the ICP-OES data. The atomic profile evaluation of the selected nanoparticle (Figure 4B) highlights a notable variability of the atomic percentages of Pd and Au along the NP’s length. Notably, there is a high concentration of Pd relative to Au at the core level, with a ratio of approximately 7 to 1.
XPS analysis was employed to analyze the surface composition of the nanoparticles in detail and to investigate the electronic properties of the elements present [23,31]. Figure 5 shows the Au and Pd deconvoluted spectra of PdAu-PVA (Figure 5A,B) and PdAu-500 °C (Figure 5C,D), while all extrapolated data are reported in Table 1. The surface composition of the nanoparticles is characterized by a significantly higher concentration of Pd atoms, approximately 2.7 times greater than that of Au. This is supported by the previous EDS atomic profile, which highlights the predominant presence of palladium on the surface. The heat treatment does not change significantly the surface composition; however, the data in Table 1 suggest that the surface is more oxidized, with a higher concentration of Pd(II) and Au(I), Au(III) compared to the PdAu-PVA sample.

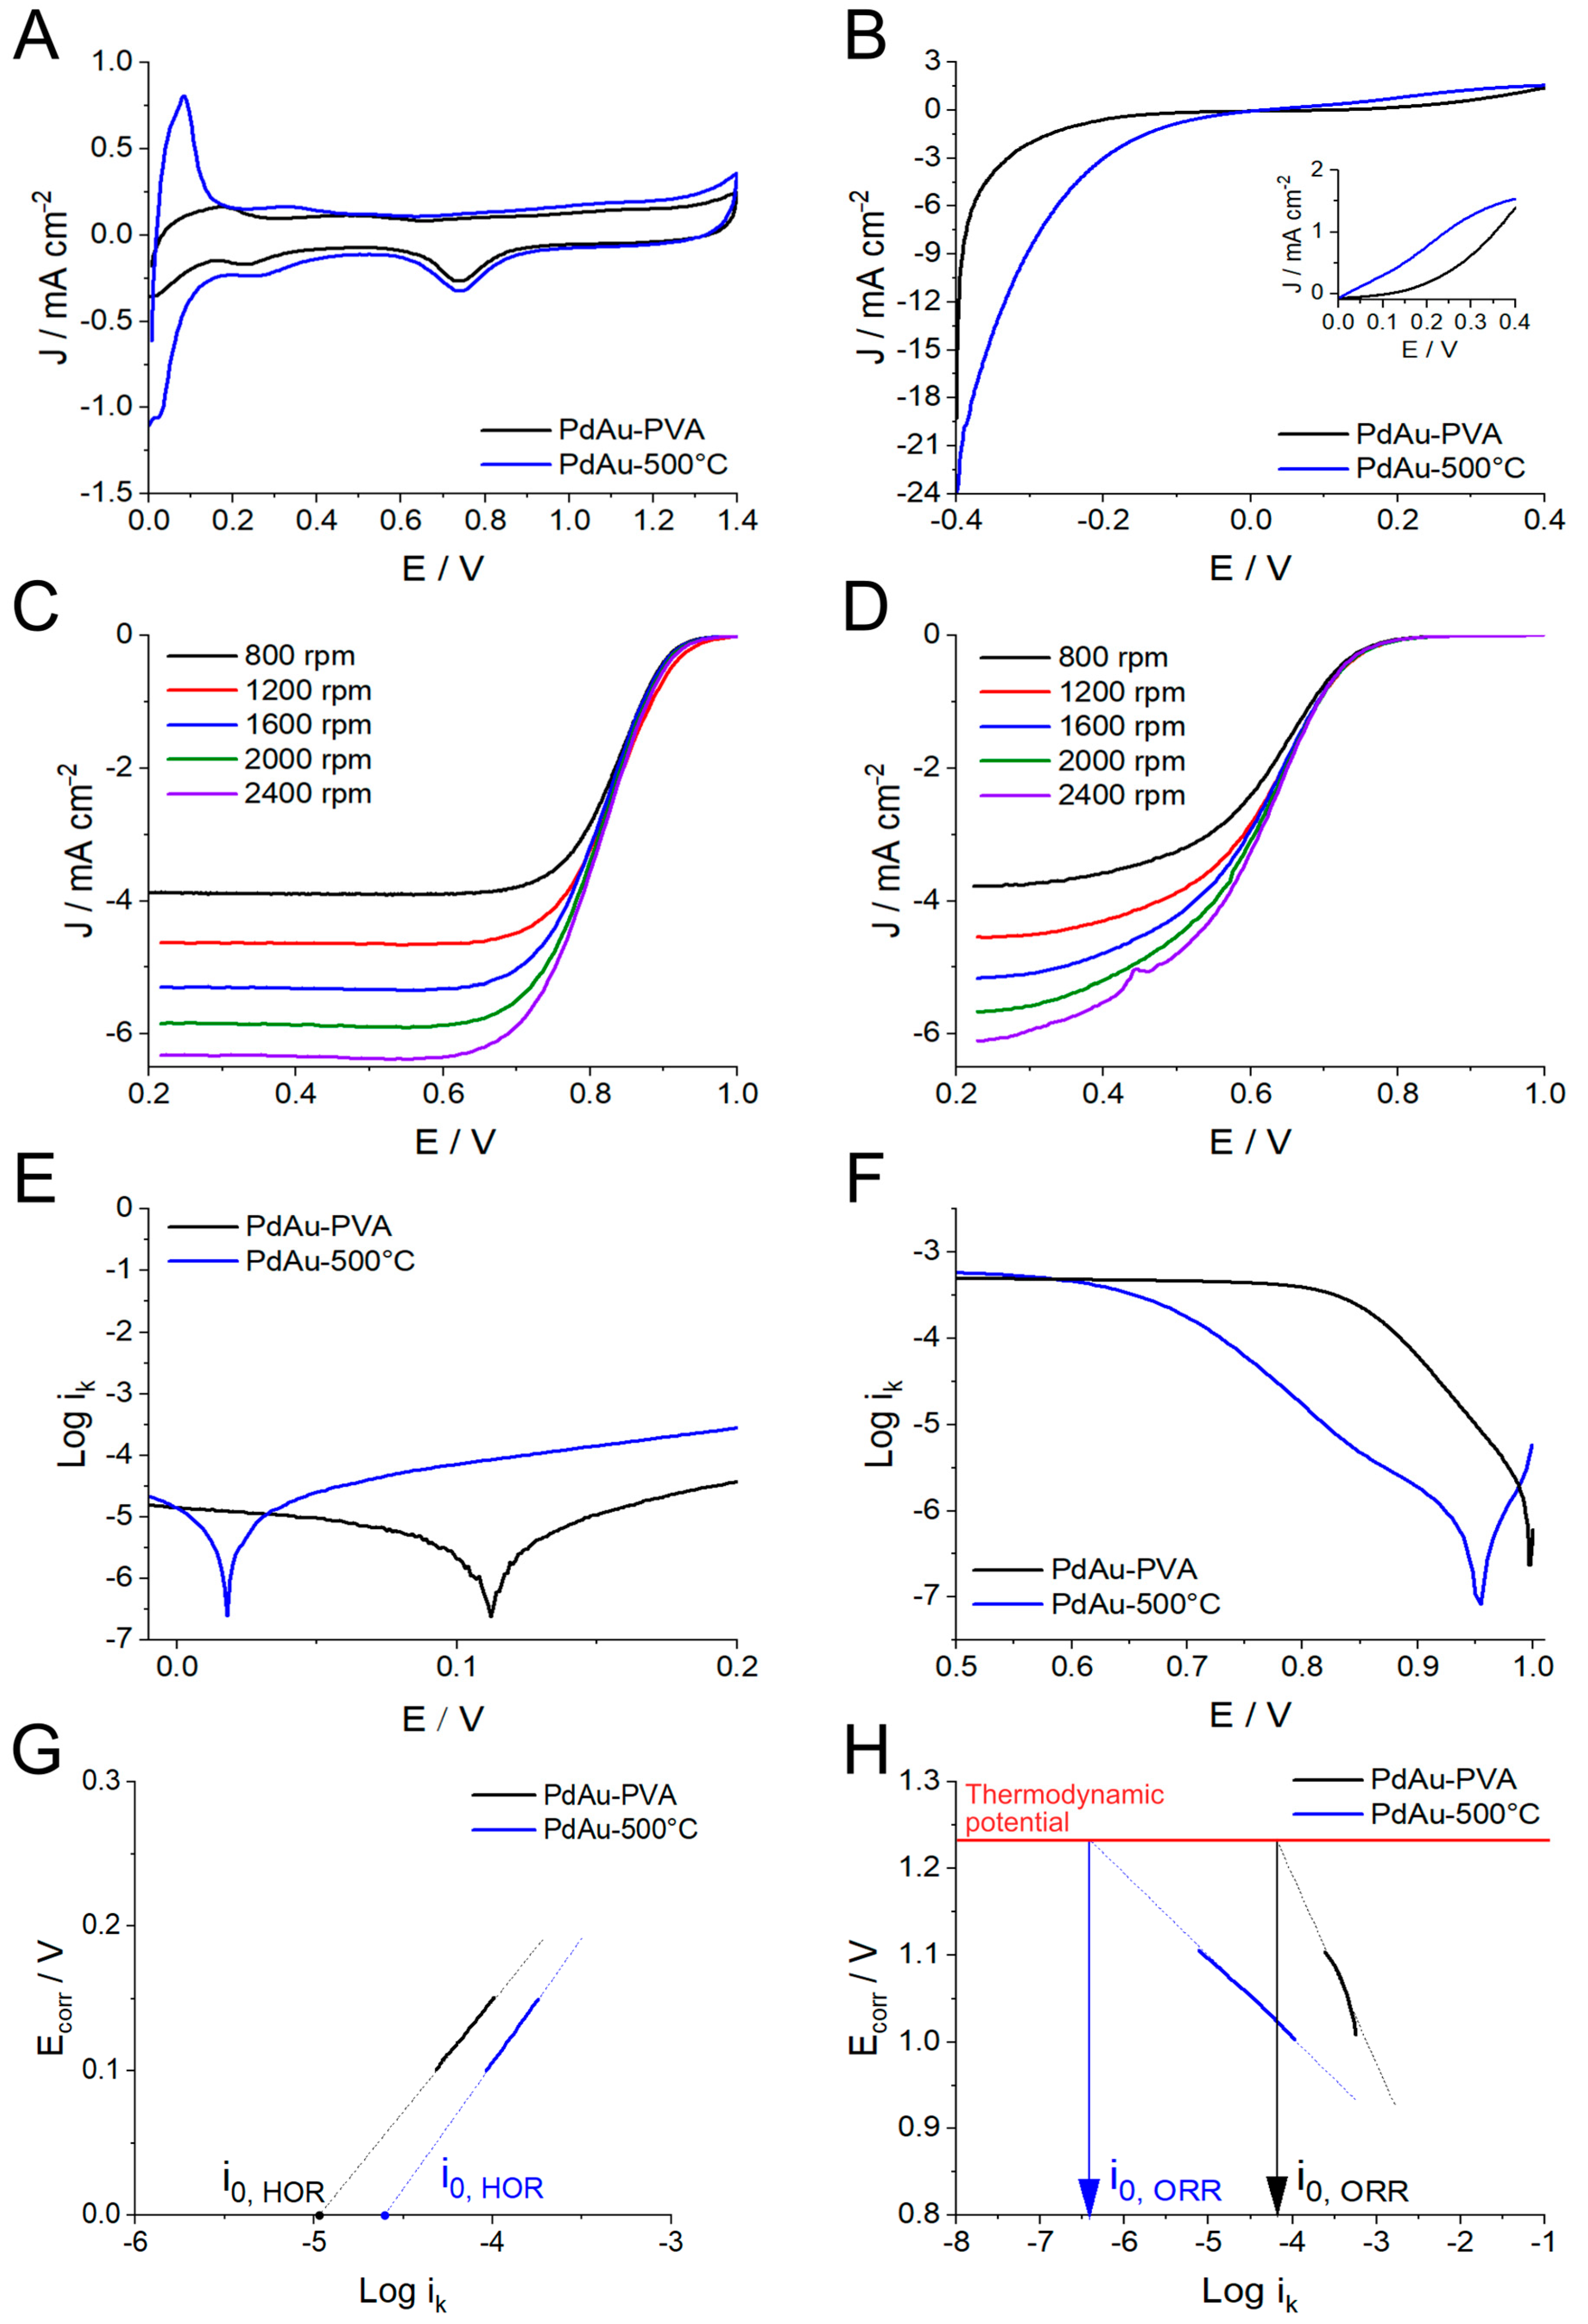
2.2. Electrochemical Testing

Electrochemical experiments were conducted in 0.1 M KOH to study the electrochemical properties of the two PdAu catalysts. Cyclic Voltammograms (CV), shown in Figure 6A, were registered at 20 mV s−1 from 0 to 1.4 V vs. RHE. The Pd-centered redox transitions are clearly defined for both materials, as reported in the literature for pure or alloy-based Pd electrocatalysts [32]. However, PdAu-500 °C (blue trace) displays different characteristics compared to PdAu-PVA (black trace). PdAu-500 °C exhibits a lower onset potential and a higher current for hydrogen desorption compared to PdAu-PVA in the anodic scan, along with a marked H-adsorption in the cathodic scan. Such increased activity in the H region (0–0.2 V) of the CV indicates that the HER and HOR reactions will be enhanced [33]. The position and intensity of the PdO reduction peak, observed around 0.7 V vs. RHE during the cathodic scan, show negligible differences. The electrochemical active surface area (EASA) was estimated by the integration of this reduction peak, as detailed in the Experimental Section 3 [34]. An increase in the surface area from 12.8 to 15.3 m² g−1 is observed for PdAu-500 °C, confirming that heat treatment effectively removes PVA capping agents from the nanoparticle surface and causes a better distribution and definition of NPs. HER/HOR activities of both catalysts were investigated by LSV in H2-saturated 0.1M KOH. The data presented in Figure 6B, along with the inset focusing on the HOR region from 0 to 0.4 V, clearly demonstrate that the heat-treated sample exhibits the highest activity. PdAu-500 °C shows, for both reactions, lower overpotentials and higher current densities, indicated as JHOR and JHER, considered at the chosen overpotential of 0.2 V and referred to geometric area (mA cm−2) or EASA (A m−2). The J values, shown in Table 2, demonstrate that PdAu-500 °C exhibits significantly enhanced activity compared to PdAu-PVA, with improvements of up to 4.3 times for HOR and up to 5 times for the HER. Moreover, the Tafel plot (Figure 6E) and the relative extrapolated exchange currents (I0) (Figure 6G and Table 2) for the HER/HOR region are a further index of the superior PdAu-500 °C performance [35].
Both PdAu-PVA and PdAu-500 °C were also tested for the ORR by LSV in O2-saturated 0.1 M KOH (Figure 6C,D) at five different working electrode (RDE) rotation speeds. Relevant electrochemical parameters are listed in Table 3. As can be seen in Figure 6C, PdAu-PVA is more active for ORR, with an onset potential of 0.91 V vs. RHE. In contrast, PdAu-500 °C shows a shift in the ORR onset potential to 0.74 V vs. RHE, suggesting that a higher overpotential is needed to initiate the reaction. The Tafel analysis was performed on the 1600 rpm LSV curve (Figure 6F) and the extrapolated data (Figure 6H and Table 3) confirm the superior activity of PdAu-PVA for ORR, which exhibits an exchange current over tenfold improved compared to PdAu-500 °C. The Koutecky–Levich (K-L) analysis [36] was performed on the ORR LSVs at three different potential steps for each catalyst to investigate the ORR kinetics and determine the number of exchanged electrons during the reaction. The K-L plots, shown in Figure S3, display a linear relationship between the reciprocal of the current density (J⁻¹) and the reciprocal square root of the rotation rate (ω⁻¹/²) for each potential step. The similar slopes calculated from the plots confirm first-order kinetics with respect to O₂ concentration within the potential range of 700 to 400 mV vs. RHE. Kinetic current densities for PdAu-PVA, calculated from the intercepts of the K-L plots, ranged from 23.8 to 50.0 mA cm⁻², while for PdAu-500 °C, the kinetic current densities ranged from 7.8 to 19.6 mA cm⁻². Thus, the PdAu-PVA catalyst exhibits surprisingly high kinetic current densities, indicating superior activity compared to PdAu-500 °C. The number of exchanged electrons, calculated as explained in the Experimental Section 3, is equal to 4 in all cases, confirming the full reduction of oxygen molecules to water. All K-L electrochemical data are resumed in Table 3.
Surprisingly, the inverse performance observed for the catalysts in hydrogen and oxygen reactions suggests that the catalytic activity of PdAu is influenced by distinct factors. In the case of hydrogen, the higher surface area, absence of PVA, and increased presence of oxide species are the key factors driving enhanced activity. As described in the literature, the hydrogen oxidation reaction (HOR) proceeds through the Heyrovský, Tafel, and Volmer steps. In alkaline media, hydroxide ions play a crucial role in both the Tafel and Volmer steps, influencing the overall reaction rate. These steps are more efficient when the catalyst exhibits strong oxophilicity, ensuring effective adsorption of hydroxide ions onto the catalyst surface. We hypothesize that the high oxophilicity of the PdAu-500 °C surface facilitates the uptake of hydroxide ions (OH) involved in both HOR and HER, as theoretically described [35], thereby enhancing the reaction rates. In contrast, for the ORR, activity decreases when higher percentages of Pd(II), Au(I), and Au(III) are present on the surface. The resulting oxophylic surface binds strongly to the oxygen intermediates in the ORR, blocking active sites and slowing the reaction. Additionally, the surface irregularities in PdAu-PVA also play a significant role in enhancing ORR kinetics with high concentrations of defects and edge sites [37,38].

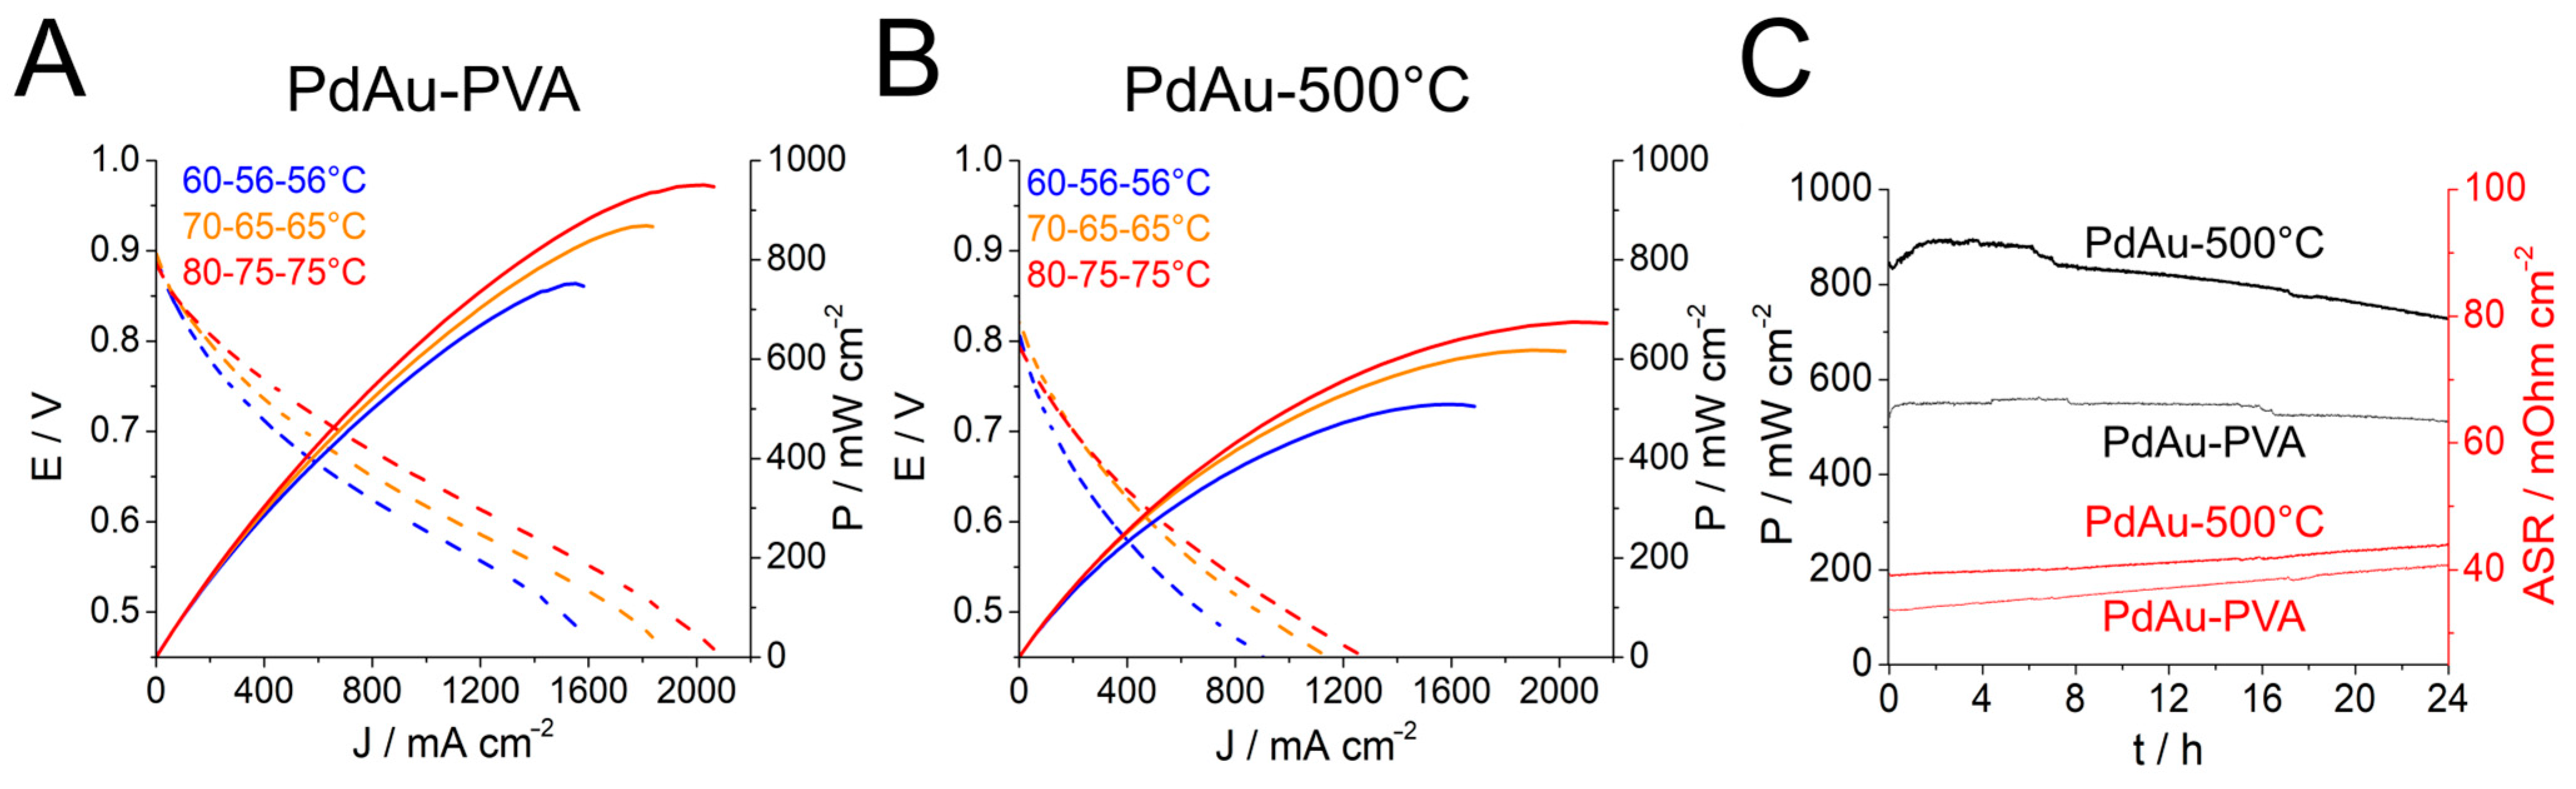
2.3. Discussion on Fuel Cell Testing

PdAu-PVA and PdAu-500-based electrodes were prepared by spray coating catalyst inks into Toray paper at the desired loading (0.25 or 0.50 mgPdAu cm−2), as described in the Experimental Section 3, for testing their HOR and ORR performances in fuel cells devices. Commercial Pt/C (40 wt %) and PtRu/C (30 wt %) were used to prepare, respectively, the cathode and anode electrodes used as reference electrodes (0.4 mgM cm−2). Three MEA types were assembled and tested. The composition of each MEA is summarized in Table 4. Prior to cell testing, the AEI-containing electrodes and HDPE-AEM were soaked in an aqueous 1.0 M KOH solution for 1 h to displace Cl counter ions to predominantly OH anions (with trace HCO3−/CO32− due to adsorption of CO2 from the air) in the AEM. The electrodes and HDPE-AEM were then washed with ultrapure water to remove excess K+ cations and OH counter ions before assembly in the fuel-cell hardware. The MEAs were pressed between the graphite flow fields using appropriate gaskets to optimize the compression and sealing. The exact test conditions used to obtain fuel-cell data are summarized in each figure caption. All gases were supplied without back-pressurization. The MEAs were “activated” by operation at 0.5 V until a steady current density was achieved (minimum of 1 h). During the experiments, the cell temperature, gas humidification, and flow regime were adjusted to reach a suitably stable cell performance. Initially, the fuel-cell performance was determined under conditions of high temperature (60–80 °C) and low gas flow regimes (0.5 L min−1 for anode (H2) and up to 1 L min−1 for cathode (O2), respectively).
Figure 7 shows the fuel cell performance of MEAs 1 and 2, employing PdAu-PVA (Figure 7A) and PdAu-500 °C (Figure 7B) as anode electrodes with a total metal loading of 0.5 mg cm−2. The cathode electrode used in both cases was Pt/C (0.4 mgPt cm−2). Cell voltage and powder density curves are shown for different cell temperature and gas humification temperatures. Under all conditions, the cell employing the heat-treated catalyst performed better. The peak power density increased with cell temperature, reaching a maximum of 950 mW cm−2. In comparison, PdAu-PVA, at the same cell temperature, reached a Pmax of 775 mW cm−2. A short-term stability study was undertaken for 24 h at a fixed cell potential of 0.5 V (Figure 7C). For PdAu-500 °C, the power density varied between 800 and 850 mW cm−2, while for the PdAu-PVA cell, a value of around 550 mW cm−2 was obtained. The area-specific resistance was monitored during the experiments. In both cases, the ASR increased over the course of the tests by circa 5 mOhm. These results confirm the increased activity for HOR after the treatment of the catalyst at 500 °C. Fuel cell testing was also carried out using the PdAu-PVA material as the cathode electrode (MEA 3), as it was shown to have enhanced activity. Figure 8 shows the performance with a PtRu/C anode electrode at cell temperatures of 60 and 80 °C. As can be seen in Figure 8A, the highest peak power was obtained at 60 °C (1100 mW cm−2). The fuel cell at 60 °C showed severe mass transport limitations at high current densities (>1800 mA cm−2). At a cell temperature of 80 °C, such effects were much less present, as can be seen in Figure 8B, where the current density reached values above 2 A cm−2. These effects are generally observed in the high current density region of the fuel cell curve, where the current density becomes limited by the transport of reactants to the catalyst surface. For example, H2 and/or O2 gas transport within the catalyst layer, as well as the transport of OH- in the electrolyte (membrane and catalyst layer). Such effects may be alleviated by increased temperature, which favours the kinetics of mass transport. The peak power density obtained at 80 °C was 900 mW cm−2. The cell power density obtained at a constant voltage of 0.5 V over a 3-h period is shown in Figure 8C. The initial cell power density was 900 mW cm−2 and reached 700 mW cm−2 by the end of the test.
In summary, the fuel cell data confirm the results of the electrochemical half-cell data. The anode PdAu-500 °C produced higher power densities than the untreated catalyst, while the PdAu-PV, when used as a cathode catalyst, produced high power densities. The performance of AEMFCs incorporating these PdAu-based catalysts reported here is within the top range of recent reports in terms of W per mgPGM−1 (1.1–1.7) [39].

3. Experimental

3.1. Synthesis Procedure

Bimetallic PdAu alloy nanoparticles were synthesized by co-reduction of K2PdCl4 and HAuCl4·3H2O with an aqueous NaBH4 solution in the presence of a stabilizing agent (PVA), as follows [28]: Two aqueous metal salt solutions, 5 mL of 92 mg K2PdCl4 and 5 mL of 36 mg HAuCl4, were added to 65 mL of deionized water. A 10 mL aqueous solution of 109 mg PVA (mPVA/m(Pd + Au) = 1.2, m= mass, PVA M.W. = 13,000–23,000) was then added into the precursor solution under continuous stirring at room temperature. Subsequently, 20 mL of 73 mg freshly prepared NaBH4 solution (nNaBH4/n(Au + Pd) = 5, n = mol) was added dropwise by a peristaltic pump at a constant rate of 1 mL min−1 to form a dark-brown sol. After the addition of all the NaBH4 solution, the mixture was stirred at room temperature for another 30 min, followed by the addition of Vulcan XC-72 carbon support (450 mg). The amount of support was calculated to obtain the desired total metal loading of 10 wt%. The pH of the suspension was adjusted to 3 with concentrated H2SO4. The slurry was filtered, and the catalyst, denoted as PdAu-PVA, was thoroughly washed with acetone and deionized water, then dried to a constant weight at 60 °C for 12 h. The final yield was 570 mg (83%), with the metal content determined by Inductively Coupled Plasma Optical Emission Spectroscopy (ICP-OES Perkin Elmer OPTIMA 8000, Waltham, MA USA) as 4.7% Pd and 2.7% Au. A portion of the catalyst was treated at 500 °C for 5 h under an inert nitrogen (N₂) flow (PdAu-500 °C). The yield was 80%, with the metal content, as determined by ICP-OES, being 5.8% Pd and 3.1% Au (mPd:mAu = 3.4).

3.2. Chemical–Physical Characterization

Powder X-ray diffraction (PXRD) analyses for PdAu-PVA and PdAu-500 °C were conducted at ambient temperature utilizing a PANalytical X’PERT PRO powder diffractometer. This setup employed CuKα radiation (λ = 1.5418 Å), complemented by a parabolic MPD-mirror and a PIXcel RTMS detector. The data were collected across a 2Θ range of 10.0 to 80.0° with a step increment of 0.105° and a total counting duration of 428.9 s, using a silicon zero background as the sample holder.
High-resolution transmission electron microscopy (HR-TEM) and scanning transmission electron microscopy (STEM) were conducted using a Talos F200X G2 TEM microscope from Thermo Scientific (Bleiswijk, The Netherlands). Utilizing its circular four-detector SuperX Energy Dispersive detector, high-resolution energy dispersive X-ray (EDX) analyses were performed on the PdAu-based material samples. A drop of sample solution, consisting of a small amount of PdAu-PVA or PdAu-500 °C material dispersed in iso-propanol, was cast onto a Holey TEM copper grid, which served as the sample holder for characterization. HR-TEM images, along with High-Angle Annular Dark Field (HAADF-STEM) micrographs and corresponding EDS mapping of PdAu-based catalysts, were obtained.
Inductively Coupled Plasma Optical Emission Spectroscopy (ICP-OES) analysis was carried out with an ICP-Optical emission dual view Perkin Elmer OPTIMA 8000 apparatus.
X-ray photoelectron spectroscopy (XPS) analyses were performed within an ultra-high vacuum chamber, achieving a base pressure below 10−9 to 10−10 mbar. The radiation employed was non-monochromatized Al Kα radiation (hυ = 1486.6 eV, VSW-TA10) paired with a hemispherical electron/ion energy analyzer (VSW-H100 equipped with a 16-channel detector). The X-ray source was operated at a power of 144 W (12 kV and 12 mA), and photoelectrons were collected perpendicular to the sample surface, maintaining a fixed angle of 54.5° between the analyzer axis and the X-ray source. Spectra were obtained in fixed analyzer transmission (FAT) mode with a pass energy of 44.0 eV. All samples were mounted on Carbon Tape, and the spectra were evaluated using CasaXPS 2.3.26PR1.0 software. Background subtraction utilized linear or Shirley functions, while the deconvolution of the XPS spectra was performed using a combination of Lorentzian asymmetric and Gaussian-Lorentzian functions. Calibration of the XPS spectra was achieved by setting the C sp2 component of the C 1 s signal to 285.1 eV.

3.3. Electrochemical Measurements

An ink was prepared for each sample, consisting of approximately 7 mg of catalyst, 600 mg of H2O, 600 mg of EtOH, and 15 mg of 5% Nafion ionomer. The mixture was then sonicated for 30 min to ensure uniform dispersion. A specific volume of 7 µL of each ink was subsequently deposited by drop-casting onto the working electrode, resulting in a metal loading of approximately 5–6 µg.
All glassware was cleaned with an H2O2/H2SO4 concentrated solution overnight and rinsed several times with Milli-Q water before use. Cyclic voltammetry (CV) and linear scan voltage (LSV) experiments were carried out in a three-electrode system, composed of a glassy carbon disk (0.196 cm2) as working electrode (WE), a standard Ag/AgClsat reference electrode (RE), and a gold wire coated in a glass tube as counter-electrode (CE). An aqueous solution of 0.1 M KOH (prepared using Milli-Q water) was prepared and introduced into the cell. This solution was subsequently purged with N2 gas for 30 min prior to conducting CV tests, or with H2 or O2 for LSV experiments aimed at investigating the catalysts’ performance for hydrogen oxidation reaction (HOR) and oxygen reduction reaction (ORR), respectively. The half-cell potential was referenced to the reversible hydrogen electrode (RHE) using the Nernst Equation, given by 0.197 V (E° Ag/AgClsat) + 0.059 × pH and corrected for IR drop. The electrochemical tests were carried out by Parstat 2273 (Princeton Applied Research, Oak Ridge, TN, USA), using the software “Power-Suite 2.58”. CVs were recorded at a rate of 20 mV s−1 to calculate the electrochemical active surface area (EASA) of the catalysts (m2 g−1). This was done by integrating the charge of the Pd-oxide peak (A·V), dividing it by the scan rate of 0.02 V·s−1 to convert it into Coulombs (C), and then normalizing the result using the stripping factor of 405 μC cm−2. The HOR experiments were conducted at a scan rate of 1 mV s−1 and a WE rotating speed of 1600 rpm, while for the ORR, LSVs were carried out at 5 mV s−1 and 1600 rpm (except for the Levich plot experiments where the speed varied from 800 to 2400 rpm). The Tafel analysis was performed for each reaction to calculate the exchange current i0, expressed as A g−1, as a measure of the catalytic activity and efficiency of the electrode materials involved in the electrochemical process. The number of electrons involved in the reduction reaction of each oxygen molecule was calculated from the Koutecky–Levich Equation [36]:
1 J = 1 J l + 1 J k = 1 B ω 1 2
where;
B = 0.62 n F C 0 ( D 0 ) 2 3 ν 1 2

3.4. Membrane–Electrode–Assembly (MEA) Preparation

ETFE-based radiation-grafted anion exchange membranes and ionomers (RG-AEMs and RG-AEIs, respectively), containing benzyltrimethylammonium (BTMA) functional groups, were used [40]. The electrodes were fabricated using the sprayed catalyst-coated gas diffusion electrode (GDE) method [16,17,41]. The AEI powder, with an ion-exchange capacity (IEC) of 1.26 ± 0.06 mmol g−1, was ground with a pestle and mortar for 10 min. The preparation procedure for both the anode and cathode is the same: a specific amount of the desired catalyst and AEI powders (20 wt% of the total solid mass) were mixed with 1 mL of water and 9 mL of propan-2-ol. The obtained ink was homogenized by ultrasonication for 30 min and then sprayed onto a Toray TGP-H-60 carbon paper gas diffusion substrate (Alfa Aesar, 10% PTFE) using an Iwata spray gun, with intermittent (<10 s) drying on a hot plate (80 °C) and weighing to ensure the correct loadings. All electrodes and the HDPE RG-AEM [41] (IEC = 2.56 mmol g−1) were immersed in an aqueous KOH solution (1 mol L−1) for 1 h, with an exchange of the KOH solution with a fresh solution midway through and then washed thoroughly in ultrapure water to remove excess KOH. The MEA (composed of the anode, cathode, and AEM) was then assembled and enclosed into a 5 cm2 fuel-cell fixture (Scribner Associates, Boerne, TX, USA) at a 5 N m torque.

3.5. Fuel Cell Testing

An 850e fuel-cell test station (Scribner Associates) was used for testing. The fuel-cell temperature was varied between 60 and 80 °C. H2 and O2 gas feeds, with flow rates of up to 0.5 and 1 L min−1, were supplied to the anode and cathode, respectively, with no back-pressurization. The dewpoints for both the anode and cathode gas supplies were adjusted to determine the sensitivity of performance to changes in gas humidification. All the connecting lines between the fuel-cell tester and the fuel-cell fixture were heated to prevent premature condensation before the humidified gases entered the flow field. The MEAs were activated by discharging the cell at a constant voltage of 0.5 V during cell heating and leaving the cells at this voltage until a steady current density was observed. AEMFC performance data were collected under controlled potentiostatic conditions. The internal Ohmic resistances were estimated using the 850e instrument’s internal current interrupt method.

4. Conclusions

This study demonstrates an effective method for preparing PdAu electrocatalysts with tunable atomic scale surfaces through heat treatment, highlighting their significant potential for enhancing the hydrogen oxidation and oxygen reduction reactions in AEMFCs. We demonstrate how heat treatment at 500 °C under an inert atmosphere enhances the crystallinity and oxophilicity of the NP surface, thereby improving their HOR activity. In contrast, these factors do not benefit the oxygen reduction reaction (ORR), which is favored by the untreated PdAu-PVA. Understanding the relationship between the nanostructured surface of catalysts and their electrochemical activity and how tuning the surface can enhance or favor certain reactions will help researchers improve materials and reduce the need for critical raw materials in energy devices such as fuel cells. Future research should focus on improving their long-term durability for practical applications in fuel cells and other electrochemical devices.

Supplementary Materials

The following supporting information can be downloaded at: https://www.mdpi.com/article/10.3390/catal15040306/s1, Figure S1. Dimensional distribution of PdAu-500 °C nanoparticles; Figure S2. HAADF and BF micrographs of large portions of samples PdAu-PVA and PdAu-500 °C; Figure S3. Koutecky–Levich analysis of PdAu-PVA and PdAu-500 °C.

Author Contributions

H.A.M.: conceptualization, supervision, formal analysis, investigation; M.V.P. investigation, data curation, writing—original draft preparation; L.P.: investigation, data curation; M.B. investigation, data curation, writing; L.F.: investigation, data curation; T.P.: investigation, data curation. All authors have read and agreed to the published version of the manuscript.

Funding

The authors acknowledge the financial support provided by the FRESH project, funded by the European Union Horizon research and innovation program under grant agreement HORIZON-RIA-101069605. MVP acknowledges Made in Italy–Circular and Sustainable (MICS) Extended Partnership, funded by the European Union NextGeneration EU (Piano Nazionale di Ripresa e Resilienza (PNRR)–Missione 4, Componente 2, Investimento 1.3–D.D. 1551.11-10-2022, PE00000004). This research was also funded by the European Union NextGeneration EU through the Italian Ministry of Environment and Energy Security, POR H2 AdP MMES/ENEA, with the involvement of CNR and RSE (PNRR—Mission 2, Component 2, Investment 3.5, “Ricerca e sviluppo sull’idrogeno”), L.A.1.1.24 and L.A.3.1.6 (CUP: B93C22000630006).

Data Availability Statement

The data that support the findings of this study are available from the corresponding author upon reasonable request.

Conflicts of Interest

The authors declare no conflicts of interest.

References

  1. Agyekum, E.B.; Odoi-Yorke, F.; Abbey, A.A.; Ayetor, G.K. A Review of the Trends, Evolution, and Future Research Prospects of Hydrogen Fuel Cells—A Focus on Vehicles. Int. J. Hydrogen Energy 2024, 72, 918–939. [Google Scholar]
  2. Staffell, I.; Scamman, D.; Velazquez Abad, A.; Balcombe, P.; Dodds, P.E.; Ekins, P.; Shah, N.; Ward, K.R. The Role of Hydrogen and Fuel Cells in the Global Energy System. Energy Environ. Sci. 2019, 12, 463–491. [Google Scholar]
  3. Davydova, E.S.; Zaffran, J.; Dhaka, K.; Toroker, M.C.; Dekel, D.R. Hydrogen Oxidation on Ni-Based Electrocatalysts: The Effect of Metal Doping. Catalysts 2018, 8, 454. [Google Scholar] [CrossRef]
  4. Bambagioni, V.; Bianchini, C.; Filippi, J.; Lavacchi, A.; Oberhauser, W.; Marchionni, A.; Moneti, S.; Vizza, F.; Psaro, R.; Dal Santo, V.; et al. Single-Site and Nanosized Fe-Co Electrocatalysts for Oxygen Reduction: Synthesis, Characterization and Catalytic Performance. J. Power Sources 2011, 196, 2519–2529. [Google Scholar] [CrossRef]
  5. Miller, H.A.; Pagliaro, M.V.; Bellini, M.; Bartoli, F.; Wang, L.; Salam, I.; Varcoe, J.R.; Vizza, F. Integration of a Pd-CeO2/C Anode with Pt and Pt-Free Cathode Catalysts in High Power Density Anion Exchange Membrane Fuel Cells. ACS Appl. Energy Mater. 2020, 3, 10209–10214. [Google Scholar] [CrossRef]
  6. Xu, X.; Pan, Y.; Zhong, Y.; Ran, R.; Shao, Z. Ruddlesden–Popper Perovskites in Electrocatalysis. Mater. Horiz. 2020, 7, 2519–2565. [Google Scholar] [CrossRef]
  7. Arges, C.G.; Ramani, V.; Pintauro, P.N. The Chalkboard: Anion Exchange Membrane Fuel Cells. Electrochem. Soc. Interface 2010, 19, 31–35. [Google Scholar] [CrossRef]
  8. Merle, G.; Wessling, M.; Nijmeijer, K. Anion Exchange Membranes for Alkaline Fuel Cells: A Review. J. Memb. Sci. 2011, 377, 1–35. [Google Scholar] [CrossRef]
  9. Dekel, D.R. Review of Cell Performance in Anion Exchange Membrane Fuel Cells. J. Power Sources 2018, 375, 158–169. [Google Scholar] [CrossRef]
  10. Gottesfeld, S.; Dekel, D.R.; Page, M.; Bae, C.; Yan, Y.; Zelenay, P.; Kim, Y.S. Anion Exchange Membrane Fuel Cells: Current Status and Remaining Challenges. J. Power Sources 2018, 375, 170–184. [Google Scholar] [CrossRef]
  11. Vincent, I.; Bessarabov, D. Low Cost Hydrogen Production by Anion Exchange Membrane Electrolysis: A Review. Renew. Sustain. Energy Rev. 2018, 81, 1690–1704. [Google Scholar] [CrossRef]
  12. Wang, Y.; Wang, G.; Li, G.; Huang, B.; Pan, J.; Liu, Q.; Han, J.; Xiao, L.; Lu, J.; Zhuang, L. Pt-Ru Catalyzed Hydrogen Oxidation in Alkaline Media: Oxophilic Effect or Electronic Effect? Energy Environ. Sci. 2015, 8, 177–181. [Google Scholar] [CrossRef]
  13. Marković, N.M.; Schmidt, T.J.; Stamenković, V.; Ross, P.N. Oxygen Reduction Reaction on Pt and Pt Bimetallic Surfaces: A Selective Review. Fuel Cells 2001, 1, 105–116. [Google Scholar]
  14. Miller, H.A.; Vizza, F. Electrocatalysts and Mechanisms of Hydrogen Oxidation in Alkaline Media for Anion Exchange Membrane Fuel Cells. In Anion Exchange Membrane Fuel Cells: Principles, Materials and Systems; An, L., Zhao, T.S., Eds.; Springer International Publishing: Cham, Switzerland, 2018; pp. 79–103. ISBN 978-3-319-71371-7. [Google Scholar]
  15. Miller, H.A.; Vizza, F.; Marelli, M.; Zadick, A.; Dubau, L.; Chatenet, M.; Geiger, S.; Cherevko, S.; Doan, H.; Pavlicek, R.K.; et al. Highly Active Nanostructured Palladium-Ceria Electrocatalysts for the Hydrogen Oxidation Reaction in Alkaline Medium. Nano Energy 2017, 33, 293–305. [Google Scholar] [CrossRef]
  16. Bellini, M.; Pagliaro, M.V.; Lenarda, A.; Fornasiero, P.; Marelli, M.; Evangelisti, C.; Innocenti, M.; Jia, Q.; Mukerjee, S.; Jankovic, J.; et al. Palladium-Ceria Catalysts with Enhanced Alkaline Hydrogen Oxidation Activity for Anion Exchange Membrane Fuel Cells. ACS Appl. Energy Mater. 2019, 2, 4999–5008. [Google Scholar] [CrossRef]
  17. Lenarda, A.; Bellini, M.; Marchionni, A.; Miller, H.A.; Montini, T.; Melchionna, M.; Vizza, F.; Prato, M.; Fornasiero, P. Nanostructured Carbon Supported Pd-Ceria as Anode Catalysts for Anion Exchange Membrane Fuel Cells Fed with Polyalcohols. Inorganica Chim. Acta 2018, 470, 213–220. [Google Scholar] [CrossRef]
  18. Pagliaro, M.V.; Miller, H.A.; Evangelisti, C.; Bellini, M.; Tuci, G.; Pham-Huu, C.; Giambastiani, G.; Marelli, M.; Vizza, F. Synergy between Nickel Nanoparticles and N-Enriched Carbon Nanotubes Enhances Alkaline Hydrogen Oxidation and Evolution Activity. ACS Appl. Nano Mater. 2021, 4, 3586–3596. [Google Scholar] [CrossRef]
  19. Sanij, F.D.; Balakrishnan, P.; Leung, P.; Shah, A.; Su, H.; Xu, Q. Advanced Pd-Based Nanomaterials for Electro-Catalytic Oxygen Reduction in Fuel Cells: A Review. Int. J. Hydrogen Energy 2021, 46, 14596–14627. [Google Scholar]
  20. Fortunato, G.V.; Pizzutilo, E.; Cardoso, E.S.F.; Lanza, M.R.V.; Katsounaros, I.; Freakley, S.J.; Mayrhofer, K.J.J.; Maia, G.; Ledendecker, M. The Oxygen Reduction Reaction on Palladium with Low Metal Loadings: The Effects of Chlorides on the Stability and Activity towards Hydrogen Peroxide. J. Catal. 2020, 389, 400–408. [Google Scholar]
  21. Xu, C.; Chen, Q.; Ding, R.; Huang, S.; Zhang, Y.; Fan, G. Sustainable Solid-State Synthesis of Uniformly Distributed PdAg Alloy Nanoparticles for Electrocatalytic Hydrogen Oxidation and Evolution. Chin. J. Catal. 2021, 42, 251–258. [Google Scholar] [CrossRef]
  22. Xu, X.; Zhong, Y.; Wajrak, M.; Bhatelia, T.; Jiang, S.P.; Shao, Z. Grain Boundary Engineering: An Emerging Pathway toward Efficient Electrocatalysis. InfoMat 2024, 6, e12608. [Google Scholar] [CrossRef]
  23. Hu, Q.; Zhan, W.; Guo, Y.; Luo, L.; Zhang, R.; Chen, D.; Zhou, X. Heat Treatment Bimetallic PdAu Nanocatalyst for Oxygen Reduction Reaction. J. Energy Chem. 2020, 40, 217–223. [Google Scholar] [CrossRef]
  24. Jiang, K.; Wang, P.; Guo, S.; Zhang, X.; Shen, X.; Lu, G.; Su, D.; Huang, X. Ordered PdCu-Based Nanoparticles as Bifunctional Oxygen-Reduction and Ethanol-Oxidation Electrocatalysts. Angew. Chem. 2016, 128, 9176–9181. [Google Scholar] [CrossRef]
  25. Kang, Y.S.; Choi, K.H.; Ahn, D.; Lee, M.J.; Baik, J.; Chung, D.Y.; Kim, M.J.; Lee, S.Y.; Kim, M.; Shin, H.; et al. Effect of Post Heat-Treatment of Composition-Controlled PdFe Nanoparticles for Oxygen Reduction Reaction. J. Power Sources 2016, 303, 234–242. [Google Scholar] [CrossRef]
  26. Bonnefont, A.; Simonov, A.N.; Pronkin, S.N.; Gerasimov, E.Y.; Pyrjaev, P.A.; Parmon, V.N.; Savinova, E.R. Hydrogen Electrooxidation on PdAu Supported Nanoparticles: An Experimental RDE and Kinetic Modeling Study. Catal. Today 2013, 202, 70–78. [Google Scholar] [CrossRef]
  27. Edström, H.; Schaefer, A.; Jacobse, L.; von Allmen, K.; Hagman, B.; Carlsson, P.; Gustafson, J. Alloying and oxidation of PdAu thin films. Thin Solid Films 2024, 790, 140212. [Google Scholar] [CrossRef]
  28. Ma, C.; Du, Y.; Feng, J.; Cao, X.; Yang, J.; Li, D. Fabrication of Supported PdAu Nanoflower Catalyst for Partial Hydrogenation of Acetylene. J. Catal. 2014, 317, 263–271. [Google Scholar] [CrossRef]
  29. Hassanzadeh-Tabrizi, S.A. Precise Calculation of Crystallite Size of Nanomaterials: A Review. J. Alloys Compd. 2023, 968, 171914. [Google Scholar]
  30. Prieur, D.; Bonani, W.; Popa, K.; Walter, O.; Kriegsman, K.W.; Engelhard, M.H.; Guo, X.; Eloirdi, R.; Gouder, T.; Beck, A.; et al. Size Dependence of Lattice Parameter and Electronic Structure in CeO2 Nanoparticles. Inorg. Chem. 2020, 59, 5760–5767. [Google Scholar] [CrossRef]
  31. Casey, É.; Holmes, J.D.; Collins, G. PdAu Nanosheets for Visible-Light-Driven Suzuki Cross-Coupling Reactions. ACS Appl. Nano Mater. 2022, 5, 16196–16206. [Google Scholar] [CrossRef]
  32. Castello, C.; Peruzzolo, T.; Bellini, M.; Pagliaro, M.V.; Bartoli, F.; Berretti, E.; Poggini, L.; Pitzalis, E.; Evangelisti, C.; Miller, H.A. Direct Formate Anion Exchange Membrane Fuel Cells with a PdAu Bimetallic Nanoparticle Anode Electrocatalyst Obtained by Metal Vapor Synthesis. Energy Adv. 2024, 3, 2520–2529. [Google Scholar] [CrossRef]
  33. Miller, H.A.; Lavacchi, A.; Vizza, F.; Marelli, M.; Di Benedetto, F.; D’Acapito, F.; Paska, Y.; Page, M.; Dekel, D.R. A Pd/C-CeO2Anode Catalyst for High-Performance Platinum-Free Anion Exchange Membrane Fuel Cells. Angew. Chem. Int. Ed. 2016, 55, 6004–6007. [Google Scholar] [CrossRef]
  34. Mukundan, V.; Yin, J.; Hu, S.; Noborikawa, J. Pd-Based Bimetallic and Trimetallic Catalyst for Direct Formic Acid Fuel Cells. ECS Trans. 2014, 64, 1113. [Google Scholar]
  35. Shinagawa, T.; Garcia-Esparza, A.T.; Takanabe, K. Insight on Tafel Slopes from a Microkinetic Analysis of Aqueous Electrocatalysis for Energy Conversion. Sci. Rep. 2015, 5, 13801. [Google Scholar] [CrossRef] [PubMed]
  36. Bhuvanendran, N.; Ravichandran, S.; Xu, Q.; Maiyalagan, T.; Su, H. A Quick Guide to the Assessment of Key Electrochemical Performance Indicators for the Oxygen Reduction Reaction: A Comprehensive Review. Int. J. Hydrogen Energy 2022, 47, 7113–7138. [Google Scholar] [CrossRef]
  37. Adachi, Y.; Nagai, T.; Kuroda, Y.; Ohgi, Y.; Matsuzawa, K.; Mitsushima, S.; Ota, K.; Ishihara, A. Factors Affecting ORR Activity of Nb-Added TiO x Catalyst Using Carbon Support for PEFC. ECS Trans. 2020, 98, 555–563. [Google Scholar] [CrossRef]
  38. Ge, X.; Sumboja, A.; Wuu, D.; An, T.; Li, B.; Goh, F.W.T.; Hor, T.S.A.; Zong, Y.; Liu, Z. Oxygen Reduction in Alkaline Media: From Mechanisms to Recent Advances of Catalysts. ACS Catal. 2015, 5, 4643–4667. [Google Scholar] [CrossRef]
  39. Li, F.; Chan, S.H.; Tu, Z. Recent Development of Anion Exchange Membrane Fuel Cells and Performance Optimization Strategies: A Review. Chem. Rec. 2024, 24, e202300067. [Google Scholar] [CrossRef]
  40. Biancolli, A.L.G.; Herranz, D.; Wang, L.; Stehlíková, G.; Bance-Soualhi, R.; Ponce-González, J.; Ocón, P.; Ticianelli, E.A.; Whelligan, D.K.; Varcoe, J.R.; et al. ETFE-Based Anion-Exchange Membrane Ionomer Powders for Alkaline Membrane Fuel Cells: A First Performance Comparison of Head-Group Chemistry. J. Mater. Chem. A Mater. 2018, 6, 24330–24341. [Google Scholar] [CrossRef]
  41. Wang, L.; Peng, X.; Mustain, W.E.; Varcoe, J.R. Radiation-Grafted Anion-Exchange Membranes: The Switch from Low- to High-Density Polyethylene Leads to Remarkably Enhanced Fuel Cell Performance. Energy Environ. Sci. 2019, 12, 1575–1579. [Google Scholar] [CrossRef]
Figure 1. XRD of PdAu-PVA (black upper trace) and PdAu-500 °C (red lower trace).
Catalysts 15 00306 g001
Figure 2. HR-TEM micrographs of (AC) PdAu-PVA and (DF) PdAu-500 °C. Scale bar: 50 nm (A,B,D,E) and 10 nm (C,F).
Catalysts 15 00306 g002
Figure 3. (A) STEM-HAADF and relative EDS mapping of (B) palladium and (C) gold in PdAu-PVA catalyst. (D) STEM-HAADF and relative EDS mapping of (E) palladium and (F) gold in PdAu-500 °C catalyst.
Catalysts 15 00306 g003
Figure 4. (A) EDX analysis of PdAu-500 °C and (B) relative atomic fraction % profile of the selected nanoparticle [31].
Catalysts 15 00306 g004
Figure 5. Pd 3d and Au 4d XPS spectra of (A) PdAu-PVA and (C) PdAu-500 °C; Au 4f spectra of (B) PdAu-PVA and (D) PdAu-500 °C.
Catalysts 15 00306 g005
Figure 6. (A) CVs in N2-saturated KOH 0.1M at 20 mV s−1. (B) LSVs in H2-saturated KOH 0.1M at 1 mV s−1 and 1600 rpm of PdAu-PVA (black line) and PdAu-500 °C (blue line). LSVs in O2-saturated KOH 0.1M at 5 mV s−1 at different rotation speeds of the WE: (C) PdAu-PVA and (D) PdAu-500 °C. Tafel plot and relative extrapolated exchange currents (i0) for both catalysts during (E,G) HOR and (F,H) ORR.
Catalysts 15 00306 g006
Figure 7. H2/O2 Fuel Cell testing of MEAs 1 and 2, composed of PdAu-PVA or PdAu-500 °C as anode (0.5 mgPdAu cm−2), HDPE-BTMA as anionic exchange membrane, and Pt (0.4 mgPt cm−2). Power curves for (A) PdAu-PVA and (B) PdAu-500 °C at different cell and gas temperatures. (C) Stability test at a constant potential of 0.5 V and a cell temperature of 80 °C, with H2/O2 gas flow at 75 °C and 0.5 Lmin−1.
Catalysts 15 00306 g007
Figure 8. H2-O2 FC testing of MEA 3, composed of PtRu (0.4 mgPtRucm−2) as anode and PdAu-PVA (0.25 mgPdAucm−2) as cathode. Power curves (black line) and potential scan (dotted line) at (A) Tcell = 60 °C, (B) Tcell = 80 °C, and (C) stability test at the constant potential of 0.5 V at Tcell =80 °C, and Tgas = 75 °C, and H2/O2 flow rates of 0.5–1 Lmin−1, respectively. The HDPE-BTMA was used as anion exchange membrane. Further details are reported in Table 4.
Catalysts 15 00306 g008
Table 1. Extrapolated XPS data of PdAu-PVA and PdAu-500 °C in terms of surface composition and oxidation states of elements.
Catalyst%Pd%AuPd/Au%Pd(0)%Pd(II)%Au(0)%Au(I)%Au(III)
PdAu-PVA73.226.82.721.378.760.532.66.9
PdAu-500 °C72.722.32.719.280.858.633.67.8
Table 2. Relevant electrochemical parameters for HOR at room temperature on glassy carbon electrodes.
CatalystJHOR@0.2V
mA cm−2
|JHER|@0.2V
mA cm−2
I0
A g−1
EASA
m2 g−1
JHOR,EASA @0.2V
A m−2
JHER,EASA @0.2V
A m−2
PdAu-PVA0.1810.6001.512.80.521.74
PdAu-500 °C0.7723.0584.815.31.947.69
Table 3. Relevant electrochemical parameters for ORR at room temperature on glassy carbon electrodes. Values of Koutecky–Levich constants DO2 = 1.98 × 10⁻⁵ cm2 s−1; υ = 1 × 10⁻² cm2 s−1; CO2 = 1.26 × 10⁻⁶ mol cm−3 [36].
Catalyst|Jl|@1600RPM
mA cm−2
Vonset
V
E@1/2Jl VKoutecky–Levich Analysis
(mA cm−2)−1 vs. ω−1/2
I0
A g−1
Jkne-
PdAu-PVA5.280.910.8223.8–50.0 [700–500 mV]3.9–4.013.1
PdAu-500 °C5.170.740.627.8–19.6 [600–400 mV]4.00.8
Table 4. Data performance of fuel cell testing.
MEAOCV
mV
AnodeCathodePmax
mW cm−2
J@Pmax
mA cm−2
Operating Conditions
Cell–Anode–Cathode °C
H2-O2 Flow Rate L min−1
1891
897
886
PdAu-500 °CPt757
871
952
1532
1791
2005
60-56-56  0.5-0.5
70-65-65  0.5-0.5
80-75-75  0.5-0.5
2794
820
806
PdAu-PVAPt510
619
674
1579
1902
2092
60-56-56  0.5-0.5
70-65-65  0.5-0.5
80-75-75  0.5-0.5
3920
923
PtRuPdAu-PVA1091
890
1802
1680
60-55-55  0.5-0.5
80-75-75  0.5-1.0
Disclaimer/Publisher’s Note: The statements, opinions and data contained in all publications are solely those of the individual author(s) and contributor(s) and not of MDPI and/or the editor(s). MDPI and/or the editor(s) disclaim responsibility for any injury to people or property resulting from any ideas, methods, instructions or products referred to in the content.

