

Enhanced Oxygen Reduction with Ethanol Tolerant Ni-Te Nanoparticles on Carbon Support Through Vapour-Solid Preparation

 ,
,  ,
,  , and
, and
Abstract

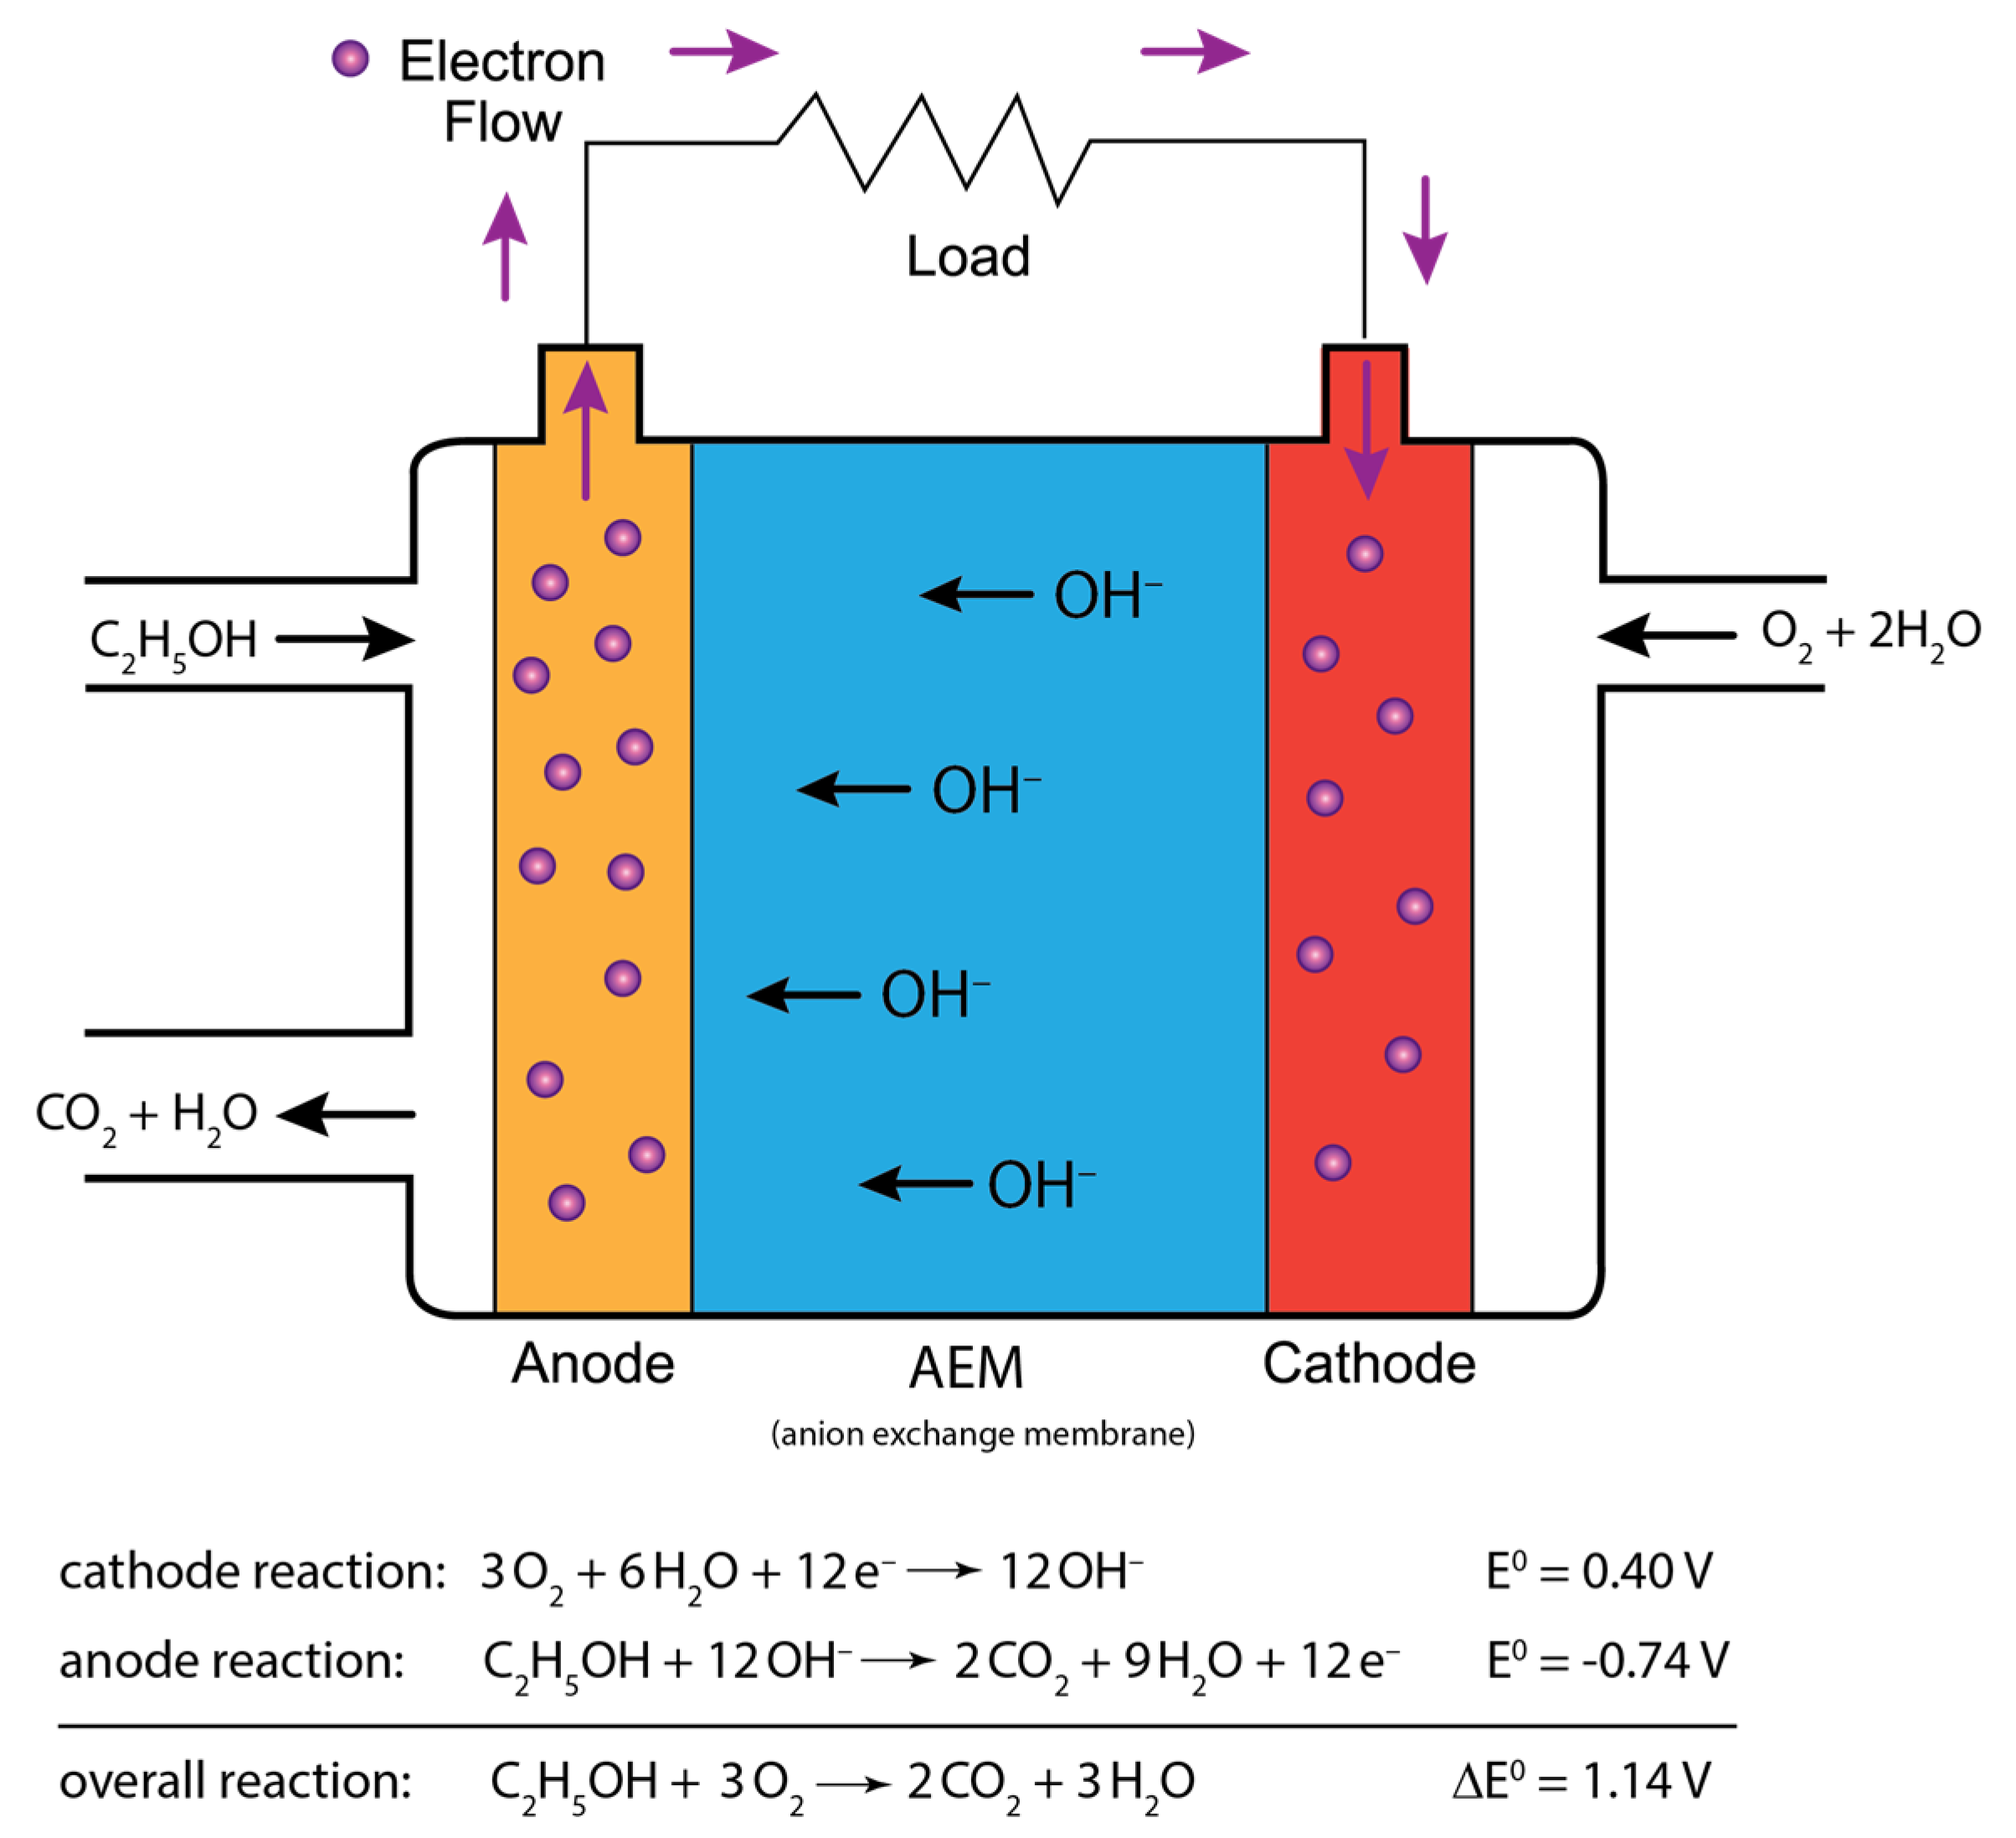
1. Introduction
2. Results and Discussion
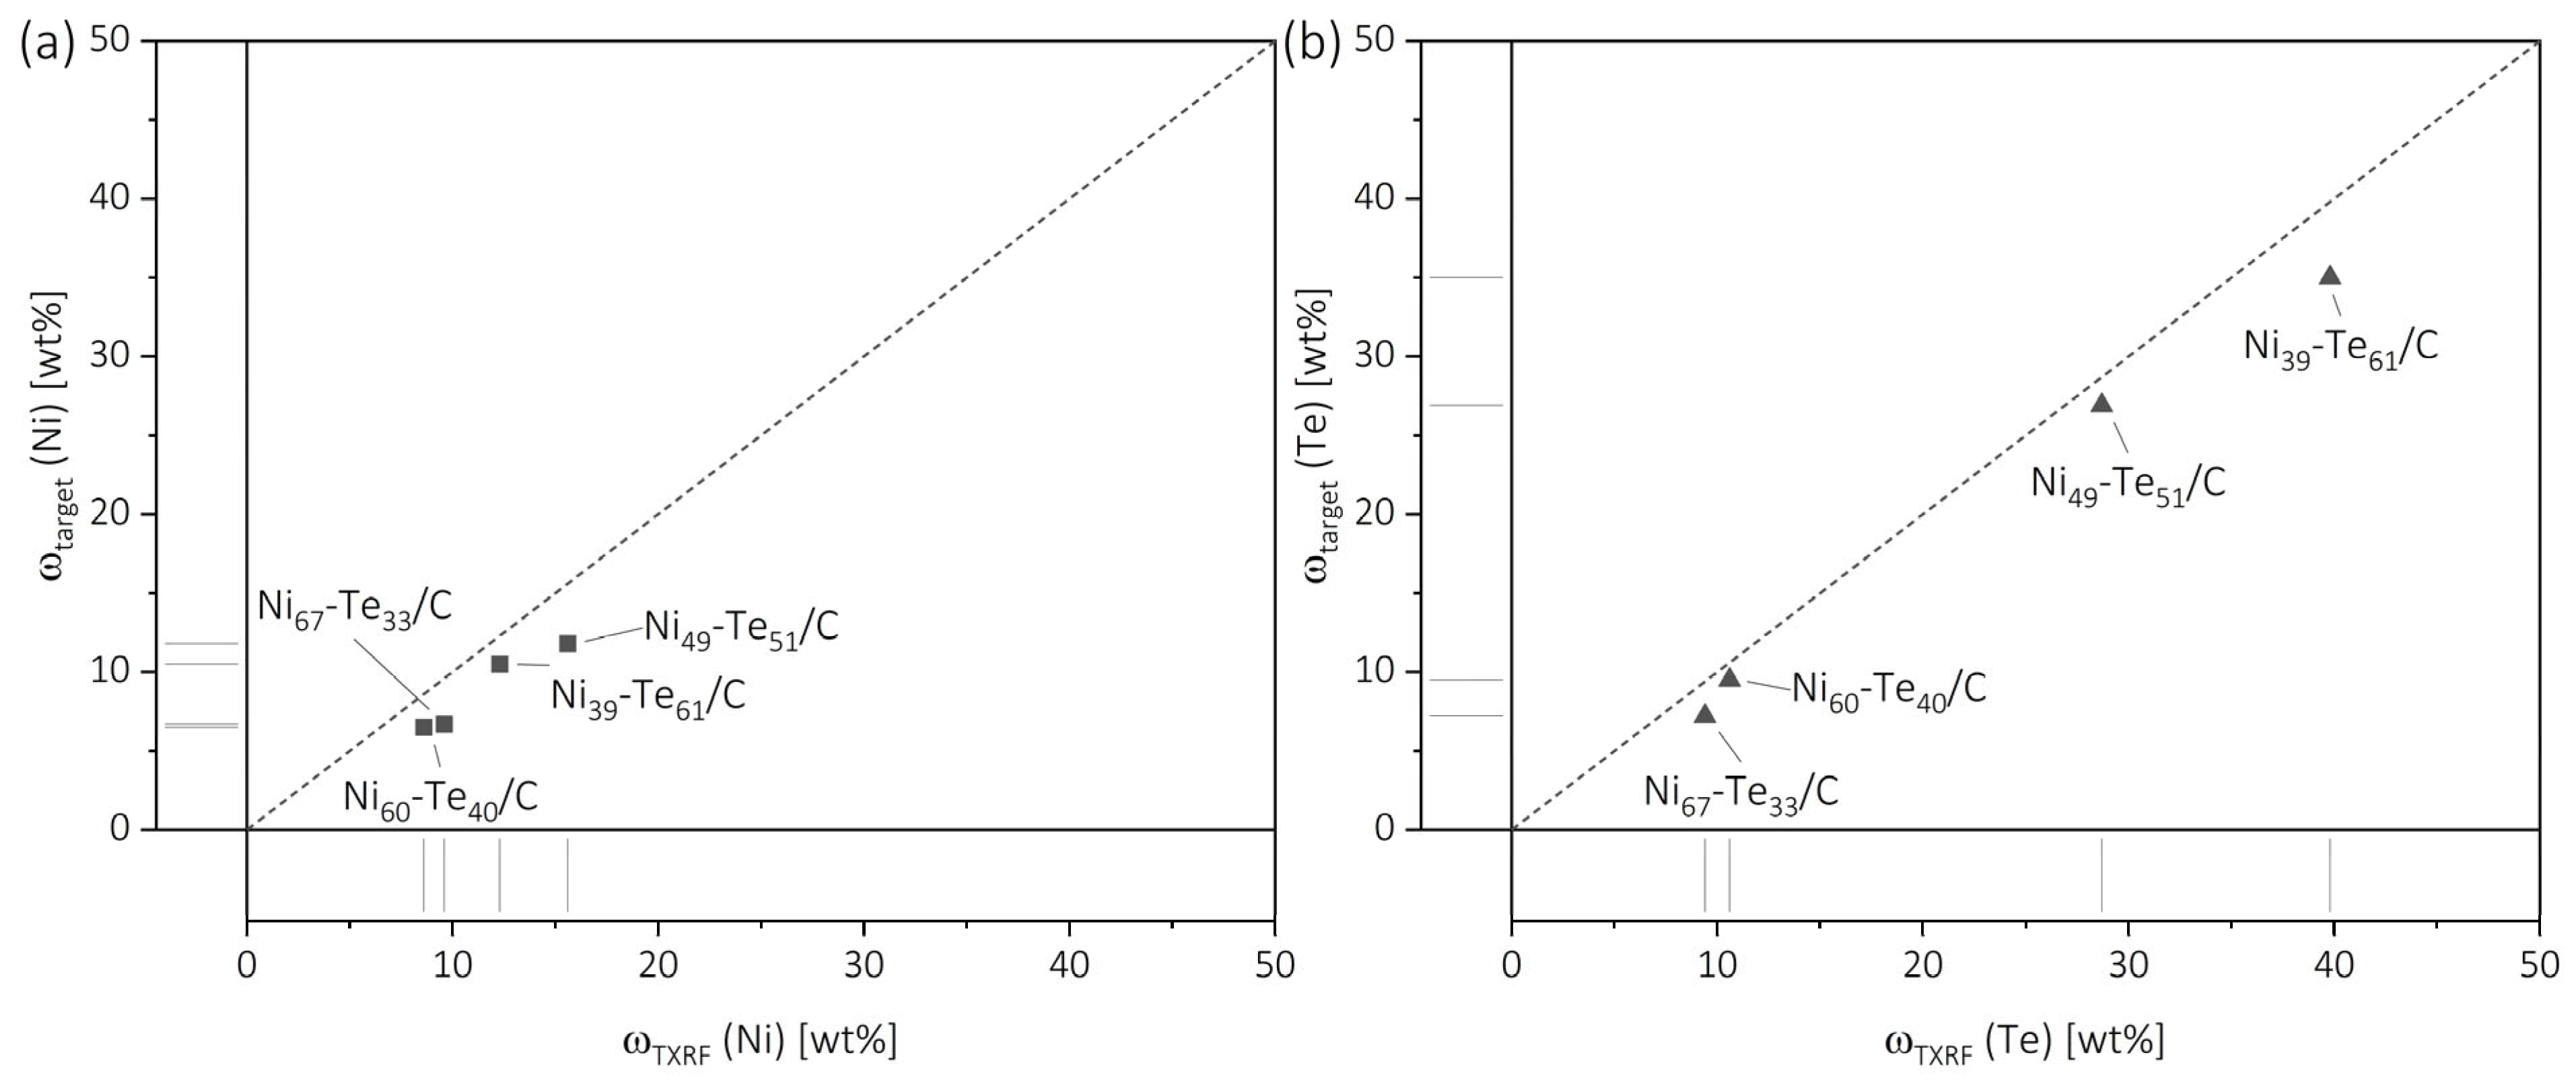
2.1. X-Ray Fluorescence Spectroscopy
2.2. X-Ray Diffraction and Rietveld Refinement
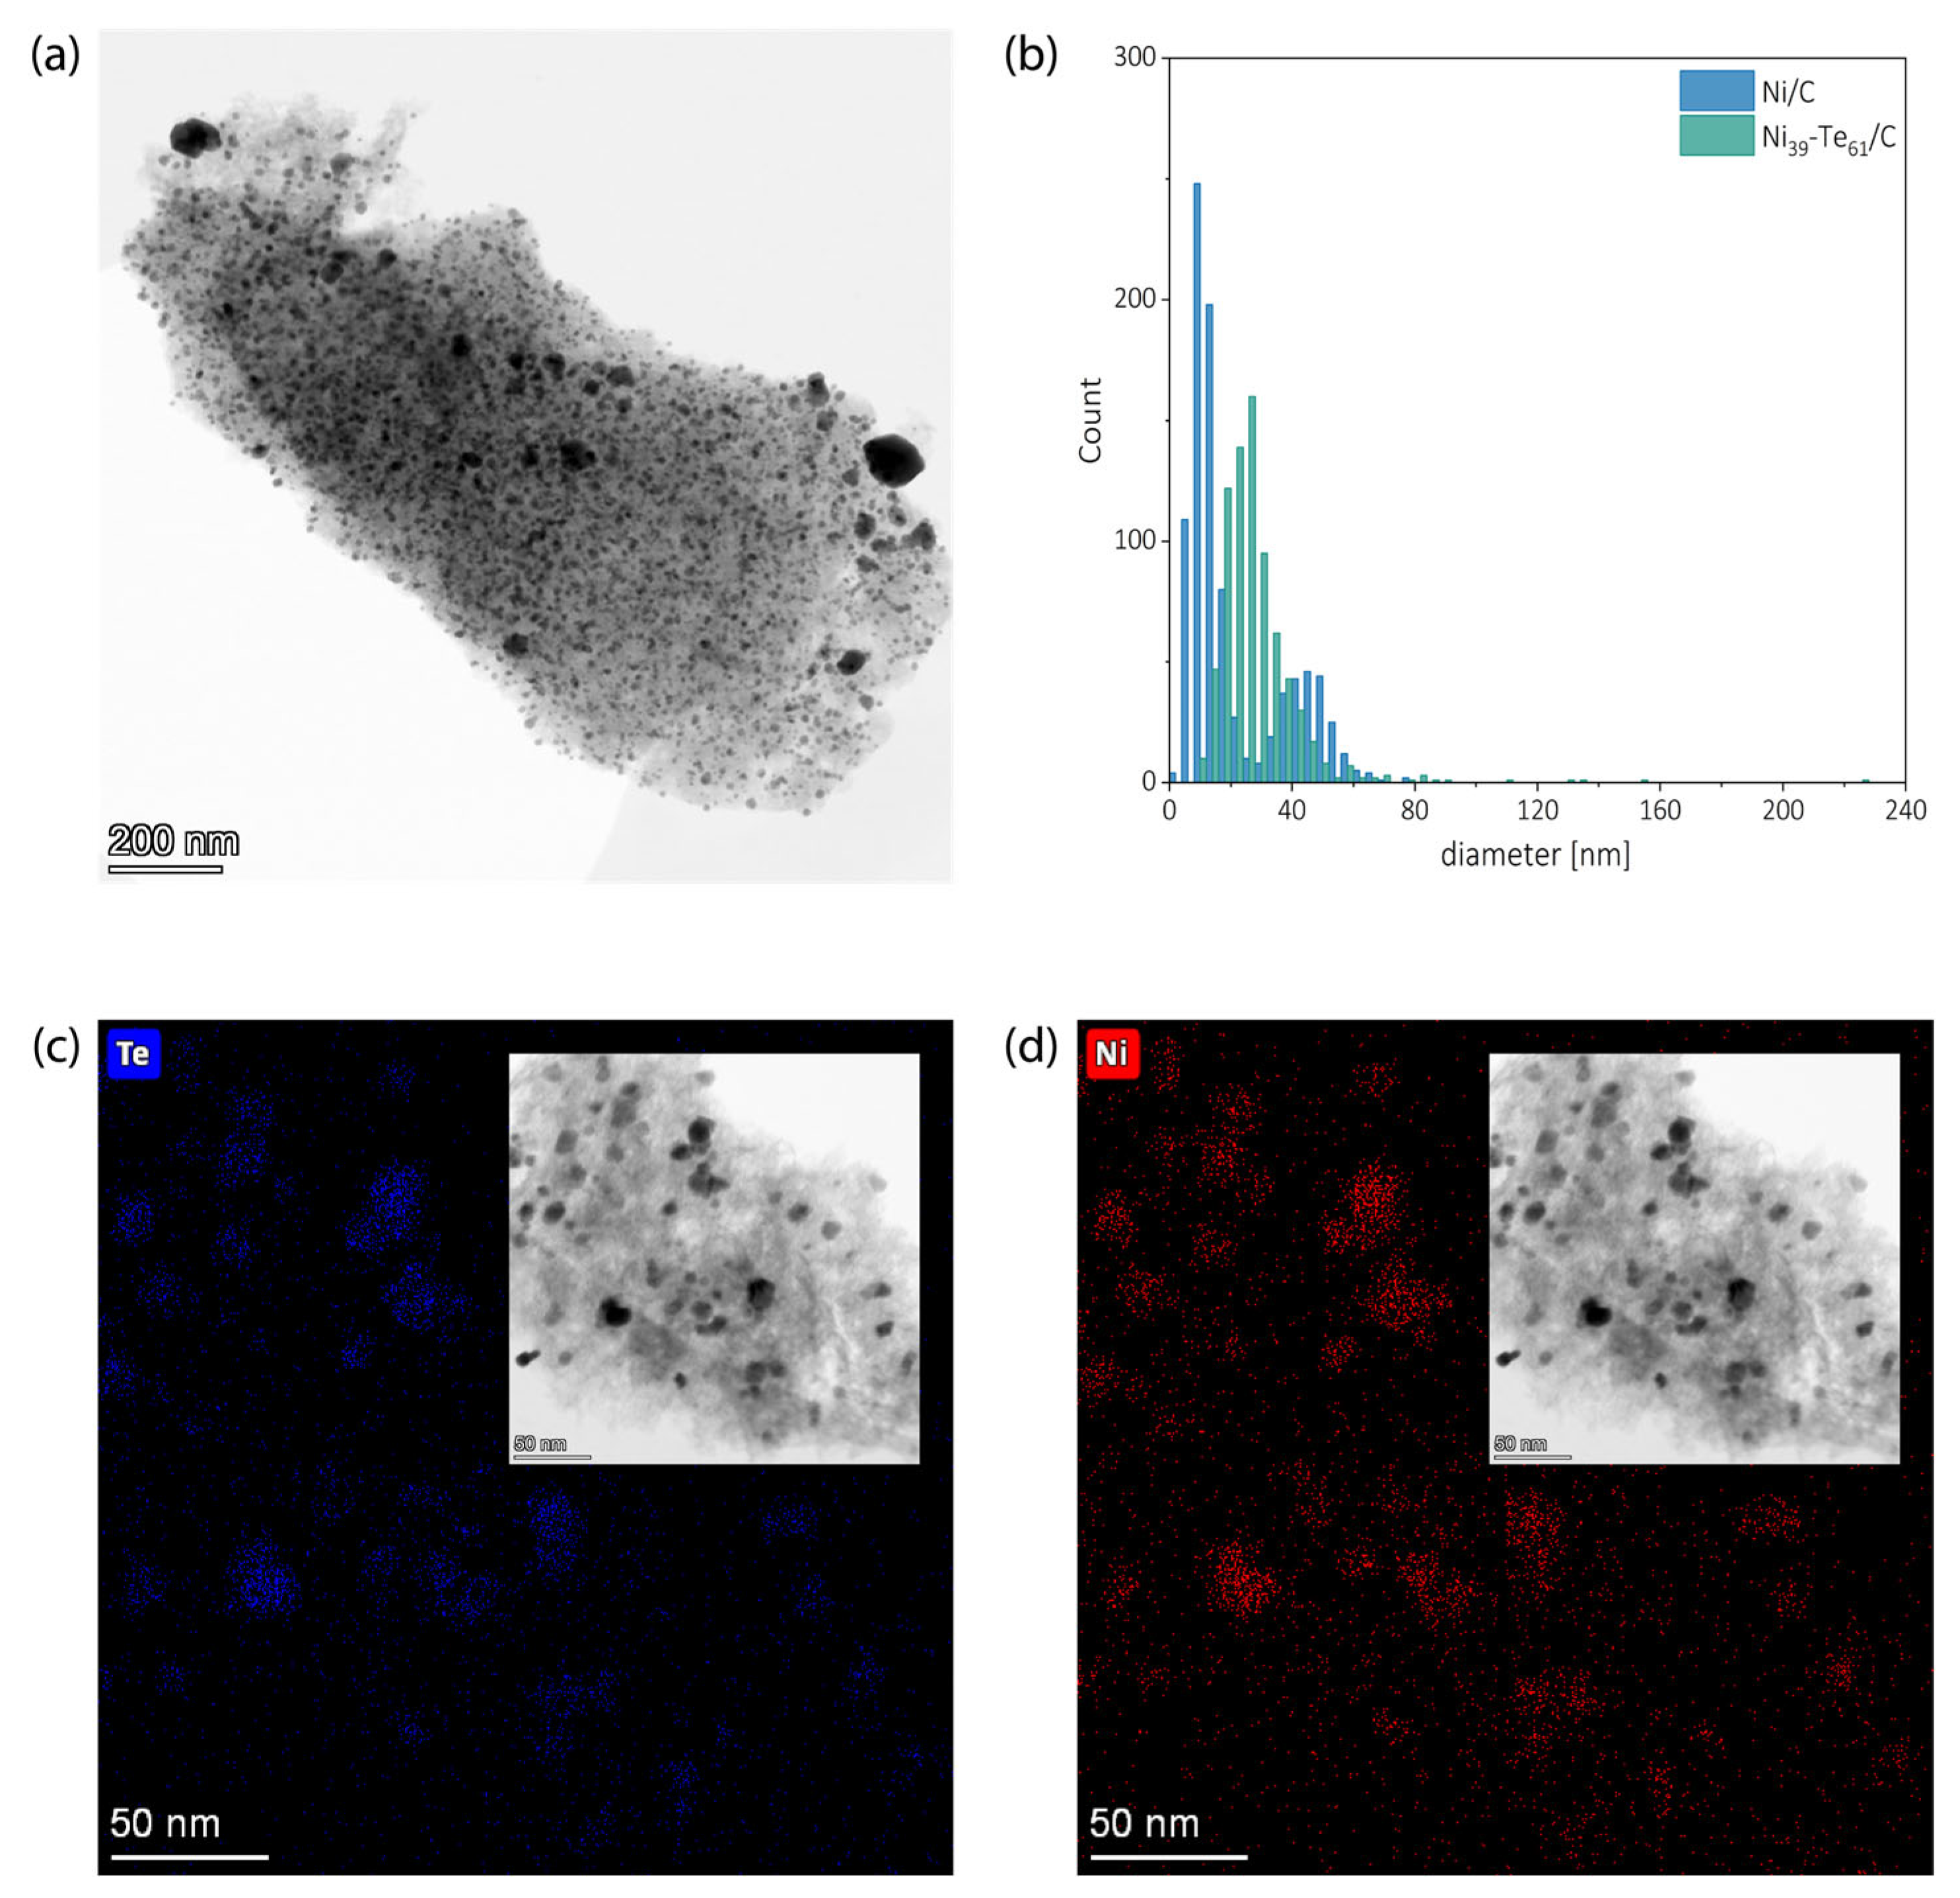
2.3. Transmission Electron Microscopy and Energy Dispersive X Ray Spectroscopy
2.4. Physisorption
2.5. Electrocatalytic ORR Investigations
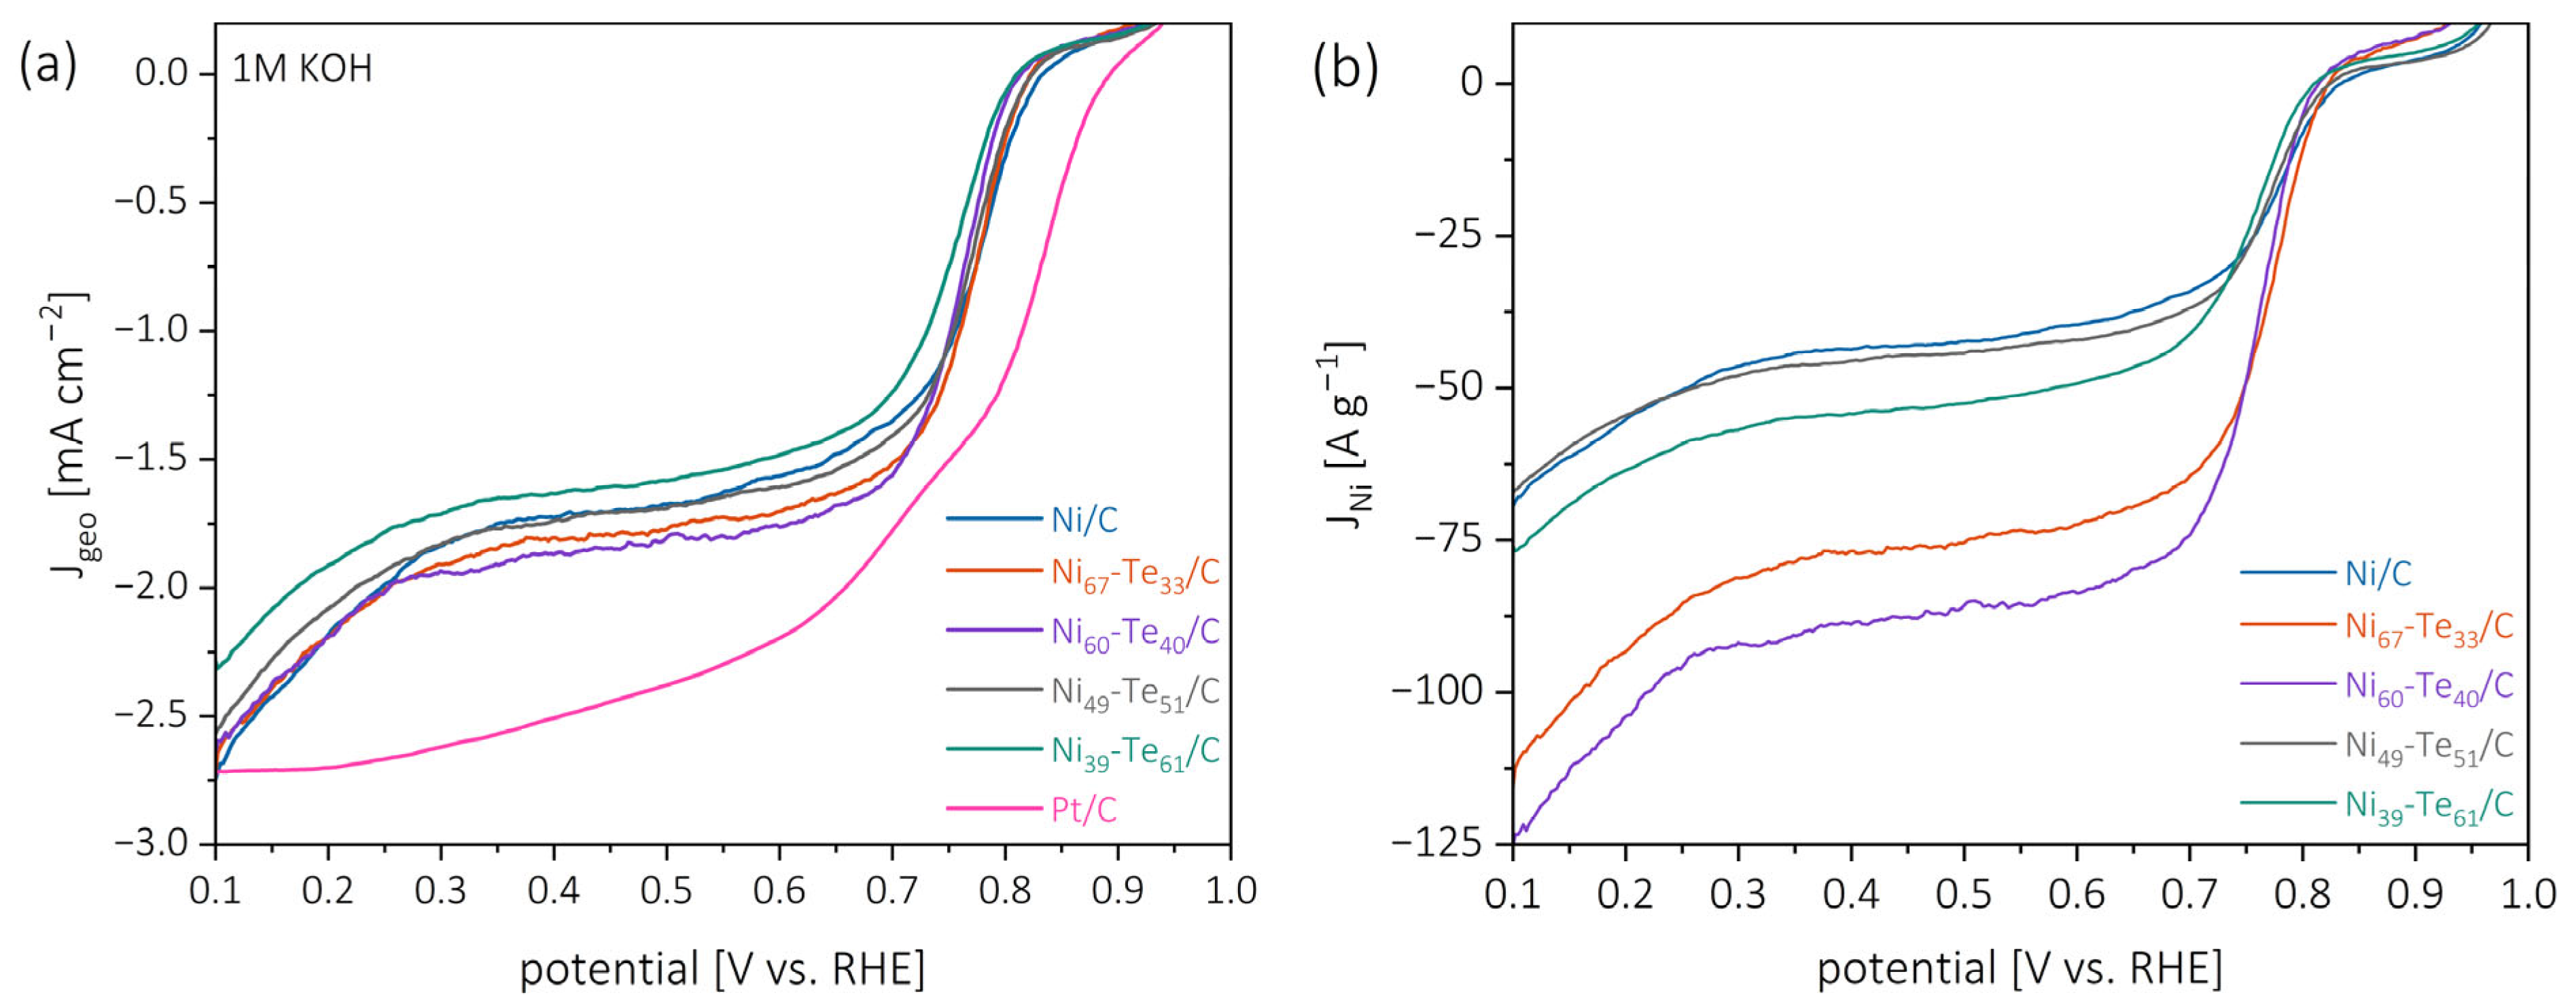
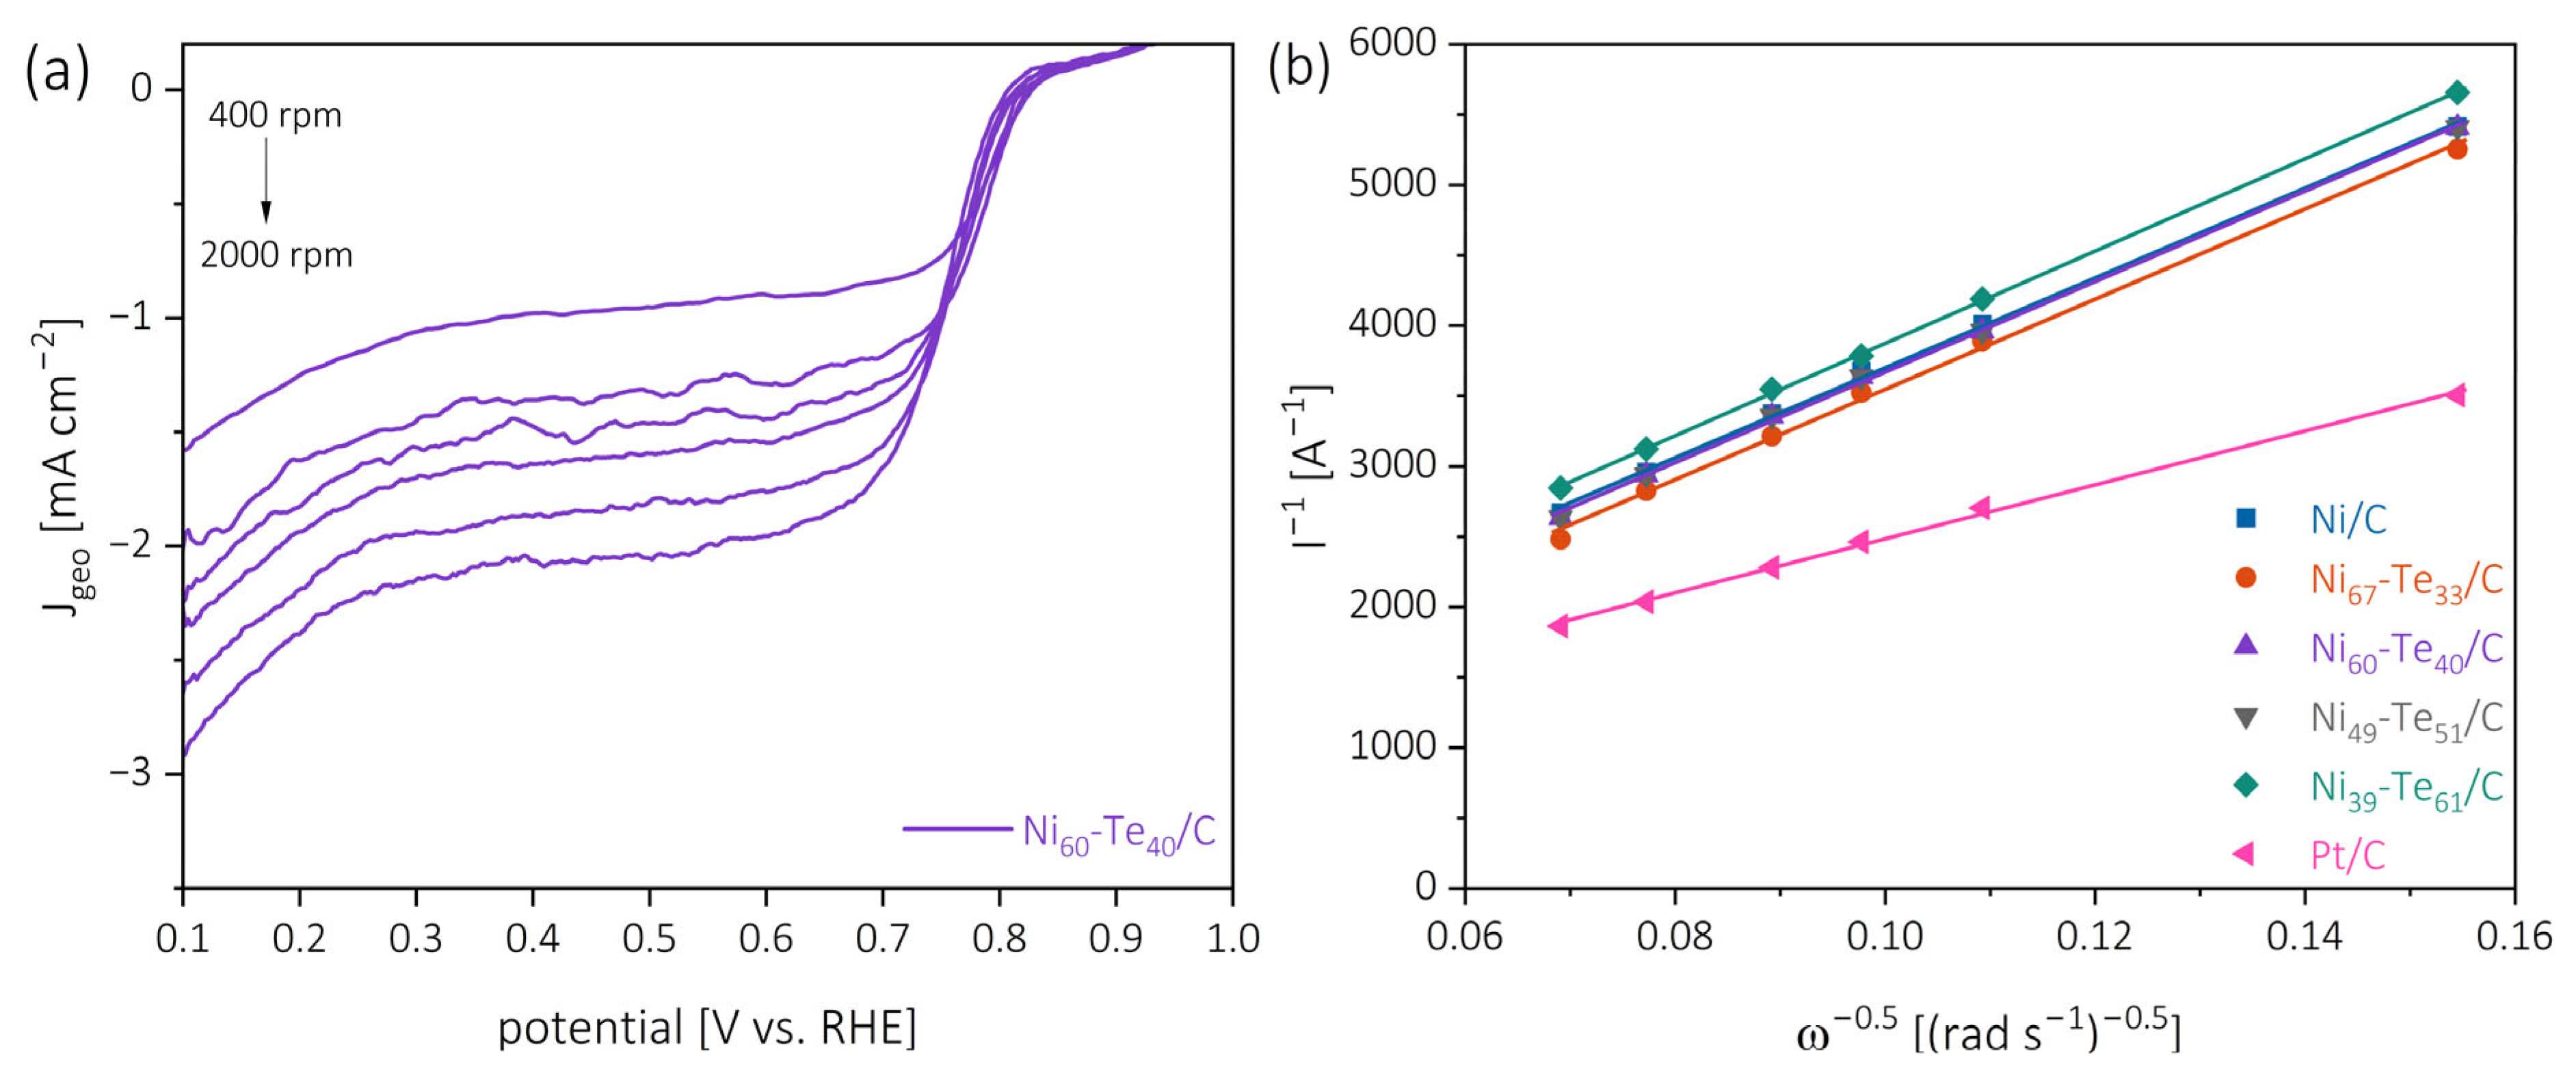
2.5.1. Catalytic Activity
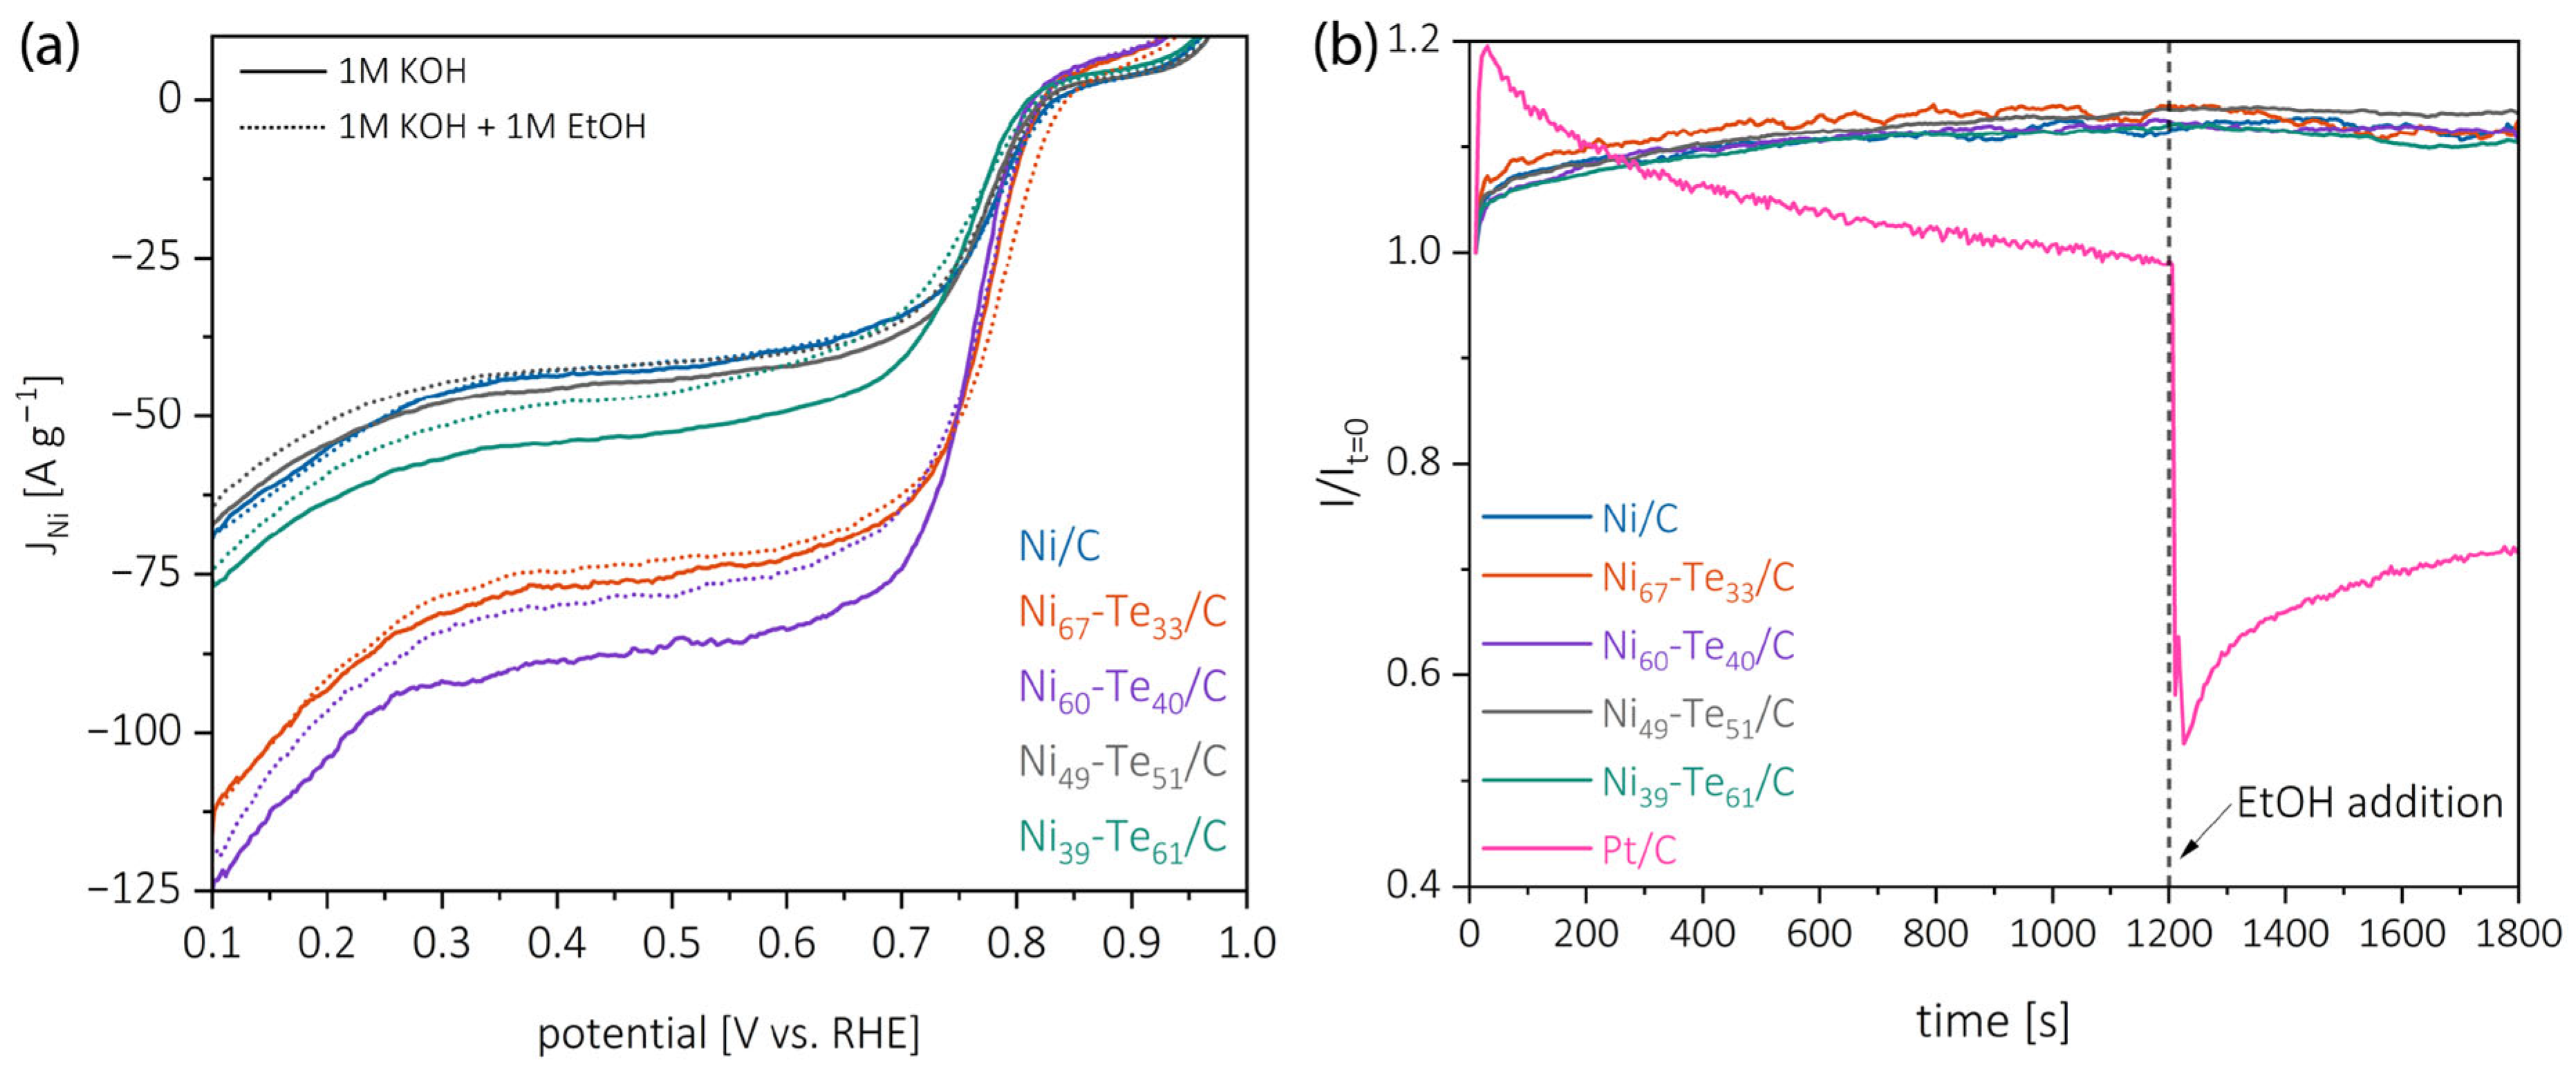
2.5.2. Ethanol Tolerance and Chronoamperometric Stability
3. Experimental
3.1. Chemicals
3.2. Preparation of Ni/C
3.3. Vapour Solid Synthesis of Ni Te/C
3.4. Materials Characterization
3.5. Electrochemical Investigation
4. Conclusions
Supplementary Materials
Author Contributions
Funding
Data Availability Statement
Acknowledgments
Conflicts of Interest
References
- International Energy Agency. World Energy Outlook 2024; International Energy Agency: Paris, France, 2024. [Google Scholar]
- Souza, F.M.; Pinheiro, V.S.; Gentil, T.C.; Lucchetti, L.E.B.; Silva, J.C.M.; Santos, M.L.M.G.; De Oliveira, I.; Dourado, W.M.C.; Amaral-Labat, G.; Okamoto, S.; et al. Alkaline direct liquid fuel cells: Advances, challenges and perspectives. J. Electroanal. Chem. 2022, 922, 116712–116736. [Google Scholar] [CrossRef]
- Badwal, S.P.S.; Giddey, S.; Kulkarni, A.; Goel, J.; Basu, S. Direct ethanol fuel cells for transport and stationary applications—A comprehensive review. Appl. Energy 2015, 145, 80–103. [Google Scholar] [CrossRef]
- Berretti, E.; Osmieri, L.; Baglio, V.; Miller, H.A.; Filippi, J.; Vizza, F.; Santamaria, M.; Specchia, S.; Santoro, C.; Lavacchi, A. Direct Alcohol Fuel Cells: A Comparative Review of Acidic and Alkaline Systems. Electrochem. Energy Rev. 2023, 6, 30. [Google Scholar] [CrossRef]
- Antolini, E.; Gonzalez, E.R. Alkaline direct alcohol fuel cells. J. Power Sources 2010, 195, 3431–3450. [Google Scholar] [CrossRef]
- Kamarudin, M.Z.F.; Kamarudin, S.K.; Masdar, M.S.; Daud, W.R.W. Review: Direct ethanol fuel cells. Int. J. Hydrogen Energy 2013, 38, 9438–9453. [Google Scholar] [CrossRef]
- Akhairi, M.A.F.; Kamarudin, S.K. Catalysts in direct ethanol fuel cell (DEFC): An overview. Int. J. Hydrogen Energy 2016, 41, 4214–4228. [Google Scholar] [CrossRef]
- Vij, V.; Sultan, S.; Harzandi, A.M.; Meena, A.; Tiwari, J.N.; Lee, W.-G.; Yoon, T.; Kim, K.S. Nickel-Based Electrocatalysts for Energy-Related Applications: Oxygen Reduction, Oxygen Evolution, and Hydrogen Evolution Reactions. ACS Catal. 2017, 7, 7196–7225. [Google Scholar] [CrossRef]
- Li, B.; Prakash, J. Oxygen reduction reaction on carbon supported Palladium–Nickel alloys in alkaline media. Electrochem. Commun. 2009, 11, 1162–1165. [Google Scholar] [CrossRef]
- Li, J.; Sun, S. Intermetallic Nanoparticles: Synthetic Control and Their Enhanced Electrocatalysis. Acc. Chem. Res. 2019, 52, 2015–2025. [Google Scholar] [CrossRef]
- Tsai, A.P.; Kameoka, S.; Nozawa, K.; Shimoda, M.; Ishii, Y. Intermetallic: A Pseudoelement for Catalysis. Acc. Chem. Res. 2017, 50, 2879–2885. [Google Scholar] [CrossRef]
- Wibner, P.; Kriegel, R.; Garstenauer, D.; Zobač, O.; Kuběna, I.; Rösch, N.; Seyller, T.; Armbrüster, M.; Richter, K.W. Facile Thermodynamically Controlled Synthesis of Intermetallic Zn1–xPdx/Al2O3 and Its Methanol Steam Reforming Properties. J. Phys. Chem. C 2024, 128, 6906–6916. [Google Scholar] [CrossRef]
- Yin, K.; Li, M.-G.; Chao, Y.-G.; Zhou, Y.; Guo, S.-J.; Liu, F.-Z.; Li, H.-B. Highly electronegative PtAu alloy for simultaneous hydrogen generation and ethanol upgrading. Rare Met. 2023, 42, 2949–2956. [Google Scholar] [CrossRef]
- Kong, Z.; Wu, J.; Liu, Z.; Yan, D.; Wu, Z.P.; Zhong, C.J. Advanced electrocatalysts for fuel cells: Evolution of active sites and synergistic properties of catalysts and carrier materials. Exploration 2025, 5, 20230052. [Google Scholar] [CrossRef] [PubMed]
- Williams, B.P.; Qi, Z.; Huang, W.; Tsung, C.K. The impact of synthetic method on the catalytic application of intermetallic nanoparticles. Nanoscale 2020, 12, 18545–18562. [Google Scholar] [CrossRef] [PubMed]
- Garstenauer, D.; Guggenberger, P.; Zobac, O.; Jirsa, F.; Richter, K.W. Active site engineering of intermetallic nanoparticles by the vapour-solid synthesis: Carbon black supported nickel tellurides for hydrogen evolution. Nanoscale 2024, 16, 20168–20181. [Google Scholar] [CrossRef]
- Predel, B. Ni-Te (Nickel-Tellurium); Landolt-Börnstein—Group IV Physical Chemistry; Springer: Cham, Switzerland, 1998; Volume 51, pp. 1–4. [Google Scholar] [CrossRef]
- Juhás, P.; Louwen, J.N.; van Eijck, L.; Vogt, E.T.C.; Billinge, S.J.L. PDFgetN3: Atomic pair distribution functions from neutron powder diffraction data using ad hoc corrections. J. Appl. Crystallogr. 2018, 51, 1492–1497. [Google Scholar] [CrossRef]
- Barstard, J.; Gronvold, F.; Rost, E.; Vestersjo, E. On the Tellurides of Nickel. Acta Chem. Scand. 1966, 20, 2865–2879. [Google Scholar] [CrossRef]
- Klepp, K.O.; Komarek, K.L. Das System Nickel-Tellur. Monatshefte Chem. 1972, 103, 934–946. [Google Scholar] [CrossRef]
- Boulet-Roblin, L.; Sheptyakov, D.; Borel, P.; Tessier, C.; Novák, P.; Villevieille, C. Crystal structure evolution via operando neutron diffraction during long-term cycling of a customized 5 V full Li-ion cylindrical cell LiNi0.5Mn1.5O4 vs. graphite. J. Mater. Chem. A 2017, 5, 25574–25582. [Google Scholar] [CrossRef]
- Dang, W.; Tang, X.; Wang, W.; Yang, Y.; Li, X.; Huang, L.; Zhang, Y. Micro-nano NiO-MnCo2O4 heterostructure with optimal interfacial electronic environment for high performance and enhanced lithium storage kinetics. Dalton Trans. 2020, 49, 10994–11004. [Google Scholar] [CrossRef]
- Gulay, L.D.; Olekseyuk, I.D. Crystal structures of the compounds Ni3Te2, Ni3−δTe2 (δ = 0.12) and Ni1.29Te. J. Alloys Compd. 2004, 376, 131–138. [Google Scholar] [CrossRef]
- Jandl, I.; Ipser, H.; Richter, K.W. Thermodynamic modelling of the general NiAs-type structure: A study of first principle energies of formation for binary Ni-containing B8 compounds. Calphad 2015, 50, 174–181. [Google Scholar] [CrossRef]
- Gor, G.Y.; Thommes, M.; Cychosz, K.A.; Neimark, A.V. Quenched solid density functional theory method for characterization of mesoporous carbons by nitrogen adsorption. Carbon 2012, 50, 1583–1590. [Google Scholar] [CrossRef]
- Sing, K.S.W.; Everett, D.H.; Haul, R.A.W.; Mouscou, L.; Pierotti, R.A.; Rouquerol, J.; Siemieniewska, T. Reporting physisorption data for gas/solid systems with special reference to the determination of surface area and porosity. Pure Appl. Chem. 1985, 57, 603–619. [Google Scholar] [CrossRef]
- Thommes, M.; Lu, G.Q.; Zhao, X.S. Physical Adsorption Characterization of Ordered and Amorphous Mesoporous Materials. In Nanoporous Materials: Science and Engineering; Imperial College Press: London, UK, 2004; pp. 317–364. [Google Scholar] [CrossRef]
- Schlumberger, C.; Thommes, M. Characterization of Hierarchically Ordered Porous Materials by Physisorption and Mercury Porosimetry—A Tutorial Review. Adv. Mater. Interfaces 2021, 8, 2002181–2002196. [Google Scholar] [CrossRef]
- Wolf, S.; Roschger, M.; Genorio, B.; Garstenauer, D.; Radic, J.; Hacker, V. Ce-modified Co-Mn oxide spinel on reduced graphene oxide and carbon black as ethanol tolerant oxygen reduction electrocatalyst in alkaline media. RSC Adv. 2022, 12, 35966–35976. [Google Scholar] [CrossRef] [PubMed]
- Li, S.; Shi, L.; Guo, Y.; Wang, J.; Liu, D.; Zhao, S. Selective oxygen reduction reaction: Mechanism understanding, catalyst design and practical application. Chem. Sci. 2024, 15, 11188–11228. [Google Scholar] [CrossRef]
- Qiao, J.; Xu, L.; Ding, L.; Shi, P.; Zhang, L.; Baker, R.; Zhang, J. Effect of KOH Concentration on the Oxygen Reduction Kinetics Catalyzed by Heat-Treated Co-Pyridine/C Electrocatalysts. Int. J. Electrochem. Sci. 2013, 8, 1189–1208. [Google Scholar] [CrossRef]
- Wolf, S.; Roschger, M.; Genorio, B.; Garstenauer, D.; Hacker, V. Mixed Transition-Metal Oxides on Reduced Graphene Oxide as a Selective Catalyst for Alkaline Oxygen Reduction. ACS Omega 2023, 8, 11536–11543. [Google Scholar] [CrossRef]
- Hall, D.S.; Bock, C.; MacDougall, B.R. The Electrochemistry of Metallic Nickel: Oxides, Hydroxides, Hydrides and Alkaline Hydrogen Evolution. J. Electrochem. Soc. 2013, 160, F235. [Google Scholar] [CrossRef]
- Centeno, T.A.; Stoeckli, F. The assessment of surface areas in porous carbons by two model-independent techniques, the DR equation and DFT. Carbon 2010, 48, 2478–2486. [Google Scholar] [CrossRef]
- Kwiatkowski, M.; Broniek, E. An Evaluation of the Reliability of the Results Obtained by the LBET, QSDFT, BET, and DR Methods for the Analysis of the Porous Structure of Activated Carbons. Materials 2020, 13, 3929. [Google Scholar] [CrossRef] [PubMed]


| Name | Formula | Structure Type | Space Group | Homogeneity Range [17] [at% Te] | Lattice Parameters [nm] | Reference |
|---|---|---|---|---|---|---|
| (Ni) | Ni | Cu | Fm-3m | - | a = 3.5181 | P. Juhás et al. [18] |
| β2 | Ni3+xTe2 | own type | P121/m1 | 41–42 | a = 0.3376 b = 0.3800 c = 0.6100 β = 91.25° | J. Barstard et al. [19] |
| γ1 | NiTe0.775 | own type | Pmc21 | - | a = 0.3916 b = 0.6860 c = 1.232 | K. Klepp et al. [20] |
| δ | NiTe2−x | NiAs | P63/mmc | 51–67 | a = 0.3956 c = 0.5370 | J. Barstard et al. [19] |
| Sample | ωTXRF (Ni) [wt%] | ωtarget (Ni) [wt%] | ωTXRF (Te) [wt%] | ωtarget (Te) [wt%] |
|---|---|---|---|---|
| Ni/C | 16.2 | - | - | - |
| Ni67-Te33/C | 9.6 | 6.7 | 9.4 | 7.2 |
| Ni60-Te40/C | 8.6 | 6.5 | 10.6 | 9.5 |
| Ni49-Te51/C | 15.6 | 11.8 | 28.7 | 26.9 |
| Ni39-Te61/C | 12.3 | 10.5 | 39.8 | 35.0 |
| Sample | Phase | Lattice Parameters [Å] | LVol-FWHM [nm] |
|---|---|---|---|
| Ni/C | Ni NiO | a = 3.529(9) a = 4.177(0) | 27.(9) 1.(2) |
| Ni67-Te33/C | Ni NiO NiTe2−x Ni3Te2 | a = 3.531(3) a = 4.177(0) a = 3.977(4), c = 5.368(2) a = 7.592(2), b = 3.777(1), c = 6.142(5) | 54.(8) 1.(3) 36.(1) 26.(2) |
| Ni60-Te40/C | Ni NiO NiTe2−x Ni3Te2 | a = 3.530(5) a = 4.177(0) a = 3.948(8)–3.975(5), c = 5.369(2)–5.371(2) a = 7.586(3), b = 3.770(3), c = 6.136(3) | 47.(2) 1.(2) * 22.(9) |
| Ni49-Te51/C | NiO NiTe2−x | a = 4.177(0) a = 3.902(7)–3.953(0), c = 5.356(1)–5.369(6) | 1.(3) * |
| Ni39-Te61/C | NiO NiTe2−x | a = 4.177(0) a = 3.889(7), c = 5.340(1) | 1.(2) 89.(0) |
| Sample | SBET [m2 g−1] | SDFT [m2 g−1] | Vtot [cm3 g−1] | wpore [nm] |
|---|---|---|---|---|
| Pt/C | 1198 | 992 | 0.84 | 3.32 |
| Ni/C | 662 | 622 | 0.60 | 3.25 |
| Ni67-Te33/C | 788 | 746 | 0.72 | 3.39 |
| Ni60-Te40/C | 779 | 749 | 0.70 | 3.32 |
| Ni49-Te51/C | 411 | 380 | 0.38 | 3.17 |
| Ni39-Te61/C | 415 | 384 | 0.37 | 3.25 |
| Catalyst | EOS [V vs. RHE] | E1/2 [V vs. RHE] | jD [mA cm−2] | jNi [A g−1] | n [] |
|---|---|---|---|---|---|
| Pt/C | 0.89 | 0.79 | −2.51 | - | 3.85 |
| Ni/C | 0.86 | 0.77 | −1.72 | −43.6 | 2.31 |
| Ni67-Te33/C | 0.84 | 0.76 | −1.81 | −76.8 | 2.30 |
| Ni60-Te40/C | 0.84 | 0.75 | −1.86 | −88.5 | 2.30 |
| Ni49-Te51/C | 0.85 | 0.76 | −1.74 | −45.4 | 2.30 |
| Ni39-Te61/C | 0.86 | 0.74 | −1.63 | −54.2 | 2.25 |
Disclaimer/Publisher’s Note: The statements, opinions and data contained in all publications are solely those of the individual author(s) and contributor(s) and not of MDPI and/or the editor(s). MDPI and/or the editor(s) disclaim responsibility for any injury to people or property resulting from any ideas, methods, instructions or products referred to in the content. |
© 2025 by the authors. Licensee MDPI, Basel, Switzerland. This article is an open access article distributed under the terms and conditions of the Creative Commons Attribution (CC BY) license (https://creativecommons.org/licenses/by/4.0/).
Share and Cite
Garstenauer, D.; Zobač, O.; Jirsa, F.; Kleitz, F.; Richter, K.W. Enhanced Oxygen Reduction with Ethanol Tolerant Ni-Te Nanoparticles on Carbon Support Through Vapour-Solid Preparation. Catalysts 2025, 15, 368. https://doi.org/10.3390/catal15040368
Garstenauer D, Zobač O, Jirsa F, Kleitz F, Richter KW. Enhanced Oxygen Reduction with Ethanol Tolerant Ni-Te Nanoparticles on Carbon Support Through Vapour-Solid Preparation. Catalysts. 2025; 15(4):368. https://doi.org/10.3390/catal15040368
Chicago/Turabian StyleGarstenauer, Daniel, Ondřej Zobač, Franz Jirsa, Freddy Kleitz, and Klaus W. Richter. 2025. "Enhanced Oxygen Reduction with Ethanol Tolerant Ni-Te Nanoparticles on Carbon Support Through Vapour-Solid Preparation" Catalysts 15, no. 4: 368. https://doi.org/10.3390/catal15040368
APA StyleGarstenauer, D., Zobač, O., Jirsa, F., Kleitz, F., & Richter, K. W. (2025). Enhanced Oxygen Reduction with Ethanol Tolerant Ni-Te Nanoparticles on Carbon Support Through Vapour-Solid Preparation. Catalysts, 15(4), 368. https://doi.org/10.3390/catal15040368