Article

Improving the Catalytic Selectivity of Reverse Water–Gas Shift Reaction Catalyzed by Ru/CeO2 Through the Addition of Yttrium Oxide

by
Alfredo Solís-García
,
Karina Portillo-Cortez
,
David Domínguez
,
Sergio Fuentes-Moyado
,
Jorge N. Díaz de León
,
Trino A. Zepeda
and
Uriel Caudillo-Flores
*
Centro de Nanociencias y Nanotecnología, Universidad Nacional Autónoma de México, Ensenada 22800, BC, Mexico
*
Author to whom correspondence should be addressed.
Catalysts 2025, 15(4), 301; https://doi.org/10.3390/catal15040301
Submission received: 22 February 2025 / Revised: 19 March 2025 / Accepted: 20 March 2025 / Published: 23 March 2025
(This article belongs to the Special Issue Design and Synthesis of Nanostructured Catalysts, 2nd Edition)

Abstract

:
This study reports the synthesis, characterization, and catalytic performance of a series of catalysts of Ru supported on CeO2-Y2O3 composites (Ru/CeYX; X = 0, 33, 66, and 100 wt.% Y2O3) for CO2 hydrogenation. Supported material modification (Y2O3-CeO2), by the Y2O3 incorporation, allowed a change in selectivity from methane to RWGS of the CO2 hydrogenation reaction. This change in selectivity is correlated with the variation in the physicochemical properties caused by Y2O3 addition. X-ray diffraction (XRD) analysis confirmed the formation of crystalline fluorite-phase CeO2 and α-Y2O3. High-resolution transmission electron microscopy (HR-TEM) and energy-dispersive X-ray spectroscopy (EDS) elemental mapping revealed the formation of a homogeneous CeO2-Y2O3 nanocomposite. As the Y2O3 content increased, the specific surface area, measured by BET, showed a decreasing trend from 106.3 to 51.7 m2 g−1. X-ray photoelectron spectroscopy (XPS) of Ce3d indicated a similar Ce3+/Ce4+ ratio across all CeO2-containing materials, while the O1s spectra showed a reduction in oxygen vacancies with increasing Y2O3 content, which is attributed to the decreased surface area upon composite formation. Catalytically, the addition of Y2O3 influenced both conversion and selectivity. CO2 conversion decreased with increasing Y2O3 content, with the lowest conversion observed for Ru/CeY100. Regarding selectivity, methane was the dominant product for Ru/CeY0 (pure CeO2), while CO was the main product for Ru/CeY33, Ru/CeY66, and Ru/CeY100, indicating a shift towards the reverse water–gas shift (RWGS) reaction. The highest RWGS reaction rate was observed with the Ru/CeY33 catalyst under all tested conditions. The observed differences in conversion and selectivity are attributed to a reduction in active sites due to the decrease in surface area and oxygen vacancies, both of which are important for CO2 adsorption. In order to verify the surface species catalytically active for RWGS, the samples were characterized by FTIR spectroscopy under reaction conditions.

Graphical Abstract

1. Introduction

The elevated atmospheric CO2 concentration, resulting from the extensive use of fossil fuels, has contributed to global warming and climate change [1]. As a result, identifying strategies to reduce atmospheric CO2 levels has become imperative. Three primary approaches have been investigated to address this challenge [2]: (a) reducing CO2 emissions through improved combustion processes, (b) capture and storage, (c) its transformation into valuable products. The latter approach offers significant potential for developing CO2 valorization technologies, as it not only reduces emissions but also produces valuable products. However, the thermodynamic stability of CO2 presents challenges to its activation and utilization [3]. Nonetheless, catalytic CO2 hydrogenation reactions have been shown to yield various products under mild temperature and pressure conditions when supported metal catalysts such as Ni, Pt, Pd, Rh, and Ru are employed [4,5]. Among these reactions, the reverse water–gas shift reaction (RWGS, CO2 + H2 = CO + H2O, ΔH 298 K = 42.1 kJ mol−1) is particularly notable, as it allows for producing carbon monoxide and water even under atmospheric pressure. This CO can serve as a feedstock for the synthesis of various chemicals and fuels via Fischer–Tropsch (FT) synthesis [6,7].
In general, supported non-noble metals such as Cu, Fe, and Ni are commonly used to catalyze the RWGS reaction due to their low cost and higher selectivity to CO. However, these materials often face stability issues due to metal sintering, leading to a decrease in catalytic activity [8,9,10]. In contrast, noble metal catalysts (e.g., Pt, Pd, Ru) offer several advantages, including the ability to catalyze the RWGS reaction at lower temperatures, superior dispersion, and enhanced stability [4,11]. However, their higher cost limits their use at large scales. Therefore, optimizing these noble-metal-based catalysts with low metal loadings while maintaining high catalytic activity is crucial to fully exploit the benefits of these materials in industrial applications.
A suitable metal catalyst for the reverse water–gas shift (RWGS) reaction must exhibit two key properties: (i) the ability to adsorb CO2 and break one of its C=O bonds; (ii) the capability to dissociate H2 and hydrogenate the oxygen atom to produce H2O [10,12]. While platinum and palladium effectively activate molecular hydrogen [13,14], their limited ability to adsorb and activate CO2 [15,16,17] may limit their catalytic performance in the RWGS reaction. In contrast, other noble metals, such as ruthenium (Ru), can cause hydrogen dissociation and dissociative activation of CO2 [18,19,20]; also, their cost is lower than Pd and Pt [21]. However, the CO produced through CO2 dissociation tends to adsorb strongly on the ruthenium surface (compared with Pt-CO and Pd-CO) [22,23], which may be hydrogenated to form methane, thereby diminishing the desired CO production. Nevertheless, the strength of the bond between the adsorbed molecules in metals in supported metal catalysts can be tuned by modifying their metal-support interaction (MSI) [24,25,26]. Some factors that affect the MSI are as follows: (i) the size and morphology of the supported metal; (ii) the thermal treatments (such as oxidation and reduction); (iii) the properties of the support (composition, morphology, surface modification) [27,28]. Therefore, the selection of the metal oxide(s) used as support is primordial for the catalysis.
Cerium oxide (CeO2) has gained widespread use as a catalyst support due to its strong metal-support interactions and the presence of oxygen vacancies on its surface, which help prevent metal sintering, thereby enhancing both stability and catalytic activity [29,30,31,32,33]. Furthermore, the redox properties of CeO2—specifically the reversible switching between Ce+4 and Ce+3 under reducing conditions—are closely linked to the creation of oxygen vacancies, making CeO2 an attractive support material for catalysts focused on CO2 reduction reactions [34,35]. However, in the catalysis of CO2 hydrogenation, CeO2-supported Ru favors preferentially the CH4 formation via CO2 methanation (CO2 + 4H2 → CH4 + 2H2O, ΔH298K = −165 kJ mol−1) [36,37] instead of carbon monoxide, given that carbonyl species, formed after CO2 dissociation, can be hydrogenated to CH4 given the affinity to Ru sites. However, as mentioned above, this affinity could be modulated by modifying the support.
Some studies have shown that yttria (Y2O3) incorporation into metal oxide supports can reduce the CO adsorption capacity of the supported metal nanoparticles [38,39], and in certain cases, this effect is even suppressed when Y2O3 is used in its pure form [40,41,42]. In this context, the present study focuses on the synthesis of CeO2-Y2O3 mixed oxides to support Ru-based powder catalysts, with the objective of investigating the influence of yttria content on the catalytic performance of these materials in the reverse water–gas shift reaction. A catalytic activity test reveals that the Y2O3 incorporation to CeO2-supported Ru changes the selectivity reaction to obtain CO as the main product of the reaction (RWGS). This, in association with a reduction of the oxygen vacancies caused by Y2O3, supported the FTIR in situ catalytic test results.

2. Results and Discussion

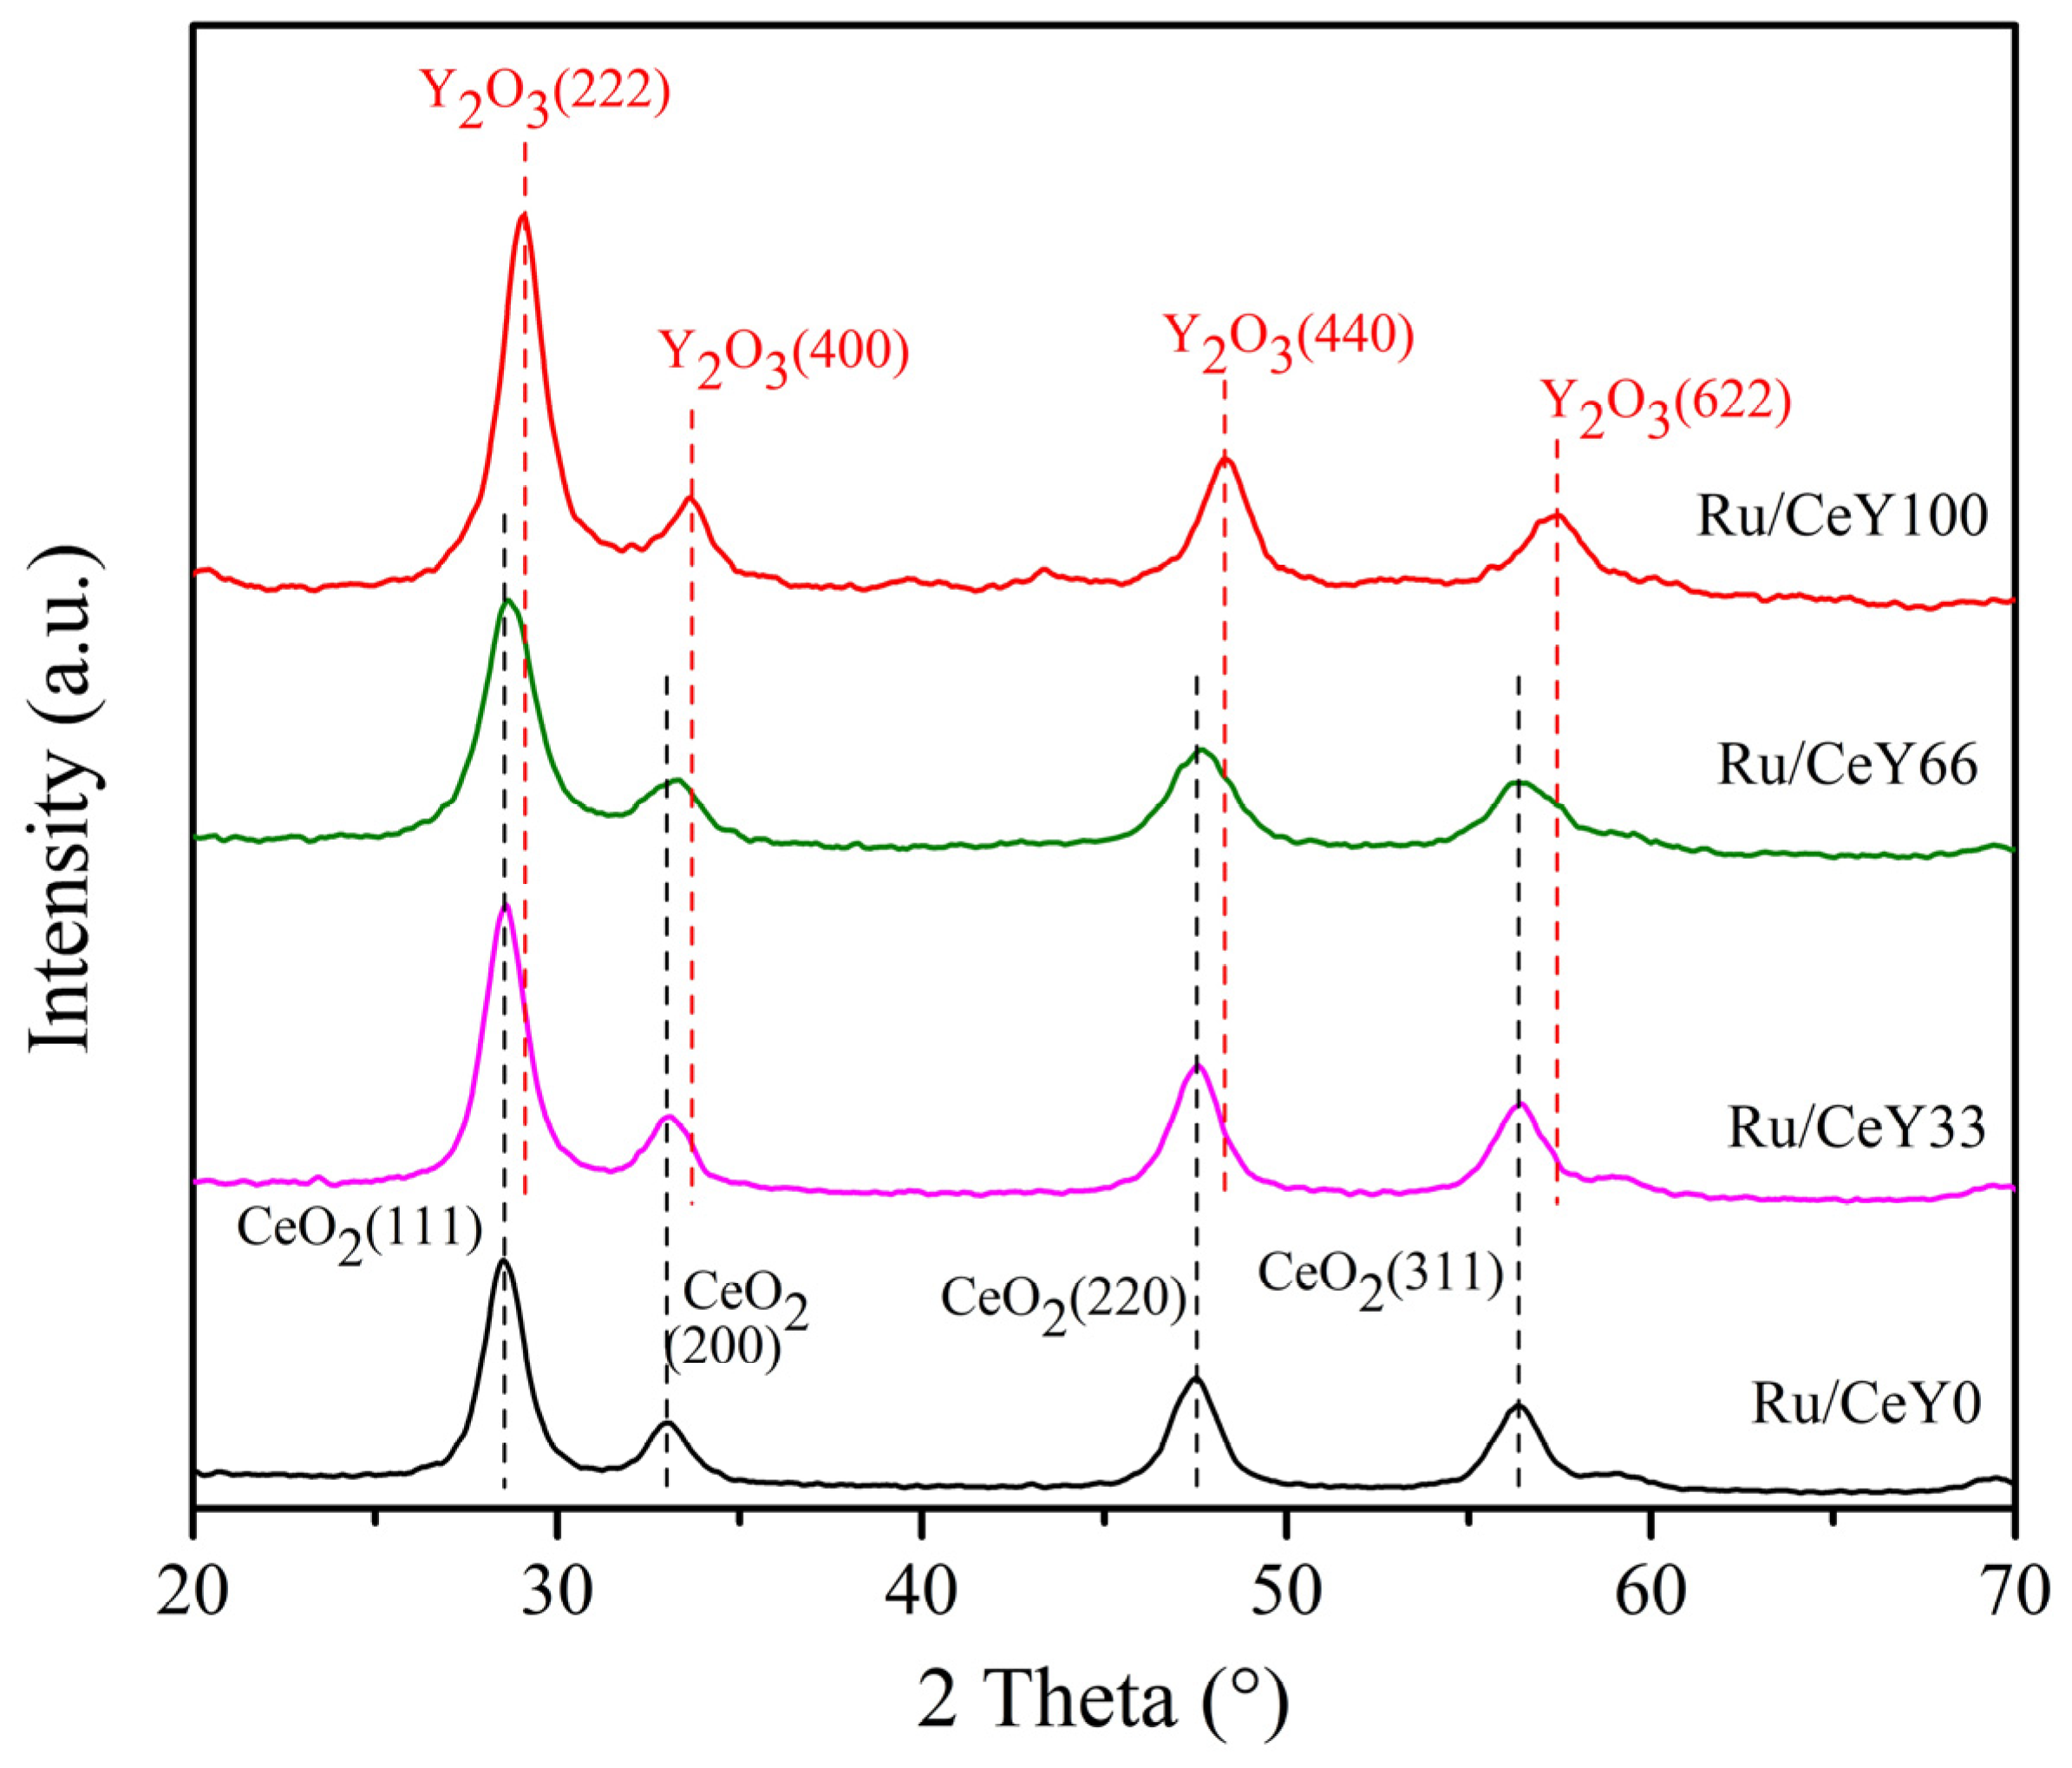
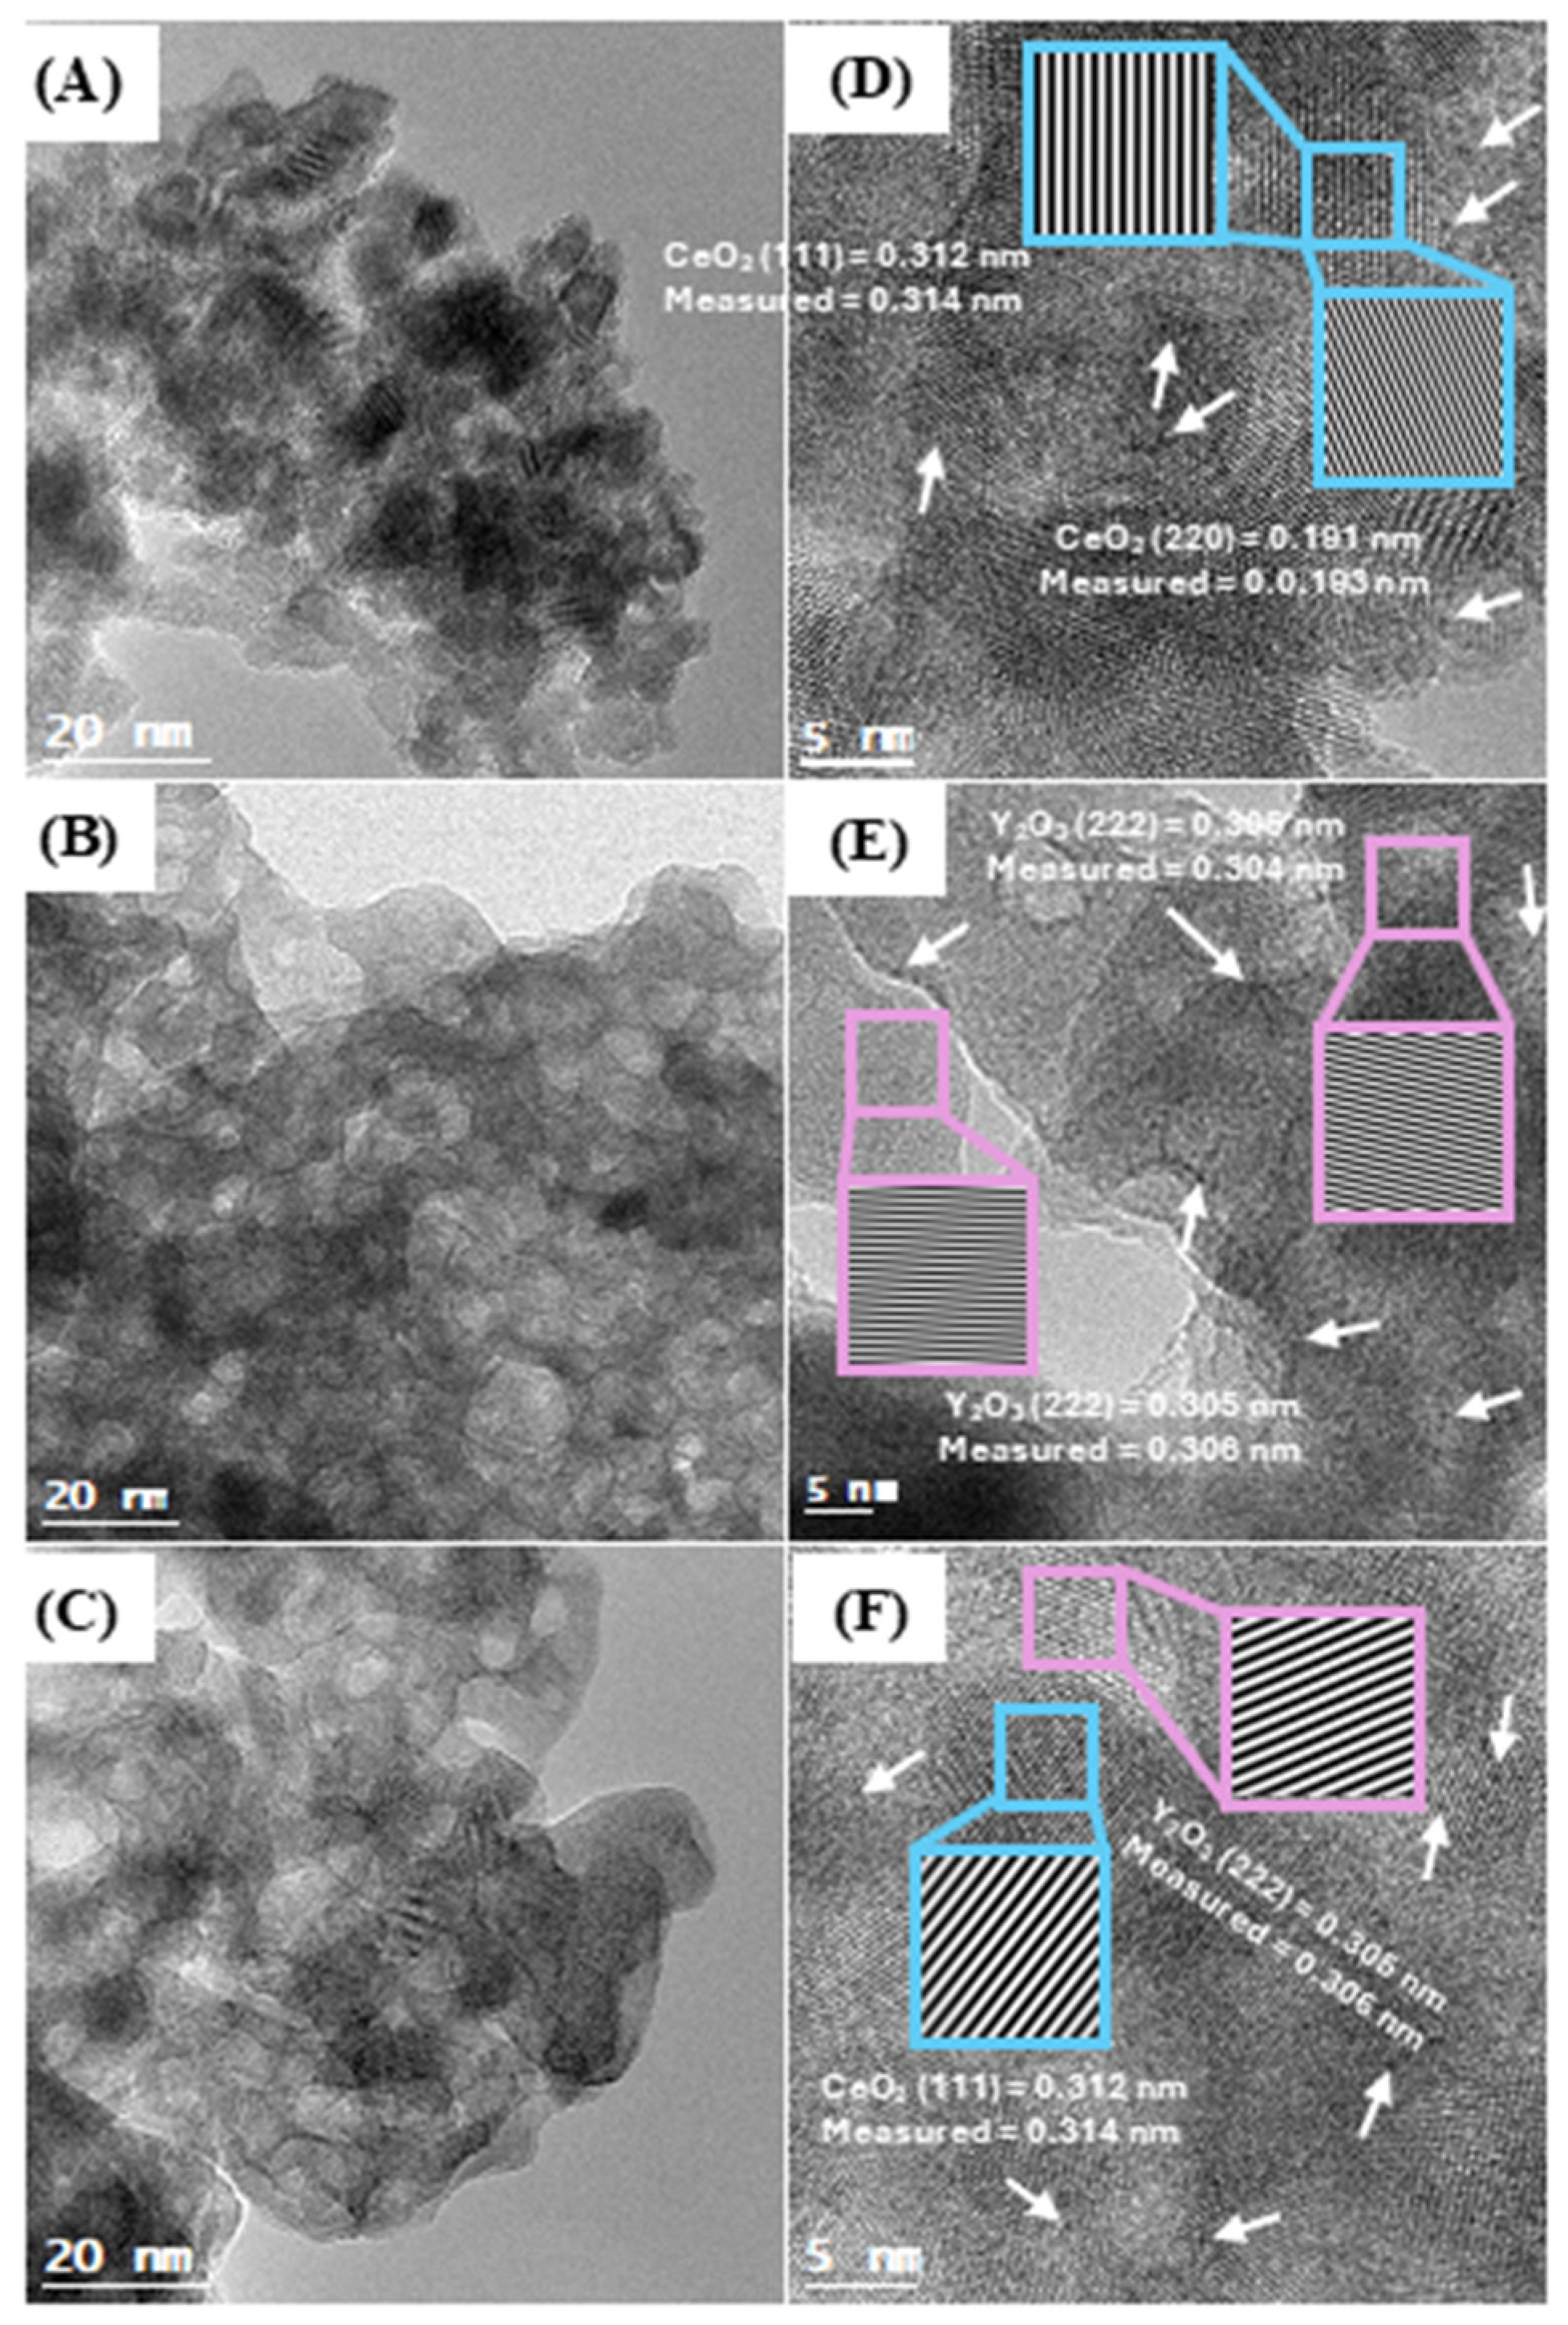
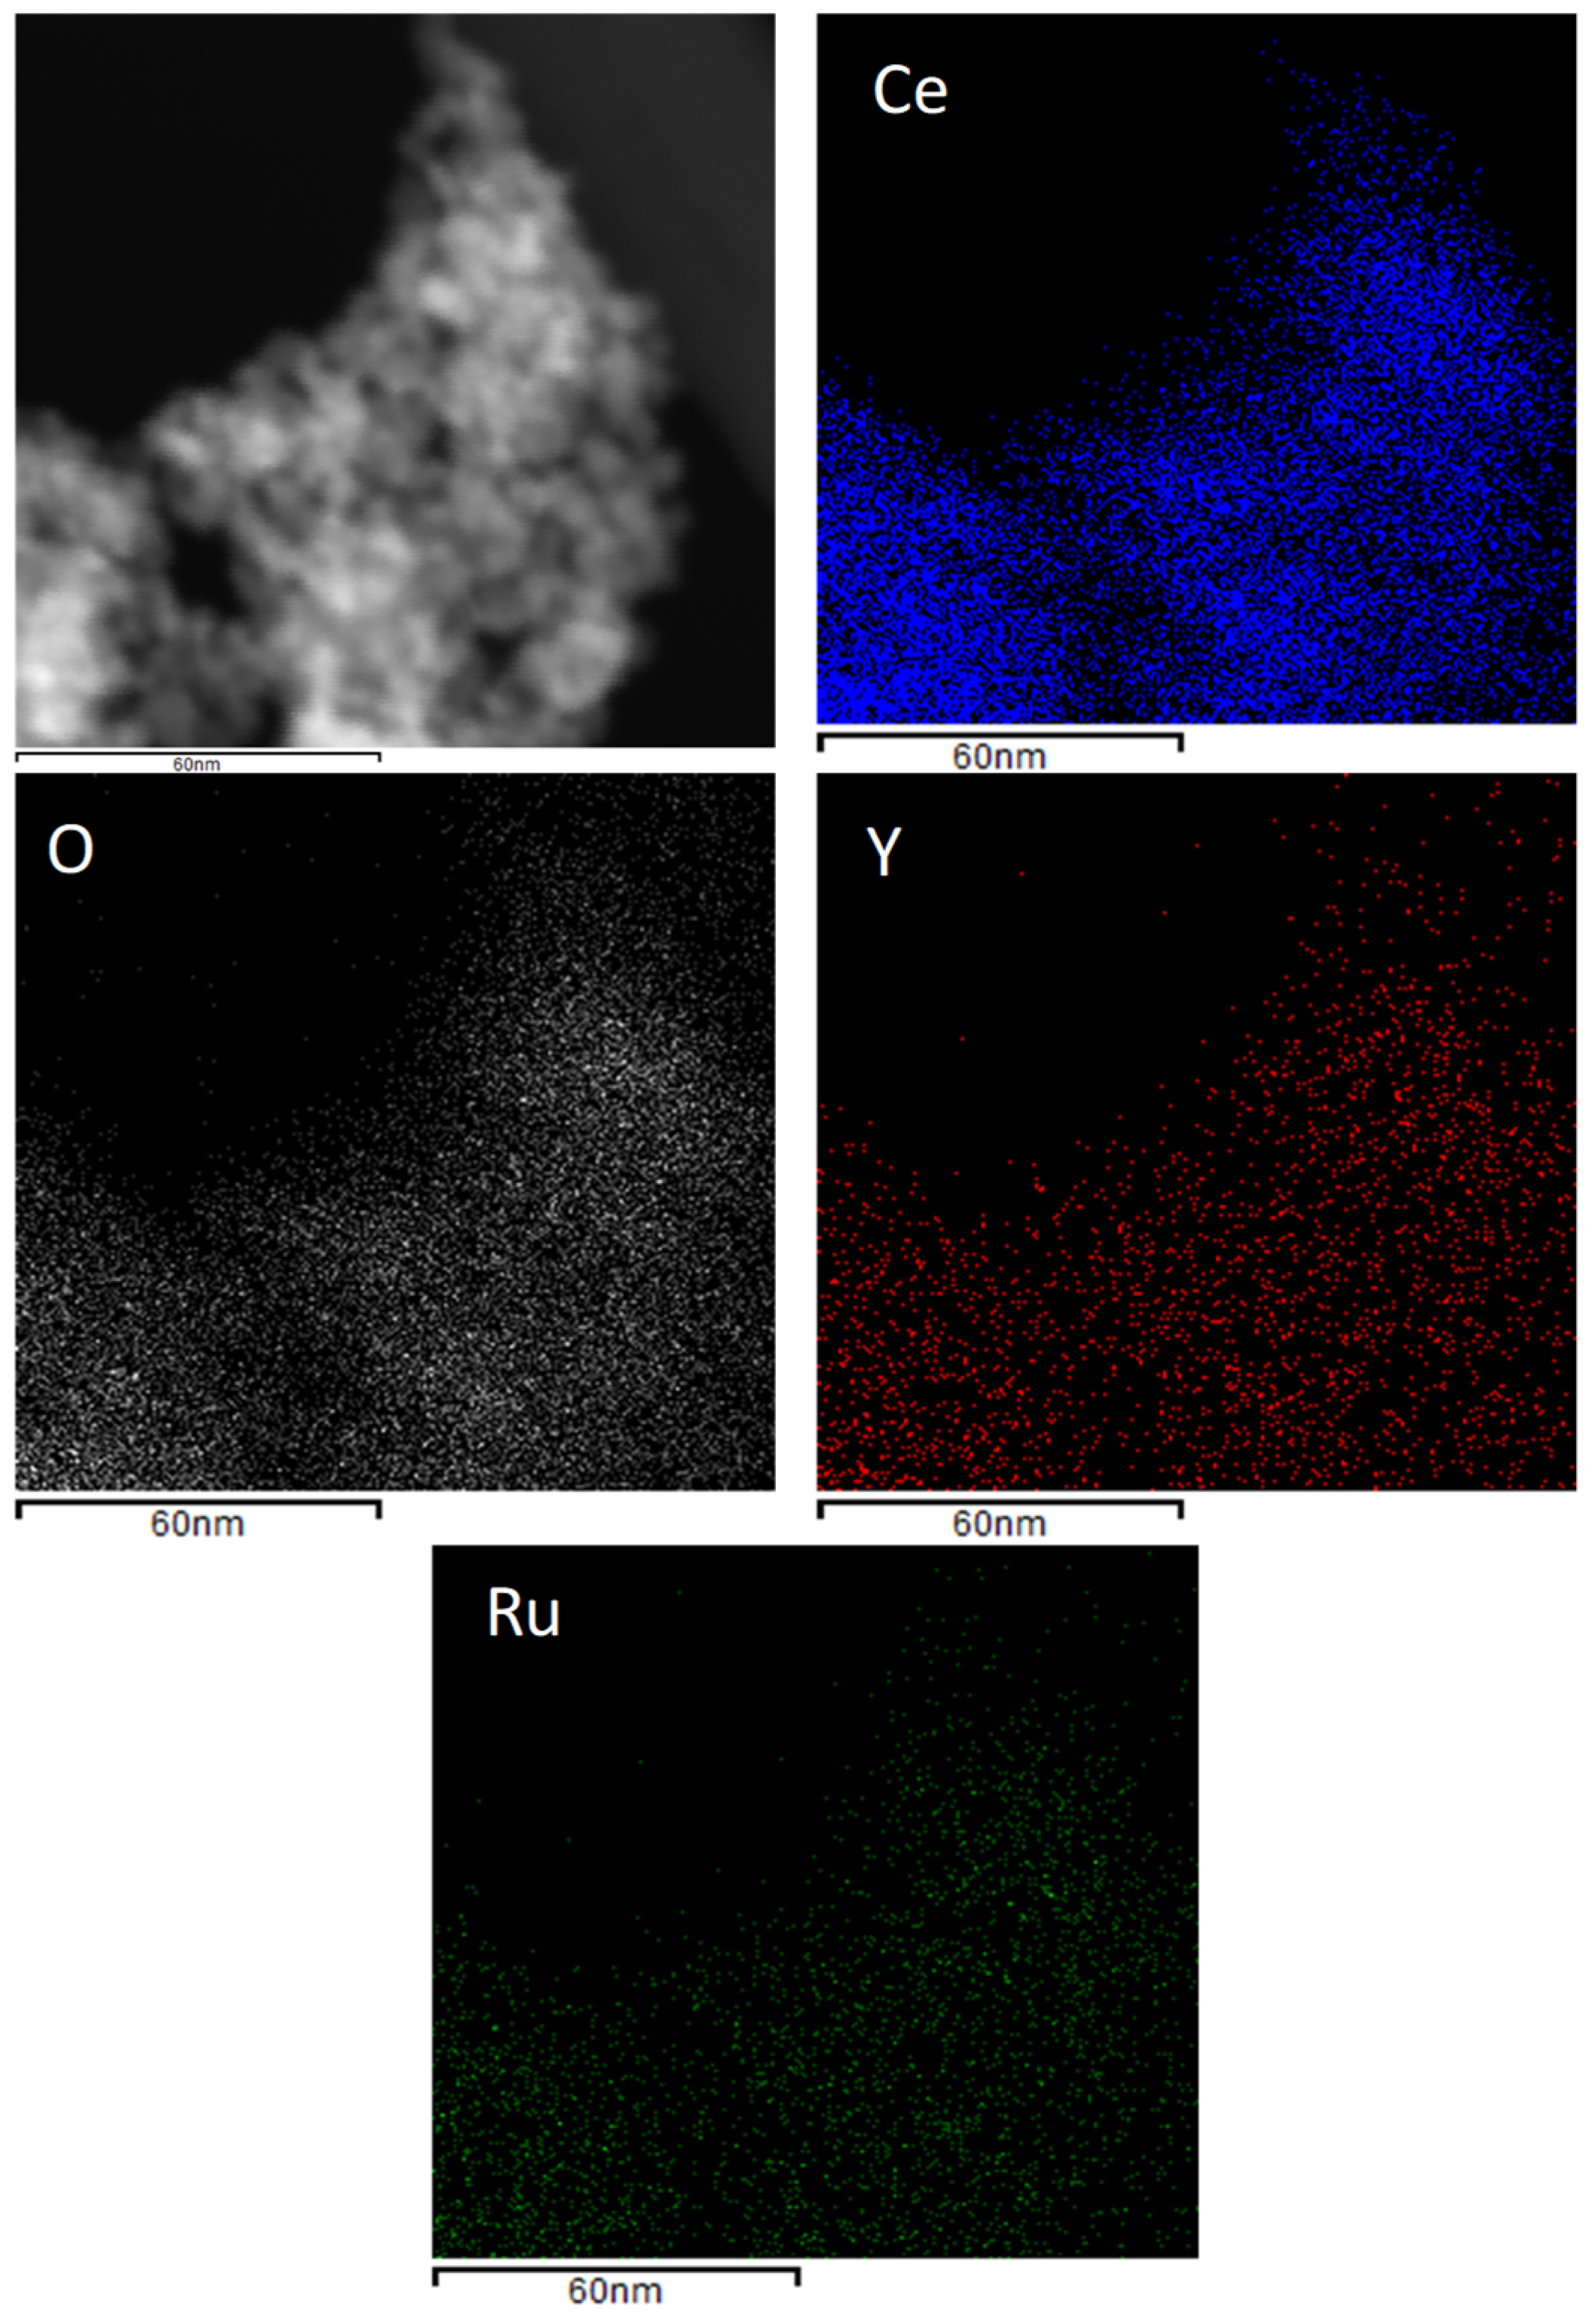
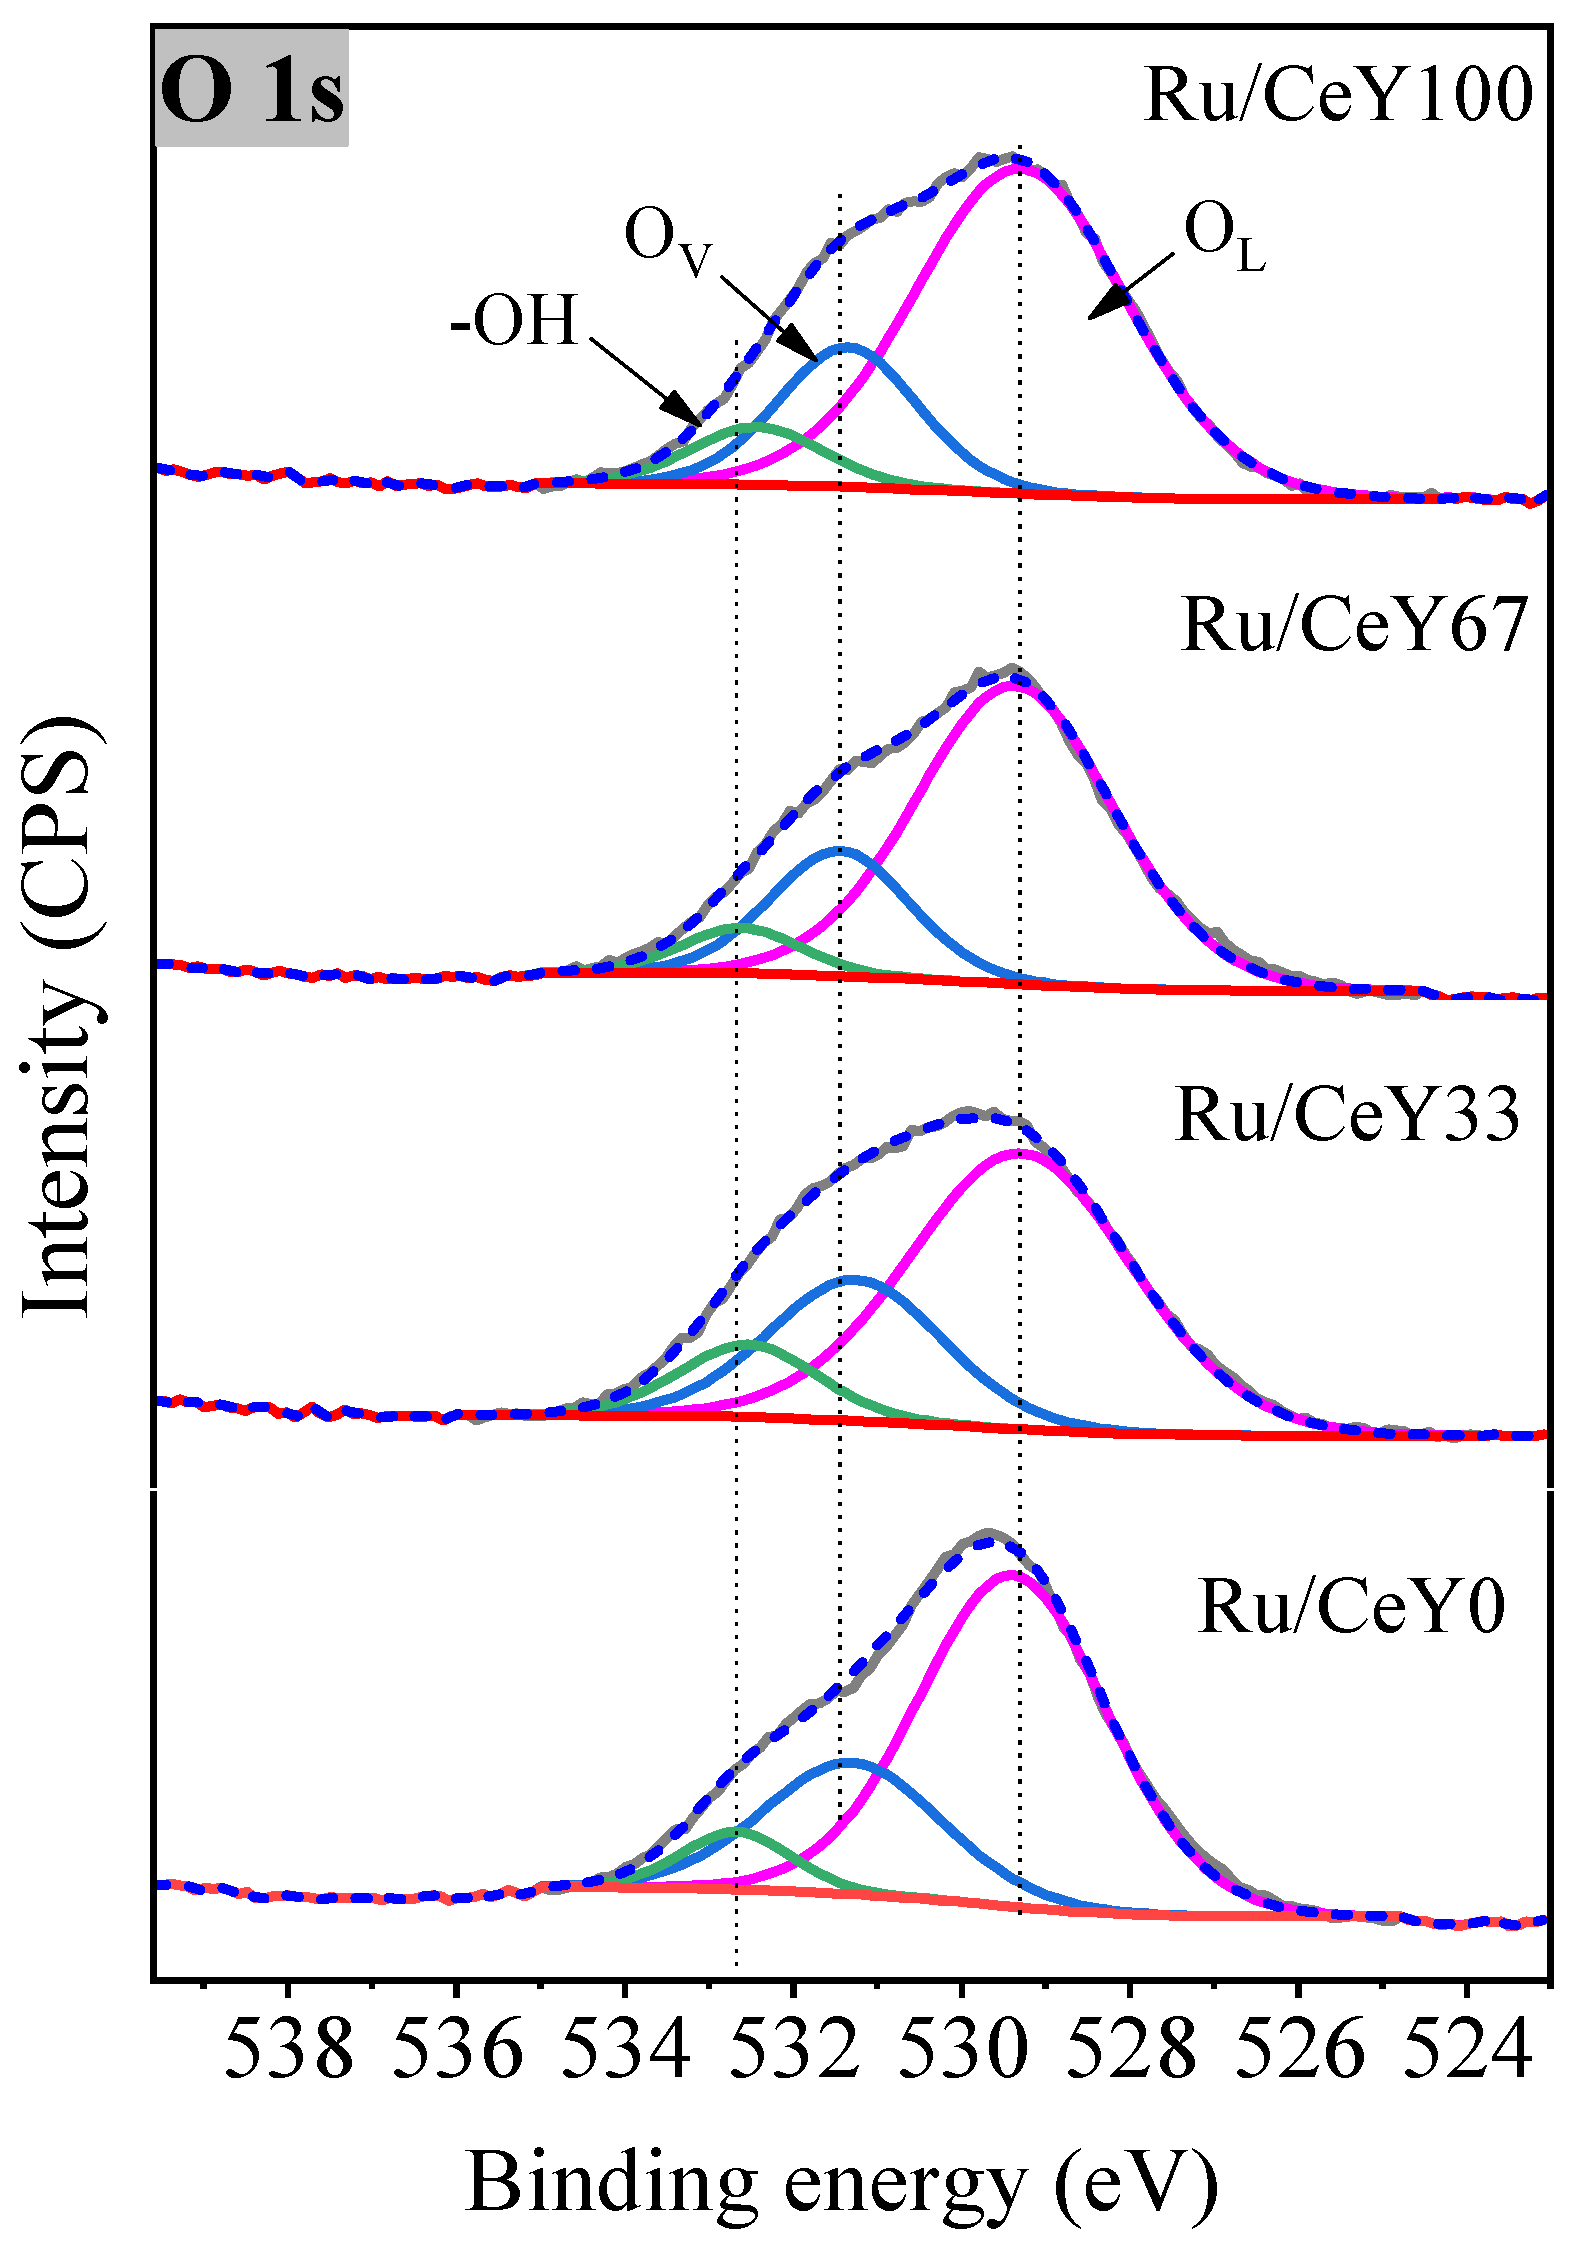
2.1. Catalysts Characterization

X-ray characterization of the supported ruthenium samples is presented in Figure 1. The XRD patterns of the cerium-containing samples exhibited characteristic peaks corresponding to the (111), (200), (220), and (311) diffraction planes of the fluorite phase of CeO2 (JCPDS 34-0394). In contrast, the X-ray diffractogram of the Ru/CeY0 sample showed peaks at 29.09°, 33.64°, 48.35°, and 57.35°, which can be attributed to the (222), (400), (440), and (622) planes of α-Y2O3, respectively (JCPDS 01–086–1107). Both CeO2 and Y2O3 crystallize in a cubic structure, with lattice parameters of 5.41  Å and 10.64  Å, respectively (Table 1). In the case of the Ru supported on mixed oxide samples, the lattice parameter was measured at 5.40  Å, which is slightly lower compared to the value observed in the Ru/CeY0 sample. This reduction can be attributed to the smaller ionic radius of Y3+ (0.93 Å) compared to Ce4+ (0.97 Å), suggesting that yttrium cations could be incorporated into the CeO2 lattice. However, it is also possible that in the CeO2-Y2O3 samples, yttrium oxide may be present in small crystals. Furthermore, no peaks corresponding to ruthenium species were observed, indicating that the metal is well dispersed on the surface of the materials.
Figure 2 shows TEM and HR-TEM images obtained from Ru/CeY0, Ru/CeY100 and Ru/CeY33 catalysts. In the case of TEM images (Figure 2A–C), it is observed that all samples display a similar nanoplate morphology. On the other hand, in the image obtained by HR-TEM of the Ru/100Ce sample (Figure 2D–F), it was possible to determine different interplanar distances associated with (111) and (220) planes of the fluorite phase of CeO2, while the measurement of the crystallographic planes of the Ru/CeY100 catalyst corresponds to (222) plane characteristic of α-Y2O3. In addition, in the HR-TEM image corresponding to the Ru/CeY33 catalyst (Figure 2F), it was possible to estimate two interlayers spacing neighboring (0.314 and 0.306 nm) which correspond to (111) and (220) planes, the most representative, of the cerium oxide and yttrium oxide. This confirms the presence of both metal oxides in inner contact in the supporting composite. Furthermore, in all images obtained by HR-TEM, there are darker entities below 1 nm (marked with arrows) dispersed homogeneously over the surface of support materials, which could be associated with ruthenium species.
EDS elemental mapping images of the Ru/CeY0, Ru/CeY100, and Ru/CeY33 catalysts are displayed in Figures S1 and S2 and Figure 3. The presence of ruthenium, oxygen, and cerium homogeneously distributed was observed (Figure S1). As expected, only ruthenium, oxygen, and yttrium elements, also homogeneously dispersed, were detected in the Ru/CeY100 material (Figure S2). In the case of Figure 3, the presence of ruthenium, oxygen, cerium, and yttrium elements was observed in the Ru/CeY33 material. EDS mapping, XRD, and HR-TEM results confirms the obtention of the Ru/metal oxide and Ru/metal oxide—metal oxide formation (metal = cerium or yttrium).
The results obtained from the N2 physisorption at −196 °C (Figure 4) revealed that all the powders exhibited type IV isotherms according to the IUPAC classification, which is characteristic of mesoporous materials. The isotherms displayed H3 hysteresis loops (Figure 4), which are typically associated with slit-like pores. The textural properties derived from these measurements are summarized in Table 1. Among the materials studied, the Ru/CeY0 sample exhibited the highest surface area (106.3 m2 g−1), while the Y2O3-supported Ru sample (Ru/CeY100) showed the lowest surface area (41.7 m2 g−1). In addition, it was observed that the incorporation of Y2O3 to the CeO2 generated a decrease in the specific surface area obtaining values of 65.9 and 51.8 m2 g−1 for the Ru/CeY33 and Ru/CeY66 catalyst, respectively. Regarding the average pore diameter, no clear trend was observed with varying Y2O3 content, with values ranging between 7.4 and 9.4 nm.
The chemical structure of the samples was analyzed through X-ray photoelectron spectroscopy (XPS). Figures S3A–C and Figure 5 display high-resolution XPS of the Ru3d, Y3d, Ce3d, and O1s zones, respectively. Figure S3A displays the Ru 3d XPS spectra for all samples overlapping with C1s spectra. Here, the peaks at the binding energies 881.1 and 285.3 eV correspond to metallic Ru0 3d5/2 and 3d3/2, respectively, whereas the peaks centered at 282.6 and 286.8 eV are attributed to oxidized Ru species [43,44,45]. Figure S3B shows the high resolution of the Y spectra zone for Ru/CeY100, Ru/CeY66, and Ru/CeY33. All spectra displayed two peaks centered at 157.1 and 159.2 eV, which correspond with the cation of Y3d split (Y3d5/2 and Y 3d3/2) characteristic of yttrium oxide species (Y3+) [46,47]. The peaks presented a position difference of 2.1 eV and an intensity ratio of 3:2 in their binding energy, which agrees with the XPS standard [48]. Figure S3C presents high-resolution Ce3d XPS spectra for Ru/CeY66, Ru/CeY33, and Ru/CeY0 materials. The peaks were deconvoluted into eight peaks located at 882.9, 889.4, and 898.6 eV, corresponding to the Ce 3d5/2 level of Ce4+, whereas the peaks located at 901.4, 908.1, and 917.2 eV were associated with Ce 3d3/2 level of Ce4+. The peaks at 885.7 and 904.0 eV correlate to Ce3+ 3d5/2 and Ce3+ 3d3/2, respectively [49,50]. As shown in Table 2, even though the amount of ceria decreases, due to the addition of Y2O3, in the Ru/CeY66 and Ru/CeY33 nanocomposite materials (see ratio Y/Ce in Table 2), the Ce3+/Ce4+ ratio is similar (0.11) for the three catalysts that contain cerium dioxide. These results not only provide evidence that the peak positions (Ru, Y, and Ce) of the different samples do not change but also confirm the different oxidation states of the yttrium (Y3+), Ce (Ce3+ and Ce4+), and Ru (Ru0 and Ru oxidized).
Moreover, significant differences were detected in the O1s XPS spectra zone of the catalysts (Figure 5). The peaks were deconvoluted into three main peaks at 529.7, 531.6, and 532.7 eV, which are related to lattice oxygen (OL), oxide defects such as oxygen vacancies (OV) or surface oxygen ions with low coordination, and adsorbed water and hydroxyl groups (-OH) bonded on sample surface [51,52]. In addition, in Table 2, it is observed that the contribution of the OV species to the O1s XPS peak decreases linearly with an increase in the Y2O3 content in the material support, as follows: Ru/CeY0 > Ru/CeY33 > Ru/CeY66 > Ru/CeY100. However, the lowest value of OV in the nanocomposite materials (Ru/CeY66 = 18.3%) is above the value obtained for the sample containing pure Y2O3 as support material (Ru/CeY100 = 16.9%), which indicates that in the case of Ru/CeY33 and Ru/CeY66 mixed oxide materials, not only does the concentration of oxygen vacancies on each of their surfaces persist but the exposed surface area of each component is also proportional to its molar fraction, obtaining, in this case, a linear dependence of OV vs. Y2O3 content in the whole series (including pure metal oxides), as shown in Figure S4. Such species (oxygen vacancies) could be potentially important for interpretation of the catalytic activity.

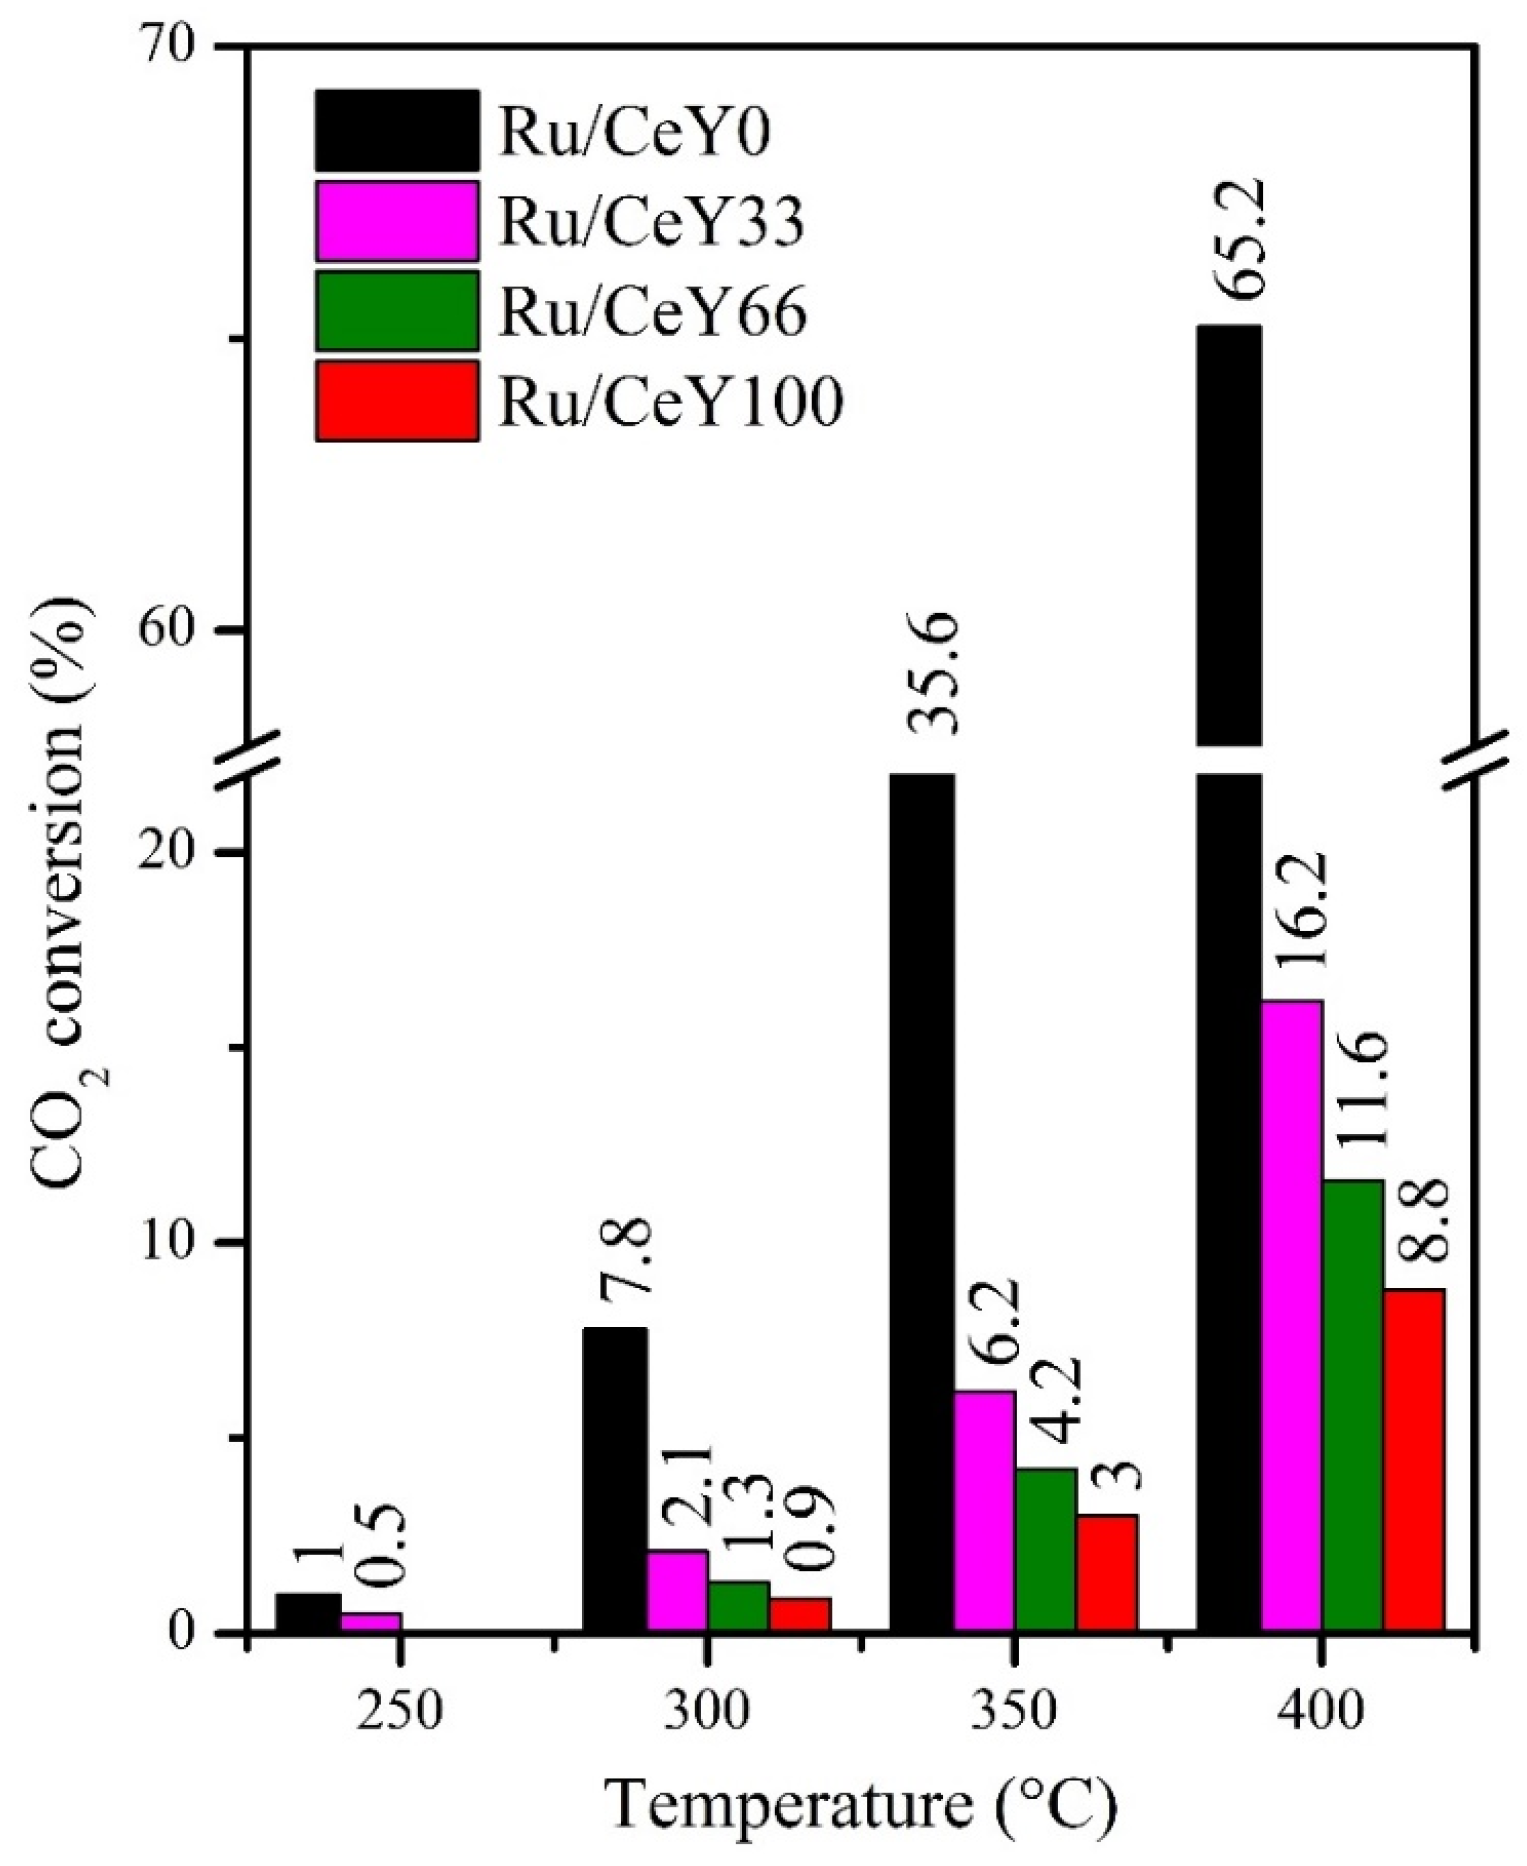
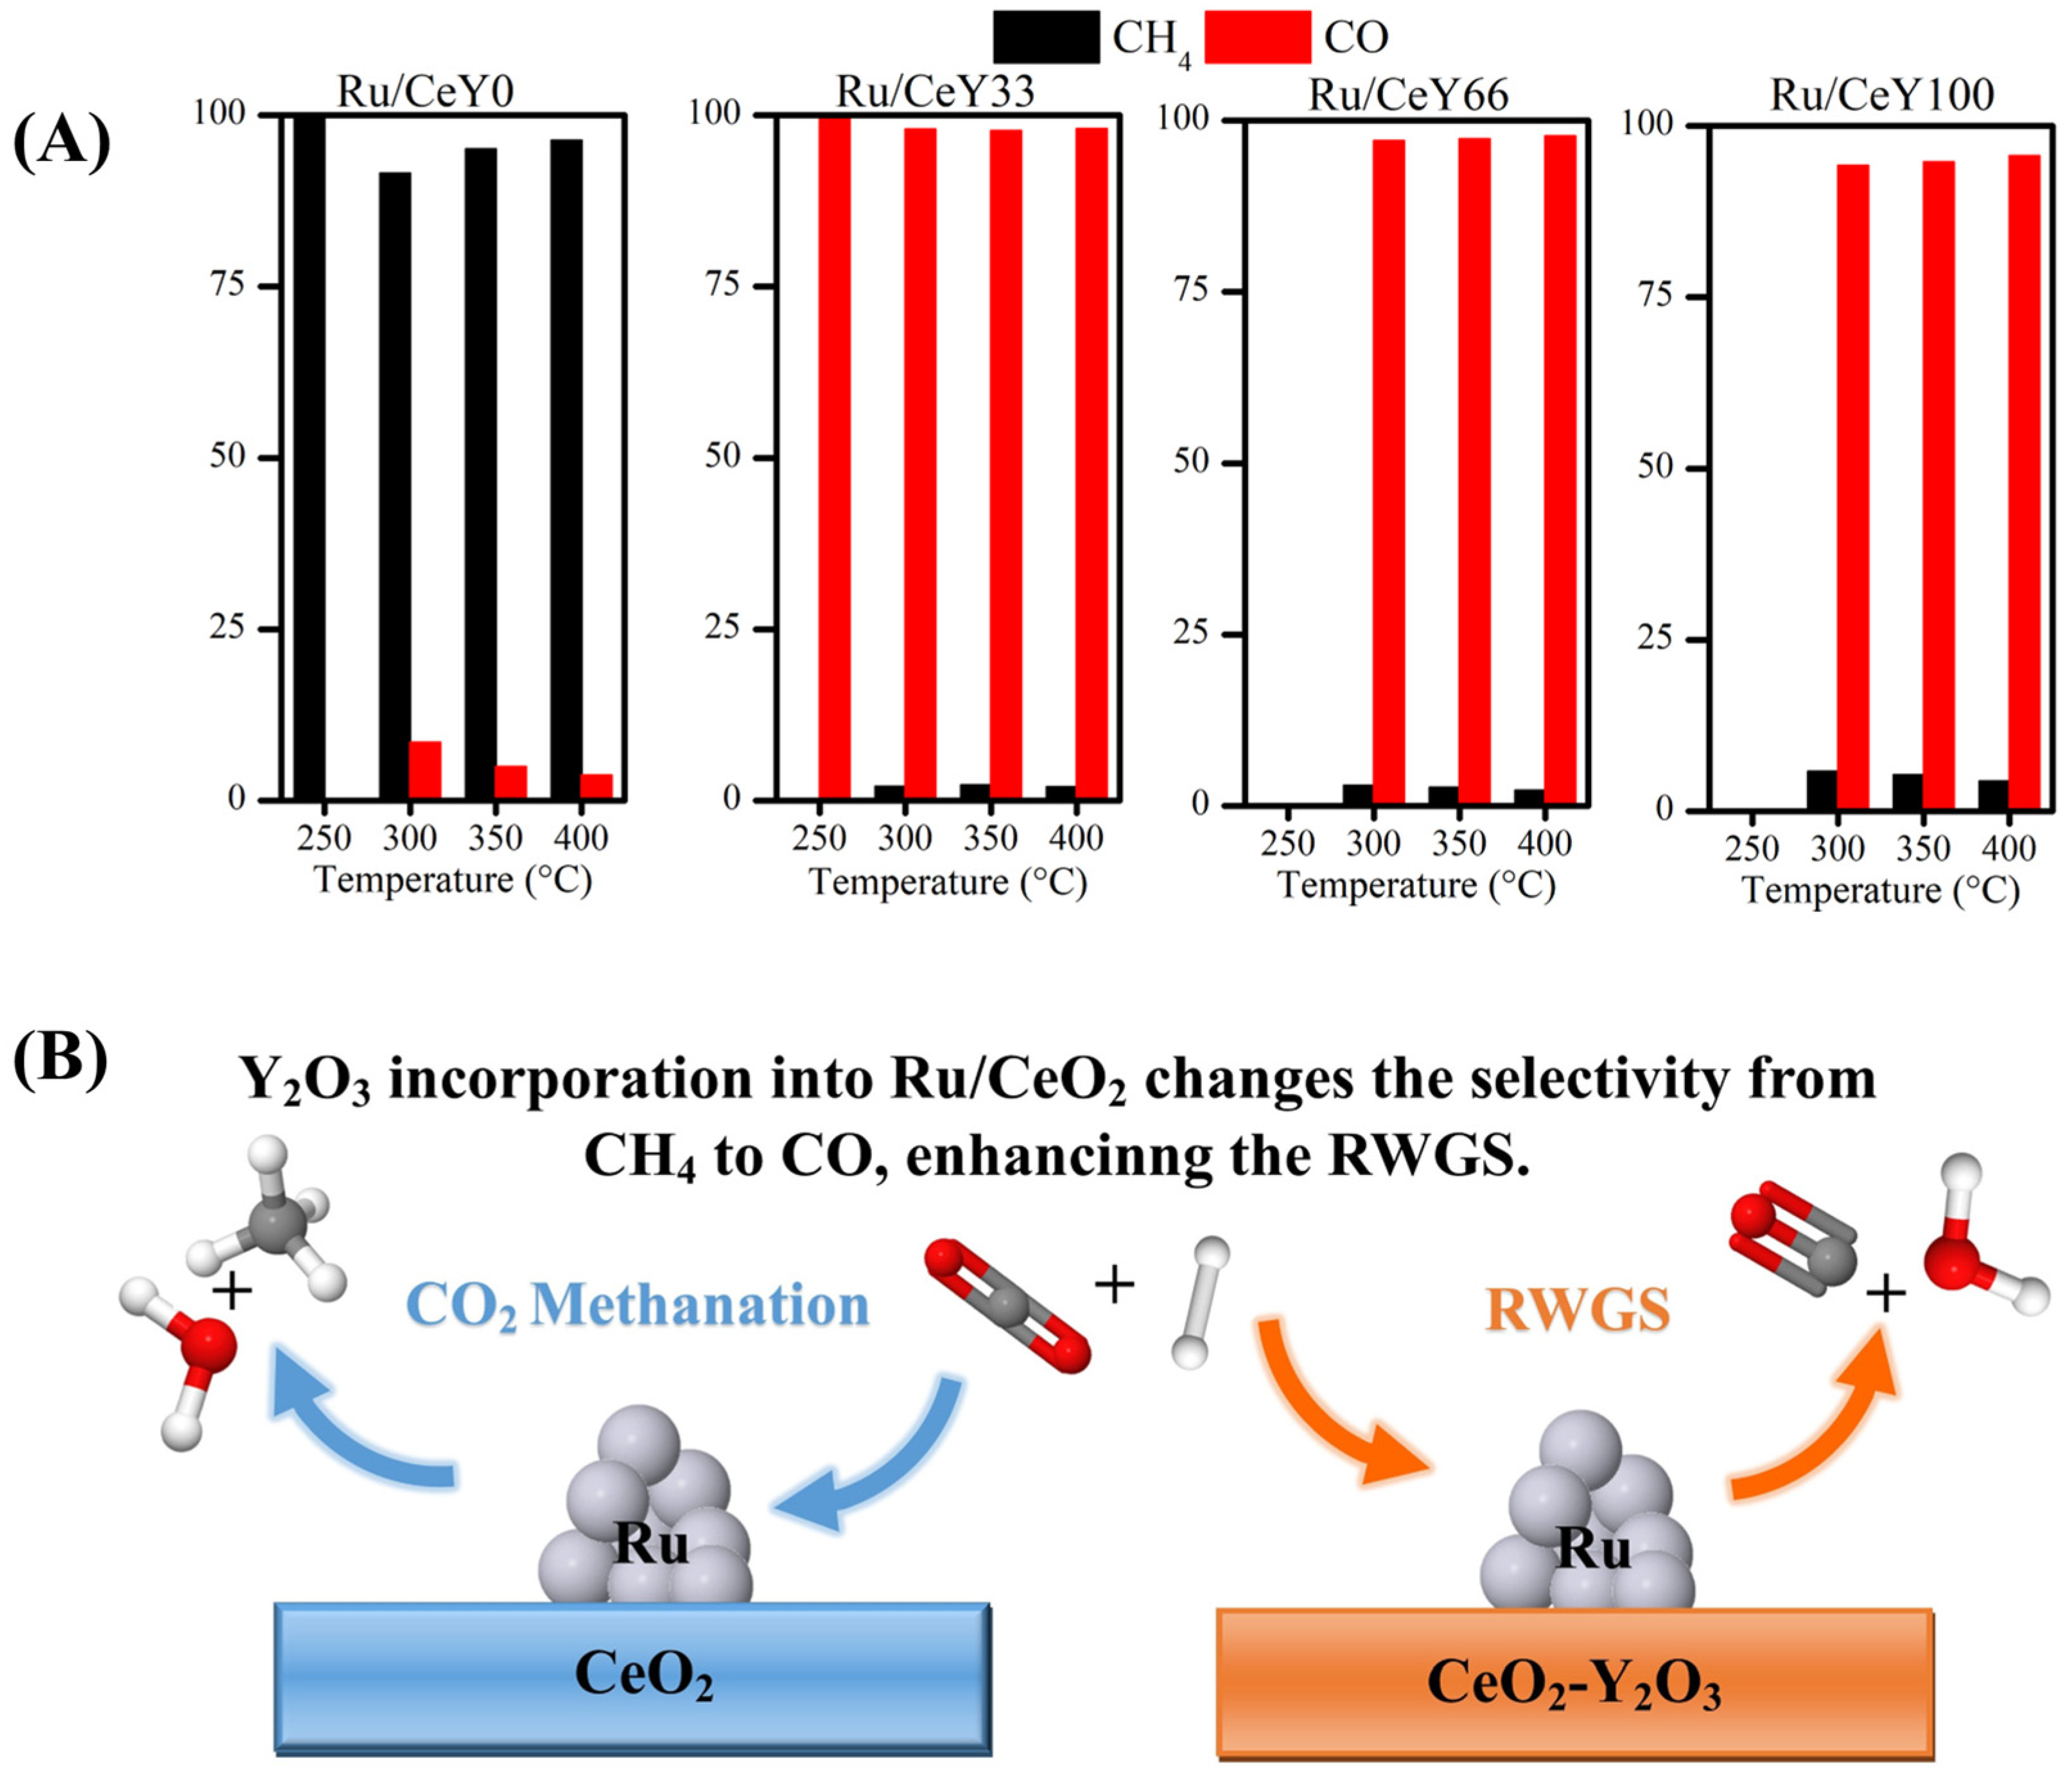
2.2. Catalytic Activity

Figure 6 shows the CO2 conversion results under steady-state conditions, obtained from catalytic tests in a continuous packed bed flow reactor. As shown, all the samples exhibited catalytic activity for CO2 transformation, with conversion increasing as the temperature rose.
The CeO2-supported Ru catalyst (Ru/CeY0) achieved the highest CO2 conversion values across the temperature range from 250 °C to 400 °C. In contrast, the Ru catalyst supported on Y2O3 (Ru/CeY100) showed the lowest CO2 conversion, despite the ignition temperature shifting to 300 °C, which is 50 °C higher than that of Ru/CeY0. For the Ru catalysts on CeO2-Y2O3 mixed supports, it was observed that increasing the proportion of yttrium oxide resulted in a decrease in CO2 conversion during the catalytic tests. Overall, the CO2 conversion for all catalysts decreased in the following order: Ru/CeY0 > Ru/CeY33 > Ru/CeY66 > Ru/CeY100 (Figure 6). A similar trend was observed in the surface area data (Table 1), suggesting that the reduction in CO2 conversion may be linked to a decrease in the number of active sites available for the reaction.
The selectivity towards CO and CH4 for the catalysts is shown in Figure 7A. As observed, for the Ru/CeY0 catalyst, methane was the primary product, with carbon monoxide also being formed at higher temperatures (above 300 °C) in smaller amounts. This suggests that CO2 is predominantly converted to CH4 via CO2 methanation, as reported by other authors [53,54]. In contrast, for the Ru/Y2O3 sample (Ru/CeY100), carbon monoxide was the main product, with methane being produced in much lower quantities. This indicates that the reverse water–gas shift reaction is favored over the Sabatier reaction in this sample. These findings demonstrate that support can significantly influence the catalytic performance of supported metal catalysts, even when the same metal is used. For the catalysts of Ru supported on CeO2-Y2O3, the selectivity was predominantly towards carbon monoxide (Figure 7A), with the selectivity for methane being lower than that of the Ru/CeY100 sample. Figure 7B shows in a representative way the influence of Y2O3 in the selectivity of the CO2 hydrogenation reaction. This suggests that the combination of cerium and yttrium in the support partially inhibits CO2 methanation. This contrasts with the results reported by Sun et al. [55], since they observed an enhancement of CO2 methanation after the incorporation of Y2O3 into Ru/CeO2, which may be due to the lower yttrium oxide loading than our study.
RWGS reaction rates for the catalysts are shown in Figure 8A. As estimated, the Ru/CeY0 catalyst exhibited the lowest CO generation rate among all the catalysts tested. The Ru/CeY100 sample demonstrated similar RWGS rates to Ru/CeY0 up to 300 °C. However, above this temperature, the difference in the RWGS rates between the two samples increased, with the Ru/CeY100 showing higher CO production. The Ru catalysts supported on CeO2-Y2O3 displayed higher CO production rates compared to Ru/CeY100. Notably, the sample with 33% w/w of Y2O3 in the support exhibited the highest CO generation, with the CO production rate at 400 °C nearly double that of the Ru/CeY100 sample (Ru/CeY33 = 5.9 µmol CO gcat−1 s−1 and Ru/CeY100 = 3.1 µmol CO gcat−1 s−1). These results suggest that an optimal combination of cerium oxide and yttrium oxide can enhance the conversion of CO2 to CO through the reverse water–gas shift reaction.
The activation energy (Ea) for the RWGS reaction was determined for each catalyst using a linearized Arrhenius plot (XCO2 < 12%), as shown in Figure 8B (See Supplementary Information for details on this procedure). For the Ru/CeY100 catalyst, the Ea was found to be 72.1 kJ mol−1, while a similar value of 71.0 kJ mol−1 was observed for Ru/CeY66. Notably, for the Ru/CeY33 sample, the Ea was reduced to 65.7 kJ mol−1, suggesting that the incorporation of yttrium in appropriate amounts can effectively lower the activation energy of the RWGS reaction. This value is comparable with the Ea obtained by Pt/SiO2 (67.9 kJ mol−1, [56]), Pt/SiC (61.6 kJ mol−1, [57]) and Pt/Al2O3 (66.0 kJ mol−1, [58]) samples in RWGS reaction. These results indicate that the presence of Y2O3 significantly enhances the catalytic performance of Ru supported on CeO2, highlighting its potential to improve RWGS reaction efficiency.
Table 3 presents a comparison of CO2 conversion and selectivity towards CO between Ru catalysts supported on different metal oxides and our samples. As shown, the Ru catalysts exhibit higher CO2 conversion; however, their selectivity towards CO is limited, since methane is the main product, as observed in the Ru/CeY0 sample. Notably, the Ru/CeY33 sample demonstrates a significant shift in selectivity, favoring CO production over methane.

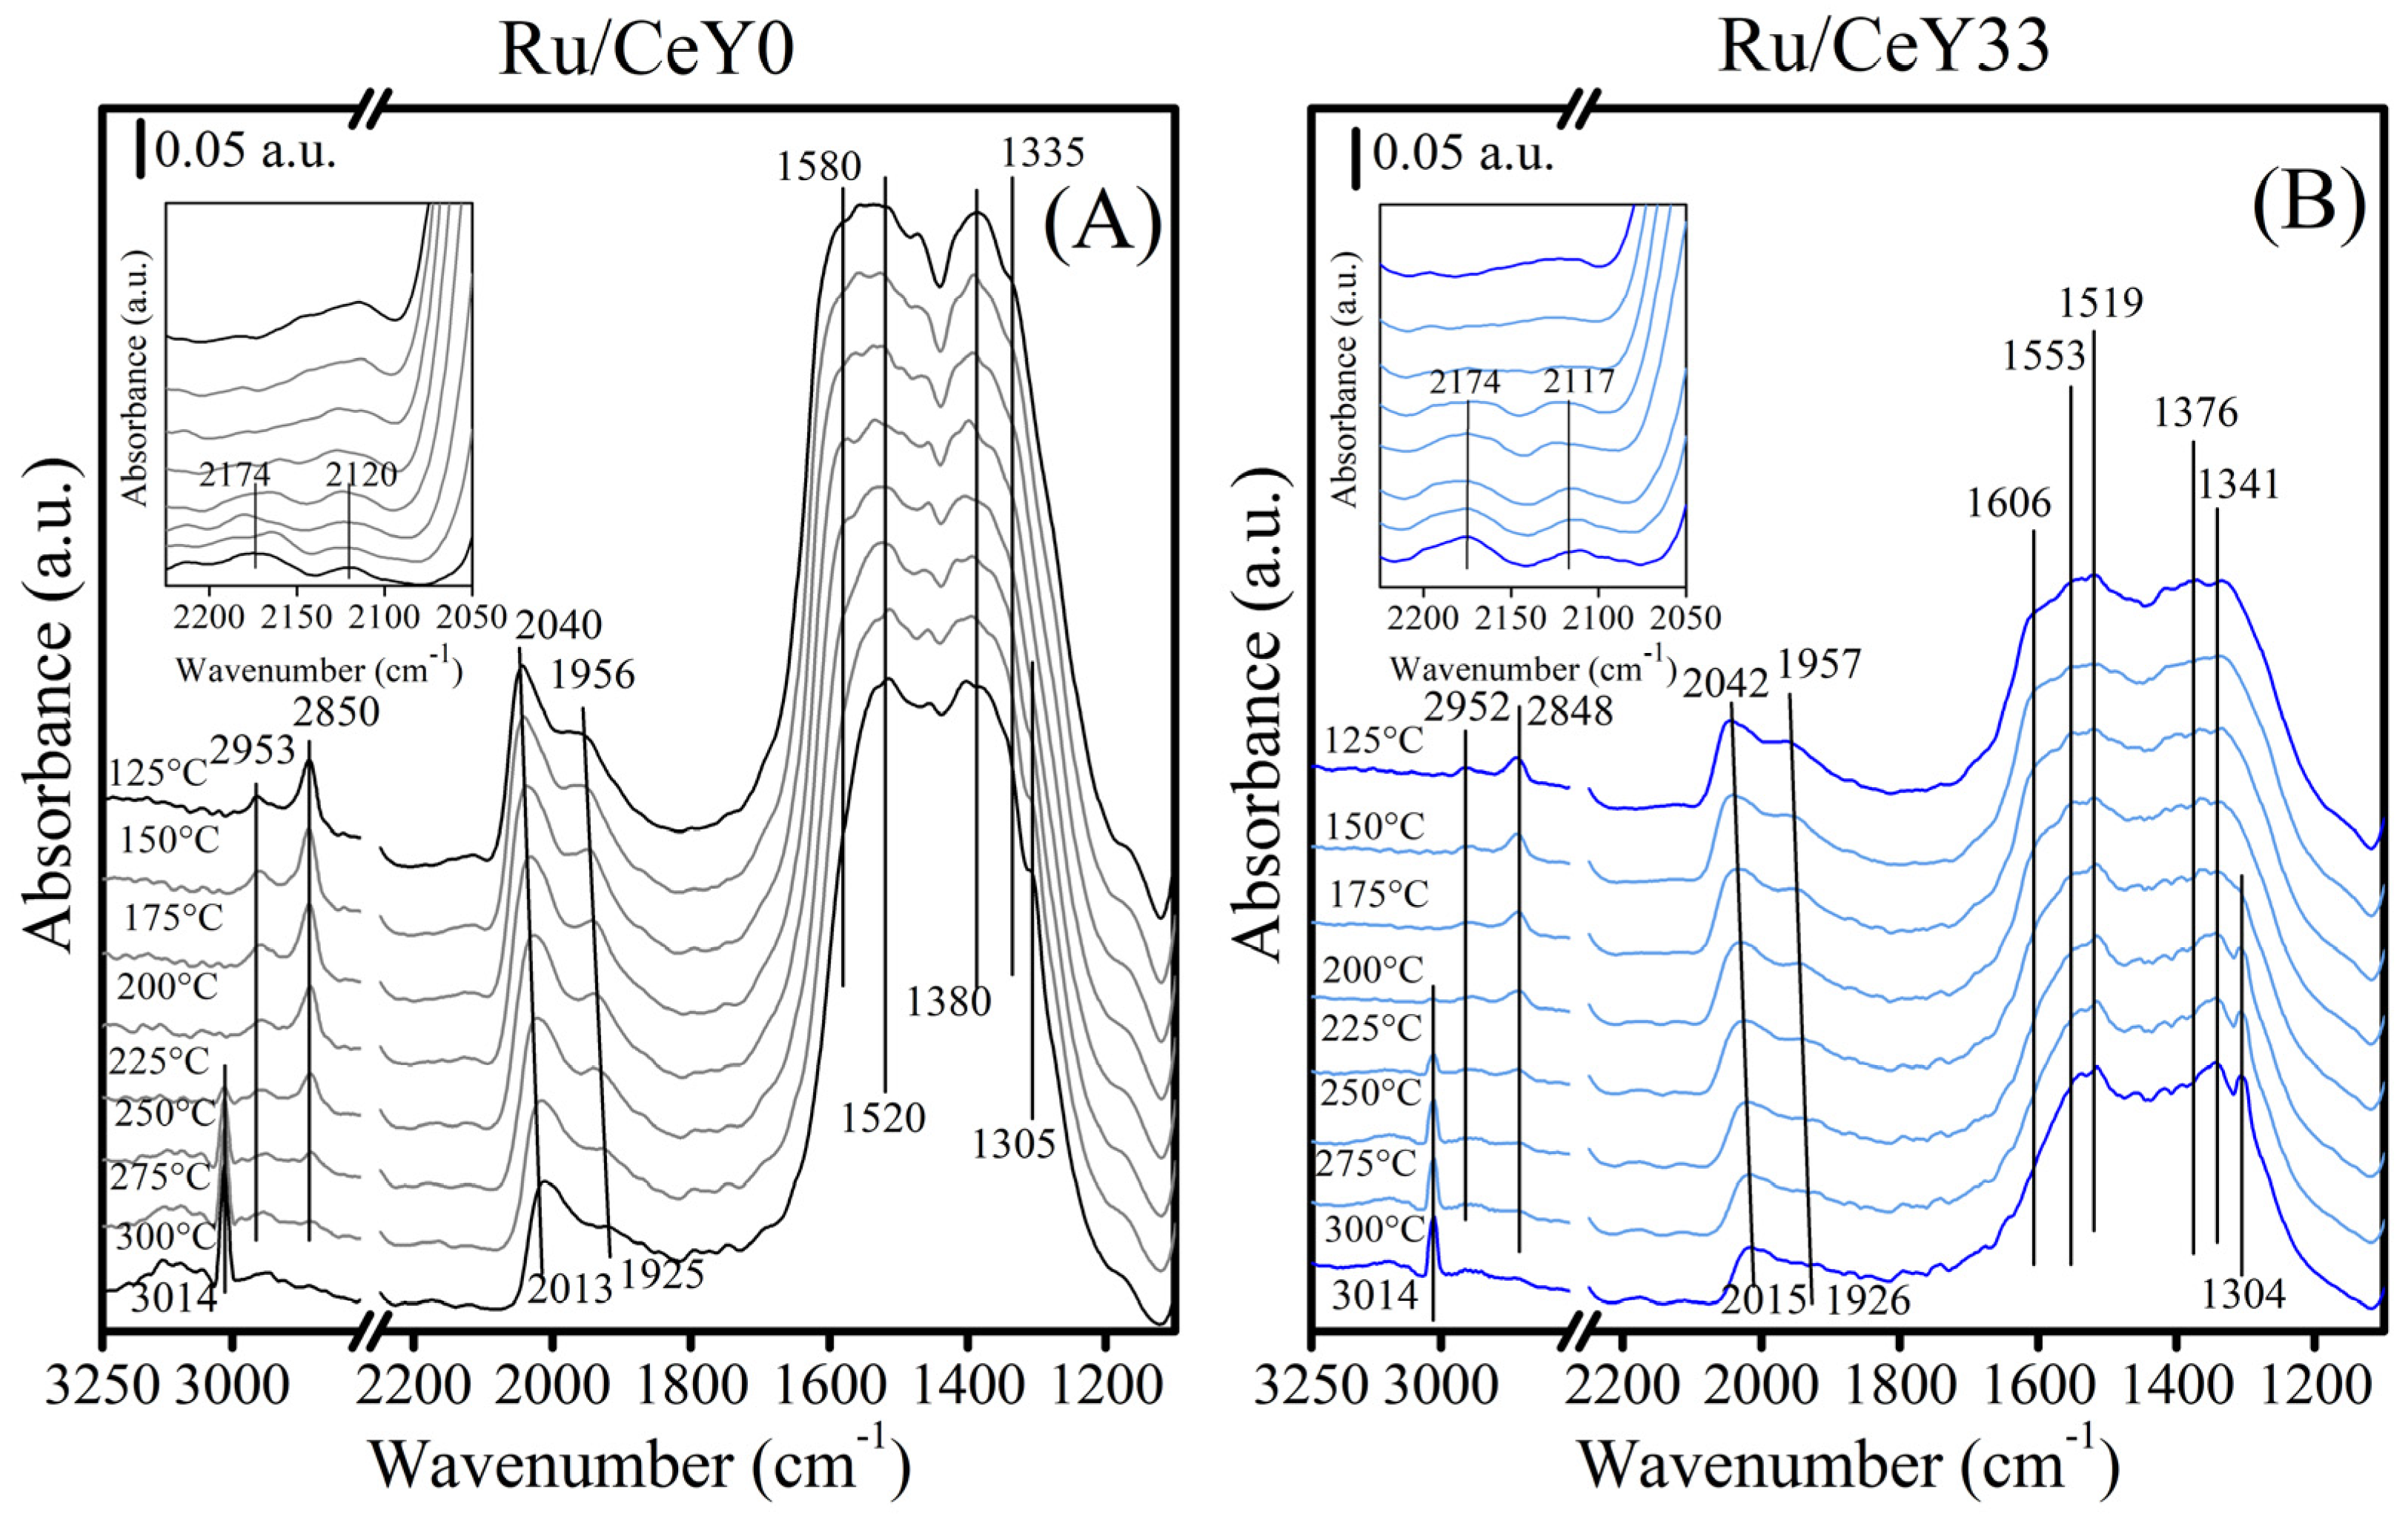
2.3. FTIR Characterization Under Reaction Conditions

To examine the impact of Y2O3 incorporation on the catalytic performance of Ru/CeO2 samples in the reverse water–gas shift (RWGS) reaction, reduced samples were exposed to a reactive gas mixture (12% CO2/48% H2/40% N2, v/v) at increasing temperatures. During the experiment, FTIR spectroscopy was employed to identify and monitor the surface species involved in the catalytic process (Figure 9).

2.3.1. Ru/CeY0

Upon exposure of the Ru/CeY0 samples to the reactive mixture (12% CO2/48% H2/40% N2, v/v) at 125 °C, several bands appeared in the IR spectrum, as shown in Figure 9A. The prominent bands at 1520 and 1380 cm−1 were attributed to the asymmetric and symmetric ν(OCO) vibration modes of carbonate species bonded to the cerium oxide surface in a monodentate configuration [61,62,63]. Previous studies have suggested that the formation of these carbonate species could result from the interaction between CO2 and surface oxygen vacancies on CeO2 [64,65]. Additionally, the IR signals at 1580 and 1335 cm−1 could be assigned to the asymmetric and symmetric ν(OCO) stretching modes of monodentate formate species attached to CeO2. The presence of these species is further supported by two bands in the C-H stretching region at 2953 cm−1 (νa(OCO) + δ(CH)) and 2850 cm−1 (ν(CH)), which are consistent with C-H bonds in formats [66,67,68]. These species likely arise from the reaction of carbonate species with hydrogen atoms, generated by H2 dissociation on Ru0 sites [69,70]. Moreover, two additional bands appeared at 2040 and 1956 cm−1, corresponding to carbonyl species bonded to Ru0 sites in linear (Ru0-CO) and bridged ((Ru0)2-CO) configurations [71,72]. These carbonyl species may originate either from direct CO2 dissociation on Ru0 sites or from the dehydroxylation of formate species near the ruthenium sites [73,74]. However, theoretical calculations suggest that the formation of carbonyl species via the dehydroxylation of formate species is more energetically favorable than direct CO2 dissociation on Ru0 given the high energy barrier (approximately 116 kJ mol−1) [75].
The temperature increases led to notable changes in the FTIR spectra of the Ru/CeY0 catalyst, as shown in Figure 9A. Specifically, the bands corresponding to formate species (2953, 2850, 1580, and 1335 cm−1) and Ru-carbonyls (2040 and 1956 cm−1) intensified as the temperature rose, reaching maximum intensities around 200 °C. Beyond this point, both the formate and Ru-carbonyl bands began to diminish. This reduction was accompanied by a shift in the bands to lower wavenumbers, with the Ru0-CO stretching mode moving from 2040 to 2013 cm−1 and the (Ru0)2-CO stretching mode shifting from 1956 to 1925 cm−1. Similar behavior was observed during CO adsorption experiments, and it was attributed to decrease in CO coverage metal surface [76,77]. In parallel, a sharp band appeared at 3014 cm−1, along with a shoulder at 1305 cm−1 (Figure 9A), which is characteristic of the ν(CH) and δ(CH) vibrational modes of methane in the gas phase, respectively [78]. This indicates that both formate species and ruthenium carbonyls may be involved in methane formation. Notably, the temperature at which methane was detected in the FTIR spectra coincides with its formation observed in the catalytic tests (Figure 7). Furthermore, two additional bands at 2174 and 2120 cm−1 (Figure 9A, inset) were identified, consistent with the presence of CO gas [78,79]. This suggests that a fraction of CO2 adsorption derived species is being converted into CO, as corroborated by the catalytic tests (Figure 7).

2.3.2. Ru/CeY33

The Ru/CeY33 sample exhibited the highest activity in catalyzing the RWGS reaction. To obtain insights to understand how the incorporation of Y2O3 into Ru/CeO2 alters the selectivity from methane to CO, we analyzed the surface species formed during catalysis using FTIR spectroscopy (Figure 9B). Upon introducing the reactive mixture into the FTIR cell, the resulting spectra differed significantly from those observed for the Ru/CeY0 sample (Figure 9A). Notably, the intensities of all bands in the Ru/CeY33 sample were lower compared to Ru/CeY0. This suggests that the presence of Y2O3 reduces the amount of CO2 adsorbed on the surface, likely due to a decrease in the number of oxygen vacancies, as indicated by the XPS data (Table 2). This reduction in CO2 adsorption may be linked to a corresponding decrease in CO2 conversion in Y2O3-containing samples (Figure 6).
At 125 °C, several bands emerged in the FTIR spectra due to the interaction between the reactive mixture and the Ru/CeY33 sample. The bands at 1519 and 1376 cm−1 can be attributed to the asymmetric (νa(OCO)) and symmetric (νs(OCO)) stretching vibrations of carbonate species in a monodentate configuration on CeO2 [61,62,63]. These species likely form from CO2 adsorption on surface oxygen vacancies [64,65]. Additionally, bands at 1553 cm−1 (νa(OCO)) and 1341 cm−1 (νs(OCO)) correspond to carbonate species in a bridged form [49,50,51]. The presence of formate species on Y2O3 was evidenced by the intense bands at 2952 cm−1 (νa(OCO) + δ(CH)) and 2848 cm−1 (ν(CH)), along with those at 1606 cm−1 (νa(OCO)) and 1376 cm−1 (νs(OCO)) [42,80]. The formation of these species likely results from the reaction between carbonate species and H atoms, which are generated through H2 dissociation on the ruthenium sites [69,70]. As observed in the Ru/CeY0 sample, two additional bands at 2042 and 1957 cm−1 appeared in the C-O stretching region of Ru/CeY33 sample (Figure 9A). These bands can be attributed to CO bonded to Ru0 sites in linear and bridged configurations [71,72], likely formed via the dehydroxylation of formate species, as discussed above.
As the temperature increased, notable changes were observed in the IR spectra of the Ru/CeY33 sample (Figure 9B). The bands corresponding to formate species and Ru0-carbonyls showed a slight increase in intensity up to approximately 200 °C (Figure 9B). Above this temperature, both signals began to progressively decrease with the rise in temperature, while simultaneously, bands associated with methane (3014 and 1304 cm−1, Figure 9B) and carbon monoxide (2171 and 2117 cm−1, Figure 9B inset) appeared and intensified. As anticipated, the carbon monoxide bands were more intense in the Ru/CeY33 sample compared to the Ru/CeY0 catalyst, which aligns with the higher selectivity towards CO observed in the catalytic tests (Figure 7). The bands of Ru-carbonyls shifted to lower frequencies when the temperature increased; this effect can be explained by a decrease in the CO coverage [76,77]. Based on the observations obtained by FTIR, it can be inferred that the Ru-carbonyls and formate species on the Y2O3 surface play a key role in the generation of carbon monoxide.
As shown in Figure 9, the intensity of the CO gas bands is weaker than those corresponding to methane, even in the Ru/CeY33 sample, where the selectivity towards the RWGS reaction is higher than CO2 methanation. This difference can be attributed to the lower IR absorption coefficient of CO compared to CH4 [81].

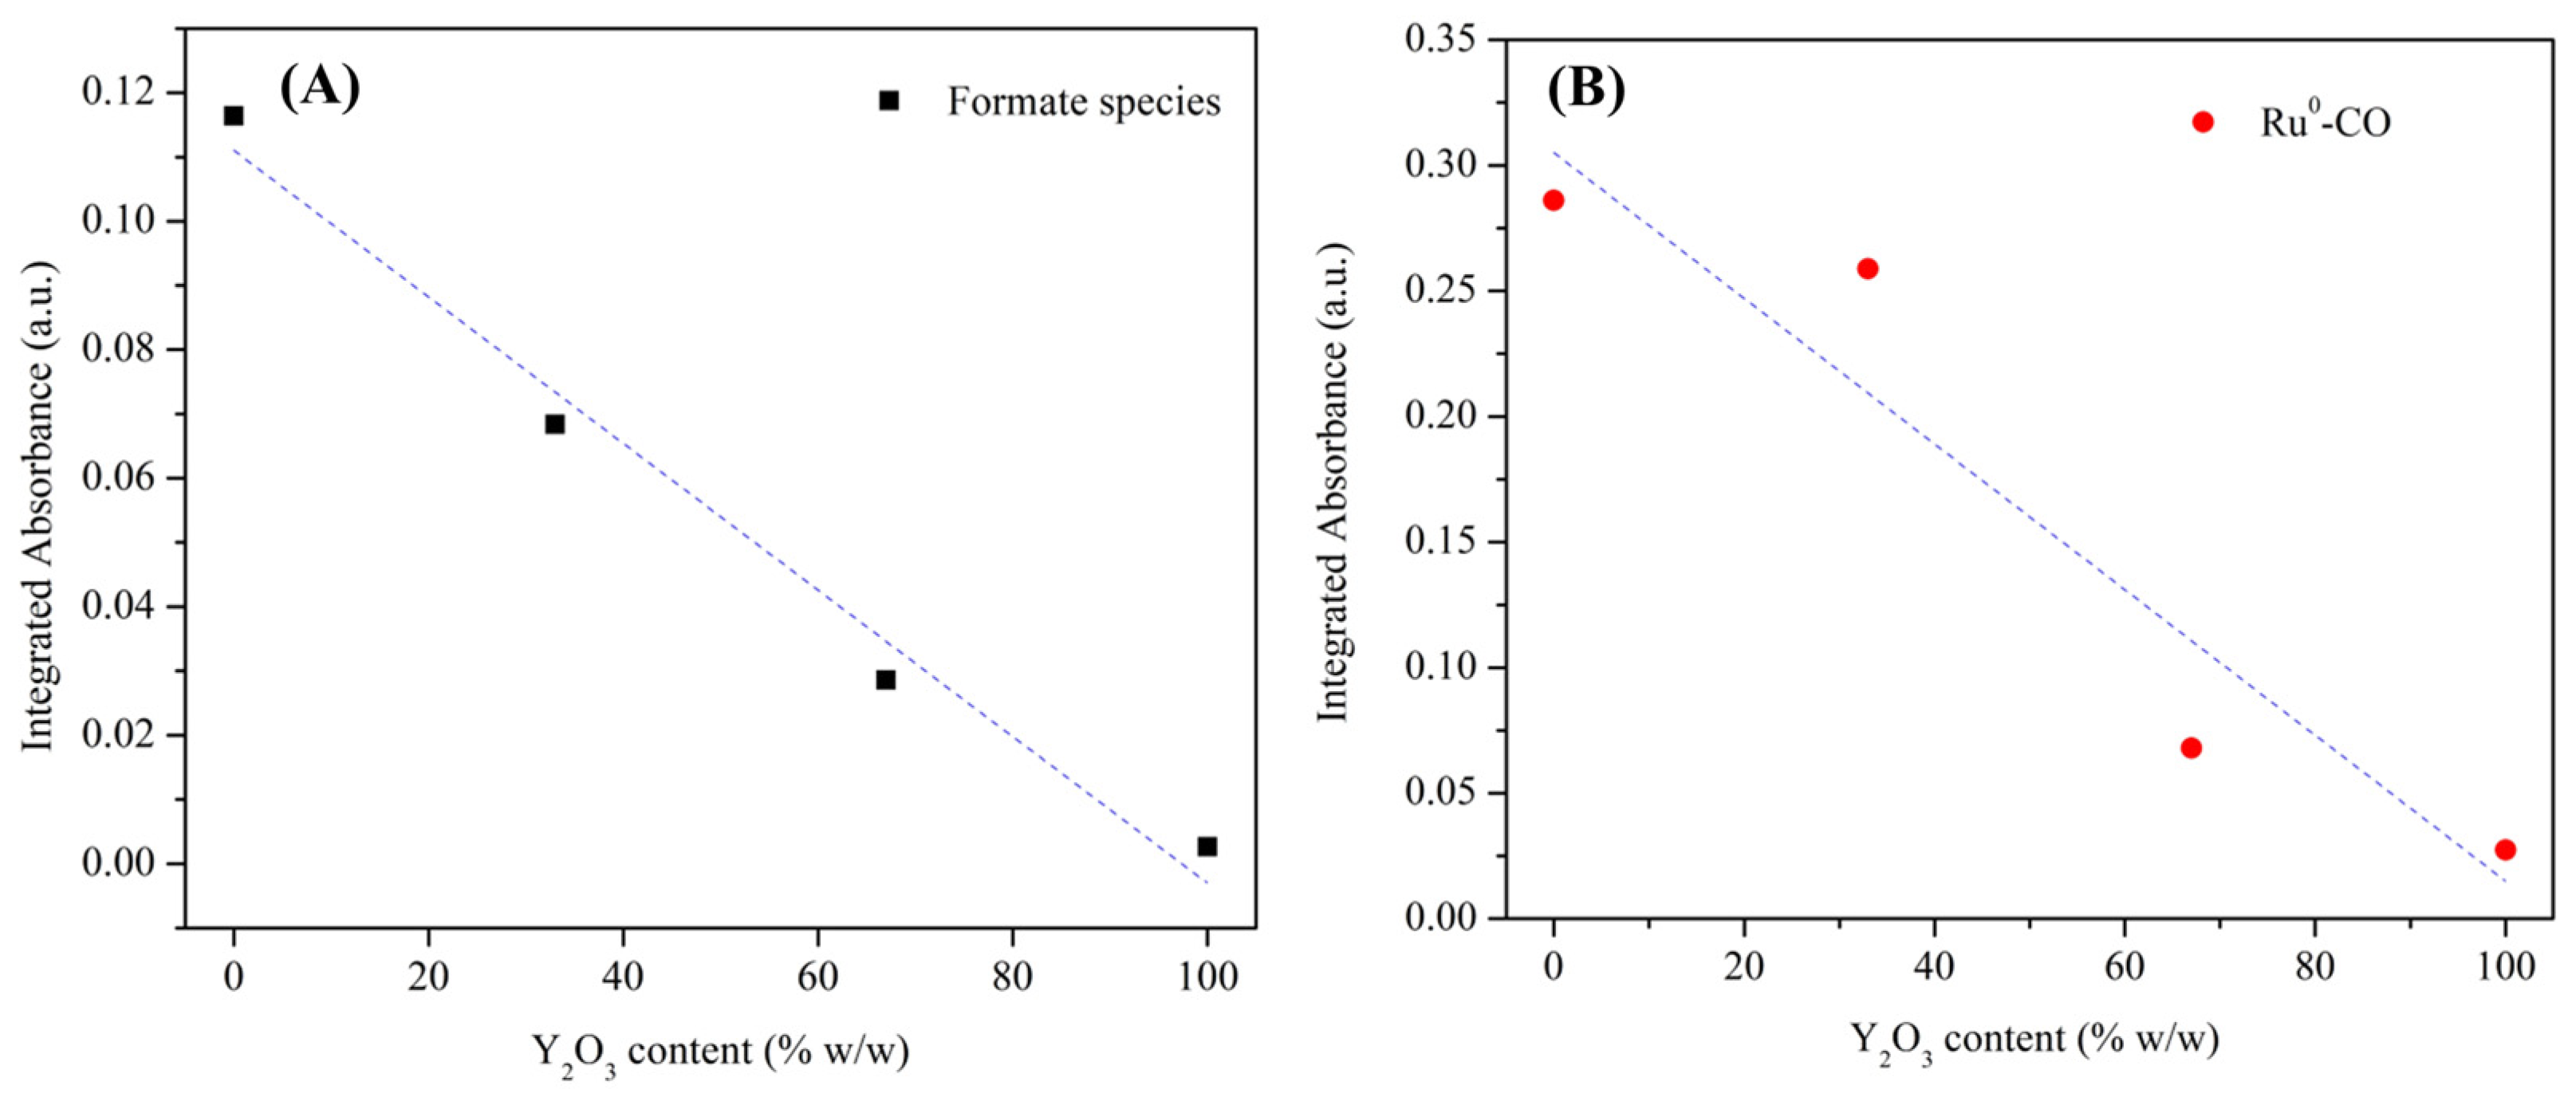
2.3.3. Effect of Y2O3 Addition to Ru/CeO2 over the RWGS Reaction

The catalytic test results demonstrated that all the tested samples were active in catalyzing CO2 transformation (Figure 6). However, there was a significant variation in their catalytic performance. Specifically, the Ru/CeY0 sample exhibited the highest CO2 conversion and selectivity towards CH4 (Figure 6 and Figure 7). In contrast, the Y2O3-containing samples exhibited a decrease in CO2 conversion but a higher selectivity towards CO compared to the Ru/CeY0 sample. This suggests that the Ru/CeO2 catalyst predominantly favors CO2 methanation, whereas the Y2O3-containing samples preferentially promote the reverse water–gas shift reaction, which can occur simultaneously under the conditions used in the catalytic tests.
XPS characterization revealed that the incorporation of yttrium oxide into CeO2 reduces the number of surface oxygen vacancies, which are critical sites for CO2 adsorption [64,65]. As shown in Figure 10, a correlation was found between the Y2O3 loading (% w/w) and the concentration of ruthenium carbonyls and formate species, as determined by FTIR. These findings indicate that the addition of yttrium oxide decreases the surface oxygen vacancies, thereby diminishing CO2 activation and resulting in a reduction in CO2 conversion.
FTIR characterization under reaction conditions revealed that both Ru-carbonyls and formate species can be involved in the CO2 catalytic conversion (Figure 9). These results also suggest that CO2 can be adsorbed onto surface oxygen vacancies, as indicated by the appearance of bands at 1520–1519 cm−1 and 1380–1376 cm−1, which correspond to the asymmetric (νa(OCO)) and symmetric (νs(OCO)) stretching vibrations of carbonate species in a monodentate configuration [61,62,63]. These carbonate species can then react with H atoms, generated by dissociative adsorption on Ru0 sites, to form formate species [69,70]. As observed in FTIR spectroscopy, formate species play a key role in the catalysis: in the case of Ru/CeY0, they can be hydrogenated to CH4 on the CeO2 surface (Figure 9A). In contrast, when formate species are located on the Y2O3 surface, they decompose to form carbon monoxide (Figure 9B) in agreement with previous observations [9,82]. In the FTIR characterization under reaction conditions, we observed the formation of surface carbonyl species on Ru0 sites in all samples. However, in the Ru/CeY0 sample, these species can be hydrogenated to methane, while in the Y2O3-containing samples, they predominantly produce carbon monoxide. The specific pathway through which these species are converted to CO or CH4 cannot be fully determined from our FTIR data alone. Based on previous studies, we propose that in the Ru/CeY0 sample, the carbonyl species are entirely hydrogenated to methane on the Ru sites [83,84,85]. In contrast, in the Y2O3-containing samples, these species are likely to desorb as carbon monoxide [86,87,88].

3. Materials and Methods

3.1. Synthesis of Catalyst Powders

The nanocomposite CeO2-Y2O3 and the respective pure metal oxide supports (CeO2 and Y2O3) were synthesized using the inverse microemulsion method. Initially, n-heptane (organic solvent), Triton X-100 (surfactant), and hexanol (cosurfactant) were mixed in proportions like those reported in previous studies [89]. To form the reverse microemulsion, an aqueous solution containing the required amount of Ce(NO3)3 or Y(NO3)3 (or in combination) was prepared and added to the organic phase. Simultaneously, a second microemulsion was prepared, containing the appropriate amount of the hydroxylating agent, tetramethylammonium hydroxide (TMAH), dissolved in water. After stirring for 1 h, the TMAH-containing microemulsion was added to the metal-containing microemulsion, and the mixture was left to react for 18–20 h to allow the precipitation process to complete. Next, the microemulsion containing the precipitated yttrium was combined with another microemulsion of similar composition, in which cerium had already been precipitated by mixing Ce(NO3)3 and TMAH. This final mixed microemulsion, containing both Y and Ce components, was stirred for an additional 20 h. The suspension was then centrifuged, decanted, and thoroughly rinsed with methanol and deionized water. The resulting solids were dried at 100 °C for 12 h. Finally, the powders were calcined in air at 500 °C for 2 h.
For catalyst synthesis, ruthenium was impregnated onto the support material using a wet impregnation method. The support was immersed in an aqueous solution of RuCl3 at room temperature and stirred continuously for 1 h. Afterward, the solvent evaporated at 80 °C. The resulting solid was dried at 100 °C and then calcined at 450 °C for 5 h. The concentration of the RuCl3 solution was carefully adjusted to achieve a metal loading of 1% w/w. The compositions of the samples, including the amounts of Y2O3 and CeO2, as well as their corresponding labels, are provided in Table 1. All reagents were obtained from Sigma-Aldrich (St. Louis, MO, USA).

3.2. Catalysts Characterization

X-ray diffraction (XRD) measurements were conducted using a PANalytical Aeris diffractometer (Malvern Panalytical, Malvern, UK), equipped with a Pixel 1D detector and Cu Kα radiation (λ = 1.5405 Å) at 40 kV and 15 mA. Data were collected over a 2θ range of 20° to 70°, with a step size of 0.021° min−1. UV-Vis diffuse reflectance spectroscopy (DRS) was performed using a Cary 5000 spectrometer (Agilent, Santa Clara, CA, USA). Textural properties were determined from nitrogen adsorption–desorption isotherms recorded at −196 °C using a Micromeritics TriStar 3000 apparatus (Micromeritics, Norcross, GA, USA). X-ray photoelectron spectroscopy (XPS) was performed on fresh samples using a SPECS® spectrometer (SPECS Group, Berlin, Germany), equipped with a PHOIBOS® 150 WAL hemispherical energy analyzer (SPECS Group, Berlin, Germany, angular resolution < 0.5°), and an XR 50 X-ray Al source with a μ-FOCUS 500 X-ray monochromator. The samples were first placed in a stainless-steel holder and degassed at 150 °C for 1 h in the pretreatment chamber before being transferred to the analysis chamber. Charge effects were corrected by referencing the binding energy (BE) of the C 1 s peak of adventitious carbon at 284.8 eV. Peak analysis was performed using the software provided by VG, applying non-linear least squares fitting.
Transmission electron microscopy (TEM) images were acquired using a JEOL JEM-2100F (STEM) microscope (JEOL, Akishima, Japan) operating at 200 kV and 54 μA, equipped with energy-dispersive X-ray spectroscopy (EDX). Prior to analysis, the samples were treated with a flow of 30 mL min−1 of H2 at 400 °C for 1 h, then dispersed in isopropanol using an ultrasonic bath. The suspension was placed on a copper grid, and the solvent evaporated at room temperature.

3.3. Catalytic Tests

The catalytic activity of the samples for CO2 hydrogenation was assessed in a Microactivity Effi continuous-flow reactor (I.D. = 9 mm) from PID-Micromeritics (Micromeritics, Norcross, GA, USA), coupled with an on-line gas chromatograph (Agilent 7890B, Agilent, Santa Clara, CA, USA). The chromatograph was equipped with two columns (HP-5 and Hayesep Q) and a thermal conductivity detector (TCD). For the experiments, 120 mg of each catalyst (particle size = 37 µm) was mixed with an appropriate amount of SiC to achieve a total volume of 1 cm3. The gas hourly space velocity (GHSV) was set to 27,450 h−1. Prior to catalytic tests, the samples were reduced in situ by exposing them to a hydrogen stream (30 mL min−1) at 400 °C for 1 h. Following reduction, the catalysts were stabilized for 3.5 h with a flow of 6 mL min−1 CO2, 24 mL min−1 H2, and 20 mL min−1 N2 at 400 °C. The catalytic performance was evaluated in terms of CO2 conversion (XCO2) and selectivity towards CH4 and CO products (SCH4 or SCO) under steady-state conditions, with temperature variation from 250 °C to 400 °C. These parameters were calculated using the following equations:
X C O 2 ( % ) = F C O 2 i n F C O 2 o u t F C O 2 i n × 100 ,
S C H 4 ( % ) = F C H 4 o u t F C O 2 i n F C O 2 o u t × 100
S C O ( % ) = F C O o u t F C O 2 i n F C O 2 o u t × 100
where Fi is the inlet or outlet molar flow of i component (mol s−1).

3.4. FTIR Characterization Under Reaction Conditions

FTIR spectroscopy under reaction conditions was conducted using an Agilent 660 spectrophotometer (Agilent, Santa Clara, CA, USA), coupled with a transmission cell/flow reactor (ISRI) equipped with ZnSe windows. Self-supporting wafers of the catalysts, with a thickness of 40 mg cm−2, were prepared by pressing the powdered samples at a pressure of 10 × 103 kg·cm−2. Prior to the experiments, the wafers were treated with a reducing mixture (35% H2/65% N2, v/v) flowing at 50 mL min−1 at 400 °C for 1 h. After reduction, the samples were cooled to 100 °C. For the CO2 hydrogenation experiments, the reduced samples were exposed to a reaction mixture (12% CO2/48% H2/40% N2, v/v) flowing at 50 mL min−1, while the temperature in the FTIR cell/flow reactor was gradually increased from 100 °C to 400 °C at a heating rate of 5 °C/min. Simultaneously, IR spectra were recorded with a resolution of ±4 cm−1.

4. Conclusions

A series of Ru/CeO2 materials modified with Y2O3 were successfully synthesized by the inverse microemulsion method. Supported material modification (Y2O3-CeO2) allowed the change in selectivity from methane to RWGS of the CO2 hydrogenation reaction by Y2O3 incorporation. XRD characterization results displayed that the crystallite phase obtained for the materials supported is fluorite (cerium dioxide) and α-Y2O3 for yttrium oxide. HR-TEM images showed the homogeneity dispersion of the elements that form the different catalysts and the formation of the Ru/CeYx nanocomposites. XPS and BET-specific surface area results demonstrate the influence of the incorporation of Y2O3 in CeO2-supported material. The powders of Ru supported on CeO2, Y2O3, and CeO2-Y2O3 were active in catalyzing CO2 and H2 transformation, though their catalytic performances varied significantly. The CeO2-supported Ru sample exhibited the highest CO2 conversion and selectivity towards CH4, indicating that the Ru/CeY0 catalyst primarily favors CO2 methanation. In contrast, the Y2O3-containing samples showed reduced CO2 conversion, with CO being the dominant product, suggesting a shift towards the reverse water–gas shift reaction. XPS characterization revealed that the incorporation of yttrium oxide into CeO2 reduced the number of surface oxygen vacancies, which are key sites for CO2 adsorption. This reduction in oxygen vacancies correlated with a decrease in CO2 activation and conversion, as confirmed by FTIR analysis. FTIR under reaction conditions further highlighted the involvement of Ru-carbonyls and formate species in CO2 catalytic conversion. CO2 adsorption on surface oxygen vacancies led to the formation of carbonate species, which could react with hydrogen atoms from Ru0 sites to produce formate species. These formate species played a pivotal role in the reaction, with Ru/CeY0 promoting their hydrogenation to CH4, while Ru/CeY33 facilitated their decomposition to CO. Additionally, carbonyl species, formed through the dehydroxylation of formate species, could either be hydrogenated to CH4 on Ru/CeY0 or desorbed as CO from Ru/CeY33. These findings provide valuable insights into the different catalytic behaviors of Ru/CeO2 and Ru/CeO2-Y2O3 systems, highlighting the role of surface oxygen vacancies and the interaction of formate and Ru-carbonyl species in determining product selectivity. Although our study shows that the Ru/CeY33 catalyst exhibits the highest catalytic activity for the RWGS reaction, further research is needed to optimize the CeO2-Y2O3 ratio (below 33% w/w Y2O3) as well as the WSHV to maximize CO2 conversion and CO selectivity. Additionally, long-term catalytic stability tests are essential to assess the viability of scaling up the process. The FTIR characterization data provided valuable insights into the surface species formed during CO2 adsorption and their potential involvement in the reaction. However, the exact pathways through which these species, such as formate and Ru-CO, are converted to CO and CH4 could not be definitively determined from our current results. Therefore, further FTIR experiments, involving variations in gas composition and the use of isotopically labeled compounds, are required to gain a more comprehensive understanding of the transformation of these surface species.

Supplementary Materials

The following supporting information can be downloaded at: https://www.mdpi.com/article/10.3390/catal15040301/s1, Figure S1: Elemental mapping and distribution of elements in the Ru/CeY0 material; Figure S2: Elemental mapping and distribution of elements in the Ru/CeY100 material; Figure S3: XPS spectra on Ru 3d (A), Y 3d (B), and Ce 3d (C) zone of the different catalysts synthesized. Figure S4: OV vs. Y2O3 amount in the different catalysts synthesized. Refs. [90,91,92] are cited in Supplementary Materials.

Author Contributions

Conceptualization, A.S.-G. and U.C.-F.; methodology, A.S.-G., K.P.-C., T.A.Z., D.D., J.N.D.d.L. and U.C.-F.; software, A.S.-G., S.F.-M. and U.C.-F.; validation, A.S.-G. and U.C.-F.; formal analysis, A.S.-G. and U.C.-F.; investigation, A.S.-G. and U.C.-F.; resources, T.A.Z., S.F.-M. and U.C.-F.; data curation, A.S.-G., K.P.-C. and U.C.-F.; writing—original draft preparation, A.S.-G. and U.C.-F.; writing—review and editing, A.S.-G., K.P.-C., T.A.Z., D.D., J.N.D.d.L., S.F.-M. and U.C.-F.; visualization, A.S.-G. and U.C.-F.; supervision, A.S.-G. and U.C.-F.; project administration, T.A.Z. and U.C.-F.; funding acquisition, T.A.Z., S.F.-M. and U.C.-F. All authors have read and agreed to the published version of the manuscript.

Funding

Research funded by PAPIIT-DGAPA, UNAM grant projects: IN112922, IN116424 and IV100124.

Data Availability Statement

Data are contained within the article or Supplementary Material.

Acknowledgments

Authors thank P. Casillas for technical support.

Conflicts of Interest

The authors declare no conflicts of interest.

References

  1. Al-Ghussain, L. Global Warming: Review on Driving Forces and Mitigation. Environ. Prog. Sustain. Energy 2019, 38, 13–21. [Google Scholar] [CrossRef]
  2. Faria, C.; Rocha, C.; Miguel, C.; Rodrigues, A.; Madeira, L.M. Process Intensification Concepts for CO2 Methanation—A Review. Fuel 2025, 386, 134269. [Google Scholar] [CrossRef]
  3. Müller, K.; Mokrushina, L.; Arlt, W. Thermodynamic Constraints for the Utilization of CO2. Chem. Ing. Tech. 2014, 86, 497–503. [Google Scholar] [CrossRef]
  4. Ye, R.P.; Ding, J.; Gong, W.; Argyle, M.D.; Zhong, Q.; Wang, Y.; Russell, C.K.; Xu, Z.; Russell, A.G.; Li, Q. CO2 Hydrogenation to High-Value Products via Heterogeneous Catalysis. Nat. Commun. 2019, 10, 5698. [Google Scholar] [CrossRef]
  5. Saeidi, S.; Najari, S.; Hessel, V.; Wilson, K.; Keil, F.J.; Concepción, P.; Suib, S.L.; Rodrigues, A.E. Recent Advances in CO2 Hydrogenation to Value-Added Products—Current Challenges and Future Directions. Prog. Energy Combust. Sci. 2021, 85, 100905. [Google Scholar] [CrossRef]
  6. Zhou, W.; Cheng, K.; Kang, J.; Zhou, C.; Subramanian, V.; Zhang, Q.; Wang, Y. New Horizon in C1 Chemistry: Breaking the Selectivity Limitation in Transformation of Syngas and Hydrogenation of CO2 into Hydrocarbon Chemicals and Fuels. Chem. Soc. Rev. 2019, 48, 3193–3228. [Google Scholar] [CrossRef]
  7. Bahmanpour, A.M.; Signorile, M.; Kröcher, O. Recent Progress in Syngas Production via Catalytic CO2 Hydrogenation Reaction. Appl. Catal. B 2021, 295, 120319. [Google Scholar] [CrossRef]
  8. Yamaoka, M.; Tomozawa, K.; Sumiyoshi, K.; Ueda, T.; Ogo, S. Efficient Reverse Water Gas Shift Reaction at Low Temperatures over an Iron Supported Catalyst under an Electric Field. Sci. Rep. 2024, 14, 10216. [Google Scholar] [CrossRef] [PubMed]
  9. Choi, Y.; Sim, G.D.; Jung, U.; Park, Y.; Youn, M.H.; Chun, D.H.; Rhim, G.B.; Kim, K.Y.; Koo, K.Y. Copper Catalysts for CO2 Hydrogenation to CO through Reverse Water–Gas Shift Reaction for e-Fuel Production: Fundamentals, Recent Advances, and Prospects. Chem. Eng. J. 2024, 492, 152283. [Google Scholar] [CrossRef]
  10. González-Castaño, M.; Dorneanu, B.; Arellano-García, H. The Reverse Water Gas Shift Reaction: A Process Systems Engineering Perspective. React. Chem. Eng. 2021, 6, 954–976. [Google Scholar] [CrossRef]
  11. Oshima, K.; Shinagawa, T.; Nogami, Y.; Manabe, R.; Ogo, S.; Sekine, Y. Low Temperature Catalytic Reverse Water Gas Shift Reaction Assisted by an Electric Field. Catal. Today 2014, 232, 27–32. [Google Scholar] [CrossRef]
  12. Zhu, M.; Ge, Q.; Zhu, X. Catalytic Reduction of CO2 to CO via Reverse Water Gas Shift Reaction: Recent Advances in the Design of Active and Selective Supported Metal Catalysts. Trans. Tianjin Univ. 2020, 26, 172–187. [Google Scholar]
  13. Zamljen, A.; Lavrič, Ž.; Prašnikar, A.; Teržan, J.; Grilc, M.; Meden, A.; Likozar, B. Understanding Platinum-Based H2 Adsorption/Desorption Kinetics during Catalytic Hydrogenation or Hydrogen Storage-Related Reactions. Renew. Energy 2024, 226, 120467. [Google Scholar]
  14. Tierney, H.L.; Baber, A.E.; Kitchin, J.R.; Sykes, E.C.H. Hydrogen Dissociation and Spillover on Individual Isolated Palladium Atoms. Phys. Rev. Lett. 2009, 103, 246102. [Google Scholar] [CrossRef]
  15. Liu, X.; Sun, L.; Deng, W.-Q. Theoretical Investigation of CO2 Adsorption and Dissociation on Low Index Surfaces of Transition Metals. J. Phys. Chem. C 2018, 122, 8306–8314. [Google Scholar]
  16. Halasi, G.; Schubert, G.; Solymosi, F. Comparative Study on the Photocatalytic Decomposition of Methanol on TiO2 Modified by N and Promoted by Metals. J. Catal. 2012, 294, 199–206. [Google Scholar]
  17. Kattel, S.; Yan, B.; Chen, J.G.; Liu, P. CO2 Hydrogenation on Pt, Pt/SiO2 and Pt/TiO2: Importance of Synergy between Pt and Oxide Support. J. Catal. 2016, 343, 115–126. [Google Scholar] [CrossRef]
  18. Pachecka, M.; Sturm, J.M.; Lee, C.J.; Bijkerk, F. Adsorption and Dissociation of CO2 on Ru (0001). J. Phys. Chem. C 2017, 121, 6729–6735. [Google Scholar]
  19. López-Rodríguez, S.; Davo-Quinonero, A.; Bailón-García, E.; Lozano-Castello, D.; Herrera, F.C.; Pellegrin, E.; Escudero, C.; García-Melchor, M.; Bueno-López, A. Elucidating the Role of the Metal Catalyst and Oxide Support in the Ru/CeO2-Catalyzed CO2 Methanation Mechanism. J. Phys. Chem. C 2021, 125, 25533–25544. [Google Scholar] [CrossRef]
  20. Rose, F.; Tatarkhanov, M.; Fomin, E.; Salmeron, M. Nature of the Dissociation Sites of Hydrogen Molecules on Ru (001). J. Phys. Chem. C 2007, 111, 19052–19057. [Google Scholar]
  21. Peng, Z.; Wang, H.; Zhou, L.; Wang, Y.; Gao, J.; Liu, G.; Redfern, S.A.T.; Feng, X.; Lu, S.; Li, B. Hollow Carbon Shells Enhanced by Confined Ruthenium as Cost-Efficient and Superior Catalysts for the Alkaline Hydrogen Evolution Reaction. J. Mater. Chem. A Mater. 2019, 7, 6676–6685. [Google Scholar] [CrossRef]
  22. Ehlers, A.W.; Frenking, G. Structures and Bond Energies of the Transition-Metal Carbonyls M(CO)5 (M = Fe, Ru, Os) and M(CO)4 (M = Ni, Pd, Pt). Organometallics 1995, 14, 423–426. [Google Scholar] [CrossRef]
  23. Ziegler, T.; Tschinke, V.; Ursenbach, C. Thermal Stability and Kinetic Lability of the Metal Carbonyl Bond. A Theoretical Study on M(CO)6 (M = Chromium, Molybdenum, Tungsten), M(CO)5 (M = Iron, Ruthenium, Osmium), and M(CO)4 (M = Nickel, Palladium, Platinum). J. Am. Chem. Soc. 1987, 109, 4825–4837. [Google Scholar] [CrossRef]
  24. Li, Y.; Zhang, Y.; Qian, K.; Huang, W. Metal–Support Interactions in Metal/Oxide Catalysts and Oxide–Metal Interactions in Oxide/Metal Inverse Catalysts. ACS Catal. 2022, 12, 1268–1287. [Google Scholar] [CrossRef]
  25. Li, M.; Yan, W.; Liu, M.; Liu, C.-J. Improved Activity of Ru/CeO2 Catalyst for CO2 Methanation by Enhanced Electronic Metal–Support Interaction. Energy Fuels 2024, 39, 604–613. [Google Scholar] [CrossRef]
  26. Dai, L.; Li, B.; Peng, Y.; Hao, X.; Xuan, R.; Huang, H.; Bi, Y.; Xu, L.; Zhang, Y.; Guo, Y. Tuning Interaction Strength between CeO2 and Iridium to Promote CO Oxidation over Ir/TiO2. J. Rare Earths 2024, 42, 651–659. [Google Scholar] [CrossRef]
  27. Ro, I.; Resasco, J.; Christopher, P. Approaches for Understanding and Controlling Interfacial Effects in Oxide-Supported Metal Catalysts. ACS Catal. 2018, 8, 7368–7387. [Google Scholar] [CrossRef]
  28. van Deelen, T.W.; Hernández Mejía, C.; de Jong, K.P. Control of Metal-Support Interactions in Heterogeneous Catalysts to Enhance Activity and Selectivity. Nat. Catal. 2019, 2, 955–970. [Google Scholar] [CrossRef]
  29. Liu, H.-X.; Li, S.-Q.; Wang, W.-W.; Yu, W.-Z.; Zhang, W.-J.; Ma, C.; Jia, C.-J. Partially Sintered Copper—Ceria as Excellent Catalyst for the High-Temperature Reverse Water Gas Shift Reaction. Nat. Commun. 2022, 13, 867. [Google Scholar] [CrossRef]
  30. Qiao, Y.; He, J.; Zhou, Y.; Wu, S.; Li, X.; Jiang, G.; Jiang, G.; Demir, M.; Ma, P. Flexible All-Solid-State Asymmetric Supercapacitors Based on PPy-Decorated SrFeO3−δ Perovskites on Carbon Cloth. ACS Appl. Mater. Interfaces 2023, 15, 52381–52391. [Google Scholar] [CrossRef]
  31. Zhang, B.; Huang, S.; Li, Y.; Shen, J.; Tian, X.; Ding, M. Highly Dispersed Cu on Hollow Spherical CeO2: An Efficient and Stable Catalyst for the RWGS Reaction. Appl. Catal. B Environ. Energy 2025, 366, 125003. [Google Scholar] [CrossRef]
  32. Fan, Y.; Li, R.; Wang, B.; Feng, X.; Du, X.; Liu, C.; Wang, F.; Liu, C.; Dong, C.; Ning, Y. Water-Assisted Oxidative Redispersion of Cu Particles through Formation of Cu Hydroxide at Room Temperature. Nat. Commun. 2024, 15, 3046. [Google Scholar] [CrossRef] [PubMed]
  33. Yang, Q.; Zhang, B.; Chen, D.; Li, Y.; Feng, C.; Du, W. Mechanochemistry Strategy in Metal/Fe3O4 with High Stability for Superior Chemoselective Catalysis. ACS Appl. Mater. Interfaces 2024, 16, 66219–66229. [Google Scholar] [CrossRef]
  34. Yu, Y.; Xia, W.; Yu, A.; Simakov, D.S.A.; Ricardez-Sandoval, L. Transition-Metal-Doped CeO2 for the Reverse Water-Gas Shift Reaction: An Experimental and Theoretical Study on CO2 Adsorption and Surface Vacancy Effects. ChemSusChem 2025, 18, e202400681. [Google Scholar] [CrossRef]
  35. Lin, L.; Yao, S.; Liu, Z.; Zhang, F.; Li, N.; Vovchok, D.; Martínez-Arias, A.; Castaneda, R.; Lin, J.; Senanayake, S.D. In Situ Characterization of Cu/CeO2 Nanocatalysts for CO2 Hydrogenation: Morphological Effects of Nanostructured Ceria on the Catalytic Activity. J. Phys. Chem. C 2018, 122, 12934–12943. [Google Scholar] [CrossRef]
  36. Quindimil, A.; De-La-Torre, U.; Pereda-Ayo, B.; Davó-Quiñonero, A.; Bailón-García, E.; Lozano-Castello, D.; González-Marcos, J.A.; Bueno-Lopez, A.; González-Velasco, J.R. Effect of Metal Loading on the CO2 Methanation: A Comparison between Alumina Supported Ni and Ru Catalysts. Catal. Today 2020, 356, 419–432. [Google Scholar] [CrossRef]
  37. Wang, F.; He, S.; Chen, H.; Wang, B.; Zheng, L.; Wei, M.; Evans, D.G.; Duan, X. Active Site Dependent Reaction Mechanism over Ru/CeO2 Catalyst toward CO2 Methanation. J. Am. Chem. Soc. 2016, 138, 6298–6305. [Google Scholar] [CrossRef]
  38. Lee, S.M.; Kim, G.J.; Lee, S.H.; Hwang, I.H.; Hong, S.C.; Kim, S.S. Catalytic Performance of Ce0.6Y0.4O2-Supported Platinum Catalyst for Low-Temperature Water–Gas Shift Reaction. ACS Omega 2018, 3, 3156–3163. [Google Scholar] [CrossRef] [PubMed]
  39. Ortiz-Domínguez, M.C.; Solis-García, A.; Venezia, A.M.; Jimenez-Lam, S.; Fuentes-Moyado, S.; Ponce-Pérez, R.; Guerrero-Sanchez, J.; Pacheco-Sosa, J.G.; de León, J.N.D. The Role of Ga and Y on Binary Al2O3-Y2O3 and Al2O3-Ga2O3 Mixed Oxides Nanoparticles towards Potential Ni Water-Gas Shift Catalysts. Nano-Struct. Nano-Objects 2024, 38, 101165. [Google Scholar] [CrossRef]
  40. Lee, Y.H.; Ahn, J.Y.; Nguyen, D.D.; Chang, S.W.; Kim, S.S.; Lee, S.M. Role of Oxide Support in Ni Based Catalysts for CO2 Methanation. RSC Adv. 2021, 11, 17648–17657. [Google Scholar] [CrossRef]
  41. Oemar, U.; Hidajat, K.; Kawi, S. High Catalytic Stability of Pd-Ni/Y2O3 Formed by Interfacial Cl for Oxy-CO2 Reforming of CH4. Catal. Today 2017, 281, 276–294. [Google Scholar] [CrossRef]
  42. Hasan, M.; Asakoshi, T.; Muroyama, H.; Matsui, T.; Eguchi, K. CO2 Methanation Mechanism over Ni/Y2O3: An in Situ Diffuse Reflectance Infrared Fourier Transform Spectroscopic Study. Phys. Chem. Chem. Phys. 2021, 23, 5551–5558. [Google Scholar] [CrossRef] [PubMed]
  43. Kim, J.; Shih, P.-C.; Tsao, K.-C.; Pan, Y.-T.; Yin, X.; Sun, C.-J.; Yang, H. High-Performance Pyrochlore-Type Yttrium Ruthenate Electrocatalyst for Oxygen Evolution Reaction in Acidic Media. J. Am. Chem. Soc. 2017, 139, 12076–12083. [Google Scholar] [CrossRef] [PubMed]
  44. Lao, M.; Zhao, G.; Li, P.; Ma, T.; Jiang, Y.; Pan, H.; Dou, S.X.; Sun, W. Manipulating the Coordination Chemistry of Ru—N(O)—C Moieties for Fast Alkaline Hydrogen Evolution Kinetics. Adv. Funct. Mater. 2021, 31, 2100698. [Google Scholar] [CrossRef]
  45. Caudillo-Flores, U.; Carrales-Alvarado, D.H.; Rodríguez-Ramos, I.; Fernández-García, M.; Kubacka, A. Synergistic, Dual Energy Source Production of Hydrogen Using Ru-Promoted Nitrogen-Doped Carbon Nanotubes. Carbon 2024, 221, 118903. [Google Scholar] [CrossRef]
  46. Liu, M.; Liu, W.; Liu, X.; Ouyang, Y.; Hou, H.; Lei, M.; Wei, Z. Yttrium Oxide as a Q-Switcher for the near-Infrared Erbium-Doped Fiber Laser. Nanophotonics 2020, 9, 2887–2894. [Google Scholar] [CrossRef]
  47. Mongstad, T.; Thøgersen, A.; Subrahmanyam, A.; Karazhanov, S. The Electronic State of Thin Films of Yttrium, Yttrium Hydrides and Yttrium Oxide. Sol. Energy Mater. Sol. Cells 2014, 128, 270–274. [Google Scholar] [CrossRef]
  48. Song, J.-B.; Kim, J.-T.; Oh, S.-G.; Yun, J.-Y. Contamination Particles and Plasma Etching Behavior of Atmospheric Plasma Sprayed Y2O3 and YF3 Coatings under NF3 Plasma. Coatings 2019, 9, 102. [Google Scholar] [CrossRef]
  49. Li, N.; Huo, L.; Dong, Q.; Zhu, B.; Huang, L.; Ma, J. RuSe2/CeO2 Heterostructure as a Novel Electrocatalyst for Highly Efficient Alkaline Hydrogen Evolution. Nanotechnology 2023, 35, 115602. [Google Scholar] [CrossRef]
  50. Izquierdo-Colorado, A.; Torres-Torres, G.; Gamboa-Rodríguez, M.T.; Silahua-Pavón, A.A.; Arévalo-Pérez, J.C.; Cervantes-Uribe, A.; Cordero-García, A.; Beltramini, J.N. Catalytic Wet Air Oxidation (CWAO) of Phenol in a Fixed Bed Reactor Using Supported Ru and Ru-Au Catalysts: Effect of Gold and Ce Loading. ChemistrySelect 2019, 4, 1275–1284. [Google Scholar] [CrossRef]
  51. Huang, H.; Dai, Q.; Wang, X. Morphology Effect of Ru/CeO2 Catalysts for the Catalytic Combustion of Chlorobenzene. Appl. Catal. B 2014, 158, 96–105. [Google Scholar] [CrossRef]
  52. Mena-Saucedo, A.; Caudillo-Flores, U.; Kubacka, A.; Fernández-García, M. In2O3-TiO2 Composites for CO2 Photothermocatalytic Valorization. J. Phys. Chem. C 2024, 128, 20923–20932. [Google Scholar] [CrossRef]
  53. Sun, S.; Sun, H.; Guan, S.; Xu, S.; Wu, C. Integrated CO2 Capture and Methanation on Ru/CeO2-MgO Combined Materials: Morphology Effect from CeO2 Support. Fuel 2022, 317, 123420. [Google Scholar] [CrossRef]
  54. López-Rodríguez, S.; Davo-Quinonero, A.; Bailón-García, E.; Lozano-Castello, D.; Bueno-Lopez, A. Effect of Ru Loading on Ru/CeO2 Catalysts for CO2 Methanation. Mol. Catal. 2021, 515, 111911. [Google Scholar]
  55. Sun, C.; Beaunier, P.; La Parola, V.; Liotta, L.F.; Da Costa, P. Ni/CeO2 Nanoparticles Promoted by Yttrium Doping as Catalysts for CO2 Methanation. ACS Appl. Nano Mater. 2020, 3, 12355–12368. [Google Scholar] [CrossRef]
  56. Ro, I.; Sener, C.; Stadelman, T.M.; Ball, M.R.; Venegas, J.M.; Burt, S.P.; Hermans, I.; Dumesic, J.A.; Huber, G.W. Measurement of Intrinsic Catalytic Activity of Pt Monometallic and Pt-MoOx Interfacial Sites over Visible Light Enhanced PtMoOx/SiO2 Catalyst in Reverse Water Gas Shift Reaction. J. Catal. 2016, 344, 784–794. [Google Scholar] [CrossRef]
  57. He, Y.; Huang, D. Single-Atom Platinum Catalyst for Efficient CO2 Conversion via Reverse Water Gas Shift Reaction. Molecules 2023, 28, 6630. [Google Scholar] [CrossRef]
  58. Chen, L.; Kovarik, L.; Szanyi, J. Temperature-Dependent Communication between Pt/Al2O3 Catalysts and Anatase TiO2 Dilutant: The Effects of Metal Migration and Carbon Transfer on the Reverse Water–Gas Shift Reaction. ACS Catal. 2021, 11, 12058–12067. [Google Scholar] [CrossRef]
  59. Dongapure, P.; Bagchi, S.; Mayadevi, S.; Devi, R.N. Variations in Activity of Ru/TiO2 and Ru/Al2O3 Catalysts for CO2 Hydrogenation: An Investigation by in-Situ Infrared Spectroscopy Studies. Mol. Catal. 2020, 482, 110700. [Google Scholar]
  60. Hu, J.; Brooks, K.P.; Holladay, J.D.; Howe, D.T.; Simon, T.M. Catalyst Development for Microchannel Reactors for Martian in Situ Propellant Production. Catal. Today 2007, 125, 103–110. [Google Scholar] [CrossRef]
  61. Yoshikawa, K.; Sato, H.; Kaneeda, M.; Kondo, J.N. Synthesis and Analysis of CO2 Adsorbents Based on Cerium Oxide. J. CO2 Util. 2014, 8, 34–38. [Google Scholar] [CrossRef]
  62. Cárdenas-Arenas, A.; Quindimil, A.; Davó-Quiñonero, A.; Bailón-García, E.; Lozano-Castello, D.; De-La-Torre, U.; Pereda-Ayo, B.; González-Marcos, J.A.; González-Velasco, J.R.; Bueno-López, A. Isotopic and in Situ DRIFTS Study of the CO2 Methanation Mechanism Using Ni/CeO2 and Ni/Al2O3 Catalysts. Appl. Catal. B 2020, 265, 118538. [Google Scholar] [CrossRef]
  63. Fan, L.; Zhang, J.; Ma, K.; Zhang, Y.; Hu, Y.-M.; Kong, L.; Jia, A.; Zhang, Z.; Huang, W.; Lu, J.-Q. Ceria Morphology-Dependent Pd-CeO2 Interaction and Catalysis in CO2 Hydrogenation into Formate. J. Catal. 2021, 397, 116–127. [Google Scholar] [CrossRef]
  64. Wang, Y.; Arandiyan, H.; Scott, J.; Aguey-Zinsou, K.-F.; Amal, R. Single Atom and Nanoclustered Pt Catalysts for Selective CO2 Reduction. ACS Appl. Energy Mater. 2018, 1, 6781–6789. [Google Scholar] [CrossRef]
  65. Liu, Y.; Li, Z.; Xu, H.; Han, Y. Reverse Water–Gas Shift Reaction over Ceria Nanocube Synthesized by Hydrothermal Method. Catal. Commun. 2016, 76, 1–6. [Google Scholar] [CrossRef]
  66. Shido, T.; Iwasawa, Y. Regulation of Reaction Intermediate by Reactant in the Water-Gas Shift Reaction on CeO2, in Relation to Reactant-Promoted Mechanism. J. Catal. 1992, 136, 493–503. [Google Scholar] [CrossRef]
  67. Lustemberg, P.G.; Bosco, M.V.; Bonivardi, A.; Busnengo, H.F.; Ganduglia-Pirovano, M. V Insights into the Nature of Formate Species in the Decomposition and Reaction of Methanol over Cerium Oxide Surfaces: A Combined Infrared Spectroscopy and Density Functional Theory Study. J. Phys. Chem. C 2015, 119, 21452–21464. [Google Scholar] [CrossRef]
  68. Li, C.; Sakata, Y.; Arai, T.; Domen, K.; Maruya, K.; Onishi, T. Adsorption of Carbon Monoxide and Carbon Dioxide on Cerium Oxide Studied by Fourier-Transform Infrared Spectroscopy. Part 2.—Formation of Formate Species on Partially Reduced CeO2 at Room Temperature. J. Chem. Soc. Faraday Trans. 1 Phys. Chem. Condens. Phases 1989, 85, 1451–1461. [Google Scholar] [CrossRef]
  69. González-Rangulan, V.V.; Reyero, I.; Bimbela, F.; Romero-Sarria, F.; Daturi, M.; Gandía, L.M. CO2 Methanation over Nickel Catalysts: Support Effects Investigated through Specific Activity and Operando IR Spectroscopy Measurements. Catalysts 2023, 13, 448. [Google Scholar] [CrossRef]
  70. Falbo, L.; Visconti, C.G.; Lietti, L.; Szanyi, J. The Effect of CO on CO2 Methanation over Ru/Al2O3 Catalysts: A Combined Steady-State Reactivity and Transient DRIFT Spectroscopy Study. Appl. Catal. B 2019, 256, 117791. [Google Scholar] [CrossRef]
  71. Chin, S.Y.; Williams, C.T.; Amiridis, M.D. FTIR Studies of CO Adsorption on Al2O3-and SiO2-Supported Ru Catalysts. J. Phys. Chem. B 2006, 110, 871–882. [Google Scholar] [PubMed]
  72. Hadjiivanov, K.; Lavalley, J.-C.; Lamotte, J.; Maugé, F.; Saint-Just, J.; Che, M. FTIR Study of CO Interaction with Ru/TiO2Catalysts. J. Catal. 1998, 176, 415–425. [Google Scholar]
  73. Solis-Garcia, A.; Zepeda, T.A.; Fierro-Gonzalez, J.C. Spectroscopic Evidence of Surface Species during CO2 Methanation Catalyzed by Supported Metals: A Review. Catal. Today 2022, 394, 2–12. [Google Scholar] [CrossRef]
  74. Podrojková, N.; Sans, V.; Oriňak, A.; Oriňaková, R. Recent Developments in the Modelling of Heterogeneous Catalysts for CO2 Conversion to Chemicals. ChemCatChem 2020, 12, 1802–1825. [Google Scholar]
  75. Zhang, S.-T.; Yan, H.; Wei, M.; Evans, D.G.; Duan, X. Hydrogenation Mechanism of Carbon Dioxide and Carbon Monoxide on Ru (0001) Surface: A Density Functional Theory Study. RSC Adv. 2014, 4, 30241–30249. [Google Scholar]
  76. Fisher, I.A.; Bell, A.T. A Comparative Study of CO and CO2Hydrogenation over Rh/SiO2. J. Catal. 1996, 162, 54–65. [Google Scholar]
  77. Panayotov, D.; Mihaylov, M.; Nihtianova, D.; Spassov, T.; Hadjiivanov, K. Spectral Evidence for Hydrogen-Induced Reversible Segregation of CO Adsorbed on Titania-Supported Rhodium. Phys. Chem. Chem. Phys. 2014, 16, 13136–13144. [Google Scholar] [PubMed]
  78. Azzolina-Jury, F.; Thibault-Starzyk, F. Mechanism of Low Pressure Plasma-Assisted CO2 Hydrogenation over Ni-USY by Microsecond Time-Resolved FTIR Spectroscopy. Top. Catal. 2017, 60, 1709–1721. [Google Scholar] [CrossRef]
  79. Huang, B.; Kobayashi, H.; Yamamoto, T.; Toriyama, T.; Matsumura, S.; Nishida, Y.; Sato, K.; Nagaoka, K.; Haneda, M.; Xie, W. A CO Adsorption Site Change Induced by Copper Substitution in a Ruthenium Catalyst for Enhanced CO Oxidation Activity. Angew. Chem. Int. Ed. 2019, 58, 2230–2235. [Google Scholar]
  80. Köck, E.M.; Kogler, M.; Bielz, T.; Klötzer, B.; Penner, S. In Situ FT-IR Spectroscopic Study of CO2 and CO Adsorption on Y2O3, ZrO2, and Yttria-Stabilized ZrO2. J. Phys. Chem. C 2013, 117, 17666–17673. [Google Scholar] [CrossRef]
  81. Campani, P.; Fang, C.S.; Prengle, H.W. Infrared Absorption Coefficients for Certain Pollutant Gases. Appl. Spectrosc. 1972, 26, 372–378. [Google Scholar] [CrossRef]
  82. Li, Z.-X.; Xu, K.; Wang, W.-W.; Fu, X.-P.; Jia, C. Stabilized Inverse Y2O3/Cu Interfaces Boost the Performance of the Reverse Water–Gas Shift Reaction. Catal. Sci. Technol. 2024, 14, 3483–3492. [Google Scholar] [CrossRef]
  83. Dreyer, J.A.H.; Li, P.; Zhang, L.; Beh, G.K.; Zhang, R.; Sit, P.H.-L.; Teoh, W.Y. Influence of the Oxide Support Reducibility on the CO2 Methanation over Ru-Based Catalysts. Appl. Catal. B 2017, 219, 715–726. [Google Scholar] [CrossRef]
  84. Wang, X.; Hong, Y.; Shi, H.; Szanyi, J. Kinetic Modeling and Transient DRIFTS–MS Studies of CO2 Methanation over Ru/Al2O3 Catalysts. J. Catal. 2016, 343, 185–195. [Google Scholar] [CrossRef]
  85. Eckle, S.; Anfang, H.-G.; Behm, R.J. Reaction Intermediates and Side Products in the Methanation of CO and CO2 over Supported Ru Catalysts in H2-Rich Reformate Gases. J. Phys. Chem. C 2011, 115, 1361–1367. [Google Scholar] [CrossRef]
  86. Yamano, R.; Ogo, S.; Nakano, N.; Higo, T.; Sekine, Y. Non-Conventional Low-Temperature Reverse Water–Gas Shift Reaction over Highly Dispersed Ru Catalysts in an Electric Field. EES Catal. 2023, 1, 125–133. [Google Scholar] [CrossRef]
  87. Chen, L.; Filot, I.A.W.; Hensen, E.J.M. Elucidation of the Reverse Water–Gas Shift Reaction Mechanism over an Isolated Ru Atom on CeO2 (111). J. Phys. Chem. C 2023, 127, 20314–20324. [Google Scholar]
  88. Aitbekova, A.; Wu, L.; Wrasman, C.J.; Boubnov, A.; Hoffman, A.S.; Goodman, E.D.; Bare, S.R.; Cargnello, M. Low-Temperature Restructuring of CeO2-Supported Ru Nanoparticles Determines Selectivity in CO2 Catalytic Reduction. J. Am. Chem. Soc. 2018, 140, 13736–13745. [Google Scholar] [CrossRef]
  89. Caudillo-Flores, U.; Barba-Nieto, I.; Muñoz-Batista, M.J.; Meira, D.M.; Fernández-García, M.; Kubacka, A. Thermo-Photo Production of Hydrogen Using Ternary Pt-CeO2-TiO2 Catalysts: A Spectroscopic and Mechanistic Study. Chem. Eng. J. 2021, 425, 130641. [Google Scholar] [CrossRef]
  90. Atkins, P.W.; De Paula, J.; Keeler, J. Atkins’ Physical Chemistry; Oxford University Press: Oxford, UK, 2023; ISBN 0198847815. [Google Scholar]
  91. Fogler, H.S. Essentials of Chemical Reaction Engineering: Essenti Chemica Reactio Engi; Pearson Education: London, UK, 2010; ISBN 0132317176. [Google Scholar]
  92. Satterfield, C.N. Heterogeneous Catalysis in Industrial Practice. 1991. Available online: https://www.osti.gov/biblio/5495428 (accessed on 19 March 2025).
Figure 1. X-ray diffraction patterns of the samples of Ru supported on CeO2, Y2O3, and CeO2-Y2O3.
Catalysts 15 00301 g001
Figure 2. TEM and HR-TEM of Ru/CeY0 (A,D), Ru/CeY100 (B,E), and Ru/CeY33 (C,F) materials.
Catalysts 15 00301 g002
Figure 3. EDS elemental mapping and distribution of elements in the Ru/CeY33 catalyst.
Catalysts 15 00301 g003
Figure 4. N2 physisorption isotherms (−196 °C) of the samples of Ru supported on CeO2, Y2O3, and CeO2-Y2O3 materials, with inset of BJH pore size distribution.
Catalysts 15 00301 g004
Figure 5. O 1s XPS peak for the CeO2, Y2O3, and CeO2-Y2O3 materials.
Catalysts 15 00301 g005
Figure 6. Steady-state CO2 conversion of the samples of Ru supported on CeO2, Y2O3, and CeO2-Y2O3 as function of the temperature. GHSV = 27,450 h−1 (12% CO2/48% H2/40% N2 v/v).
Catalysts 15 00301 g006
Figure 7. (A) Selectivity towards CH4 and CO for catalysts of Ru supported on CeO2, Y2O3, and CeO2-Y2O3, as a function of temperature under steady-state conditions. The reaction was carried out with a flow of 50 mL of reactive mixture (12% CO2, 48% H2, 40% N2, v/v) at a GHSV of 27,450 h−1. (B) Schematic representation of the Y2O3 influence in the selectivity of the CO2 hydrogenation reaction.
Catalysts 15 00301 g007
Figure 8. (A) RWGS reaction rate and (B) Arrhenius equation plot (XCO2 < 12%) for samples of Ru supported on CeO2, Y2O3, and CeO2-Y2O3, as a function of temperature under steady-state conditions. GHSV = 27,450 h−1 (12% CO2/48% H2/40% N2 v/v).
Catalysts 15 00301 g008
Figure 9. FTIR characterization of the (A) Ru/CeY0 and (B) Ru/CeY33 sample under the flow of the reactive mixture (12% CO2/48% H2/40% N2, v/v) at increasing temperatures at a heating rate of 5 °C/min.
Catalysts 15 00301 g009
Figure 10. Correlation between (A) yttrium oxide content (% w/w) and the area of the ν(CH) band associated with formate species, and (B) yttrium oxide content (% w/w) and area of the ν(CO) band associated with Ru0-CO species.
Catalysts 15 00301 g010
Table 1. Composition of the support, textural properties, and lattice parameters of the samples a.
SampleCeO2-Y2O3 b (%w/w)BET Area c (m2 g−1)Pore Volume c (cm3 g−1)Pore Diameter c (nm)a0 CeO2 d (Å)
Ru/CeY0100-0106.30.2477.55.41
Ru/CeY3367-3365.90.1067.45.40
Ru/CeY6634-6651.80.1118.75.40
Ru/CeY1000-10041.70.1079.410.64 Y2O3
a The theoretical Ru load in the catalysts was fixed at 1%; b nominal support composition; c determined by N2 physisorption (−196 °C); d  a 0 = h 2 + k 2 + l 2 λ 2 s e n θ .
Table 2. XPS Y/Ce, and Ce3+/Ce4+ atomic ratios, and OV (%), obtained from XPS analysis.
SampleY/CeCe3+/Ce4+Ov (%)
Ru/CeY0----------25.1
Ru/CeY331.10.1022.7
Ru/CeY662.30.1118.3
Ru/CeY100-----0.1116.8
Table 3. Comparison of the catalytic activity of different supported Ru catalysts for CO2 hydrogenation reactions.
SampleTemp (°C)GHSV (h−1)Inlet Gas Composition (%v/v)XCO2 (%)SCO (%)REF
0.5% Ru/TiO232514,40010% CO2/40% H2/50% H2600[59]
0.5% Ru/Al2O332514,40010% CO2/40% H2/50% H2300[59]
3.0% Ru/SiO235045,00020% CO2/80% H2460.1[60]
3.0% Ru/TiO235045,00020% CO2/80% H264.10.1[60]
4.0% Ru/CeO2325900016% CO2/64% H2/20% N2900.1[19]
Ru/CeY035027,45016% CO2/64% H2/20% N235.64.9%This work
Ru/CeY3335027,45016% CO2/64% H2/20% N26.297.7%This work
Disclaimer/Publisher’s Note: The statements, opinions and data contained in all publications are solely those of the individual author(s) and contributor(s) and not of MDPI and/or the editor(s). MDPI and/or the editor(s) disclaim responsibility for any injury to people or property resulting from any ideas, methods, instructions or products referred to in the content.

