


Immobilization of Enzymes on Electrodes and Electrode Design in Biofuel Cells


Abstract
1. Introduction
2. Results and Discussion
2.1. Cyclic Voltammetry Analysis of the Electrodes
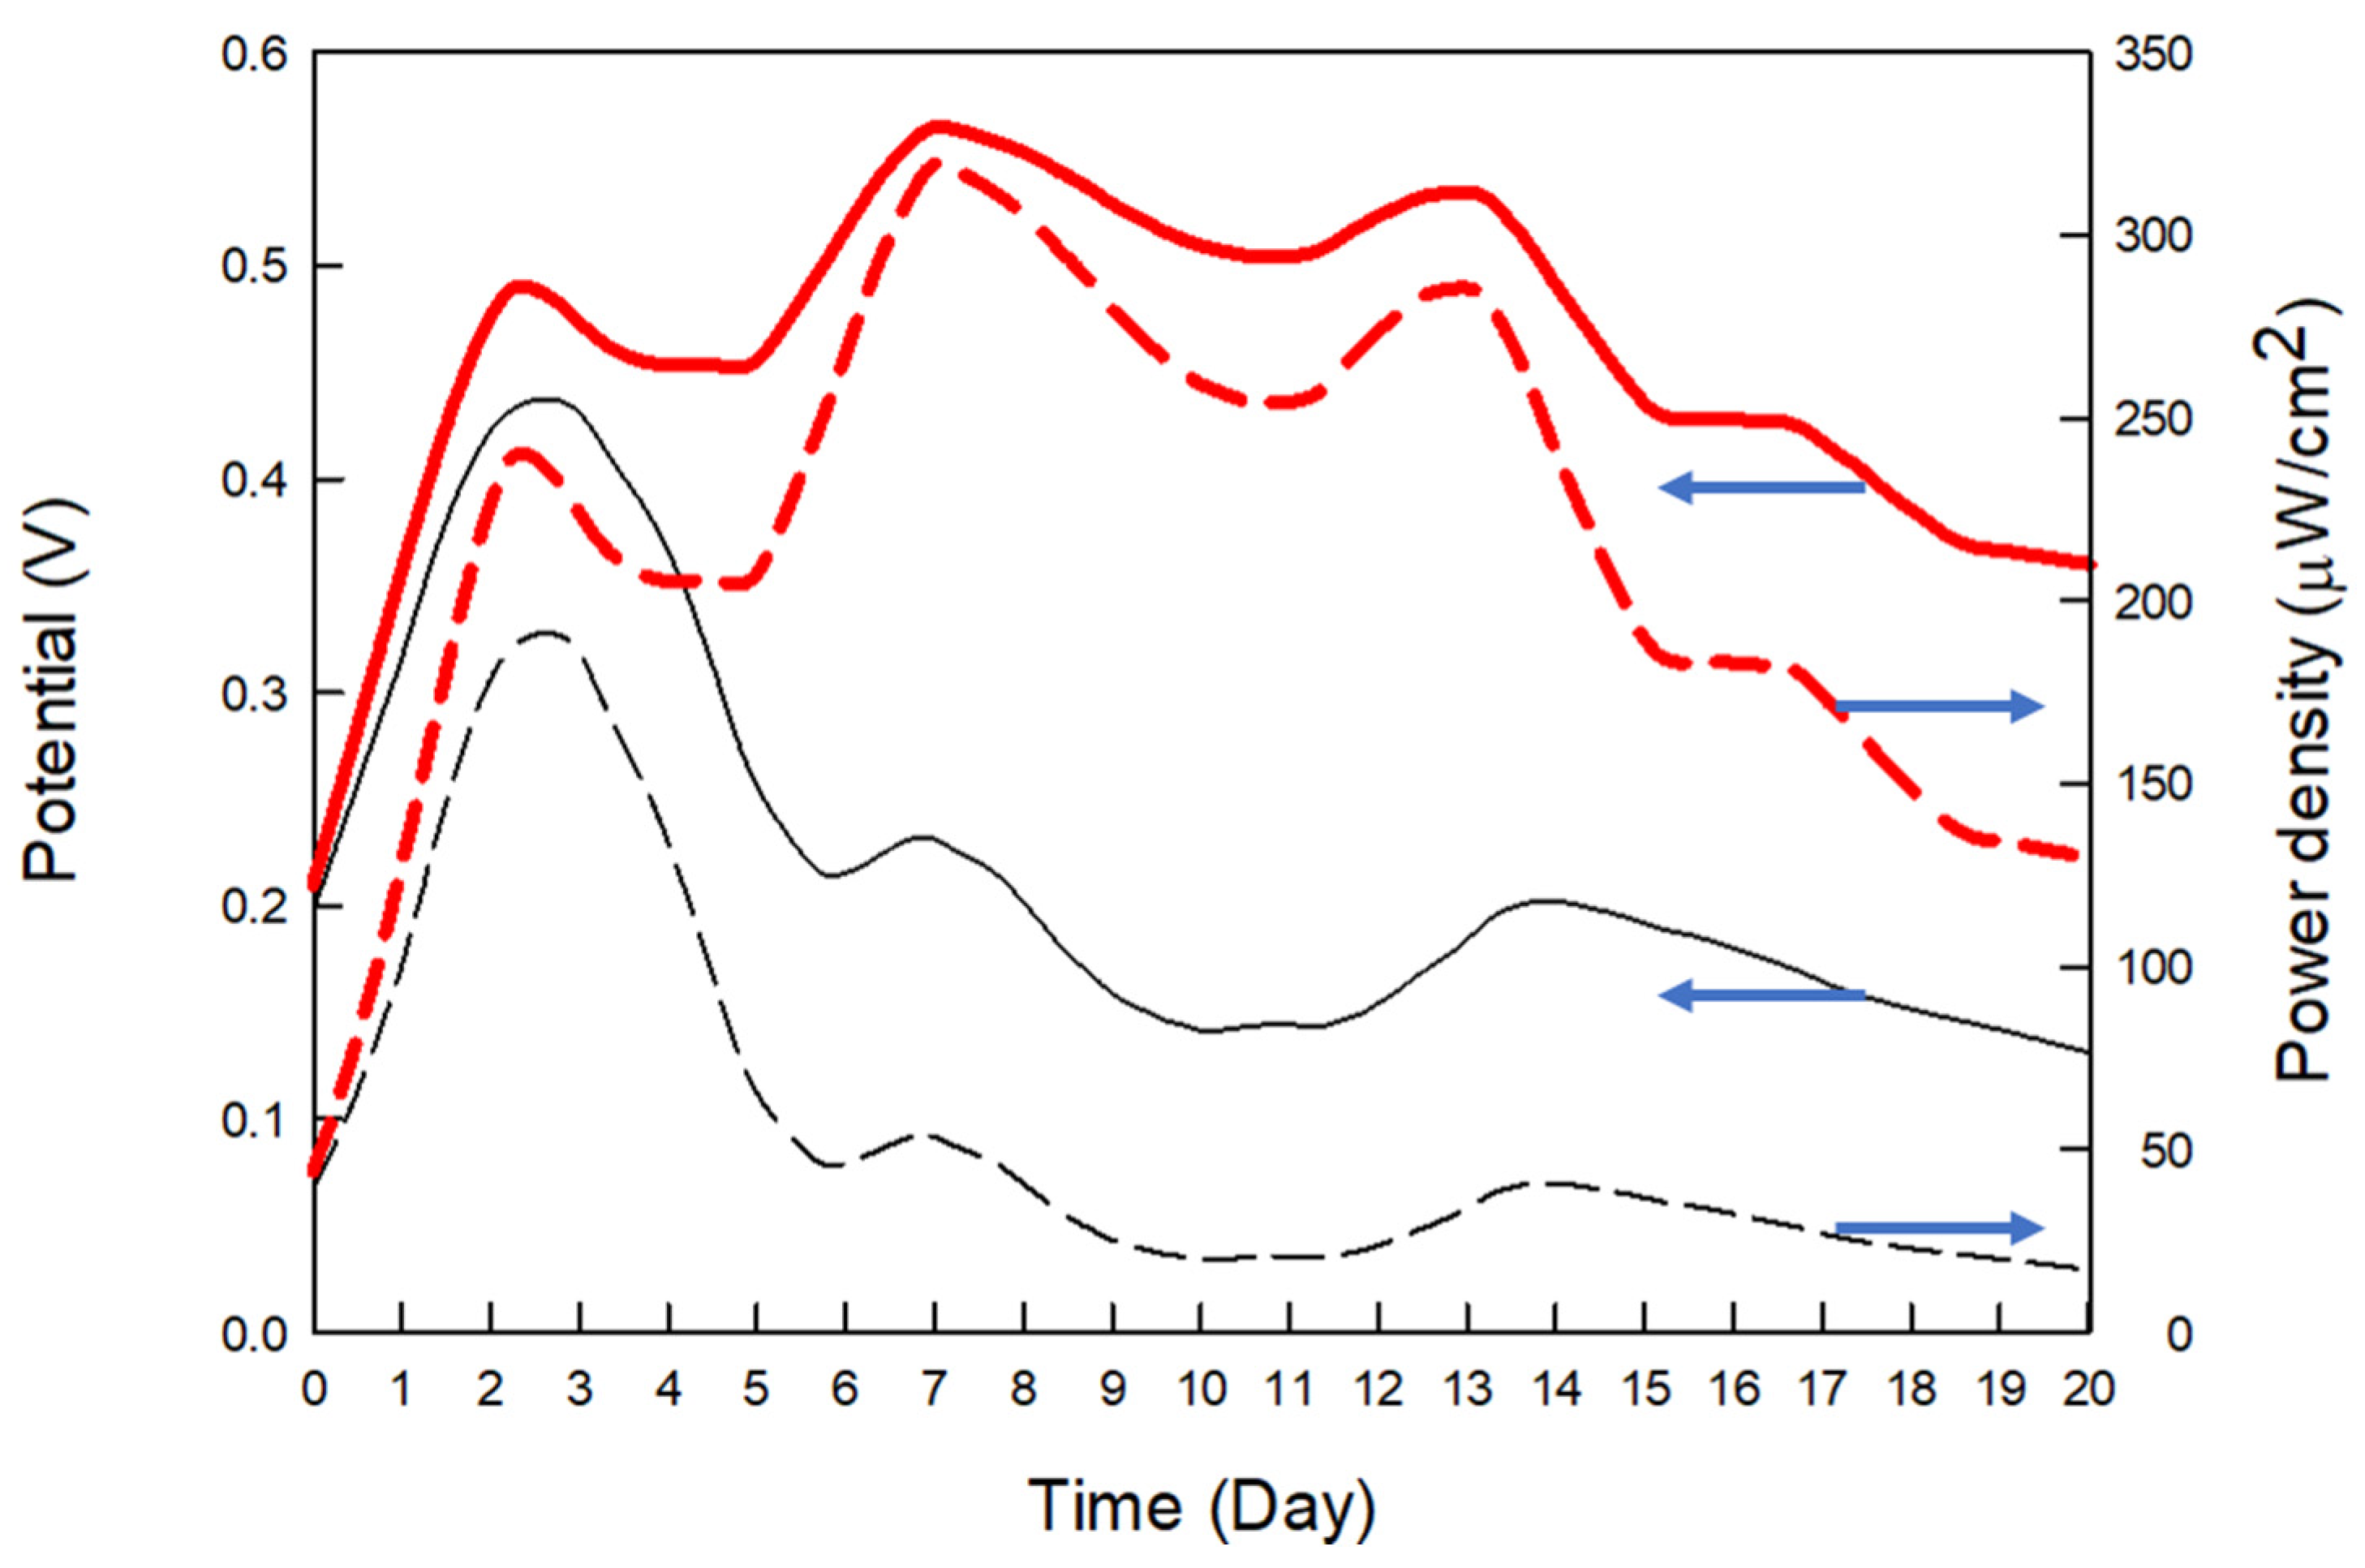
2.2. EBFC Performance Test Analysis

| Cell | A1C1 | A1C2 | A1C3 | A1C4 | A1C5 | A1C6 | A1C7 | A1C8 | A1C9 |
| Initial voltage (V) | 0.422 | 0.377 | 0.390 | 0.409 | 0.513 | 0.458 | 0.262 | 0.329 | 0.500 |
| Power density (μW/cm2) | 178.1 | 141.8 | 152.3 | 167.3 | 263.3 | 209.4 | 68.7 | 107.9 | 249.7 |
| Cell | A2C1 | A2C2 | A2C3 | A2C4 | A2C5 | A2C6 | A2C7 | A2C8 | A2C9 |
| Initial voltage (V) | 0.534 | 0.355 | 0.414 | 0.428 | 0.491 | 0.406 | 0.380 | 0.277 | 0.515 |
| Power density (μW/cm2) | 285.5 | 125.9 | 171.3 | 183.3 | 241.5 | 164.8 | 144.1 | 76.6 | 264.8 |
| Cell | A3C1 | A3C2 | A3C3 | A3C4 | A3C5 | A3C6 | A3C7 | A3C8 | A3C9 |
| Initial voltage (V) | 0.482 | 0.374 | 0.476 | 0.387 | 0.429 | 0.377 | 0.415 | 0.244 | 0.513 |
| Power density (μW/cm2) | 232.4 | 139.6 | 226.3 | 149.7 | 184.4 | 142.3 | 172.5 | 59.6 | 263.2 |
| Cell | A4C1 | A4C2 | A4C3 | A4C4 | A4C5 | A4C6 | A4C7 | A4C8 | A4C9 |
| Initial voltage (V) | 0.394 | 0.390 | 0.381 | 0.397 | 0.407 | 0.399 | 0.359 | 0.303 | 0.542 |
| Power density (μW/cm2) | 155.2 | 151.9 | 145.2 | 157.4 | 166.0 | 159.1 | 129.0 | 91.8 | 293.5 |
| Cell | A5C1 | A5C2 | A5C3 | A5C4 | A5C5 | A5C6 | A5C7 | A5C8 | A5C9 |
| Initial voltage (V) | 0.433 | 0.370 | 0.361 | 0.376 | 0.308 | 0.442 | 0.366 | 0.324 | 0.469 |
| Power density (μW/cm2) | 187.1 | 137.1 | 130.3 | 141.6 | 94.7 | 195.3 | 133.7 | 105.2 | 220.2 |
| Cell | A6C1 | A6C2 | A6C3 | A6C4 | A6C5 | A6C6 | A6C7 | A6C8 | A6C9 |
| Initial voltage (V) | 0.388 | 0.400 | 0.400 | 0.270 | 0.406 | 0.417 | 0.396 | 0.362 | 0.479 |
| Power density (μW/cm2) | 150.3 | 160.3 | 159.6 | 73.1 | 165.0 | 173.7 | 156.7 | 131.2 | 229.2 |
| Cell | A7C1 | A7C2 | A7C3 | A7C4 | A7C5 | A7C6 | A7C7 | A7C8 | A7C9 |
| Initial voltage (V) | 0.421 | 0.379 | 0.398 | 0.271 | 0.373 | 0.391 | 0.472 | 0.329 | 0.459 |
| Power density (μW/cm2) | 177.5 | 144.0 | 158.4 | 73.7 | 139.4 | 153.1 | 222.4 | 108.5 | 211.0 |
| Cell | A8C1 | A8C2 | A8C3 | A8C4 | A8C5 | A8C6 | A8C7 | A8C8 | A8C9 |
| Initial voltage (V) | 0.397 | 0.437 | 0.441 | 0.287 | 0.482 | 0.344 | 0.432 | 0.328 | 0.446 |
| Power density (μW/cm2) | 157.9 | 191.3 | 194.5 | 82.4 | 232.8 | 118.4 | 186.8 | 107.6 | 199.3 |
| Cell | A9C1 | A9C2 | A9C3 | A9C4 | A9C5 | A9C6 | A9C7 | A9C8 | A9C9 |
| Initial voltage (V) | 0.380 | 0.353 | 0.377 | 0.378 | 0.455 | 0.382 | 0.354 | 0.369 | 0.512 |
| Power density (μW/cm2) | 144.2 | 124.3 | 142.3 | 142.6 | 206.6 | 145.6 | 125.2 | 136.0 | 261.7 |
| Cell | A1C1 | A1C2 | A1C3 | A1C4 | A1C5 | A1C6 | A1C7 | A1C8 | A1C9 |
| TOE (J) | 655 | 700 | 672 | 498 | 801 | 756 | 438 | 486 | 919 |
| Cell | A2C1 | A2C2 | A2C3 | A2C4 | A2C5 | A2C6 | A2C7 | A2C8 | A2C9 |
| TOE (J) | 877 | 738 | 819 | 574 | 902 | 808 | 484 | 529 | 1020 |
| Cell | A3C1 | A3C2 | A3C3 | A3C4 | A3C5 | A3C6 | A3C7 | A3C8 | A3C9 |
| TOE (J) | 774 | 673 | 941 | 577 | 876 | 719 | 576 | 501 | 981 |
| Cell | A4C1 | A4C2 | A4C3 | A4C4 | A4C5 | A4C6 | A4C7 | A4C8 | A4C9 |
| TOE (J) | 611 | 647 | 574 | 423 | 650 | 673 | 496 | 432 | 922 |
| Cell | A5C1 | A5C2 | A5C3 | A5C4 | A5C5 | A5C6 | A5C7 | A5C8 | A5C9 |
| TOE (J) | 655 | 546 | 684 | 388 | 646 | 684 | 480 | 430 | 868 |
| Cell | A6C1 | A6C2 | A6C3 | A6C4 | A6C5 | A6C6 | A6C7 | A6C8 | A6C9 |
| TOE (J) | 764 | 748 | 754 | 530 | 907 | 800 | 654 | 635 | 948 |
| Cell | A7C1 | A7C2 | A7C3 | A7C4 | A7C5 | A7C6 | A7C7 | A7C8 | A7C9 |
| TOE (J) | 671 | 582 | 602 | 442 | 782 | 697 | 515 | 456 | 844 |
| Cell | A8C1 | A8C2 | A8C3 | A8C4 | A8C5 | A8C6 | A8C7 | A8C8 | A8C9 |
| TOE (J) | 631 | 611 | 803 | 424 | 784 | 809 | 493 | 490 | 777 |
| Cell | A9C1 | A9C2 | A9C3 | A9C4 | A9C5 | A9C6 | A9C7 | A9C8 | A9C9 |
| TOE (J) | 640 | 561 | 568 | 391 | 813 | 548 | 336 | 415 | 920 |
3. Materials and Methods
3.1. Chemicals
3.2. Electrolyte Solution
3.3. Preparation of the Enzyme Solution and Immobilization Technique
3.4. Performance Test of the EBFC
3.5. Cyclic Voltammetry with Half-Cell Analysis
4. Conclusions
Author Contributions
Funding
Institutional Review Board Statement
Informed Consent Statement
Data Availability Statement
Conflicts of Interest
Notations
| ABTS | 2,2′-azino-bis (3-ethylbenzothiazoline-6-sulfonic acid) |
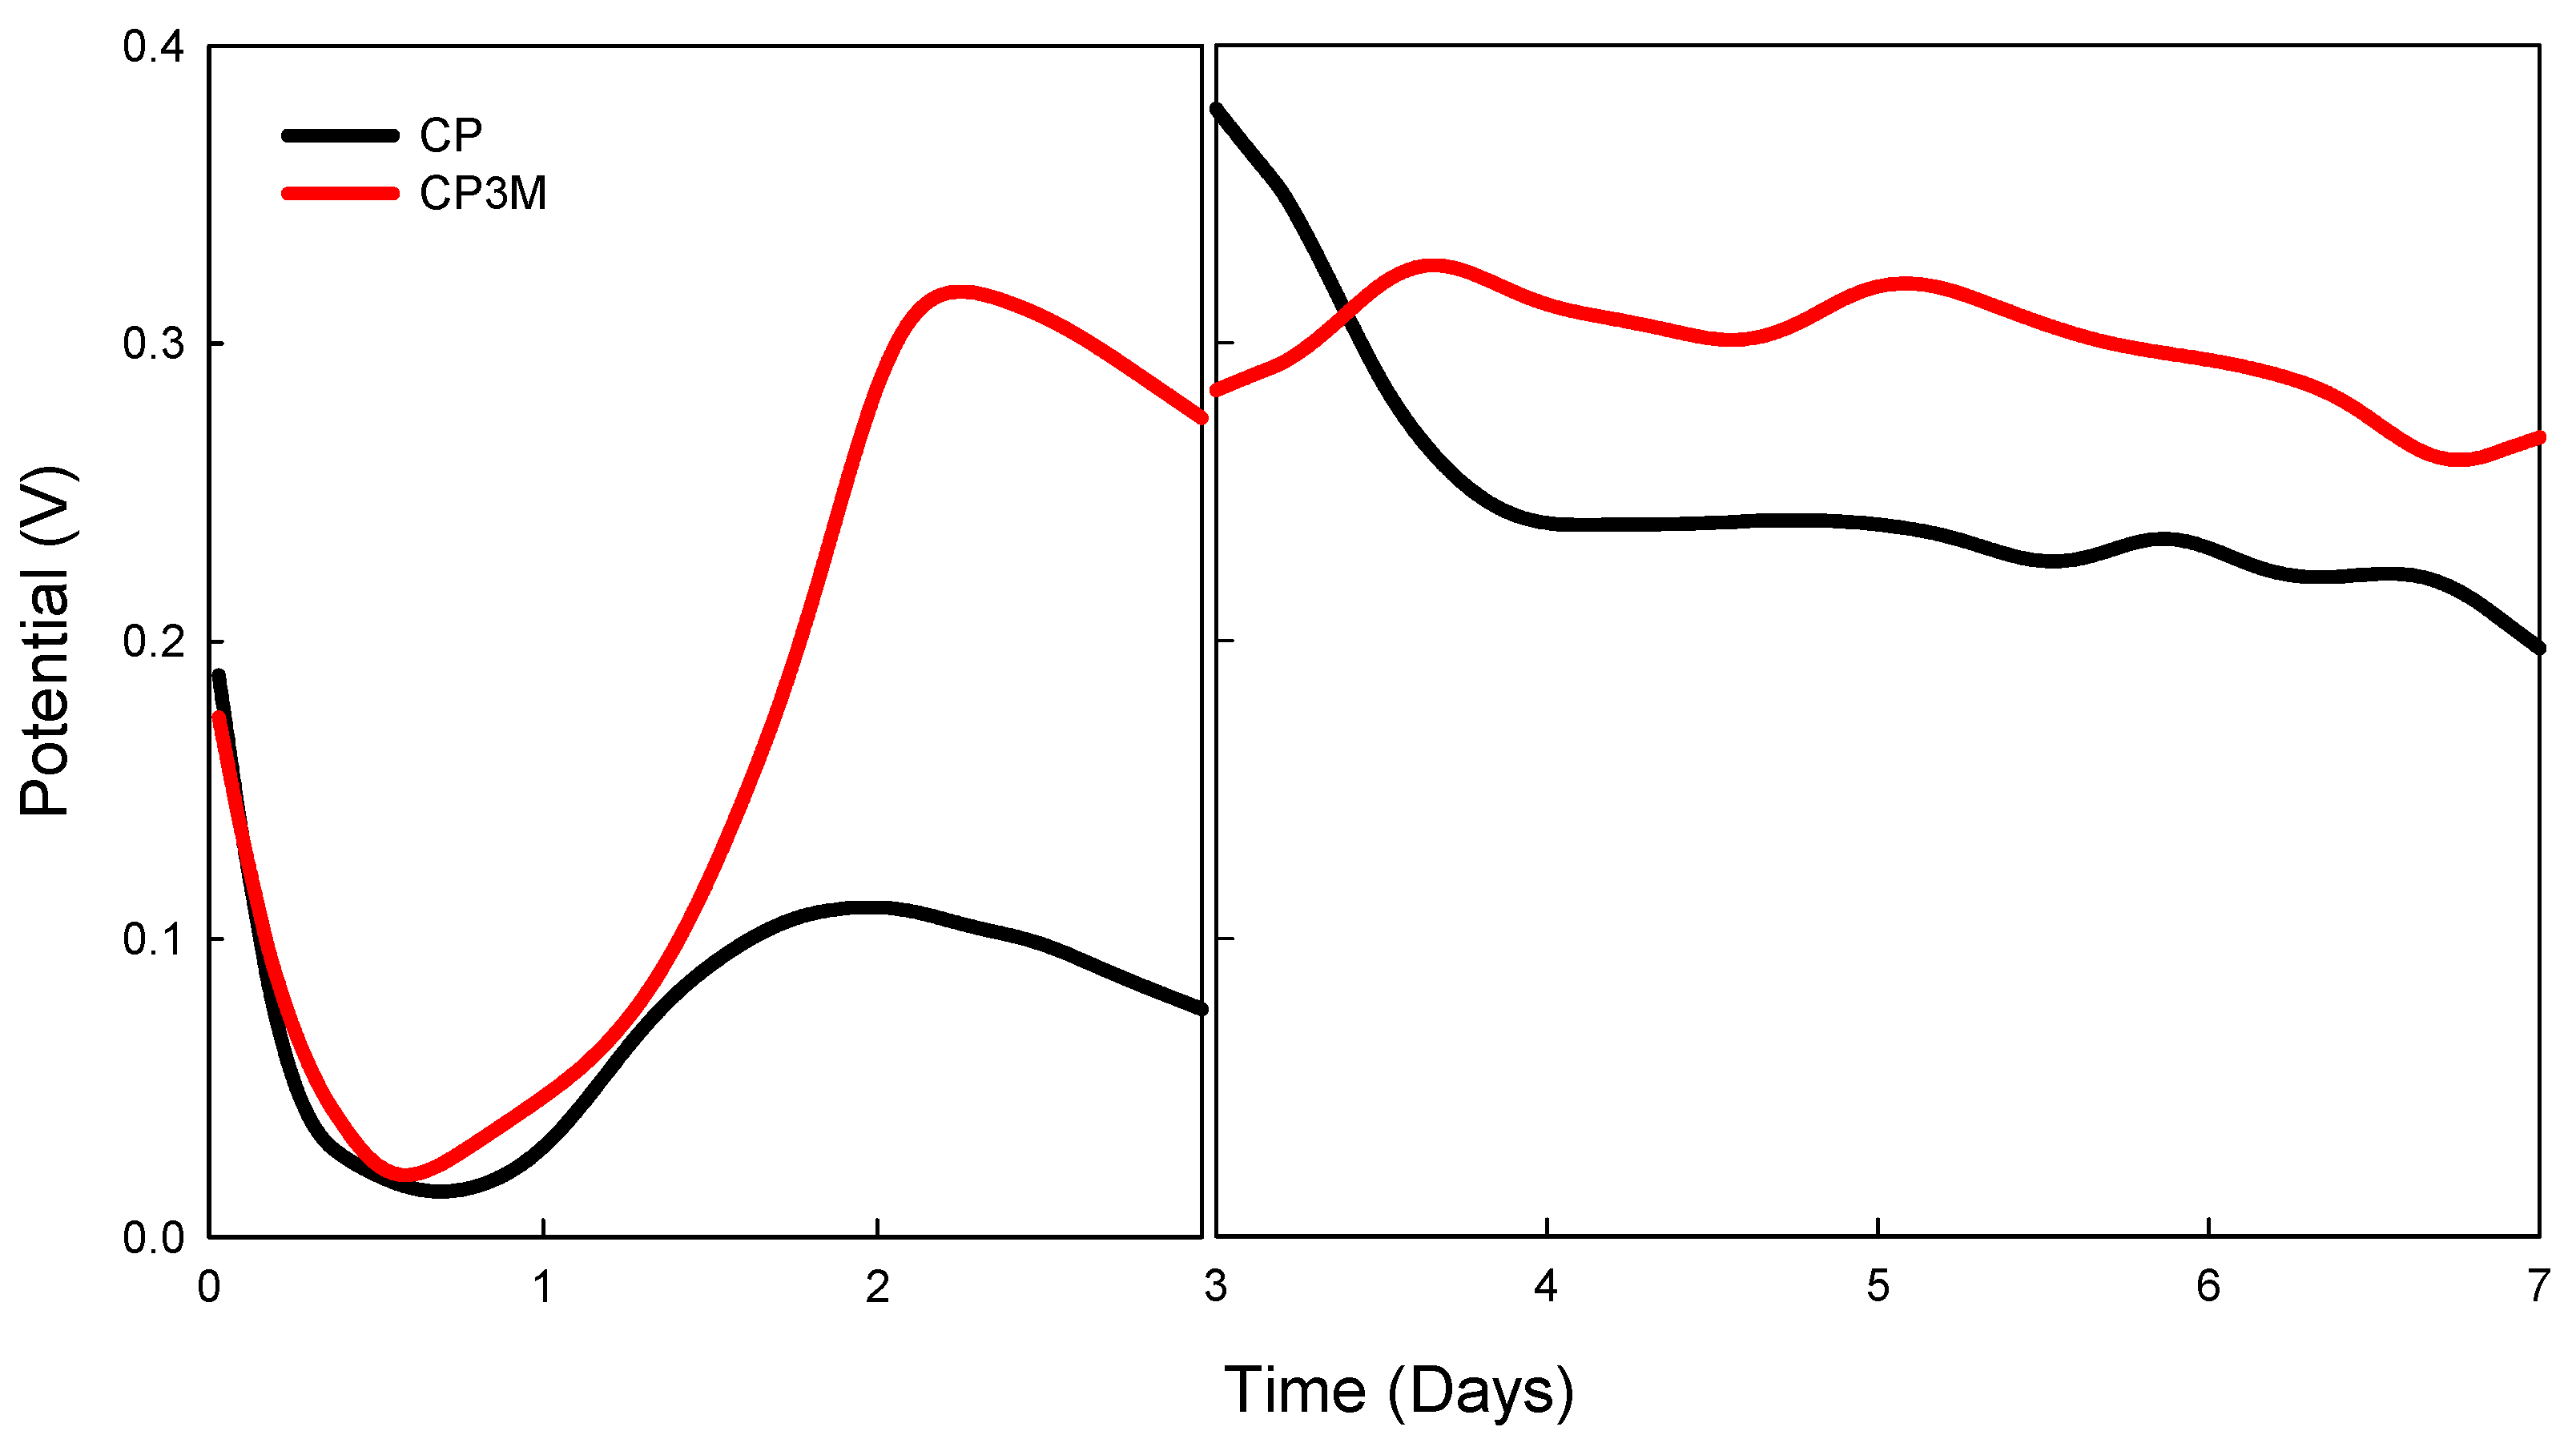
| CP | copper-type |
| CP3M | copper-type with 3M micropore type |
| EBFC | enzyme-based biofuel cell |
| CV | cyclic voltammetry |
| GOx | glucose oxidase |
| Lac | laccase |
| PANI | polyaniline |
| PBS | phosphate-buffer solution |
| PPy | polypyrrole |
References
- Zebda, A.; Innocent, C.; Renaud, L.; Certin, M.; Pichot, F.; Ferrigno, R.; Tingry, S. Enzyme-Based Microfluidic Biofuel Cell to Generate Micropower in Biofuel’s Engineering Process Technology. In Biofuel’s Engineering Process Technology; Marco Aurelio, D.S.B., Ed.; InTech: London, UK, 2011. [Google Scholar] [CrossRef]
- Kim, J.; Jia, H.; Wang, P. Challenges in biocatalysis for enzyme-based biofuel cells. Biotechnol. Adv. 2006, 24, 296–308. [Google Scholar] [CrossRef]
- Żygowska, M. Design, Fabrication and Characterisation of Components for Microfluidic Enzymatic Biofuel Cells. Ph.D. Thesis, National University of Ireland, Cork, Ireland, April 2014. [Google Scholar]
- Wong, Y.; Yu, J. Laccase-catalyzed Decolorization of Synthetic Dye. Water Res. 1999, 33, 3512–3520. [Google Scholar] [CrossRef]
- Xu, Q.; Liu, C.; Wu, H. Low-cost Immobilized Enzyme Glucose Sensor based on Laminar Flow. J. Phys. Conf. Ser. 2020, 1681, 012008. [Google Scholar] [CrossRef]
- Wong, C.M.; Wong, K.H.; Chen, X.D. Glucose oxidase: Natural occurrence, function, properties and industrial applications. AMBB 2008, 78, 927–938. [Google Scholar] [CrossRef]
- Jaeger, K.E.; Eggert, T. Enantioselective biocatalysis optimized by directed evolution. COBIOT 2004, 15, 305–313. [Google Scholar] [CrossRef]
- Ummalyma, S.B.; Bhaskar, T. Recent advances in the role of biocatalyst in biofuel cells and its application: An overview. BGER 2024, 40, 2051–2089. [Google Scholar] [CrossRef]
- Cao, L.; Chen, J.; Pang, J.; Qu, H.; Liu, J.; Gao, J. Research Progress in Enzyme Biofuel Cells Modified Using Nanomaterials and Their Implementation as Self-Powered Sensors. Molecules 2024, 29, 257. [Google Scholar] [CrossRef]
- Blanford, C.F.; Heath, R.S.; Armstrong, F.A. A stable electrode for high-potential, electrocatalytic O2 reduction based on rational attachment of a blue copper oxidase to a graphite surface. Chem. Commun. 2007, 1710–1712. [Google Scholar] [CrossRef]
- Moore, C.M.; Akers, N.L.; Hill, A.D.; Johnson, Z.C.; Minteer, S.D. Improving the Environment for Immobilized Dehydrogenase Enzymes by Modifying Nafion with Tetraalkylammonium Bromides. Biomacromolecules 2004, 5, 1241–1247. [Google Scholar] [CrossRef]
- Heineman, W.R.; Kissinge, P.T. Analytical Electrochemistry: Methodology and Applications of Dynamic Techniques. Anal. Chem. 1980, 52, 138R–151R. [Google Scholar] [CrossRef]
- Cai, J.; Shen, F.; Zhao, J.; Xiao, X. Enzymatic biofuel cell: A potential power source for self-sustained smart textiles. iScience 2024, 27, 108998. [Google Scholar] [CrossRef]
- Zhang, J.; Huang, X.; Zhang, L.; Si, Y.; Guo, S.; Su, H.; Liu, J. Layer-by-layer assembly for immobilizing enzymes in enzymatic biofuel cells. Sustain. Energy & Fuels 2020, 4, 68–79. [Google Scholar] [CrossRef]
- Shamsudin, M.; Tan, L.; Tsuji, T. Enzyme immobilization technology in biofuel production: A review. Proc. IOP Conf. Ser. Mater. Sci. Eng. 2021, 1051, 012056. [Google Scholar] [CrossRef]
- Pak, J.; Chang, W.; Kwon, C.H.; Cho, J. Recent Advances in Enzyme-based Biofuel Cells Using Glucose Fuel: Achieving High Power Output and Enhanced Operational Stability. Adv. Funct. Mater. 2024; 2415933early view. [Google Scholar] [CrossRef]
- Ismagilov, R.F.; Stroock, A.D.; Kenis, P.J.A.; Whitesides, G.; Stone, H.A. Experimental and theoretical scaling laws for transverse diffusive broadening in two-phase laminar flows in microchannels. Appl. Phys. Lett. 2000, 76, 2376. [Google Scholar] [CrossRef]
- Dai, D.J.; Chan, D.S.; Wu, H.S. Modified Carbon Nanoball on Electrode Surface Using Plasma in Enzyme-Based Biofuel Cells. Energy Procedia 2012, 14, 1804–1810. [Google Scholar] [CrossRef]
- Roth, G.J.; Calverley, D.C. Aspirin, Platelets, and Thrombosis: Theory and Practice. Blood 1994, 83, 885–898. [Google Scholar] [CrossRef]
- Munauwarah, R.; Bojang, A.A.; Wu, H.S. Characterization of enzyme immobilized carbon electrode using covalent-entrapment with polypyrrole. JCIE 2018, 41, 710–719. [Google Scholar] [CrossRef]
- Bojang, A.A.; Wu, H.S. Characterization of electrode performance in enzymatic biofuel cells using cyclic voltammetry and electrochemical impedance Spectroscopy. Catalysts 2020, 10, 782. [Google Scholar] [CrossRef]
- Khan, M.; Inamuddin. Fabrication and characterization of electrically conducting electrochemically synthesized polypyrrole-based enzymatic biofuel cell anode with biocompatible redox mediator vitamin K3. Sci. Rep. 2024, 14, 3324. [Google Scholar] [CrossRef]
- Hayes, J.R.; Engstrom, A.M.; Friesen, C. Orthogonal flow membraneless fuel cell. J. Power Sources 2008, 183, 257–259. [Google Scholar] [CrossRef]
- Kashyap, D.; Venkateswaran, P.S.; Dwivedi, P.K.; Kim, Y.H.; Kim, G.M.; Sharma, A.; Goel, S. Recent developments in enzymatic biofuel cell: Towards implantable integrated micro-devices. Int. J. Nanoparticles 2015, 8, 61–81. [Google Scholar] [CrossRef]
- Ding, S.N.; Holzinger, M.; Mousty, C.; Cosnier, S. Laccase electrodes based on the combination of single-walled carbon nanotubes and redox layered double hydroxides: Towards the development of biocathode for biofuel cells. J. Power Sources 2010, 195, 4714–4717. [Google Scholar] [CrossRef]
- Klis, M.; Maicka, E.; Michota, A.; Bukowska, J.; Sek, S.; Rogalski, J.; Bilewicz, R. Electroreduction of laccase covalently bound to organothiol monolayers on gold electrodes. Electrochim. Acta 2007, 52, 5591–5598. [Google Scholar] [CrossRef]
- Shim, J.; Kim, G.-Y.; Moon, S.-H. Covalent co-immobilization of glucose oxidase and ferrocenedicarboxylic acid for an enzymatic biofuel cell. JEAC 2011, 653, 14–20. [Google Scholar] [CrossRef]
- Calabrese Barton, S.; Gallaway, J.; Atanassov, P. Enzymatic Biofuel Cells for Implantable and Microscale Devices. Chem. Rev. 2004, 104, 4867–4886. [Google Scholar] [CrossRef]
- Zebda, A.; Renaud, L.; Cretin, M.; Pichot, F.; Innocent, C.; Ferrigno, R.; Tingry, S. A microfluidic glucose biofuel cell to generate micropower from enzymes at ambient temperature. Electrochem. Commun. 2009, 11, 592–595. [Google Scholar] [CrossRef]
- Willner, I.; Yan, Y.M.; Willner, B.; Tel-Vered, R. Integrated Enzyme-Based Biofuel Cells-A Review. Fuel Cells 2009, 9, 7–24. [Google Scholar] [CrossRef]
 : pH5
: pH5 : pH 6
 : pH 7), immersed for 0 h in a glucose and PBS solution; (
 : pH 5
 : pH 6
 : pH 7), immersed for 1 h in a glucose and PBS solution.
: pH5: pH 6: pH 7), immersed for 0 h in a glucose and PBS solution; (: pH 5: pH 6: pH 7), immersed for 1 h in a glucose and PBS solution.
: pH 7), immersed for 1 h in a glucose and PBS solution.
: pH5: pH 6: pH 7), immersed for 0 h in a glucose and PBS solution; (: pH 5: pH 6: pH 7), immersed for 1 h in a glucose and PBS solution.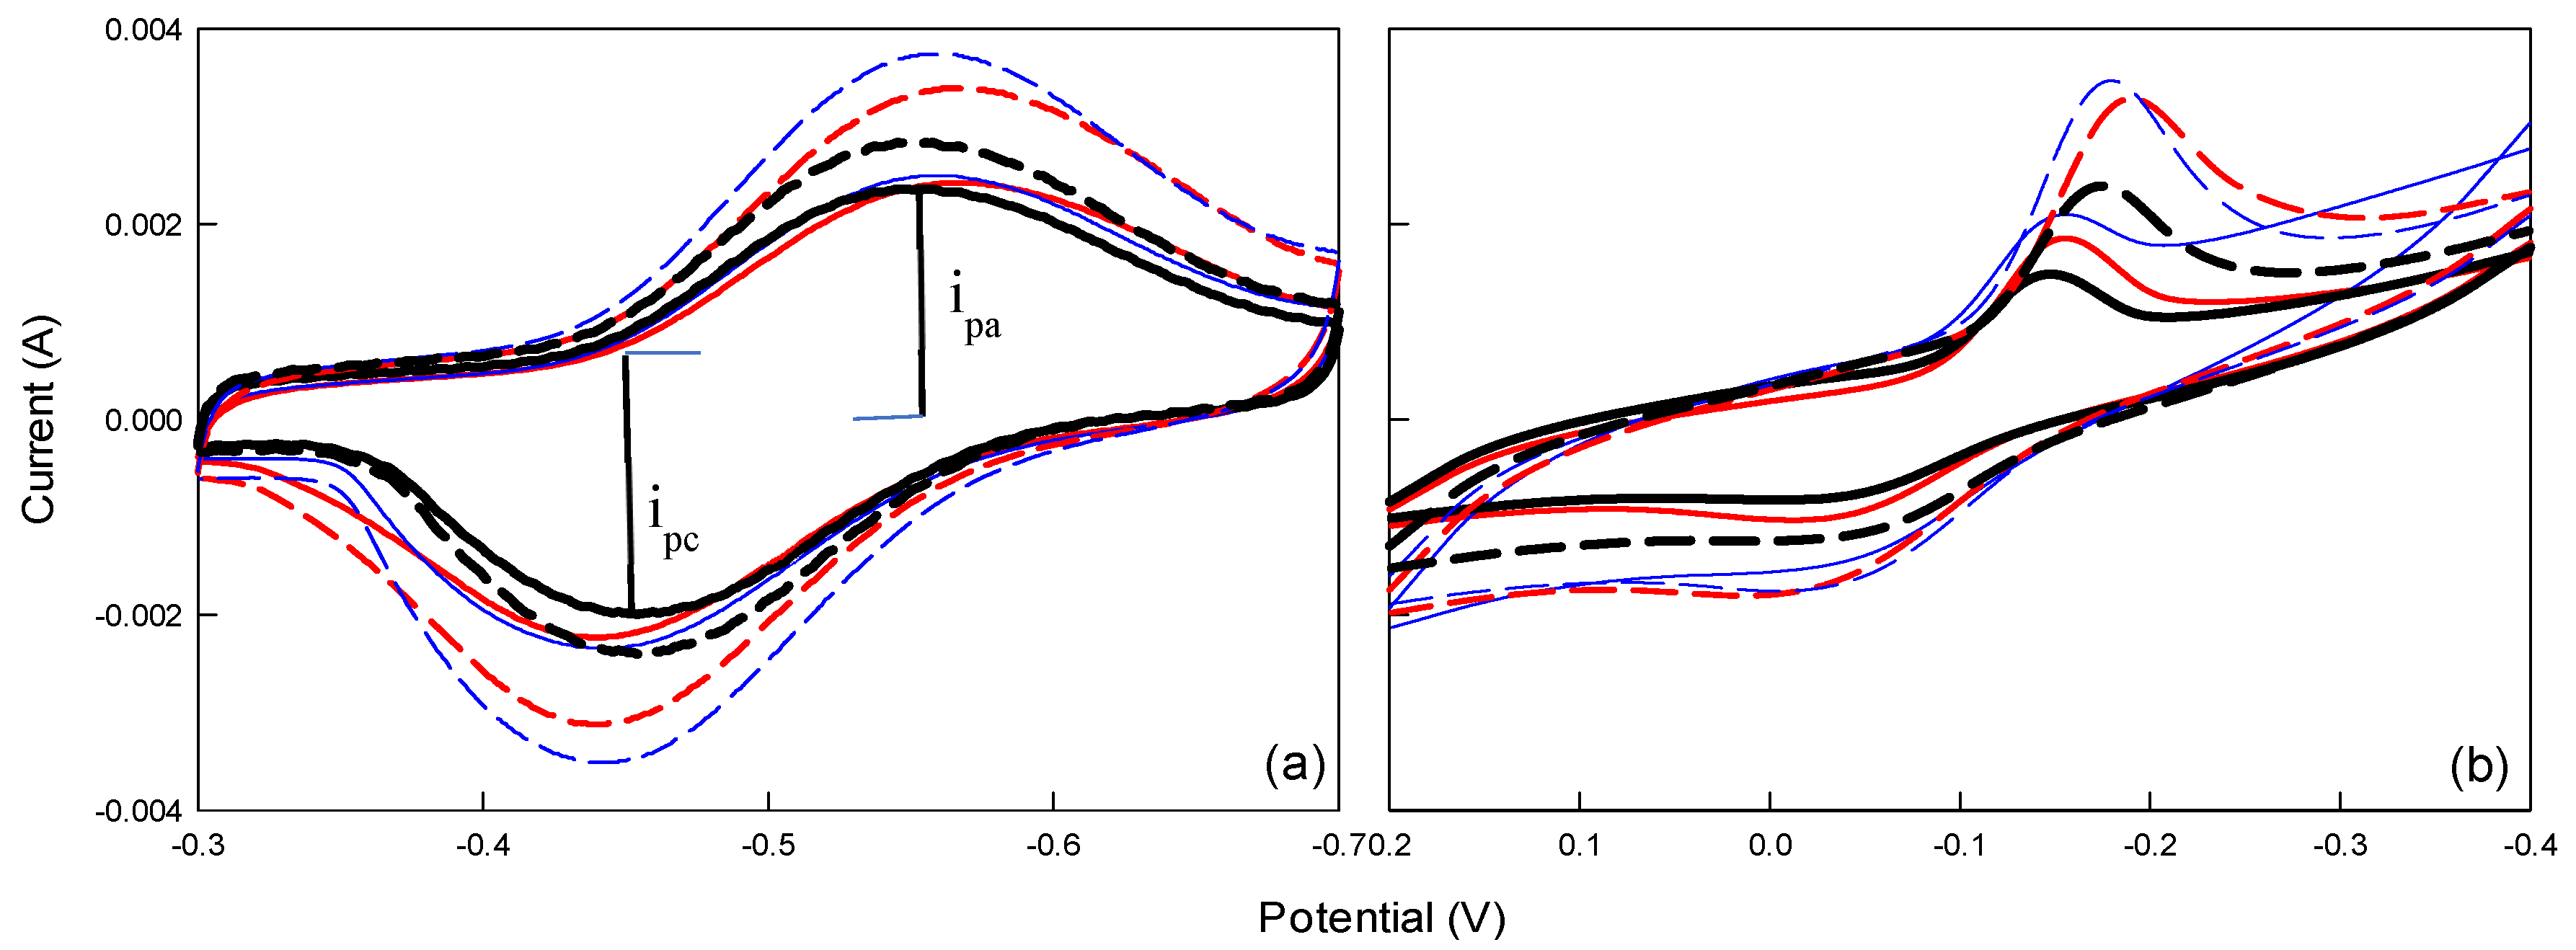
 : 0.1,
  : 0.2,
  : 0.3,
  : 0.4); PANI (mM) = (
 : 0.1,
  : 0.2,
  : 0.3,
  : 0.4); blank (mM) =
  : 0, GOx (5 U/10 μL), Fe(CN)63−(10 mM), pH = 7.
: 0.1, : 0.2, : 0.3, : 0.4); PANI (mM) = (: 0.1, : 0.2, : 0.3, : 0.4); blank (mM) = : 0, GOx (5 U/10 μL), Fe(CN)63−(10 mM), pH = 7.
: 0, GOx (5 U/10 μL), Fe(CN)63−(10 mM), pH = 7.
: 0.1, : 0.2, : 0.3, : 0.4); PANI (mM) = (: 0.1, : 0.2, : 0.3, : 0.4); blank (mM) = : 0, GOx (5 U/10 μL), Fe(CN)63−(10 mM), pH = 7.
 A1,
A1,  A2,
A2,  A3,
A3,  A4,
A4,  A5,
A5,  A6,
A6,  A7,
A7,  A8,
A8,  A9.
A9.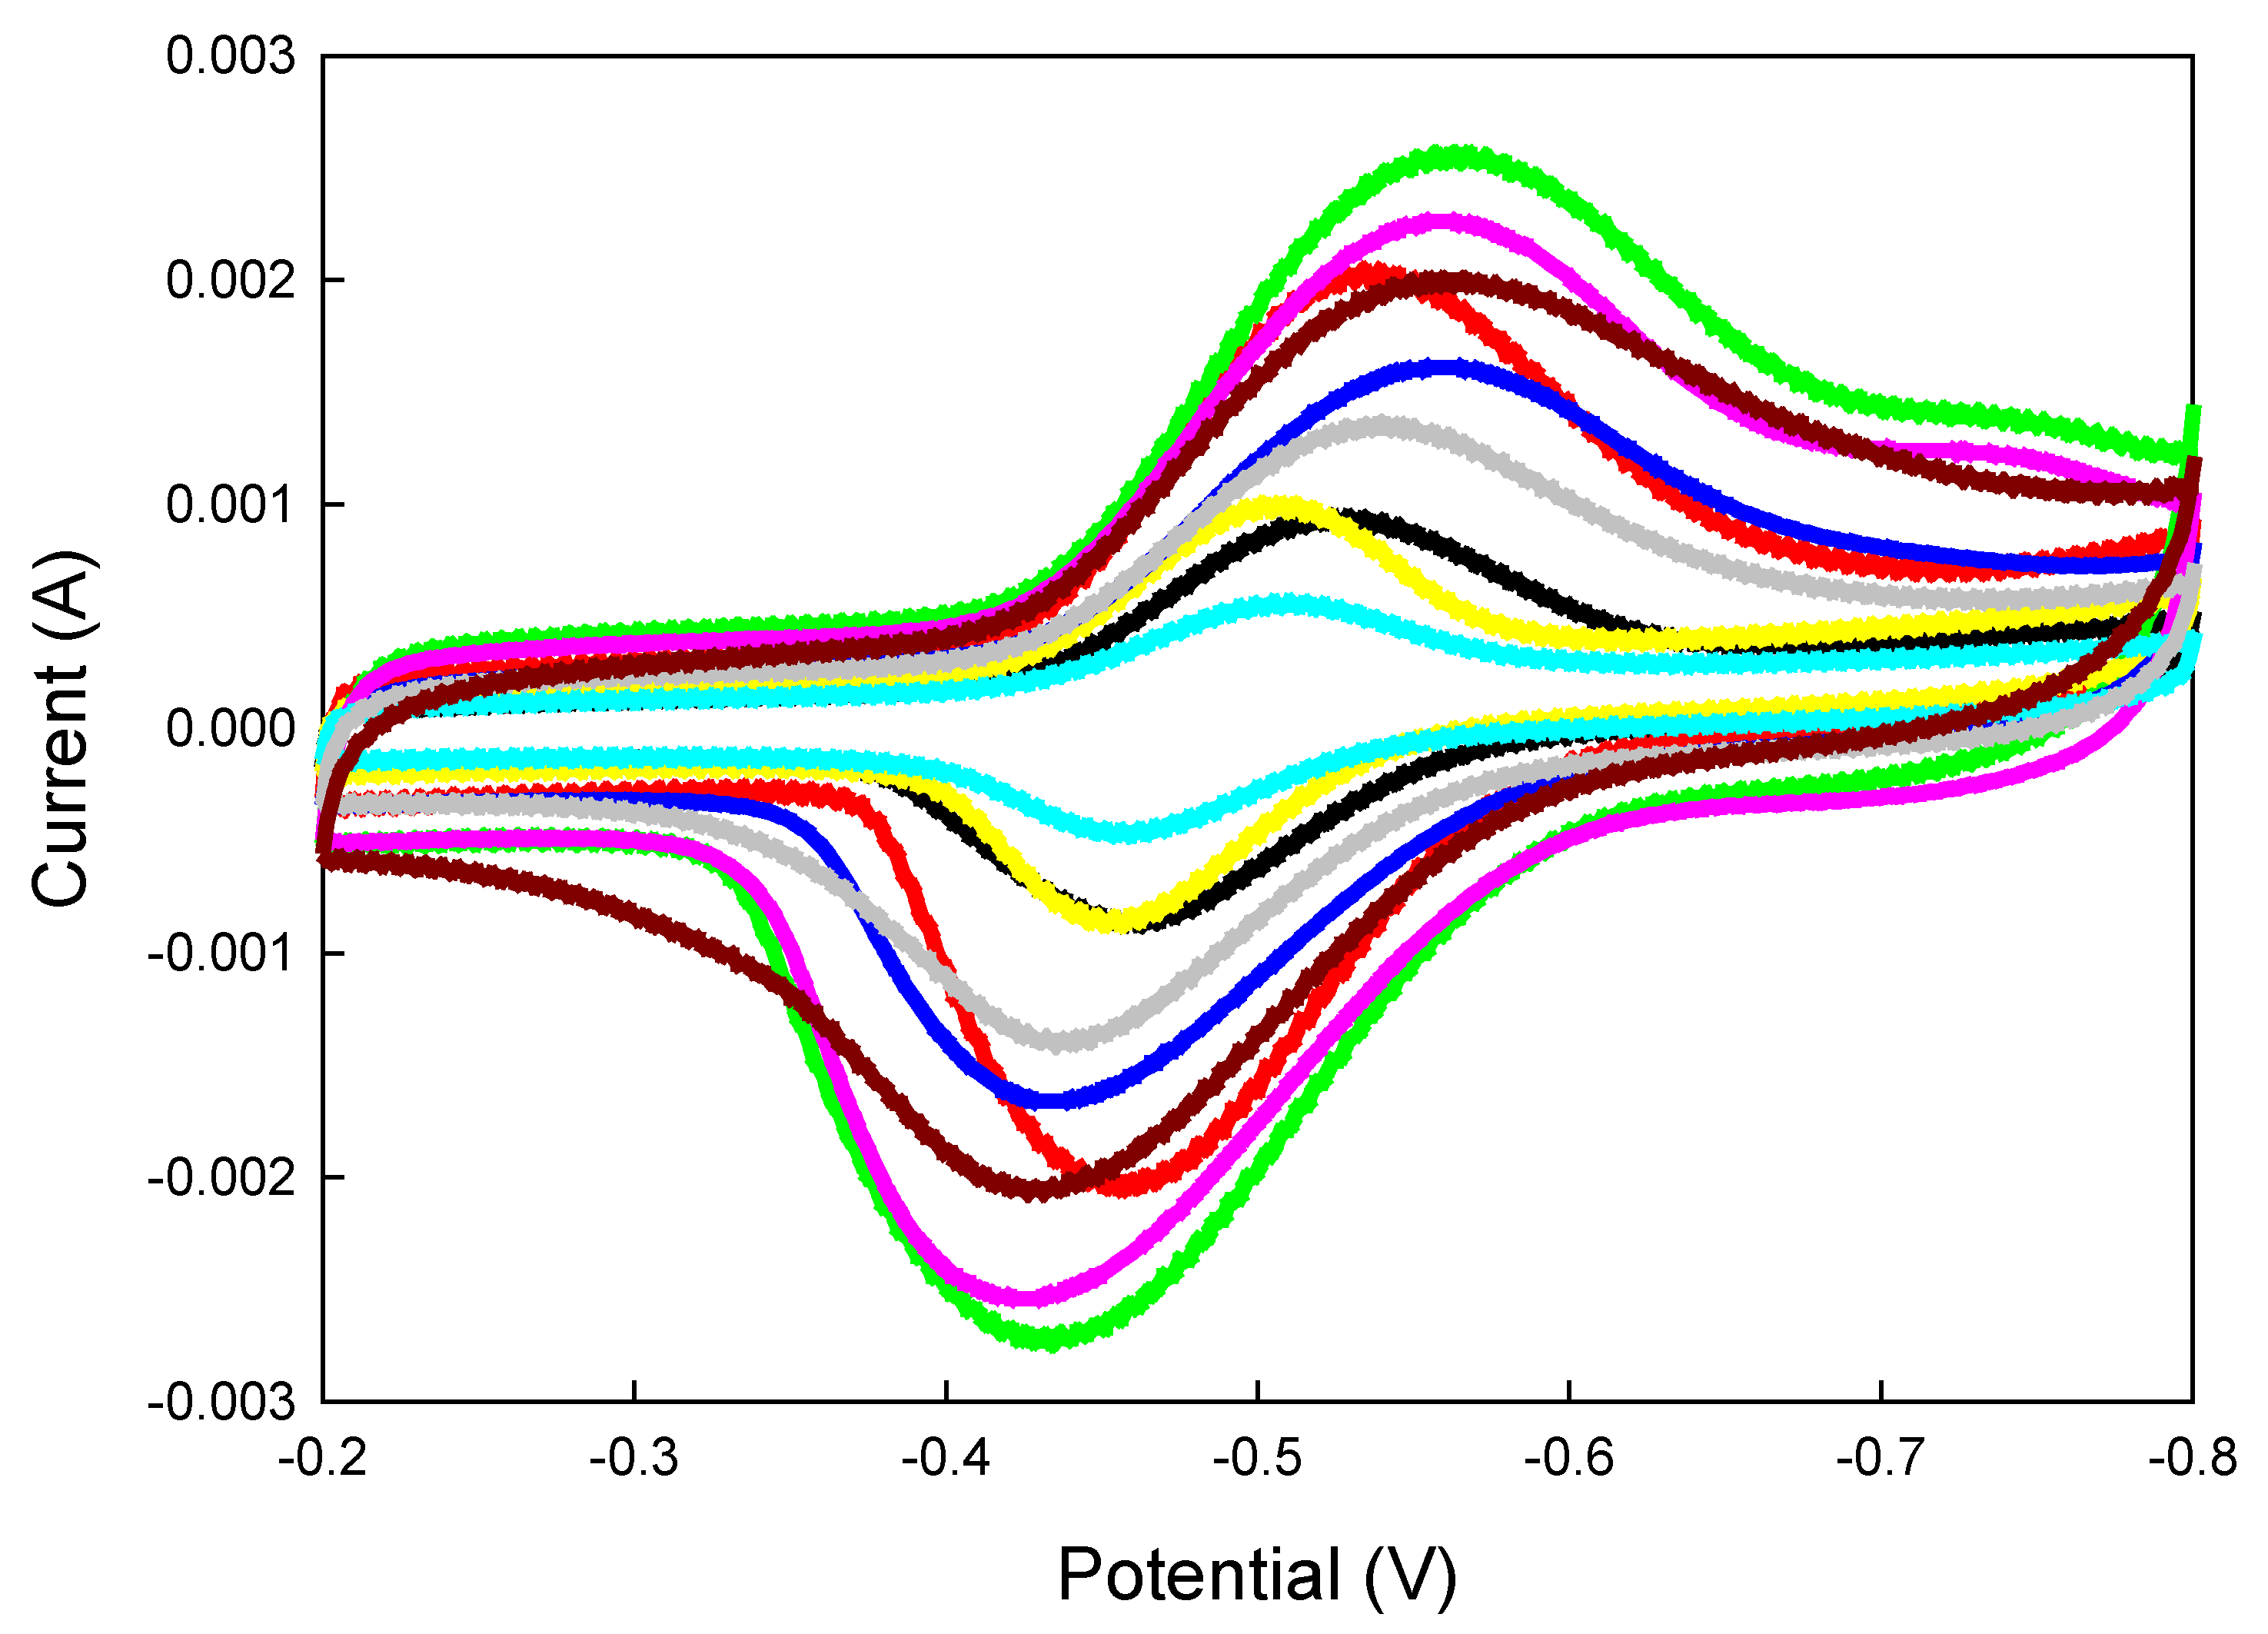
 A1,
A1,  A2,
A2,  A3,
A3,  A4,
A4,  A5,
A5,  A6,
A6,  A7,
A7,  A8,
A8,  A9) and cathode electrodes (subfigure number).
A1, A2, A3, A4, A5, A6, A7, A8, A9) and cathode electrodes (subfigure number).
A9) and cathode electrodes (subfigure number).
A1, A2, A3, A4, A5, A6, A7, A8, A9) and cathode electrodes (subfigure number).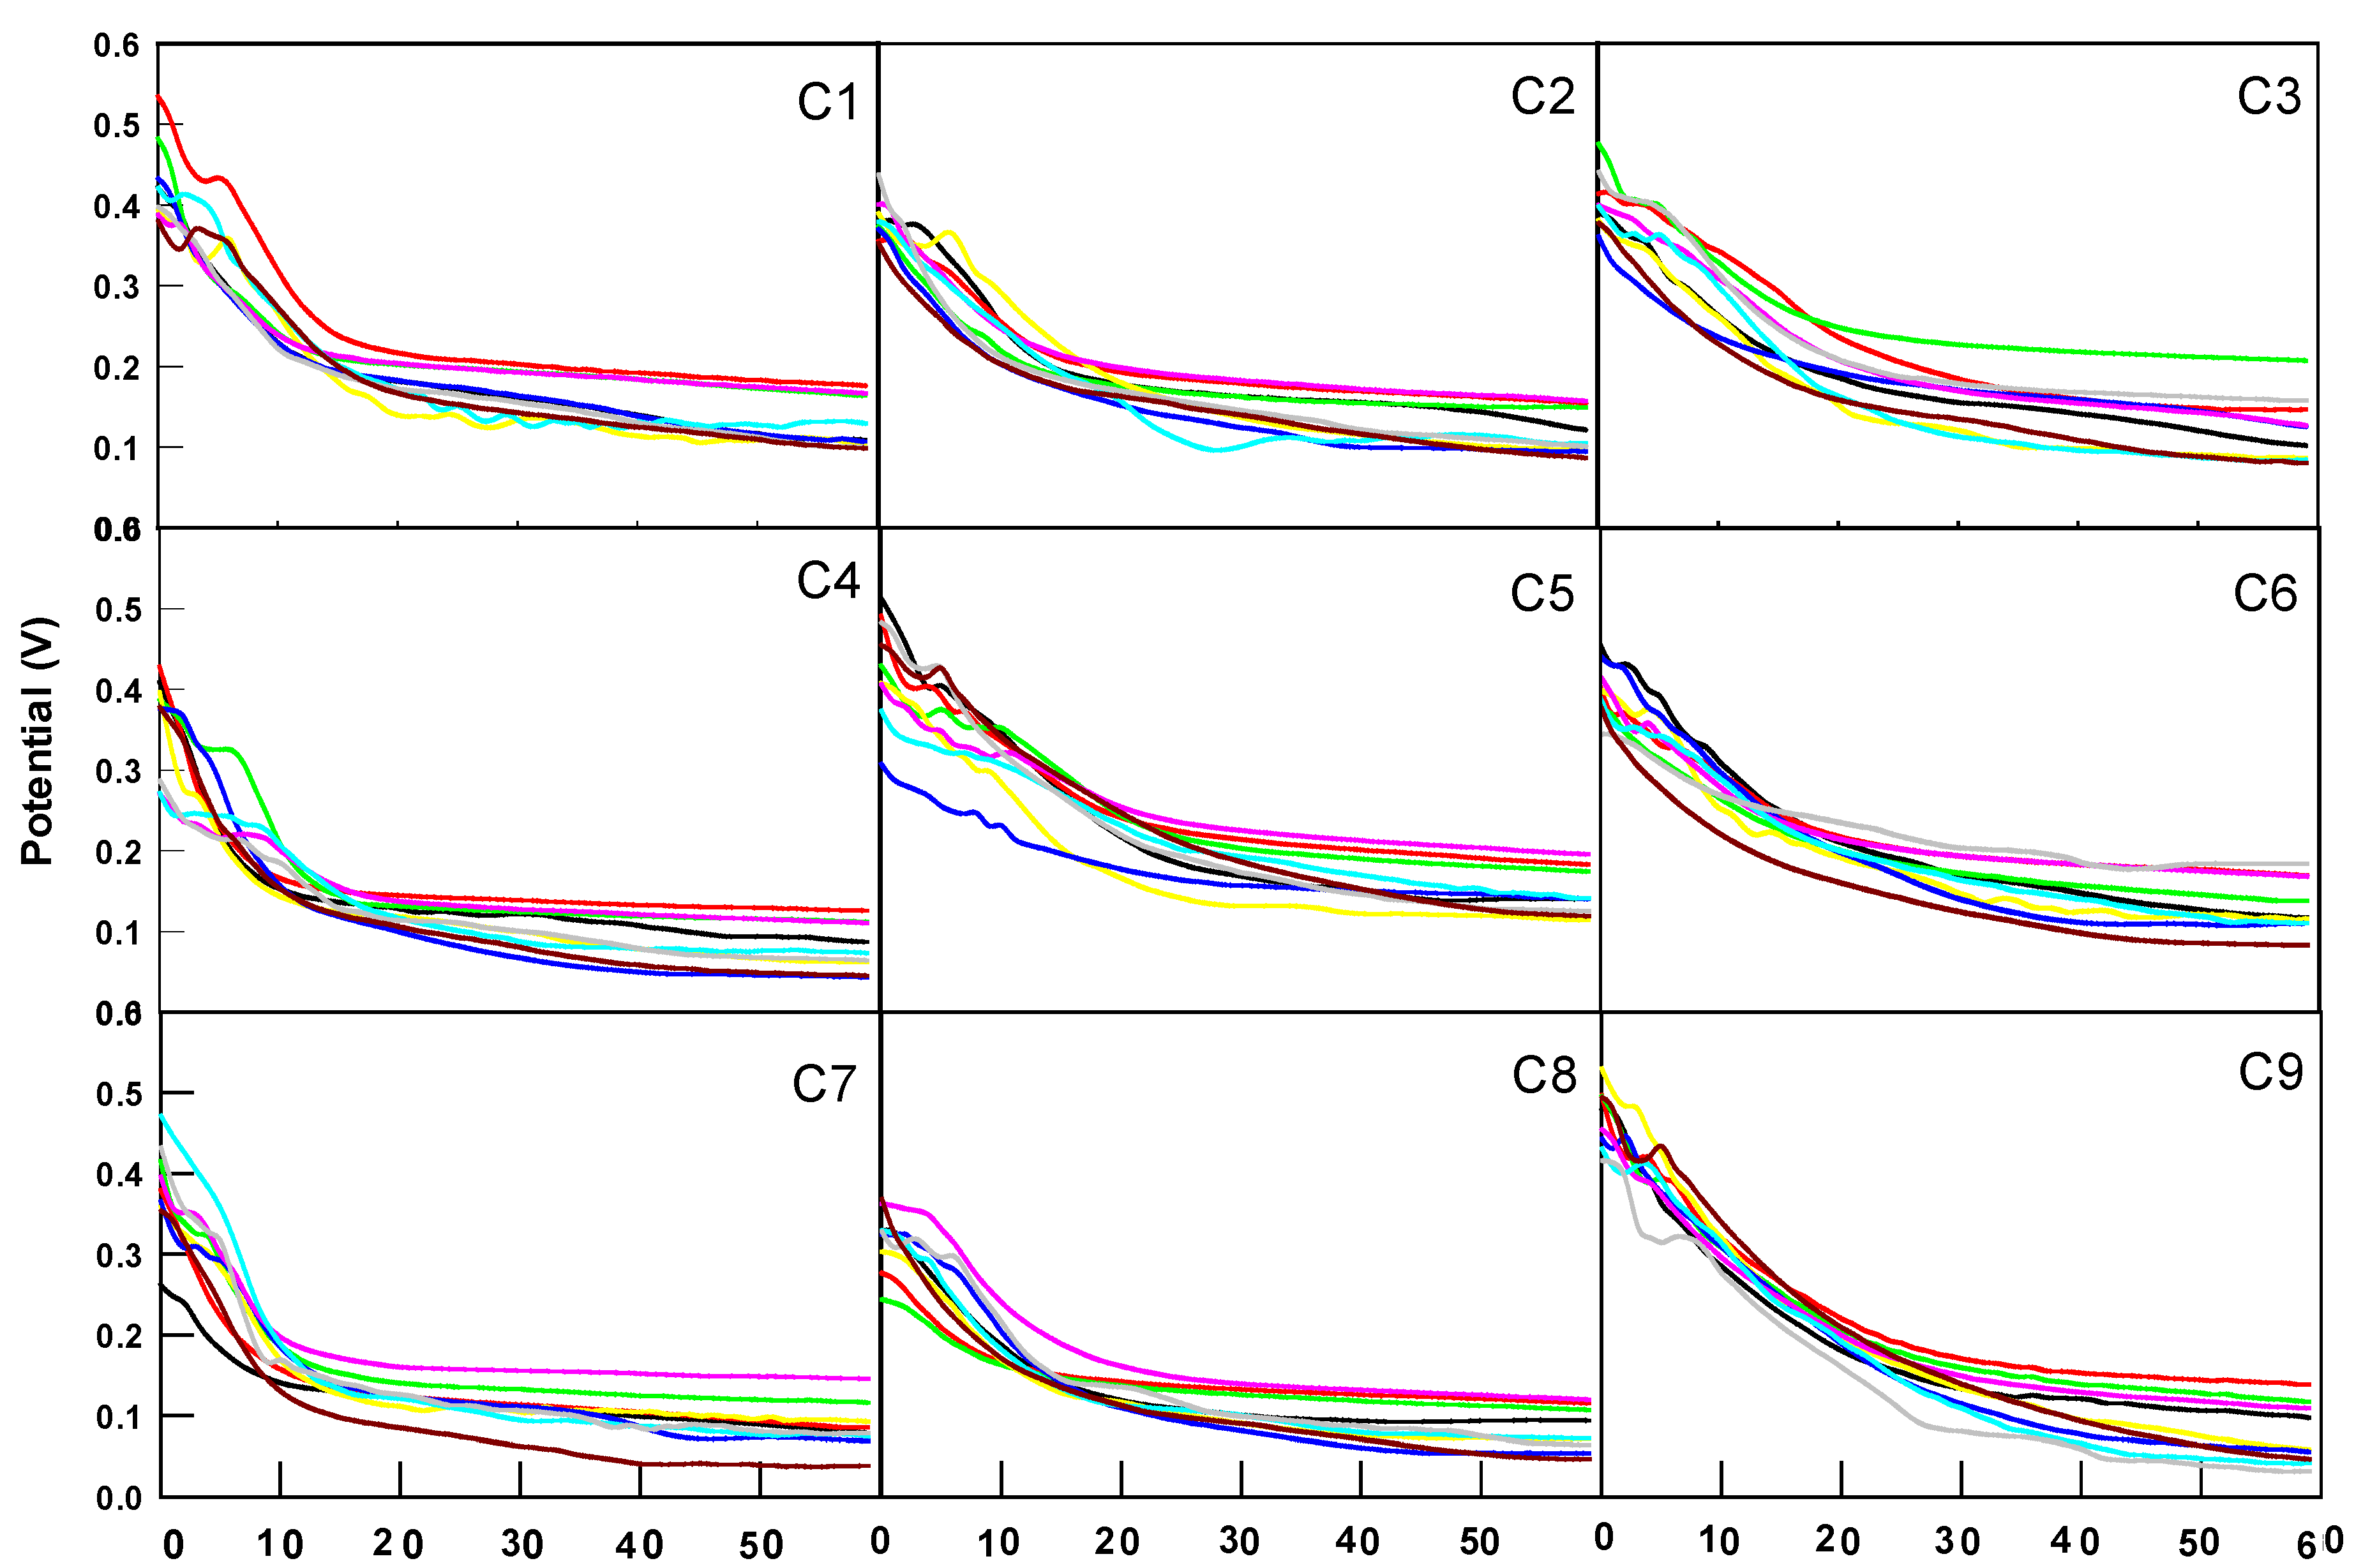

| Current | PPy5 b | PPy6 | PPy7 | PANI5 | PANI6 | PANI7 |
|---|---|---|---|---|---|---|
| ipa (A) | 2.42 × 10⁻³ | 2.49 × 10⁻³ | 2.36 × 10⁻³ | 2.34 × 10⁻³ | 2.51 × 10⁻³ | 1.94 × 10⁻³ |
| ipc (A) | −2.23 × 10⁻³ | −2.34 × 10⁻³ | −2 × 10⁻³ | −1.45 × 10⁻³ | −1.72 × 10⁻³ | −1.01 × 10⁻³ |
| △i a | 7.8% | 6% | 15.2% | 38% | 31.4% | 47.9% |
| Electrode | Response Time | Voltage (V) | Power Density (μW/cm2) |
|---|---|---|---|
| CP | excellent | 0.24 | 57.6 |
| CP3M | good | 0.57 | 324.9 |
| System (Oxidation/ Reduction) | Enzyme (Anode/ Cathode) | Concentration (mM) (Anode/ Cathode) | Electrode | Electrolyte | Potential (V) | Power Density (μW/cm2) | Time (h) | Reference |
|---|---|---|---|---|---|---|---|---|
| Glucose/O2 | GOx/LAc | 10/10 | Graphite disk electrodes with Os-complex | PBS, pH 4.4~7.4 | 0.3 pH 4.4 0.4 pH 5.5 0.25 pH 7.4 | 10, 40 and 16 (37 °C) | --- | [24] |
| Glucose/O2 | GOx/LAc | 5/1 | Graphite electrode modified with CNT | PBS, pH 5.86 | 0.2 | 4.1 (20 °C) | --- | [2] |
| Glucose/O2 | GOx/LAc | 10/10 | Carbon electrode modified with PPy | PBS, pH 7.4 | 0.41 | 27 (37 °C) | 144 | [25] |
| Glucose/O2 | GOx/LAc | 10/10 | Carbon fiber electrodes with SWNT | PBS, pH 7.4 | 0.4 | 58 (25 °C) | 50 | [26] |
| Glucose/O2 | GOx/LAc | 60/3 | Carbon fiber electrodes with CNT | PBS, pH 7.0 CBS, pH 5.0 | 0.65 | 45 (37 °C) | 1 | [27] |
| Glucose/O2 | GOx/LAc | 3/3 | Au electrode 0.0314 cm2 | PBS, pH 7.0 Membraneless | 0.46 | 0.442 (25 °C) | 100 | [28] |
| Glucose/O2 | GOx/LAc | 10/5 | Gold electrode (10 mm in length and 2 mm in width) | PBS, pH 7.0 CBS, pH 3.0 | 0.3 | 110 (23 °C) | --- | [29] |
| Glucose/O2 | GOx/LAc | 5/5 | Au electrode | PBS, pH 6.0 | 0.226 | 178 (25 °C) | --- | [30] |
| Glucose/O2 | GOx/LAc | 40/40 | Carbon paper | PBS, pH 7.0 CBS, pH 5.0 | 0.35 | 122.6 (37 °C) | 100 | [6] |
| Glucose/O2 | GOx/LAc | 40/40 | Carbon paper covered with tape | PBS, pH 5.0 CBS, pH 5.0 | 0.57 | 324.9 (37 °C) | 480 | This study |
| No. | GOx (U/10 μL) | PPy (mM) | Fe(CN)63− (mM) | pH |
|---|---|---|---|---|
| A1 | 5 | 0.5 | 1 | 5 |
| A2 | 5 | 1 | 2 | 6 |
| A3 | 5 | 1.5 | 3 | 7 |
| A4 | 10 | 0.5 | 2 | 7 |
| A5 | 10 | 1 | 30 | 5 |
| A6 | 10 | 1.5 | 10 | 6 |
| A7 | 15 | 0.5 | 30 | 6 |
| A8 | 15 | 1.0 | 10 | 7 |
| A9 | 15 | 1.5 | 20 | 5 |
| No. | Lac (U/10 μL) | PPy (mM) | ABTS (mM) | pH |
|---|---|---|---|---|
| C1 | 5 | 0.5 | 10 | 5 |
| C2 | 5 | 1.0 | 20 | 6 |
| C3 | 5 | 1.5 | 30 | 7 |
| C4 | 10 | 0.5 | 20 | 7 |
| C5 | 10 | 1.0 | 30 | 5 |
| C6 | 10 | 1.5 | 10 | 6 |
| C7 | 15 | 0.5 | 30 | 6 |
| C8 | 15 | 1.0 | 10 | 7 |
| C9 | 15 | 1.5 | 20 | 5 |
Disclaimer/Publisher’s Note: The statements, opinions and data contained in all publications are solely those of the individual author(s) and contributor(s) and not of MDPI and/or the editor(s). MDPI and/or the editor(s) disclaim responsibility for any injury to people or property resulting from any ideas, methods, instructions or products referred to in the content. |
© 2025 by the authors. Licensee MDPI, Basel, Switzerland. This article is an open access article distributed under the terms and conditions of the Creative Commons Attribution (CC BY) license (https://creativecommons.org/licenses/by/4.0/).
Share and Cite
Chen, C.Y.; Bojang, A.A.; Damayanti, D.; Wu, H.S. Immobilization of Enzymes on Electrodes and Electrode Design in Biofuel Cells. Catalysts 2025, 15, 253. https://doi.org/10.3390/catal15030253
Chen CY, Bojang AA, Damayanti D, Wu HS. Immobilization of Enzymes on Electrodes and Electrode Design in Biofuel Cells. Catalysts. 2025; 15(3):253. https://doi.org/10.3390/catal15030253
Chicago/Turabian StyleChen, Chang Yen, Adama A. Bojang, Damayanti Damayanti, and Ho Shing Wu. 2025. "Immobilization of Enzymes on Electrodes and Electrode Design in Biofuel Cells" Catalysts 15, no. 3: 253. https://doi.org/10.3390/catal15030253
APA StyleChen, C. Y., Bojang, A. A., Damayanti, D., & Wu, H. S. (2025). Immobilization of Enzymes on Electrodes and Electrode Design in Biofuel Cells. Catalysts, 15(3), 253. https://doi.org/10.3390/catal15030253