


Catalytic OBSiC Open Cell Foams for Methane-Rich Gas Production Through Hydrogasification of Plastic Waste


Abstract
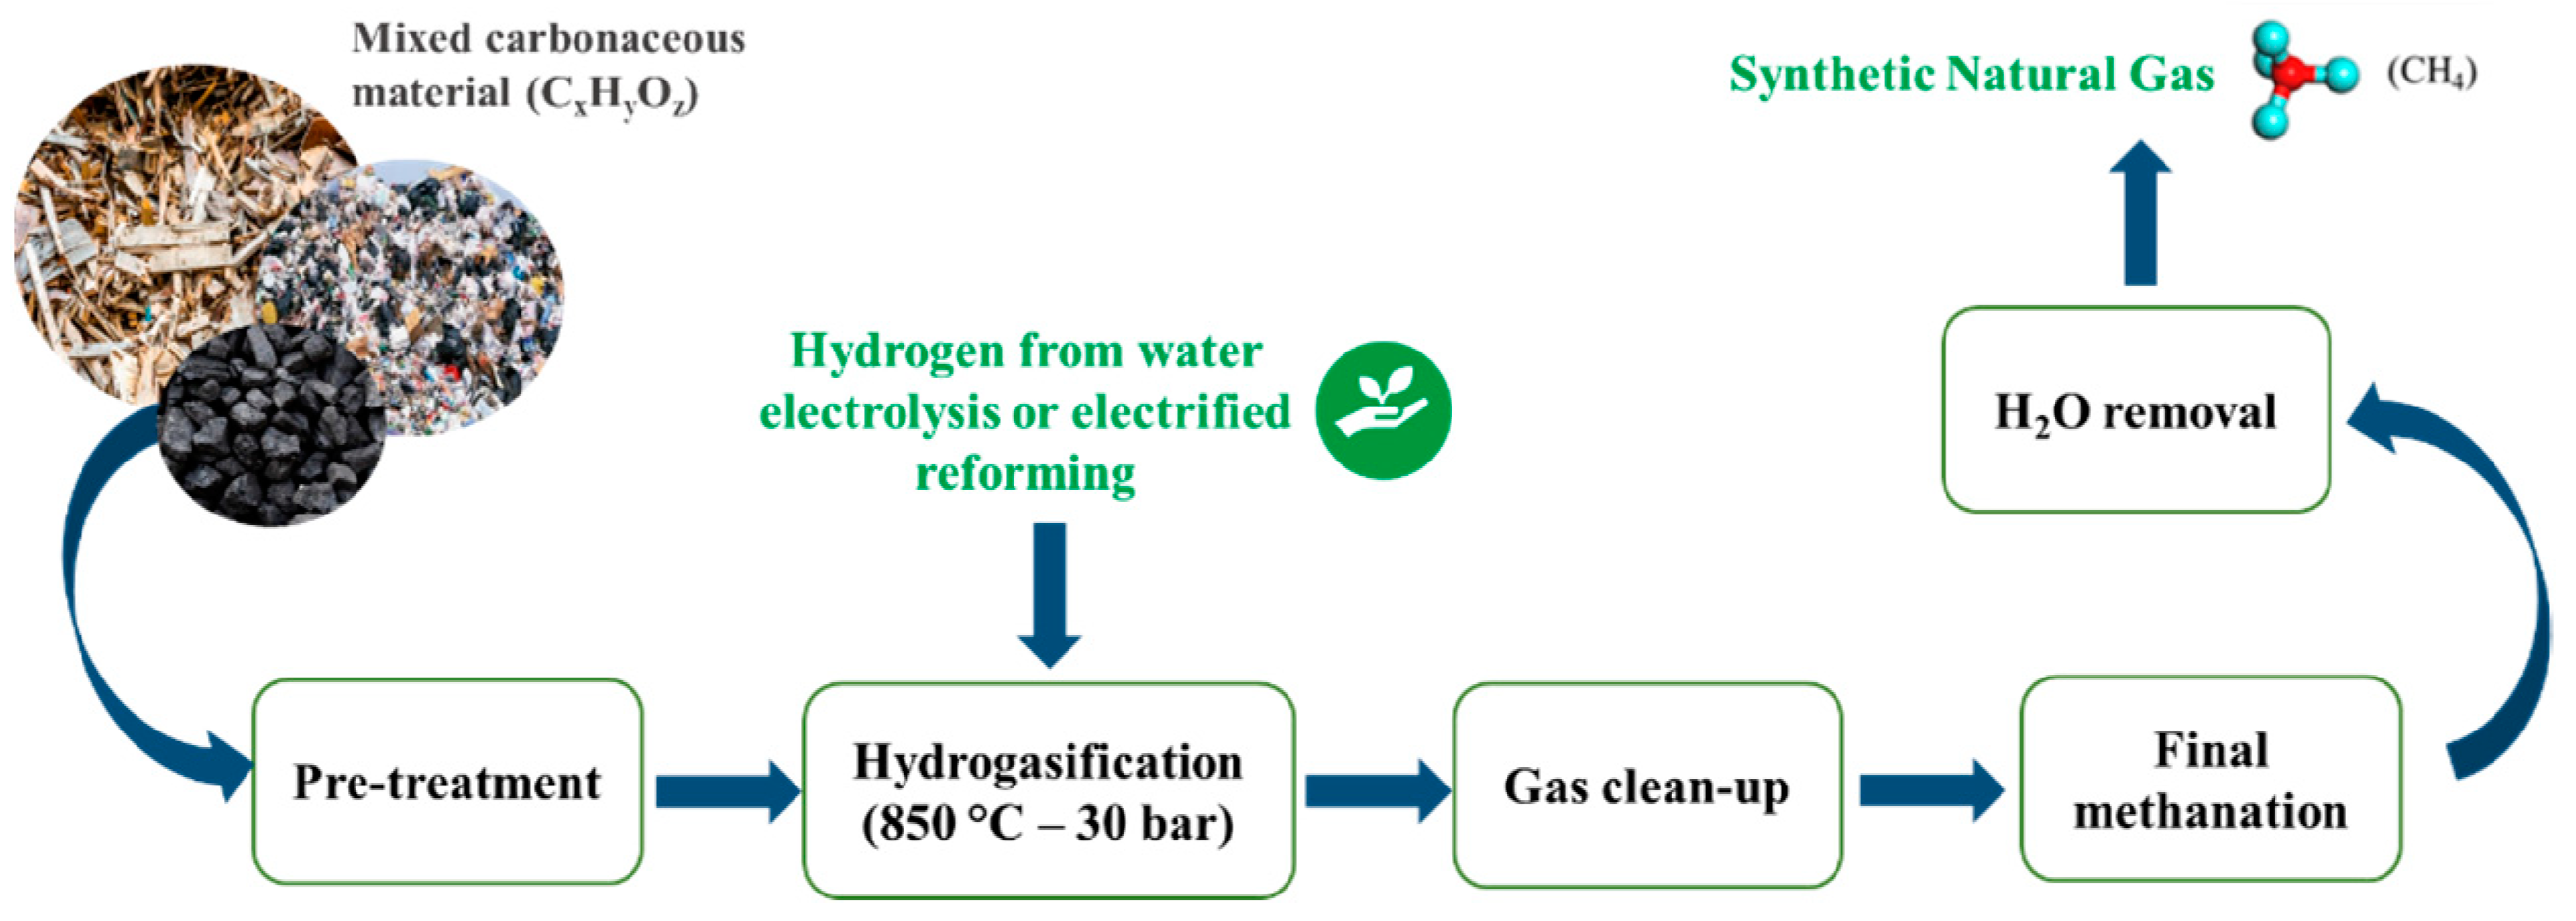
1. Introduction
2. Results and Discussion
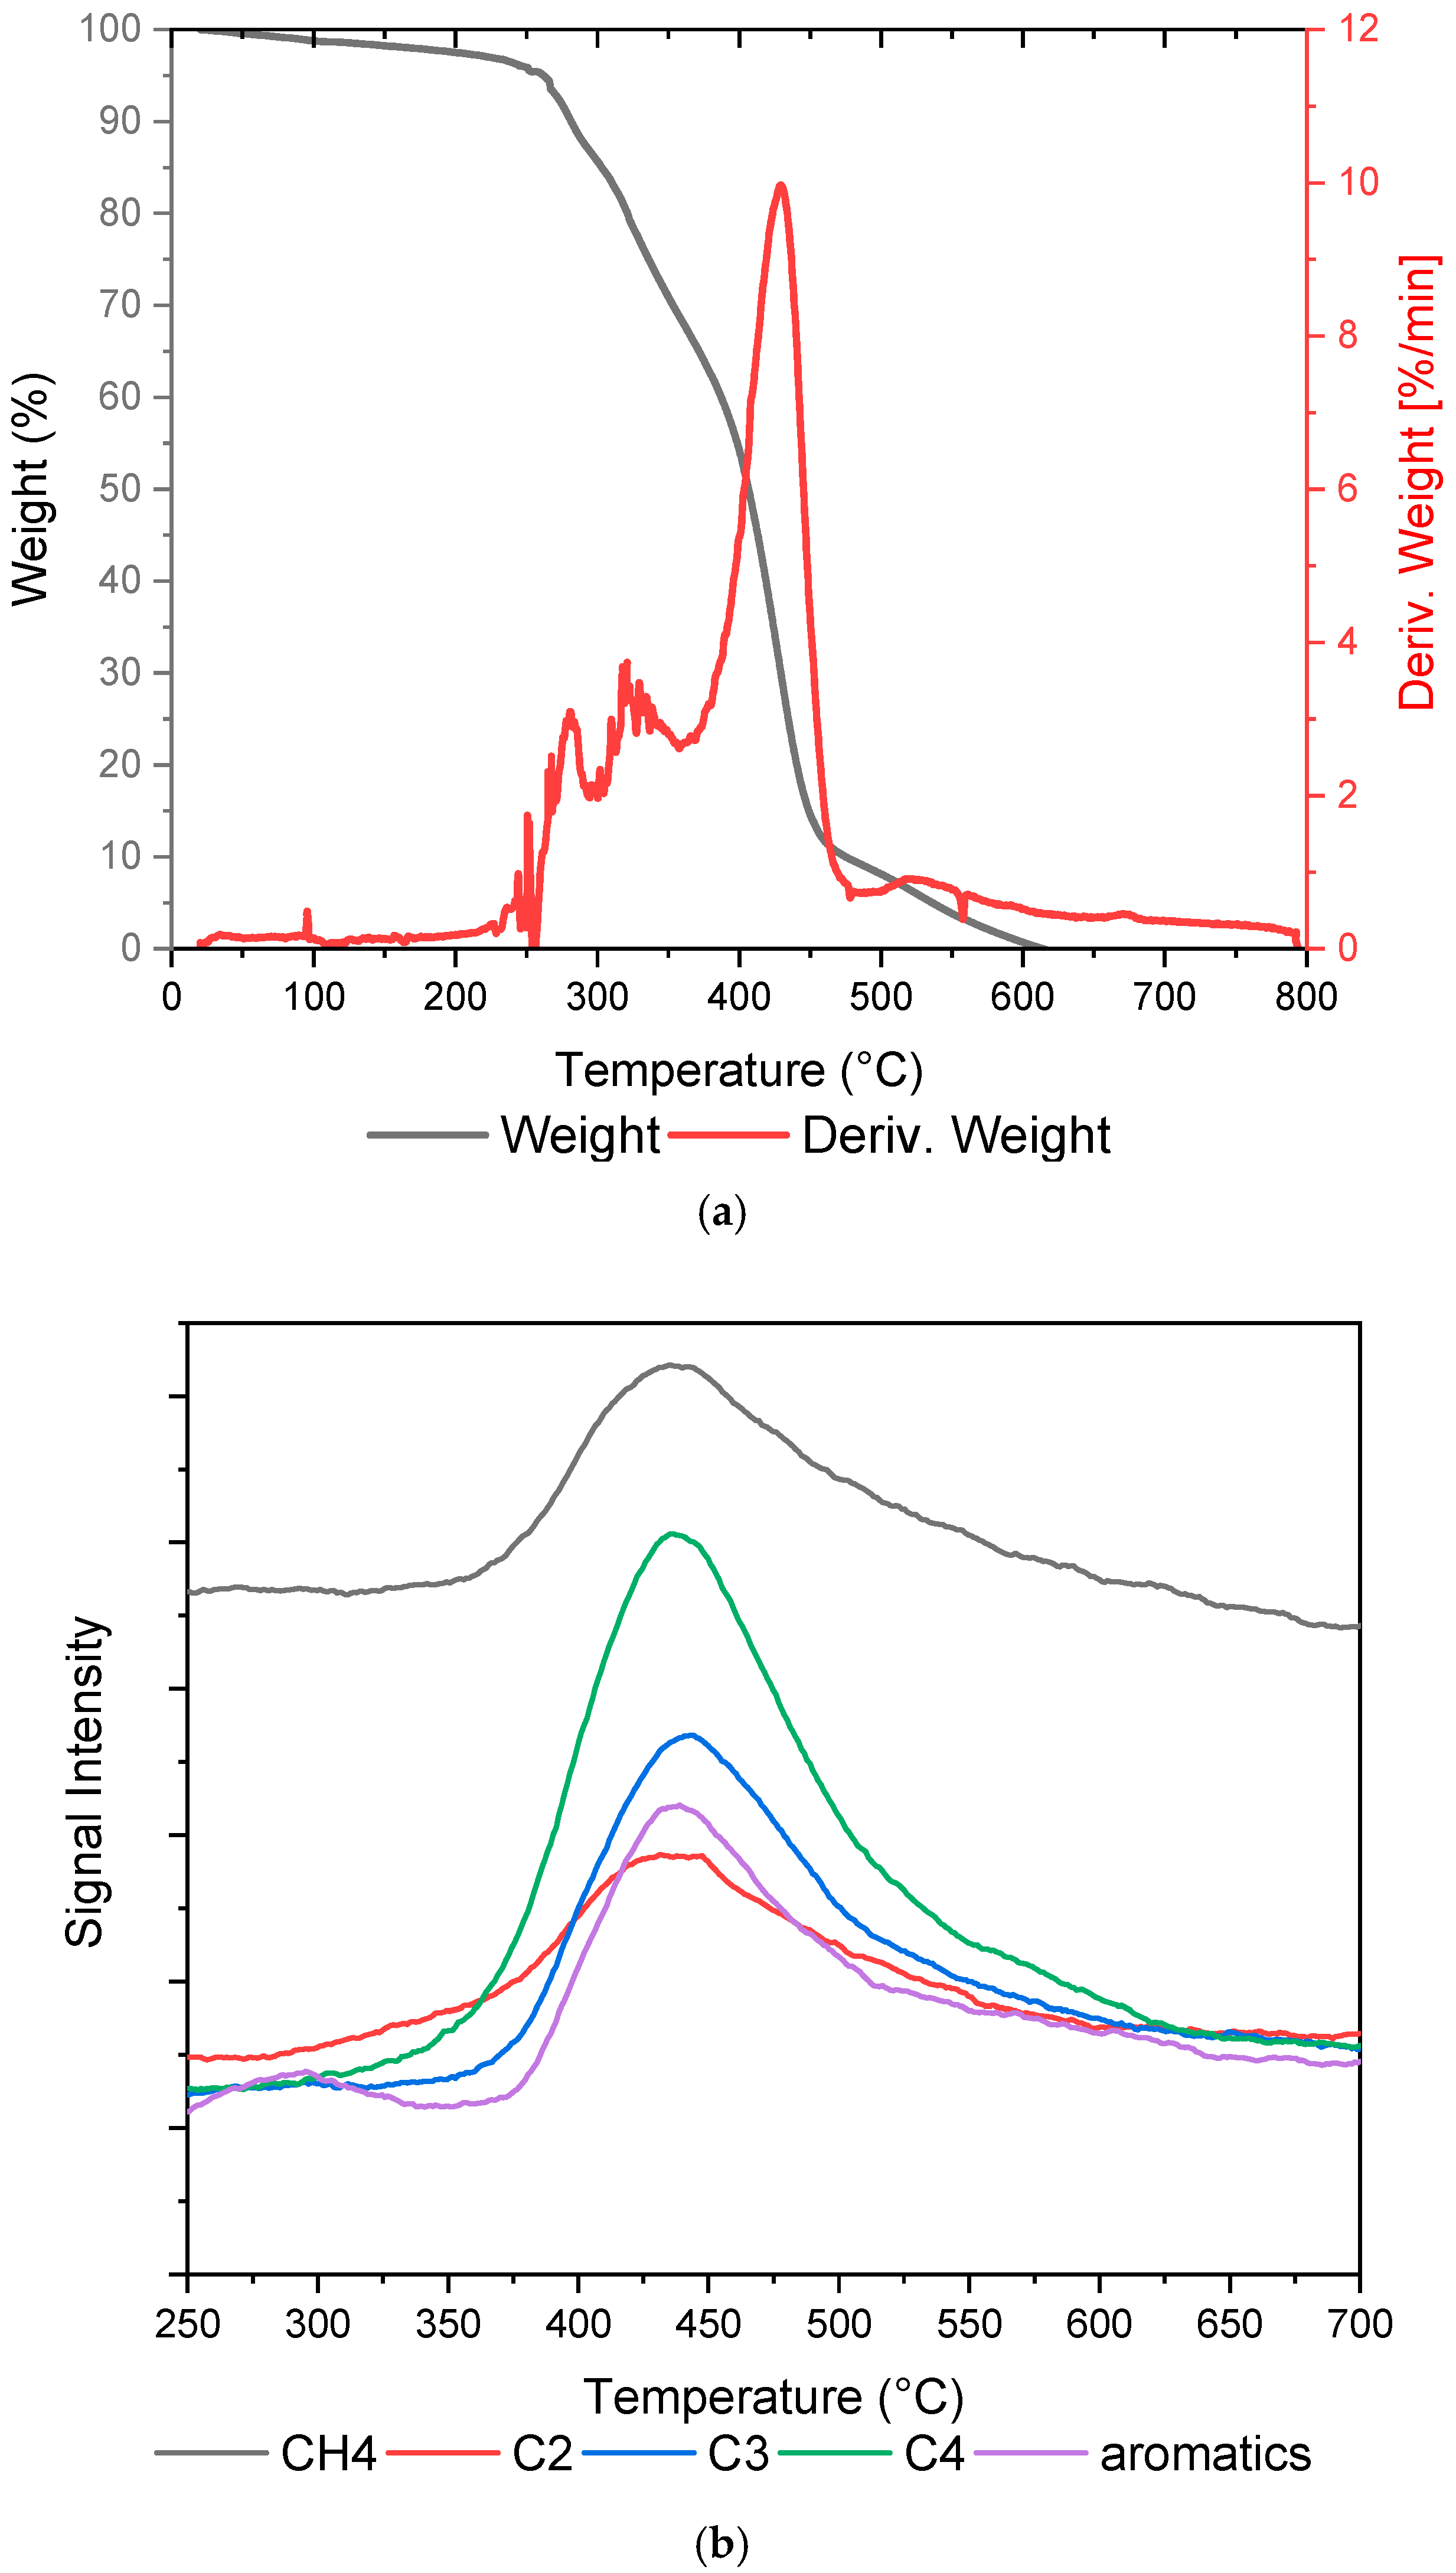
2.1. Plastic Waste Characterization
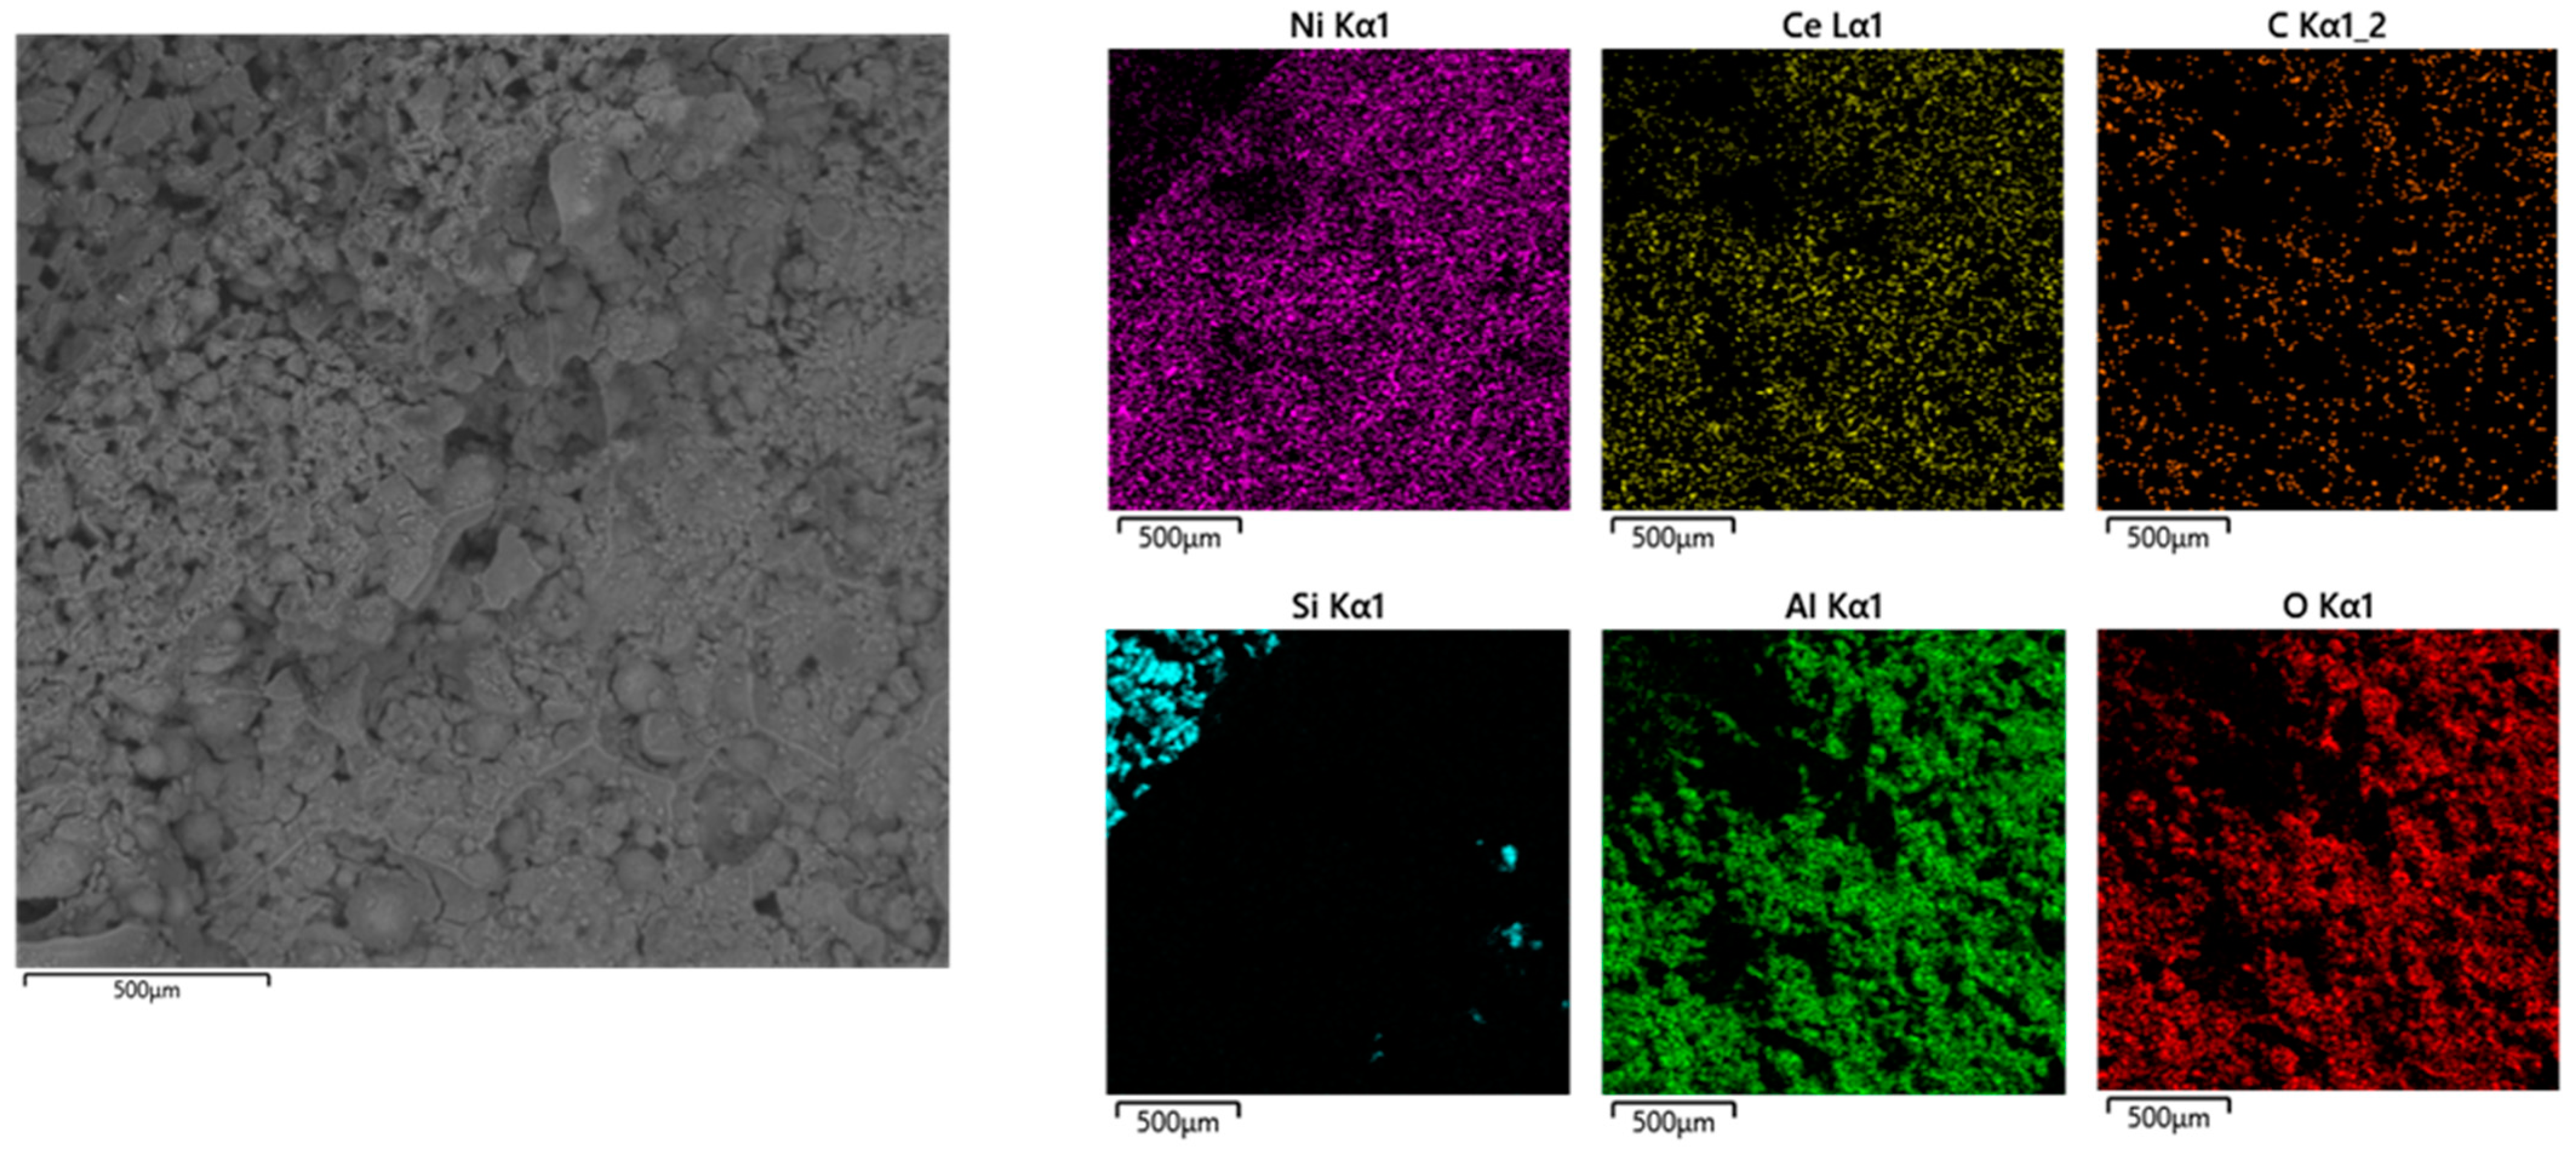
2.2. Catalyst Characterization
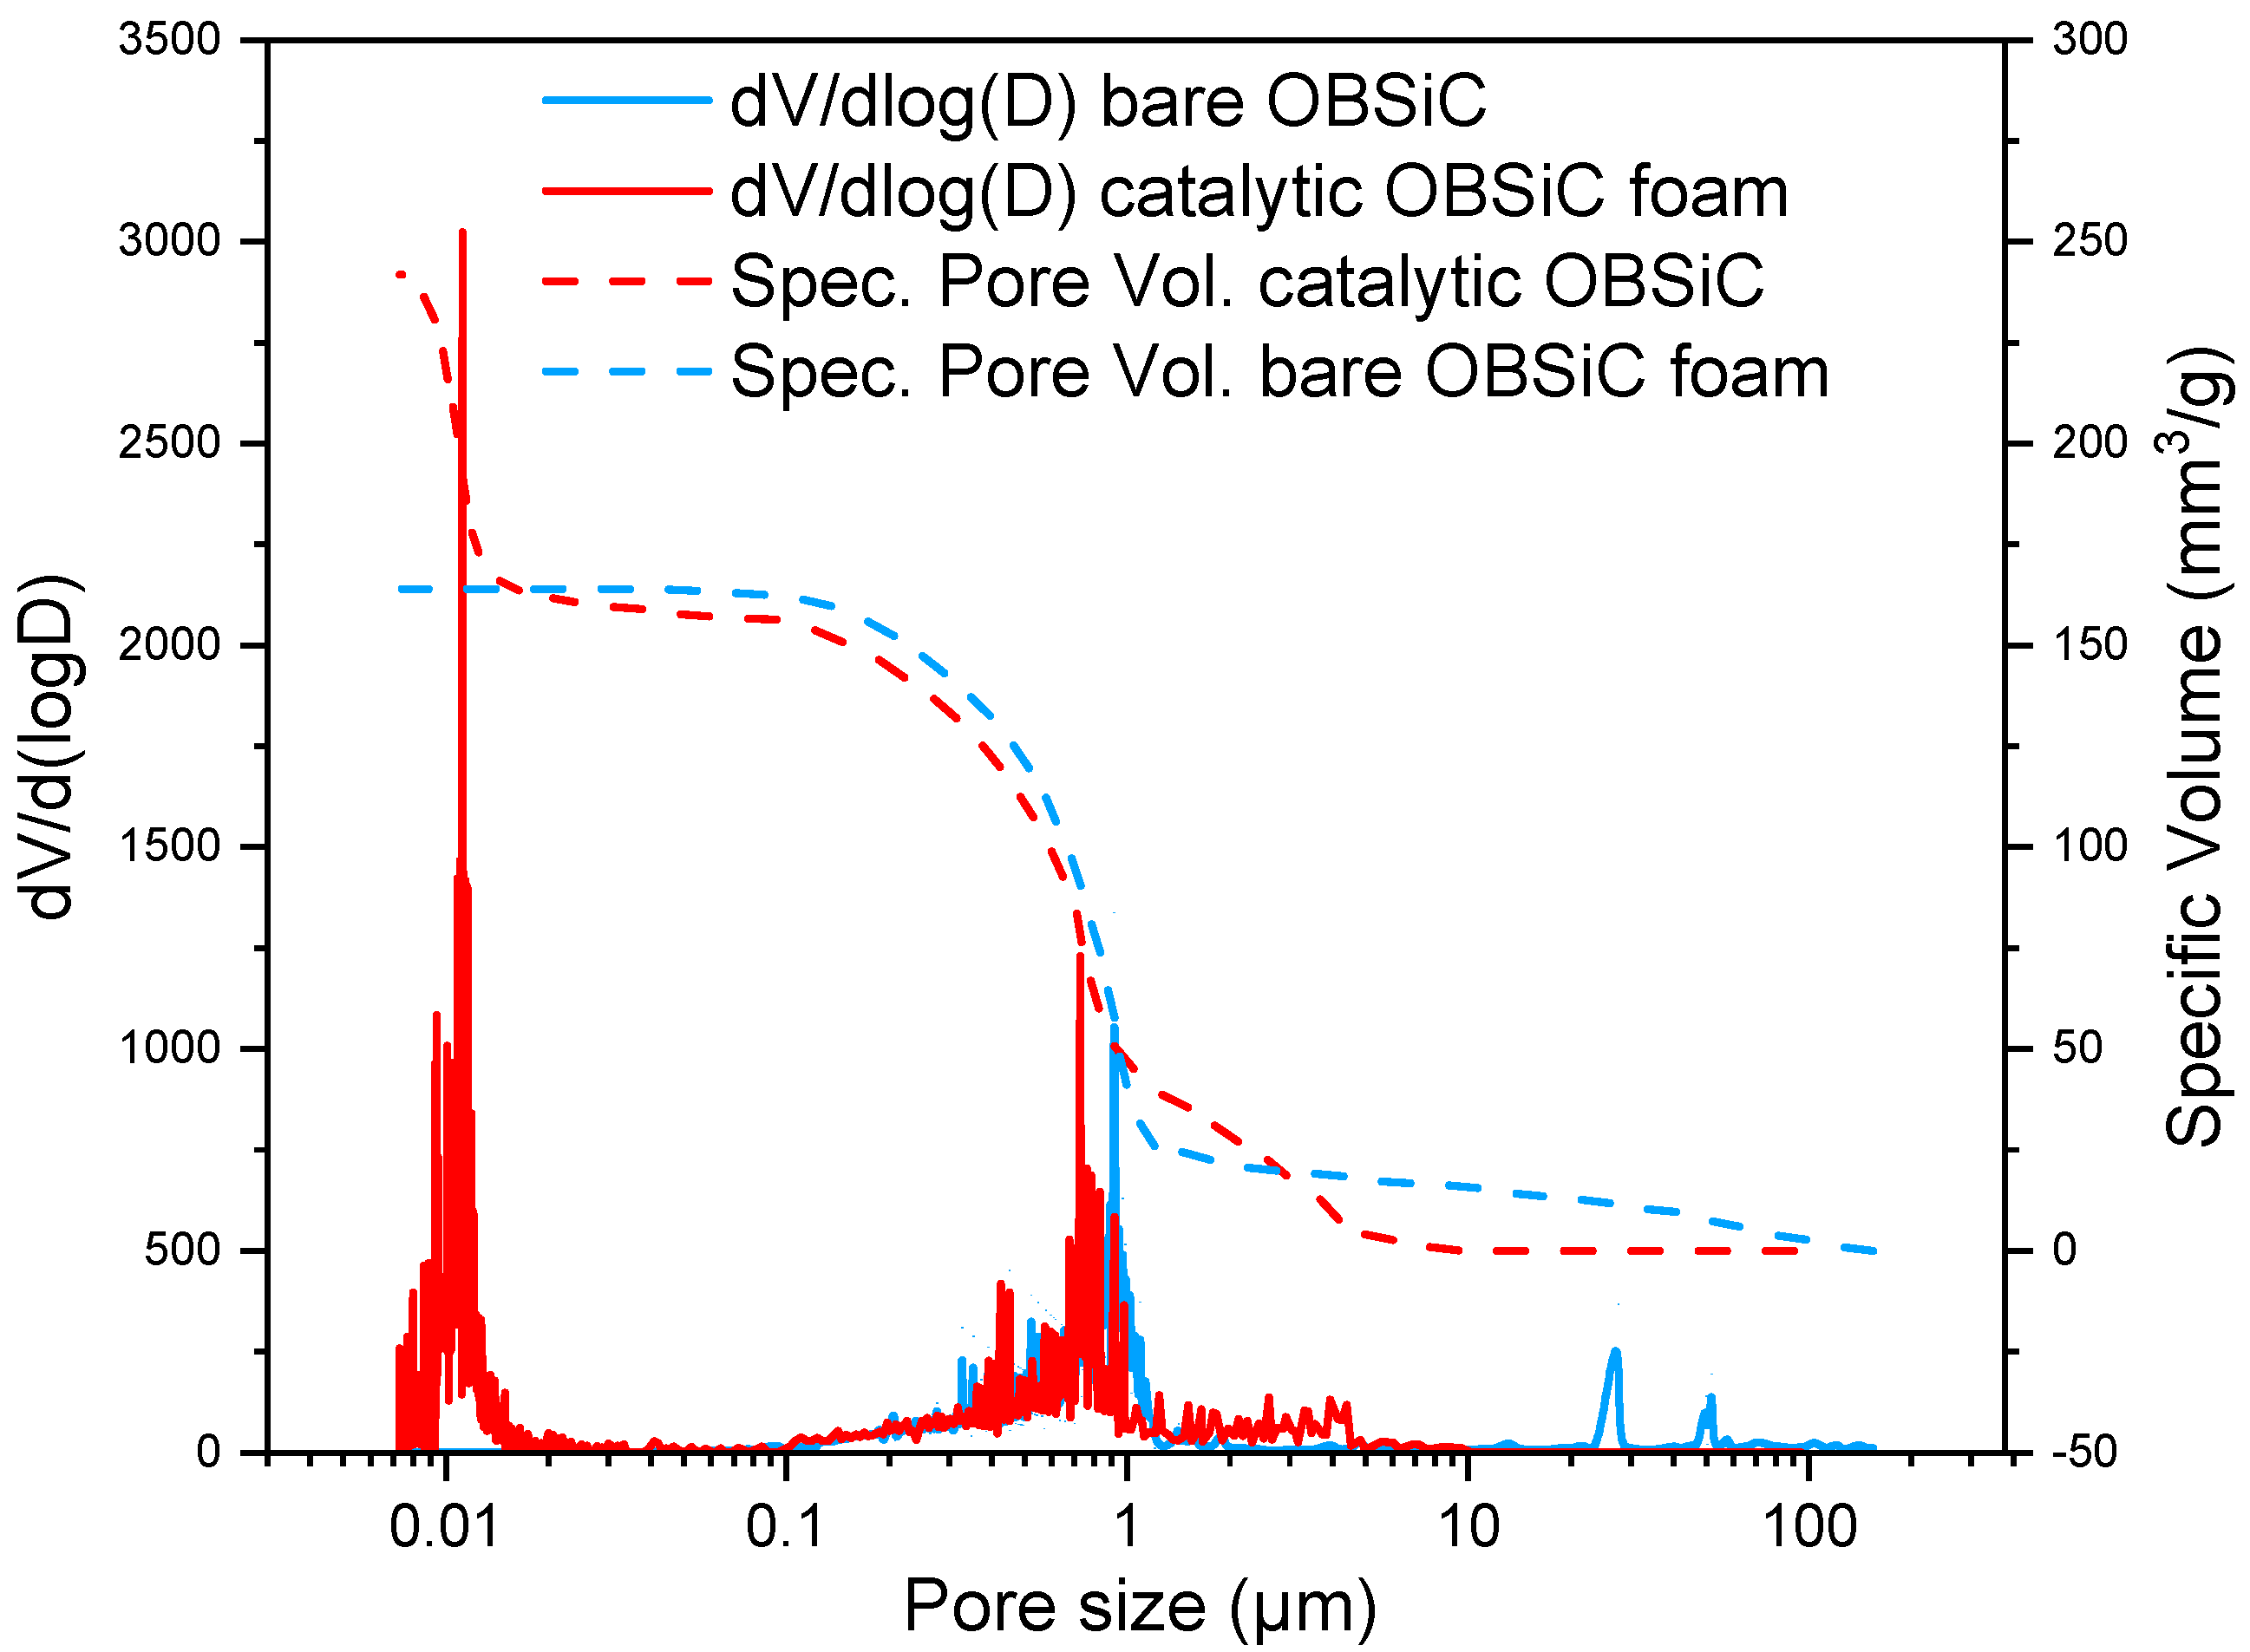
2.2.1. Porosity and Pore Size Distribution
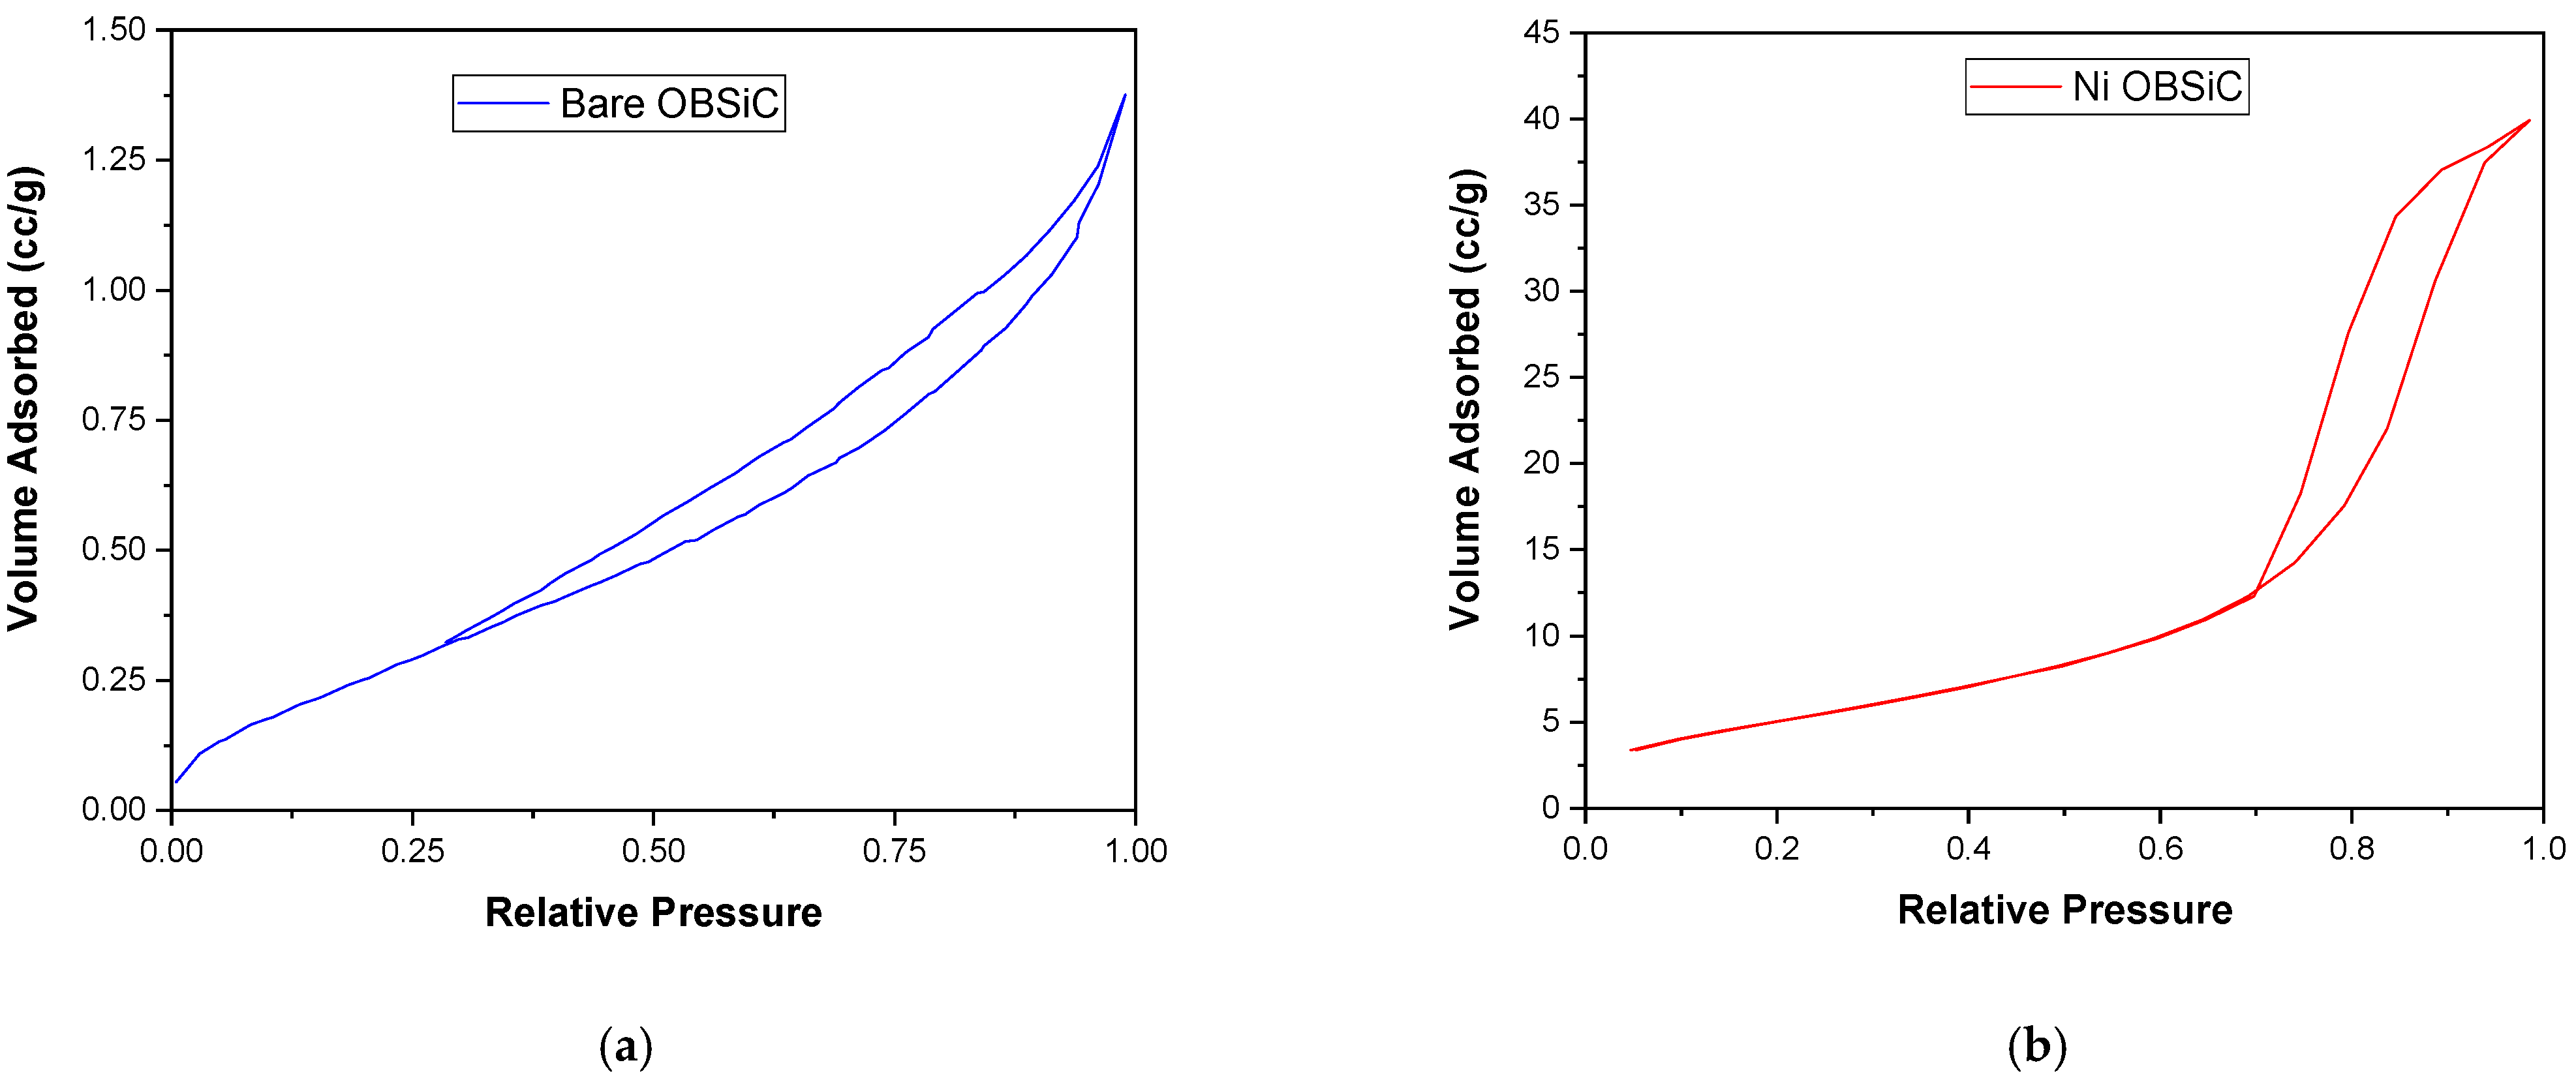
2.2.2. Textural Properties
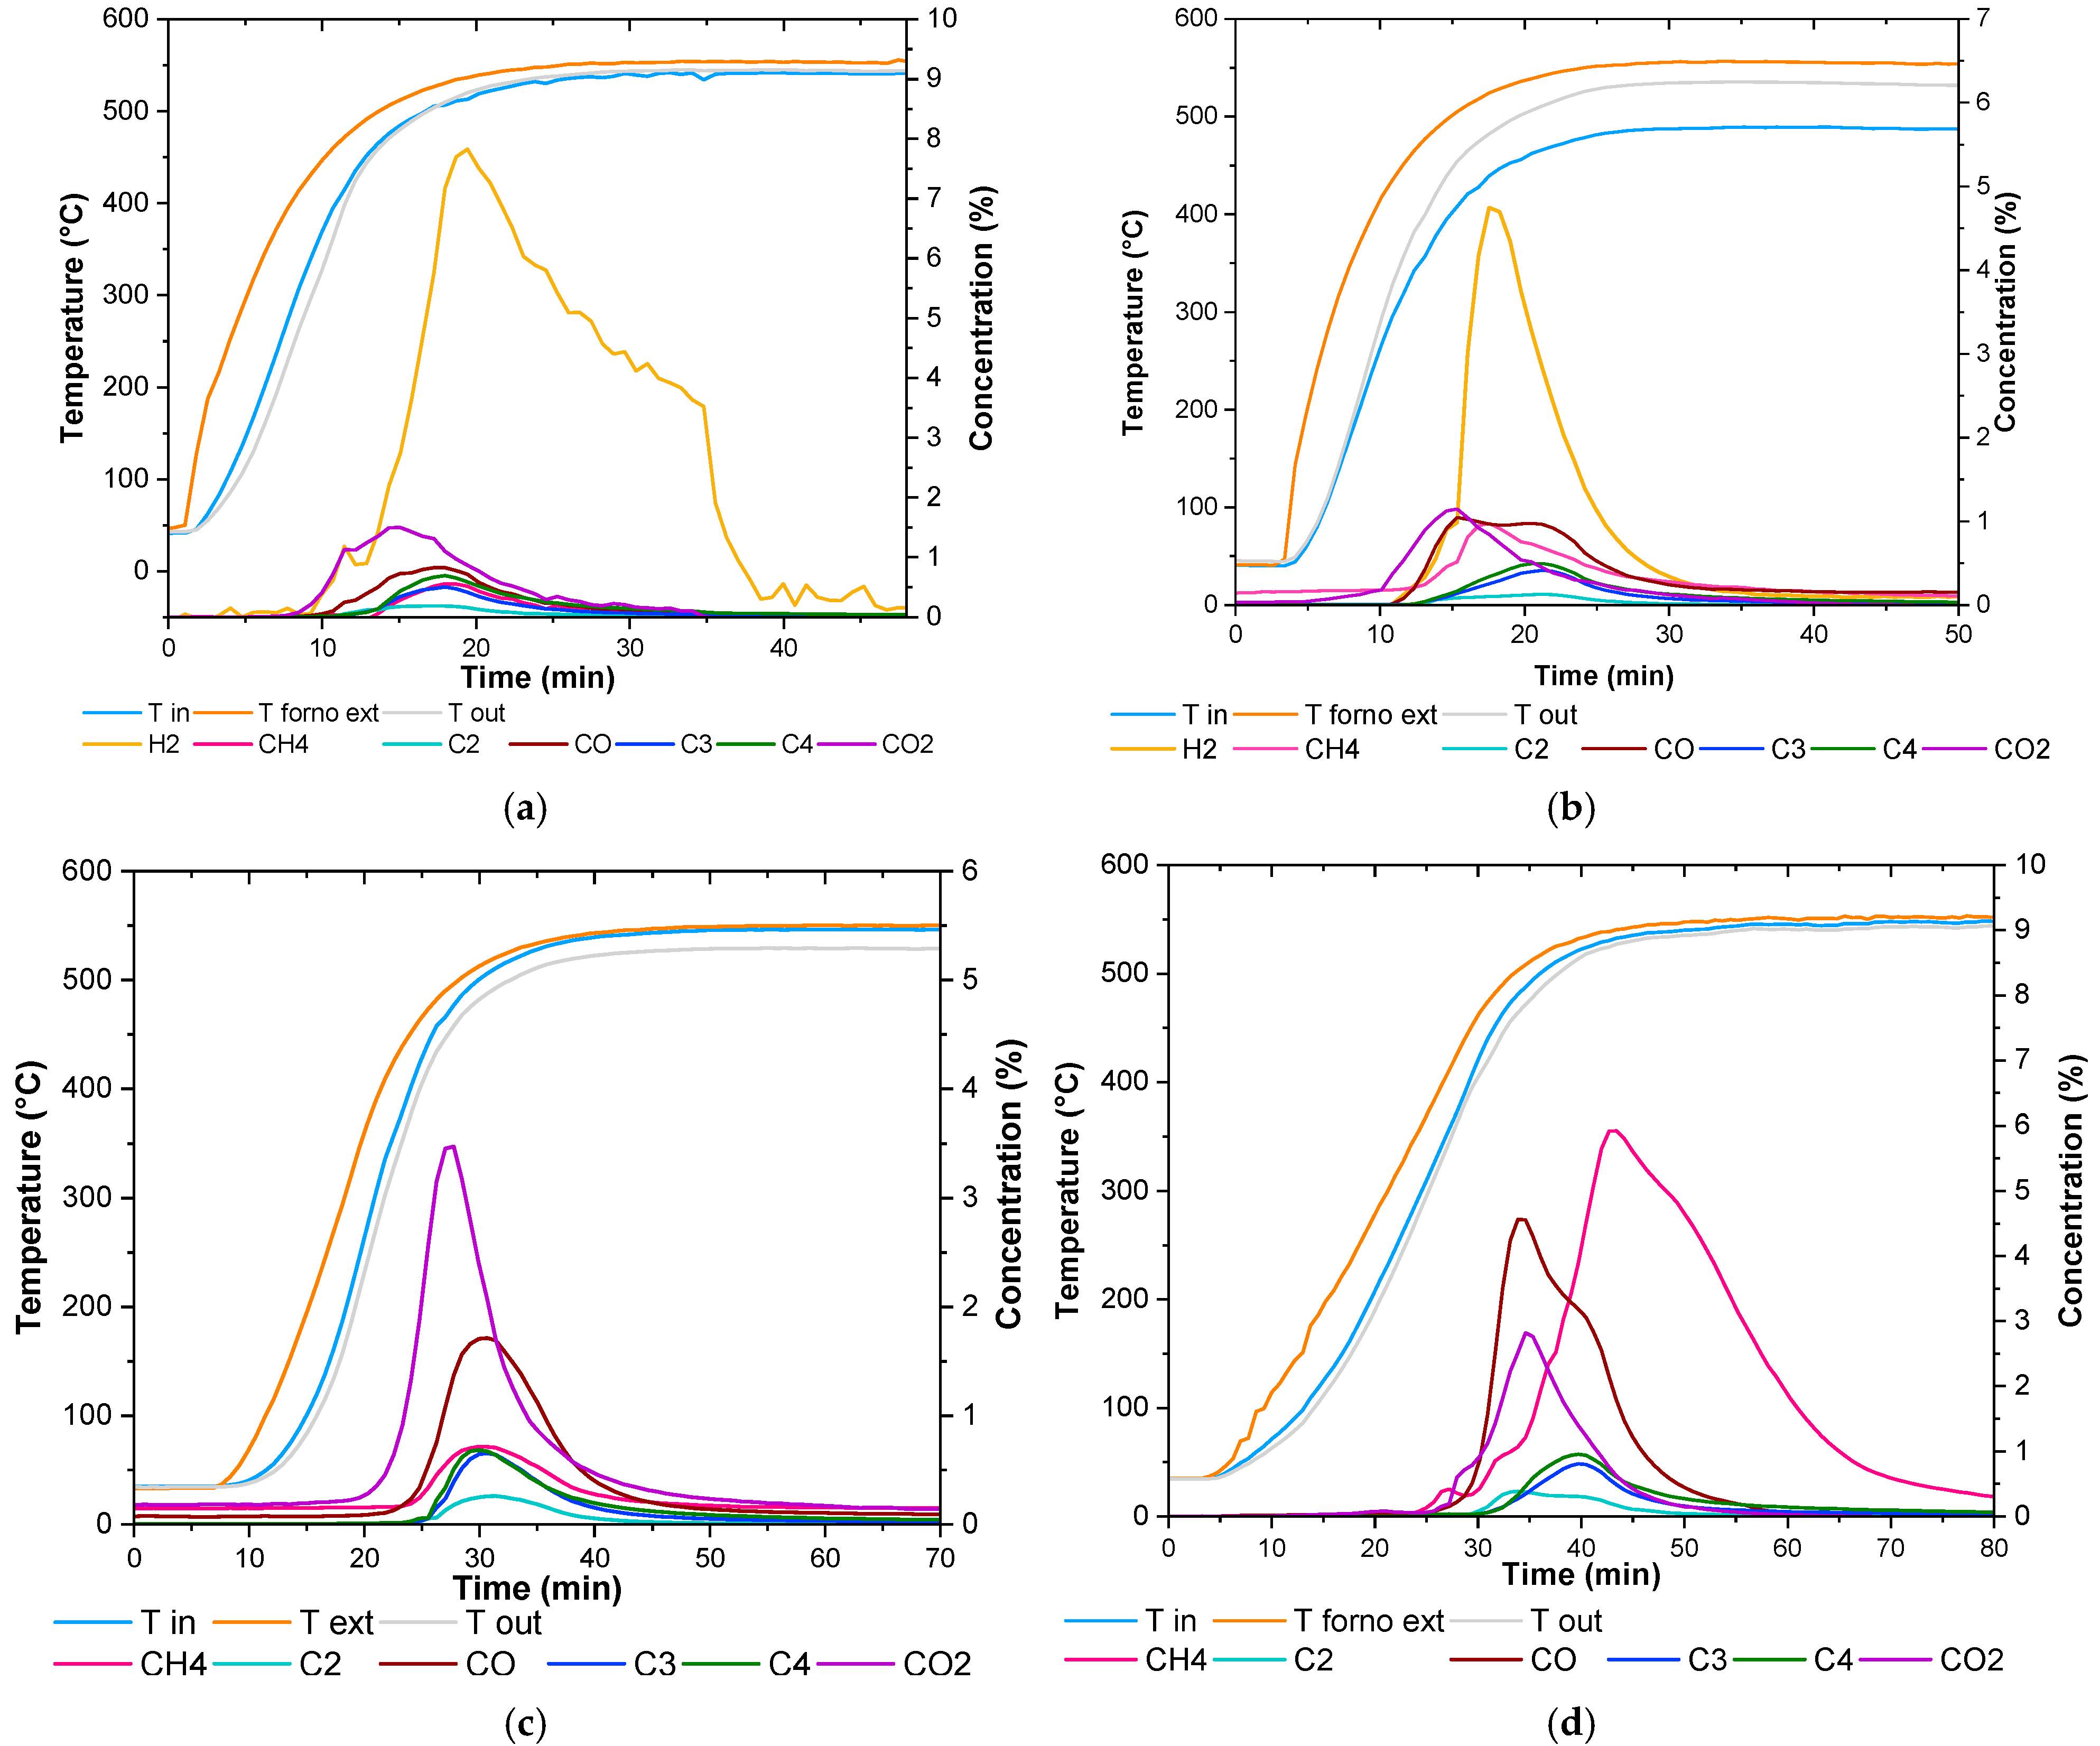
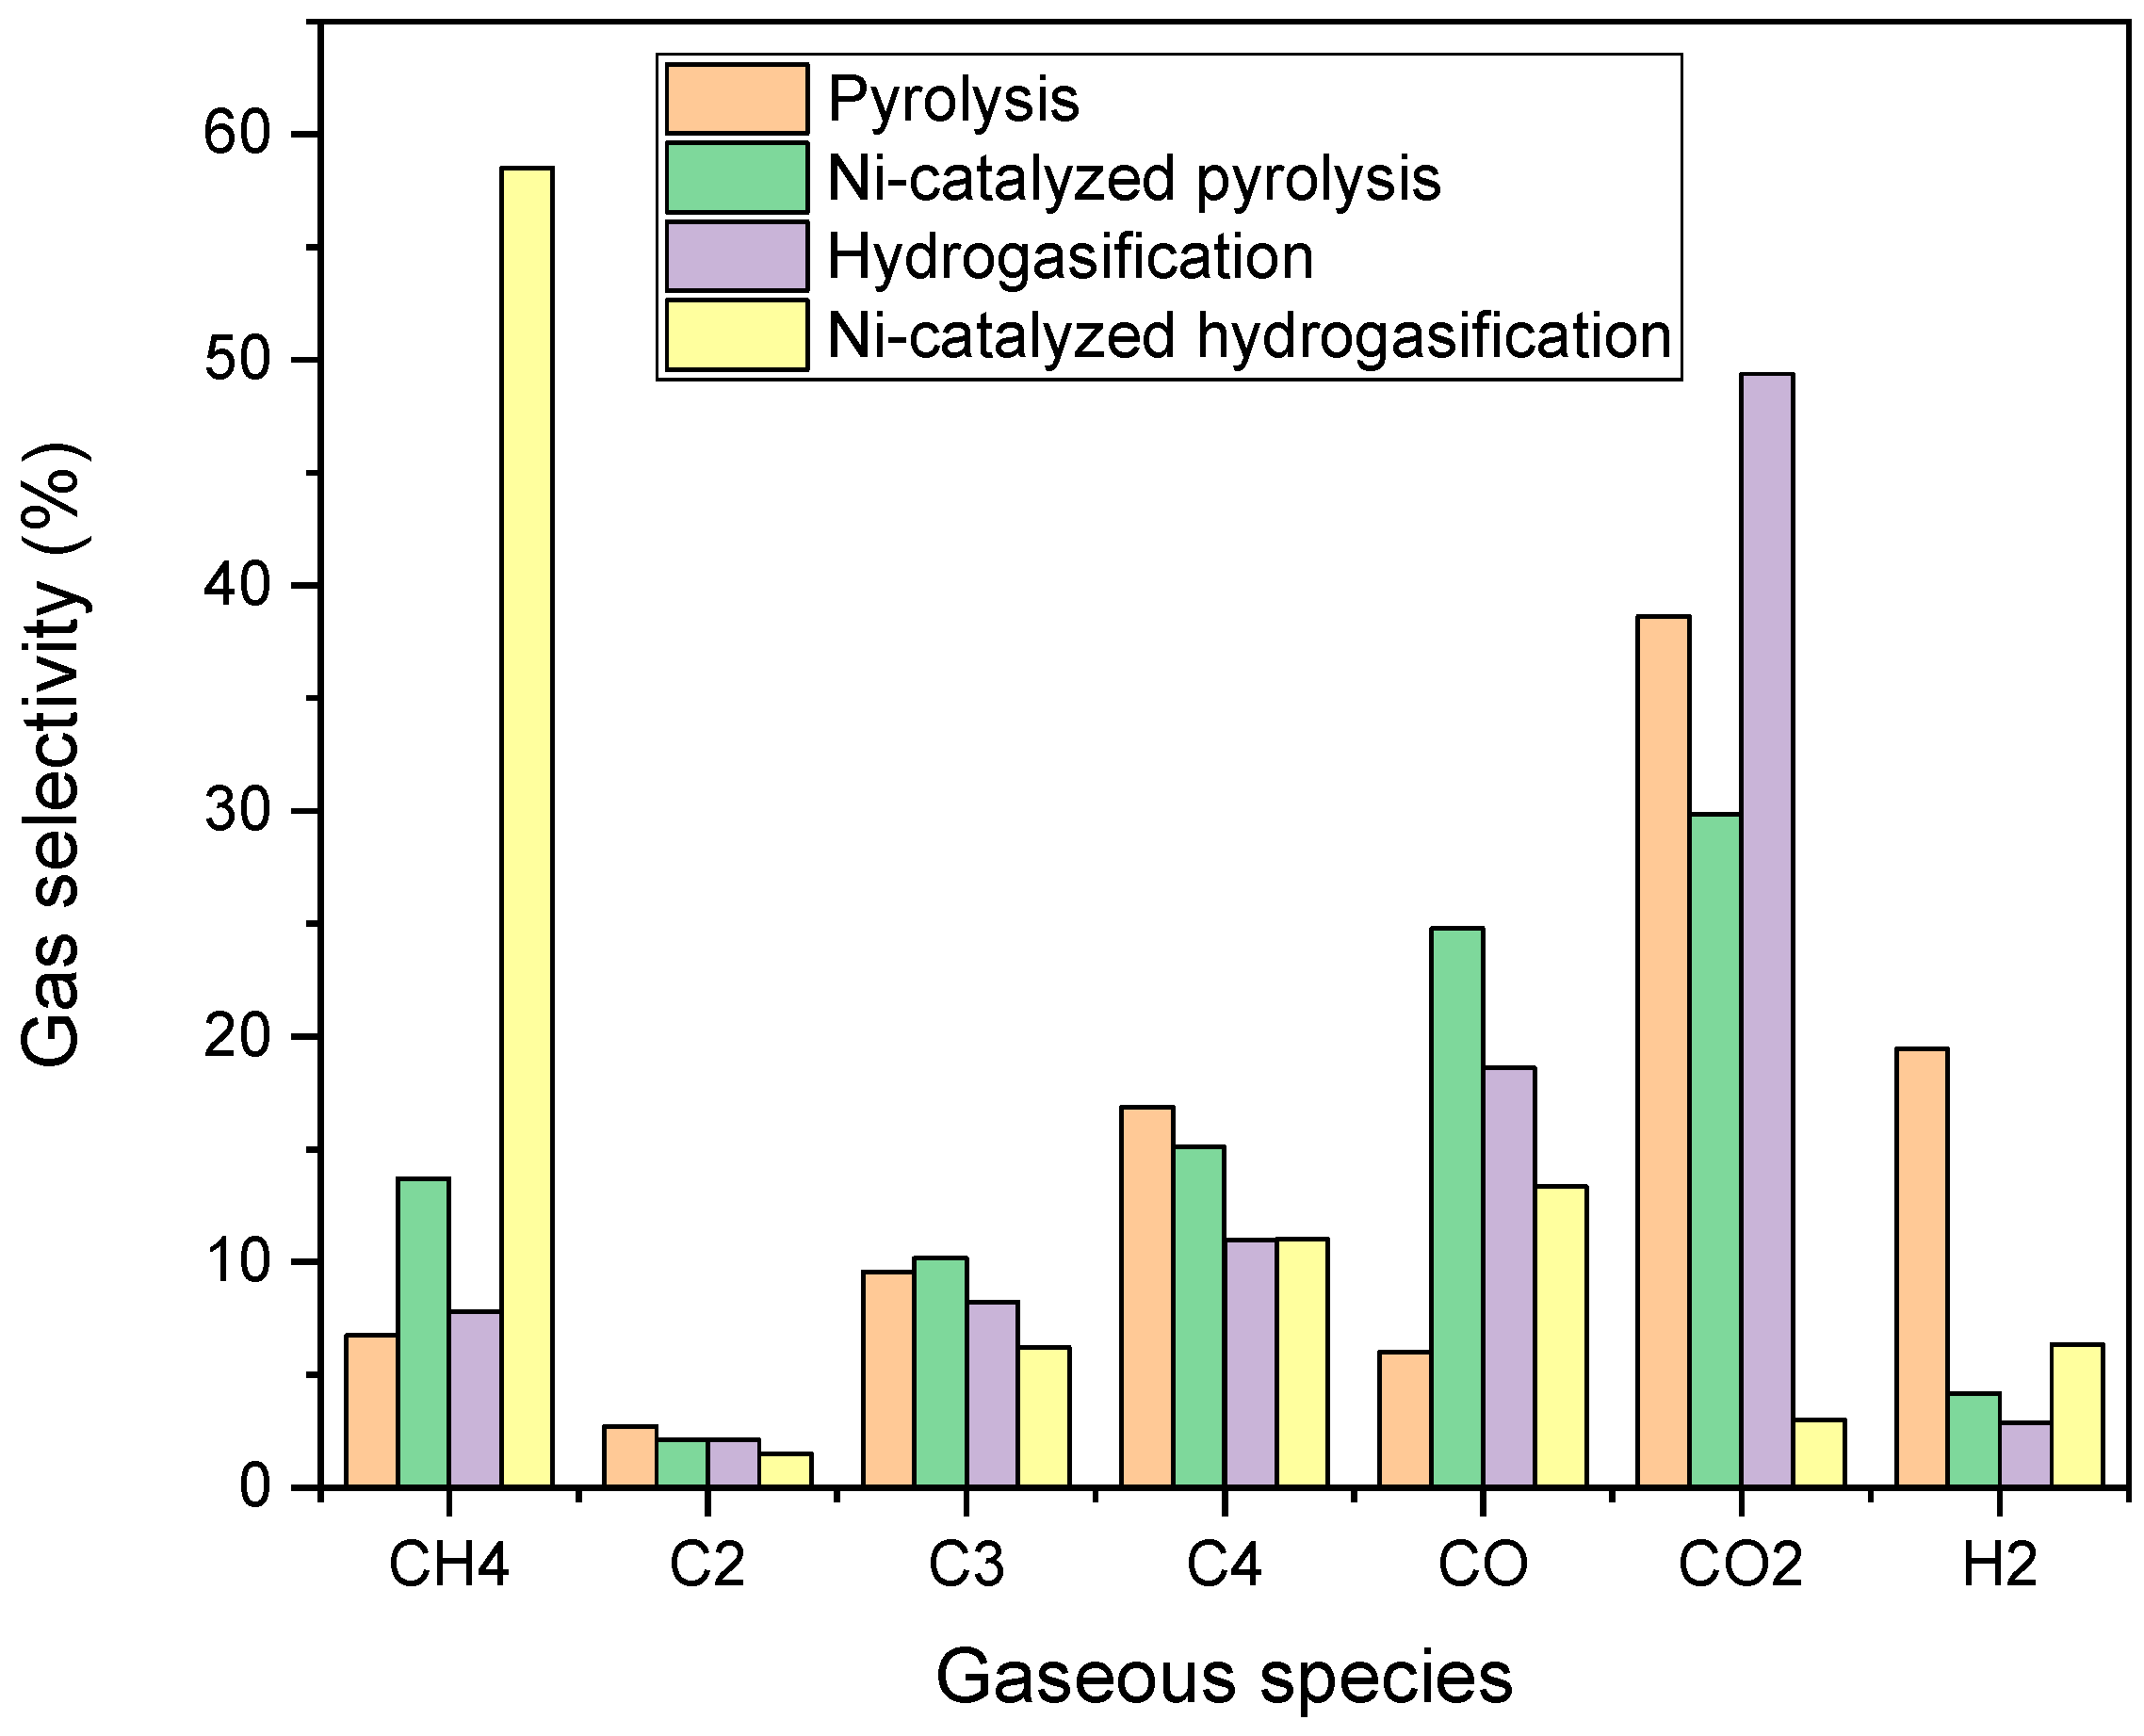
2.3. Experimental Test Results
2.4. Reaction Mechanism
3. Materials and Methods
3.1. Plastic Waste Matrix
3.2. Carrier for the Structured Catalyst
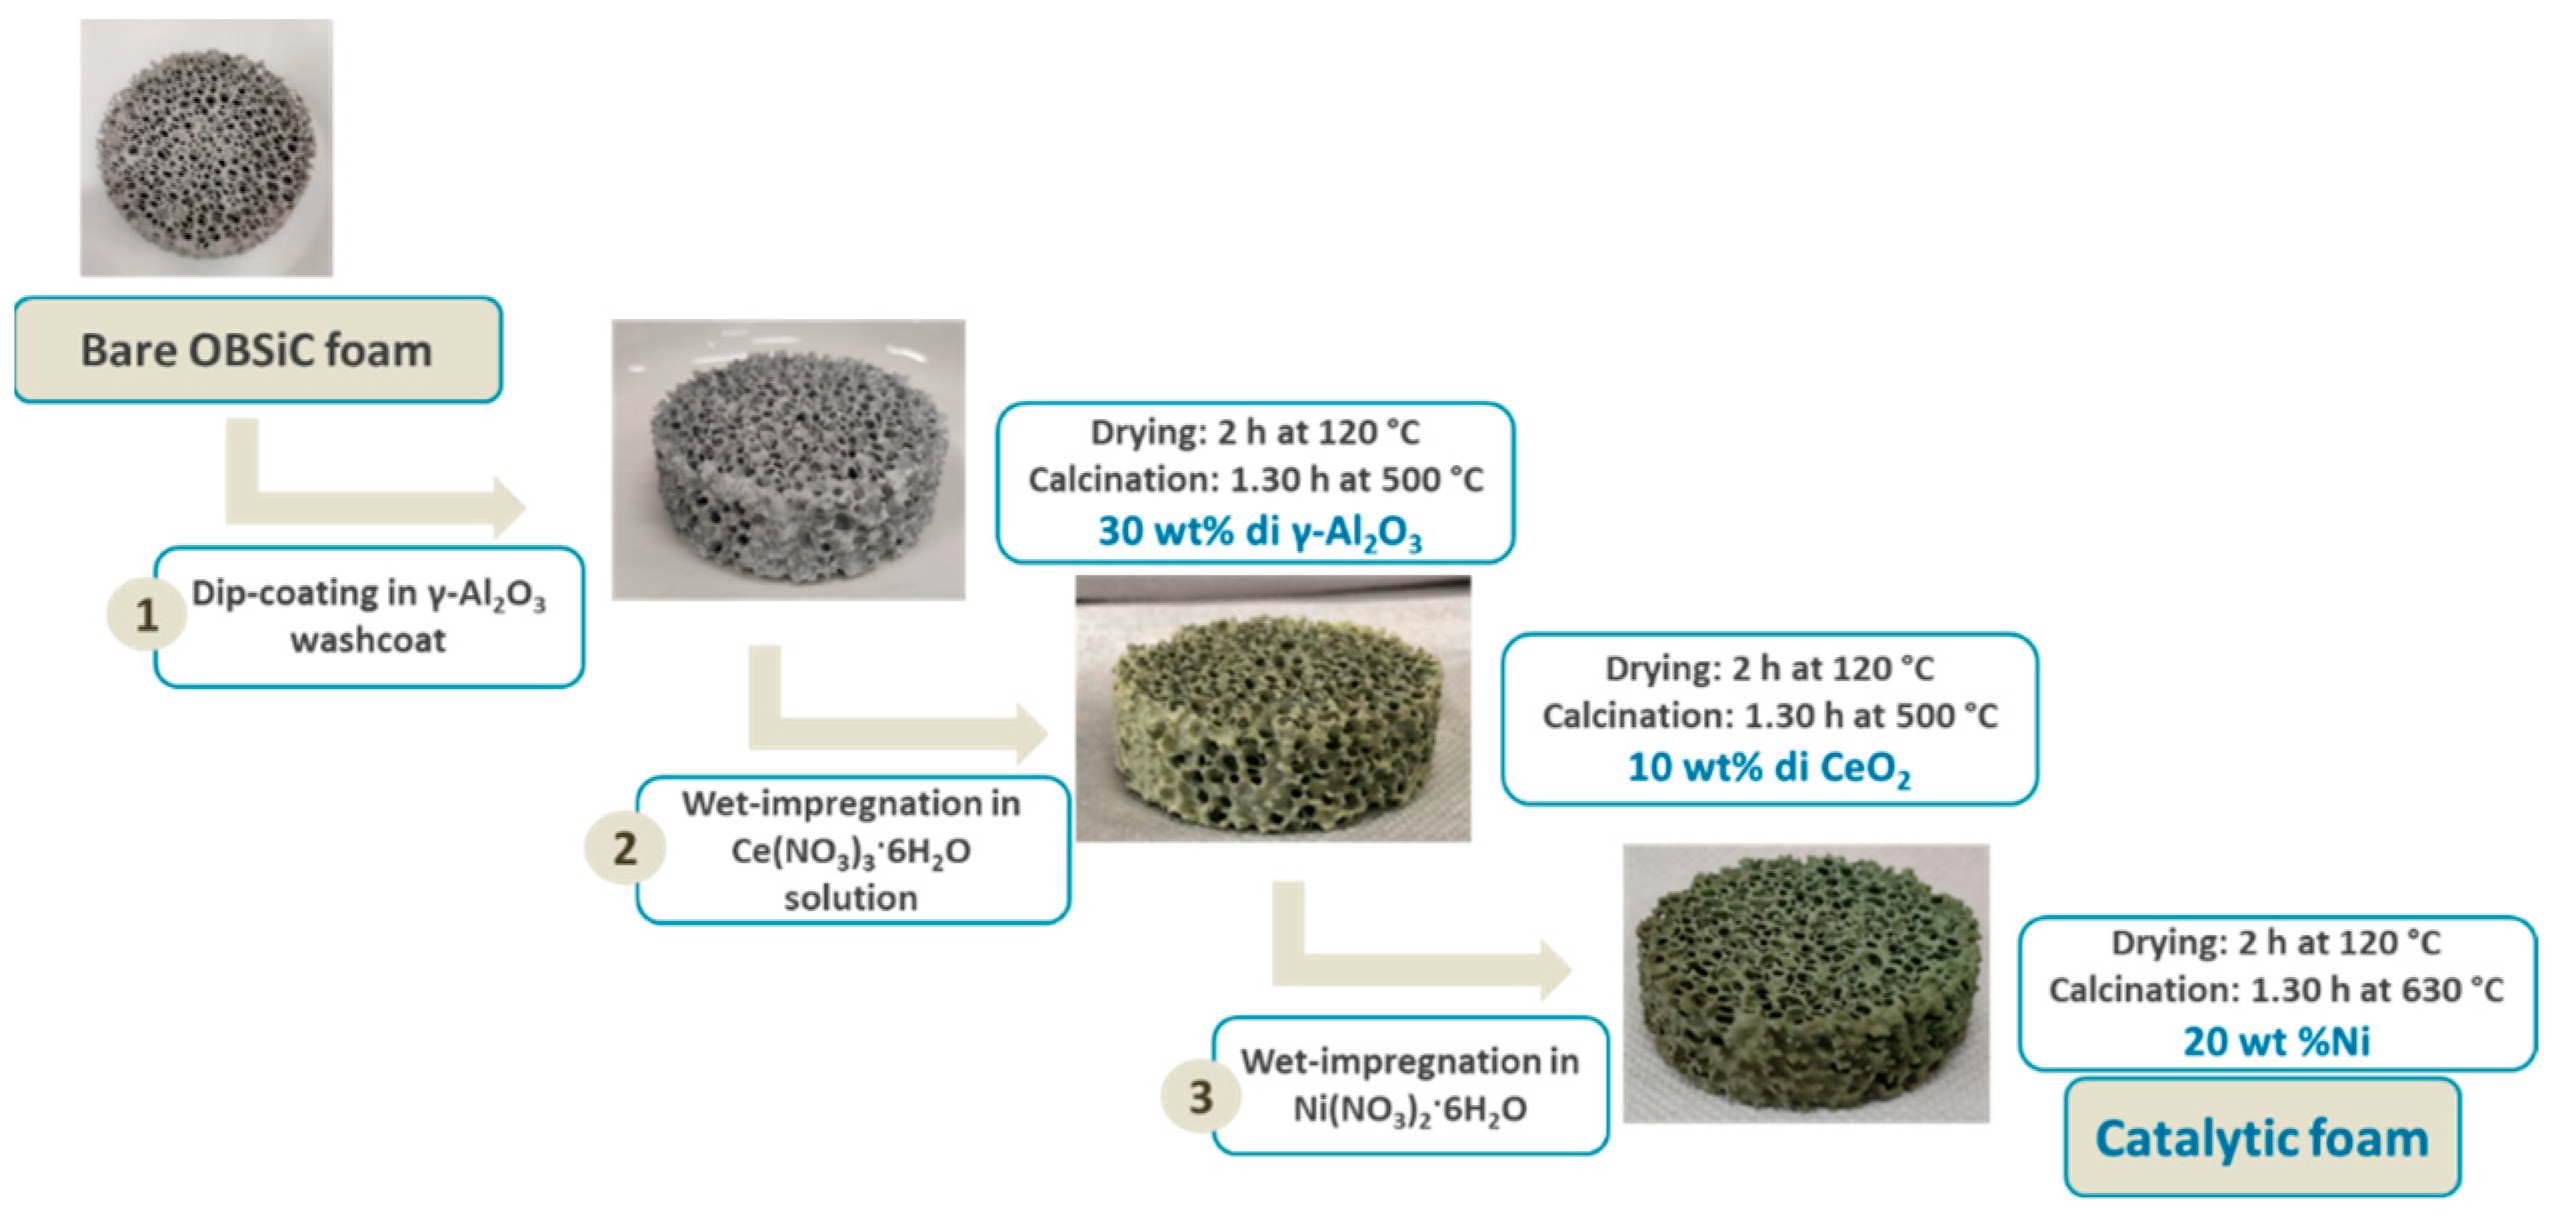
3.3. Preparation of the Structured Catalyst
3.4. Characterization Techniques
3.5. Experimental Plant and Test
- Feeding section: A battery of mass flow controllers (MFCs) is used for the regulation of flow rates of the different gases used. In particular, the gases are H2 and Ar for the reaction and CO and CO2 for the mass spectrometer calibration; N2 is used for the cooling step of the reactor.
- Reaction section: The reactor has a diameter of 1.5 cm and a length of 40 cm and is arranged in an oven which heats up to the reaction temperature. Two K-type thermocouples, located one on the plastic waste bed and one on the catalyst bed, are used to measure the temperatures; a pressure transducer measures the pressure upstream of the reactor. The gaseous products pass through a tube heated up to 200 °C and then undergo quick coaling in a flask dipped into a refrigerant liquid at −15 °C. This step allows for the condensation of the heavier hydrocarbons produced by the reaction. A detailed representation of this section is reported in Figure 12b.
- Analysis section: A mass spectrometer is used to analyze the gas composition of the products in continuous mode. Before each test, a gaseous stream with known composition is sent to calibrate the instrument, allowing the evaluation of the response factors; once this operation has been conducted, it is possible to start the test.
4. Conclusions
Author Contributions
Funding
Data Availability Statement
Acknowledgments
Conflicts of Interest
References
- Weldekidan, H.; Strezov, V.; Town, G. Review of solar energy for biofuel extraction. Renew. Sustain. Energy Rev. 2018, 88, 184–192. [Google Scholar] [CrossRef]
- Morales, S.; Miranda, R.; Bustos, D.; Cazares, T.; Tran, H. Solar biomass pyrolysis for the production of bio-fuels and chemical commodities. J. Anal. Appl. Pyrolysis 2014, 109, 65–78. [Google Scholar] [CrossRef]
- Meloni, E.; Iervolino, G.; Ruocco, C.; Renda, S.; Festa, G.; Martino, M.; Palma, V. Electrified Hydrogen Production from Methane for PEM Fuel Cells Feeding: A Review. Energies 2022, 15, 3588. [Google Scholar] [CrossRef]
- Meloni, E.; Martino, M.; Iervolino, G.; Ruocco, C.; Renda, S.; Festa, G.; Palma, V. The Route from Green H2 Production through Bioethanol Reforming to CO2 Catalytic Conversion: A Review. Energies 2022, 15, 2383. [Google Scholar] [CrossRef]
- Lee, K.; Jing, Y.; Wang, J.; Yan, N. A unified view on catalytic conversion of biomass and waste plastics. Nat. Res. 2022, 6, 635–652. [Google Scholar] [CrossRef]
- Plastics-the Facts 2019 An Analysis of European Plastics Production, Demand and Waste Data. Available online: https://plasticseurope.org/wp-content/uploads/2021/10/2019-Plastics-the-facts.pdf (accessed on 29 November 2024).
- Wang, Z.; Burra, K.G.; Lei, T.; Gupta, A.K. Co-pyrolysis of waste plastic and solid biomass for synergistic production of biofuels and chemicals-A review. Prog. Energy Combust. Sci. 2021, 84, 100899. [Google Scholar] [CrossRef]
- Geyer, R.; Jambeck, J.R.; Law, K.L. Production, use, and fate of all plastics ever made. Sci. Adv. 2017, 3, e1700782. [Google Scholar] [CrossRef] [PubMed]
- Tosti, S.; Spazzafumo, G.; Capobianco, D.; Buceti, G.; Pozio, A.; Bartucca, S. EU scenarios of renewable coal hydro-gasification for SNG production. Sustain. Energy Technol. Assess. 2016, 16, 43–52. [Google Scholar] [CrossRef]
- Yan, L.; He, B.; Ma, L.; Pei, X.; Wang, C. Chemical equilibrium model and prediction for coal hydrogasification. Int. J. Chem. React. Eng. 2014, 12, 103–112. [Google Scholar] [CrossRef]
- Barbuzza, E.; Buceti, G.; Pozio, A.; Santarelli, M.; Tosti, S. Gasification of wood biomass with renewable hydrogen for the production of synthetic natural gas. Fuel 2019, 242, 520–531. [Google Scholar] [CrossRef]
- Melaina, M.W.; Antonia, O.; Penev, M. Blending Hydrogen into Natural Gas Pipeline Networks: A Review of Key Issues. 2013. Available online: http://www.osti.gov/bridge (accessed on 29 November 2024).
- Murakami, K.; Arai, M.; Shirai, M. Hydrogasification of Loy Yang Brown Coal by Ion-Exchanged Nickel Species. Energy Fuels 2000, 14, 1240–1244. [Google Scholar] [CrossRef]
- Haga, T.; Ozaki, J.-I.; Suzuki, K.; Nishiyama, Y. Role of MgO and CaO Promoters in Ni-Catalyzed Hydrogenation Reactions of CO and Carbon. J. Catal. 1992, 134, 107–117. [Google Scholar] [CrossRef]
- Haga, T.; Nishiyama, Y. Promotion of iron-group catalyst by calcium salts in hydrogasification of carbons at elevated pressures. Ind. Eng. Chem. Res. 1987, 26, 1202–1206. [Google Scholar] [CrossRef]
- Zhang, F.; Sun, H.; Bi, J.; Qu, X.; Yan, S.; Zhang, J.; Zhang, J. The evolution of Fe and Fe-Ca catalysts during char catalytic hydrogasification. Fuel 2019, 257, 116040. [Google Scholar] [CrossRef]
- Yan, S.; Qu, X.; Xia, Z.; Chen, C.; Bi, J. Effect of experimental variables on coal catalytic hydrogasification in a pressurized fluidized bed. Fuel 2022, 307, 121761. [Google Scholar] [CrossRef]
- Qu, X.; Wang, Q.F.; Yan, S.; Feng, J.; Zhang, J.S.; Zhang, R.; Bi, J.C. The behavior of the different catalysts for model carbon hydrogasification. J. Fuel Chem. Technol. 2022, 50, 1–10. [Google Scholar] [CrossRef]
- Qu, X.; Yan, S.; Yan, X.; Zhang, J.; Zheng, Q.; An, Y. Role of cobalt and calcium on coal catalytic hydrogasification in a pressurized fluidized bed. Fuel 2019, 239, 347–356. [Google Scholar] [CrossRef]
- Yan, S.; Bi, J.; Qu, X. The behavior of catalysts in hydrogasification of sub-bituminous coal in pressured fluidized bed. Appl. Energy 2017, 206, 401–412. [Google Scholar] [CrossRef]
- Yan, S.; Zhang, J.; Yan, X.; Pan, D.; Ren, H.; Qu, X. Catalytic coal hydrogasification by cobalt-calcium catalyst in a pressurized fluidized bed: Role of hydropyrolysis and catalysis process. J. Anal. Appl. Pyrolysis 2018, 135, 251–259. [Google Scholar] [CrossRef]
- Jiang, J.; Liu, Z.; Liu, Q. Synergetic catalysis of calcium oxide and iron in hydrogasification of char. Energy Fuels 2017, 31, 198–204. [Google Scholar] [CrossRef]
- Sun, H.; Wang, J.; Bi, J.; Zhang, R.; Qu, X.; Zhang, J.; Zhang, J. Investigating the Cu-based catalysts for char catalytic hydrogasification and its recovery. Fuel 2021, 294, 120567. [Google Scholar] [CrossRef]
- Sun, H.; Zhang, F.; Bi, J.; Qu, X.; Yan, S.; Zhang, J.; Zhang, J. Study of Cu-Ni-Ca Composite Catalysts in Catalytic Hydrogasification of Char. Energy Fuels 2019, 33, 9661–9670. [Google Scholar] [CrossRef]
- Skodras, G.; Panagiotidou, S.; Kokorotsikos, P.; Serafidou, M. Potassium catalyzed hydrogasification of low-rank coal for synthetic natural gas production. Open Chem. 2016, 14, 92–102. [Google Scholar] [CrossRef]
- Dai, L.; Zhou, N.; Lv, Y.; Cheng, Y.; Wang, Y.; Liu, Y.; Cobb, K.; Chen, P.; Lei, H.; Ruan, R. Pyrolysis technology for plastic waste recycling: A state-of-the-art review. Prog. Energy Combust. Sci. 2022, 93, 101021. [Google Scholar] [CrossRef]
- Xuan, W.; Yan, S.; Dong, Y. Exploration of Pyrolysis Behaviors of Waste Plastics (Polypropylene Plastic/Polyethylene Plastic/Polystyrene Plastic): Macro-Thermal Kinetics and Micro-Pyrolysis Mechanism. Processes 2023, 11, 2764. [Google Scholar] [CrossRef]
- Cychosz, K.A.; Guillet-Nicolas, R.; García-Martínez, J.; Thommes, M. Recent advances in the textural characterization of hierarchically structured nanoporous materials. R. Soc. Chem. 2017, 46, 389–414. [Google Scholar] [CrossRef]
- Cychosz, K.A.; Thommes, M. Progress in the Physisorption Characterization of Nanoporous Gas Storage Materials. Engineering 2018, 4, 559–566. [Google Scholar] [CrossRef]
- Ewald, S.; Hinrichsen, O. On the interaction of CO2 with Ni-Al catalysts. Appl. Catal. A Gen. 2019, 580, 71–80. [Google Scholar] [CrossRef]
- Hong, D.; Li, P.; Si, T.; Guo, X. ReaxFF simulations of the synergistic effect mechanisms during co-pyrolysis of coal and polyethylene/polystyrene. Energy 2021, 218, 119553. [Google Scholar] [CrossRef]
- Albeladi, D.; Alsulami, Q.A.; Narasimharao, K. Recent Progress in Nickel and Silica Containing Catalysts for CO2 Hydrogenation to CH4. Catalysts 2023, 13, 1104. [Google Scholar] [CrossRef]
- Lv, C.; Xu, L.; Chen, M.; Cui, Y.; Wen, X.; Li, Y.; Wu, C.E.; Yang, B.; Miao, Z.; Hu, X.; et al. Recent Progresses in Constructing the Highly Efficient Ni Based Catalysts with Advanced Low-Temperature Activity Toward CO2 Methanation. Front. Chem. 2020, 8, 269. [Google Scholar] [CrossRef] [PubMed]
- Pan, Q.; Peng, P.; Sun, T.; Wang, S.; Wang, S. Insight into the reaction route of CO2 methanation: Promotion effect of medium basic sites. Catal. Commun. 2014, 45, 74–78. [Google Scholar] [CrossRef]
- Zhao, K.; Li, Z.; Bian, L. CO2 methanation and co-methanation of CO and CO2 over Mn-promoted Ni/Al2O3 catalysts. Front. Chem. Sci. Eng. 2016, 10, 273–280. [Google Scholar] [CrossRef]


| Catalyst | Temperature (°C) | Total Basicity (μmol∙g−1) | |
|---|---|---|---|
| Fresh | 95 | 8.5 | |
| 483 | 41.1 | 84.2 | |
| 630 | 34.6 | ||
| Spent | 131 | 30.9 | |
| 200 | 13.8 | 68.2 | |
| 500 | 23.5 |
| Test | Solid Yield, wt% | Liquid Yield, wt% | Gas Yield, wt% |
|---|---|---|---|
| Pyrolysis | 11.70 | 36.50 | 51.80 |
| Ni-catalyzed Pyrolysis | 17.35 | 23.00 | 59.65 |
| Hydrogasification | 4.25 | 37.25 | 58.50 |
| Ni-catalyzed Hydrogasification | 18.05 | 5.50 | 76.45 |
| (C) % | (H) % | (N) % | (S) % | (O) % |
|---|---|---|---|---|
| 77.54 | 10.75 | 0.36 | 0.00 | 11.34 |
| Parameter | Condition |
|---|---|
| Plastic waste | 2 g |
| Catalyst | 1.33 g |
| Catalyst/Plastic waste ratio (for the catalytic tests) | 2/3 |
| WHSV | 9000 NmLgas·h−1·gcat−1 |
| Toven | 550 °C |
| Tcat~Tplastic waste | 540 °C |
| Heating ramp | 40 °C·min−1 |
| Tout tube | 200 °C |
| Gas flow rate | 200 NmL·min−1 |
| 80 vol%H2–20 vol% Ar For the hydrogasification test 100% Ar For the pyrolysis |
Disclaimer/Publisher’s Note: The statements, opinions and data contained in all publications are solely those of the individual author(s) and contributor(s) and not of MDPI and/or the editor(s). MDPI and/or the editor(s) disclaim responsibility for any injury to people or property resulting from any ideas, methods, instructions or products referred to in the content. |
© 2025 by the authors. Licensee MDPI, Basel, Switzerland. This article is an open access article distributed under the terms and conditions of the Creative Commons Attribution (CC BY) license (https://creativecommons.org/licenses/by/4.0/).
Share and Cite
Saraceno, E.; Meloni, E.; Giaconia, A.; Palma, V. Catalytic OBSiC Open Cell Foams for Methane-Rich Gas Production Through Hydrogasification of Plastic Waste. Catalysts 2025, 15, 152. https://doi.org/10.3390/catal15020152
Saraceno E, Meloni E, Giaconia A, Palma V. Catalytic OBSiC Open Cell Foams for Methane-Rich Gas Production Through Hydrogasification of Plastic Waste. Catalysts. 2025; 15(2):152. https://doi.org/10.3390/catal15020152
Chicago/Turabian StyleSaraceno, Emilia, Eugenio Meloni, Alberto Giaconia, and Vincenzo Palma. 2025. "Catalytic OBSiC Open Cell Foams for Methane-Rich Gas Production Through Hydrogasification of Plastic Waste" Catalysts 15, no. 2: 152. https://doi.org/10.3390/catal15020152
APA StyleSaraceno, E., Meloni, E., Giaconia, A., & Palma, V. (2025). Catalytic OBSiC Open Cell Foams for Methane-Rich Gas Production Through Hydrogasification of Plastic Waste. Catalysts, 15(2), 152. https://doi.org/10.3390/catal15020152