Abstract
This study focuses on enhancing the efficiency of alkaline water electrolysis technology, a key process in green hydrogen production, by leveraging the synergy of magnetic fields and in situ electrode activation. Optimizing AWE efficiency is essential to meet increasing demands for sustainable energy solutions. In this research, nickel mesh electrodes were modified through the application of magnetic fields and the addition of hypo-hyper d-metal (cobalt complexes and molybdenum salt) to the electrolyte. These enhancements improve mass transfer, facilitate bubble detachment, and create a high-surface-area catalytic layer on the electrodes, all of which lead to improved hydrogen evolution rates. The integration of magnetic fields and in situ activation achieved over 35% energy savings, offering a cost-effective and scalable pathway for industrial green hydrogen production.
1. Introduction
The production of “green” hydrogen is widely recognized as crucial for the decarbonization of several industrial sectors such as steel manufacturing, cement production, and transportation, where direct electrification is not feasible [1]. In contrast to “grey” and “blue” hydrogen, produced via steam methane reforming or coal gasification, “green” hydrogen is produced via water electrolysis using renewable electricity. It offers a pathway to near-zero greenhouse gas emissions [2]. Furthermore, the large-scale usage of “green” hydrogen enables zero-pollution energy production via fuel cells, enhancing grid flexibility, and resolving the intermittent nature of renewable energy sources [3].
Alkaline water electrolysis (AWE) is a well-established, reliable technology for the production of “green” hydrogen, which is nowadays considered the energy carrier of the future [4]. Although mature, water electrolysis plays a crucial role, as it could be easily integrated into renewable power source systems, thus making hydrogen production free from greenhouse gases emissions [5,6].
Hydrogen production via water electrolysis has always been a cornerstone technology for clean, renewable energy generation [7,8]. Alkaline water electrolysis (AWE), is a widely applied method that offers the advantage of operating with lower-cost catalysts and under simpler conditions compared to other electrolytic methods. It is a convenient solution for large-scale hydrogen production [9]. The benefits of AWE over efficient proton exchange membrane (PEM) electrolysis are primarily related to significantly lower production and operational costs, while preserving the continuity of performance in terms of hydrogen production capacity and stability [10]. The challenge across the AWE research community is to find improvements that make the alkaline electrolysis process more efficient and thus more economical to use, thus further lowering the cost of “green” hydrogen [11,12]. As the global efforts for sustainable energy solutions intensify, with hydrogen playing a pivotal role, R&D work to enhance the efficiency of AWE is driving the support of the scaling up of “green” hydrogen initiatives [13].
Commercial alkaline water electrolysers utilize stainless steel, Ni or Raney Ni as cathodes, and operate with potassium hydroxide solution in the concentration range from 1 mol/L in new generation alkaline electrode membrane (AEM) electrolysers and 6–9 mol/L classic alkaline electrolysers (AEL), and in the temperature range of 50–80 °C [14,15]. The main issue with commercial cathodes is loss of their electrochemical activity over time in alkaline media, especially with high electrolyte concentrations [16].
This study explores innovative methods to increase the overall efficiency of hydrogen production in AWE, at the same time overcoming the deactivation of electrodes during their operational lifetime. To attract stakeholders’ interest, the efficiency of AWE should be raised to more than 30% compared to the state-of-the-art in energy consumption. In this work, we will show a simple upgrade pathway to reach industrially interesting savings in energy consumption by combining the effects of magnetic fields and advanced electrocatalytic strategies using the in situ activation of electrodes [17].
Specifically, the research investigates the impact of magnetic fields on nickel mesh electrodes, which have been shown to enhance hydrogen evolution reaction (HER) rates through magnetohydrodynamic (MHD) effects [18,19]. These effects improve mass transfer by inducing the flow of the electrolyte, which not only facilitates bubble detachment from the electrode surfaces but also enhances the distribution of ions across the electrode, reducing resistive losses associated with gas bubble formation [20,21].
In addition, this study incorporates an in situ activation approach using hypo-hyper d-metal complexes and salts, originating from advanced electrocatalytic theories [22,23,24]. By adding transition metal salts such as cobalt, molybdenum, and nickel directly into the electrolyte, a high-surface-area catalyst is dynamically generated on the nickel electrode surface [25,26]. This technique allows the formation of an active, durable electrode surface without the need for pre-deposition or high-temperature processes, providing a cost-effective alternative to traditional catalyst applications [27]. In situ activation is achieved by direct dissolution of the catalysts in the electrolyte during the electrolytic process [28]. It does not require a separate surface activation step, which adds considerably to the cost of the cathode [29]. The use of hypo-hyper d-metal combinations exploits intermetallic bonding theory, enhancing the stability and activity of the catalyst and potentially achieving efficiencies comparable to those using precious metals, but with substantially reduced costs [30].
By integrating these two enhancements: permanent magnetic field application and in situ electrode activation, this research aims to improve the performance of AWE for industrial hydrogen production. The findings could point the way for more efficient, scalable hydrogen production systems that are both economically viable and aligned with global decarbonization goals.
2. Experimental
In situ testing in the single cell arrangement was performed using a test stand, Figure 1, and polarization curve (I–V Curve) for overall electrochemical performance evaluation measurements in terms of energy consumption per mol of H2. Tafel analysis and reaction kinetics and determination of the electrochemical active surface area were done by means of potentiodynamic and electrochemical impedance spectroscopy (EIS) measurements for separating ohmic, activation, and concentration losses for evaluation of reaction rates, diffusion coefficients, charge transfer resistance, and double layer capacity values.
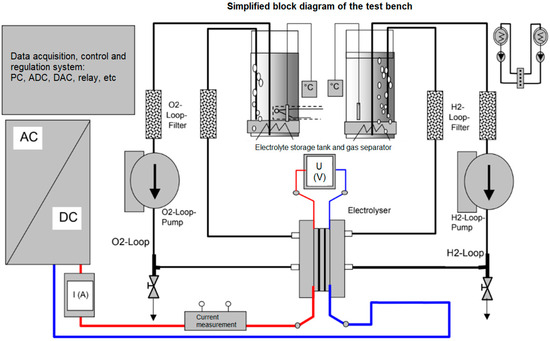
Figure 1.
Simplified block diagram of the single electrolyser cell test stand.
The performance determined from results of in situ tests of the single cell are dependent on the chosen material properties, e.g., components for making up the single cell. In this regard, measurements were performed in 6 M KOH solution (Merck, Boston, MA, USA) prepared in deionized water. For the catalytic materials added in situ at Ni mesh electrodes, a mixture of two component based on Co(EDA) complex and Mo salts were used [31,32].
Integration of a permanent magnetic field in the cell is shown in Figure 2.
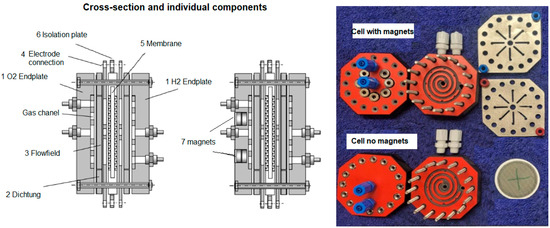
Figure 2.
Test cells 1 and 2 construction, with and without magnets, for comparison purposes in energy savings.
Measurement cell 1 for alkaline water electrolysis was used to determine the energy consumption with a standard (6 M KOH) electrolyte and 6 M KOH with the addition of in situ catalysts (Co-Mo, [29]), while cell 2 was used to determine energy consumption with 6 M KOH + CoMo in the presence of a magnetic field. The measurements were performed in galvanostatic mode, using Gamry (Warminster, PA, USA) 3000 Potentiostat/Galvanostat, meaning that the fixed current density (mA cm−2) was applied to the electrolyser while simultaneously measuring the voltage between the electrodes. The evolved gases (hydrogen + oxygen) were passed through glass tubes filled with silica gel to remove the humidity. Time of evolution of a certain volume of hydrogen was measured using a U-tube water manometer.
Seven cylindrical neodymium-iron-boron (NdFeB) permanent magnets (Ø8 mm, length 6 mm each) are placed on cathode side with the N-pole oriented towards the anode of the electrolyser to make the magnetic field as homogenous as possible. Placement of the magnets was the subject of modelling activities using ANSYS Meshing (https://www.ansys.com/products/meshing, accessed on 12 October 2025) and COMSOL Multiphysics modelling software (https://www.comsol.com/comsol-multiphysics, accessed on 12 October 2025), which revealed an optimal positioning of magnets for single cell measurements in order to have a uniform magnetic field over the whole volume, Figure 3.
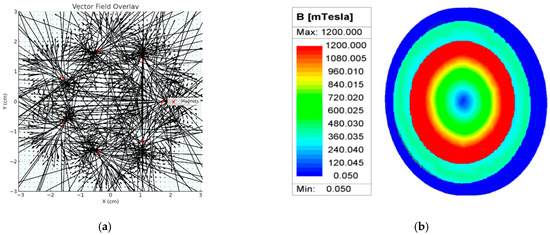
Figure 3.
(a) Magnetic flux vector field overlay, and (b) modelling of the magnetic field distribution over the electrolyser cell.
This modelling clearly shows that the proposed positioning of magnets at the cathode side of the electrolyser cell produces a dense and well-aligned ring, meaning that the magnetic field flows smoothly around the inner perimeter, forming a rotationally symmetric, focused region of high magnetic density. Using these calculations, it is shown that the range of magnetic flux is from 0.3 T in the electrolyser cell centre to 1.2 T at the peripherals of the cell, covering the whole volume of the cell flow field.
Investigations of the hydrogen evolution reaction (HER) mechanism were performed in a standard three-electrode electrochemical cell. A large mesh platinum wash was used as the counter electrode, nickel as the working electrode (1 cm2), and a saturated calomel electrode (SCE) as the reference electrode. The inactive sides of the working electrode were protected from the solution by the alkaline-resistant epoxy resin. The electrolyte in the working electrode compartment was purged with gaseous hydrogen during measurements.
The standard (6 M KOH) electrolyte, 6 M KOH + CoMo, and 6 M KOH + CoMo with inserted magnet systems were investigated. Tafel curves were recorded by scanning the working electrode potential from −1.45 V to −0.9 V vs. SCE at the scan rate of 1 mV s−1, using Gamry 1000E Potentiostat/Galvanostat at room temperature. Before each measurement, the electrolyte solution in the cell was deoxygenated with hydrogen by continuous bubbling for 30 min. Before each experiment, the nickel surface was first treated by etching in a solution of nitric acid (concentration ratio HNO3:H2O = 2:1) for 2 min and then washed with distilled water.
Electrochemical impedance spectra (EIS) were recorded in the frequency range from 100 kHz to 0.2 Hz using 10 mV AC amplitude at the constant overpotentials in the range of −50 mV to −250 mV. Before each measurement, the electrolyte solution in the cell was deoxygenated with hydrogen by continuous bubbling for 30 min.
3. Results
In the state-of-the-art electrode processing technology for AWE, a high effective surface area of the nickel-based coatings at the base metal of the bipolar plates has to be achieved to have high performance at low cost. Usually, target performance is achieved using a separate deposition step using costly processes, such as a wire-arc spray deposition, CVD, or sputtering processes. Four main factors must be considered in developing commercially practical electrodes for AWE electrolysis: electrochemical efficiency, stability, scale-up, and cost. The purpose of new catalyst implementation obtained in simplified in situ electroplating is to contribute to the faster achievement of the 2024 KPIs of the Clean Hydrogen JU SRIA.
The in situ process of electrodeposition has several advantages over those. It allows the use of thinner bipolar plates and is capable of coating a three-dimensional electrode surface. This reduces ohmic losses and has a higher efficiency at a given hydrogen production rate. In our proof-of-concept single-cell system, by using in situ added metal ethylenediamine (EDA) complexes, we managed to obtain remarkable results, with energy savings of more than 30% compared to state-of-the-art electrodes. The energy requirement for the electrolysis process was determined using the following relation:
where I (A) is the total current, U (V) is the cell voltage, and t (s) is the time required to produce 1 mol of hydrogen. The energy consumption in kJ/mol of the evolved hydrogen, determined in this way, can be used to correlate all three investigate systems, since these used the same electrode geometry. The results of the obtained values of the energy consumption are presented in Figure 4.
Energy = I × U × t
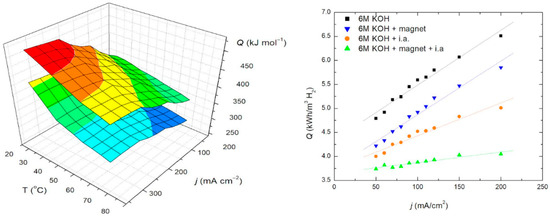
Figure 4.
Energy consumption vs. current density: (Left)—3D at range of temperatures for 6 M KOH, and 6 M KOH + i.a. + magnet according; (Right)—comparison for 6 M KOH, 6 M KOH + magnetic field, 6 M KOH + i.a. and 6 M KOH + i.a. + magnetic field, at room temperature.
The highest energy consumption values were recorded for the electrolyser using a standard electrolyte across all applied current densities. In contrast, significantly lower energy consumption was achieved with the addition of ionic activators, and the lowest values were observed when both ionic activators and a magnetic field were applied. Energy consumption increased linearly with rising current density in all tested systems, while evidently decreasing with the rise of operating temperature. These findings strongly support the use of ionic activators in conjunction with a magnetic field, as they substantially reduce the amount of energy required to produce the same amount of hydrogen compared to using a standard electrolyte for the value of 38%, Table 1.

Table 1.
Energy consumption of the investigated single-cell electrolyser performance, calculated at room temperature and 200 mA/cm2.
The percentage reduction in energy consumption (REC) was calculated by comparing the energy used in systems with 6 M KOH + ionic activators (i.a.) and 6 M KOH + i.a. + magnetic field against the standard 6 M KOH system, as a standard electrolyte. Energy consumption of the electrolyser cell with 6 M KOH + magnet + CoMo i.a reached 45 kWh/kg H2, at room temperature, which represents a reduction of about 38% compared to electorolysis cells with standard electrolytes. Also, according to the Arrhenius equation, increasing the temperature from 25 °C to 70 °C further enhances energy efficiency and yields greater energy savings. The target for AWE catalysts, in the 2024 KPIs of the Clean Hydrogen JU SRIA, is 48 kWh/kg H2 in 2030. Our results show that with a proof-of-concept single-cell measurements installation and an applied magnetic field and CoMo-based i.a., the given 2030 goal is surpassed.
The energy efficiency, ηHHV, at room temperature is defined as the higher heating value (HHV) of hydrogen divided by the energy consumed by the electrolysis system per mol of hydrogen produced, given by the equation
ηHHV = 283.3 (kJ mol−1)/Q (kJ mol−1)
At 298 K and 1 atm, the heat of formation of liquid water (e.g., HHV), or the energy released when water is formed in the reaction between hydrogen and oxygen, is 283.8 kJ mol−1 or 39 kWh kg−1 of hydrogen. This energy requirement is used to calculate efficiencies and make comparisons between the investigated electrolyser cells 1 and 2, the first using standard 6 M KOH, the second with improvement using CoMo i.a., and the third combining the addition of i.a. and magnetic field. The results are presented in Figure 5.
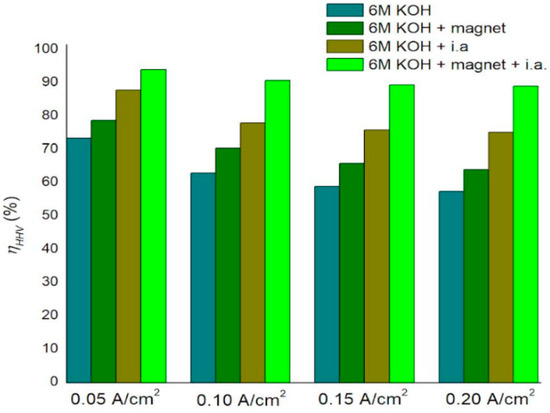
Figure 5.
The energy efficiency, ηHHV, of the electrolyser at different current densities with and without magnets.
The electrolyser efficiency at 200 mA/cm2 increased from 57.4% with a standard electrolyte to 89.05% when using ionic activators combined with a magnetic field, representing a notable improvement in alkaline water electrolysis efficiency.
The mechanism through which i.a. in combination with the magnetic field increases the electrolytic efficiency compared to the Ni mesh cathode is very complex. It includes different effects, each with their specific contributions. One of them is the electrocatalytic effects of providing a very large surface area of active centres through the deposition of Co and Mo species on the electrode surface. Another feature of in situ activation is that, according to Brewer hypo-hyper-d-interionic bonding theory, suitable catalysts are systems that combine early-transition with late-transition d-electronic metals, and their bimetallic surfaces are expected to exhibit increased electrocatalytic activity compared to pure metal surfaces [33]. Brewer’s theory predicts that the strongest bonding and thus the greatest catalytic effect shall appear for the d8 configuration (same as noble Pt). In such combinations, the electron cloud is shifted from a less electronegative metal to a more electronegative one. The excess of electrons gathered around the atom of a more electronegative metal is an “active site” allowing the reaction of hydrogen ion discharge to take place. The overpotential value of the HER for such electrodeposit is close to the value characteristic of a more electronegative metal, that is, the one whose atoms are the active sites in the reaction of hydrogen evolution. Minimum catalytic activity occurs for the bonding of d4-d5 electronic configuration; however, these have maximum “hydride” ability, i.e., the ability to form hydrides [34]. Therefore, on phase diagrams, two opposite volcanic curves can be drawn, one with a maximum electrocatalytic ability meaning a minimum of the “hydride” ability and vice versa. Among right side d-electronic metals, Ti, W, Zr, Hf, La, and Mo are most often selected for such connections, and from among left side d-electronic metals, Fe, Zn, Ni, Co, and sometimes also precious metals [35].
There is an additional catalytic effect of ethylenediamine ligands caused by cleaning the surface, destroying and removing the oxide film from the cathode surface, preparing it for deposition of metals, and resulting in the enhancement of the corrosion resistance of the electrodes, which is an important factor for the efficient evolution of the gases in the alkaline electrolytic process [32].
The magnetic field influences hydrogen evolution via two routes. The first is the influence on the electrodeposition of Co and Mo species during in situ activation, producing highly developed surface morphology, and the second is the influence of the hydrogen gas bubble formation. The second uses the fact that gaseous hydrogen is a diamagnetic material, meaning that its molecules leave the electrode surface as soon as possible, which results in smaller bubbles forming at the electrode surface. In this way, the larger portion of the electrode will be more active to electrochemical reactions.
Further analysis and explanation follow the observed differences of investigated systems in the potentiodyniamic and electrochemical impedance spectroscopy measurements.
The reaction mechanism and rate-determining step (RDS) of the hydrogen evolution reaction (HER) can be identified through Tafel analysis. In alkaline solutions, the HER generally follows a three-step mechanism involving the Volmer, Tafel, and Heyrovsky reactions [36,37].
The process begins with the Volmer reaction, a proton discharge and electrosorption step, followed by either the Heyrovsky reaction, an electron transfer desorption step, or the Tafel reaction, a catalytic recombination step. When each step is the RDS, the corresponding Tafel slope values are −120 mV/dec, −40 mV/dec, and −30 mV/dec, respectively [38]. The HER in alkaline solutions begins with the adsorption and dissociation of water, where H* is generated by breaking H-O-H bonds. This step is widely accepted as the rate-determining step (RDS) in the HER because it requires additional energy to produce protons. Many studies attribute the lower performance of electrocatalysts in alkaline solutions compared to acidic environments to the extra energy needed in the Volmer step [39]. Typically, the alkaline HER follows the Volmer–Heyrovsky or Volmer–Tafel mechanisms.
Figure 6 presents Tafel analysis polarization curves obtained for the standard electrolyte, strandard electrolyte + magnetic field, and strandard electrolyte + i.a.+ magnetic field at room temperature.
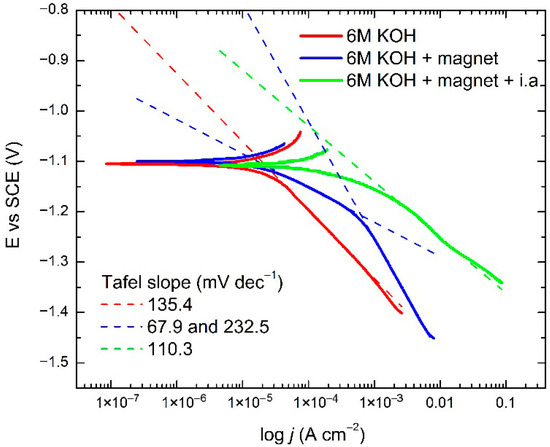
Figure 6.
Tafel curves obtained at Ni cathode in 6 M KOH as standard electrolyte, standard electrolyte + magnetic field, and standard electrolyte + i.a. + magnetic field at room temperature.
The Tafel slope is a key indicator for assessing catalyst activity and helps predict the kinetics of the alkaline HER process. It reflects the rate of increase in current density with rising overpotential and is derived from the Tafel plot, which is based on potentiodynamic measurements at relatively low overpotentials and fitted using the Tafel equation:
where η (V) represents the applied overpotential, j (mA cm−2) the resulting current density, b (V dec−1) the Tafel slope, and (V) the intercept. This intercept is related to the exchange current density jo, through the following equation:
where R is the gas constant (8.314 kJ mol−1 K−1), β is the symmetry factor, n is the number of electrons exchanged, and F is the Faraday constant (96,485 °C mol−1). The results are presented in Table 2:

Table 2.
Kinetic parameters derived from Tafel analysis of the Ni cathode in 6 M KOH as standard electrolyte, standard electrolyte + magnetic field, and standard electrolyte + i.a. + magnetic field.
Figure 6 and Table 2 shows a comparison of the Tafel curves for 6 M KOH as standard electrolyte, standard electrolyte + magnetic field, and standard electrolyte + i.a. + magnetic field. Following the results of the Tafel analysis, the rate-determining step (RDS) at low overvoltages is the Heyrovsky reaction, which is associated with the electro-desorption step. At higher overvoltages, the Volmer reaction is the RDS, as the charge transfer process determines the HER kinetics. This behaviour is in good agreement with the previously reported mechanism for the HER in 6 M KOH on a Ni-based cathode [40,41]. These findings suggest the Volmer–Heyrovsky reaction path for the HER. Catalysts with efficient charge transfer properties tend to have lower Tafel slopes, indicating enhanced activity, and there is an evident increase in the exchange current density. These results are in very good compliance with energy consumption values.
In order to determine the origin of the observed change in the HER mechanism, EIS measurements were performed at different overvoltages at room temperature. EIS was applied to further investigate the electrode/electrolyte interface and corresponding processes that occur at the electrode surface. Impedance spectra of the Ni cathode as working electrode in the complex plane were determined and are presented in Figure 7 as Nyquist plots.

Figure 7.
Nyquist plots obtained at several overvoltages for the Ni cathode in (a) 6 M KOH as standard electrolyte + magnetic field (b) standard electrolyte + i.a., and (c) standard electrolyte + i.a. + magnetic field at room temperatures.
The obtained Nyquist plots for standard electrolyte shows the expected behaviour, exhibiting one semi-circle, while the Nyquist plots for 6 M KOH + i.a. and 6 M KOH + magnet + i.a. show a second semi-circle at high frequencies. The Nyquist plots were subjected to a fitting procedure in order to access important HER kinetics and mechanism parameters.
The Armstrong equivalent circuit, Figure 8, was used for the fitting of all experimental impedance data, recorded at several overvoltages for the electrolyser with the Ni cathode in (a) 6 M KOH as standard electrolyte + magnetic field (b) standard electrolyte + i.a., and (c) standard electrolyte + i.a. + magnetic field.
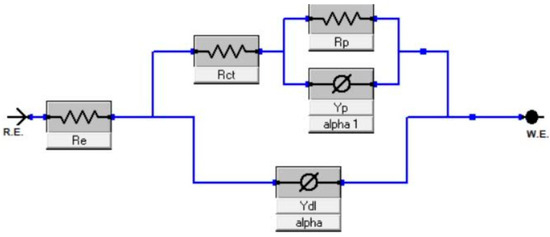
Figure 8.
The Armstrong equivalent circuit.
The Armstrong equivalent circuit is typically used to model the AC impedance behaviour when a second semicircle appears in the Nyquist plots equivalent circuits. Re represents the electrolyte resistance, and Rct denotes the charge transfer resistance associated with the electrode reaction at the working electrode (WE). The double-layer capacitance of the WE is denoted by Cdl, while Rp is linked to the mass transfer resistance of the adsorbed intermediate Hads (often referred to as pseudo-resistance), and Cp is the pseudo-capacitance of the WE. Deviation from ideal capacitance behaviour is observed as a frequency-dependent phase angle, represented by a constant phase element (CPE). This dispersion in solid electrodes is strongly influenced by the electrode surface’s condition, such as roughness, polycrystallinity, and anion adsorption. The double-layer capacitance Cdl of the cathode can be estimated using Equation [42]:
where T represents the capacitance parameter from fitting analysis, Rct is the charge-transfer resistance, and α is a dimensionless exponent (0 < α < 1).
The values obtained from the EIS data fitting at various overpotentials using the Armstrong circuit model are summarized in Table 3.

Table 3.
Comparison of EIS parameters at several overvoltages for the Ni cathode in (a) 6 M KOH as standard electrolyte + magnetic field (b) standard electrolyte + i.a., and (c) standard electrolyte + i.a. + magnetic field at room temperatures.
The electrolyte resistance, Re, does not change very much, and is slightly higher for 6 M KOH + i.a. and 6 M KOH + magnet + i.a. at room temperature. This could be associated with the differences in the ionic species mobility and the interaction of Co and Mo species with the highly concentrated KOH solution. The biggest difference is observed in the charge transfer resistance Rct value, which is significantly higher for the 6 M KOH + magnet electrolyser than the other two. On the other hand, the Rct value at an overvoltage of 150 mV is about 3 times lower for the 6 M KOH + magnet than observed in 6 M KOH on the nickel cathode. At the same overvoltage of 150 mV, Rct values in the case of CoMo-based i.a. and CoMo and magnet electrolyser cell are about 30 times lower, proving enhanced kinetics of the charge transfer reaction, e.g., the Volmer reaction, in the HER mechanism. The observed increase in double-layer capacitance, Cdl, between the investigated electrolysis systems proves the co-deposition of the Co and Mo species on the Ni cathode during electrolytic process. This effect can be evaluated by calculating the surface roughness factor, σ, by dividing the Cdl values with 20 μF/cm2, which is the value of the capacitance for relatively smooth surfaces [42]. This calculation in the case of 6 M KOH + magnet, does not reflect an actual increase in surface area of the nickel cathode, since there are no ionic species to be deposited. This should be considered as pseudo-roughness, and serves only as comparison to the electrolytic system with CoMo-based i.a. and magnet with CoMo-based i.a. This pseudo-roughness originates from the influence of the magnetic field on the ionic mobility, as the applied magnetic field changes the trajectory of ionic species in a through-plane spiral route. This increased trajectory causes a larger time spent by electrons in three-phase boundary conditions (solid–liquid–gas), and gives elevated Cdl values, even when there is no real increase in the surface area. The increased surface roughness in the case of 6 M KOH + CoMo-based i.a. is due to co-deposition of ionic species, and follows an expected behaviour for in situ activated electrolysis and a synergetic effect of two d-metal combinations [32]. An interesting feature was observed for 6 M KOH + magnet+ i.a., which is a further increase in surface roughness at all investigated overvoltages. In this case, this is a clear synergy of applied magnetic field and deposited CoMo-based ionic activators. The magnetic field influences the co-deposition process, as the Co is ferromagnetic and the Mo a paramagnetic material. This means that during the co-deposition process, magnetic moments are aligned with the applied external magnetic field, and the obtained structure facilitates a charge transfer reaction in the HER mechanism.
These findings are confirmed using scanning electron microscopy (SEM) images, Figure 9.

Figure 9.
SEM images of nickel electrode in magnetic field with in situ electrodeposited catalyst, for 6 M KOH + magnetic field + CoMo i.a., at magnifications of 500, 1000, and 2000×.
Figure 9 shows the fine deposit during in situ-activated electrolytic hydrogen production in presence of the magnetic field of an alkaline electrolyser. When the electrodeposition of ionic species onto commercial nickel electrodes occurs, an extremely developed 3D surface area is obtained along with much higher catalytic activity compared to nickel, which corresponds to the obtained values in EIS analysis, Table 3. Also, the surface is notably more developed compared to a previous work [22] where the investigated system was 6 M KOH + i.a. under the same operating conditions.
The synergy of the applied magnetic field and CoMo-based i.a. can be further confirmed through the obtained values of pseudo-resistance and pseudo-capacitance, Rp and Cp, calculated using the Armstrong equivalent circuit, Table 3. Namely, in Figure 7, a small semi-circle at high frequencies can been seen. It is correlated to mass transfer processes during the electrolytic process with an in situ-activated electrolyte [22]. The Armstrong equivalent circuit, which contains pseudo-resistance and pseudo-capacitance, is not usually used for electrolytic processes with a standard electrolyte, whereas the Randless circuit is commonly used without considering these mass transfer processes. These pseudo-resistance values are lower for 6 M KOH + magnet compared with systems with CoMo-based i.a., while pseudo-capacitance values are increased for the latter. These findings agree with a previous discussion on the influence of magnetic fields on the trajectories of electrons in the HER reaction, while its positive influence on the co-deposited Co and Mo species prevails. This is evident when comparing the Rct and Rp values, showing values several orders of magnitude higher for Rct. These results clearly confirm findings from the Tafel analysis, Figure 6, about the Volmer–Heyrovsky mechanism for the HER, with the Volmer reaction as a rate-determining step. EIS analyses also confirm the obtained reduction in energy consumption of the electrolysis cell when magnetic field and i.a. were applied.
4. Conclusions
This work demonstrates a feasible approach to achieving substantial energy savings and improving the efficiency of AWE for green hydrogen production. By integrating a permanent magnetic field with in situ activation using cobalt-based complexes and molybdenum salt, this study successfully enhanced electrolyser performance, reducing energy consumption by about 38% and improved overall system efficiency. Another benefit is that this is a simple and cost-effective process that avoids the typical deposition as the electrode preparation step for achieving high surface areas. Investigation of the HER mechanism and kinetics using Tafel and EIS analysis confirm the synergy between ionic activators and magnetic field in alkaline media on nickel electrodes. These advancements could show a pathway towards improving performances and reducing costs of AWE, which could become a game-changer for AWE technology stakeholders.
Author Contributions
M.P.M.K.: Investigation, Writing—Original Draft, S.L.M.: Investigation, J.G.P.: Investigation, D.P.P.: Visualization, D.L.V.: Visualization. Z.M.N.: Resources, V.M.N.: Investigation, Writing—Original Draft. All authors have read and agreed to the published version of the manuscript.
Funding
This research was funded by Ministry of Science, Technological Development, and Innovation of the Republic of Serbia for financial support under Grant No. 451-03-136/2025-03/200051.
Data Availability Statement
The original contributions presented in the study are included in the article, further inquiries can be directed to the corresponding authors.
Conflicts of Interest
The authors declare no conflicts of interest.
References
- International Energy Agency. The Future of Hydrogen: Seizing Today’s Opportunities; International Energy Agency: Paris, France, 2019. [Google Scholar]
- International Renewable Energy Agency. Green Hydrogen: A Guide to Policy Making; International Renewable Energy Agency: Paris, France, 2020. [Google Scholar]
- Ullah, I.; Amin, M.; Zhao, P.; Qin, N.; Xu, A.W. Recent advances in inorganic oxide semiconductor-based S-scheme heterojunctions for photocatalytic hydrogen evolution. Inorg. Chem. Front. 2025, 12, 1329–1348. [Google Scholar] [CrossRef]
- Dash, S.K.; Chakraborty, S.; Elangovan, D. A Brief Review of Hydrogen Production Methods and Their Challenges. Energies 2023, 16, 1141. [Google Scholar] [CrossRef]
- Abdelsalam, R.A.; Mohamed, M.; Farag, H.E.Z.; El-Saadany, E.F. Green hydrogen production plants: A techno-economic review. Energy Convers. Manag. 2024, 319, 118907. [Google Scholar] [CrossRef]
- Gerloff, N. Comparative Life-Cycle-Assessment analysis of three major water electrolysis technologies while applying various energy scenarios for a greener hydrogen production. J. Energy Storage 2021, 43, 102759. [Google Scholar] [CrossRef]
- Horri, B.A.; Ozcan, H. Green hydrogen production by water electrolysis: Current status and challenges. Curr. Opin. Green Sustain. Chem. 2024, 47, 100932. [Google Scholar] [CrossRef]
- Hosseiny, S.E.; Wahid, M.A. Hydrogen production from renewable and sustainable energy resources: Promising green energy carrier for clean development. Renew. Sustain. Energy Rev. 2016, 57, 850–866. [Google Scholar] [CrossRef]
- Muthiah, M.; Elnashar, M.; Afzal, W.; Tan, H. Safety assessment of hydrogen production using alkaline water electrolysis. Int. J. Hydrogen Energy 2024, 84, 803–821. [Google Scholar] [CrossRef]
- Benghanem, M.; Almohamadi, H.; Haddad, S.; Mellit, A.; Chettibi, N. The effect of voltage and electrode types on hydrogen production powered by photovoltaic system using alkaline and PEM electrolyzers. Int. J. Hydrogen Energy 2024, 57, 625–636. [Google Scholar] [CrossRef]
- Sebbahi, S.; Assila, A.; Belghiti, A.A.; Laasri, S.; Kaya, S.; Hlil, E.K.; Rachidi, S.; Hajjaji, A. A comprehensive review of recent advances in alkaline water electrolysis for hydrogen production. Int. J. Hydrogen Energy 2024, 82, 583–599. [Google Scholar] [CrossRef]
- El-Shafie, M. Hydrogen production by water electrolysis technologies: A review. Results Eng. 2023, 20, 101426. [Google Scholar] [CrossRef]
- Jesse, B.J.; Kramer, G.J.; Koning, V.; Vögele, S.; Kuckshinrichs, W. Stakeholder perspectives on the scale-up of green hydrogen and electrolyzers. Energy Rep. 2024, 11, 208–217. [Google Scholar] [CrossRef]
- Amores, E.; Rodríguez, J.; Carreras, C. Influence of operation parameters in the modeling of alkaline water electrolyzers for hydrogen production. Int. J. Hydrogen Energy 2014, 39, 13063–13078. [Google Scholar] [CrossRef]
- Esfandiari, N.; Aliofkhazraei, M.; Colli, A.N.; Walsh, F.C.; Cherevko, S.; Kibler, L.A.; Elnagar, M.M.; Lund, P.D.; Zhang, D.; Omanovic, S.; et al. Metal-based cathodes for hydrogen production by alkaline water electrolysis: Review of materials, degradation mechanism, and durability tests. Prog. Mater. Sci. 2024, 144, 101254. [Google Scholar] [CrossRef]
- Manabe, A.; Kashiwase, M.; Hashimoto, T.; Hayashida, T.; Kato, A.; Hirao, K.; Shimomura, I.; Nagashima, I. Basic study of alkaline water electrolysis. Electrochim. Acta 2013, 100, 249–256. [Google Scholar] [CrossRef]
- Binns, M. Methods for Enhancing Electrolysis for Hydrogen Production: The Benefits of Applying Magnetic Fields. Enegies 2024, 17, 4897. [Google Scholar] [CrossRef]
- Zhao, P.; Wang, J.; He, W.; Xia, H.; Cao, X.; Li, Y.; Sun, L. Magnetic field Pre-polarization enhances the efficiency of alkaline water electrolysis for hydrogen production. Energy Convers. Manag. 2023, 283, 116906. [Google Scholar] [CrossRef]
- Yongwen Sun, C.Z.; Hong, L.; Yao, H.; Gao, Y. Magnetic field-assisted electrocatalysis: Mechanisms and design strategies. Carbon Energy 2024, 6, 575. [Google Scholar] [CrossRef]
- Lin, M.-Y.; Hourng, L.-W.; Kuo, C.-W. The effect of magnetic force on hydrogen production efficiency in water electrolysis. Fuel Energy Abstr. 2012, 37, 1311–1320. [Google Scholar] [CrossRef]
- Gatard, V.; Deseure, J.; Chatenet, M. Use of magnetic fields in electrochemistry: A selected review. Curr. Opin. Electrochem. 2020, 23, 96–105. [Google Scholar] [CrossRef]
- Nikolic, V.M.; Maslovara SLj Tasic, G.S.; Brdaric, T.P.; Lausevic, P.Z.; Radak, B.B.; Marceta Kaninski, M.P. Kinetics of hydrogen evolution reaction in alkaline electrolysis on a Ni cathode in the presence of Ni–Co–Mo based ionic activators. Appl. Catal. B Environ. 2015, 179, 88–94. [Google Scholar] [CrossRef]
- Maslovara SLj Marceta Kaninski, M.P.; Perovic, I.M.; Lausevic, P.Z.; Tasic, G.S.; Radak, B.B.; Nikolic, V.M. Novel ternary Ni-Co-Mo based ionic activator for efficient alkaline water electrolysis. Int. J. Hydrogen Energy 2013, 38, 15928–15933. [Google Scholar] [CrossRef]
- El-Nowihy, G.H.; Abdellatif, M.M.; El-Deab, M.S. Magnetic field-assisted water splitting at ternary NiCoFe magnetic Nanocatalysts: Optimization study. Renew. Energy 2024, 226, 120395. [Google Scholar] [CrossRef]
- Feng, J.; Wei, L.; Li, H.; Shen, J. Eco-friendly and facile nanomanufacturing of amorphous Co-Ce-Fe trimetallic molybdates composites for accelerated anodic oxygen evolution in alkaline water electrolysis: Evaluation of active sites performance. Green Energy Environ. 2025, 10, 1027–1038. [Google Scholar] [CrossRef]
- Song, L.; Zhang, T.; Zhang, X.; Tian, J.; Wang, J.; Yang, J.; Wang, W.; Lin, K.; Feng, D.; Ma, B. Enhanced hydrogen production performance via noble-metal-free amorphous NiZnSx-CS co-catalyst with novel gradient coating structure. Appl. Catal. B Environ. 2024, 359, 124458. [Google Scholar] [CrossRef]
- Miulovic, S.M.; Maslovara, S.L.; Seovic, M.M.; Radak, B.B.; Marceta Kaninski, M.P. Energy saving in electrolytic hydrogen production using Co-Cr activation—Part I. Int. J. Hydrogen Energy 2012, 37, 16770–16775. [Google Scholar] [CrossRef]
- Maslovara, S.; Anićijević, D.V.; Brković, S.; Georgijević, J.; Tasić, G.; Kaninski, M.M. Experimental and DFT study of CoCuMo ternary ionic activator for alkaline HER on Ni cathode. J. Electroanal. Chem. 2019, 839, 224–230. [Google Scholar] [CrossRef]
- Maslovara SLj Miulovic, S.M.; Marceta Kaninski, M.P.; Tasic, G.S.; Nikolic, V.M. Energy consumption of the electrolytic hydrogen production using Zn-Co-Mo based activators—Part I. Appl. Catal. A Gen. 2013, 451, 216–219. [Google Scholar] [CrossRef]
- Miulovic, S.M.; Maslovara, S.L.; Perovic, I.M.; Nikolic, V.M.; Kaninski, M.P.M. Electrocatalytic activity of ZnCoMo based ionic activators for alkaline hydrogen evolution—Part II. Appl. Catal. A Gen. 2013, 451, 220–226. [Google Scholar] [CrossRef]
- Maslovara, S.L.; Vasić Anićijević, D.; Kijevcanin, M.L.; Radovic, I.R.; Nikolic, V.M.; Lausevic, P.Z.; Kaninski, M.P.M. Improved HER activity of Ni and stainless steel electrodes activated by NiCoMo ionic activator—A combined DFT and experimental study. Int. J. Hydrogen Energy 2017, 42, 5072–5082. [Google Scholar] [CrossRef]
- Marčeta Kaninski, M.P.; Maksić, A.D.; Stojić, D.L.; Miljanić, Š.S. Ionic activators in the electrolytic production of hydrogen—Cost reduction-analysis of the cathode. J. Power Sources 2004, 131, 107–111. [Google Scholar] [CrossRef]
- Beck, P.A. Electronic Structure and Alloy Chemistry of Transition Elements; Interscience Publishers: London, UK, 1963. [Google Scholar]
- Jaksic, M.M. Advances in electrocatalysis for hydrogen evolution in the light of the Brewer-Engel valence-bond theory. Int. J. Hydrogen Energy 1987, 12, 727–752. [Google Scholar] [CrossRef]
- Jaksic, M.M. Brewer intermetallic phases as synergetic electrocatalysts for hydrogen evolution. Mater. Chem. Phys. 1989, 22, 1–26. [Google Scholar] [CrossRef]
- Jakšić, J.M.; Vojnović, M.V.; Krstajić, N.V. Kinetic analysis of hydrogen evolution at Ni–Mo alloy electrodes. Electrochim. Acta 2000, 45, 4151–4158. [Google Scholar] [CrossRef]
- Ahmed, S.; Kazmi, W.W.; Butt, F.N.; Irshad, M.; Sher, F.; Ali Kazmi, S.M.; Chaudry, U.M.; Zeb, H.; Jun, T.S.; Khan, M.K. Fabrication of nanocage structured based electrocatalyst for oxygen evolution reactions. Mater. Lett. 2023, 331, 133416. [Google Scholar] [CrossRef]
- Jaksic, M.M. Towards the reversible electrode for hydrogen evolution in industrially important electrochemical processes. Int. J. Hydrogen Energy 1986, 11, 519–532. [Google Scholar] [CrossRef]
- Li, A.; Sun, Y.; Yao, T.; Han, H. Earth-Abundant Transition-Metal Based Electrocatalysts for Water Electrolysis to Produce Renewable Hydrogen. Chem. A Eur. J. 2018, 24, 18334–18355. [Google Scholar] [CrossRef]
- Lacnjevac, C.M.; Markovic, N.M.; Jaksic, M.M. Synergetic electrocatalytic effect of d metals for the hydrogen evolution reaction on gold substrates. Surf. Tech. 1984, 22, 51–59. [Google Scholar] [CrossRef]
- Divisek, J.; Schmitz, H.; Steffen, B. Electrocatalyst materials for hydrogen evolution. Electrochim. Acta 1994, 39, 1723–1731. [Google Scholar] [CrossRef]
- Jovic, V.D.; Jovic, B.M. EIS and differential capacitance measurements onto single crystal faces in different solutions part I: Ag(111) in 001 M NaCl. J. Electroanal. Chem. 2003, 541, 1–11. [Google Scholar] [CrossRef]
Disclaimer/Publisher’s Note: The statements, opinions and data contained in all publications are solely those of the individual author(s) and contributor(s) and not of MDPI and/or the editor(s). MDPI and/or the editor(s) disclaim responsibility for any injury to people or property resulting from any ideas, methods, instructions or products referred to in the content. |
© 2025 by the authors. Licensee MDPI, Basel, Switzerland. This article is an open access article distributed under the terms and conditions of the Creative Commons Attribution (CC BY) license (https://creativecommons.org/licenses/by/4.0/).