1. Introduction
Thermo-catalytic decomposition (TCD) presents a path to effectively decarbonize natural gas, producing both hydrogen fuel and usable solid carbon as products. Unlike the conventional method for hydrogen production, it does not entail WGS stages or CO
2 removal. Pilot-scale studies have found that the energy needed for CO
2 capture and sequestration can impose substantial capital and operational costs [
1], and at times overlooking the necessary infrastructure for downstream delivery and distribution [
2], and typically lacking adequate storage systems or having none at all in many instances [
3]. Conversely, TCD offers a promising transition pathway toward a hydrogen economy by leveraging abundantly existing natural gas resources along with their current infrastructures for production and delivery. Additionally, the carbon produced during TCD can be utilized in various high-value applications, including battery electrodes, fuel cells, protective coatings, rubber additives, and energy storage devices [
4]. The performance and longevity of the TCD process are closely tied to the structural characteristics of the initial carbon catalyst. However, TCD is inherently autogenic. That is, the process not only generates hydrogen and carbon but also continuously modifies the catalyst surface. As the reaction proceeds, the accumulating carbon deposit alters the catalyst morphology and chemistry, often leading to a gradual decline in activity due to catalyst deactivation However, if TCD is to be implemented effectively at commercial or industrial scale, alternative and higher-volume applications for the carbon byproduct need not only to become feasible but ultimately essential. Applications such as environmental remediation, soil amendment, and land restoration can ensure sustainable carbon management and avoid accumulation of waste materials, especially at large scale production [
5,
6].
TCD studies show that carbon-based catalysts exhibit lower intrinsic activity compared to metal catalysts, often necessitating higher operational temperatures in the range of 800–1000 °C or above for effective performance. On the other hand, carbon catalysts higher thermal stability, which can translate to extended operational lifetimes, greater tolerance to variable feedstocks, and a relative resistance to catalyst poisoning [
6,
7]. Additionally, due to their structural similarity with the solid carbon product formed during thermo-catalytic decomposition (TCD) and their low cost, carbon catalysts can be seamlessly incorporated into the resulting carbon byproduct. This integration eliminates the need for catalyst separation or post-reaction recovery processes, thereby simplifying system design and reducing operating costs [
8].
Seemingly, carbon materials lack a universally agreed-upon definition of active sites. In the context of carbon catalysts, active sites refer to the specific structural or chemical features on the carbon surface that are directly responsible for catalyzing a reaction. Active sites in carbon materials arise from a range of defects, heteroatom substitutions, and structural irregularities that locally alter the electronic structure, adsorption strength, and reactivity of the carbon framework. These include, but are not limited to lattice defects, low-coordination atoms, edge sites, vacancies, dislocations, heteroatoms, and other forms of structural disorder that create localized high-energy sites [
9,
10]. As a result, disordered carbon materials are generally more catalytically active than their highly ordered counterparts, such as graphite [
11,
12]. For instance, due to their structural disorder, activated carbons have demonstrated higher stability and catalytic performance compared to their carbon black counterparts. However, their activity is ultimately limited by their finite pore volume, pore width, and surface area.
During TCD, catalyst deactivation occurs primarily due to the intense carbon deposition. As showed by Suelves et al., TCD rates are initially dependent on the structure of the carbon catalyst but exhibit non-monotonic behavior in the long term as carbon continues to deposit [
13]. Additionally, Muradov et al. investigated several carbon forms—including carbon blacks, activated carbons, and graphites—and found that more disordered carbons display higher catalytic activity. Their results indicated that TCD activity correlates with increasing structural order as follows: amorphous > turbostratic > graphitic [
14].
The evolution of the deposited carbon’s structure was effectively illustrated by Lazaro et al., who showed that XRD profiles of catalysts became increasingly ordered as the reaction duration increased. Similarly, Serrano et al. found that differences in catalytic activity among various carbon blacks were consistent with differences in their XRD intensity ratios, specifically the C(101)/C(002) [
15]. In follow-up studies using XPS, Serrano et al. identified a direct relationship between the number of structural defects and the threshold temperature for TCD onset—used as a proxy for catalytic activity [
11]. These authors found that defects such as vacancies that interrupt the sp
2 carbon network, or topological distortions that affect binding energy, contribute to broadening the full width at half maximum (FWHM) of the C 1s XPS peak. This reinforces the notion that differences in catalytic activity among carbon materials are fundamentally structural in nature.
Despite ongoing debate regarding which structural parameters are most influential, many studies agree that TCD activity is governed more by the presence of active sites rather than by surface area alone [
16]. Furthermore, some studies have attributed variations in activity to differences in surface defects; namely: dislocations, vacancies, and discontinuities [
14]. A study by Lee et al. tested various commercial CBs and found that TCD rates did not directly correlate with surface area, further implying that other factors, such as microstructure, can play a critical role in TCD activity [
17]. Malaika and Kozłowski concluded that the initial catalyst structure may influence that of the deposited carbon [
18]. Corroboratively, Kameya and Hanamura examined deposited on CBs as a potential product. Their study linked catalytic performance to the carbon black’s microstructure, mainly due to its elevated concentration of active sites in the form of edges and defects inherent to its nanoscale graphitic layers [
19]. It was observed that changes in catalytic activity over time were likely by variations in crystallite (lamellae) size, and thus the concentration of edge sites, as deduced from Raman spectroscopy. These findings parallel observations from soot oxidation studies where a disordered microstructure, resembling that of CBs, has been associated with reactivity [
20,
21,
22].
Muradov et al. hypothesize that on disordered carbon surfaces, the regular carbon bonding pattern is disrupted, which gives rise to “free” valences and discontinuities such as edges and corners of carbon crystallites. As crystallite size decreases, the concentration of active sites correspondingly increases. Thus, due to their smaller crystallites, less ordered carbons generally contain more edge sites and exhibit greater catalytic activity than their relatively inert graphitic analogs [
14]. In a study by Wieckowski et al., methane decomposition on activated carbons was examined across a temperature range of 750 °C–850 °C. It was observed that, over time, the deposited carbon blocked the catalyst’s pores, which in turn lead to reduced methane conversion rates [
23].
An emerging agreement proposes that these carbon materials are hindered by one of their defining characteristics: porosity. While their high surface area is often highlighted, it primarily stems from micropores relative to meso- or macropores. However, it is of particular significance to note that surface area is a purely physical parameter and as such, it contributes little to chemical reactivity. Although pore curvature and exposed edge planes along with other unterminated sites can enhance initial activity in TCD. Yet, this initial activity is typically short-lived as these highly energetic sites are inevitably blocked by the buildup of carbon deposits. Fundamentally, TCD involves the continuous deposition of carbon, and long-term activity depends on the ability of the deposited carbon to maintain or regenerate catalytic activity. Therefore, the performance of a carbon catalyst in TCD is not only determined by its initial structure but also by how the evolving deposit sustains active site availability over time through self-renewal.
This study investigates the dynamic behavior of TCD through time-resolved reaction data, demonstrating that TCD-generated carbon initially enhances and ultimately governs methane decomposition. To date, this work represents the first systematic examination of the relationship between active sites, catalyst nanostructure, and TCD rates. Moreover, the literature demonstrates a collective absence of studies employing hydrocarbon feedstocks beyond methane.
2. Results and Discussion
2.1. Methane Conversion Dependence on Initial Gas Composition
Trends in methane concentration during thermal decomposition using pure methane and synthetic natural gas (SNG) provide important insights into the relative reactivity of the gas feeds and the catalytic performance of the deposited carbon. In these two alternating experiments, the concentration of methane is initially high during the temperature ramp, indicating minimal reaction at low temperatures. As the temperature approaches the reaction zone (~750 °C), the drop in methane concentration reflects the extent of methane consumption. Here, the change in methane concentration is a direct indicator of reaction rate and catalytic activity. Therefore, larger decreases in methane concentration correspond to higher methane conversion and faster reaction rates. For these tests, nascent R250 was employed as the catalyst and gas flowrates were held constant at 0.5 cm3/s.
In Panel A of
Figure 1, the experiment starts with pure CH
4. As the temperature increases, methane concentration drops significantly, indicating rapid decomposition and high catalytic activity. As noted, methane consumption plateaus at ~12%. However, with the reactive gas switch to SNG, methane conversion doubles as the SNG methane concentration drops from 85% to 61% relative to the initial pure CH
4 feed. This increase indicates a faster reaction rate and suggests that SNG is either more reactive or promotes the formation of more active carbon on the catalyst surface than pure methane. Panel B shows the reverse scenario where the reaction sequence begins with SNG as the feed gas. As the temperature increases, methane concentration decreases substantially. As with scenario A, methane consumption from SNG was ~24%. Conversely, when the feed is switched to pure CH
4, methane conversion is only 5%. This decline in catalytic activity reflects the lower reactivity of pure methane, illustrating the hypothesis that CH
4 decomposition (alone) produces a less active carbon deposit, i.e., less disordered. Together, these trends reveal that pure methane is significantly less reactive than SNG under the same thermal conditions, resulting in faster reaction rates and higher methane consumption for SNG. The higher methane conversion from SNG is likely due to the presence of higher hydrocarbons (C2s and C3s from ethane and propane, respectively) which can aid methane consumption by promoting radical formation.
Differential oxidation was used to study the carbon deposit produced by pure methane vs. SNG at 800 °C. As illustrated in our prior work [
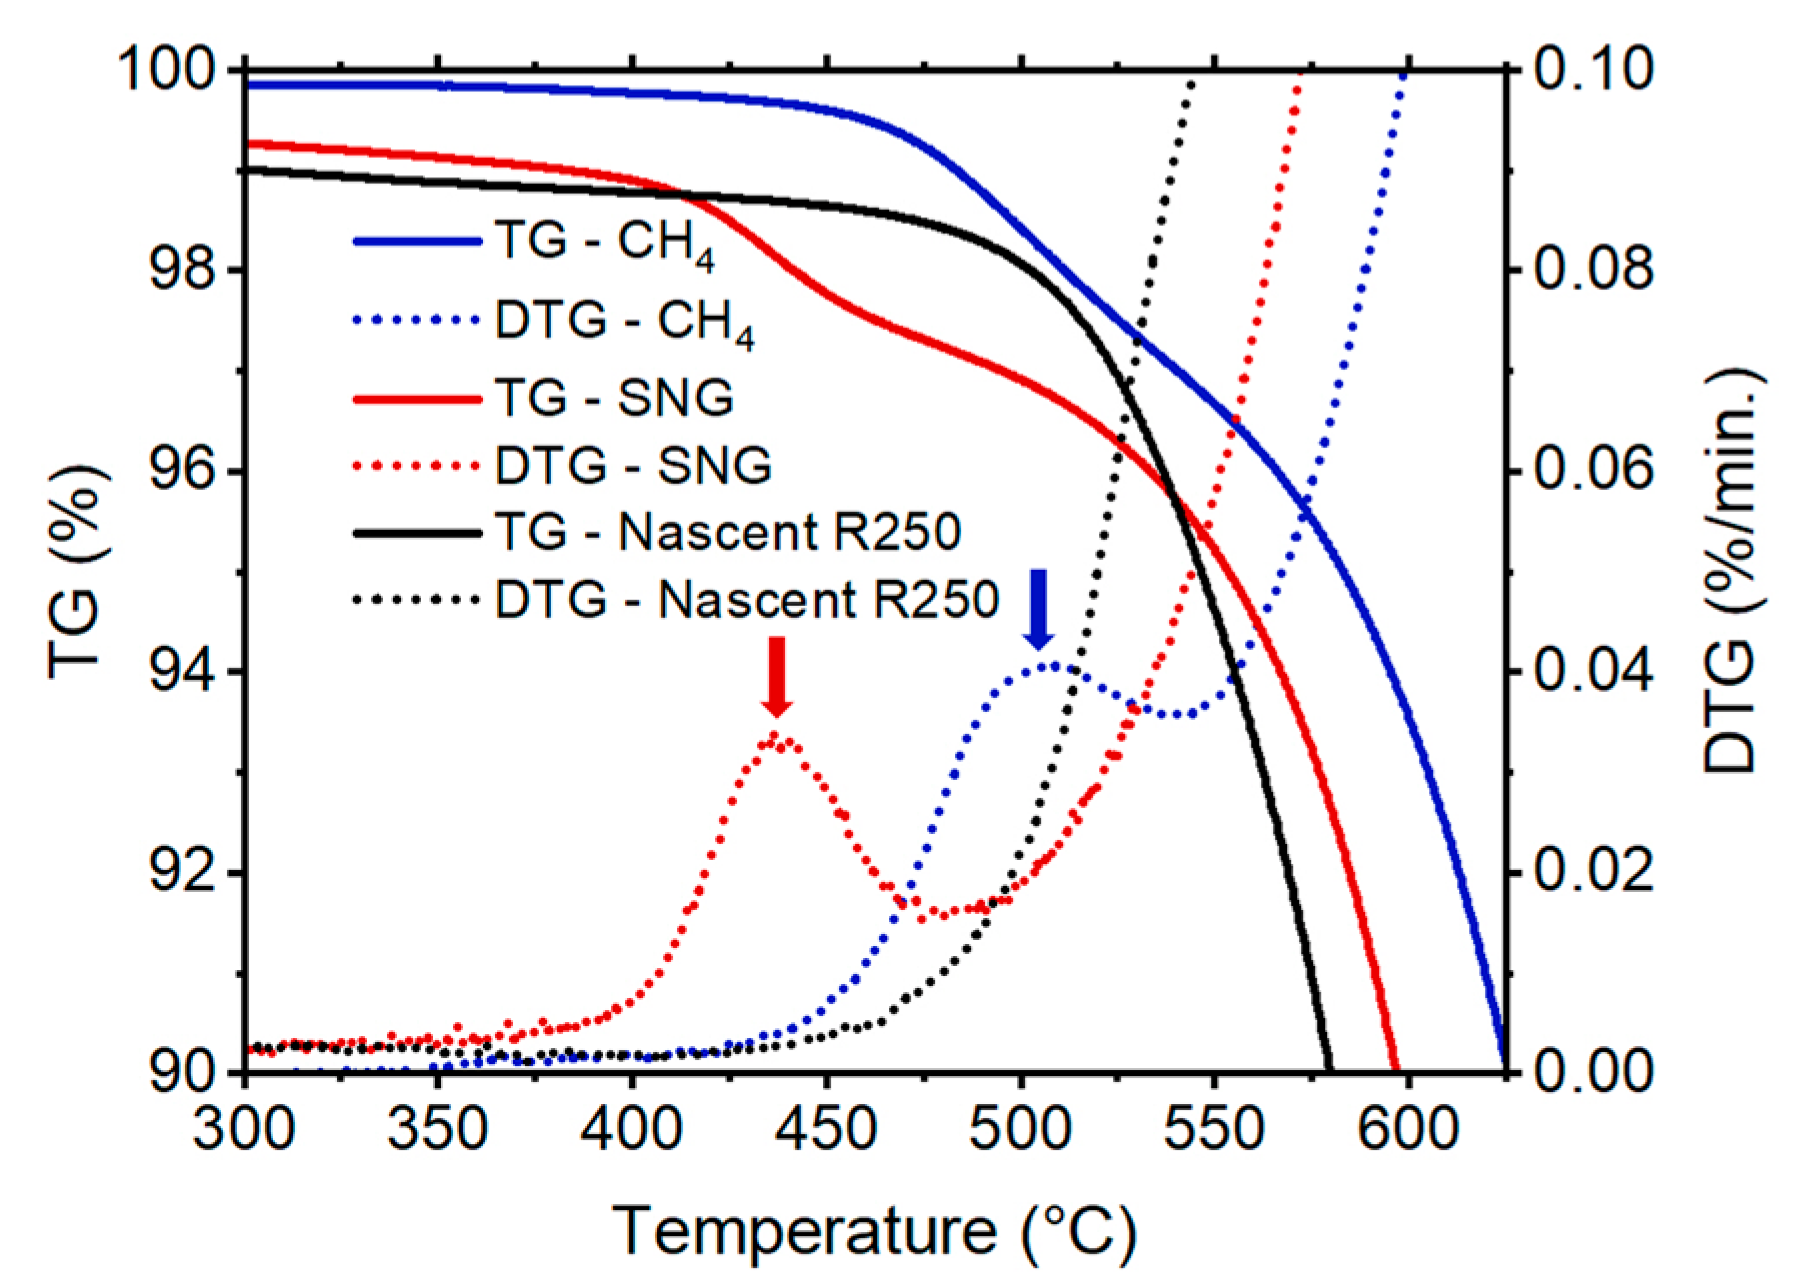
24], the quantification of TCD deposit on the nascent catalyst can be performed using thermogravimetric analysis. Theoretically, the different TCD activities between deposited carbon from methane versus SNG could imply differences in their nanostructure and corresponding oxidative reactivities. A controlled, slow temperature ramp in air can leverage these reactivity differences, distinguishing these deposits from one another. In cases where oxidation ranges overlap, separation can still be achieved by analyzing the derivative of the TGA curve, a common approach for interpreting complex TGA spectra. As illustrated by the arrows in
Figure 2, the onset temperatures for the two deposited carbon forms are very different. The SNG deposit peak is observed at ~440 °C while that of methane was at 510 °C. This confirms that the SNG deposit, having a lower onset temperature, has higher oxidative reactivity with corresponding greater disordered structure and therefore greater catalytic activity during TCD.
2.2. Deposit Reactivity
Figure 3 presents a comparative analysis of the oxidative reactivity of carbon deposits formed during methane thermo-catalytic decomposition (TCD) across different carbon catalysts. The results indicate that the carbon deposited on M1300 and Ketjenblack exhibits reactivity nearly identical to their nascent forms, suggesting minimal structural differences between the nascent carbon and TCD carbon. In contrast, the carbon deposited on R250 is notably more reactive than the original R250 carbon black, indicating that the TCD carbon is significantly different by activity and corresponding structure than the nascent R250 carbon—yet with origins being the nascent R250 surface activity.
As illustrated in panel A, the weight loss derivative curves for the M1300 and Ketjenblack deposits show no distinct second oxidation peak, implying that the deposited carbon closely resembles the original material in composition and structure. However, in the case of R250, a separate, distinguishable oxidation event is observed, highlighting a clear difference between the nascent and deposited carbon phases. This suggests that the catalytic decomposition of SNG over R250 leads to the formation of a structurally distinct carbon across this temperature range.
Furthermore, panel B reveals that the oxidative behavior of the TCD carbon deposits is temperature dependent. Specifically, deposits formed at lower reaction temperatures exhibit lower onset temperatures for oxidation, indicating a more reactive or less ordered structure. This temperature dependence emphasizes the influence of synthesis conditions on the properties of the resulting carbon and highlights the importance of considering both the catalyst and reaction conditions when evaluating carbon reactivity. Additional comparative thermogravimetric analysis is available in the
Supplemental Figure S3. Complementary Raman spectroscopic analysis is also provided in the
Supplementary Materials Figure S4.
2.3. Active Site Enhancement via Partial Oxidation and Oxygen Chemisorption
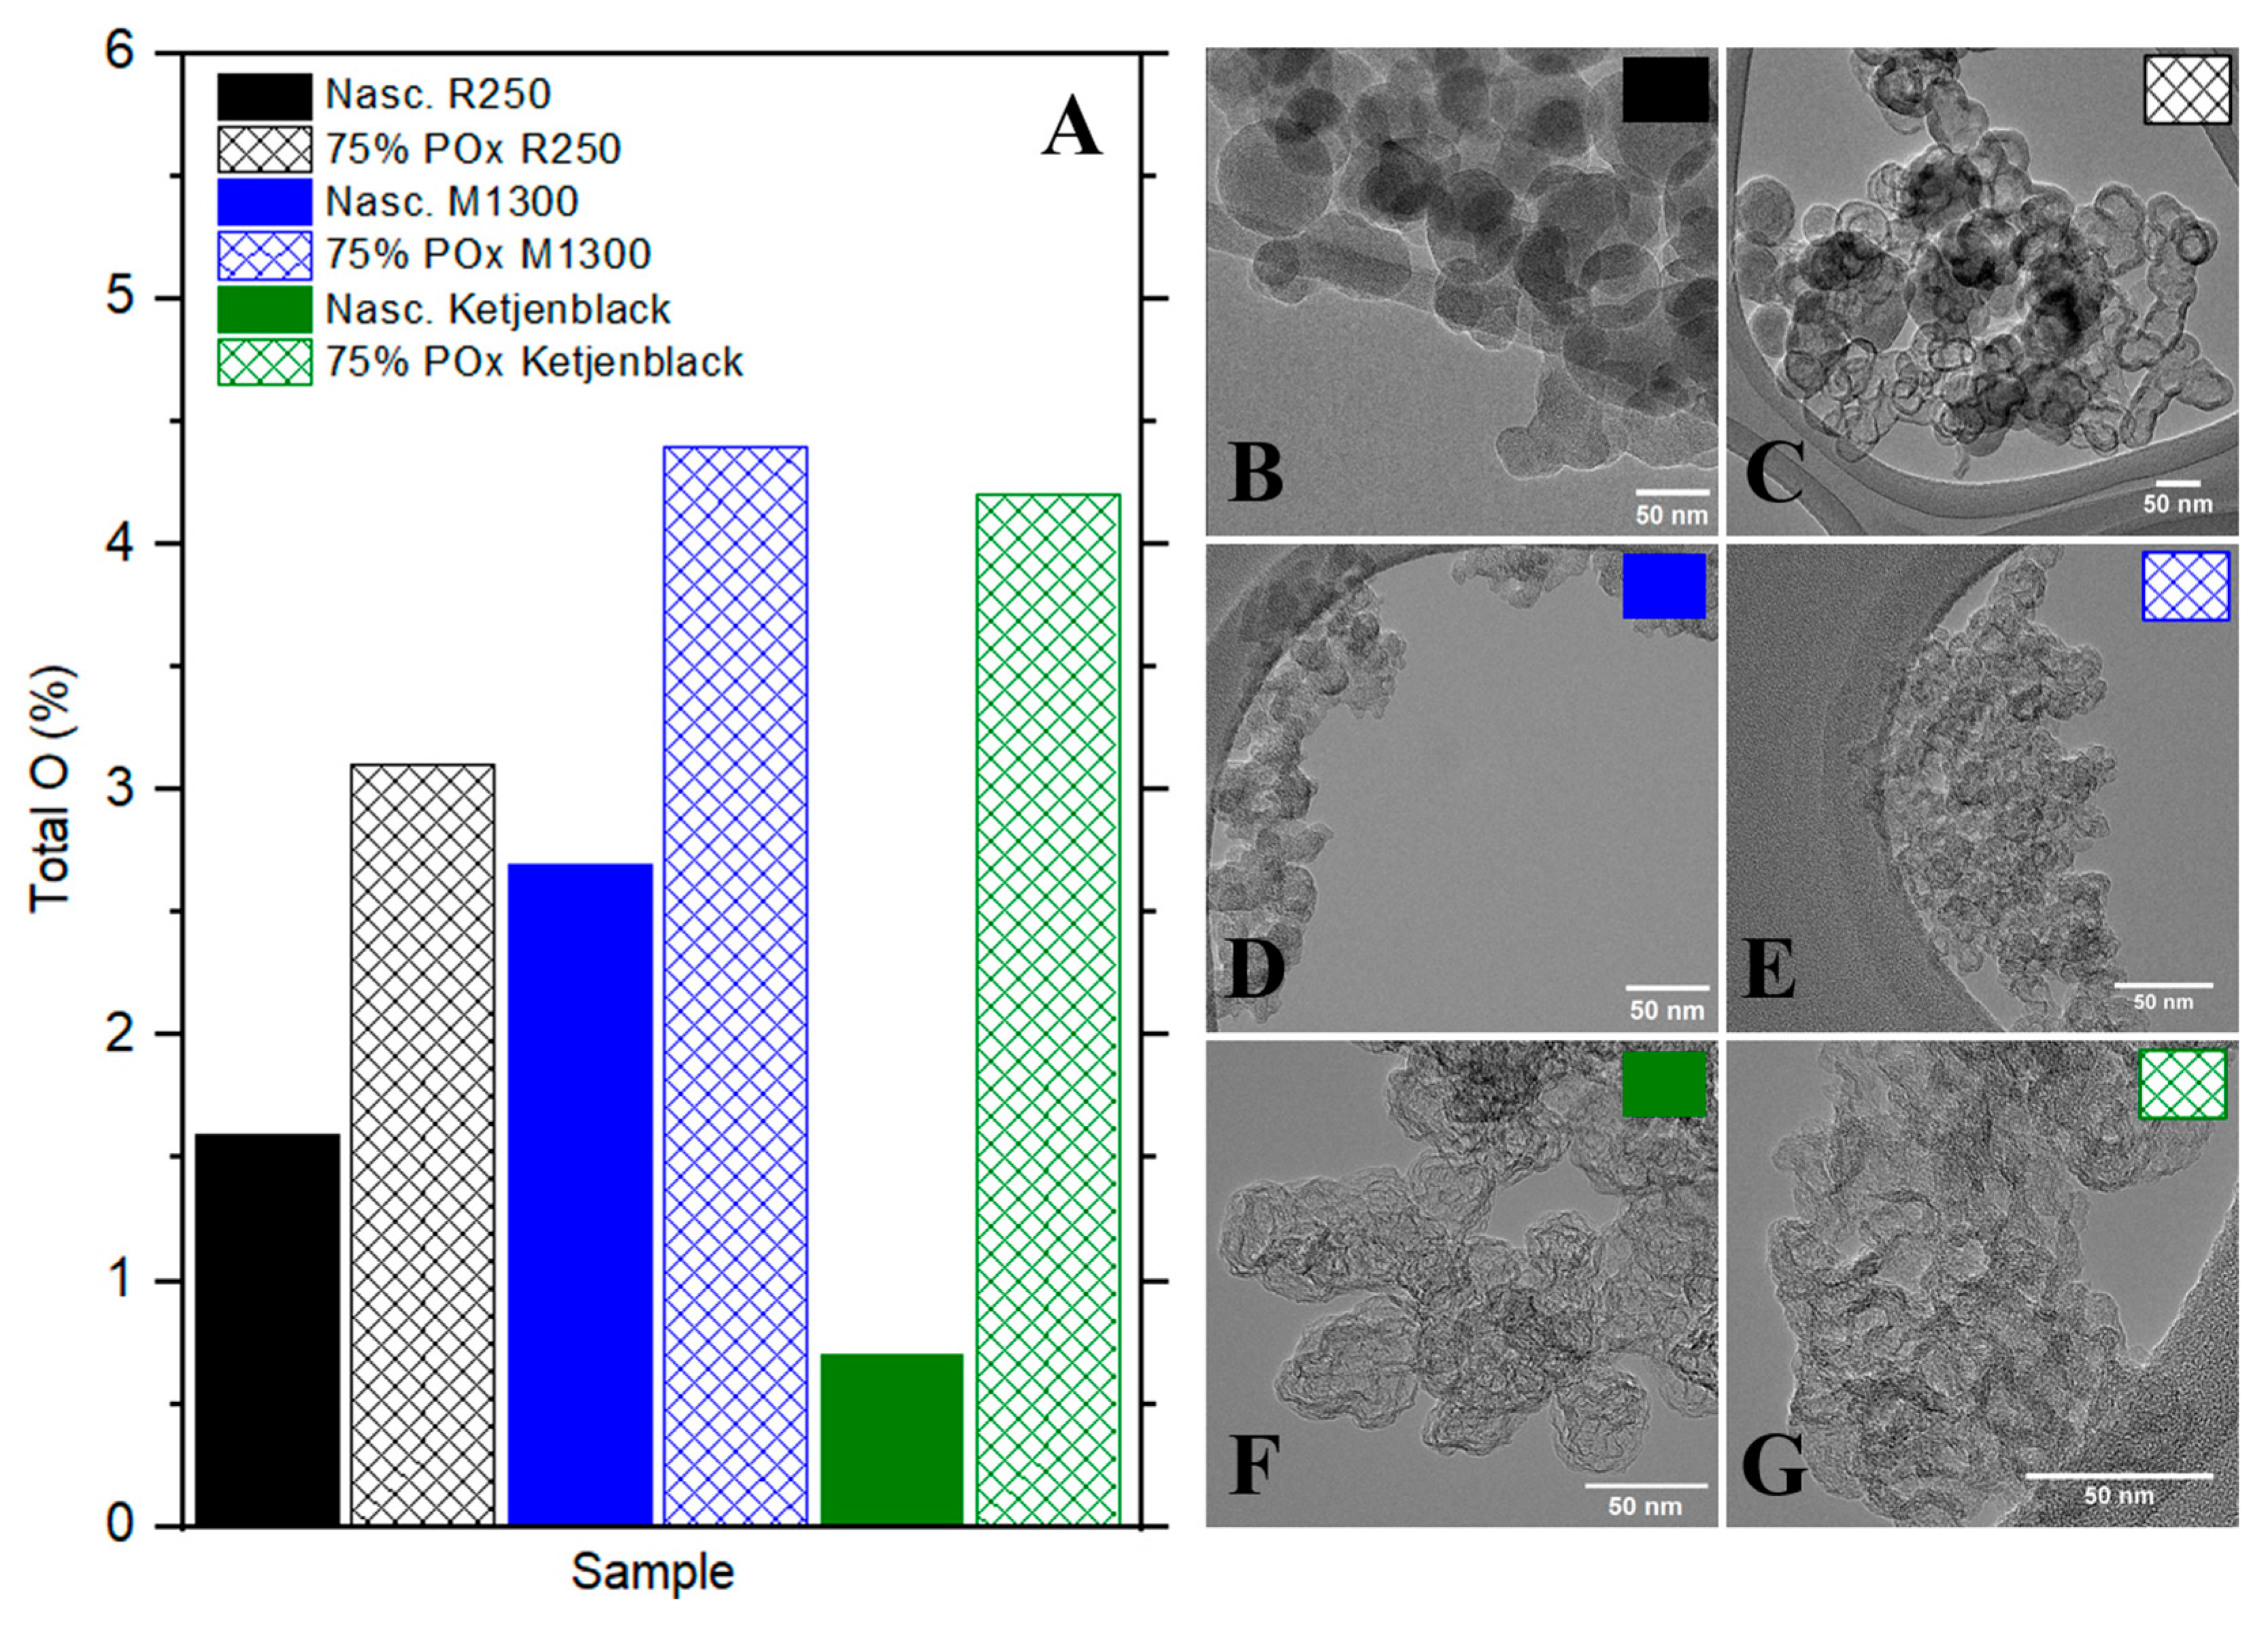
Figure 4 shows the total oxygen content (O%) measured by XPS for the three carbon catalysts before and after 75% partial oxidation, along with their respective TEM correspondents. All samples underwent mild oxidation and activated O
2; chemisorption, followed by surface analysis. Importantly, surface area increased for all catalysts following oxidation, except for Ketjenblack. R250, in particular, exhibited the most dramatic surface area gain, increasing by more than 600%. The substantial increase in surface area implies that R250’s structure contained previously inaccessible pores that were exposed through oxidative treatment or that the nascent nanostructure possessed high propensity to form interlayer pores. The oxygen content of the partially oxidized R250 increased from 1.6% to 3.1% compared to the nascent and M1300 improved from 2.7% to 4.4% oxygen atomic percent. The highest O% improvement was displayed by Ketjenblack with an increase from 0.7% to 4.2%. The differences in oxygen uptake and surface area evolution reflect key differences in nanostructure of the partially oxidized carbons. R250 appears moderately ordered with latent porosity that becomes accessible upon oxidation. M1300 is highly disordered and easily oxidized but may lack the structural characteristics needed for catalytic activity. Ketjenblack is initially porous and reactive but structurally unstable, as oxidation leads to surface collapse despite extensive functionalization. These structural fingerprints help explain each material’s afore-described reactivity and suitability for TCD.
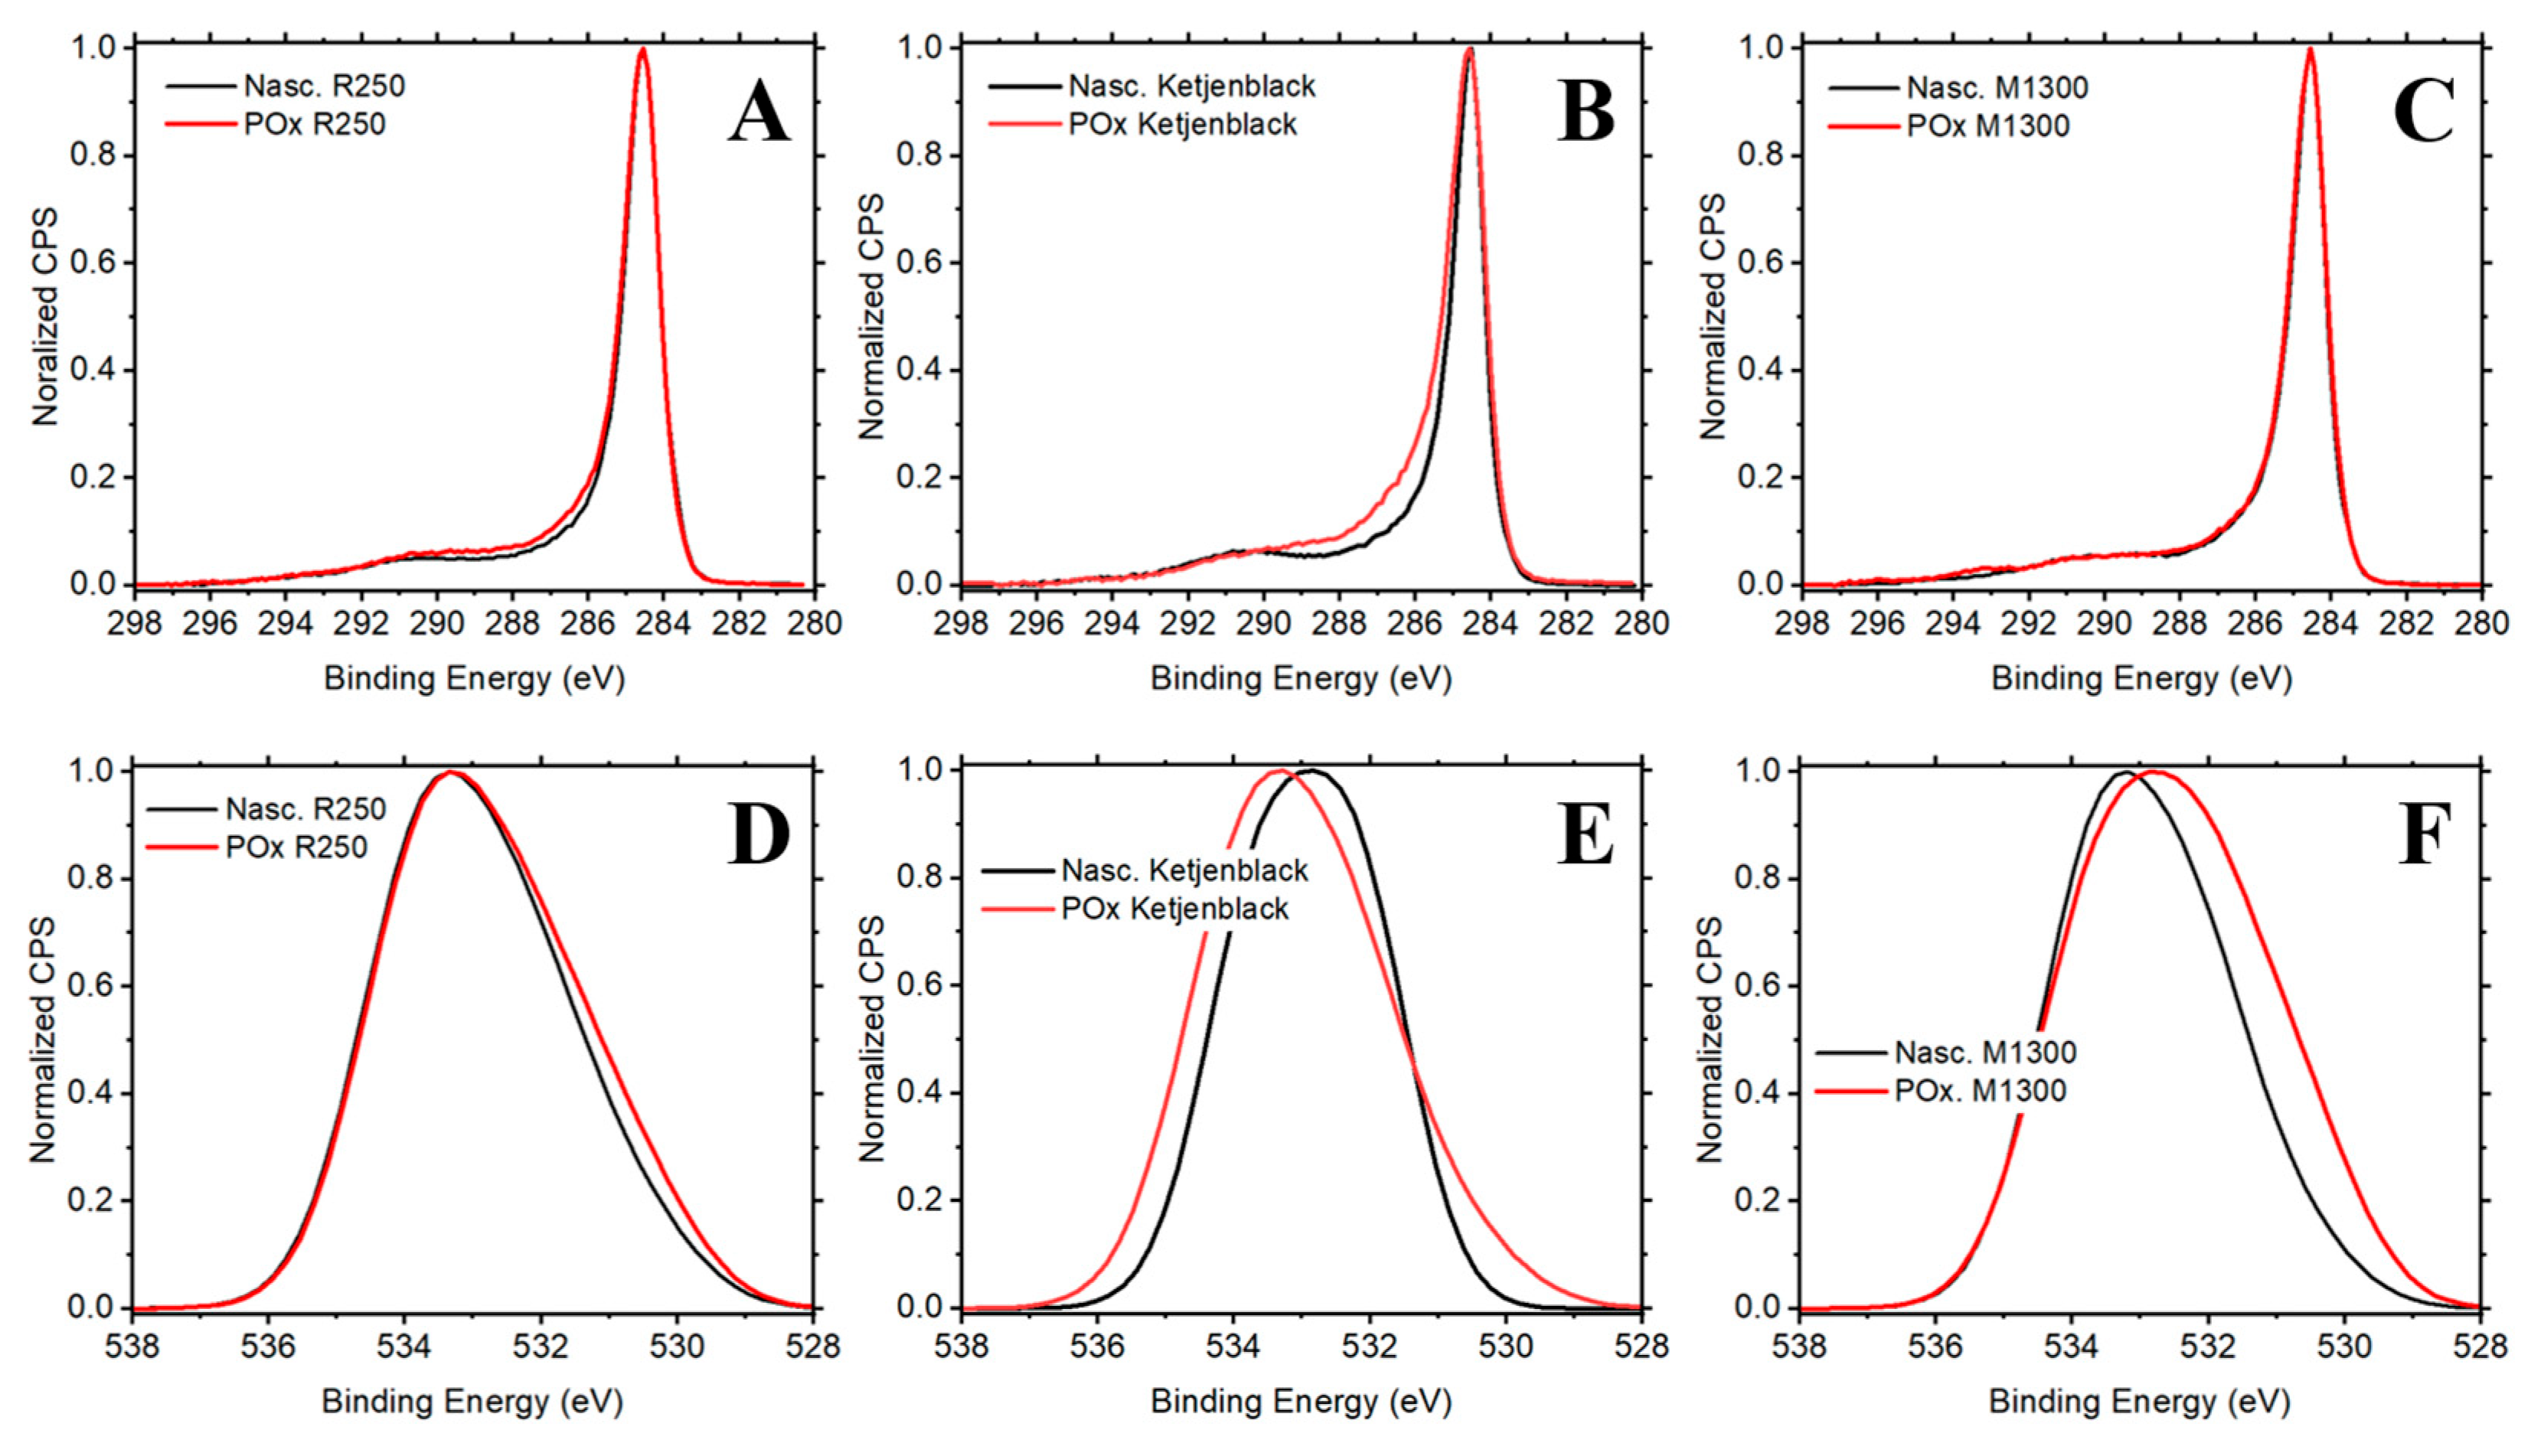
The C 1s and O 1s spectra were deconvoluted using a combination of Gaussian–Lorentzian peak shapes and appropriate background subtraction. In our analysis, we found that nascent carbon catalysts exhibited differences in surface chemistry, indicating a variation in the surface functional groups introduced by partial oxidation and activated chemisorption. Ketjenblack displayed the largest oxygen uptake as shown in
Figure 5. XPS deconvolutions of the C 1s can be found in
Figure S5a and O 1s in
Figure S5b of the Supplementary Materials.
2.4. Reaction Rates and Activation Energy
Activation energy plays a central role in understanding the kinetics of methane decomposition over carbon catalysts. Generally, a lower activation energy correlates with a higher number of accessible active sites, making them more desirable catalysts for hydrogen production via TCD, (unless the apparent rate is normalized by active site number) Still, activation energy can be used to assess and rank catalytic activity of the different carbons. For example, graphite being composed mainly of relatively inert basal sites, requires higher TCD temperatures for methane decomposition in comparison to commercial carbon black whose disorder and edge sites abundance helps promote methane activation. Conversely, partial oxidation of carbon blacks enhances many physical and chemical properties of these catalysts including surface area and porosity, as well as surface (oxygen) functional groups that can initiate active sites at elevated temperatures. These modifications lead to increased reactivity and potentially lower activation energy.
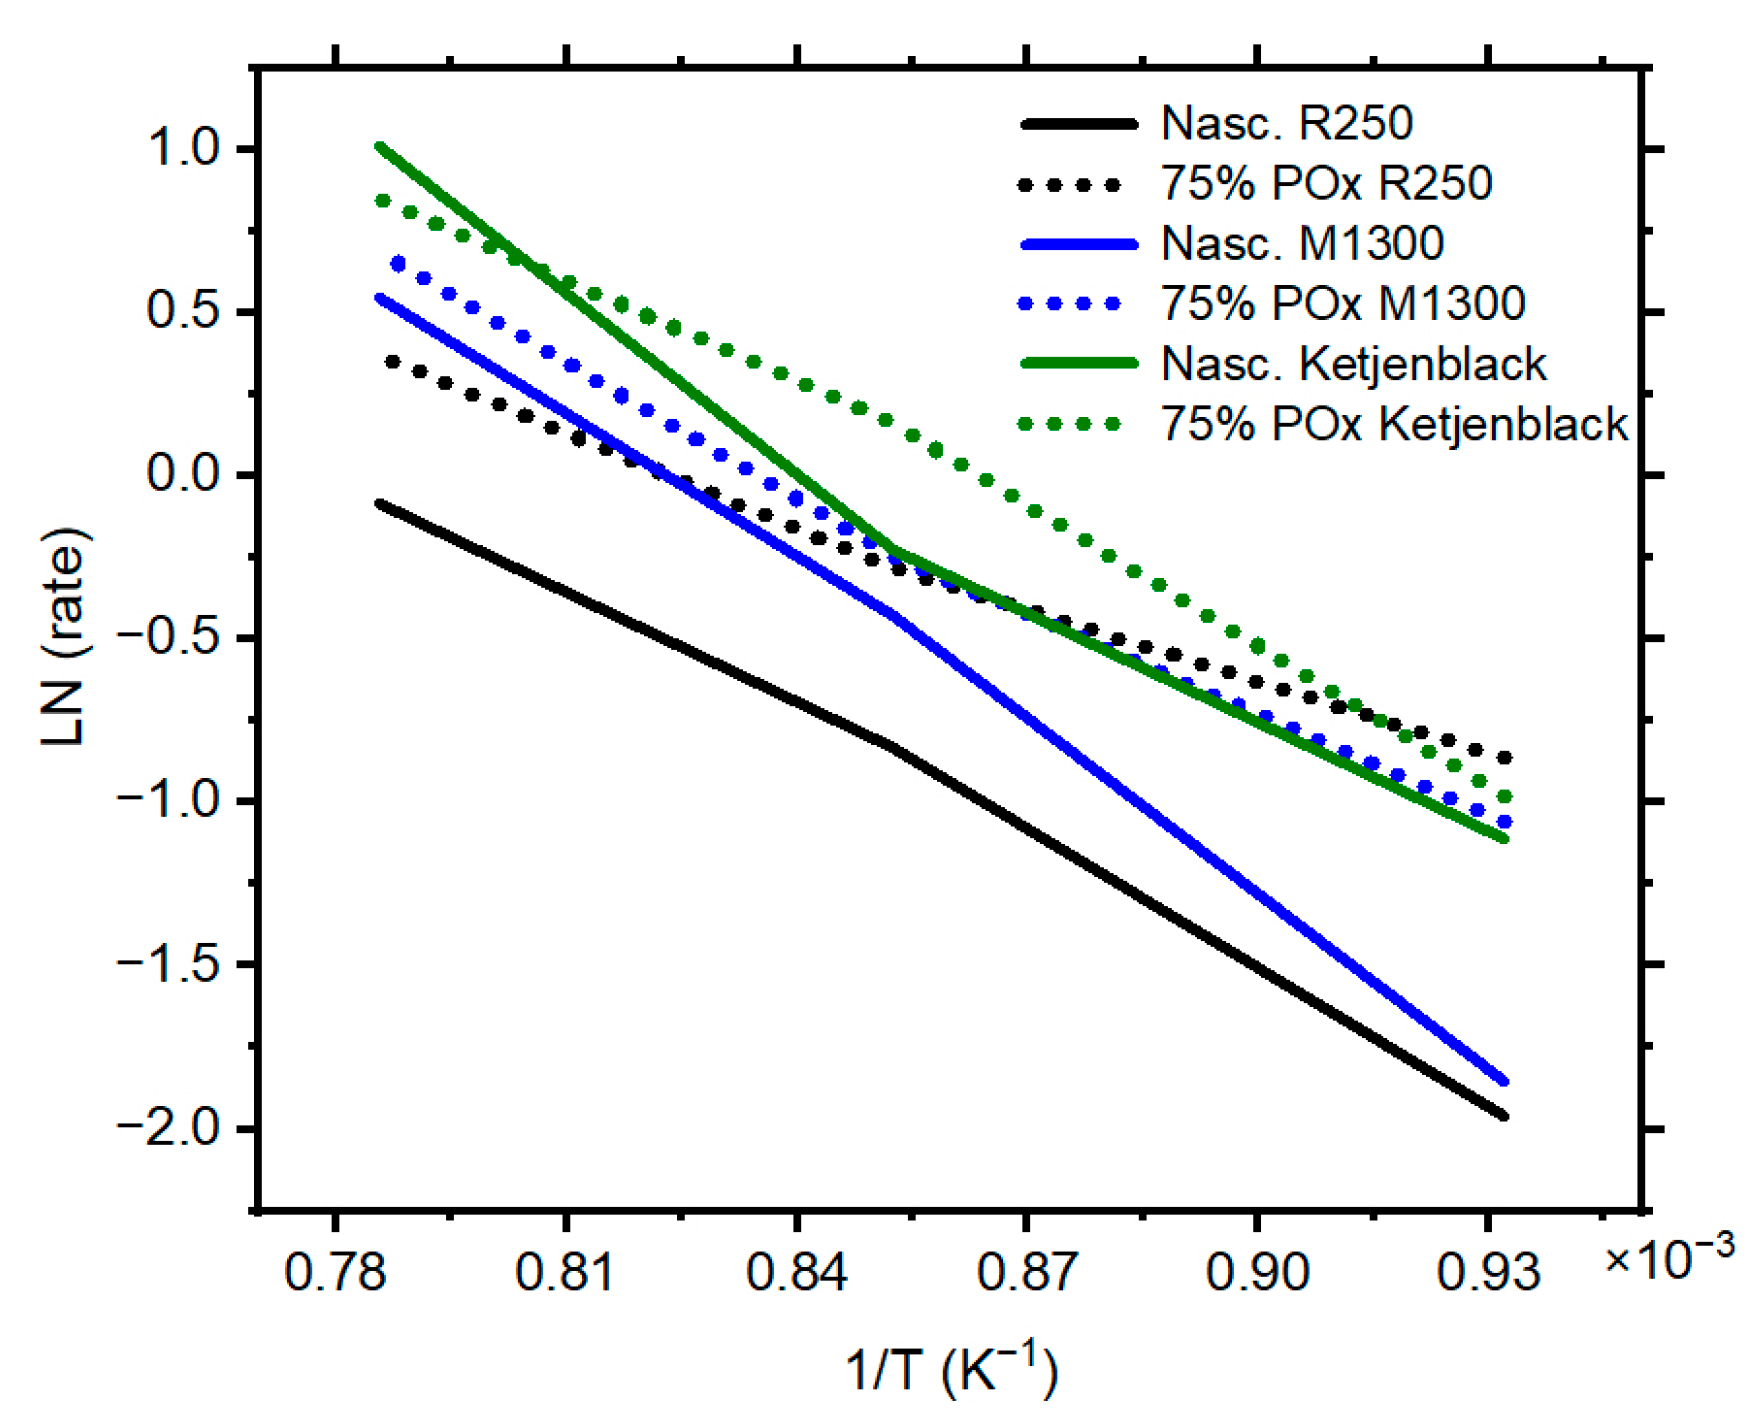
The Arrhenius plots illustrated in
Figure 6 provide a clear comparative view on the catalytic behavior of the three nascent carbon blacks and their partially oxidized counterparts. The assumption of an Arrhenius behavior implies that TCD reaction kinetics are thermally activated and that the slope of each plot is proportional to its activation energy. A summary of the activation energy values is presented in
Table 1.
R250: nascent R250 has an activation energy of 107.1 kJ/mol, showing a comparatively steep slope in the Arrhenius plot. This indicates moderate activity, particularly at lower temperatures. However, after 75% wt. partial oxidation, the activation energy dropped to 69.7 kJ/mol. This drastic change in the energy requirement (~35% drop) indicates that in addition to increasing the surface area, partial oxidation likely exposed additional reactive edge sites that in turn enabled higher decomposition. This also suggests that the reactivity of R250 was initially limited by structural and chemical factors that were successfully addressed by the mild oxidation.
M1300: This carbon black exhibits its highest activation energy in its nascent form (136.7 kJ/mol). However, unlike R250, M1300 has an even higher temperature dependence. After partial oxidation, the activation energy decreases substantially to 98.5 kJ/mol (28% drop compared to its nascent form). While it exhibited the lowest catalytic activity among the three carbons, this improvement demonstrates that oxidation can disrupt graphitic domains and increase defect density or edge site exposure, thereby enhancing catalytic performance.
Ketjenblack: This catalyst displayed a different behavior from the other two carbon blacks. Notably, in its nascent form, it has an activation energy of 119.8 kJ/mol. As with the other two catalysts, the activation energy of Ketjenblack decreased to 104.5 kJ/mol upon partial oxidation. However, this carbon showed the smallest activation energy improvement, a change of only ~13%. This small reduction indicates that the nascent structure of Ketjenblack is already catalytically well-optimized for TCD, and that the partial oxidation treatment offers limited additional benefit.
This summary of activation energies shows that the catalytic effectiveness of carbon materials is a function of both structural order and surface activity, both of which can be tuned through targeted post-treatment strategies like partial oxidation. The activation energy differences between the nascent versus partially oxidized carbon blacks highlight the impact of nanostructure upon catalytic activity. Our measured methane activation energies (69.7–136.7 kJ/mol), along with the contributions of C2 and C3 hydrocarbon components, are consistently lower than the literature-reported values for pure methane decomposition (141–243 kJ/mol) [
17,
25,
26] over carbon catalysts under comparable conditions. This difference suggests that the presence of higher hydrocarbon intermediates facilitates methane activation by lowering the apparent energy barrier. C2 and C3 species are more reactive than methane, and their adsorption, decomposition, and subsequent radical generation can provide additional reactive pathways that promote methane conversion at lower energies. Consequently, the observed activation energies reflect not only intrinsic methane dissociation but also the synergistic role of these higher hydrocarbons in accelerating the overall reaction. Underscoring this feature is that changes to nanostructure by oxidation (regeneration) can substantially change the carbon activity—as demonstrated here on the nascent catalysts.
2.5. Carbon Deposition Rates
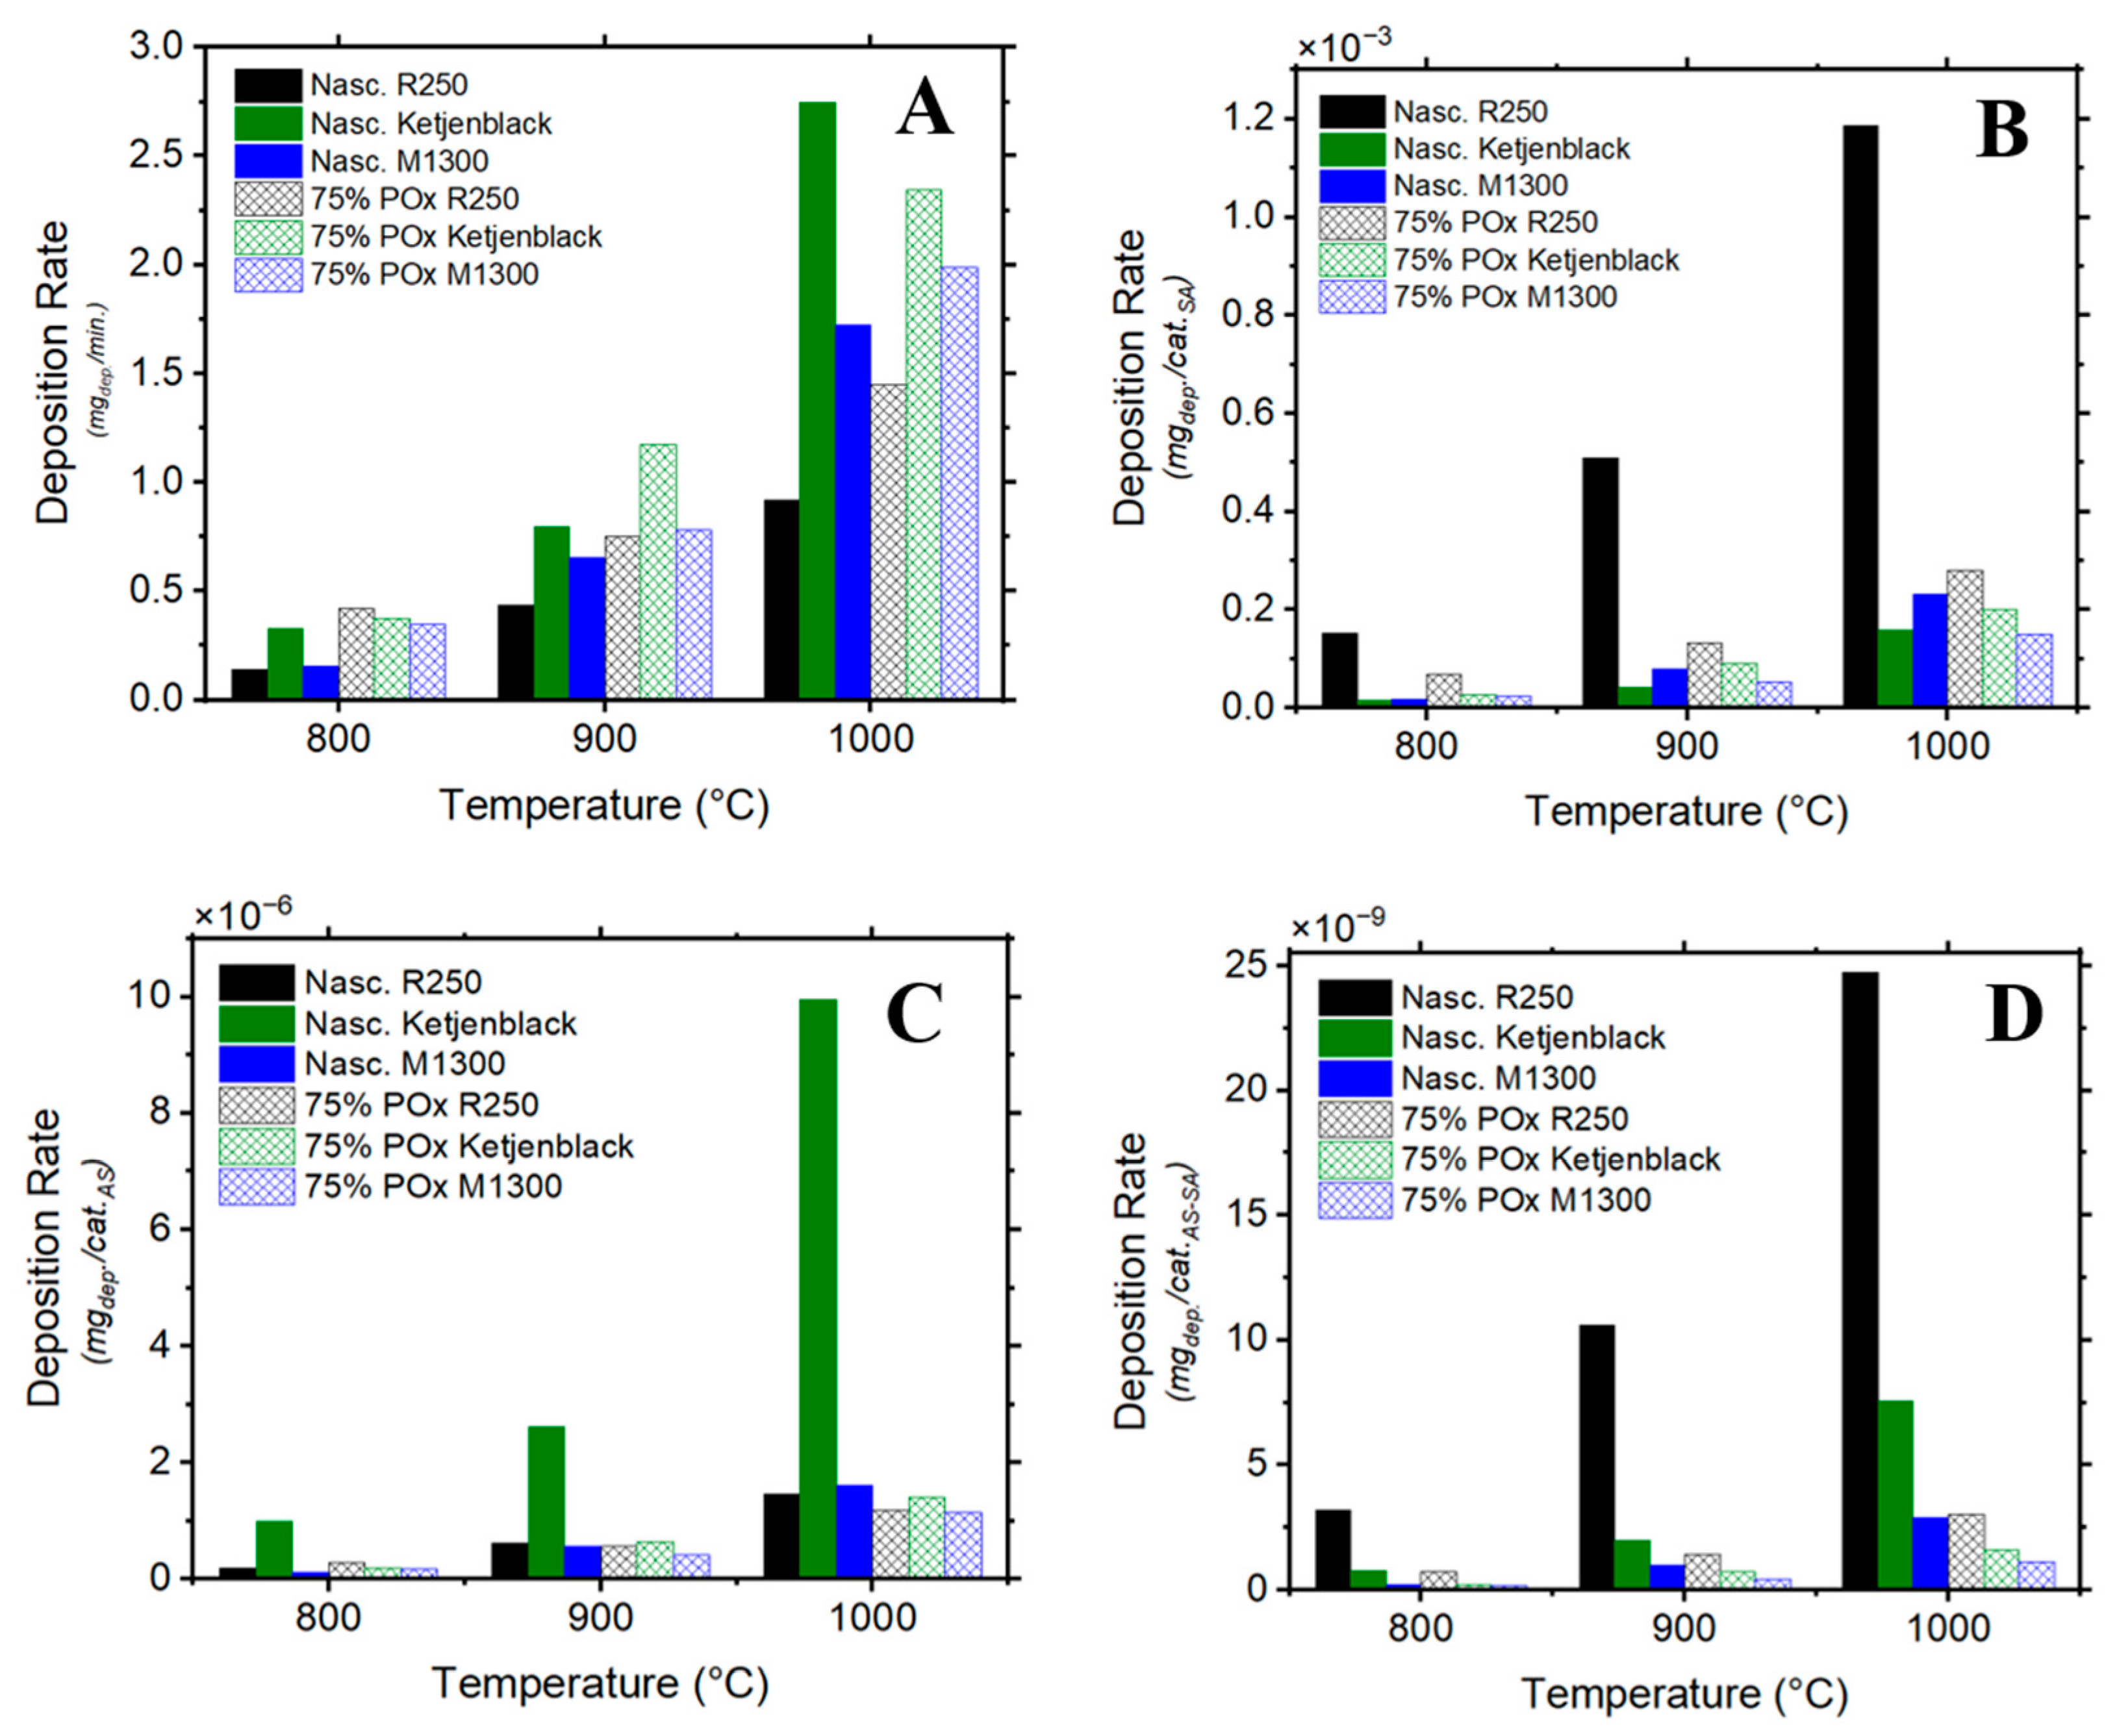
The temperature-dependent deposition rate plots (A–D) provide valuable insights into the performance of carbon catalysts before and after partial oxidation. These plots illustrate how deposition rates vary not only with temperature but also with the physical and chemical characteristics of each catalyst. To note, all catalysts were tested under identical reaction conditions, including gas composition, flow rate, and catalyst mass. Additionally, all measured rates likely represent steady-state values and all normalization parameters (catalyst mass, BET surface area, chemisorbed oxygen content) were accurately determined and representative of active site availability or surface accessibility.
Figure 7A shows that all catalysts exhibit an increase in carbon deposition with temperature, as expected for a thermally activated process. At 1000 °C, the highest overall rates are observed, particularly for partially oxidized R250 and M1300. Nascent Ketjenblack also shows strong performance across all temperatures, especially at 1000 °C where the mass deposition rate of the nascent Ketjenblack far surpasses that of its oxidized variant. This observed higher activity for nascent Ketjenblack at 1000 °C likely arises from multiple contributing factors. Elevated temperatures can enhance the intrinsic reactivity of carbon surfaces, increasing SNG decomposition rates. Additionally, certain active sites on the carbon may only be chemically active at higher temperatures, whereas they remain largely inactive at lower temperatures. Together, these effects can lead to enhanced catalytic performance observed at 1000 °C for the un-oxidized Ketjenblack. Panel B of
Figure 7 shows the deposition rate normalized by catalyst surface area per unit mass. Here in particular, nascent R250 surprisingly shows the highest surface area normalized deposition mass deposition rate, especially at higher temperatures. This suggests that even though R250 has lower mass deposition rate per total time (panel A), its catalytic sites are presumably more active per surface area of unit mass. M1300 and Ketjenblack show moderate activity per unit surface area, and the benefits of POx treatment appear less pronounced when normalized this way.
Another deposition rate normalization is illustrated in panel C. Here, deposition rates are normalized by the amount of chemisorbed oxygen. The amount of chemisorbed oxygen species is adopted as a proxy for active sites formed during or after partial oxidation. By this normalization metric, nascent Ketjenblack dominates deposition, especially at high temperatures. In contrast, the POx-treated samples show lower site-specific activity. This points to a degree of site heterogeneity. It should be noted that, while oxidation increases active site density, it may not necessarily improve active site quality. Furthermore, mass deposition rates can be more influenced by the deposited carbon in contrast to the original catalysts as a greater concentration of active sites may be more susceptible to early deactivation by TCD deposited carbon.
Finally, panel D provides deposition rates normalized to the product of surface area and active site density, offering a surface-specific perspective. Again, nascent R250 exhibits the highest activity while Ketjenblack and M1300 perform moderately. POx-treated samples show reduced rates despite high overall surface areas. This implies that the new surface introduced by oxidation is not uniformly catalytically active—either due to passivated regions, the presence of less-reactive oxygen functionalities, or structural changes that create surface but not necessarily productive edge sites. Therefore, more surface area does not always translate to higher surface-specific reactivity.
2.6. Carbon Deposit Nanostructure
TEM images of the nascent and partially oxidized carbon black catalysts (pre- and post TCD) are presented in
Figure 8 In its nascent form, R250 has visible lamellae configured in the usual concentric manner about the particle core with decreasing structure towards the particle interior (panel A). M1300 appear more aggregated with irregular shape. It has no clear concentric lamellae arrangement or ordered layering (panel B). Ketjenblack displays a highly curved morphology with somewhat randomly oriented fringes (panel C) reflecting many interlocked partial shells. Upon partial oxidation, the interior of R250 particles become hollow and/or exhibit a cotton-like appearance with low density and high porosity. M1300 and Ketjenblack oxidation resulted in some degree of particle fragmentation most likely due to their curved morphologies. For all carbon catalysts, outgrowths and protruding structures resembling coral-like carbon formations (indicated by the arrows in
Figure 8) are evident in the TCD deposited carbon. As we noted in our previous work [
24], the formation of similar TCD carbon on all catalysts indicates that the structure of the deposited carbon does not depend on the nascent carbon catalyst structure; rather, it is a function of the hydrocarbon feed and temperature—together controlling the structure of the TCD carbon and autocatalytic self-regulation of the TCD rate. The dominance of coral-like carbon deposits helps explain the sustained thermo-catalytic decomposition performance at prolonged reaction times. Fringe analysis distributions of the nascent carbon catalysts are provided in the
Supplementary Materials Figure S2.

