Article

Photocatalytic Oxidation of Pesticides with TiO2-CeO2 Thin Films Using Sunlight

by
Tania Arelly Tinoco Pérez
1,
Evaristo Salaya Gerónimo
1,
José Gilberto Torres Torres
1,
Gloria Alicia del Angel Montes
2,
Israel Rangel Vázquez
3,
Adrian Cordero García
1,
Adrian Cervantes Uribe
1,
Adib Abiu Silahua Pavon
1 and
Juan Carlos Arevalo Pérez
1,*
1
Centro de Investigación de Ciencia y Tecnología Aplicada de Tabasco, División Académica de Ciencias Básicas, Universidad Juárez Autónoma de Tabasco, Cunduacán 86690, Mexico
2
Ciencias Básicas e Ingeniería, Laboratorio de Catálisis Edificio R-216, Universidad Autónoma Metropolitana-Iztapalapa, Av. Ferrocarril San Rafael Atlixco 186, Col. Leyes de Reforma 1ª Sección, Alcaldía Iztapalapa 09310, Mexico
3
Departamento de Química, Division de Ciencias Naturales y Exactas, Campus Guanajuato de la Universidad de Guanajuato, Noria Alta s/n, Col. Noria Alta, Guanajuato 36050, Mexico
*
Author to whom correspondence should be addressed.
Catalysts 2025, 15(1), 46; https://doi.org/10.3390/catal15010046
Submission received: 12 December 2024 / Revised: 1 January 2025 / Accepted: 3 January 2025 / Published: 6 January 2025
(This article belongs to the Special Issue Advances in Photocatalytic Degradation)

Abstract

:
TiO2 thin film coatings significantly improve catalyst separation in photocatalytic processes. They can be applied in heterogeneous photocatalysis under sunlight by mixing TiO2 with other oxides, such as CeO2, for the removal of pollutants in water. Here, TiO2-CeO2 thin films deposited on borosilicate slides were analyzed and applied in solar heterogeneous photocatalysis for the oxidation of pesticides. The films were synthesized by the sol-gel method with spin coating. The waste solutions from the synthesis were used to prepare TiO2 and TiO2-CeO2 powders. These were analyzed by XRD and XPS to explain the behavior of the films. The thin films were characterized by UV-Vis spectroscopy with transmittance, UV-Vis spectroscopy with RDS, profilometry, AFM and SEM. The addition of CeO2 to TiO2 caused a decrease in the average crystal size and an increase in the strain index. The addition of a second layer made the TiO2-CeO2 thin films thinner. The CeO2 created surface and electronic defects in the titania films, which enhanced their photocatalytic properties under sunlight in the mineralization of diuron and methyl parathion. The TiO2-CeO2-5.0% single-layer thin film samples were the most active in this study and will undoubtedly be applied in larger-scale reaction systems.

1. Introduction

Titanium oxide is the most widely used semiconductor in heterogeneous photocatalysis for the treatment of emerging contaminants in water and air due to its low cost, abundance, chemical–mechanical stability, low toxicity, and excellent textural, structural, and semiconductor properties [1,2]. Doping TiO2 with noble metals, transition metals, metal oxides, lanthanides, and non-metals modifies the morphology, structure, and optical and electronic properties of this semiconductor, increasing its efficiency in the photocatalytic degradation of aqueous contaminants using sunlight or visible light [3]. However, it is crucial to note that many of these studies are conducted on photocatalysts in the form of extremely fine powders, which pose significant risks in occupational settings due to the potential for inhalation and epidermal exposure. The toxicity of TiO2 depends on the exposure time and particle size, making it imperative to exercise caution when handling these materials [4]. Fine TiO2 powders exhibit high photocatalytic activity because they can be almost homogeneously mixed with water, as shown by Degussa TiO2 (P25). However, this also represents a significant drawback. It is extremely challenging to separate this solid from the aqueous medium for recovery, which increases the energy costs if it is to be reused [5]. Furthermore, it has been demonstrated that the depth of the light penetration in an aqueous medium is limited by the absorption of the TiO2 particles and by the molecules present in the reaction [6].
These issues can be addressed through the utilization of TiO2 coatings deposited on inert matrices, which facilitate the separation of the reaction medium. TiO2 thin films are employed primarily as anti-reflective coatings, protective layers for optical objects, sensors, and self-cleaning anti-pollution surfaces [7]. The latter have been the subject of increased research activity because of the environmental benefits they generate. The creation of antimicrobial surfaces is a particularly promising avenue of research, with potential applications in hospitals and other settings where the elimination of pathogenic microorganisms is desirable [8]. Such coatings are also employed in the filtration of ventilation systems, with the objective of eliminating volatile organic compounds in the gaseous phase as contaminants in enclosed spaces. In the treatment of contaminated water, thin films have been deposited on inert substrates that are easily accessible and have a large contact area, using methodologies that are straightforward to reproduce and cost-effective. It can be reasonably deduced that methodologies based on the sol-gel process, such as dip coating [9] and spin coating [10], are optimal for achieving the above-mentioned conditions. The latter allows for effective control of the thickness of thin films by increasing or decreasing the rpm, thereby utilizing centrifugal forces. Furthermore, it is straightforward to regulate, as the number of precursors in the sol-gel method with suitable solvents can be varied, thus conferring considerable versatility for deposition in diverse matrices with extensive contact areas [10]. There is sufficient evidence in the literature to demonstrate the effectiveness of these coatings in the photocatalytic degradation of dyes in aqueous media [11]. It is currently the objective of researchers to enhance the efficiency of these coated materials when illuminated by visible or solar radiation, with the aim of reducing the costs involved in the process. This has been achieved by producing TiO2 coatings doped with lanthanide ions [12] or with TiO2 mixed with other photoactive inorganic oxides, such as ZnO [13], SiO2 [14] and CeO2 [15]. The combination of the aforementioned ideas leads to the conclusion that CeO2 can act as both a dopant and a mixed oxide in TiO2 depending on its concentration. Moreover, it has been demonstrated that the CeO2 coating can also generate a self-healing effect in stainless steel as a thin film, thereby preventing corrosion [16]. The evaluation of thin films of TiO2 doped with CeO2 under UV light has demonstrated that these films can store and release oxygen, which causes surface vacancies. Furthermore, the effect of electron–hole pair recombination is reduced, thereby increasing the photocatalytic activity and generating a higher availability of hydroxyl radicals, which are responsible for the oxidation process [17]. Despite the wide band gap energies of TiO2 and CeO2, these materials exhibit an enhanced spectral response under UV light. However, when doped or formed into heterojunctions in the form of thin films, it has been demonstrated that they generate hydrophilic surfaces photoinduced by electron–hole pairs. Also, CeO2 reduces the band gap energy of TiO2, thereby increasing its absorption of visible light and improving the separation of photogenerated charges. It has previously been reported that the variation in the Eg of TiO2-CeO2 can be attributed to the formation of defect levels inside the forbidden energy levels of the system. There are five reasons why the Eg changes in TiO2: (i) substitution of Ti4+ by Ce4+, (ii) vacancies created by Ti4+, (iii) the quantum size effect relating to the surface, (iv) oxygen vacancies created by Ti3+ and (v) the presence of Ce3+ on the grain boundaries [18]. This has significant implications for photocatalytic applications under visible light, as evidenced by previous studies [19,20,21]. The observations indicate a dearth of studies that have investigated the photocatalytic efficiency of TiO2-CeO2 thin films in the removal of aqueous pollutants under sunlight or visible light. The objective of this study is to analyze the effect of CeO2 variations in TiO2-CeO2 thin films deposited on borosilicate slides for the solar photocatalytic oxidation of two pesticides in aqueous media. The coated borosilicate slides were prepared using the sol-gel method with spin coating, achieving up to two layers of deposition without the presence of fractures in the coating, with the ability to be continuously used and separated in different reaction cycles.

2. Results and Discussion

2.1. XRD

Figure 1 illustrates the XRD patterns of TiO2, CeO2-doped TiO2 and CeO2 powders. It can be observed that the diffraction peaks exhibited by the titania and doped titania samples are located at 25.3°, 37.1°, 48.2°, 53.1°, 55.1° and 62.2° on the 2θ scale. These peaks are associated with the anatase (A) crystalline phase planes of TiO2 (101, 004, 200, 105, 211 and 204). The identification of these peaks was made using the Joint Committee on Powder Diffraction Standards (JCPDS) library. Moreover, no diffraction peak corresponding to CeO2 was identified in the doped samples, which indicates the effective dispersion of CeO2 in the titania. This is because concentrations lower than 10% by weight cannot be identified by XRD due to the small size of the agglomerates, which cannot be detected by this technique [22]. Furthermore, it can be observed that increasing the amount of CeO2 reduces the intensity of the peak associated with plane 101. Specifically, in the sample with the highest CeO2 content, a slight shift is observed, which consequently affects structural parameters such as the crystal size (D) and strain index (Ɛ). These are presented in Table 1, where the crystal size decreases from 10.66 nm to 8.14 nm, while the strain index increases from 0.01549 to 0.02027. These observations confirm that the incorporation of cerium cations in titania affects the particle size and demonstrate a good interaction as a dopant.

2.2. XPS

In order to analyze the surface chemical composition and oxidation states of the elements present in the powders generated by the precursors used to synthesize the TiO2 and CeO2-doped TiO2 thin films, the samples were investigated by X-ray photoelectron spectroscopy (XPS). Figure 2a illustrates the high-resolution XPS spectra of pure TiO2 and TiO2-CeO2-5% employed to normalize the binding energy shift resulting from the electrostatic charges, with the C 1s peak at 284.50 eV serving as the reference point. The XPS spectra of Ti 2p in Figure 2b demonstrate the presence of Ti 2p2/3 and Ti 2p1/2 characteristic signals at 458.6 eV and 464.2 eV, respectively. This indicates the presence of titanium in the form of Ti4+ in the tetragonal structures of both samples [23]. However, upon deconvolution of the Ti 2p3/2 peak in both samples, a signal at 456.49 eV attributed to the Ti3+ species is observed, indicating the presence of active and surface adsorption sites in heterogeneous photocatalysis [24]. This species exhibits a notable increase in relative abundance in the CeO2-doped sample, as evidenced in Table 2. This observation suggests an imbalance of surface charges produced by the dopant. The fitting of the O 1s signal for TiO2 reveals the presence of three bands at 529.37 eV, 531.60 eV and 533.49 eV. In the doped material, these bands manifest at 529.45 eV, 531.50 eV and 533.39 eV, as illustrated in Figure 2c and Table 2. The signal associated with a binding energy of 529 eV is related to oxygen in the form of oxide (O2−) present in the superficial Ti–O bonds [25,26]. The relative abundance of this signal increases when CeO2 is present as a dopant, which could confirm the formation of the Ti–O–Ce bond and generate a greater chemical interaction at the surface level between TiO2 and CeO2. With regard to the signals observed at 531 eV and 533 eV, these have been primarily attributed to the oxygen present in the hydroxyl groups (OH) and to the surface water (H2O), respectively, which result in the formation of oxygen defects in the surface network of TiO2 [17,27]. Additionally, Table 2 illustrates that the relative abundance of both signals diminishes in the presence of CeO2, substantiating the assertion that this dopant induces the creation of more oxygen defects on the surface of titania, thereby enhancing the material’s oxidative capacity and its ability to store and release oxygen [28]. In contrast, Figure 2d presents a detailed analysis of the XPS spectrum of the doped sample, with an amplification factor applied (4×). This reveals the Ce 3d5/2 signals, with the peaks at 882 eV and 888 eV corresponding to Ce4+ (3d94f2) O (2p4) and Ce4+ (3d94f1) O (2p5), respectively. The remaining signals at 880 eV and 884 eV are attributed to the Ce3+ (3d94f2) O (2p5) and Ce3+ (3d94f1) O (2p6) mixture, as previously reported in references [25,29,30]. The height and width of each peak in the four signals exhibit close intensities, indicating a relative abundance value of approximately 1:1, as observed in Table 2. This confirms the presence of the Ce3+/4+ ion mixture in the TiO2-CeO2 at 5.0%, whereby the Ce3+ ion is responsible for the reduction of Ti4+ to Ti3+ in titania, resulting in the formation of additional surface oxygen defects. This, in turn, enhances the photocatalytic properties of the system under visible light [31].

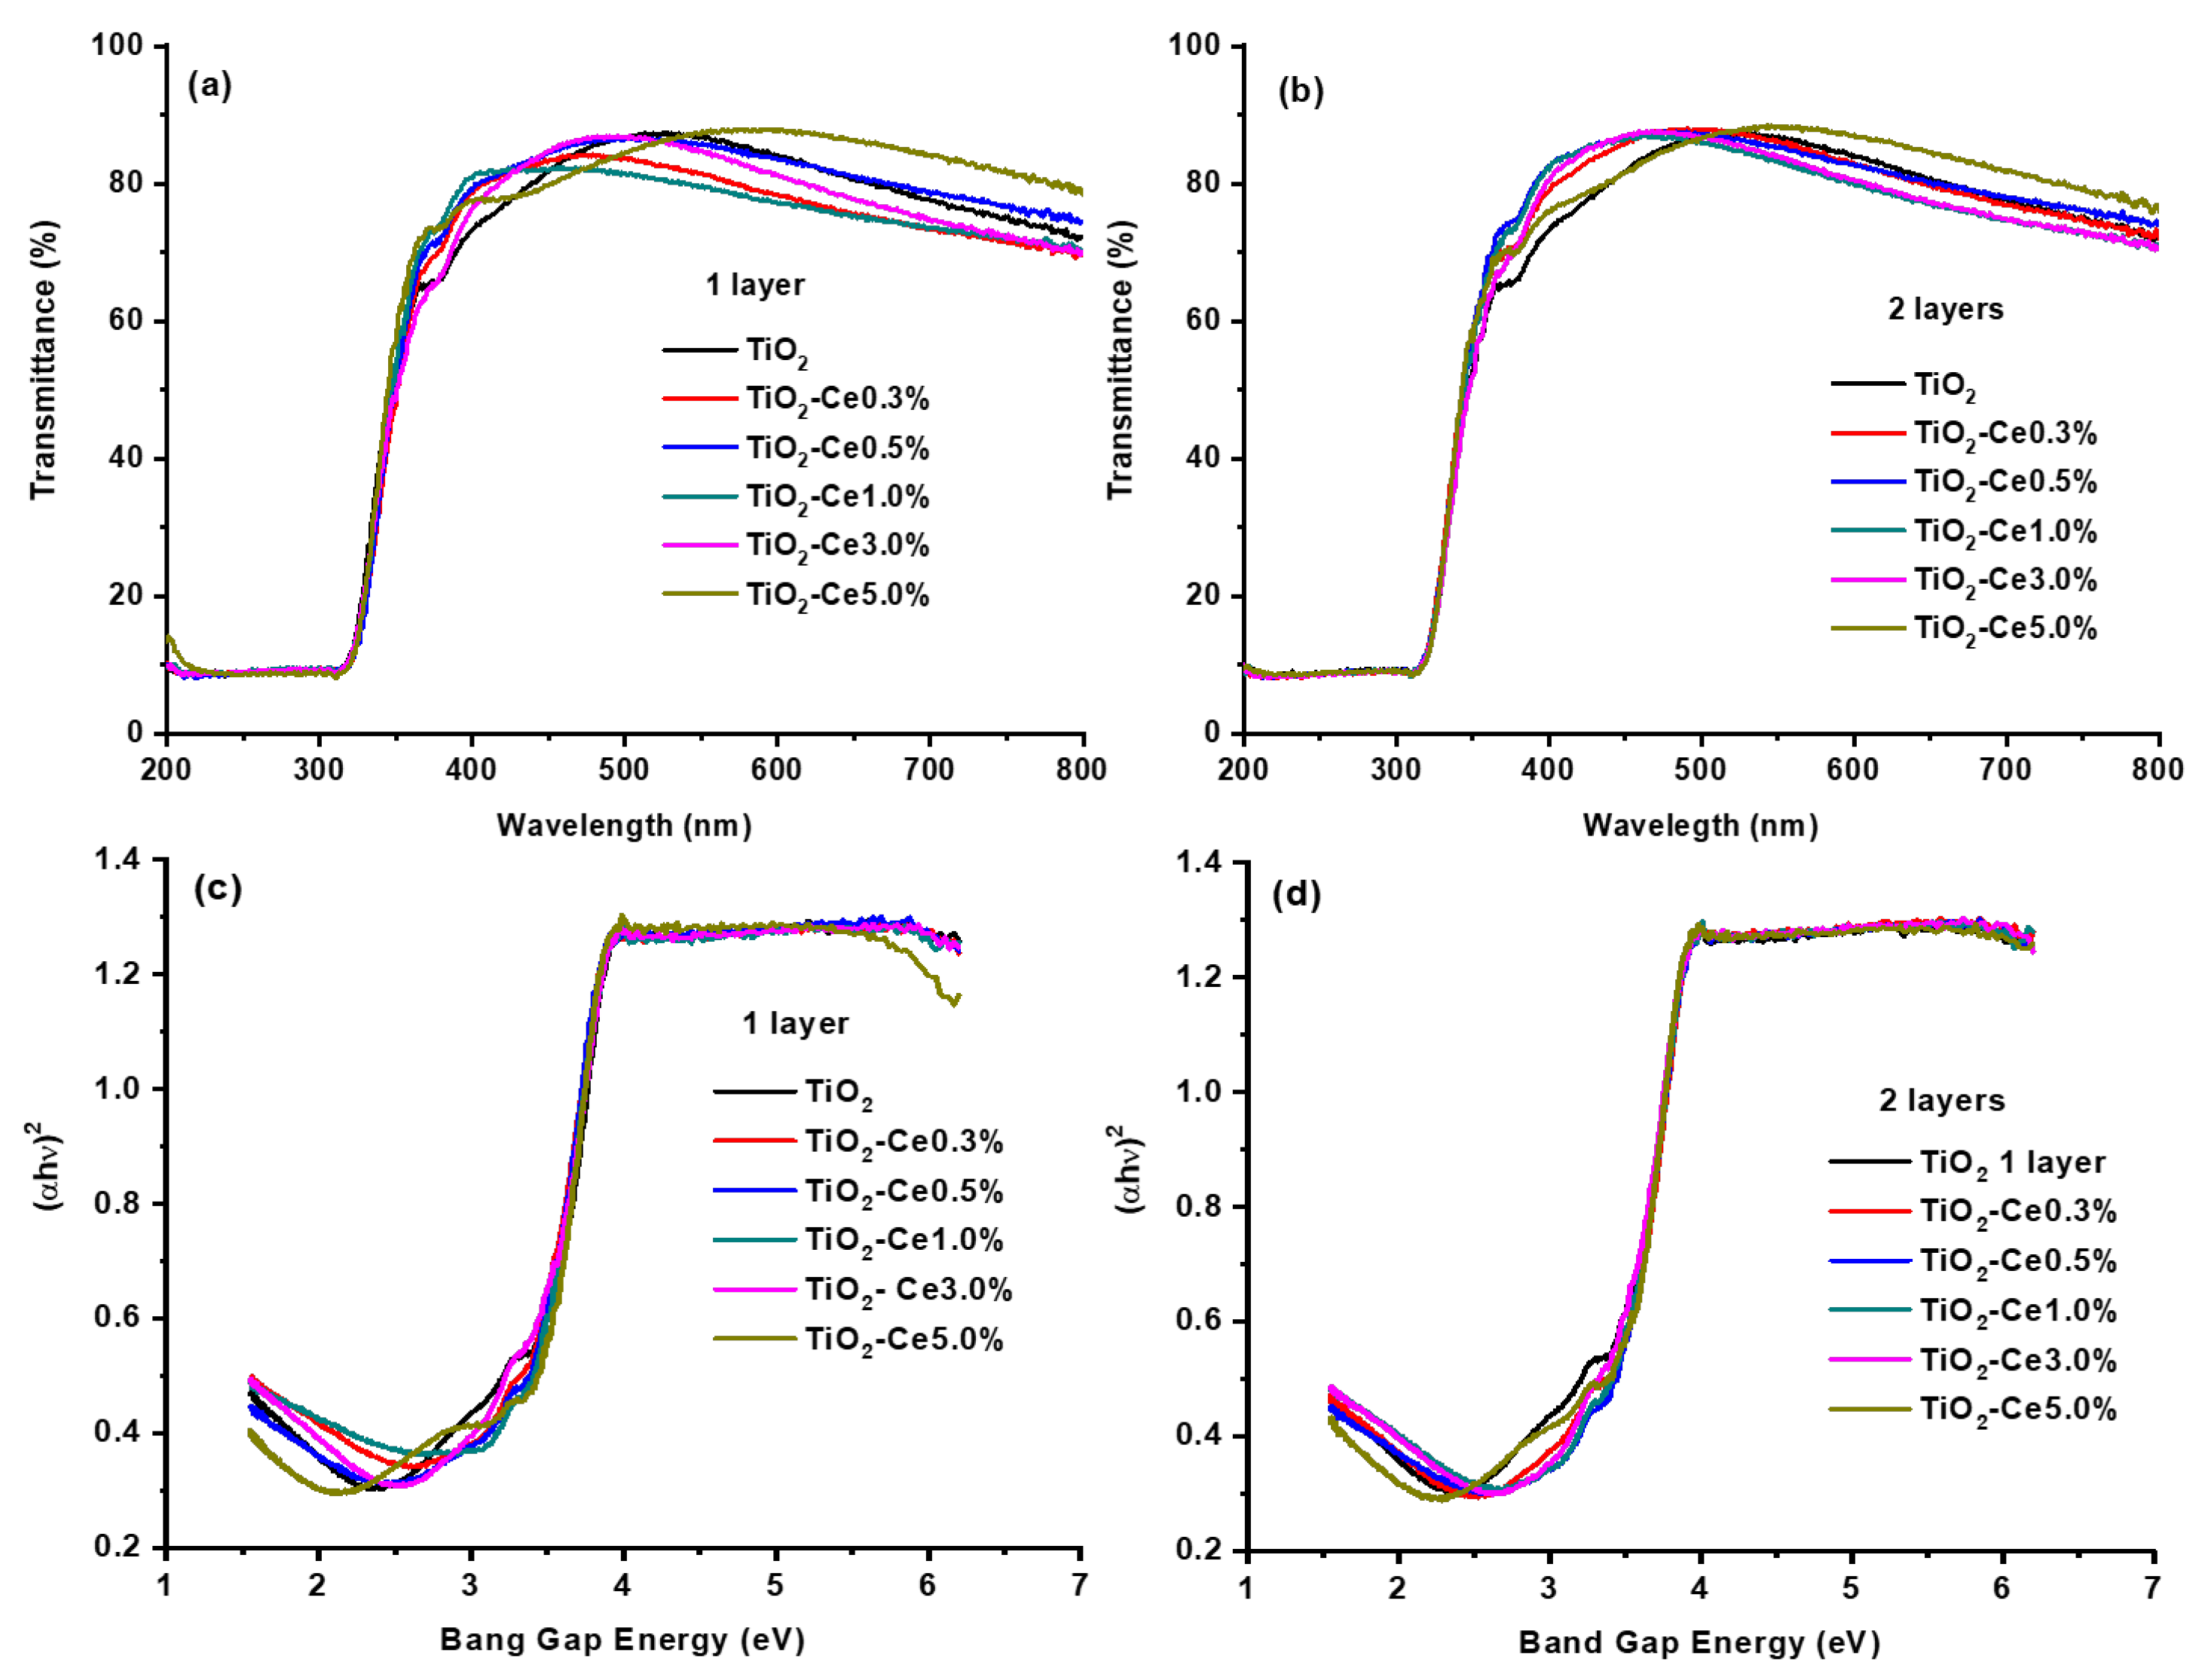
2.3. Transmittance UV-Vis Spectroscopy

The thickness of the analyzed thin films was calculated utilizing the UV-Vis transmittance spectra, as illustrated in Figure 3a,b. This was achieved through the application of the following equation [32]:
t = M λ 1 λ 2 2   n 1 λ 2 n 2 λ 1 ,
where M represents the number of oscillations between the two extremum points (M = 1 between two consecutive maxima or minima). λ1, n(λ1) and λ2, n(λ2) are the corresponding wavelengths and index of refraction. It can be observed that the addition of CeO2 to titania at the lowest concentration results in a reduction in the thickness of the thin film, whether one or two layers are present. This can be attributed to the fact that the incorporation of CeO2 reduces the crystal size of titania, which in turn prevents crystal growth by the formation of Ti–O–Ce bonds. Furthermore, surface nucleation is also related to the ionic radius of Ce3+ (0.115 nm) and Ce4+ (0.101 nm), which are larger than the Ti4+ ion (0.062 nm). In some cases, Ce ions replace Ti ions, occupying interstitial positions [33,34]. Upon reaching a CeO2 concentration of 1.0%, the minimum thickness of the various layers is attained. Subsequently, upon increasing the CeO2 content to its highest concentration, the thickness of the samples increased, with the lowest value observed for the slides with two layers compared to those with one layer (Table 3). This behavior is primarily attributed to the presence of CeO2, as evidenced by the finding that when increasing the number of layers in the thin films of pure TiO2 on slides, under similar synthesis conditions, the thickness of the coating is directly proportional to the number of layers added [35].

2.4. UV-Vis Diffuse Reflectance Spectroscopy

The band gap energy (Eg) for all the samples analyzed was calculated using the Tauc method, plotting (αhν)2 against the photon energy, as TiO2 has been demonstrated to exhibit indirect transition Eg values using the following equation [19]:
α = A ( h v E g ) n h v ,
where α represents the absorption coefficient, denotes the photon energy, A is a constant, Eg signifies the band gap energy and n is ½ for TiO2. The UV-Vis spectra presented in Figure 3c,d were employed to estimate the Eg in eV value and light absorption edge in nm of the samples by extrapolating a line along the slope of each spectrum to its intercept with the x-axis. The Eg and light absorption edge values for all the samples are presented in Table 3. It can be observed that the slides with a coating layer have values between 3.36 eV (TiO2-CeO2 0.3%) and 3.40 eV (TiO2-CeO2 3.0%). However, for the films comprising two layers, the values were found to fall within the range of 3.35 eV (TiO2-CeO2 5.0%) to 3.43 eV (TiO2-CeO2 0.5%). In the case of the samples with the highest Ce content, an increase in the number of layers resulted in a reduction in the Eg value. This finding aligns with the observations reported by Sta et al. for pure TiO2 thin films [35]. The value of the Eg in the TiO2-CeO2 system can be modified by a number of factors, including the preparation method, the choice of precursors, the application of heat treatment, and so forth. These factors give rise to the formation of mesoporous and macroporous structures, with the former displaying a lower Eg. Consequently, the reduction of this parameter can be attributed to the formation of defective levels situated between the Eg levels of TiO2 and CeO2; these levels are responsible for the observed reduction in the Eg. The interstitial substitution of Ti4+ ions by Ce3+ and Ce4+ ions results in the generation of surface oxygen vacancies. Furthermore, the presence of these ions at the grain boundaries leads to the formation of new energy levels situated within the electronic structure of TiO2-CeO2 [18]. In addition, it is established that a lanthanide-induced red shift occurs when the unoccupied 4f orbitals of Ce3+ permit an electronic transition to the 2p orbitals of oxygen (valence band), which then transfer electrons to the 3d orbitals of titanium (conduction band). In light of the aforementioned evidence, it can be posited that the 4f orbitals of Ce are occupied, thereby forming new electronic states within the TiO2 band gap. This, consequently, reduces the charge transfer distance and the amount of photogenerated energy required to excite Ce-doped TiO2 with light associated with longer wavelengths [18,36,37].
Table 3. Results of the thickness and bandgap energy of the thin films of TiO2 and doped TiO2-CeO2 for the samples with one and two layers, respectively.
SampleThickness, t (nm)Band Gap Energy, Eg (eV) [λ (nm)] *
One layerTwo LayersOne LayerTwo Layers
TiO2159.48167.353.38 (366.86)3.40 (364.70)
TiO2-CeO2-0.3% 136.97134.393.36 (369.04)3.41 (363.63)
TiO2-CeO2-0.5% 154.01133.233.38 (366.86)3.43 (361.51)
TiO2-CeO2-1.0% 125.66125.423.39 (365.78)3.42 (362.57)
TiO2-CeO2-3.0% 147.48133.143.40 (364.71)3.37 (367.95)
TiO2-CeO2-5.0% 230.03182.183.37 (367.95)3.35 (370.15)
* Light absorption edge [38].

2.5. Profilometry and AFM
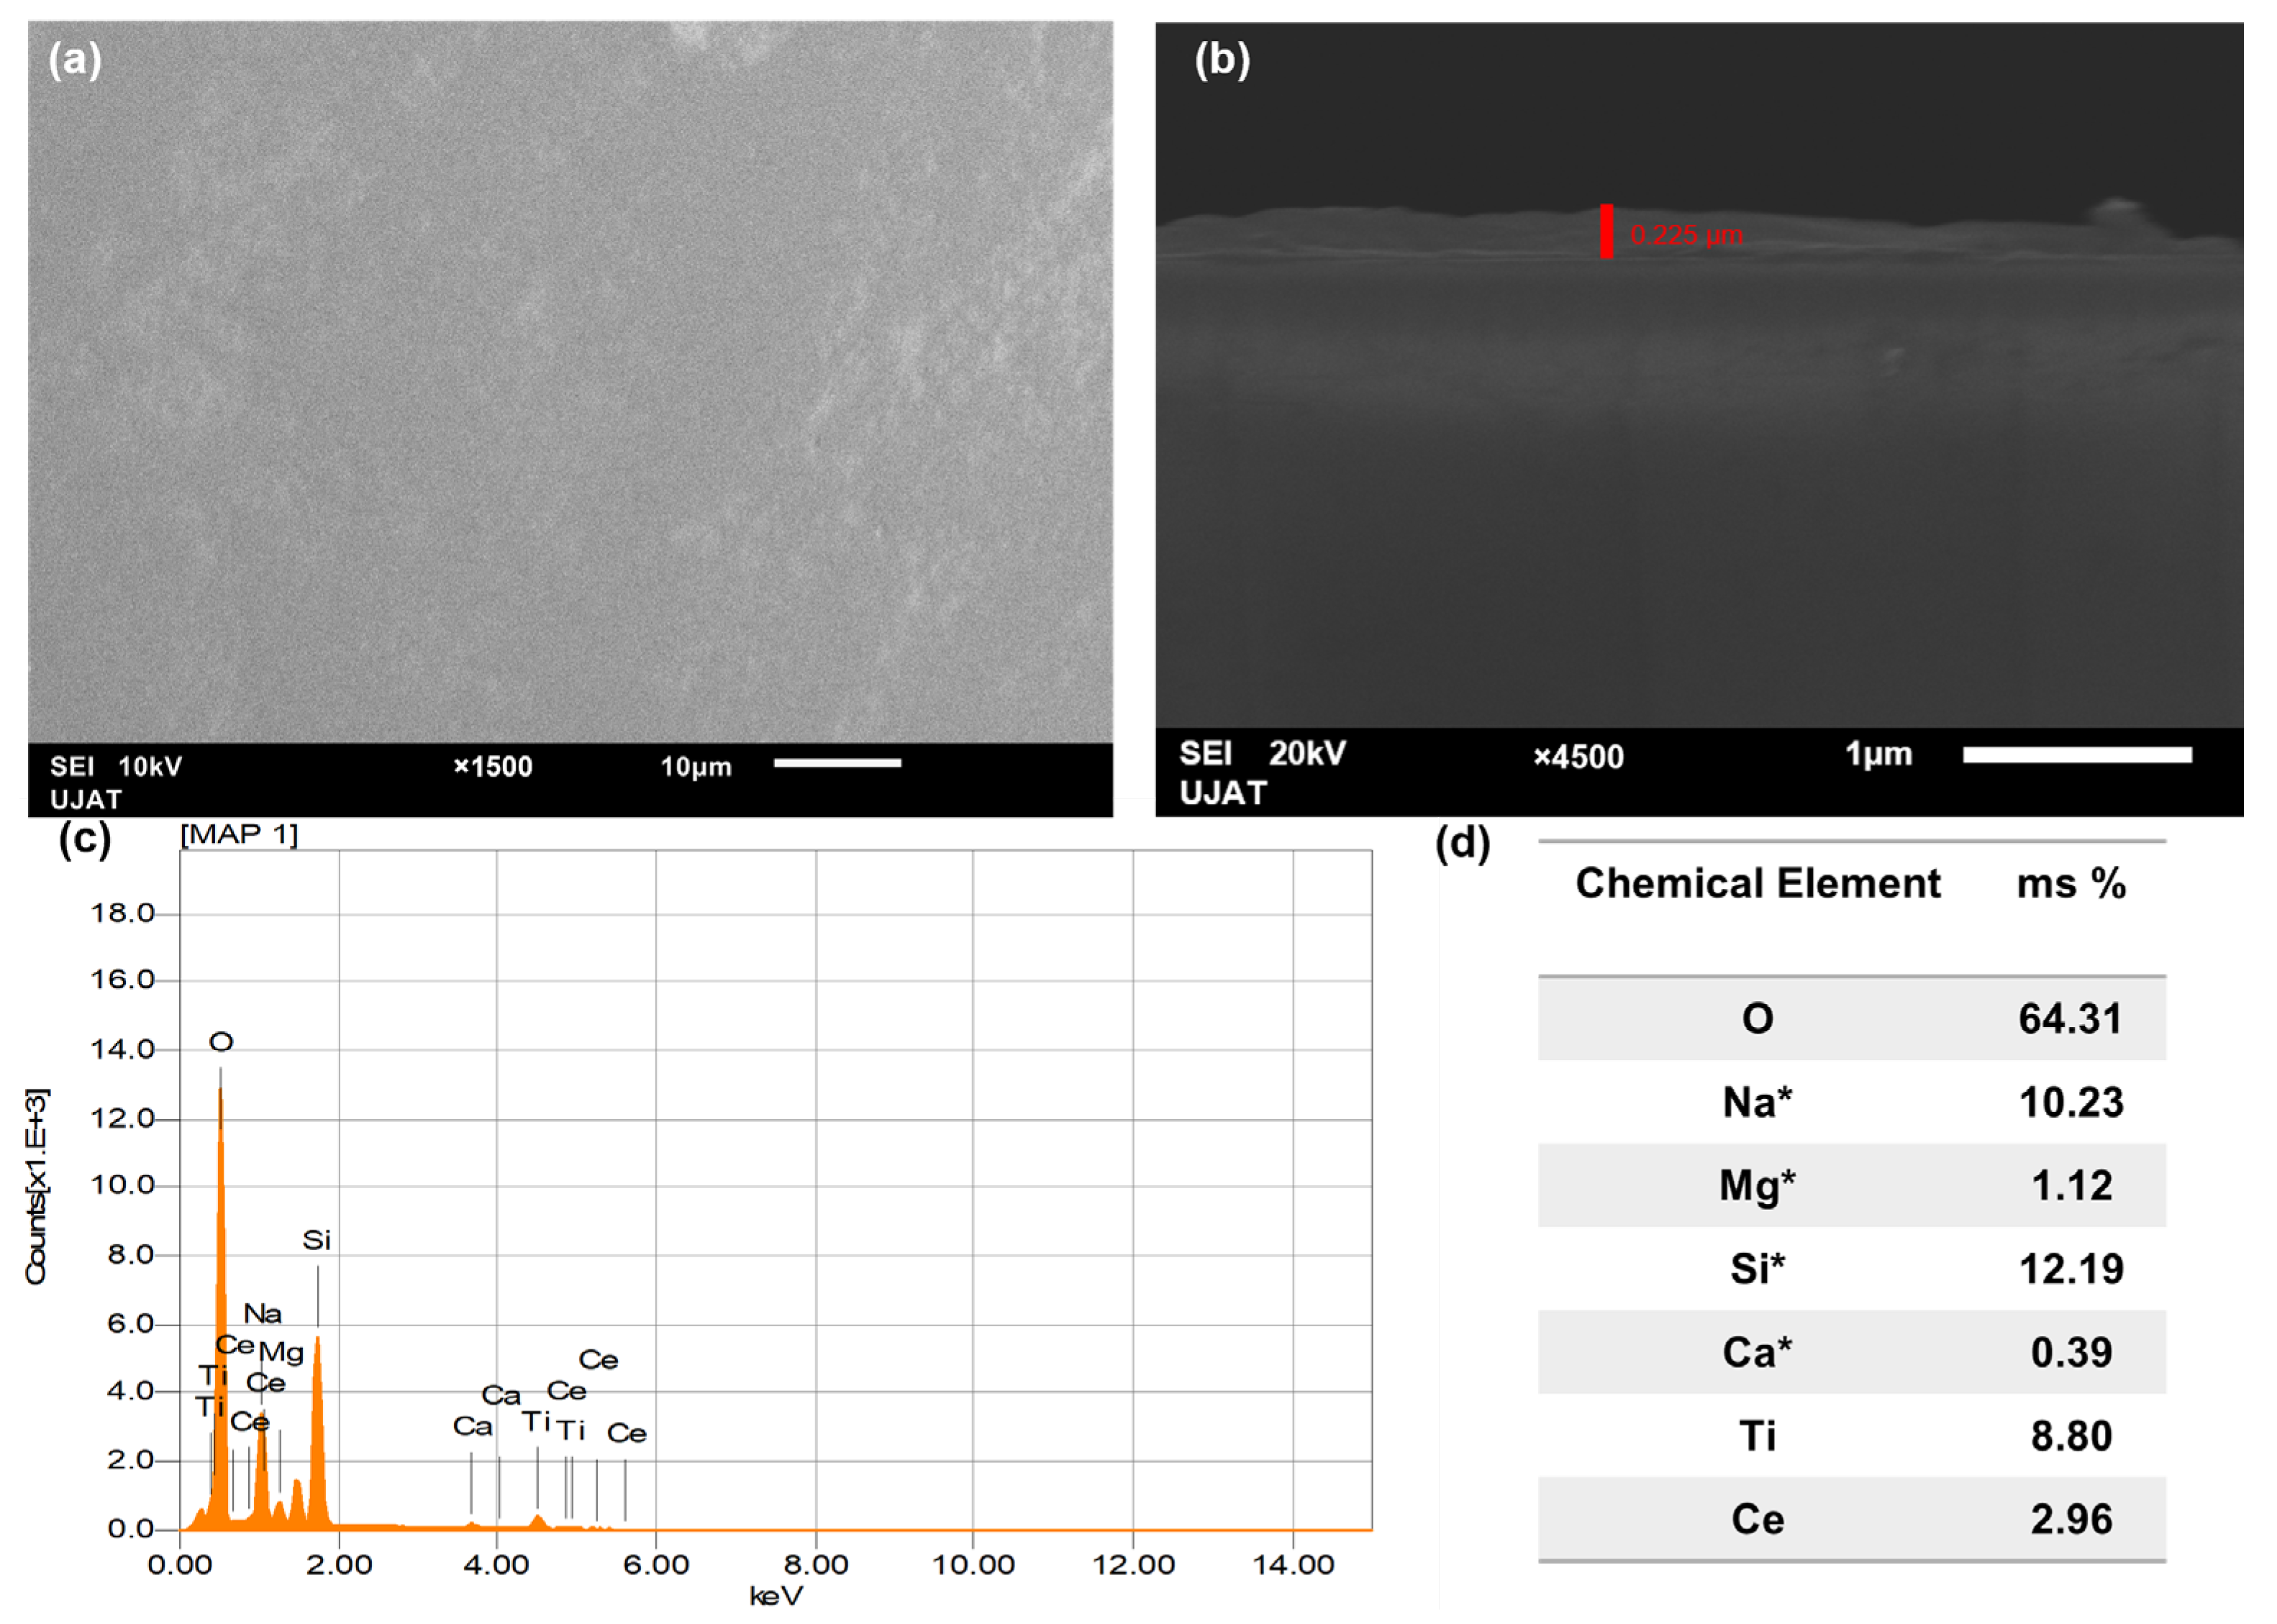
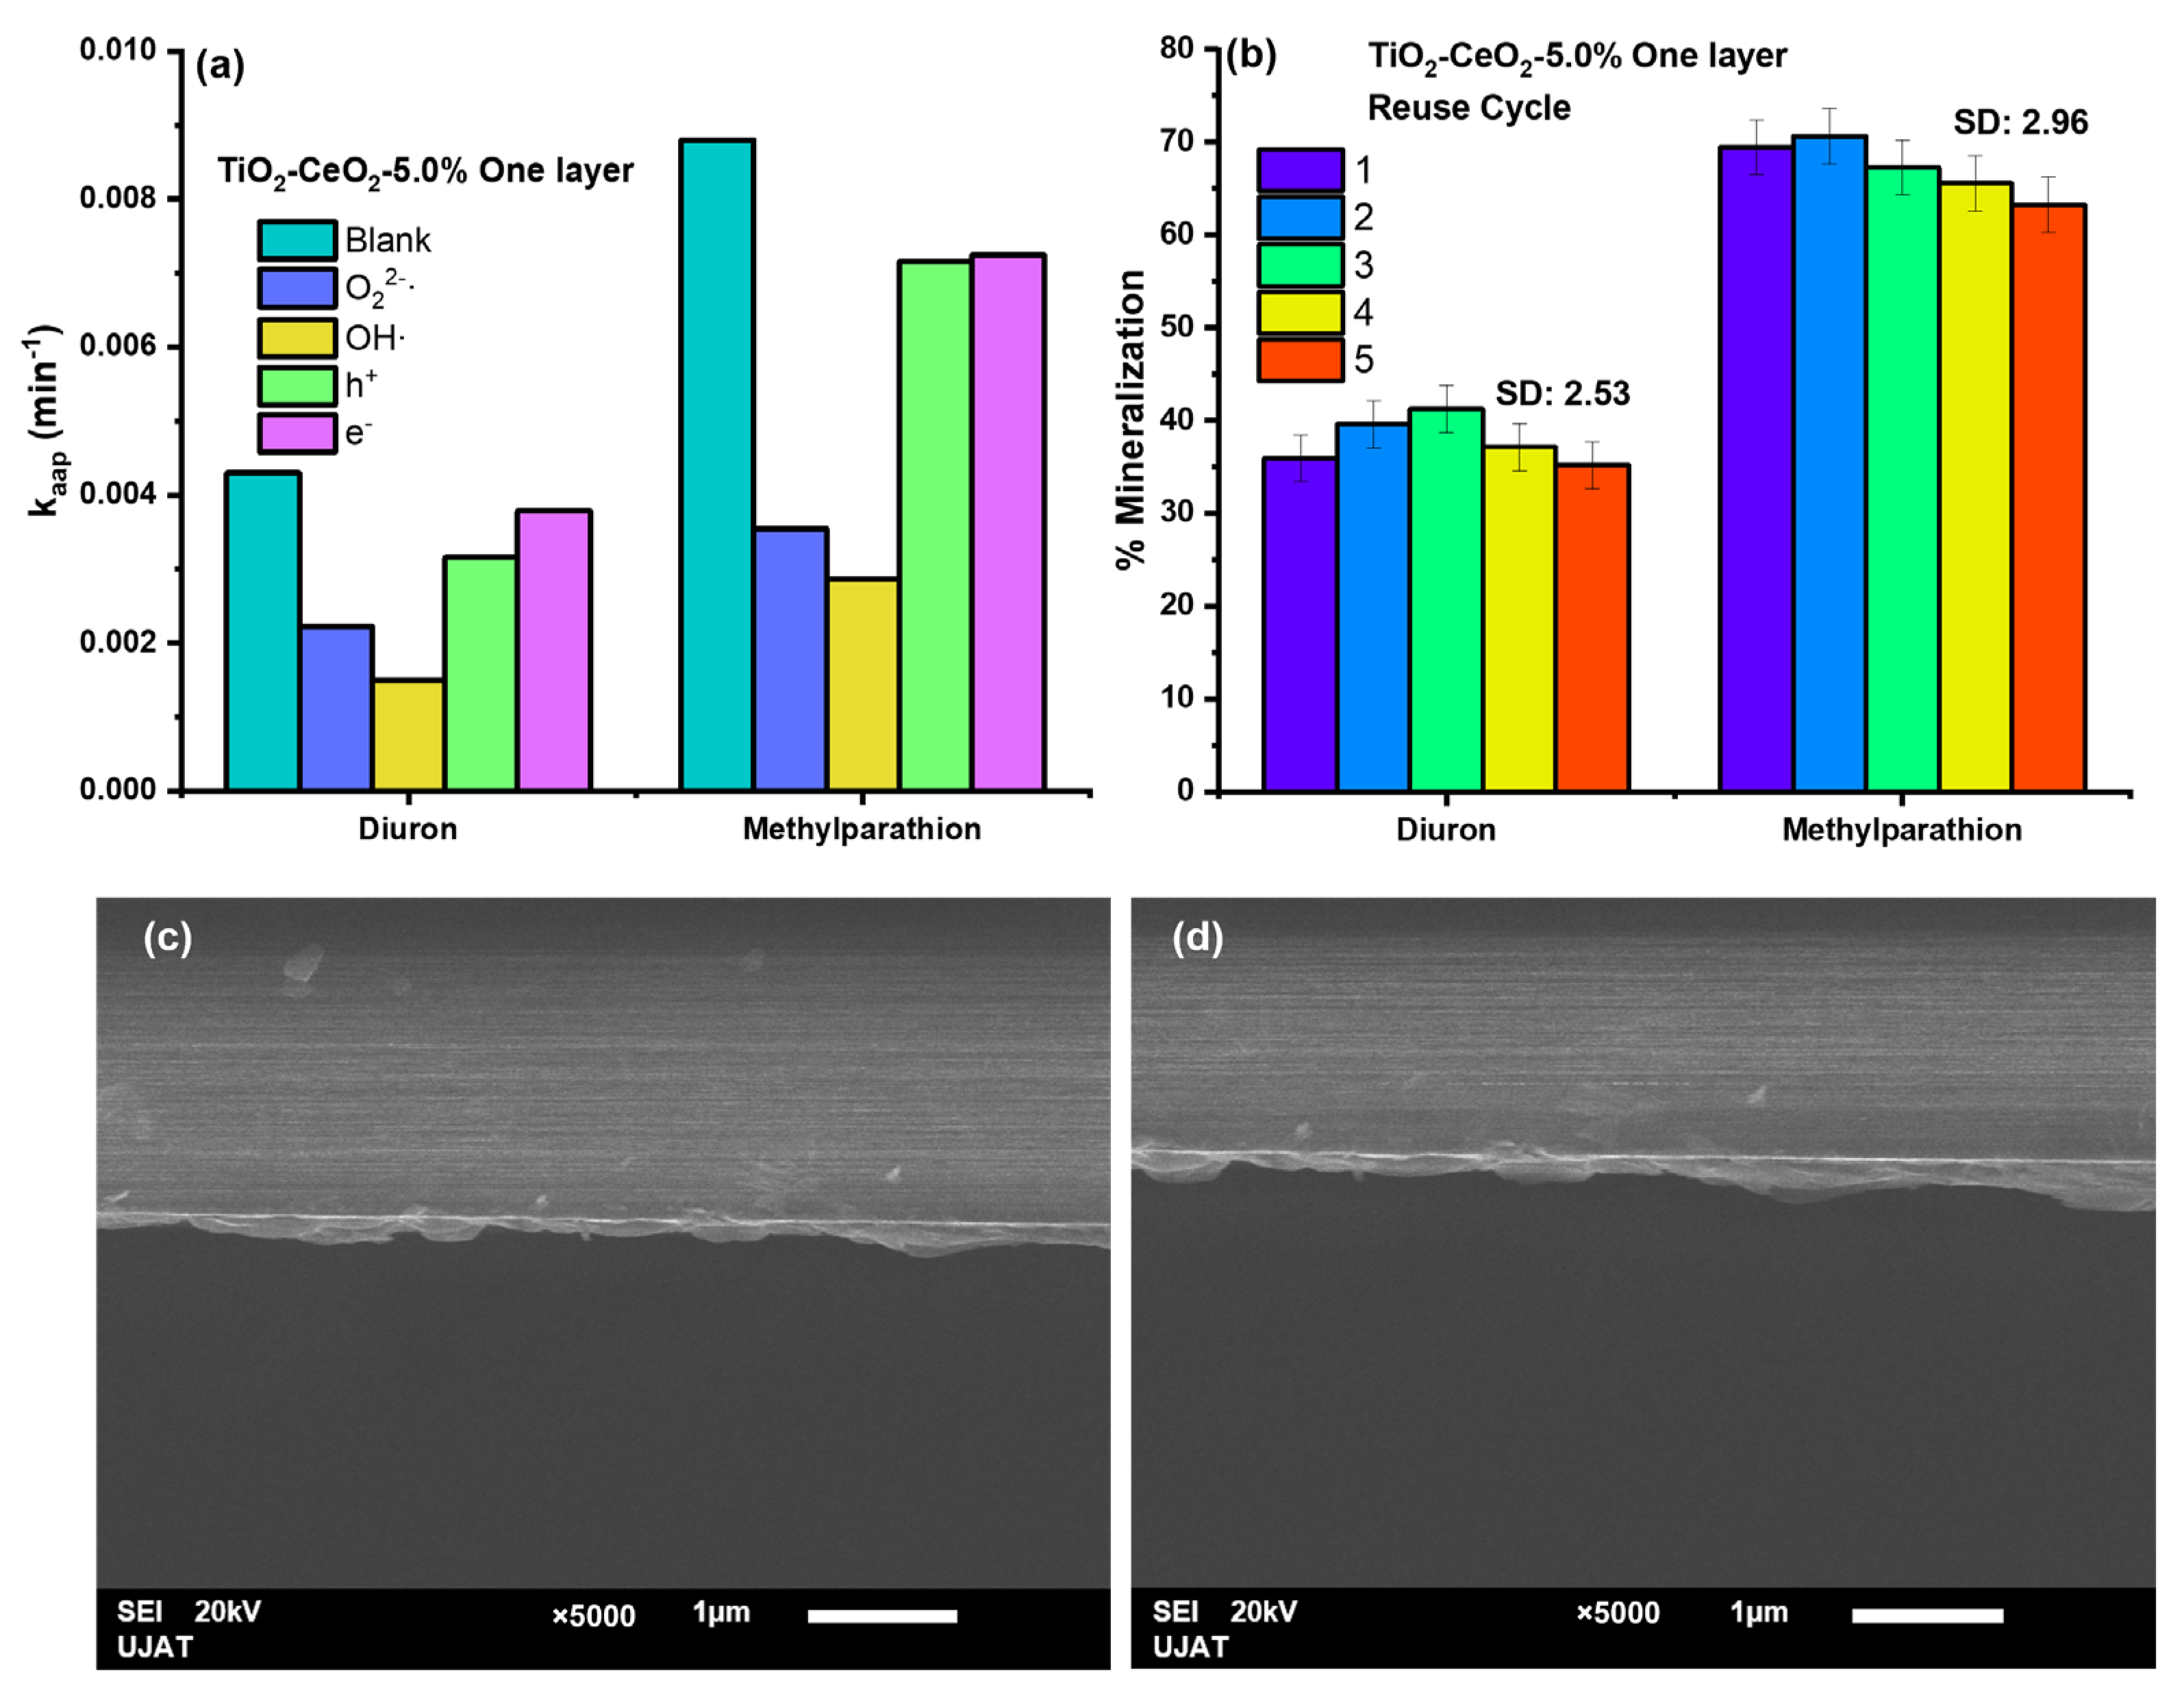
The thickness of the thin films with varying CeO2 concentrations and layer numbers was confirmed by atomic force microscopy (AFM) and profilometry, as illustrated in Figure 4. The AFM images demonstrate that at lower CeO2 content (a) (b), a rough surface is observed for both cases. It can be observed that the incorporation of the second layer increases the roughness, which is a characteristic of TiO2 thin films deposited on glass [35]. However, the heat treatment temperature of the samples also influenced this behavior, as evidenced by the substantial increase in roughness when the treatment temperature rises from 400 to 600 °C in the TiO2 thin films, due to the superficial growth of grains [39]. Furthermore, the presence of agglomerates and cracks is evident upon the addition of a second layer, with the thickness value approaching the optically calculated value, as illustrated in Table 3. Conversely, an increase in the Ce content in the samples resulted in a reduction in the roughness (c), which exhibited a slight increase upon deposition of a second layer (d). The incorporation of Ce as a dopant in TiO2 thin films has been observed to enhance the surface uniformity, leading to the formation of stable agglomerates devoid of any indications of crack formation. These larger agglomerates may potentially be associated with a partial hydrolysis phenomenon that occurs during the synthesis process [19], as evidenced by the notable increase in the thickness of the thin films. Nevertheless, the structural development of the TiO2-CeO2 system with homogeneous and uniform characteristics can be explained by a mechanism that is determined at the solid solubility limit of Ce in titania, which can be expressed as follows. Up to the solid solubility limit, there is a homogeneous distribution of point defects that improves nucleation, recrystallization, and grain growth. At the Ce limit, the semiconductor properties of the system are optimized [40]. The reduction in thickness and the increase in roughness with the presence of cracks were also increased by the addition of another layer for the samples with high Ce content. The thickness of the thin films for the samples with lower and higher Ce content as a dopant was also determined by profilometry (e), and these results show values very close to those calculated theoretically in Table 3, which is the same for the thickness values obtained by AFM.

2.6. SEM

Figure 5 depicts the surface morphology of the TiO2-CeO2-5.0 wt% thin film with one layer (a). It can be observed that the surface exhibits a smooth appearance with the presence of uniformly distributed agglomerates at a magnification of 1500×. The cross-section view of the same sample (b) reveals that the thickness of the thin film was approximately 0.225 um (225 nm), which is in close agreement with the calculated value presented in Table 3. The EDS spectrum (c) and elemental distribution (d) are also illustrated in this figure, where the presence of Ce can be observed. The existence of elements such as Na, Mg, Si and Ca is attributed to the elemental content of the borosilicate slide, as previously reported [41].

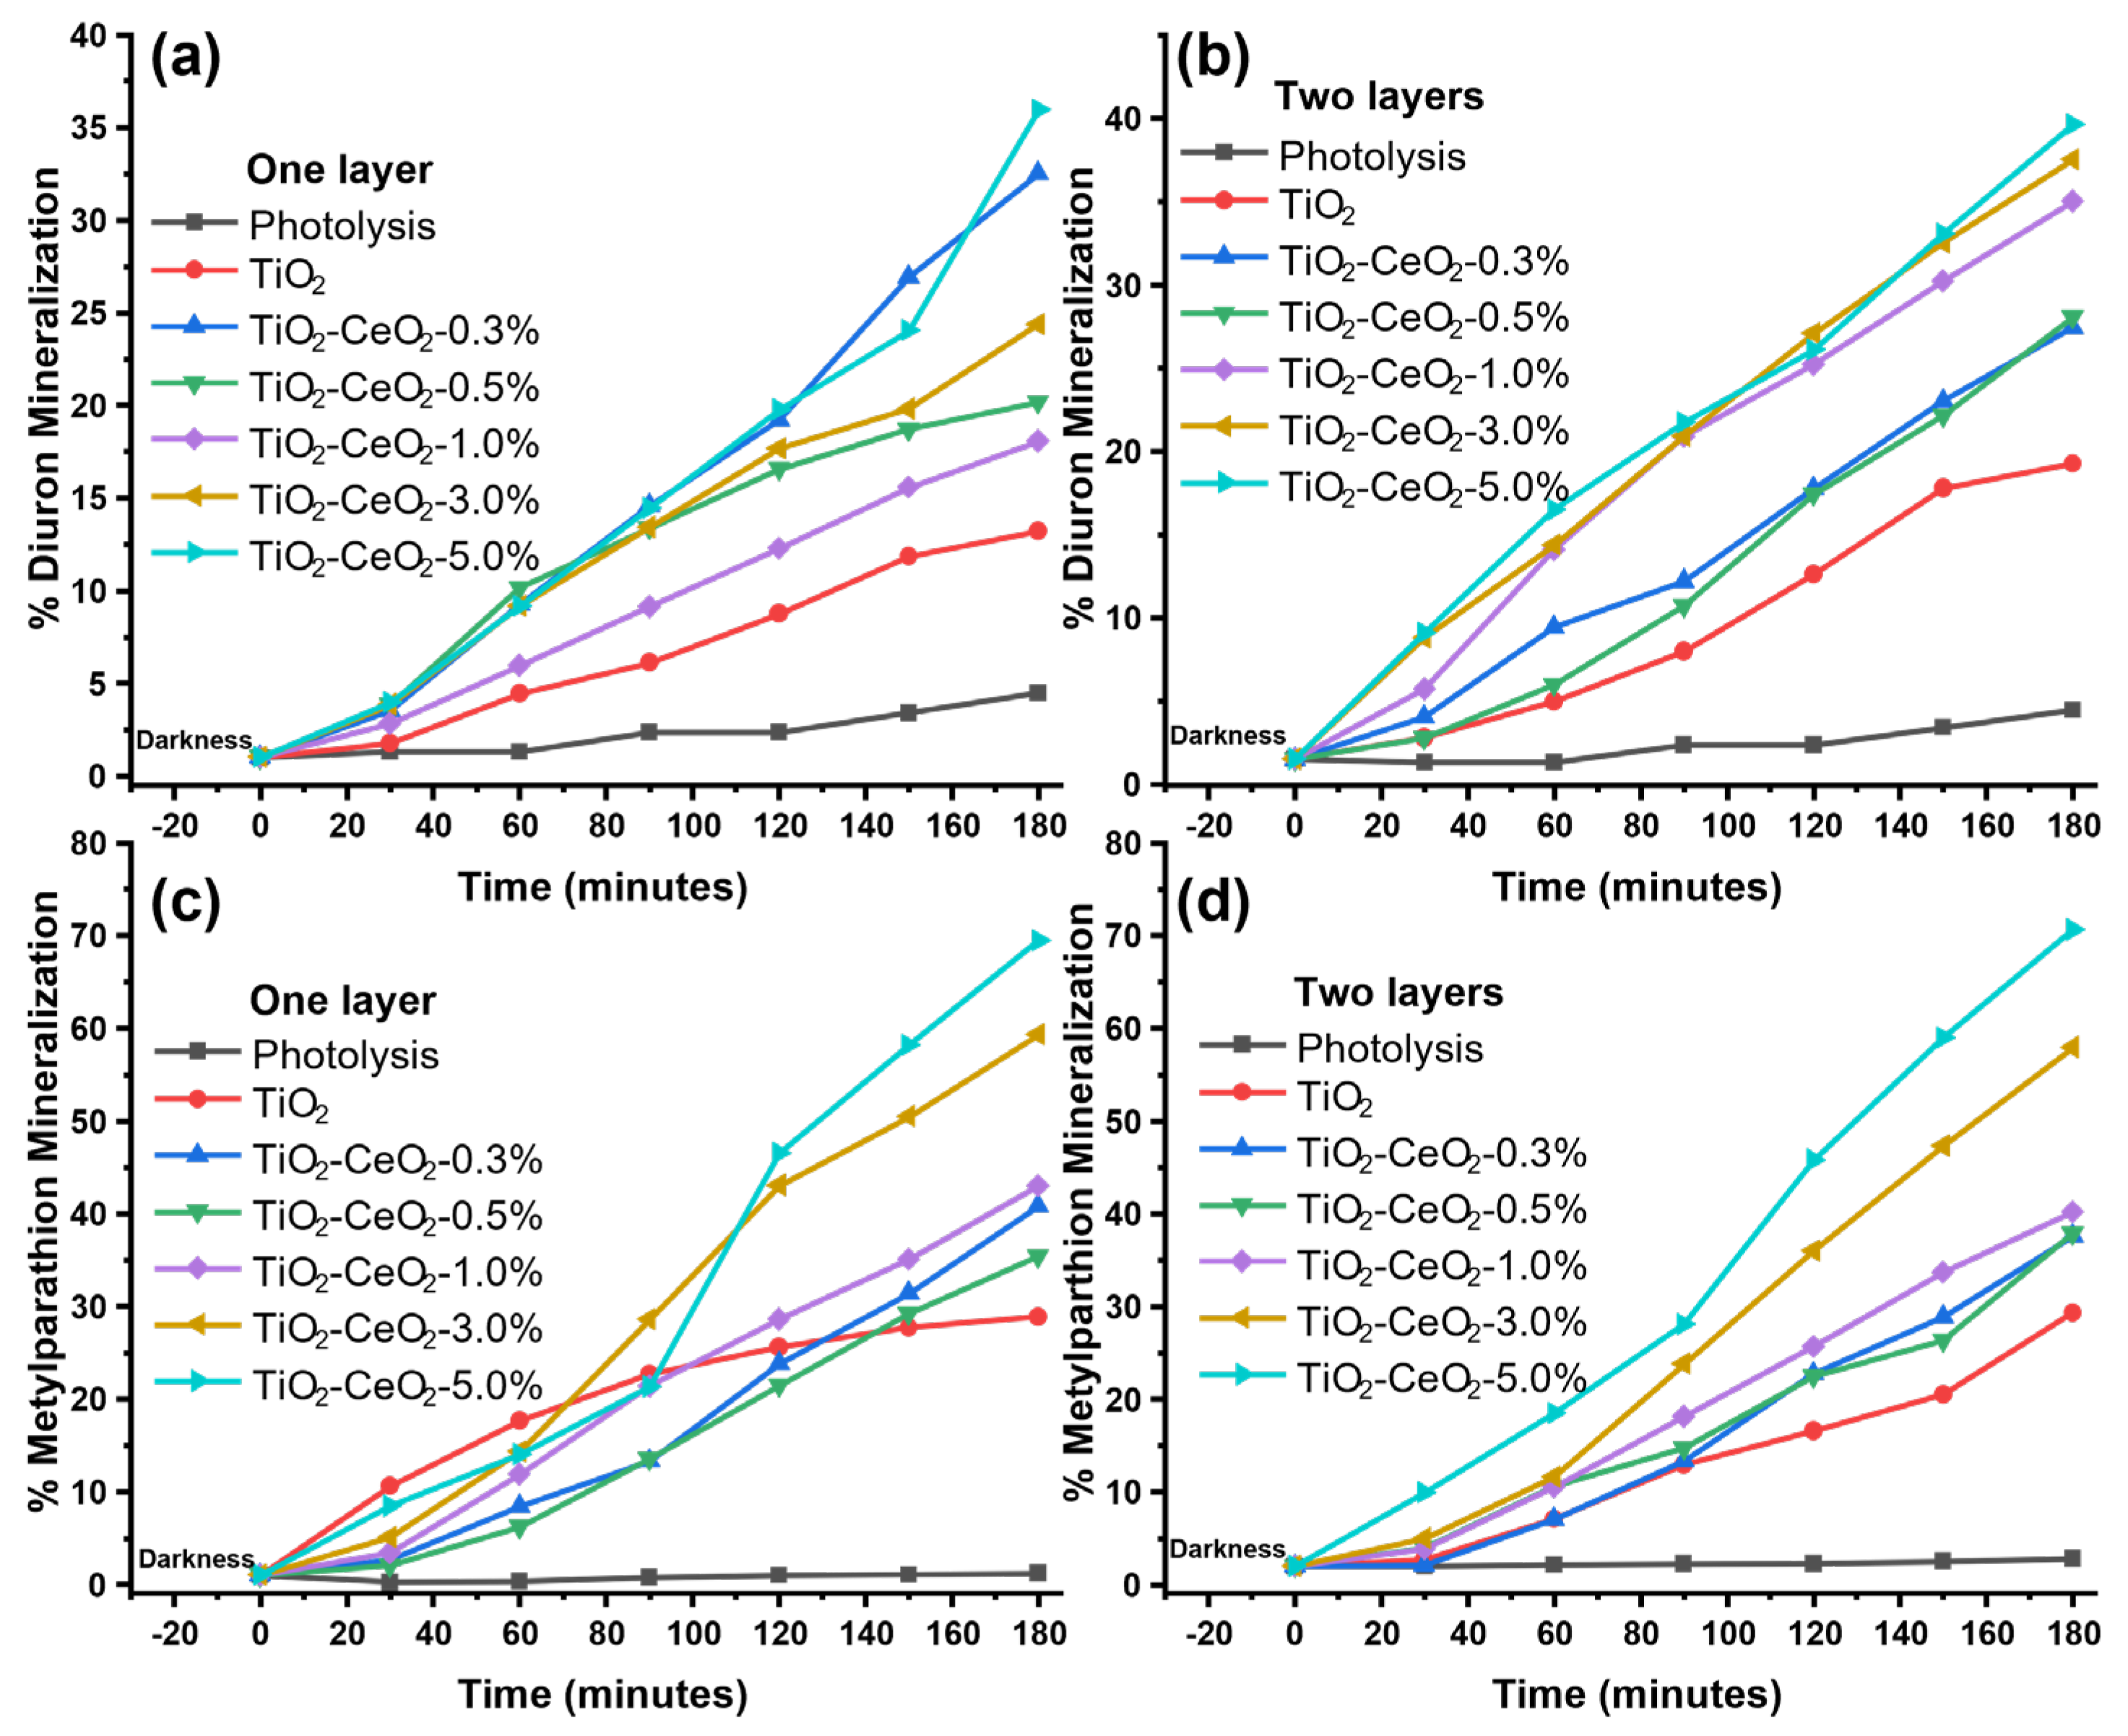
2.7. Photocatalytic Test

The outcomes of the photocatalytic assessment of the degradation and mineralization of diuron (D) and methyl parathion (MP) using single- and double-layer TiO2 and Ce-doped TiO2 thin films under solar illumination are presented in Table 4. The rate constants and half-life times for each reaction were employed as parameters to estimate the photodegradation using a pseudo-first-order reaction kinetics model. It can be observed that photolysis has no significant effect on the photodegradation and mineralization of both contaminants. Additionally, it was found that in the samples with one layer, the doped thin films exhibited enhanced activity compared to the thin films with pure TiO2, thereby underscoring the importance of Ce doping. Conversely, the opposite trend was observed for thin films with a lower amount of dopant when a second layer was added. This reduction in degradation can be attributed to the generation of intermediate species, which possibly have absorbances close to λ = 275 nm for MP and λ = 250 nm for D, generated by the incorporation of the second layer and the effect of irradiation with sunlight. This is in line with the findings of Ameen et al., who reported that TiO2-CeO2 nanocomposites under visible irradiation generate intermediates from 20 min of reaction in the photodegradation of bromophenol, which lead to the mineralization of the dye [42]. Then, there is a great possibility that in this study, the decrease in the photocatalytic activity of some thin films of titania doped with cerium is due to the effect of sunlight. However, these intermediates play a crucial role in the reaction mechanisms leading to mineralization, a parameter used to determine the photocatalytic oxidation of pesticides.
In terms of the degradation of diuron, the thin films doped with a single layer that exhibited the greatest activity were TiO2-CeO2-0.3% (0.0043 min−1) and TiO2-CeO2-5.0% (0.0044 min−1). The latter remained the most active when the second layer was added, resulting in an increased rate constant of up to 0.0050 min−1. In light of the aforementioned explanation, it can be posited that these thin films exhibit enhanced chemical stability, thereby preventing the generation of additional reaction intermediates. With regard to the photodegradation of methyl parathion, the thin films comprising one or two layers that exhibited the highest activity were also those doped with CeO2 at 5.0% (0.0087 min−1 and 0.0088 min−1), respectively. Similarly, the samples with a lower Ce content exhibited reduced activity. In this instance, the thin films doped with Ce at 5.0% displayed a greater affinity for degrading methyl parathion than diuron, irrespective of the number of layers.
Table 4 also presents the data regarding the percentages of diuron and methyl parathion mineralization of all the thin films evaluated in the photocatalytic process under sunlight. Figure 6a,b depict the graphs that delineate the photocatalytic behavior of theTiO2 and Ce-doped TiO2 thin films with one and two layers in the diuron mineralization process. The findings illustrate that photolysis and pure TiO2 thin films with one and two layers display a reduced capacity to mineralize both contaminants in comparison to the Ce-doped samples. Moreover, it was shown that the photocatalytic activity of pure titania thin films under sunlight is enhanced by increasing the thickness with respect to both contaminants. This is corroborated by reports indicating that the activity of TiO2 thin films on slides under visible light is optimal when the thickness is less than 200 nm [43], which aligns with the values reported in Table 3 (159.48 nm and 167.35 nm).
The TiO2-CeO2-5.0% thin films with one and two layers demonstrated the highest mineralization percentage for both diuron and methyl parathion. It was observed that the mineralization of diuron in the films with the lowest Ce content, with a single coating, was found to be very similar to that of the films with the highest Ce content. However, the addition of a second layer resulted in a reduction of the mineralization. The mineralization is reduced, which is directly correlated with the decrease in the thickness of the thin film (136.97 nm to 134.39 nm). This is attributable to the presence of Ce, which serves to compact the thickness when a second layer is added. This is due to the fact that the addition of cerium reduces the crystal size, as observed in Table 1. This phenomenon does not occur with pure TiO2 films. While the TiO2-CeO2-5.0% thin films with two layers exhibited the most favorable mineralization percentage for diuron, two samples demonstrated comparable values (TiO2-CeO2-3.0% with two layers and TiO2-CeO2-5.0% with one layer). The maximum difference observed was 2.7%, which prompted us to consider the possibility that the TiO2-CeO2-5.0% sample with one layer has a better possibility of being applied in a larger-scale reaction system for the mineralization of diuron. This approach would result in lower expense with respect to its photocatalytic efficiency. Figure 6c,d also demonstrate the mineralization of methyl parathion under sunlight. It can be observed that an increase in the amount of Ce in the thin films correlates with an enhancement of photocatalytic activity. This finding aligns with previous research on the utilization of Ce coatings on TiO2 thin films for the photodegradation of dyes [42]. A comparable phenomenon is observed when the TiO2-CeO2 and TiO2-CeO2-ZrO2 systems are evaluated under visible irradiation for the elimination of Rhb [44]. However, this trend is subject to an upper limit with regard to the optimal Ce content, given that exceeding this amount results in a decline in the photocatalytic activity. It has been estimated that the optimal amount of Ce for thin films of TiO2 is 0.05 molar, used either under UV light or visible light, for the degradation of the MB dye [25]. Conversely, the TiO2-CeO2 powders indicate that the optimal Ce content is present at 5% wt when evaluated in the UV light degradation of 2,4-D. This is closely related to the crystal size, because as the optimal Ce content is exceeded, the crystal size increases. It is known that the photocatalytic activity increases inversely proportional to the average particle size [22]. Accordingly, the present study has revealed that the optimal Ce content is also manifested at 5% by weight, which is consistent with the range of 2–10 wt% established by Kumari et al. in their compilation [18]. Given these results, it may be proposed to perform future studies under the same conditions describing TiO2-CeO2 thin films with CeO2 concentrations above 5.0 wt.% to establish a real optimum CeO2 concentration in this type of system and to determine up to which amount of CeO2 the reaction yield decreases.
The photocatalytic activity of Ce-doped TiO2 thin films under solar irradiation can be explained by the presence of the Ce4+ and Ce3+ states of CeO2, since the 4f orbitals of these species are able to absorb visible light (400–500 nm) by means of the charge transfer transition that occurs between the 4f electrons and the empty orbitals of Ti4+ [25]. Then, during the photocatalytic process, the photogenerated electrons are immediately transferred from the valence band to the conduction band of TiO2 and CeO2 (avoiding their recombination with holes), which migrate to the surface and are transferred to the absorbed oxygen molecules, which can combine to form superoxide radicals [45]. In this sense, the presence of Ce can also increase the catalytic activity of TiO2 due to its ability to store oxygen on the surface and by reducing the particle size of the material, which has been previously studied by the working group [46].
The main photogenerated species involved in the photocatalytic oxidation mechanism of diuron and methyl parathion using CeO2-doped TiO2 thin films were developed through the implementation of photocatalytic evaluation tests conducted in the presence of scavengers, including isopropanol (for OH·), benzoquinone (for O22−·), EDTA (for h+) and potassium dichromate (for e) [27,47], as shown in Figure 7a. The rate constants exhibited a notable decline when isopropanol was used, followed by benzoquinone, indicating that hydroxyl radicals and photogenerated superoxide radicals play a pivotal role in the oxidation (mineralization) of diuron and methyl parathion. Because of this, a schematic representation describing the reaction mechanism based on the formation of hydroxyl radicals (OH·) and superoxides (O22−·) is proposed in Figure 8, where the oxygen molecules (O2) adsorbed on the surface of the titania react with the electrons (e) to form O22−·, which inhibits the recombination of electron–hole pairs and interacts with the water (H2O) to form hydrogen peroxide (H2O2), which also immediately reacts with e to generate OH·. At the same time, the H2O adsorbed on the surface of the material reacts with the photogenerated holes (h+) to produce OH· [18]. Therefore, the production of hydroxyl radicals and superoxides is of great importance as they are responsible for mineralizing the diuron and methyl parathion present as aqueous pollutants. Section (b) of the same figure describes the five reuse cycles applied to the same sample, demonstrating the stability of the material after several consecutive reactions using the two pollutant molecules. It can be observed that the value for diuron mineralization varies within a narrow range of 35–41%, with a standard deviation (SD) of ±2.53, while for methyl parathion it varies between 63–70% (SD: ±2.96). This demonstrates that there are no significant alterations in the photocatalytic oxidation of the pollutants following reuse. With regard to the stability of the thin films in sections (c) and (d), SEM micrographs of the cross-section of the sample have been exanimated. It has been observed that there are no structural changes before and after the reaction, which confirms the stability of the thin films in different reaction runs. The sample TiO2-CeO2-5.0% with one layer shows great potential to be applied as a fixed bed in a large-scale continuous photocatalytic reaction system, which can be illuminated during the day by sunlight and at night by artificial visible light (LED light) to maintain the reaction for long times until the mineralization of the contaminants.

3. Materials and Methods

3.1. Thin Films Preparations

Borosilicate slides with dimensions of 50 × 20 × 1 mm were employed as substrates for the deposition of thin films. The slides were cleaned using a 1:1 water–acetone mixture in an ultrasonic bath for 10 min, after which they were dried in a vacuum chamber at 50 °C in order to remove any residual impurities. The precursors employed in the synthesis of the thin films via the sol-gel method were procured through the following means. For the synthesis of TiO2, a solution of titanium butoxide (Sigma-Aldrich 97%, Ciudad de México, México) was prepared with n-butanol (Sigma-Aldrich 99% Ciudad de México, México) in a 1:4 ratio, with the reaction mixture kept under constant stirring for 30 min in a closed container with an inert atmosphere maintaining a pH of 5.25. The procedure for TiO2-CeO2 was modified slightly. Previously, a specific quantity of cerium nitrate hexahydrate (Sigma-Aldrich 99.99%, Ciudad de México, México) was dissolved in butanol, with the quantity varying according to the established weight percentage (0.3, 0.5, 1.0, 3.0 and 5.0%, respectively); here, the pH increased to 5.43 when the largest amount of Ce precursor was added. The deposition of the films on the substrates was conducted using a spin-coating apparatus (Laurell Technologies Corporation, Laurell WS-650MZ-23NPPB, PA, USA). Subsequently, the substrate was coated with the precursor solution at 500 rpm in a vacuum, and the speed was then increased to 1500 rpm. Subsequently, the films were subjected to a drying process at 120 °C for 15 min and a calcining procedure at 500 °C for 4 h, with a heating rate of 2 °C/min. This resulted in the formation of a highly transparent and fixed layer on the substrate. The deposition of successive layers without fractures and high transparency was only possible with the application of two layers. The second layer was deposited by repeating the aforementioned methodology after the first layer was dried at 120 °C. In total, six different types of thin films were produced with 10 replicates. Subsequently, the various precursors of the thin films, including the residual cerium nitrate dissolved in butanol, were subjected to the same heat treatment until the formation of powders was achieved. These powders were then analyzed using both DRX and XPS.

3.2. Sample Characterization

The obtained powders were characterized by XRD in order to identify the crystalline phases, as well as to estimate the average crystal size and deformation, using the Debye-Scherrer equation in the 101 plane of the anatase phase of TiO2 [21]. The XRD spectra were obtained at room temperature using a Bruker D8 Advance powder diffractometer, with Cu-Kα radiation (λ = 0.154 nm) and a monochromatic graphite secondary beam in a range of 20 to 70 on the 2θ scale with a step of 0.05°, with a measurement time of 0.5 s per point. Furthermore, the powders were subjected to XPS analysis, which enabled the acquisition of data pertaining to the chemical and electronic environment at the surface level. This was achieved through the utilization of a VG Escalab II spectrometer, equipped with a Kα X-ray source (1486.6 eV) at 225 W (15 kV, 15 mA) and a hemispherical analyzer for electron detection. The XPS spectra were processed using Casa software, version 2.3.14, with carbon as the reference element at 285.0 eV in order to align the signals of the analyzed species. The thickness of the thin films was determined by measuring the optical transmittance spectra of each sample using the Manifacier equation [35] with a UV-Vis spectrophotometer (Agilent, Varian model Cary 300, VIC, Australia) in a wavelength range of 200 to 800 nm. However, the determination of the band gap energy was conducted using the same spectrophotometer but with an integration sphere to obtain diffuse reflectance spectra. These were then processed using the Tauc methodology [12]. The thickness of the layers and the roughness were confirmed only for the samples with higher photocatalytic activity using a surface profilometer (Bruker, Dektak-XT, Billerica, MA, USA) and an atomic force microscope (Ambios Technology Inc., Q-scope 250/400 Nomad, Santa Cruz, CA, USA). To analyze the morphology, thickness, microstructure and elemental analysis of the best thin film, a scanning electron microscope (JEOL, model JSM-6010LA, Tokyo, Japan) coupled to an energy-dispersive X-ray spectroscopy detector was used.

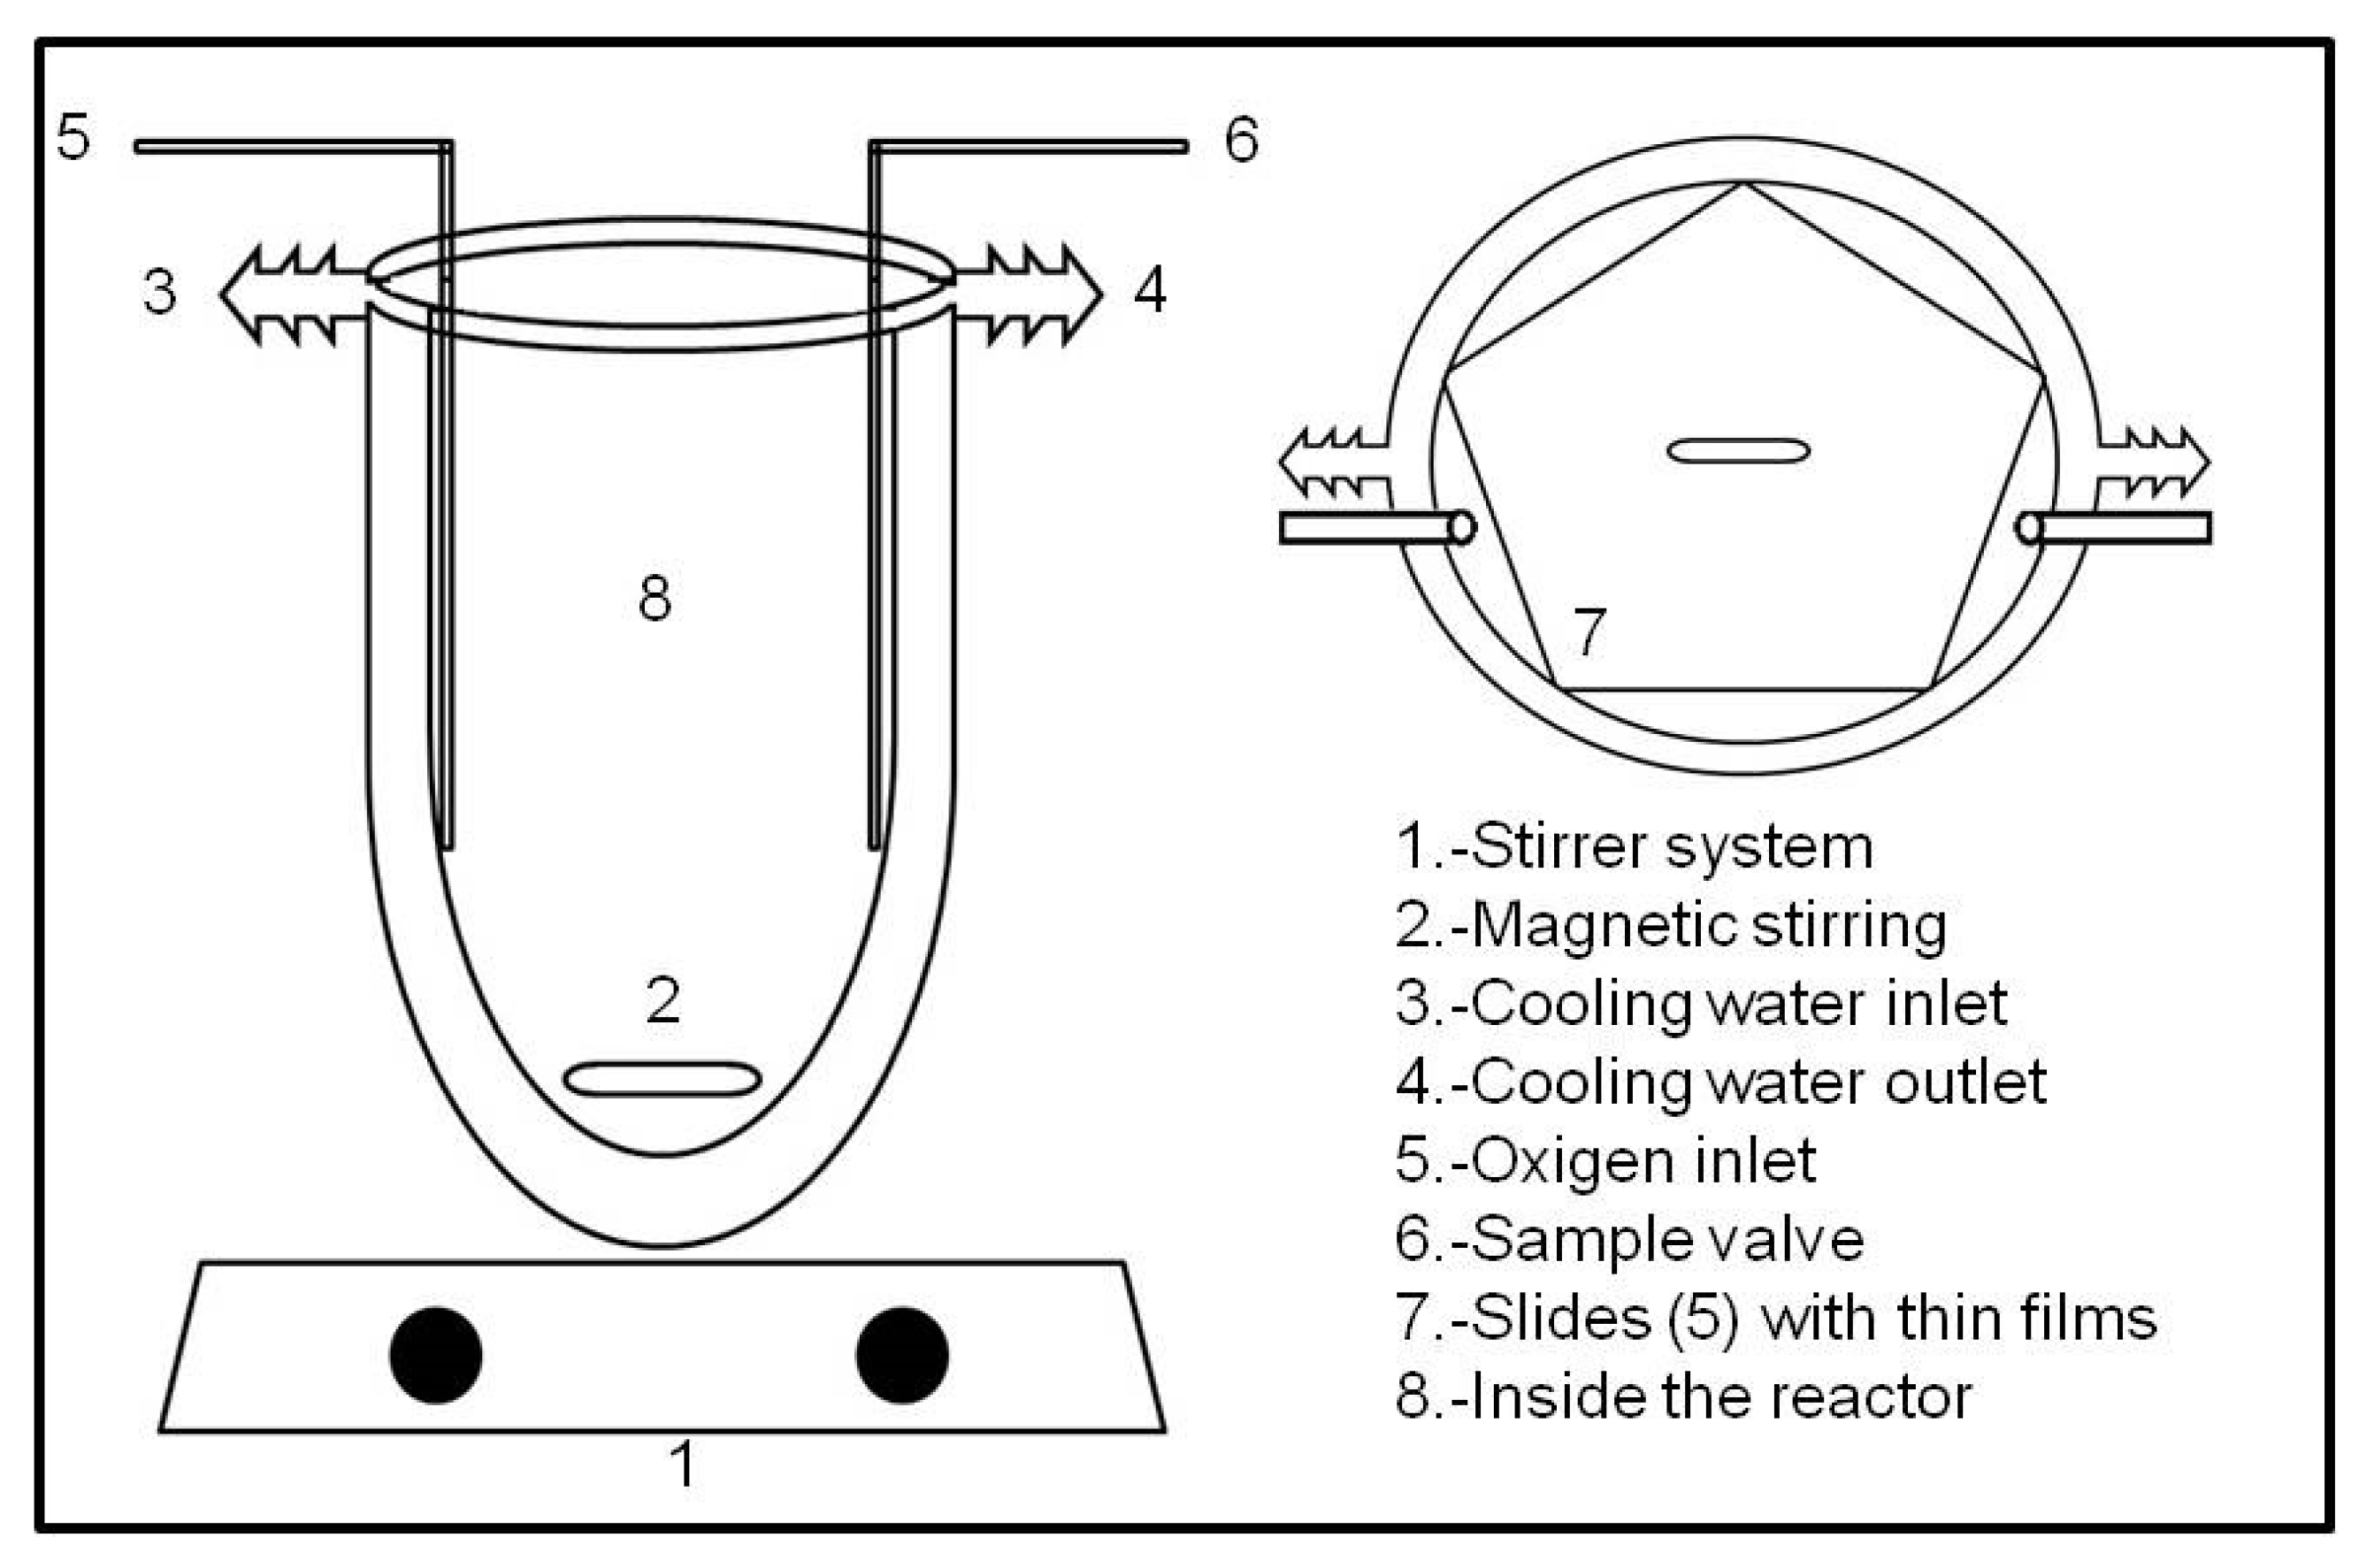
3.3. Photocatalytic Properties

Figure 9 depicts the reactor utilized for the assessment of the photocatalytic activity of the TiO2 and TiO2-CeO2 thin films on slides. The reactor was situated within a solar simulator (Atlas Suntest CPS+ with a 15 kW Xe lamp and a specialized quartz filter that restricts light transmission) for the execution of the photocatalytic oxidation reactions of methyl parathion (MP = 25 mg/L, pH = 6.63) and diuron (D = 20 mg/L, pH = 6.87). Here, it was maintained at a constant temperature of 23 °C due to the constant recirculation of water through the inlets and outlets that the reactor has provided to maintain the reaction temperature constant. Prior to commencing the photocatalytic reactions for each pollutant, the system was stirred in the absence of light for a period of 30 min to achieve equilibrium between adsorption and desorption. The total reaction time was 180 min, with samples collected at 30 min intervals using filters with a pore size of 0.2 µm (Millex®-GN, 25 mm, Millipore Nylon, Cork, Ireland). The photodegradation was monitored by UV-Vis spectroscopy, with the maximum absorbance peak of each pollutant (MP, λ = 275 nm; D, λ = 250 nm) being used as a reference point. The mineralization of MP and D was determined utilizing a total organic carbon analyzer (Shimadzu, UV-1700, Kyoto, Japan) with an experimental error of ±0.05 mg/L. The thin films exhibiting the most effective photocatalytic performance for MP and D were subjected to five consecutive evaluations. At the conclusion of each reaction, the coated slides were rinsed with deionized water and subjected to a 24 h drying process at 80 °C to facilitate reuse. Reactions with scavengers, including benzoquinone (O22−·), isopropanol (OH·), EDTA (h+) and potassium dichromate (e), were conducted at a concentration of 10 mg/L to ascertain the primary photogenerated species engaged in the photocatalytic oxidation mechanism. Furthermore, the stability of the thin films was evaluated through the analysis of scanning electron microscopy (SEM) micrographs of the cross-sectional sample, both prior to and following the reaction.

4. Conclusions

Borosilicate slides were coated with Ce-doped TiO2 thin films via the sol-gel spin-coating method. An increase in the amount of Ce resulted in a reduction in the crystal size and an enhancement of the strain index, which indicates an effective dispersion and interaction between TiO2 and CeO2; this was confirmed by XPS, which revealed the presence of Ti4+, Ti3+, Ce4+ and Ce3+ ions produced by the Ti–O–Ce bond. The Ce3+/4+ ions facilitate the generation of oxygen vacancies, which in turn give rise to the formation of new energy levels in the TiO2-CeO2 electronic structure. The observed increase in sunlight absorption can be attributed to the presence of unoccupied 4f orbitals, which reduce the charge transfer distance and consequently decrease the photon energy, promoting an electron transfer from the valence band to the conduction band. On the other hand, the addition of a second layer increases the roughness but decreases with the higher CeO2 content, causing greater thickness. The addition of CeO2 enhances the photocatalytic activity of the material under sunlight due to the improvement in visible light absorption, oxygen storage and reduction in crystal size. TiO2-CeO2 thin films at 5.0 wt% with one layer exhibited the most favorable photocatalytic behavior under sunlight, displaying a higher affinity for oxidizing methyl parathion through photogenerated hydroxyl radicals and superoxides. In addition, future studies can be proposed to evaluate these thin films with an amount of CeO2 higher than 5.0% to establish an optimal concentration. These coatings have the potential for large-scale application in the treatment of contaminated water, as they demonstrate stability and reactivity even after continuous use.

Author Contributions

Conceptualization, J.C.A.P. and J.G.T.T.; formal analysis, T.A.T.P., E.S.G., A.C.G., A.C.U., A.A.S.P., I.R.V. and J.C.A.P.; investigation, T.A.T.P. and E.S.G.; methodology, J.C.A.P., J.G.T.T. and G.A.d.A.M.; project administration, J.C.A.P. and J.G.T.T.; resources, J.C.A.P., J.G.T.T., G.A.d.A.M., A.C.G., A.C.U. and A.A.S.P.; software, A.A.S.P. and I.R.V.; supervision, J.C.A.P. and J.G.T.T.; validation, T.A.T.P., E.S.G., A.C.G., A.C.U., A.A.S.P., I.R.V. and J.C.A.P.; visualization, T.A.T.P., E.S.G., J.C.A.P. and J.G.T.T.; writing—original draft, J.C.A.P. and J.G.T.T.; writing—review and editing, J.C.A.P., J.G.T.T. and G.A.d.A.M. All authors have read and agreed to the published version of the manuscript.

Funding

This research received no external funding.

Data Availability Statement

Data are contained within the article.

Acknowledgments

The research team would like to thank the National Council of Humanities, Sciences and Technologies (CONAHCYT) for the scholarship awarded to master’s students Tania Arelly Tinoco Perez and Evaristo Salaya Geronimo. We also appreciate the facilities provided by Adrian Carbajal Dominguez (may he rest in peace, 2020) for the use of the spin-coating equipment. In the same way, we recognize the support and trust for the analyses by profilometry and AFM provided by Armando Dominguez Ortiz (rest in peace, 2022).

Conflicts of Interest

The authors declare no conflicts of interest.

References

  1. Carp, O.; Huisman, C.L.; Reller, A. Photoinduced Reactivity of Titanium Dioxide. Prog. Solid State Chem. 2004, 32, 33–177. [Google Scholar] [CrossRef]
  2. Fujishima, A.; Zhang, X. Titanium Dioxide Photocatalysis: Present Situation and Future Approaches. Comptes Rendus Chim. 2006, 9, 750–760. [Google Scholar] [CrossRef]
  3. Banerjee, S.; Pillai, S.C.; Falaras, P.; O’shea, K.E.; Byrne, J.A.; Dionysiou, D.D. New Insights into the Mechanism of Visible Light Photocatalysis. J. Phys. Chem. Lett. 2014, 5, 2543–2554. [Google Scholar] [CrossRef] [PubMed]
  4. Boffetta, P.; Soutar, A.; Cherrie, J.W.; Granath, F.; Andersen, A.; Anttila, A.; Blettner, M.; Gaborieau, V.; Klug, S.J.; Langard, S.; et al. Mortality among Workers Employed in the Titanium Dioxide Production Industry in Europe. Cancer Causes Control 2004, 15, 697–706. [Google Scholar] [CrossRef]
  5. Karthikeyan Thirunavukkarasu, G.; Bacova, J.; Monfort, O.; Dworniczek, E.; Paluch, E.; Bilal Hanif, M.; Rauf, S.; Motlochova, M.; Capek, J.; Hensel, K.; et al. Critical Comparison of Aerogel TiO2 and P25 Nanopowders: Cytotoxic Properties, Photocatalytic Activity and Photoinduced Antimicrobial/Antibiofilm Performance. Appl. Surf. Sci. 2022, 579, 152145. [Google Scholar] [CrossRef]
  6. Dell’Edera, M.; Lo Porto, C.; De Pasquale, I.; Petronella, F.; Curri, M.L.; Agostiano, A.; Comparelli, R. Photocatalytic TiO2-Based Coatings for Environmental Applications. Catalisys Today 2021, 380, 62–83. [Google Scholar] [CrossRef]
  7. Tian, X.; Cui, X.; Lai, T.; Ren, J.; Yang, Z.; Xiao, M.; Wang, B.; Xiao, X.; Wang, Y. Gas Sensors Based on TiO2 Nanostructured Materials for the Detection of Hazardous Gases: A Review. Nano Mater. Sci. 2021, 3, 390–403. [Google Scholar] [CrossRef]
  8. Mahmoudi-Qashqay, S.; Zamani-Meymian, M.R.; Sadati, S.J. Improving Antibacterial Ability of Ti-Cu Thin Films with Co-Sputtering Method. Sci. Rep. 2023, 13, 16593. [Google Scholar] [CrossRef]
  9. Mechiakh, R.; Sedrine, N.B.; Chtourou, R.; Bensaha, R. Correlation between Microstructure and Optical Properties of Nano-Crystalline TiO2 Thin Films Prepared by Sol-Gel Dip Coating. Appl. Surf. Sci. 2010, 257, 670–676. [Google Scholar] [CrossRef]
  10. Lukong, V.T.; Ukoba, K.; Jen, T.C. Review of Self-Cleaning TiO2 Thin Films Deposited with Spin Coating. Int. J. Adv. Manuf. Technol. 2022, 122, 3525–3546. [Google Scholar] [CrossRef]
  11. Kumar Patnaik, R.; Divya, N. A Brief Review on the Synthesis of TiO2 Thin Films and Its Application in Dye Degradation. Mater. Today Proc. 2023, 72, 2749–2756. [Google Scholar] [CrossRef]
  12. Pérez, J.A.B.; Courel, M.; Pal, M.; Delgado, F.P.; Mathews, N.R. Effect of Ytterbium Doping Concentration on Structural, Optical and Photocatalytic Properties of TiO2 Thin Films. Ceram. Int. 2017, 43, 15777–15784. [Google Scholar] [CrossRef]
  13. Widyastuti, E.; Chiu, C.T.; Hsu, J.L.; Chieh Lee, Y. Photocatalytic Antimicrobial and Photostability Studies of TiO2/ZnO Thin Films. Arab. J. Chem. 2023, 16, 105010. [Google Scholar] [CrossRef]
  14. Momeni, M.; Saghafian, H.; Golestani-Fard, F.; Barati, N.; Khanahmadi, A. Effect of SiO2 Addition on Photocatalytic Activity, Water Contact Angle and Mechanical Stability of Visible Light Activated TiO2 Thin Films Applied on Stainless Steel by a Sol Gel Method. Appl. Surf. Sci. 2017, 392, 80–87. [Google Scholar] [CrossRef]
  15. Liu, B.; Zhao, X.; Zhang, N.; Zhao, Q.; He, X.; Feng, J. Photocatalytic Mechanism of TiO2-CeO2 Films Prepared by Magnetron Sputtering under UV and Visible Light. Surf. Sci. 2005, 595, 203–211. [Google Scholar] [CrossRef]
  16. Guergova, D.; Stoyanova, E.; Stoychev, D.; Avramova, I.; Stefanov, P. Self-Healing Effect of Ceria Electrodeposited Thin Films on Stainless Steel in Aggressive 0.5 Mol/L NaCl Aqueous Solution. J. Rare Earths 2015, 33, 1212–1227. [Google Scholar] [CrossRef]
  17. Kumar, V.; Chen, W.F.; Zhang, X.; Jiang, Y.; Koshy, P.; Sorrell, C.C. Properties and Performance of Photocatalytic CeO2, TiO2, and CeO2–TiO2 Layered Thin Films. Ceram. Int. 2019, 45, 22085–22094. [Google Scholar] [CrossRef]
  18. Kumari, V.; Sharma, A.; Kumar, N.; Sillanpää, M.; Makgwane, P.R.; Ahmaruzzaman, M.; Hosseini-Bandegharaei, A.; Rani, M.; Chinnamuthu, P. TiO2-CeO2 Assisted Heterostructures for Photocatalytic Mitigation of Environmental Pollutants: A Compre-hensive Study on Band Gap Engineering and Mechanistic Aspects. Inorg. Chem. Commun. 2023, 151, 110564. [Google Scholar] [CrossRef]
  19. Huong, H.T.; Nhu, T.T.Q.; Nang, H.X.; Tuan, P.A.; Huy, P.T. Super-Hydrophilic Ce3+-Doped TiO2-SiO2 Nanocomposite Thin Films with High Optical Transmittance by a Simple Spin-Coating Method. Thin Solid Film. 2023, 768, 139730. [Google Scholar] [CrossRef]
  20. Procópio, A.M.S.; do Carmo Lima Carvalho, J.; Silveira, T.H.R.; Valério, A.L.; Vaz, I.C.F.; Cabral, A.C.T.; de Freitas, M.R.; da Silva, M.C.; Filho, F.M. CeO2 Thin Film Supported on TiO2 Porous Ceramics. Mater. Lett. 2020, 276, 128224. [Google Scholar] [CrossRef]
  21. Contreras-García, M.E.; García-Benjume, M.L.; Macías-Andrés, V.I.; Barajas-Ledesma, E.; Medina-Flores, A.; Espitia-Cabrera, M.I. Synergic Effect of the TiO2-CeO2 Nanoconjugate System on the Band-Gap for Visible Light Photocatalysis. Mater. Sci. Eng. B 2014, 183, 78–85. [Google Scholar] [CrossRef]
  22. Galindo, F.; Gómez, R.; Aguilar, M. Photodegradation of the Herbicide 2,4-Dichlorophenoxyacetic Acid on Nanocrystalline TiO2-CeO2 Sol-Gel Catalysts. J. Mol. Catal. A Chem. 2008, 281, 119–125. [Google Scholar] [CrossRef]
  23. Jiang, Y.; Jin, Z.; Chen, C.; Duan, W.; Liu, B.; Chen, X.; Yang, F.; Guo, J. Cerium-Doped Mesoporous-Assembled SiO2/P25 Nanocomposites with Innovative Visible-Light Sensitivity for the Photocatalytic Degradation of Organic Dyes. RSC Adv. 2017, 7, 12856–12870. [Google Scholar] [CrossRef]
  24. Sahoo, S.S.; Mansingh, S.; Babu, P.; Parida, K. Black Titania an Emerging Photocatalyst: Review Highlighting the Synthesis Techniques and Photocatalytic Activity for Hydrogen Generation. Nanoscale Adv. 2021, 3, 5487–5524. [Google Scholar] [CrossRef]
  25. Moongraksathum, B.; Chen, Y.W. CeO2–TiO2 Mixed Oxide Thin Films with Enhanced Photocatalytic Degradation of Organic Pollutants. J. Sol-Gel Sci. Technol. 2017, 82, 772–782. [Google Scholar] [CrossRef]
  26. Reguero-Márquez, G.A.; Lunagómez-Rocha, M.A.; Cervantes-Uribe, A.; del Angel, G.; Rangel, I.; Torres-Torres, J.G.; González, F.; Godavarthi, S.; Arevalo-Perez, J.C.; Espinosa de los Monteros, A.E.; et al. Photodegradation of 2,4-D (Dichlorophenoxyacetic Acid) with Rh/TiO2; Comparative Study with Other Noble Metals (Ru, Pt, and Au). RSC Adv. 2022, 12, 25711–25721. [Google Scholar] [CrossRef]
  27. Liu, G.; Mamat, M.; Baikeli, Y.; Dong, X. Photocatalytic Degradation of Methylene Blue by TiO2/Nd2O3 Composite Thin Films. Heliyon 2024, 10, e29894. [Google Scholar] [CrossRef]
  28. Li, Z.; Sheng, J.; Zhang, Y.; Li, X.; Xu, Y. Role of CeO2 as Oxygen Promoter in the Accelerated Photocatalytic Degradation of Phenol over Rutile TiO2. Appl. Catal. B 2015, 166–167, 313–319. [Google Scholar] [CrossRef]
  29. Moongraksathum, B.; Chen, Y.W. Anatase TiO2 Co-Doped with Silver and Ceria for Antibacterial Application. Catal. Today 2018, 310, 68–74. [Google Scholar] [CrossRef]
  30. Li, F.B.; Li, X.Z.; Hou, M.F.; Cheah, K.W.; Choy, W.C.H. Enhanced Photocatalytic Activity of Ce3+-TiO2 for 2-Mercaptobenzothiazole Degradation in Aqueous Suspension for Odour Control. Appl. Catal. A Gen. 2005, 285, 181–189. [Google Scholar] [CrossRef]
  31. Xiu, Z.; Xing, Z.; Li, Z.; Wu, X.; Yan, X.; Hu, M.; Cao, Y.; Yang, S.; Zhou, W. Ti3+-TiO2/Ce3+-CeO2 Nanosheet Heterojunctions as Efficient Visible-Light-Driven Photocatalysts. Mater. Res. Bull. 2018, 100, 191–197. [Google Scholar] [CrossRef]
  32. Manifacier, J.C.; Gasiot, J.; Fillard, J.P. A Simple Method for the determination of the optical Constants n, k and the Thickness of a Weakly Thin Film. J. Phys. E Sci. Instrum. 1976, 9, 1002–1004. [Google Scholar] [CrossRef]
  33. Štengl, V.; Bakardjieva, S.; Murafa, N. Preparation and Photocatalytic Activity of Rare Earth Doped TiO2 Nanoparticles. Mater. Chem. Phys. 2009, 114, 217–226. [Google Scholar] [CrossRef]
  34. Kayani, Z.N.; Maria; Riaz, S.; Naseem, S. Magnetic and Antibacterial Studies of Sol-Gel Dip Coated Ce Doped TiO2 Thin Films: Influence of Ce Contents. Ceram. Int. 2020, 46, 381–390. [Google Scholar] [CrossRef]
  35. Sta, I.; Jlassi, M.; Hajji, M.; Boujmil, M.F.; Jerbi, R.; Kandyla, M.; Kompitsas, M.; Ezzaouia, H. Structural and Optical Properties of TiO2 Thin Films Prepared by Spin Coating. J. Solgel Sci. Technol. 2014, 72, 421–427. [Google Scholar] [CrossRef]
  36. Arévalo-Pérez, J.C.; de la Cruz-Romero, D.; Cordero-García, A.; Lobato-García, C.E.; Aguilar-Elguezabal, A.; Torres-Torres, J.G. Photodegradation of 17 α-Methyltestosterone Using TiO2 -Gd3+ and TiO2-Sm3+ Photocatalysts and Simulated Solar Radiation as an Activation Source. Chemosphere 2020, 249, 126497. [Google Scholar] [CrossRef]
  37. Vo, T.L.N.; Dao, T.T.; Duong, A.T.; Bui, V.H.; Nguyen, V.H.; Nguyen, D.L.; Nguyen, D.C.; Nguyen, T.H.; Nguyen, H.T. Enhanced Photocatalytic Degradation of Organic Dyes Using Ce–Doped TiO2 Thin Films. J. Sol-Gel Sci. Technol. 2023, 108, 423–434. [Google Scholar] [CrossRef]
  38. Chen, N.; Xia, J.; Li, L.; Lv, Q.; Zhao, K.; Ahmad, M.; Xiao, Z.; Wang, S.; Ye, F.; Zhang, Q. Comprehensive Enhancement of Photocatalytic H2O2 Generation and Antibacterial Efficacy on Carbon Nitride through a Straightforward Polydopamine Coating Strategy. Surf. Interfaces 2025, 56, 105566. [Google Scholar] [CrossRef]
  39. Haider, A.J.; Al-Anbari, R.H.; Kadhim, G.R.; Salame, C.T. Exploring Potential Environmental Applications of TiO2 Nanoparticles. Energy Procedia 2017, 119, 332–345. [Google Scholar] [CrossRef]
  40. Chung, L.; Chen, W.F.; Koshy, P.; Sorrell, C.C. Effect of Ce-Doping on the Photocatalytic Performance of TiO2 Thin Films. Mater. Chem. Phys. 2017, 197, 236–239. [Google Scholar] [CrossRef]
  41. Sani, S.F.A.; Othman, M.H.U.; Alqahtani, A.; Almugren, K.S.; Alkallas, F.H.; Bradley, D.A. Low-Cost Commercial Borosilicate Glass Slides for Passive Radiation Dosimetry. PLoS ONE 2020, 15, e0241550. [Google Scholar] [CrossRef]
  42. Ameen, S.; Shaheer Akhtar, M.; Seo, H.K.; Shin, H.S. Solution-Processed CeO2/TiO2 Nanocomposite as Potent Visible Light Photocatalyst for the Degradation of Bromophenol Dye. Chem. Eng. J. 2014, 247, 193–198. [Google Scholar] [CrossRef]
  43. Dundar, I.; Mere, A.; Mikli, V.; Krunks, M.; Acik, I.O. Thickness Effect on Photocatalytic Activity of TiO2 Thin Films Fabricated by Ultrasonic Spray Pyrolysis. Catalysts 2020, 10, 1058. [Google Scholar] [CrossRef]
  44. Li, M.; Zhang, S.; Lv, L.; Wang, M.; Zhang, W.; Pan, B. A Thermally Stable Mesoporous ZrO2-CeO2-TiO2 Visible Light Photocatalyst. Chem. Eng. J. 2013, 229, 118–125. [Google Scholar] [CrossRef]
  45. Park, J.H.; Kim, W.S.; Jo, D.H.; Kim, J.S.; Park, J.M. Effect of Ce Conversion Underlayer Coating on the Photo-Catalytic Activity of TiO2 Sol-Gel Film Deposited on Hot-Dip GI. J. Ind. Eng. Chem. 2014, 20, 1965–1972. [Google Scholar] [CrossRef]
  46. Monteros, A.E.D.L.; Lafaye, G.; Cervantes, A.; Del Angel, G.; Barbier, J.; Torres, G. Catalytic Wet Air Oxidation of Phenol over Metal Catalyst (Ru,Pt) Supported on TiO2-CeO2 Oxides. Catal. Today 2015, 258, 564–569. [Google Scholar] [CrossRef]
  47. Lalliansanga; Tiwari, D.; Lee, S.M.; Kim, D.J. Photocatalytic Degradation of Amoxicillin and Tetracycline by Template Synthesized Nano-Structured Ce3+@TiO2 Thin Film Catalyst. Environ. Res. 2022, 210, 112914. [Google Scholar] [CrossRef]
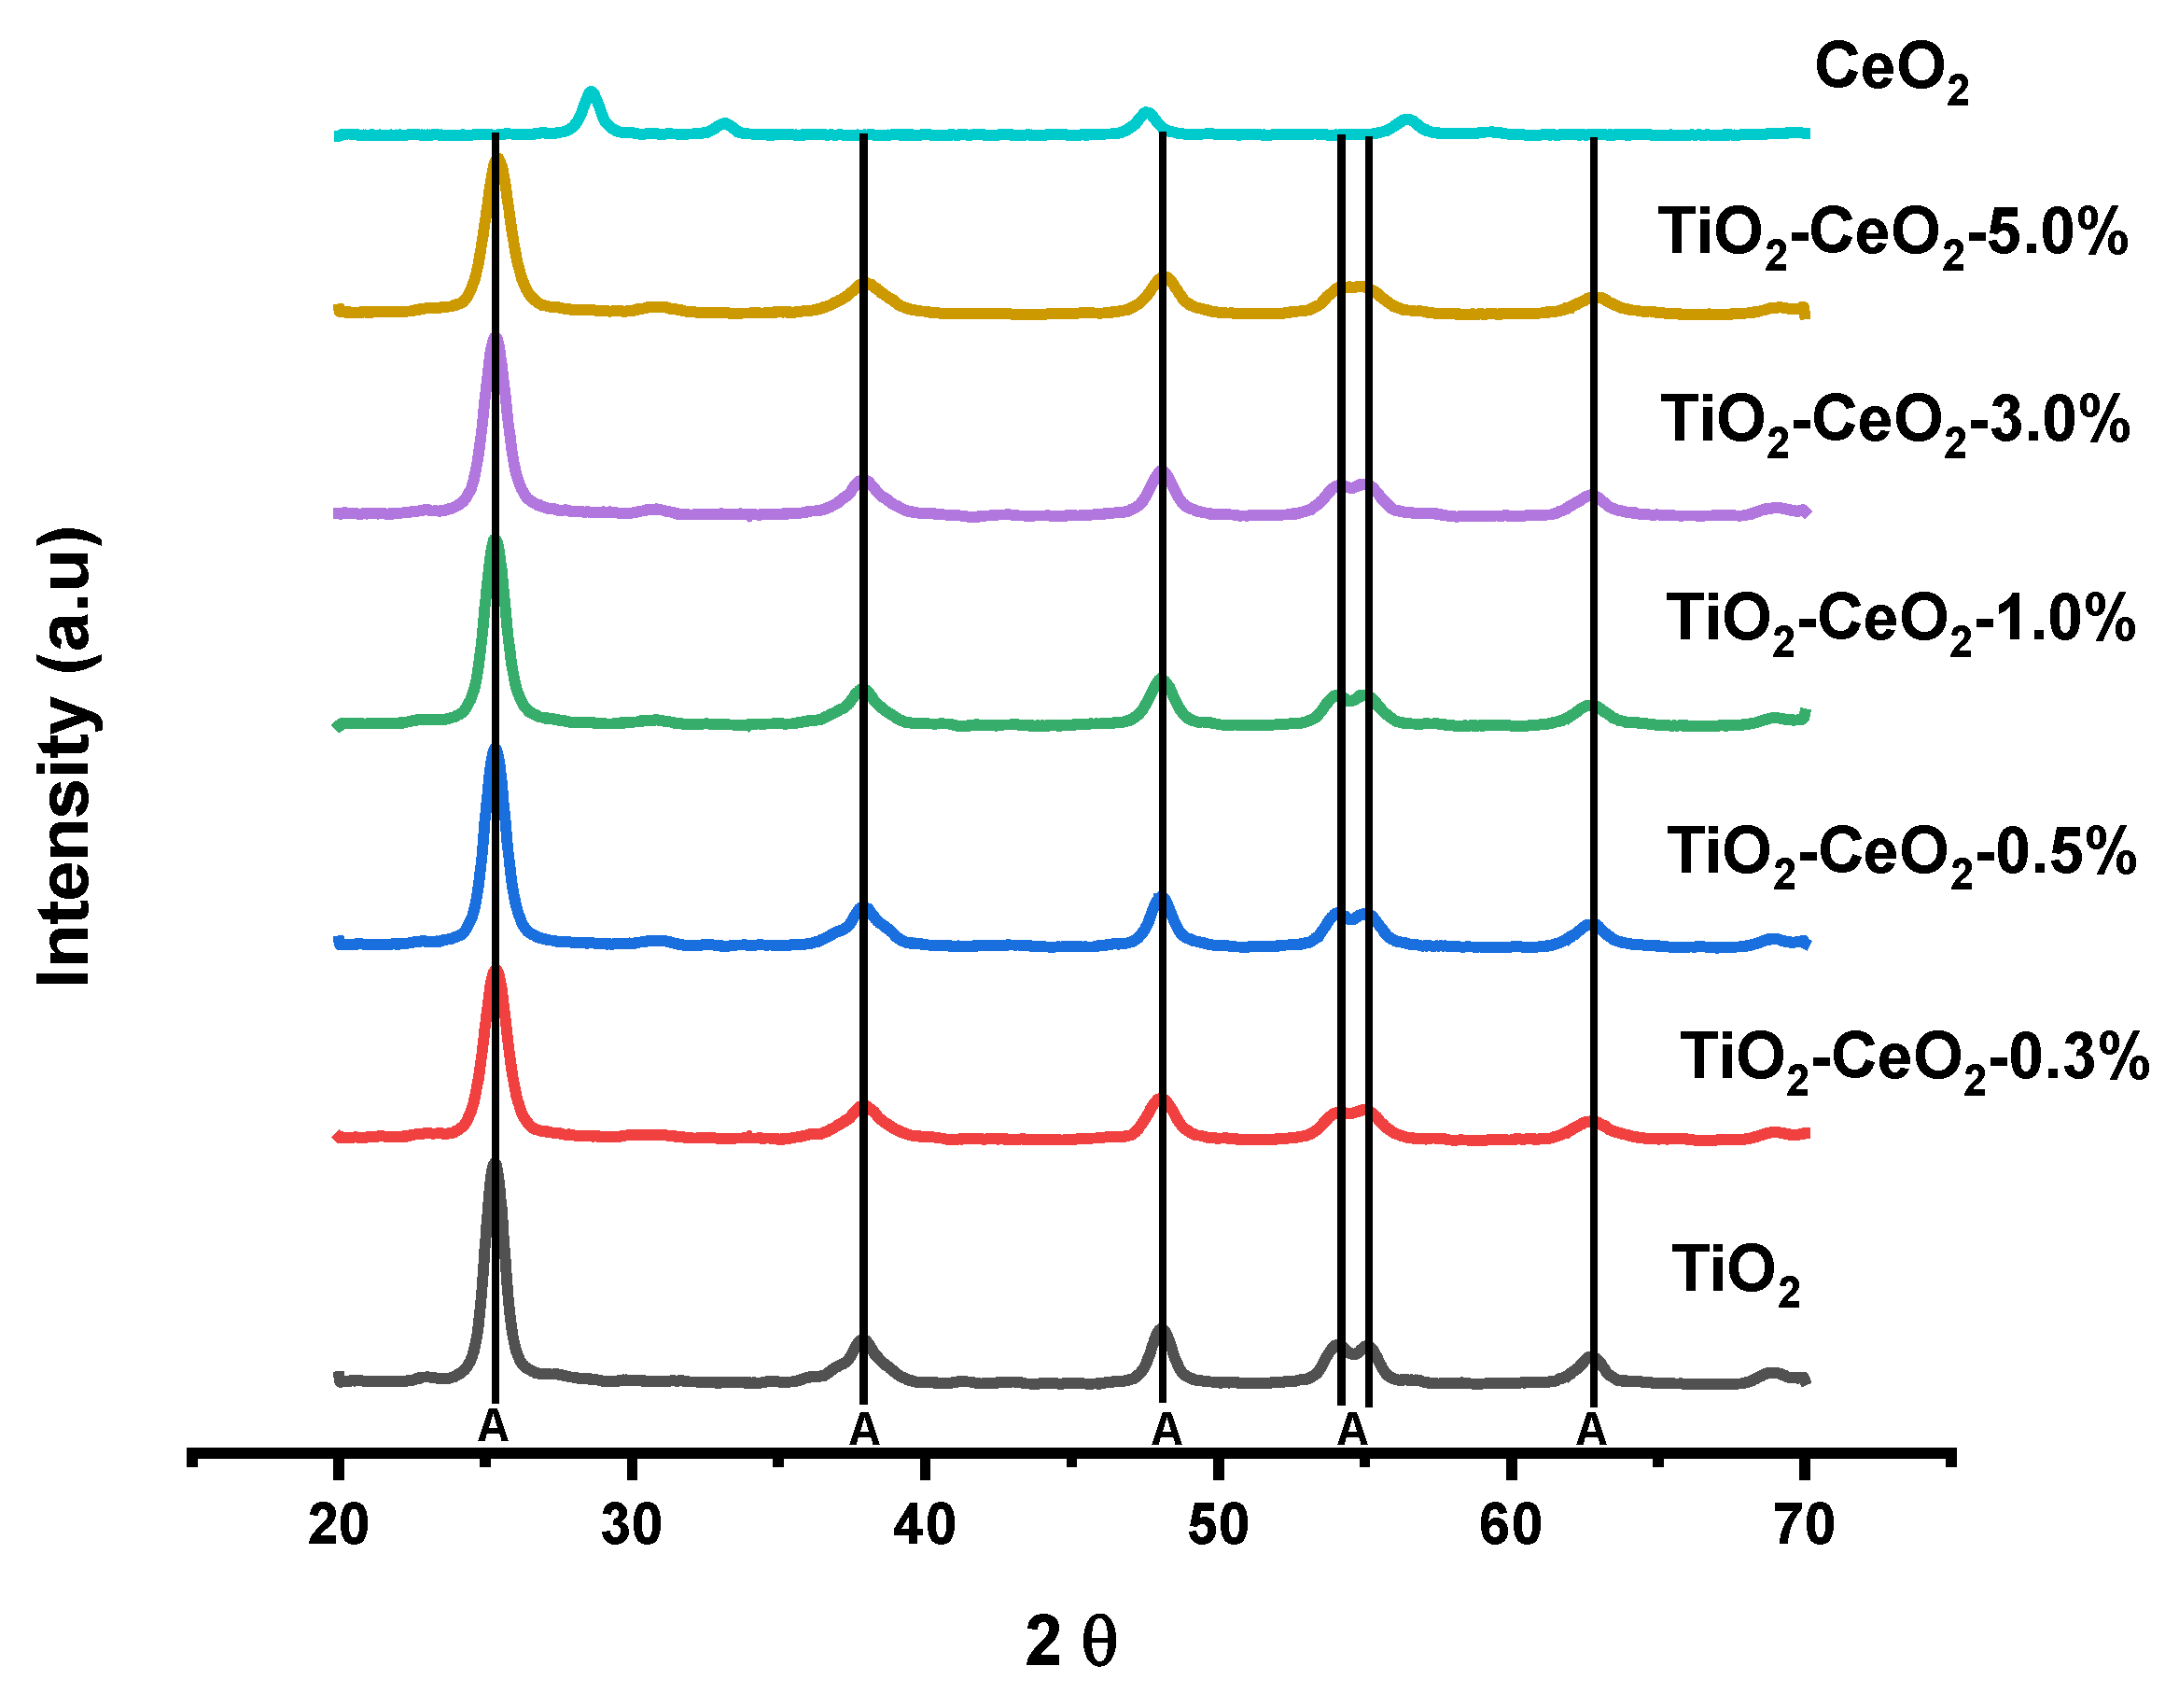
Figure 1. XRD patterns of TiO2, CeO2-doped TiO2 and CeO2 powders.
Catalysts 15 00046 g001
Figure 2. Comparison of the XPS spectra of TiO2 and TiO2-CeO2 at 5.0%: (a) calibration with C 1s, (b) Ti 2p, (c) O 1s and (d) Ce 3d.
Catalysts 15 00046 g002
Figure 3. UV-Vis transmittance (a,b) and absorbance (c,d) spectra for TiO2 and CeO2-doped TiO2 thin films with one layer (a,c) and two layers (b,d), respectively.
Catalysts 15 00046 g003
Figure 4. AFM images of TiO2-CeO2 0.3% 1 layer (a), TiO2-CeO2 0.3% 2 layers (b), TiO2-CeO2 5.0% 1 layer (c), TiO2-CeO2 5.0% 2 layers (d) and profilometry plots of the same samples (e).
Catalysts 15 00046 g004
Figure 5. The morphology of the TiO2-CeO2 5.0% sample magnified at 1500× (a) and the cross-section (b) are presented. The EDS spectrum (c) and the elemental distribution by percentages of each element in the sample (d). Elements making up the borosilicate slide*.
Catalysts 15 00046 g005
Figure 6. Diuron (a,b) and methyl parathion (c,d) solar photocatalytic mineralization using single- and double-layer TiO2 and Ce-doped TiO2 thin films.
Catalysts 15 00046 g006
Figure 7. Photocatalytic degradation (a) and reuse tests for the mineralization (b) of diuron and methyl parathion using TiO2-CeO2-5.0% thin films with one layer. SEM images of the cross-section before (c) and after (d) reaction using the same sample.
Catalysts 15 00046 g007
Figure 8. Schematic representation of the proposed reaction mechanism in TiO2-CeO2 thin films.
Catalysts 15 00046 g008
Figure 9. Reaction system employed in the photocatalytic tests placed in a solar simulator.
Catalysts 15 00046 g009
Table 1. Crystal size and strain index values for TiO2 and CeO2-doped TiO2 powders.
SampleCrystallite Size, D (nm)Strain, Ɛ
TiO210.660.01549
TiO2-CeO2-0.3%9.700.01702
TiO2-CeO2-0.5%9.640.01713
TiO2-CeO2-1.0%9.550.01728
TiO2-CeO2-3.0%9.080.01818
TiO2-CeO2-5.0%8.140.02027
Table 2. Relative abundance data obtained by XPS for the chemical species present in the TiO2 and TiO2-CeO2-5.0% powders.
SampleTi 2pO 1sCe 3d
Ti4+Ti3+O2−OHH2OCe4+Ce3+
TiO2458.12456.49529.37531.60533.49--
97.12.967.3266.7--
TiO2-CeO2-5.0%458.20456.49529.45531.50533.39882, 888880, 884
95.84.273.123.73.349.20, 51.6050.90, 48.40
Table 4. Photocatalytic evaluation results. Reaction rate constant (kapp), half-life time (t1/2) and % mineralization by TOC.
One Layerkaap (min−1)T1/2 (min)TOC (%)Two Layerskaap
(min−1)
T1/2 (min)TOC (%)
Photolysis            D
MP
0.000417324.45Photolysis                   D
MP
0.000417324.45
0.000513861.220.000513861.22
TiO2                              D
MP
0.002428913.20TiO2                    D
MP
0.002330119.25
0.002133028.880.005113629.32
TiO2-CeO2 0.3%        D
MP
0.004316132.52TiO2-CeO2 0.3%      D
MP
0.001257827.41
0.00759241.830.005911737.57
TiO2-CeO2 0.5%D
MP
0.003122420.18TiO2-CeO2 0.5%      D
MP
0.001163028.06
0.004714735.400.005013937.91
TiO2-CeO2 1.0%D
MP
0.002725718.08TiO2-CeO2 1.0%      D
MP
0.003619334.99
0.00828542.990.004914140.17
TiO2-CeO2 3.0%D
MP
0.003718724.38TiO2-CeO2 3.0%      D
MP
0.003221737.57
0.002527759.300.00838457.95
TiO2-CeO2 5.0%      D
MP
0.004415835.93TiO2-CeO2 5.0%      D
MP
0.005013838.55
0.00878069.460.00887970.63
Disclaimer/Publisher’s Note: The statements, opinions and data contained in all publications are solely those of the individual author(s) and contributor(s) and not of MDPI and/or the editor(s). MDPI and/or the editor(s) disclaim responsibility for any injury to people or property resulting from any ideas, methods, instructions or products referred to in the content.

