1. Introduction
1,3 Butadiene (BD) is an important diolefin used in the production of synthetic rubber, ABS resins, and styrene–butadiene latex. Currently, BD is mainly obtained as a byproduct from the thermal cracking of hydrocarbons and the dehydrogenation of C4 hydrocarbons, respectively.
In the last two decades, there have been research activities regarding the synthesis of BD from ethanol, a method that fulfills the “sustainable development” principle and is supported by the availability of ethanol.
Two technologies were developed at the beginning of the 20th century for the production of BD from ethanol (ETB), the one-stage process (patented by Lebedev in 1928) and the two-stage process, respectively (invented by Ostromislensky in 1915). In the Lebedev process, BD is obtained directly from ethanol in a single reactor, whereas, in the Ostromislensky process, the ethanol is dehydrogenated to acetaldehyde in a first-stage reactor and, further, BD is synthesized from a mixture of acetaldehyde and ethanol in a second-stage reactor. Both processes were industrially applied (the Lebedev process in the Soviet Union and the Ostromislensky process in the USA) until 1960, when they were replaced with technologies based on petroleum derivatives [
1].
The most investigated catalysts for the Lebedev ETB process are based on the mixture of magnesium oxide–silica (MgO–SiO
2) modified with transitional metals or metal oxides (ZnO, ZrO
2, etc). Good ETB performances have also been demonstrated using other metal oxide mixtures as catalysts (ZrO
2–MgO, ZrO
2–SiO
2, TiO
2–SiO
2, Ta
2O
5–SiO
2, HfO
2–SiO
2, etc.). Details regarding the catalysts’ performances in the ETB process are provided by Kyriienko et al. [
2] and Pomalaza et al. [
1]. The proposed chemical transformation mechanisms for the one-stage ETB process were reviewed by Pomalaza et al. [
1] and Tabanelli et al. [
3].
Only a few reports have been published on the reaction kinetics and engineering of the one-stage ETB process until now. A significant study of this process carried out over a MgO–SiO
2 mixture, promoted with ZnO, ZrO
2, and K
2O, was published by Da Ros et al. [
4]. The process investigations were performed at temperatures between 300 and 400 °C, weight space velocities (WHSV) between 0.3 and 2.5 h
−1 (reported to the fed ethanol), and molar fractions of ethanol in the feed between 0.41 and 0.85 (in the presence of an inert gas as carrier). Based on their experimental observations, Da Ros et al. [
4] proposed a reaction scheme describing the investigated ETB transformation chemistry (Scheme 1 in their paper). Brosteanu et al. [
5] used these published data to develop power law rate expressions for the ETB transformation steps and estimated their kinetic parameters (
Table 1).
The thermodynamic investigations of the ETB process evidenced that the transformation is kinetically controlled, with the ethanol conversion and BD yield being dependent primarily on catalyst performances (Angelici et al. [
6], Makshina et al. [
7], and Banu et al. [
8]). The ETB one-stage ethanol conversion to BD is described by the following global reaction:
The transformation is endothermic, with the enthalpy of the reaction (1) varying from 102 to 109 kJ/mol, for reaction temperature changes from 200 to 500 °C [
7].
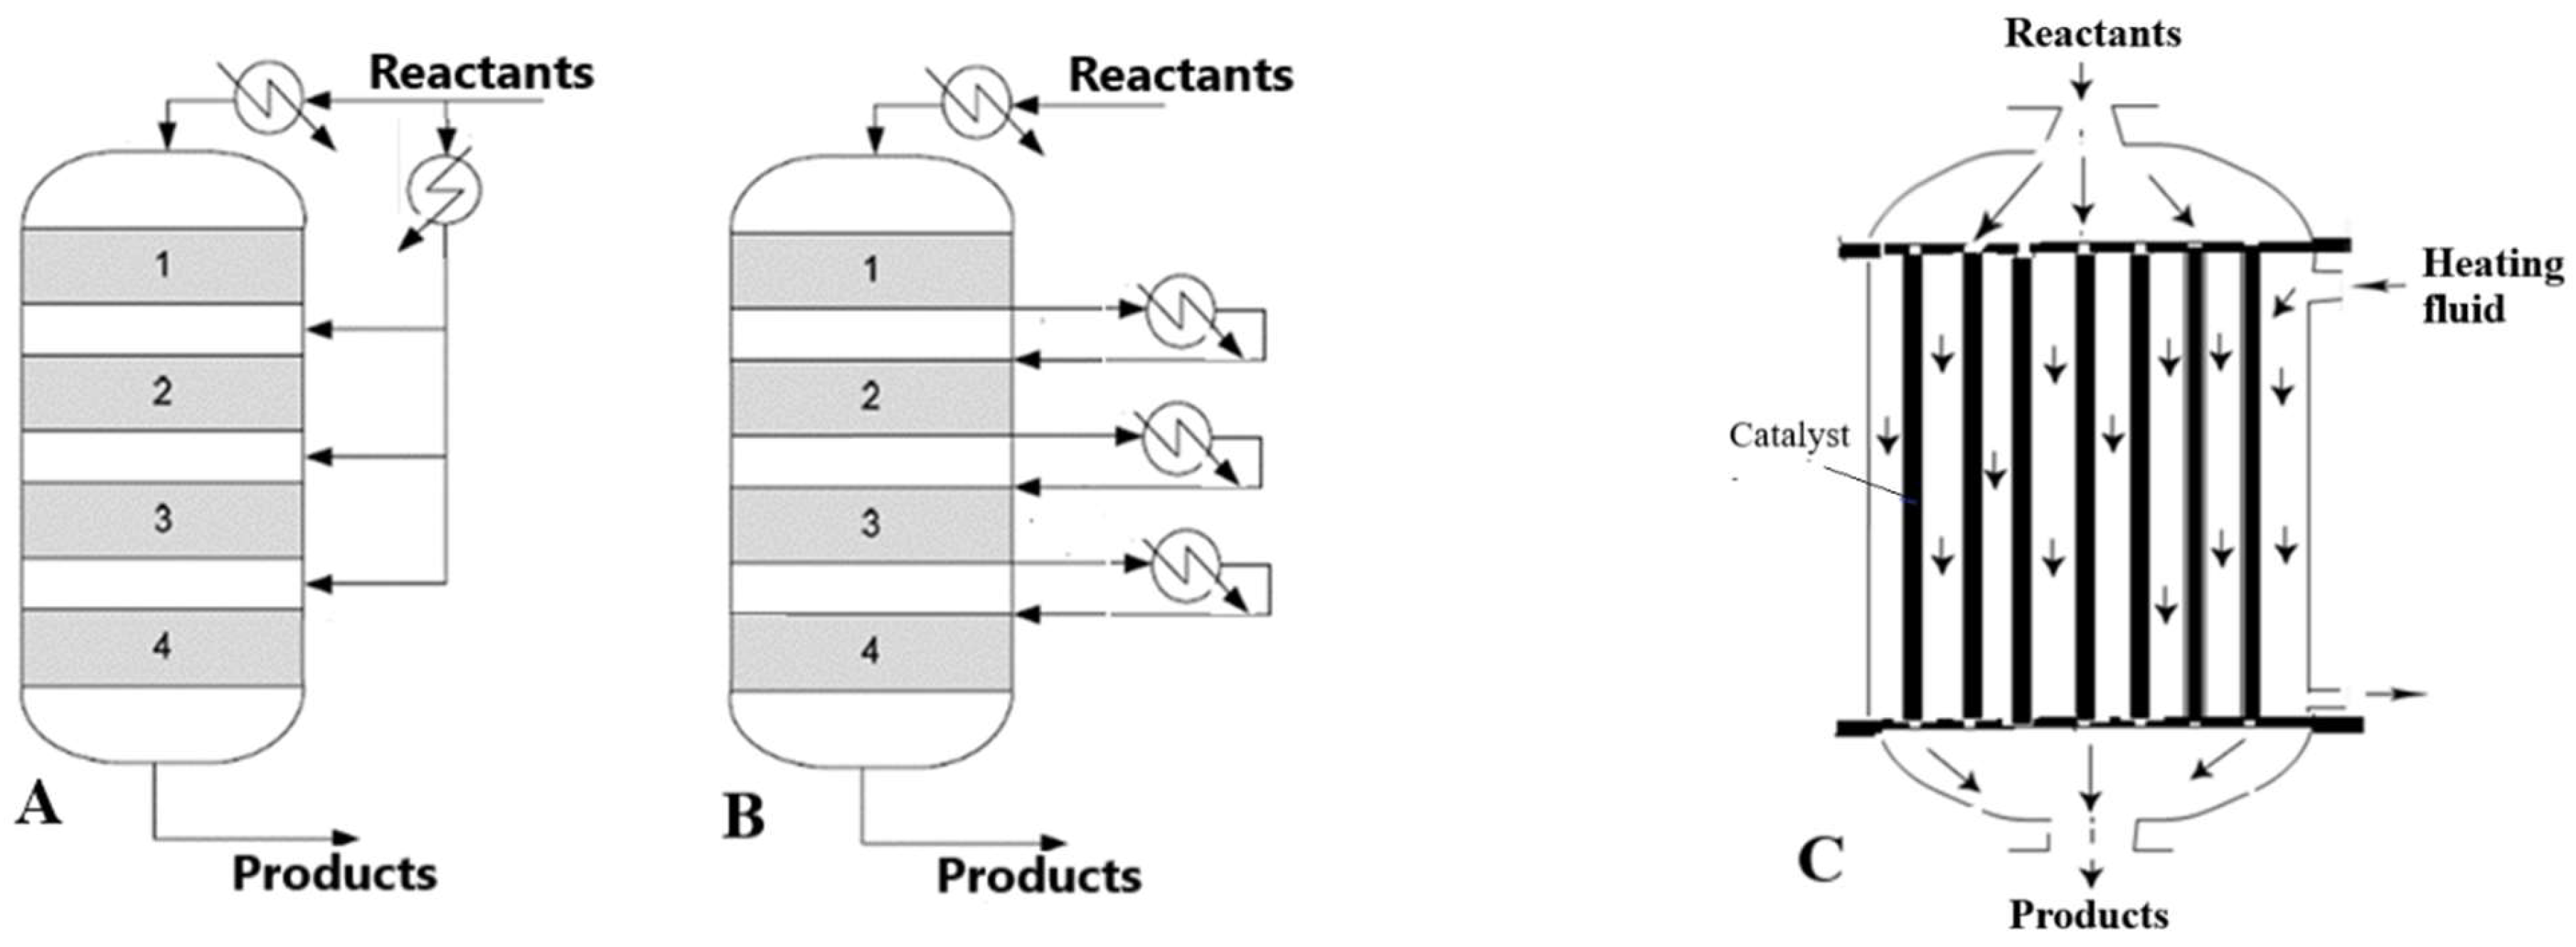
The aim of this work is to comparatively evaluate the performances of two types of catalytic fixed-bed reactors in the ethanol transformation to BD by the Lebedev process: the multibed adiabatic reactor with inter-bed heating (MBAR) and the multitubular reactor (MTR) (
Figure 1).
To the best of our knowledge, this is the first detailed comparison of different reactor performances for the ethanol-to-butadiene conversion.
2. The Reactors’ Mathematical Models
In the MBAR, the catalyst is distributed in a few adiabatic beds, with the reaction mixture reheated after each bed, either by injection of hot reactant (
Figure 1A, direct heating) or using heat exchangers (
Figure 1B, indirect heating). The MTR has a construction similar to a shell and tube heat exchanger, with the parallel tubes packed with the catalyst and the heating thermal fluid circulating on the shell side (
Figure 1C).
- (a)
The heterogeneous model
Typically, the heterogeneous model includes the mass and heat balance equations in the flowing gas as well as the heat and mass balance equations within the porous catalyst particle.
In this study, considering the relatively high gas velocity in the catalyst bed and the high ratio between the length of catalyst bed and the particle diameter (L/dp >> 50), the axial mixing of the gas phase was neglected (ideal plug flow). Additionally, as the process is characterized by a moderate intrinsic kinetics, the radial temperature and concentration gradients in the catalyst bed were neglected and the catalyst particle was considered isothermal.
The mass balance equations in the flowing gas can be written in the form describing the evolution of reaction extents along the bed axial co-ordinate [
9]:
The heat balance equation in the flowing gas was used in the form:
The gas pressure drop along the bed is described by the equation:
The boundary conditions associated with Equations (2)–(4) are:
The mass and heat balance equations in the catalyst particle were used in the forms:
As heating fluid, we considered Dowtherm A saturated vapors at a sufficiently high flow rate to ensure constant temperature along the reactor (vapors give off only the latent heat of vaporization). The heating fluid feed flow rate is calculated from the overall heat balance equation around the reactor (neglecting the heat loss):
The mean reaction rate,
, appearing in (2) and (3), is calculated by averaging v
Ri over particle volume (spherical geometry):
The composition inside the porous catalyst particle is calculated from the mass balance equations:
The boundary conditions associated with Equation (10) are:
In Equation (10), the formation rate of species j,
, is calculated from the relation:
The influence of internal diffusion on the kinetics of reaction i is defined by the internal effectiveness factor:
The integration accuracy of Equation (10) was checked by the equality:
- (b)
Pseudo-homogeneous (PO) model
This model, simpler than the heterogeneous one, assumes that the temperature and composition are identical in both phases in a cross-section of the catalyst bed (null concentration and temperature inter-phase and intra-particle gradients). The mathematical model of the process is defined by Equations (2)–(4).
Note that, in the case of adiabatic beds, the heat balance Equation (3) does not include the term defining the heat transfer between the heating agent and the reaction mixture (KT = 0).
The numerical solution of the mathematical model defined by the equations presented above was calculated by Matlab programing environment, using the integration functions ode15s (Equations (2)–(4)), bvp5c (Equation (10)), and Newton–Raphson method (transcendental Equations (6) and (7)).
The physical and transport properties of the gas mixture were calculated using data and relations published by Reid et al. [
10]. For Dowtherm A vapors, used as heating fluid, the properties are published by the manufacturer (Dowtherm A Technical Data Sheet, [
11]). The heat transfer coefficient, K
T, appearing in Equation (3) is calculated by classical relations (see Hottel et al. [
12] and Froment et al. [
13]), whereas the gas-to-particle mass and heat transfer coefficients, k
G,j and α
GS, were calculated using the correlations proposed by Ranz [
14] and Petrovic and Thodos [
15], respectively. The effective diffusion coefficients inside the porous structure of catalyst particle, appearing in Equation (10), were calculated considering molecular and Knudsen mechanisms, by relations and data published by Reid et al. [
10] and Froment et al. [
13].
3. Results and Discussion
3.1. Test of the Particle Isothermicity
The hypothesis of constant temperature inside the catalyst particle was approximately assessed by the Weisz–Prater criterion (originally proposed for singular reactions), referring to the global reaction (1) [
13]:
In the expression (16), ΔT
max is the maximum expected temperature variation inside the particle. The catalyst particle conductivity was evaluated using data published by Yaws [
16] and its value is λ
ef = 0.41 W/(m K). The global enthalpy of transformation per mole of ethanol was considered ΔH
RA = 54 kJ/mol and the effective diffusivity of ethanol D
efA = 2.24·10
−7 m
2/s. By approximating surface ethanol concentration and temperature by gas phase values in the feed, C
AS ≅ C
AG = 0.0217 kmol/m
3 and T
S ≅ T
G = 673 K (see
Section 3.2), one obtains β
G = 9.5·10
−4 or ΔT
max ≅ 0.64 K. Note that this evaluation considered only the thermal effects of the main reaction steps. Nevertheless, the internal temperature drop in the catalyst pellet is diminished by the exothermal character of some secondary reactions, this leading to an even smaller internal temperature gradient. In conclusion, the Weisz–Prater criterion predicts a negligible temperature variation within the catalyst particle.
3.2. Reactor Simulation Results. Simplification of the Reactor Mathematical Model
The reactor nominal working conditions were kept in the domains appearing in the experimental study of Da Ros et al. [
4], used in the development of the kinetic model (
Table 2). Our previous investigations showed significant dependencies of the ethanol conversion and BD selectivity on the catalyst particle size. The particle diameter selected in this study (d
p = 3 mm) belongs to the interval of maximum BD formation rate (Bozga et al. [
17]). For the catalyst weight specified in
Table 2, the selected catalyst bed length (L = 3 m) ensures a sufficiently high gas flow velocity to limit the gas–particle temperature and concentration gradients.
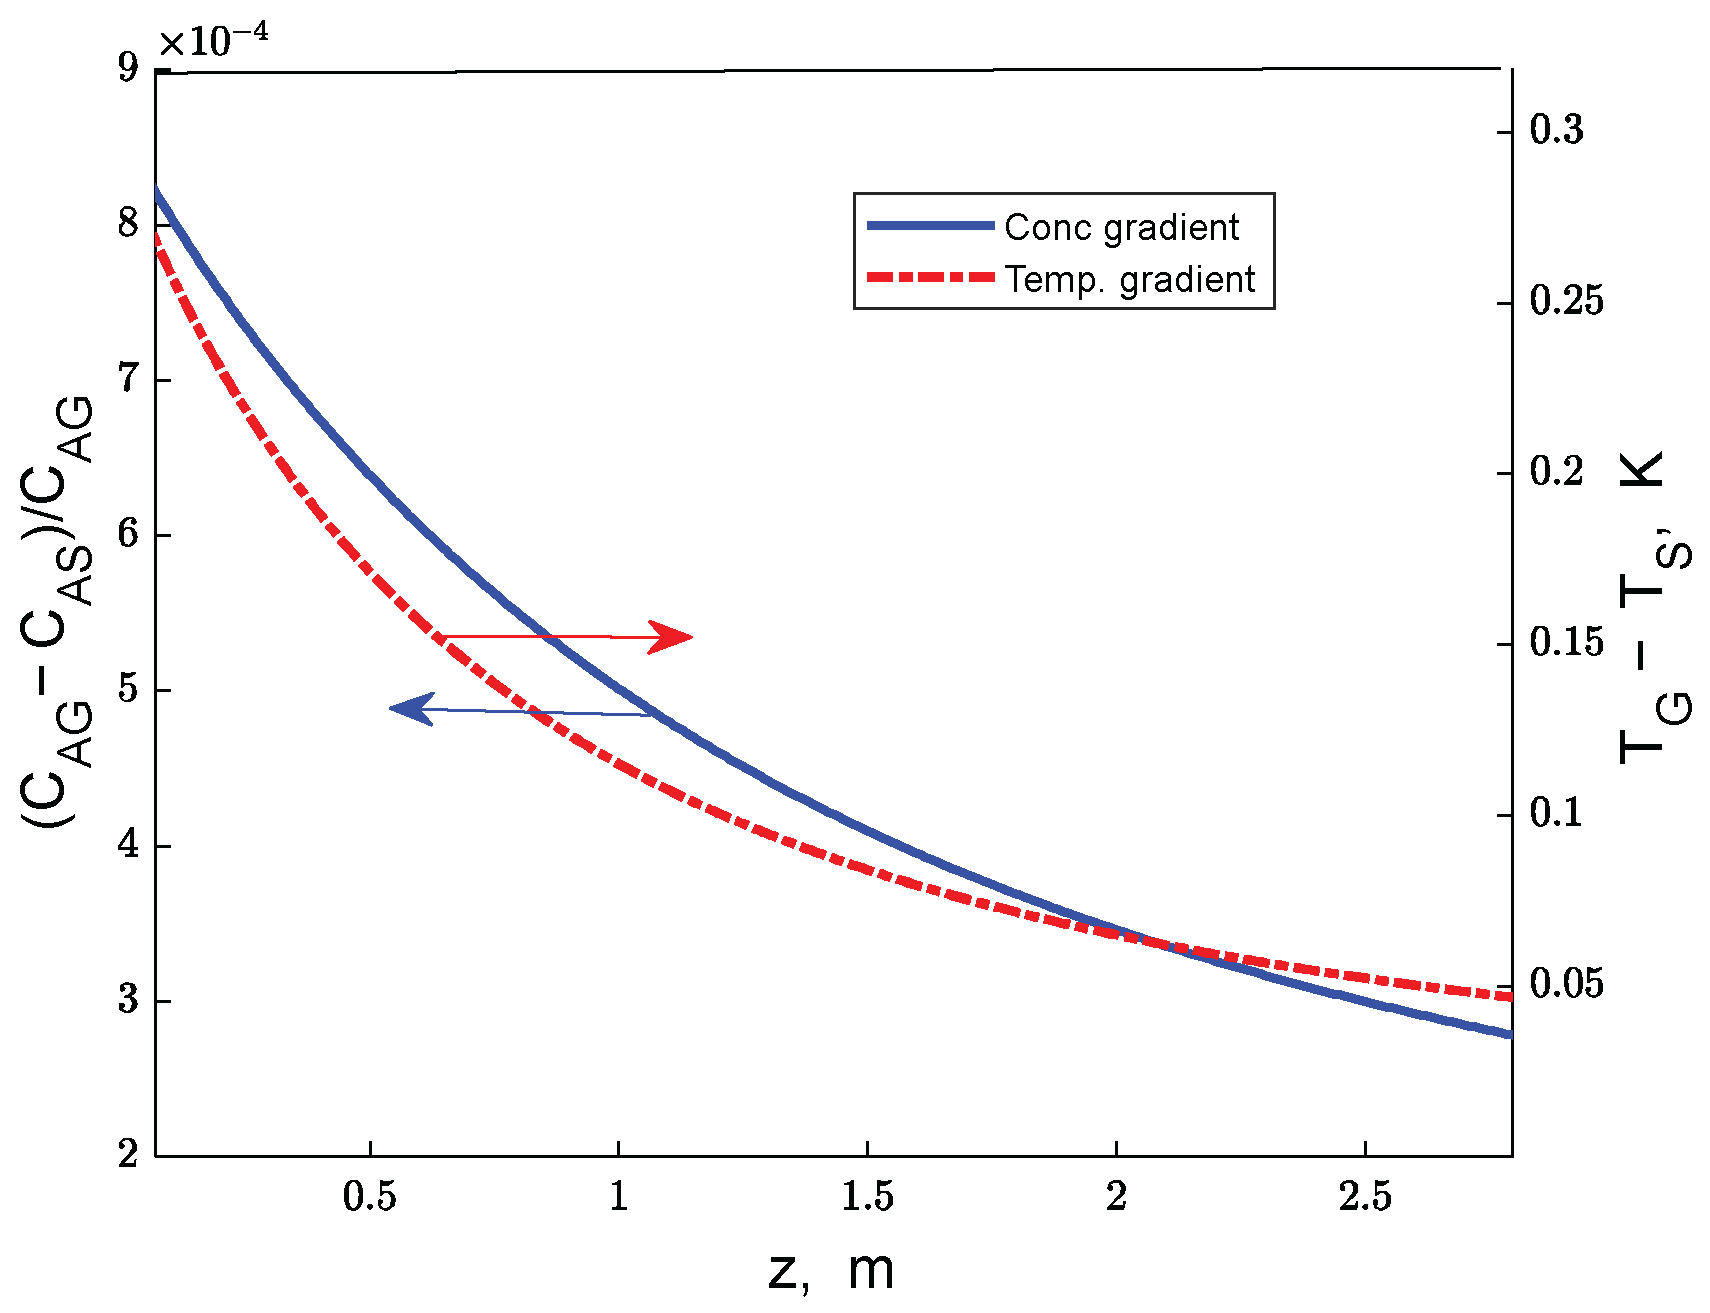
The error in the numerical integration of particle mass balance equations, calculated for ethanol as the relative difference between the two terms of Equation (15), is at a maximum of 0.006%. The solution of the heterogeneous reactor model (Equations (2)–(15) evidences that the gas–particle temperature and concentration gradients are negligible on the working domain for both adiabatic and multitubular reactors (
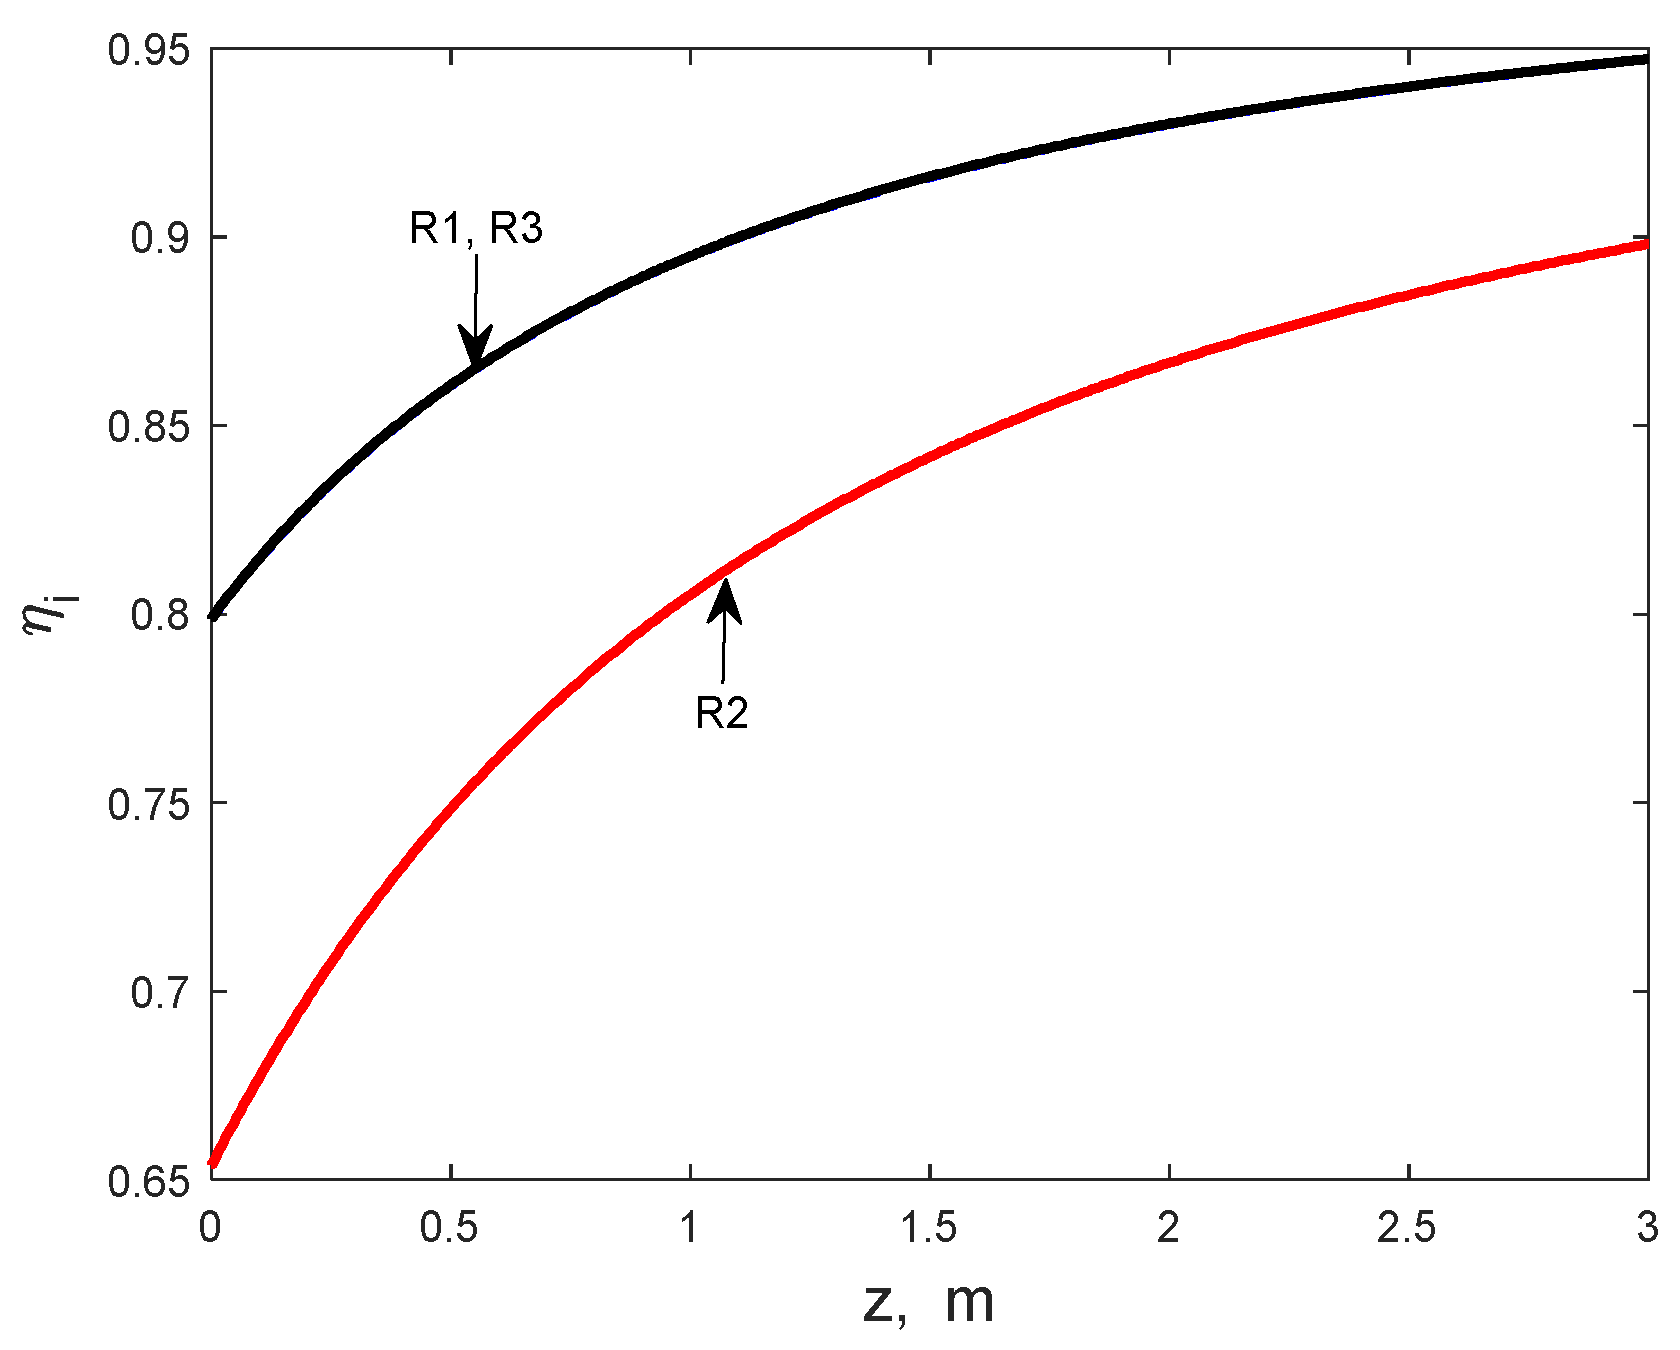
Figure 2). However, the influence of internal diffusion on the process kinetics is significant, as suggested by the values of the internal effectiveness factors (
Figure 3 and
Figure 4). On the first zone of the catalyst bed, the values of effectiveness factors for the reactions R1, R2, and R3 are significantly lower than 1, demonstrating a limiting effect of diffusion inside the catalyst particle on these reactions’ kinetics (
Figure 3). Note that the curves for reactions R1 and R3 are practically superposed.
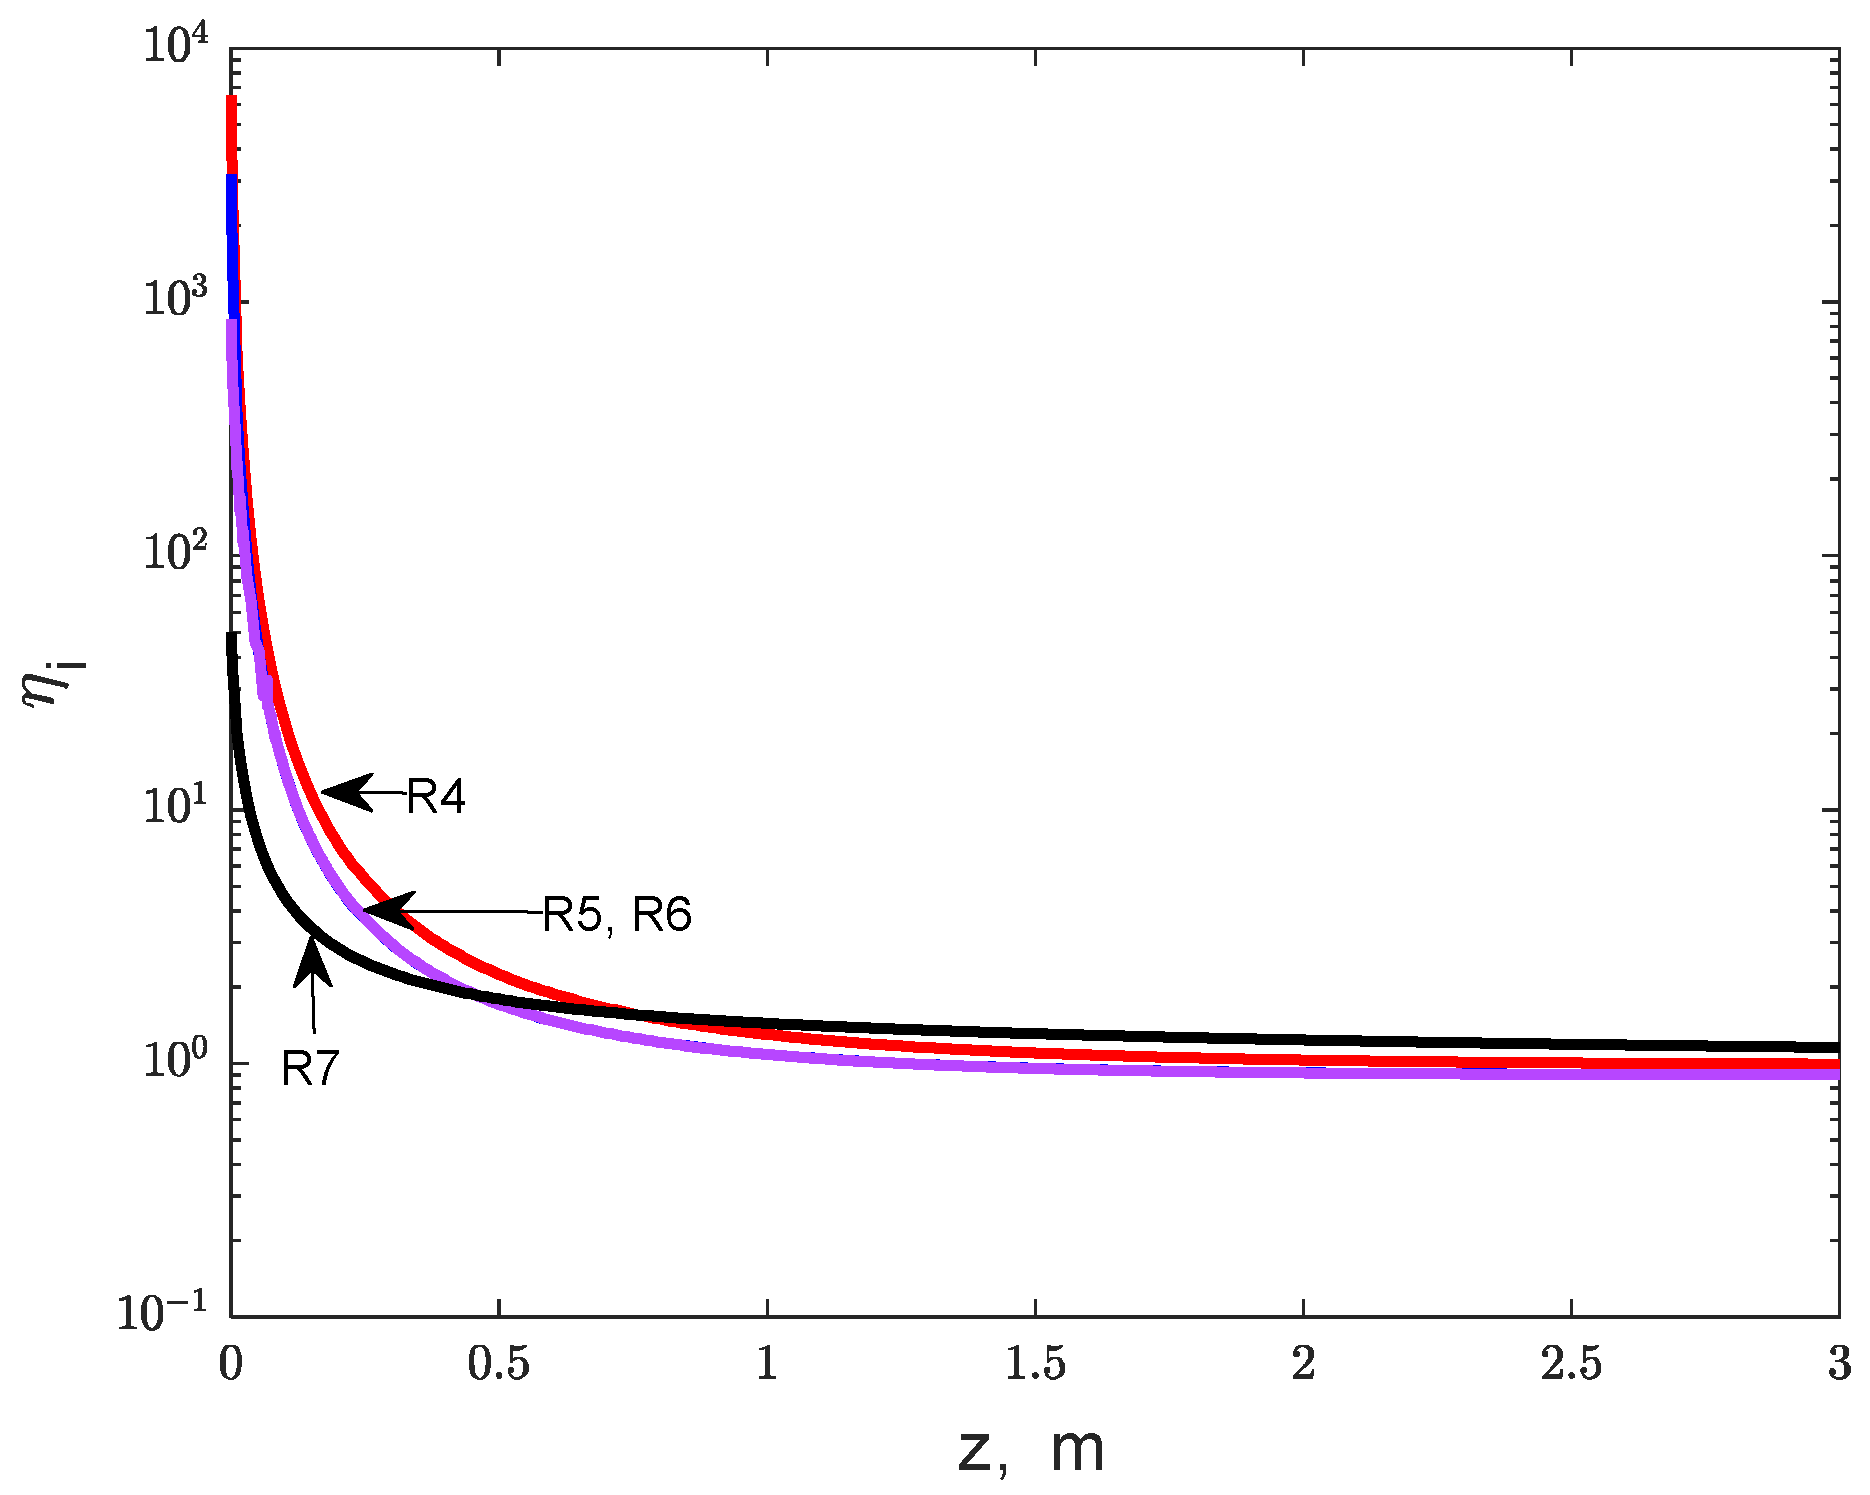
Nevertheless, the effectiveness factors for reactions R4 to R7 (involving the transformation of intermediary products) highlight a favorable effect of internal diffusion, as the values are significantly above 1 near the feed section of the bed, decreasing to values close to 1 along the bed (
Figure 4). This reflects a positive influence of internal diffusion on these reactions’ kinetics as a consequence of the intermediary products accumulation inside the catalyst particle, favored by a slow internal diffusion.
The numerical integration of the particle mass balance Equation (10) is a time-consuming activity. Therefore, when there are required repetitive integrations, such as in optimization calculations, the implementation of the heterogeneous model presented above becomes cumbersome. To mitigate this inconvenience, we correlated the internal effectiveness factors for the first three reactions with respect to the reaction temperature by the empirical relations:
The parameters a
i, b
i, and c
i were estimated by the least-square method from the corresponding effectiveness factor values given in
Figure 3, calculated by the integration of balance equations in the particle. The estimated values of the parameters are given in
Table 3. For reactions R4 to R7, we considered constant effectiveness factors along the bed, η
i = 1, i = 4,..7.
Once the internal effectiveness factors are available, the average reaction rates in the catalyst particle,
, can be calculated from the relation (14). Note that, in this relation, v
Ri,s is evaluated at temperature and composition in the gas convective zone (external concentration and temperature gradients are negligible). In all calculations related to the MTR, the feed reaction temperature was considered equal to the heating fluid temperature and the feed composition was kept at the nominal level (
Table 2).
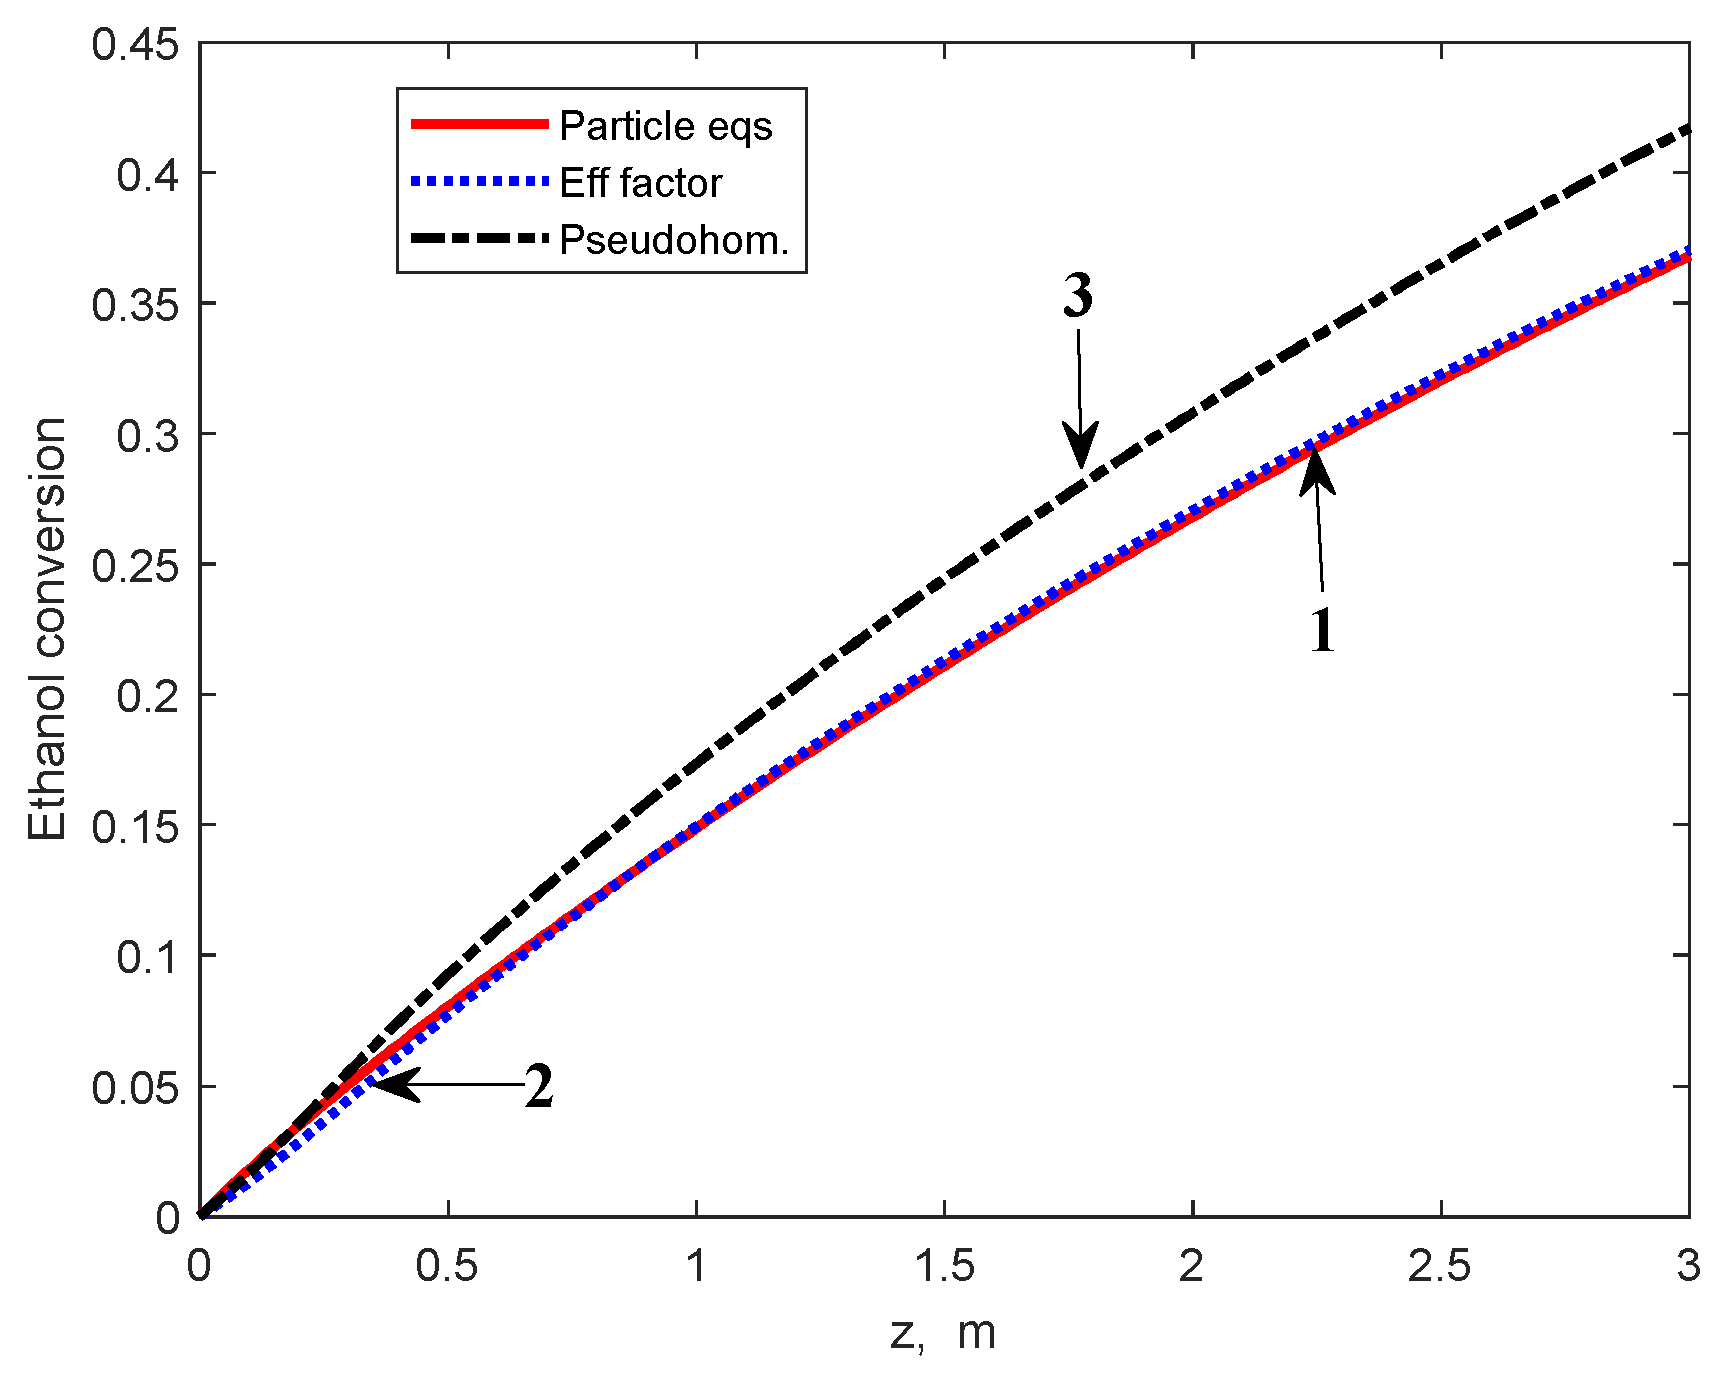
Results of the MTR simulation, using the effectiveness factors calculated by relation (14), are presented in
Figure 5,
Figure 6 and
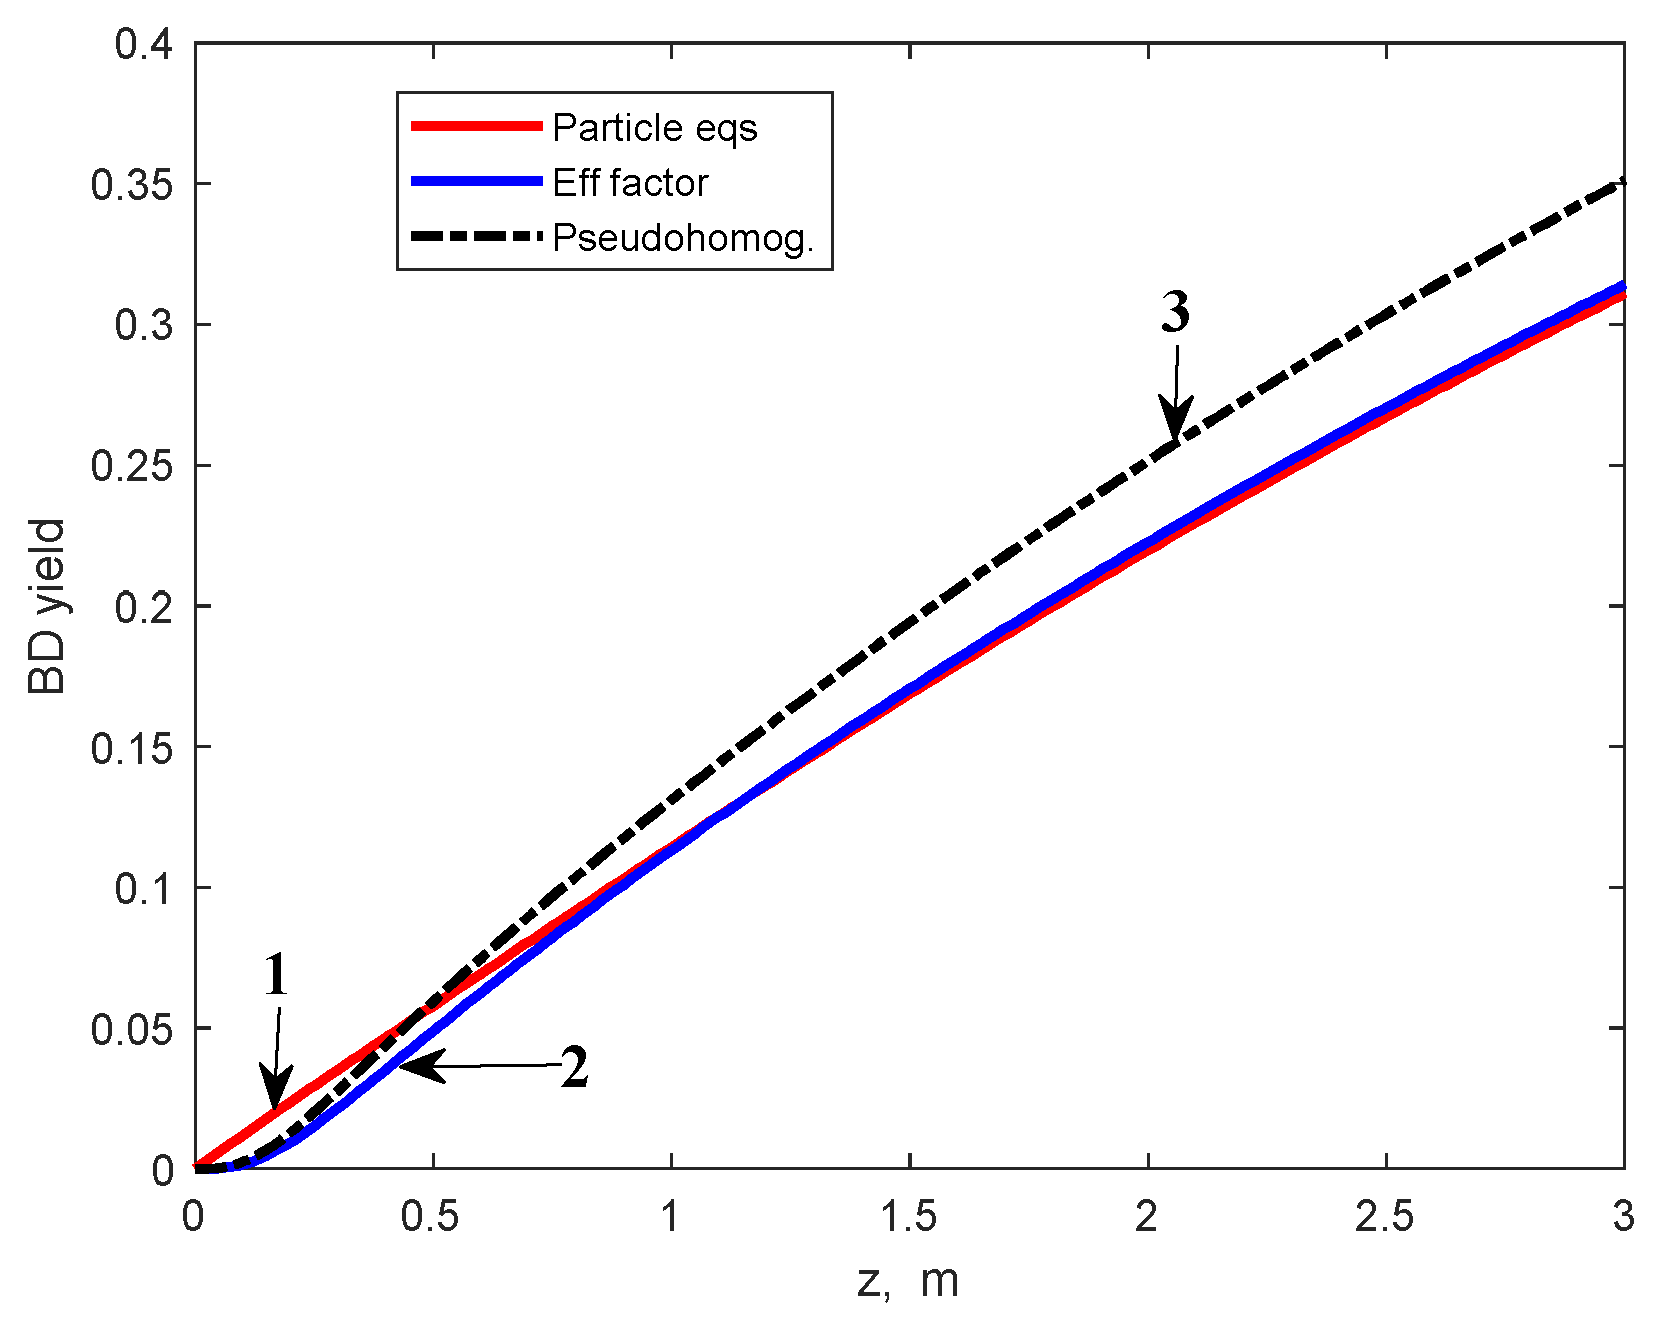
Figure 7. These findings are compared with results obtained from the heterogeneous model, including the integration of the particle balance equations, and the PO model. As can be observed from these figures, the results obtained using the PO model are rather different from those of the heterogeneous model: ~5 percent units for ethanol conversion, ~4 percent units for BD yield, and up to 3.5 K for reaction temperature.
Note that the ethanol conversion and BD yield calculated by using the PO model are slightly higher as a result of disregarding the internal diffusion limitations and, consequently, the reaction temperature values are lower due to the endothermal character of the chemical transformation.
As can be observed from these figures, the curves calculated using the effectiveness factors superpose well on those calculated using the heterogeneous model. A minor deviation appears for the BD yield curve due to neglecting the values of η
i greater than 1 for reactions R4 to R7. However, the deviation is relatively small and vanishes after approximately 1 m of the catalyst bed (
Figure 6). Based on these results, in the calculations subsequently presented, we used the effectiveness factors calculated from the relation (14) (hereafter referred to as the “effectiveness factor model”), instead of the particle mass balance Equation (10).
3.3. A Comparison of the Multibed Adiabatic Reactors and the Multitubular Reactor
The comparison was performed using the “effectiveness factors model” for the nominal parameters given in
Table 2. The smallest BD yield values correspond to MBAR with inter-bed heating by injection of hot reactant (
Figure 1A). A key factor leading to this result is the decrease of the reaction (contact) time due to the reactant bypassing the catalyst beds. Our calculations provide evidence that the best results reachable in this reactor correspond to a single adiabatic bed.
In the MBAR with indirect heating (
Figure 1B), the reaction contact time is longer, resulting in higher ethanol conversion and BD yield. Considering identical inlet temperatures in the beds, equal to the maximum value (673 K), for given values of catalyst weight and feed rate, the performances of this reaction system increase with the number of beds and tend towards those of the isothermal reactor operated at the feed temperature.
Table 4 presents two MBAR simulations, considering four and six beds. As can be observed, the four-bed MBAR is less performant than the MTR but a six-bed MBAR has practically the same performance as MTR. These differences are explained by the temperature level in the catalyst bed. Increasing the number of catalyst beds (reheating points) for the same catalyst weight, the average temperature increases, tending towards the isothermal regime. However, increasing the number of catalyst beds augments the reactor construction cost (higher number of reactor internals, higher number of heat exchangers, and higher consumption of heating fluid).
Therefore, typically, up to four catalyst beds are used in this type of catalytic reactor [
18].
To ensure constant temperature of the heating fluid in the MTR (avoiding the subcooling of Dowtherm condensate), the feed rate of saturated Dowtherm vapors should be higher than 5664 kg/h (calculated from Equation (8)).
3.4. Reactor Optimization
In this paragraph, the comparative results of an optimization study are presented for the four-bed MBAR with indirect heating and MTR, respectively. Three classical objective functions have been considered: BD yield (ηBD), BD production rate (FBD), and a simple function approximating the profit of reactor operation (PBD). For the four-bed MBAR, the independent optimization variables are the feed flow rate, bed inlet temperatures, and the catalyst beds heights. The independent variables considered in the optimization of the MTR are the heating fluid temperature and the reaction mixture feed flow rate. The operating variable values are restricted to the corresponding experimental domains used in the formulation of the kinetic model. Thus, the temperature of heating fluid was limited up to 673 K and the feed flow rate in the limits corresponding to space velocities, 0.31 h−1 ≤ WHSV ≤ 2.49 h−1.
Due to the endothermic nature of the transformation and the strong dependence of its kinetics on temperature, the optimal temperature value is the maximum allowed (673 K) in all analyzed problems. The calculations were carried out using the Matlab function “fmincon” and the results are presented in
Table 5.
- (a)
Maximizing the BD yield
As expected, the maximum BD yield is obtained for feed flow rates close to minimum level (906.2 kg/h) and maximum allowed temperature. The optimal BD yield is slightly higher for the multitubular reactor due to better heating of the catalyst beds. Although the BD yields are higher than those corresponding to the nominal regime (
Table 2), the catalyst productivities are lower due to the lower ethanol feed rates.
- (b)
Maximization of the BD production
The reactor BD production (outlet BD mass rate) is directly proportional to the mass flow rate and BD yield, so the maximum of BD production is achieved as a compromise between high flow rates (corresponding to low BD yields) and high BD yields (corresponding to small flow rates). The maximum BD production is ~663 kg/h (0.261 kg BD/kgcat h) for the MBAR and ~714 kg/h (0.281 kg BD/kgcat h) for the MTR, the last corresponding to feed mass flow rates around 7300 kg/h and relatively low BD yields (under 20%). Thus, compared to the nominal regime, an increase in BD production is obtained but with an increase in recycling costs. Consequently, the most rational operating regime appears to be a trade-off between the maximization of BD production and the minimization of ethanol and inert recycling.
- (c)
A simple objective function of economical nature
The aforementioned trade-off can be defined by the maximization of the profit from reactor operation. A simplified expression of this profit could be the difference between the selling price of the BD produced in the reactor and the separation and recycling cost of untransformed ethanol and inert:
The maximum level of this function depends essentially on the BD market price and the cost of energy (separation and recycling being energy-consuming operations). The market price of BD is taken as 2 USD/kg [
19]. In
Table 5, the dependencies of optimization results on the ratio C
sep/p
BD are presented
. Increasing the cost of ethanol and inert separation and recycling (C
sep/p
BD), the maximum of the objective function is attained at relatively small mass feed rates and, consequently, high ethanol conversions (high reaction times), these conditions leading to relatively small expenses associated with recycling. Conversely, at smaller separation and recycling costs, the optimal regime corresponds to higher mass flow rates, smaller ethanol conversions, higher BD production rates, and higher recycles. The objective function values, f, are up to 17% higher for the multitubular reactor, as compared with the four-bed MBAR (consequence of higher ethanol conversions and BD yields).
The results presented above prove that, for a typical number of beds (less than six), the multitubular reactor is superior to the adiabatic multitubular reactor with inter-bed heating.
4. Conclusions
In this work, the performances of the main fixed-bed reactors in the Lebedev process of ethanol transformation to butadiene were compared using mathematical modeling and simulation techniques.
The mathematical model used in the study takes into account the transformation characteristics at both the catalyst particle and catalyst bed scales, using a published kinetic model developed for a modified MgO–SiO2 catalyst. The process simulation at the level of the catalyst particle evidenced significant kinetic limitations induced by the internal diffusion and negligible influences of mass and heat interphase (gas to particle) transfer. To reduce the complexity of the process model, empirical expressions were formulated to calculate the internal effectiveness factors associated with the reactions involving the conversion of ethanol to acetaldehyde and secondary products, respectively. Considering the endothermic nature of the global transformation and the high temperature dependence of process kinetics, all reactor simulations were performed at the maximum allowed temperature (400 °C). The multibed adiabatic reactor simulations have shown that better BD yields are obtained for inter-bed heating using heat exchangers. Nevertheless, these are inferior to those of the multitubular reactor, operated under similar conditions, if the number of catalyst beds is kept to typical values used in practice (inferior to six). The simulation studies, carried out for the multibed adiabatic reactor and the multitubular reactor, in the working domain particular for the construction of the kinetic model, highlighted that the ethanol conversion is limited (usually lower than 50%), this leading to important recycles of untransformed ethanol, in addition to the inert recycle. However, the low values of ethanol conversion are compensated by a relatively good BD selectivity.
The results of a preliminary optimization study evidenced that the maximization of BD yield corresponds to low reactor feed rate and BD production rate, respectively, whereas the maximization of BD production corresponds to a high flow rate, a relatively low BD yield, and high ethanol and inert recycles. A practical trade-off between the two trends can be achieved by maximizing the revenue generated by reactor operation.


