

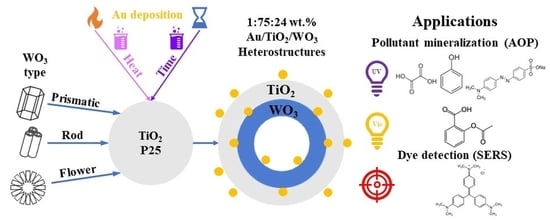
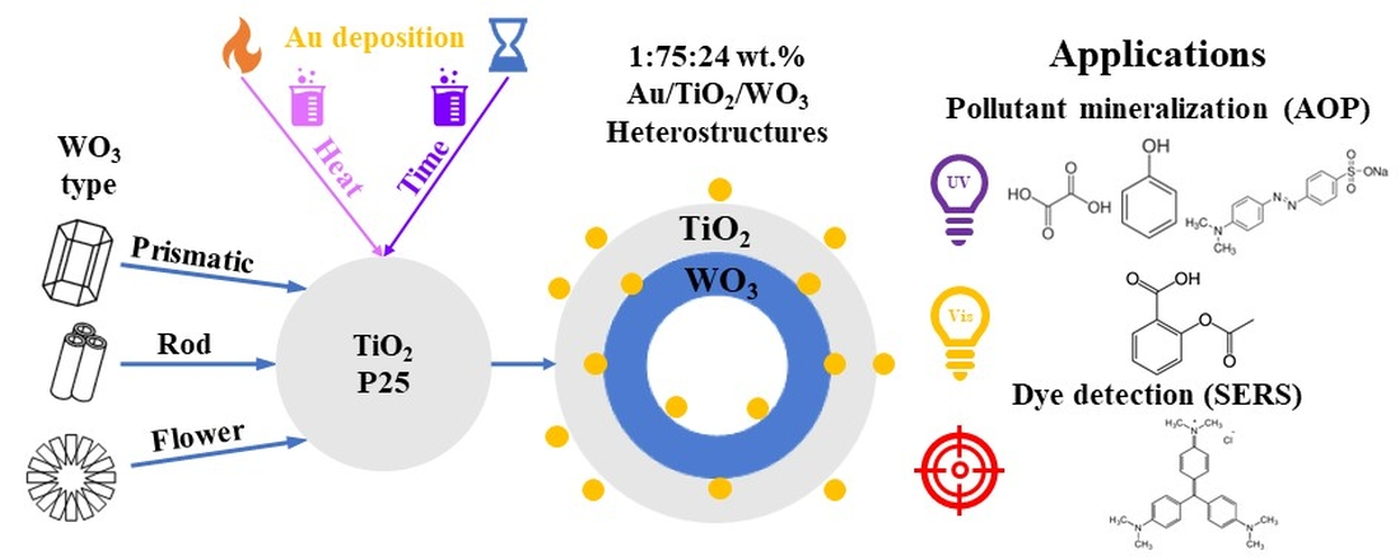
Tungsten Oxide Morphology-Dependent Au/TiO2/WO3 Heterostructures with Applications in Heterogenous Photocatalysis and Surface-Enhanced Raman Spectroscopy

 ,
, 
 ,
,  ,
,  and
and 
Abstract
1. Introduction
2. Results
2.1. TEM Investigations
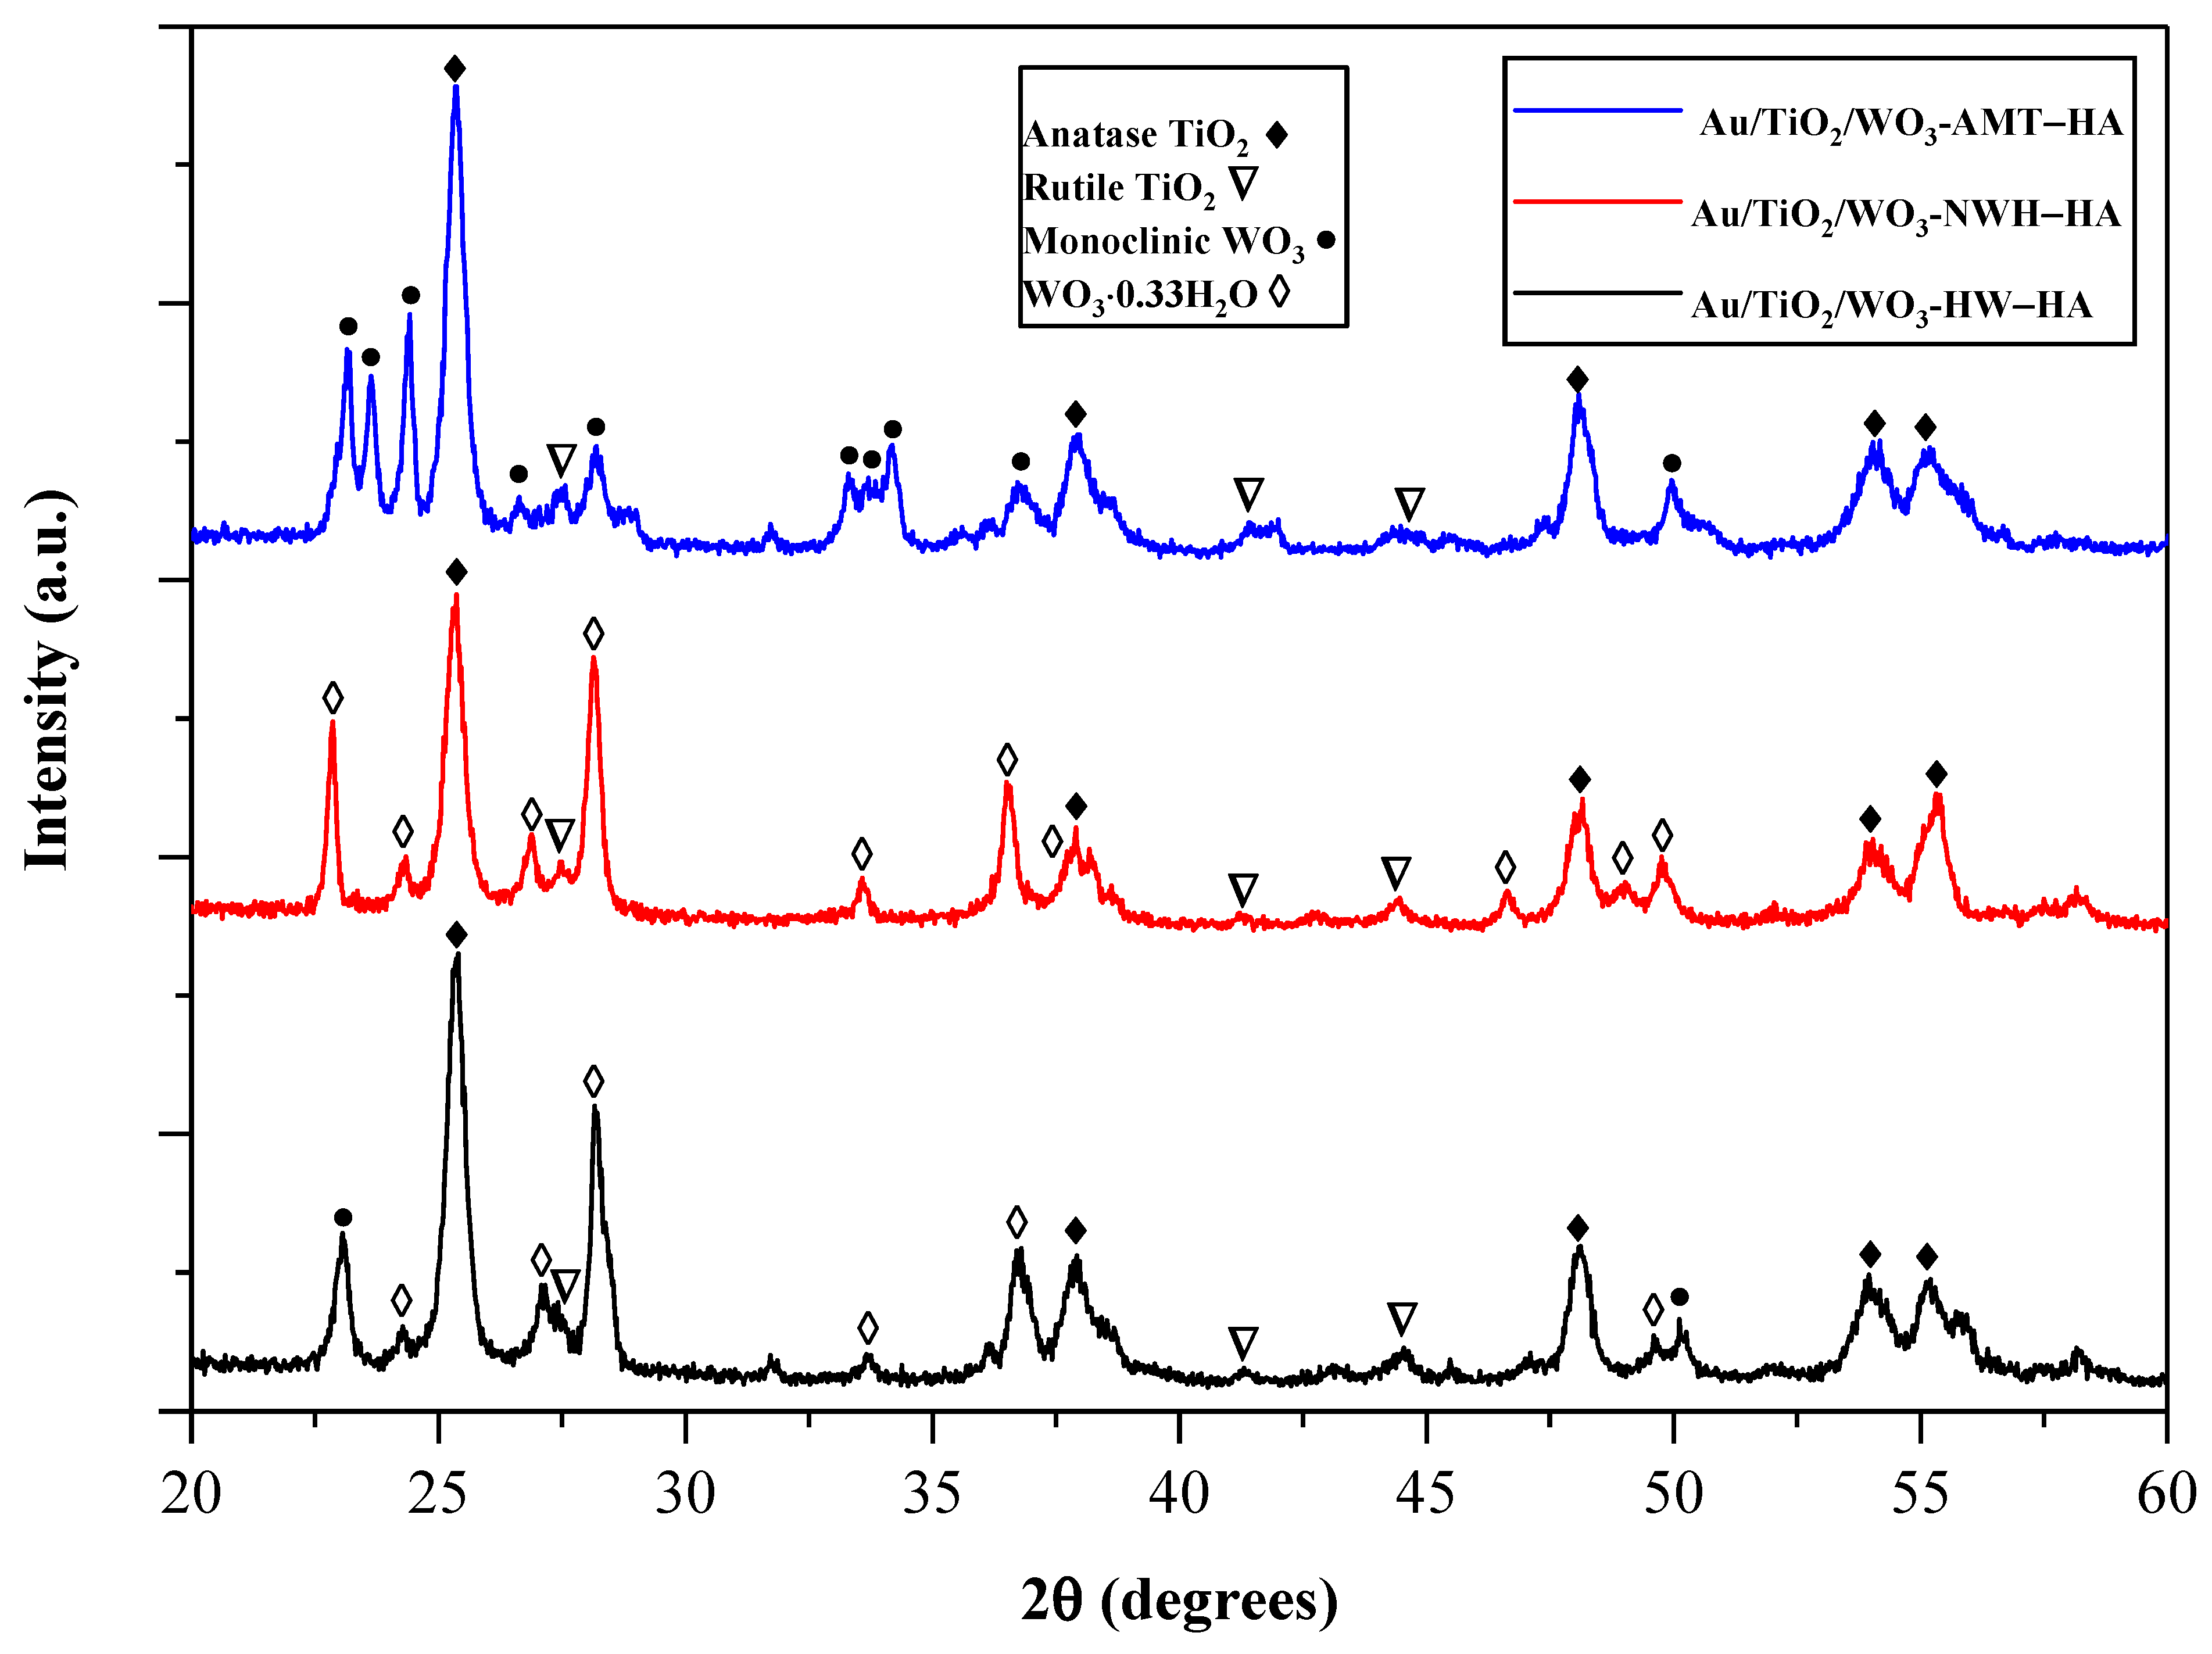
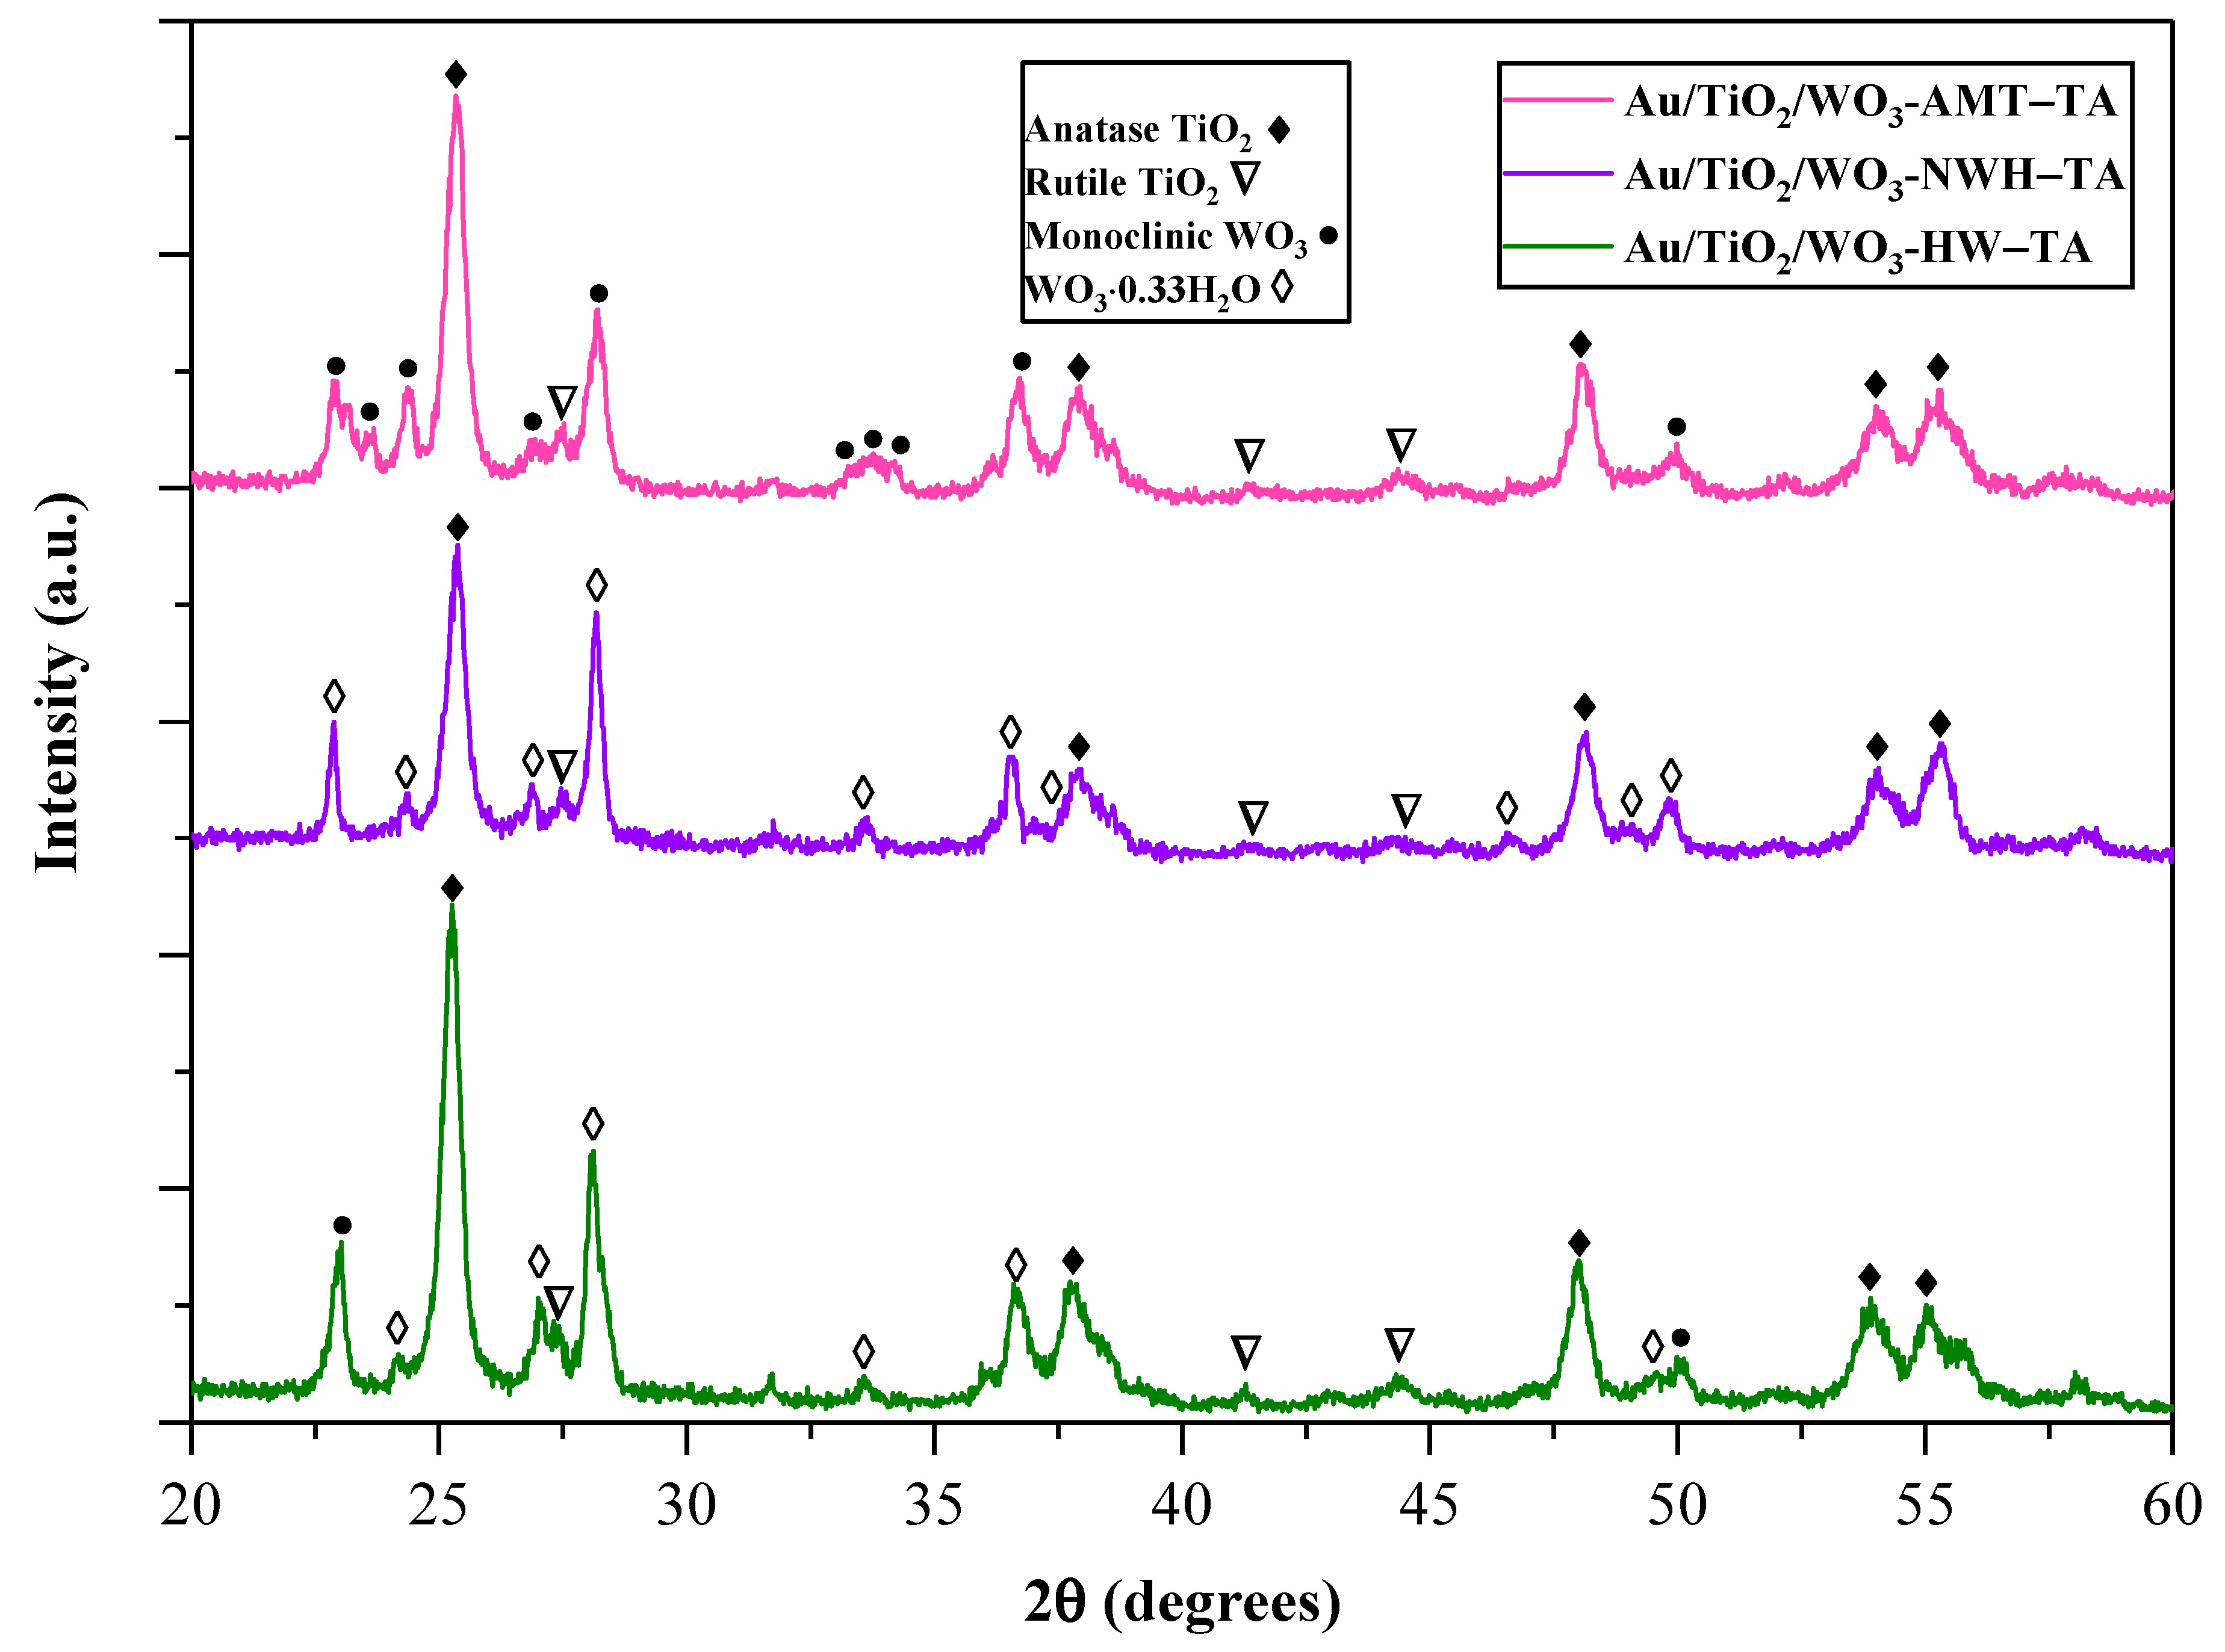
2.2. X-ray Diffraction Analysis
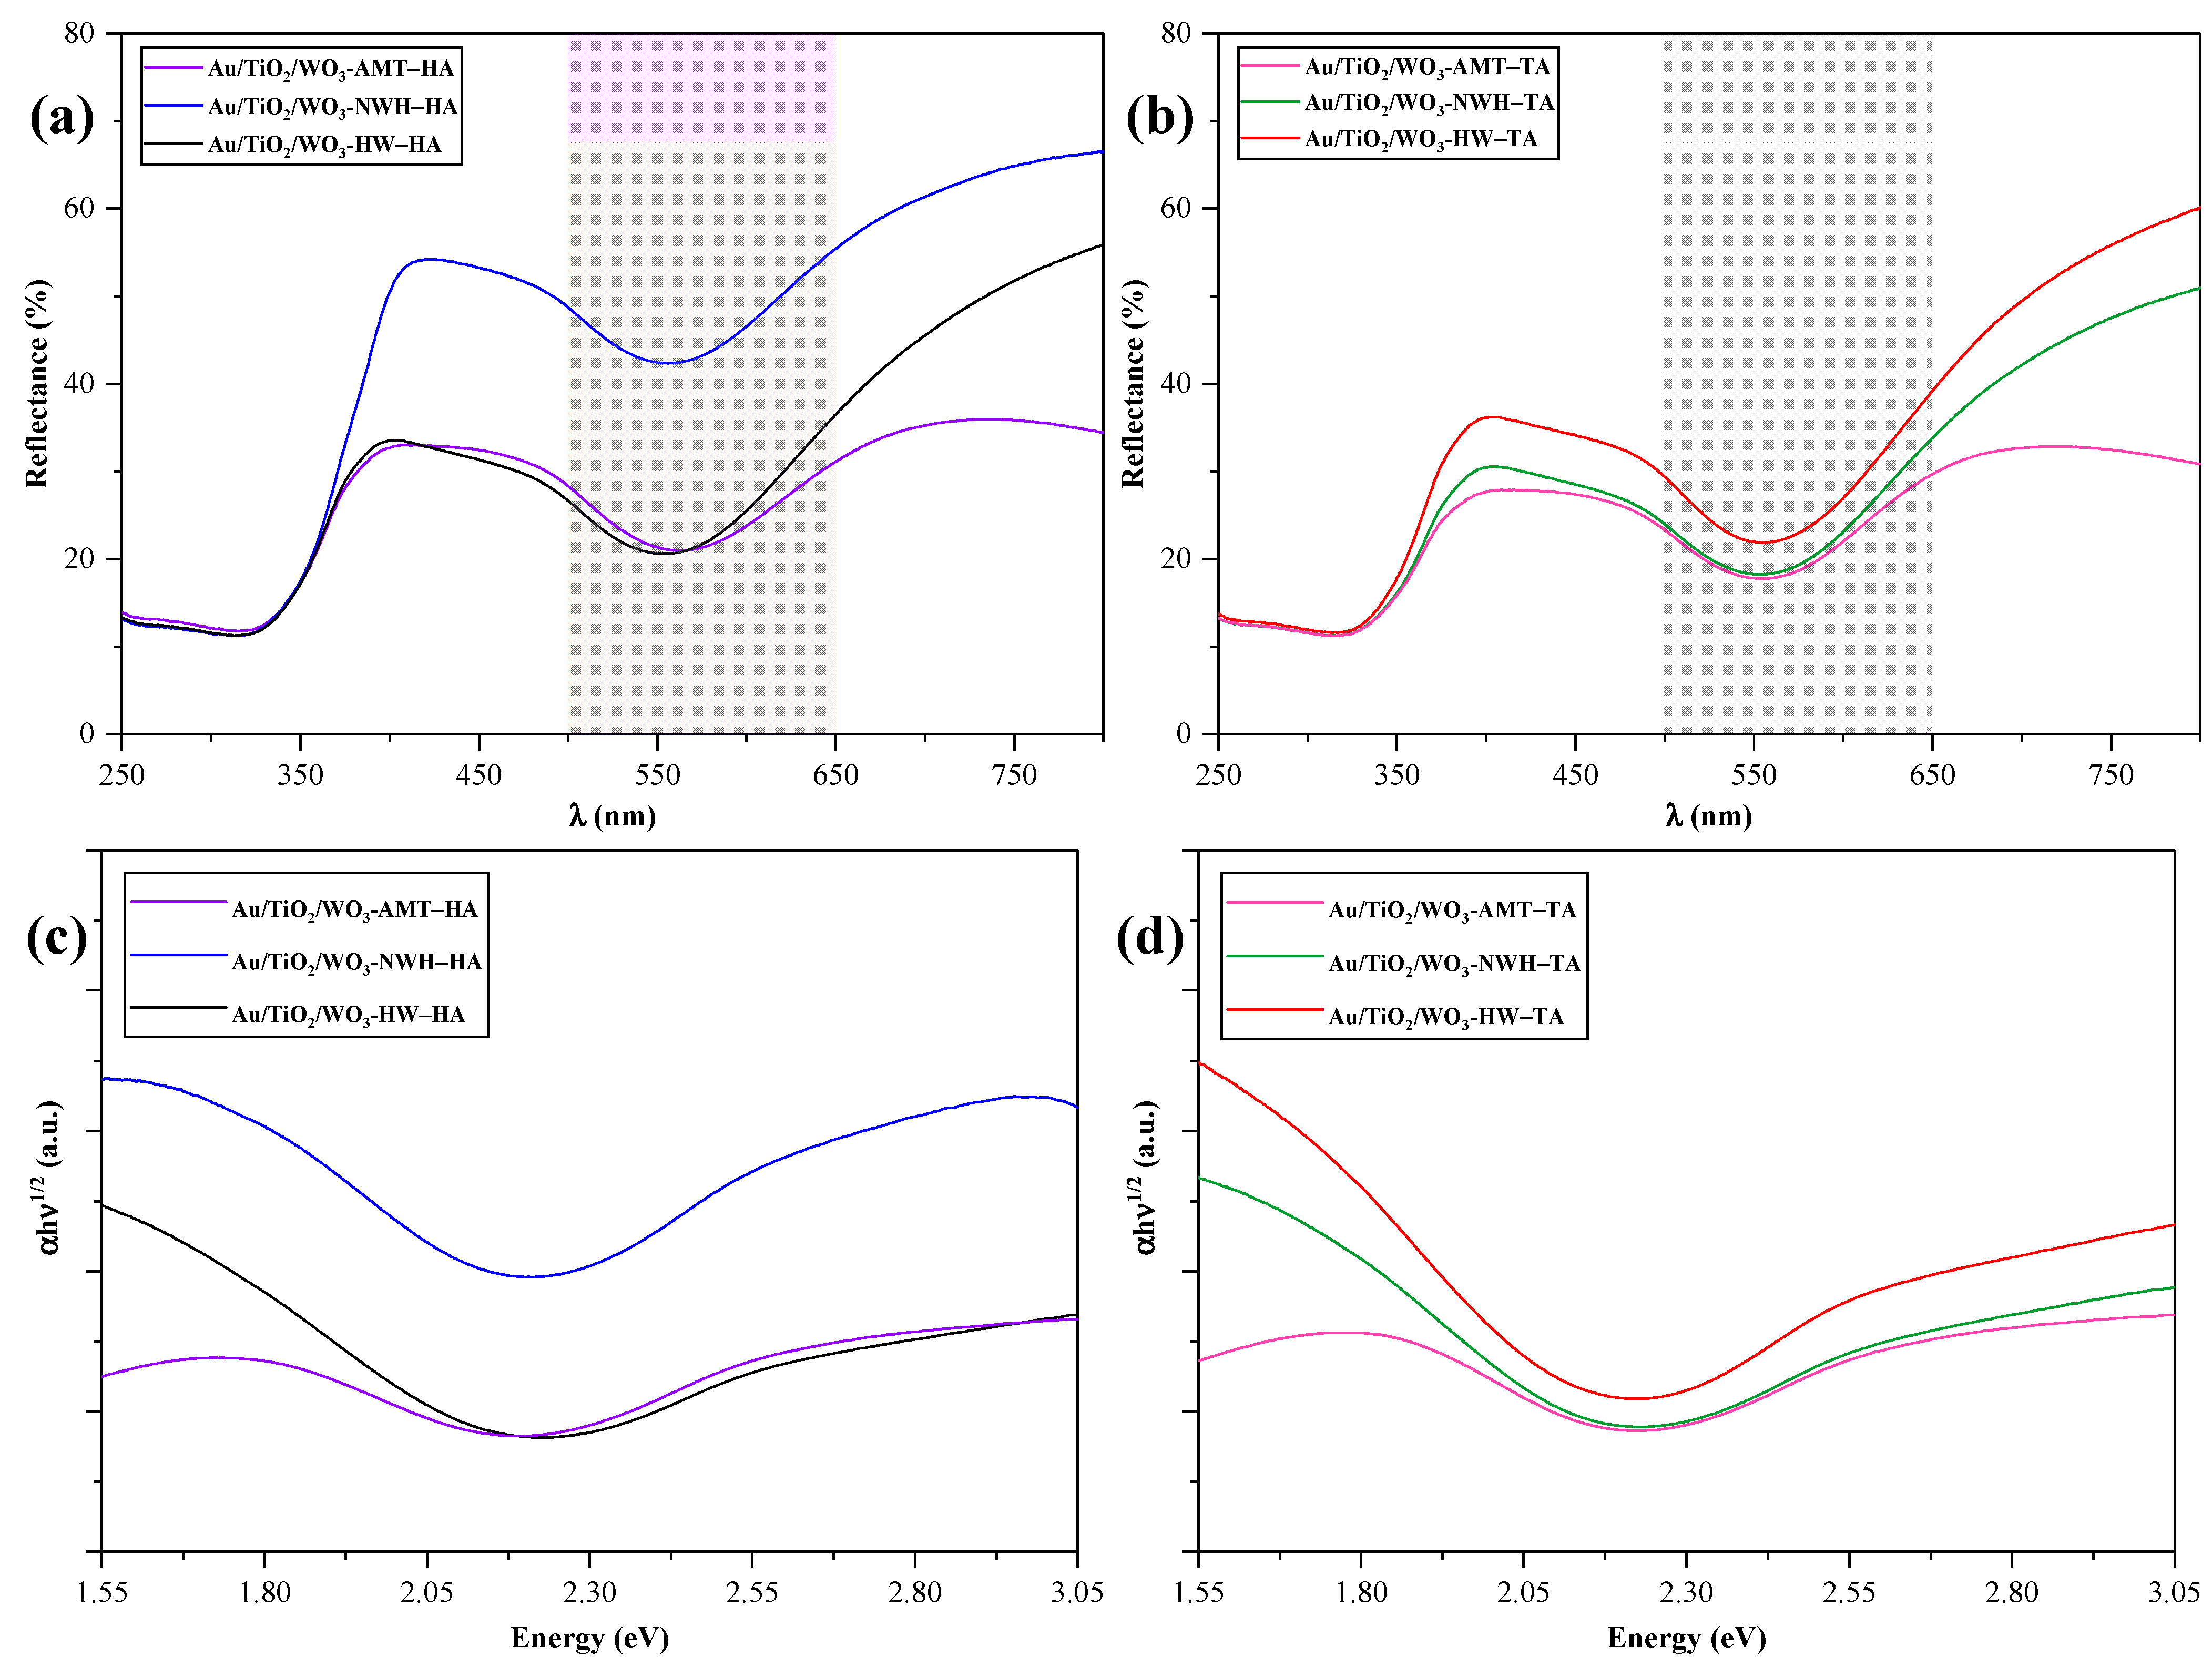
2.3. Optical Properties
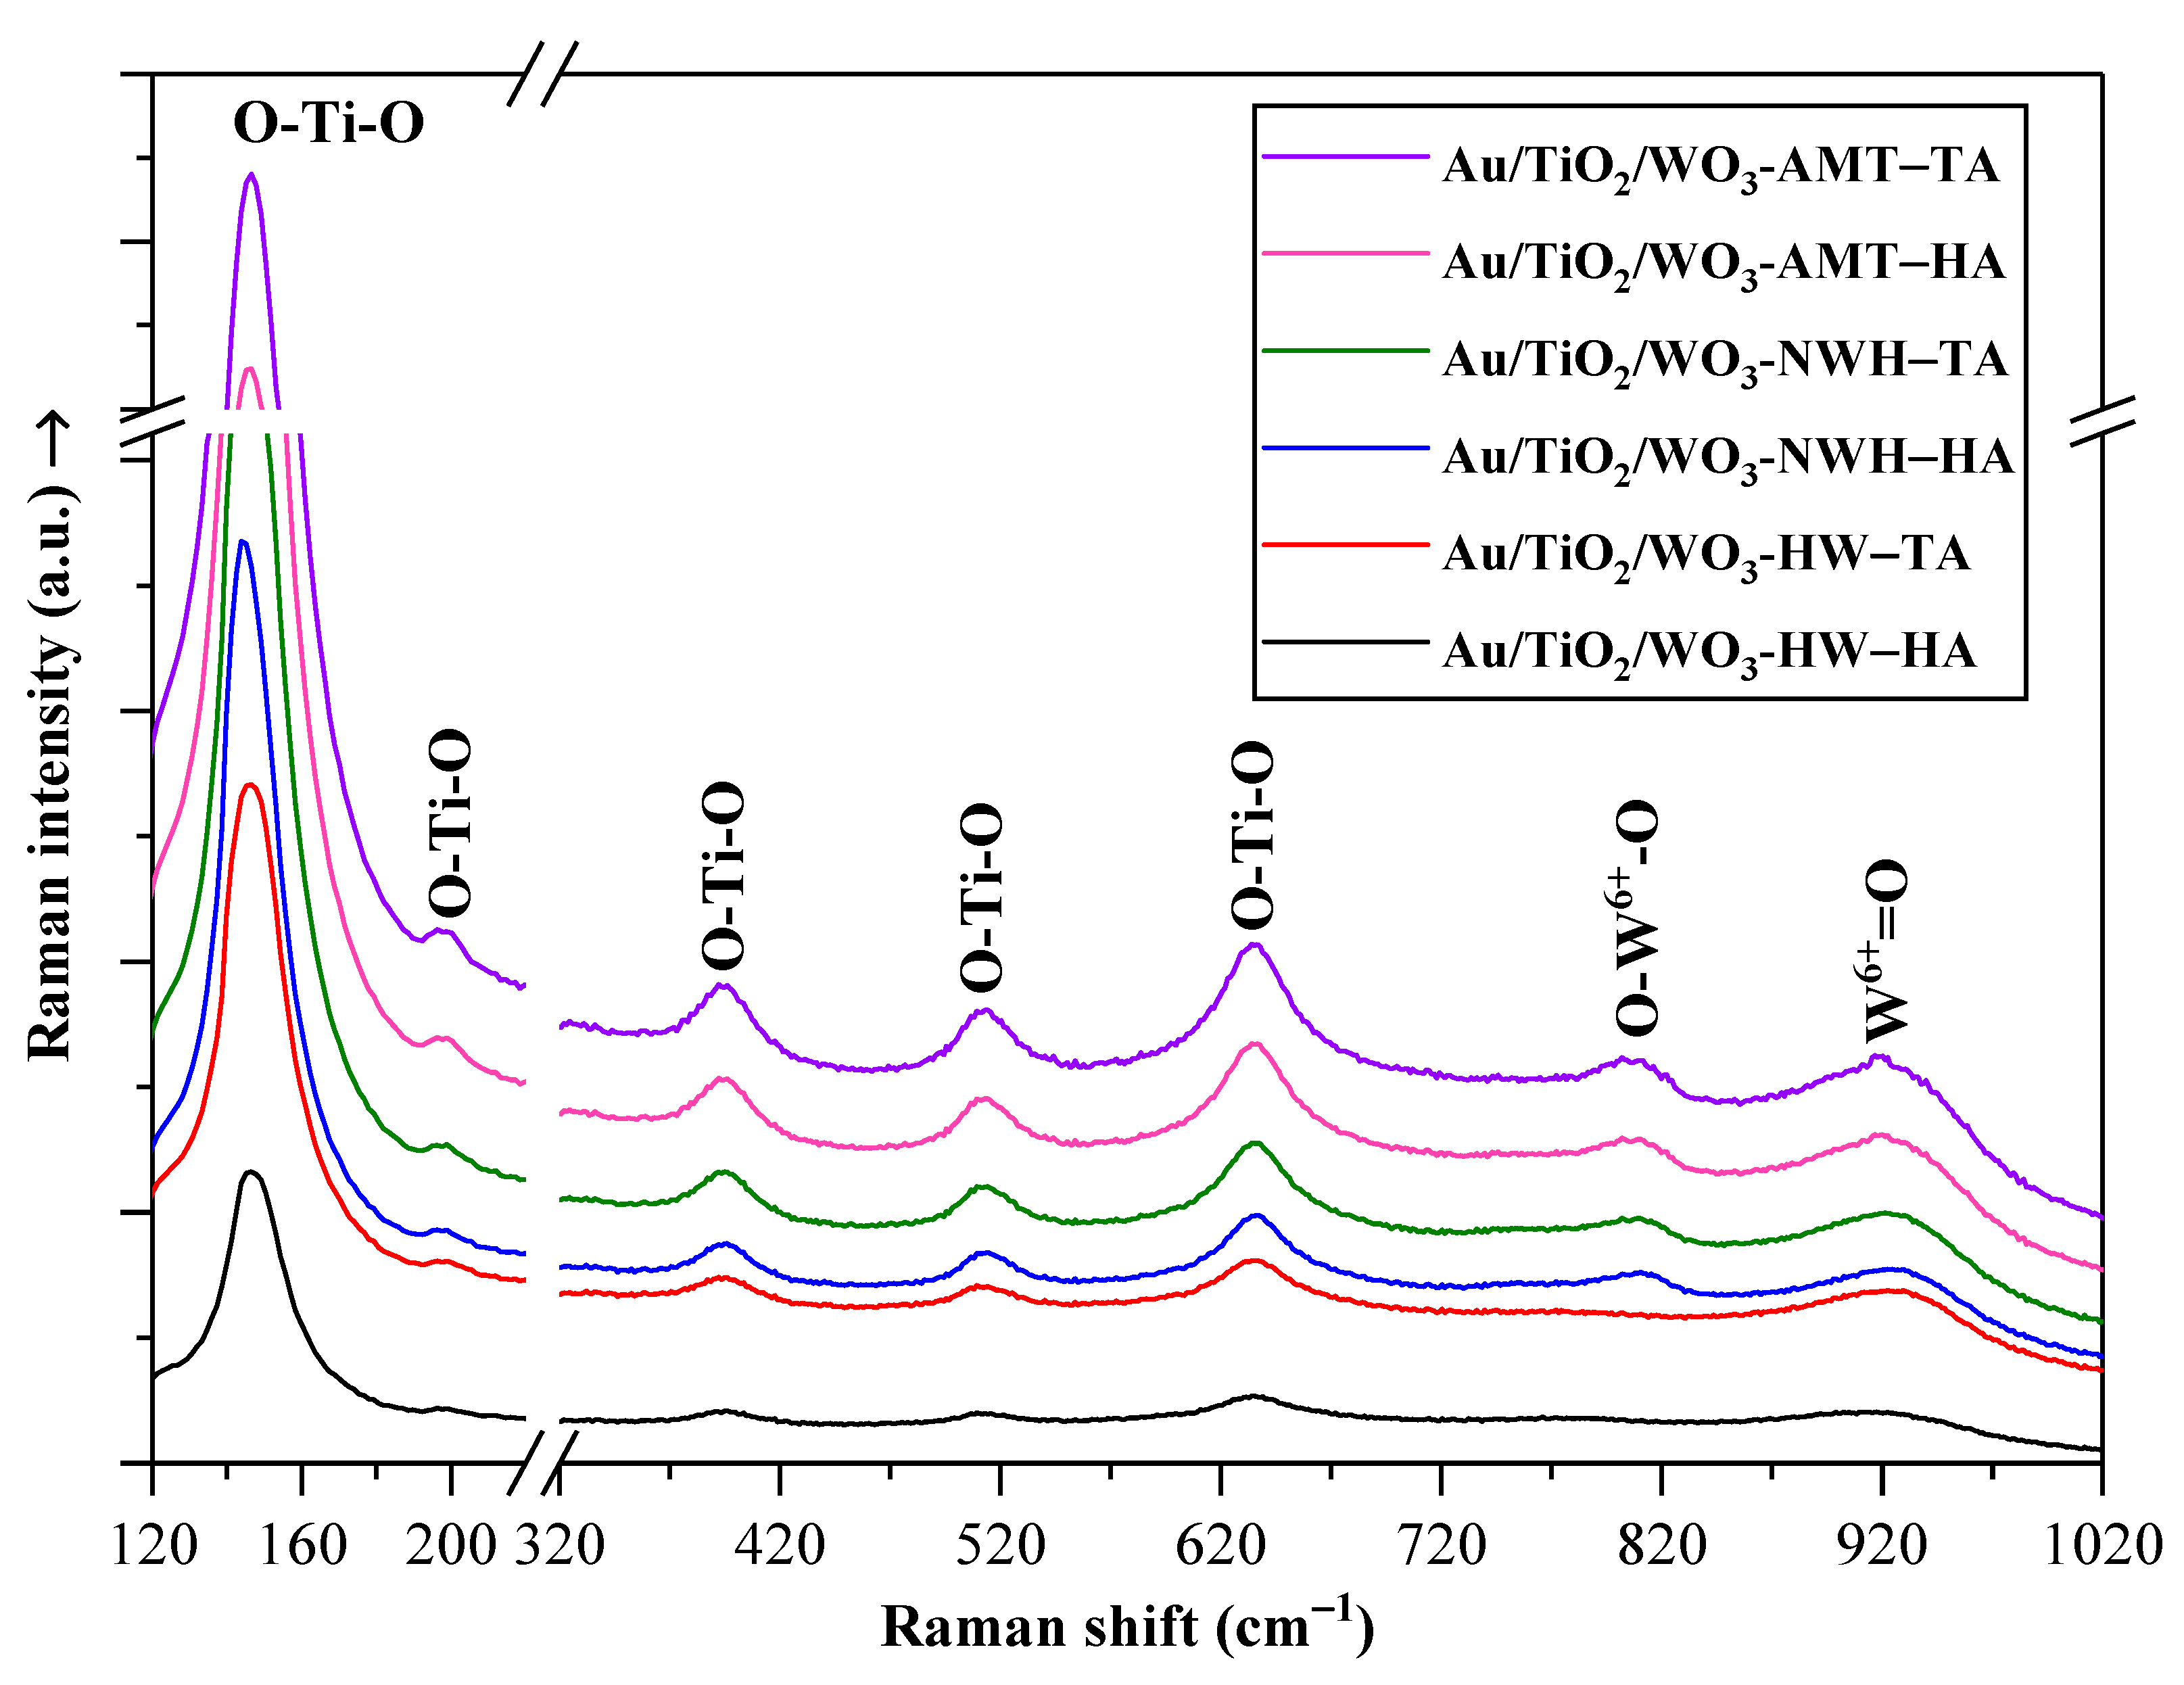
2.4. Raman Spectroscopy
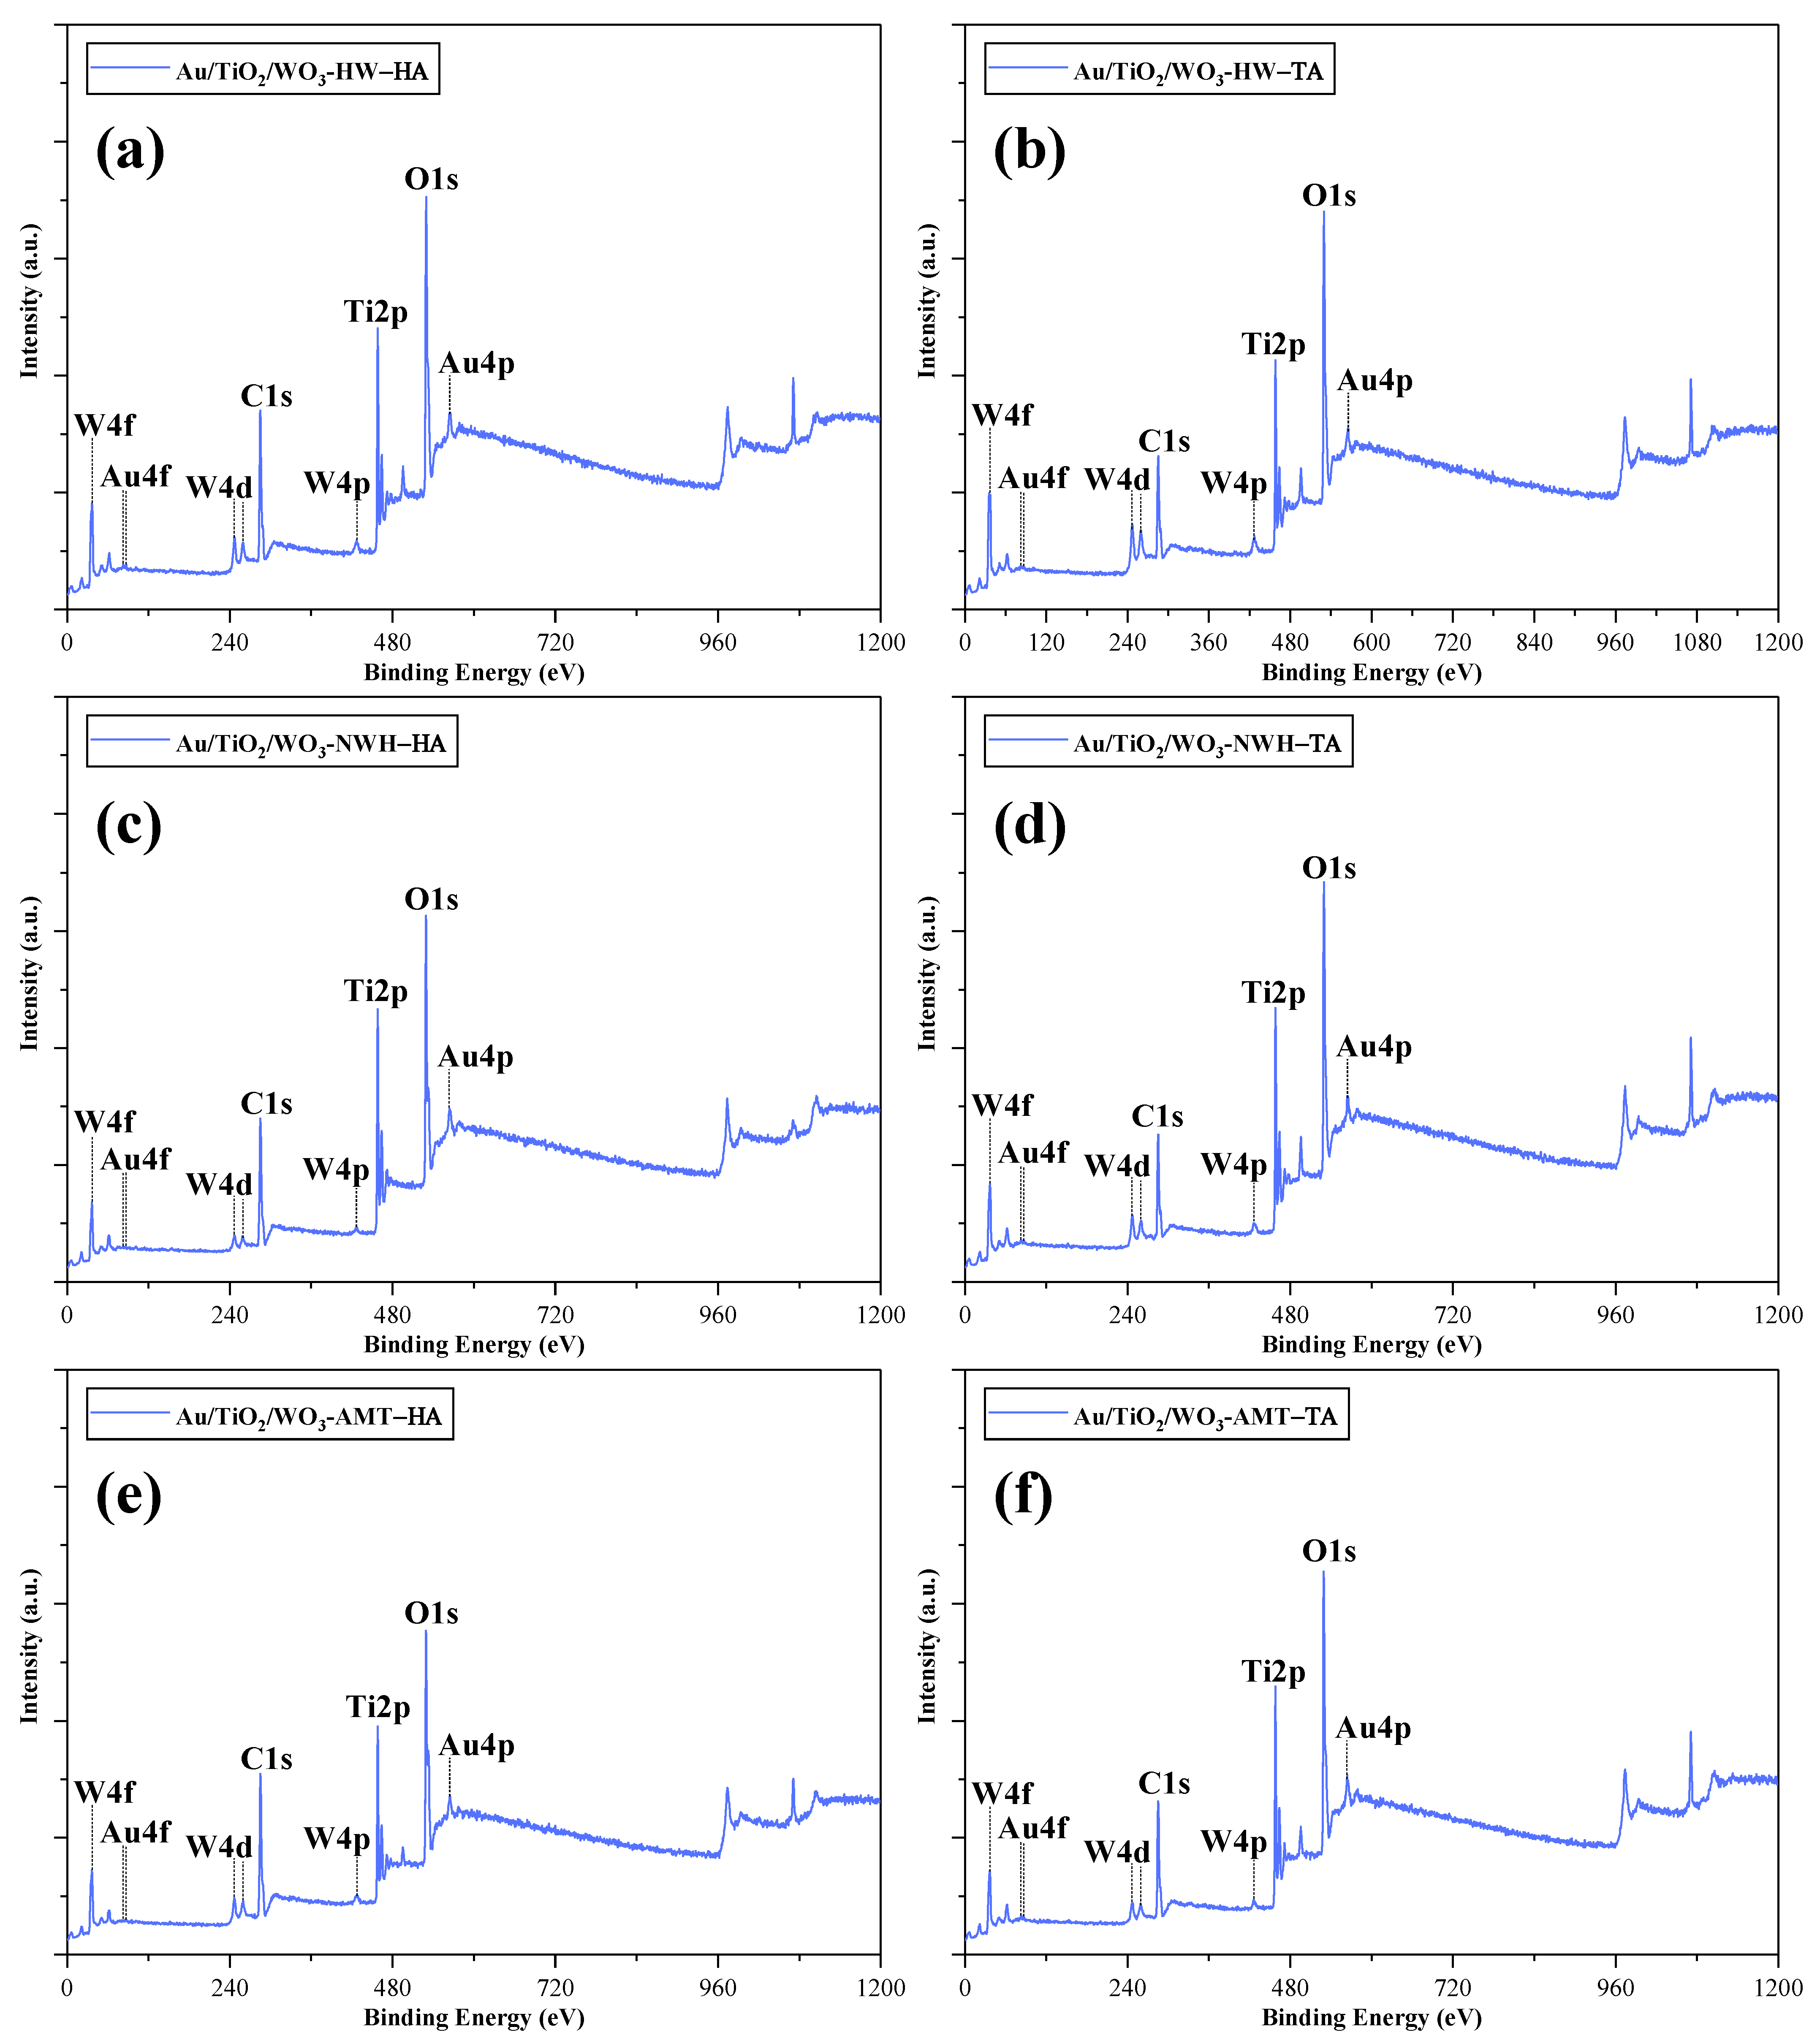
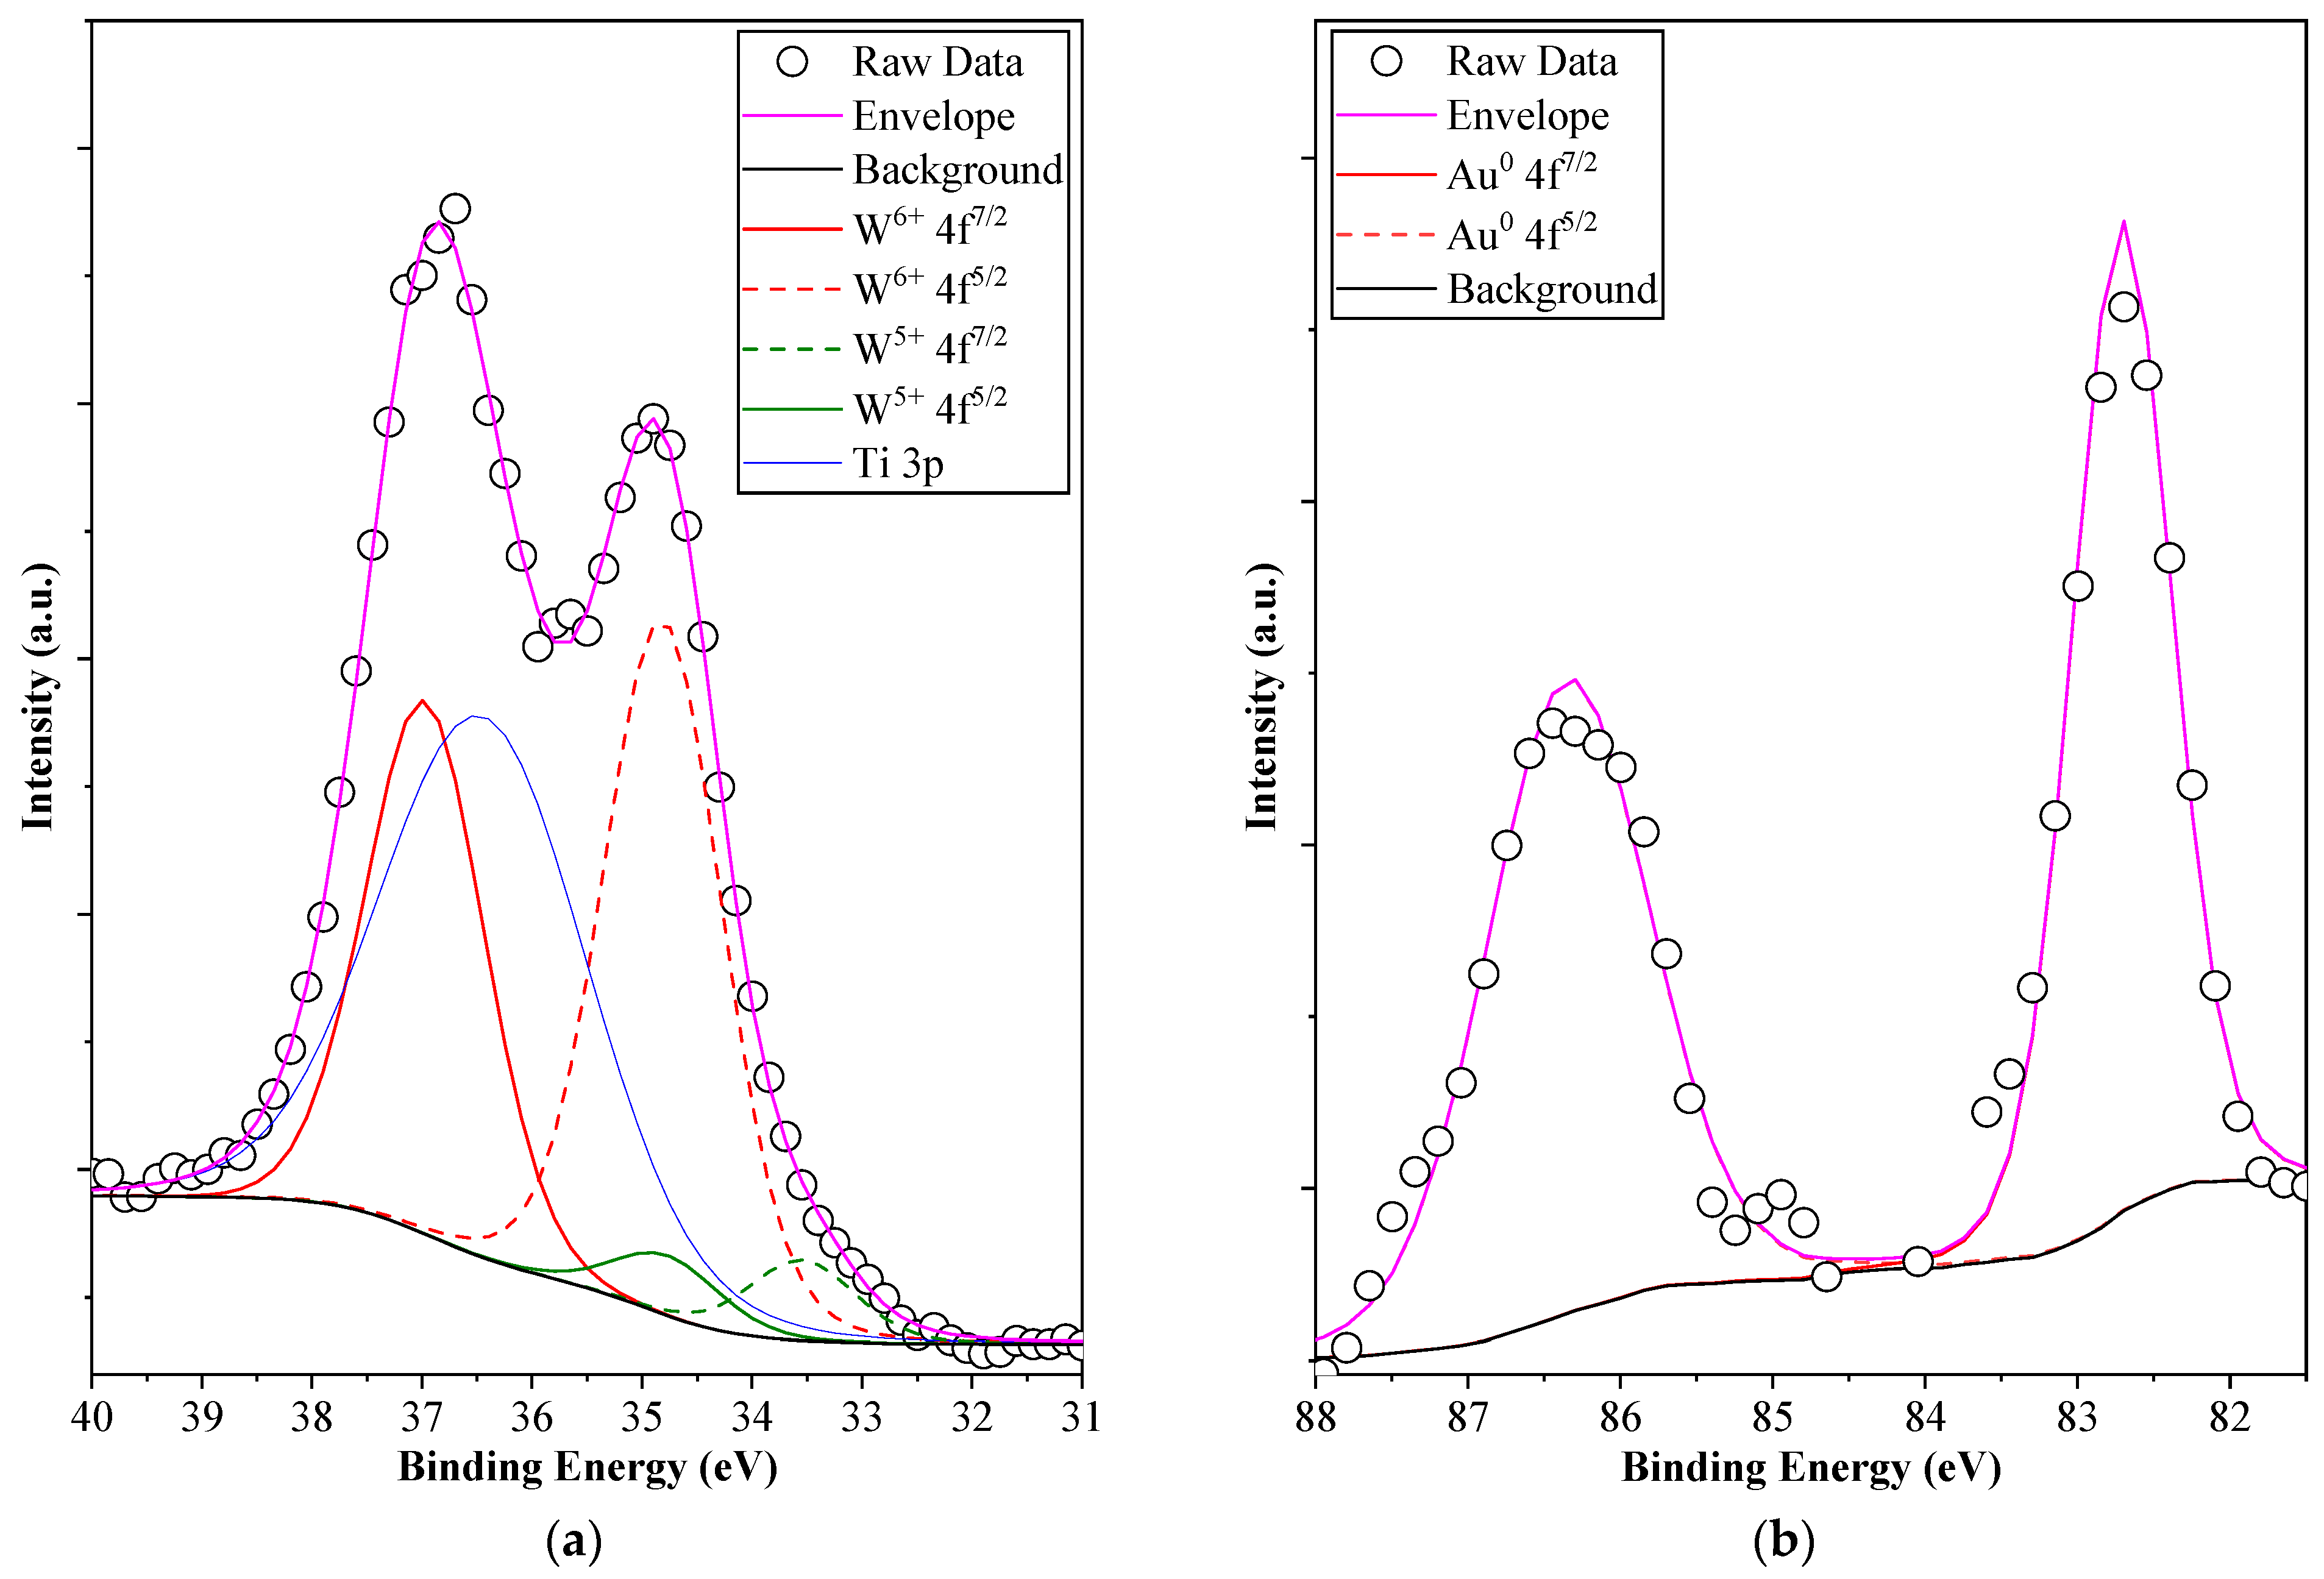
2.5. X-ray Photoelectron Spectroscopy (XPS)
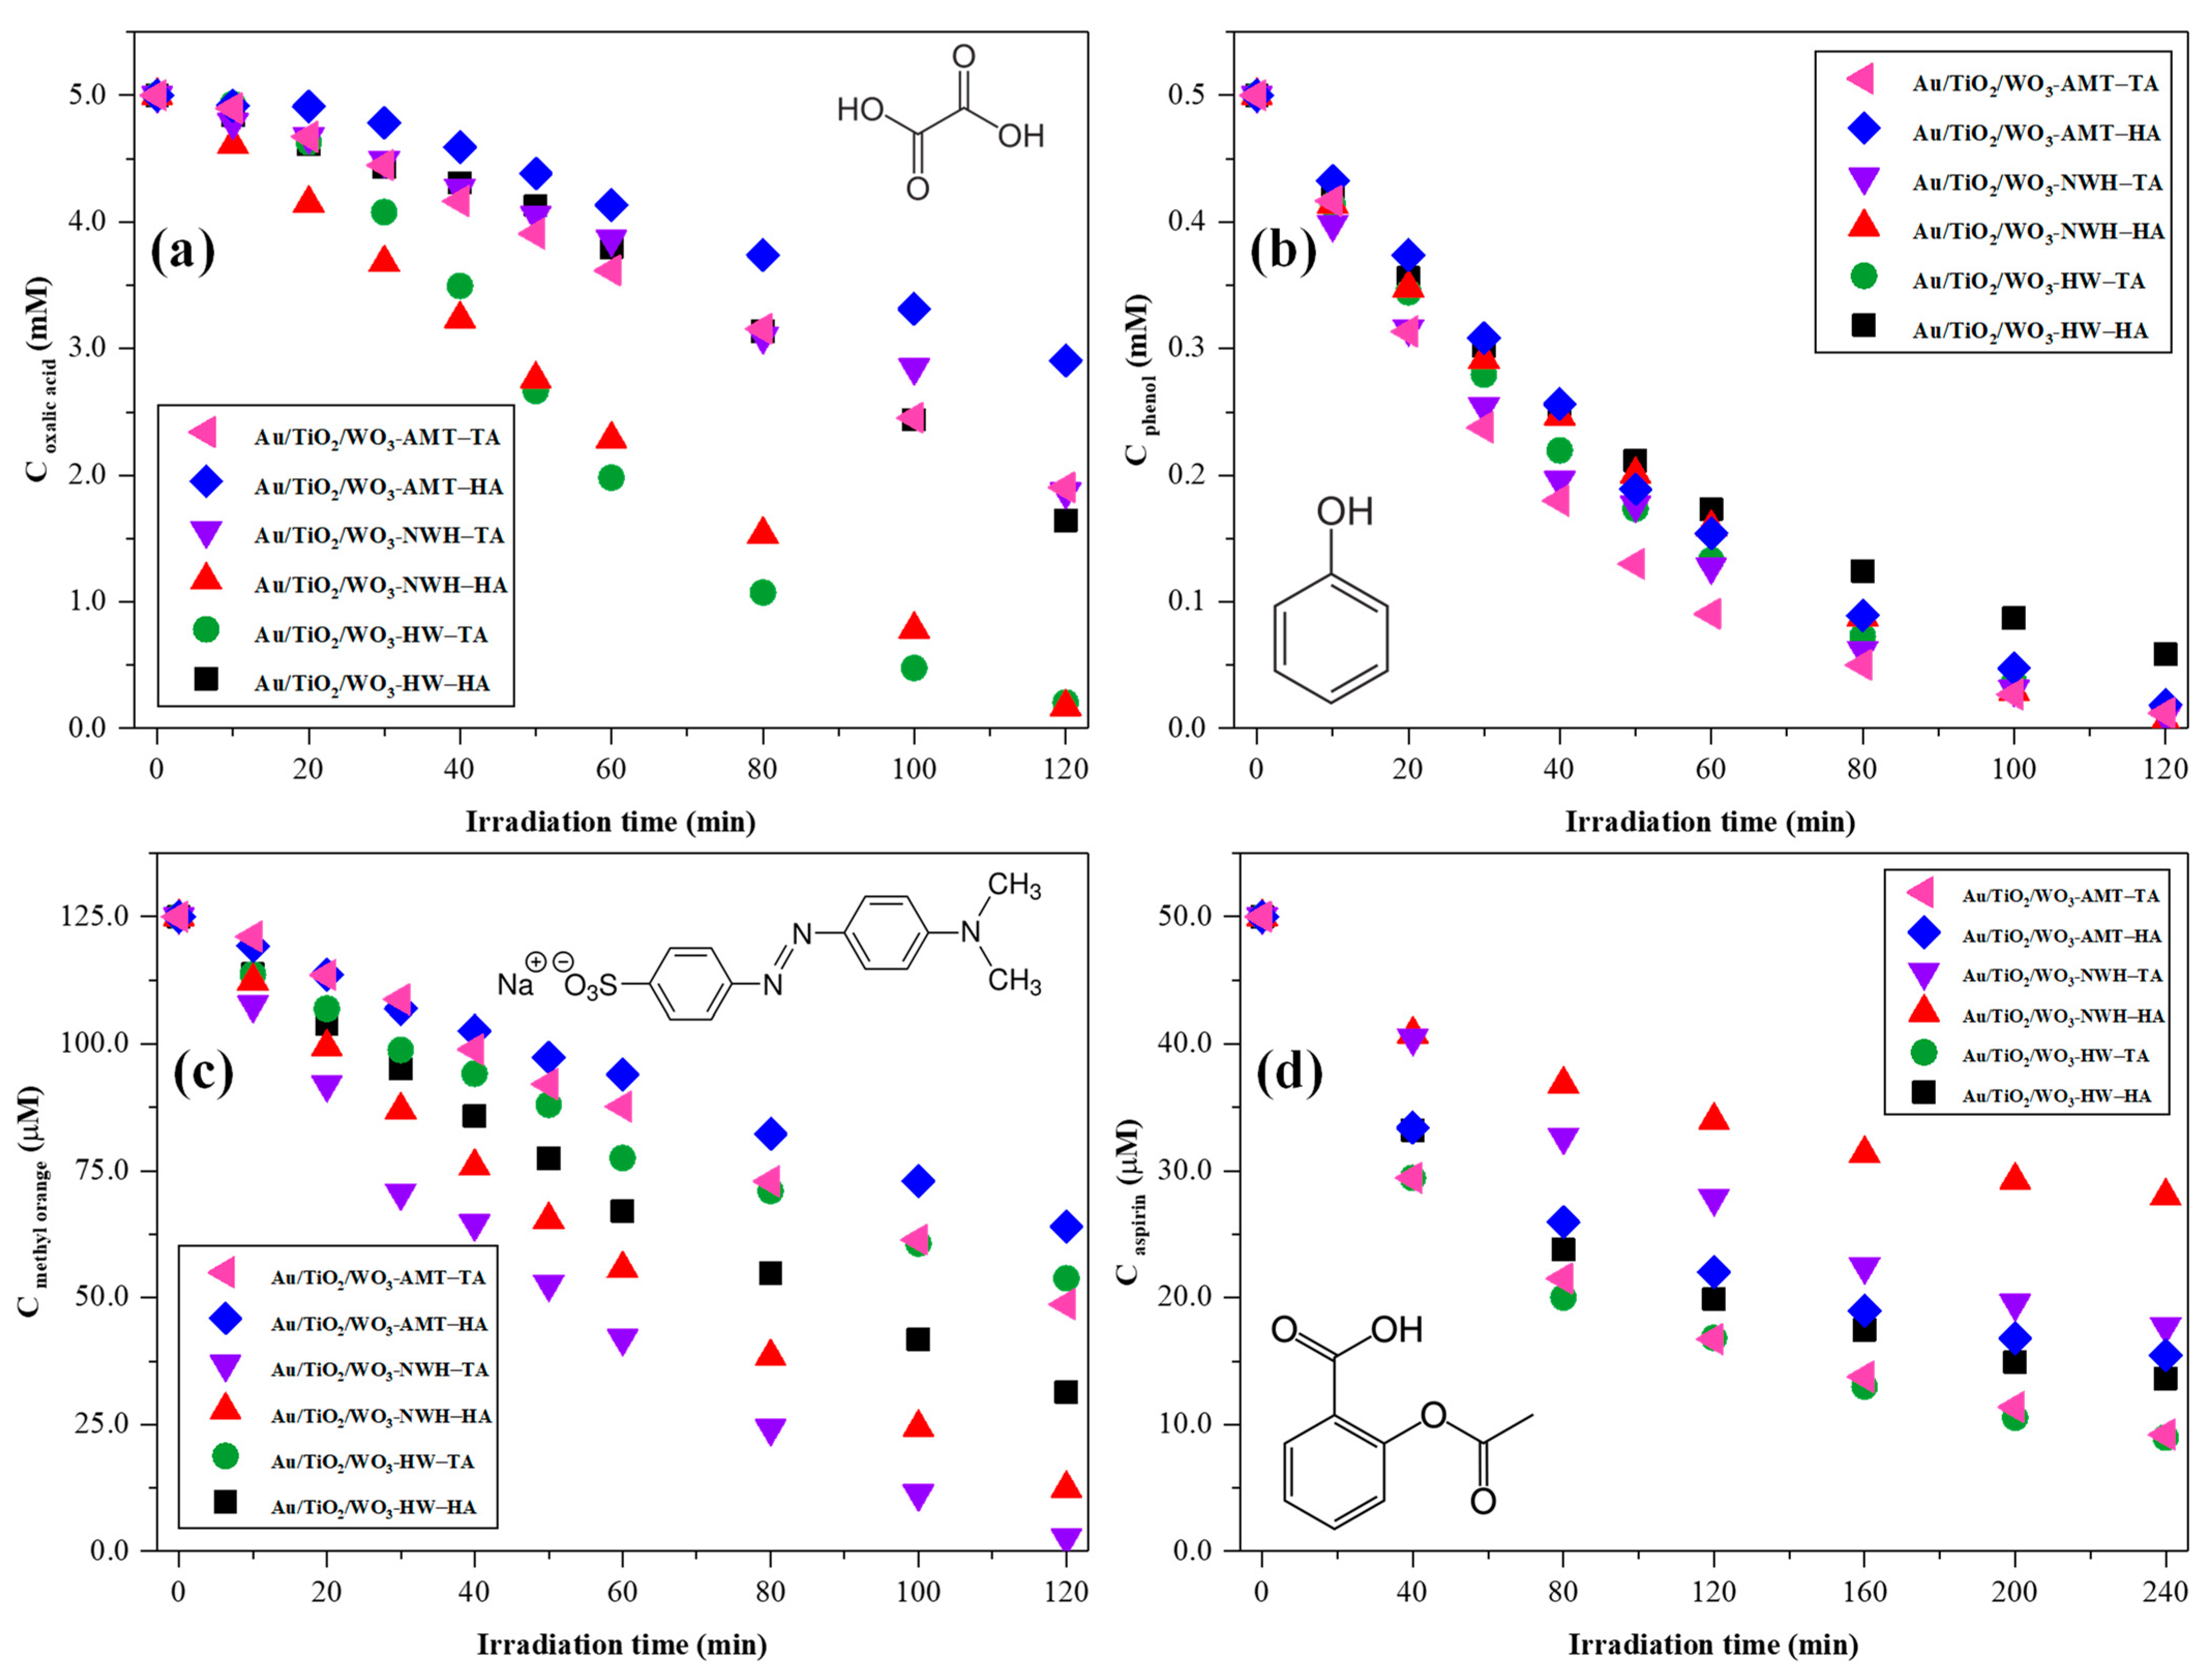
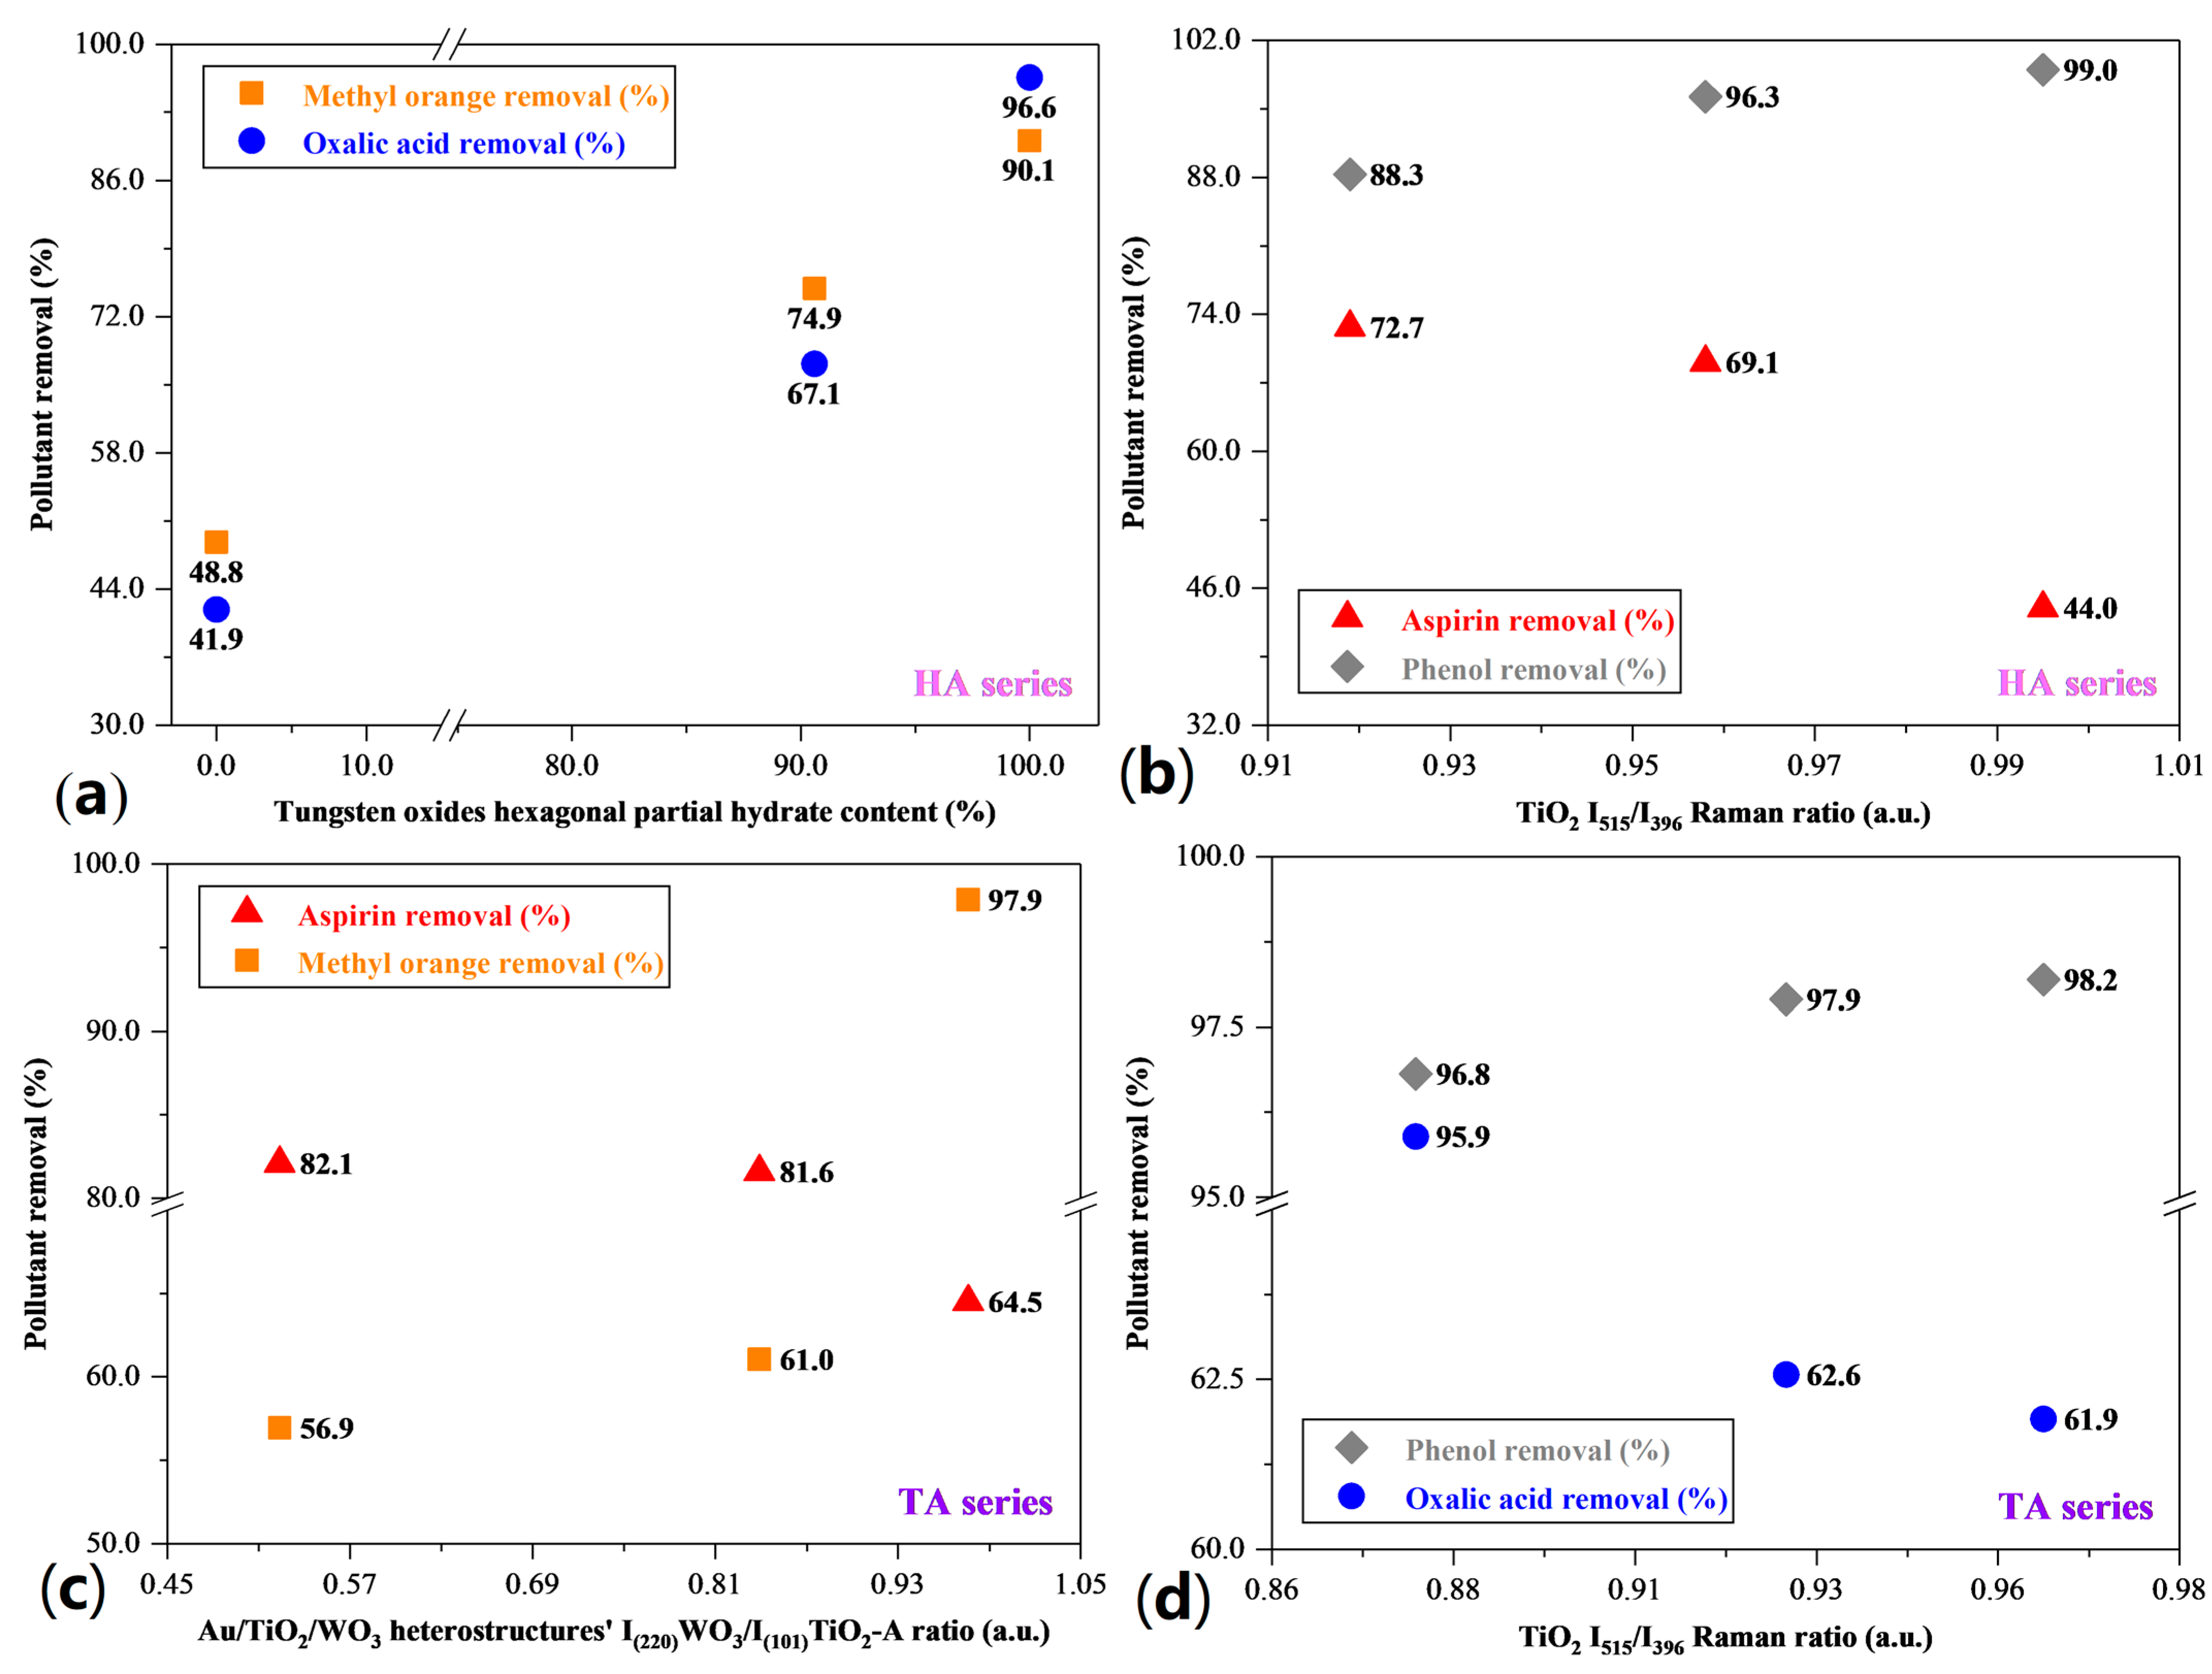
2.6. Photocatalytic Activity Assessment
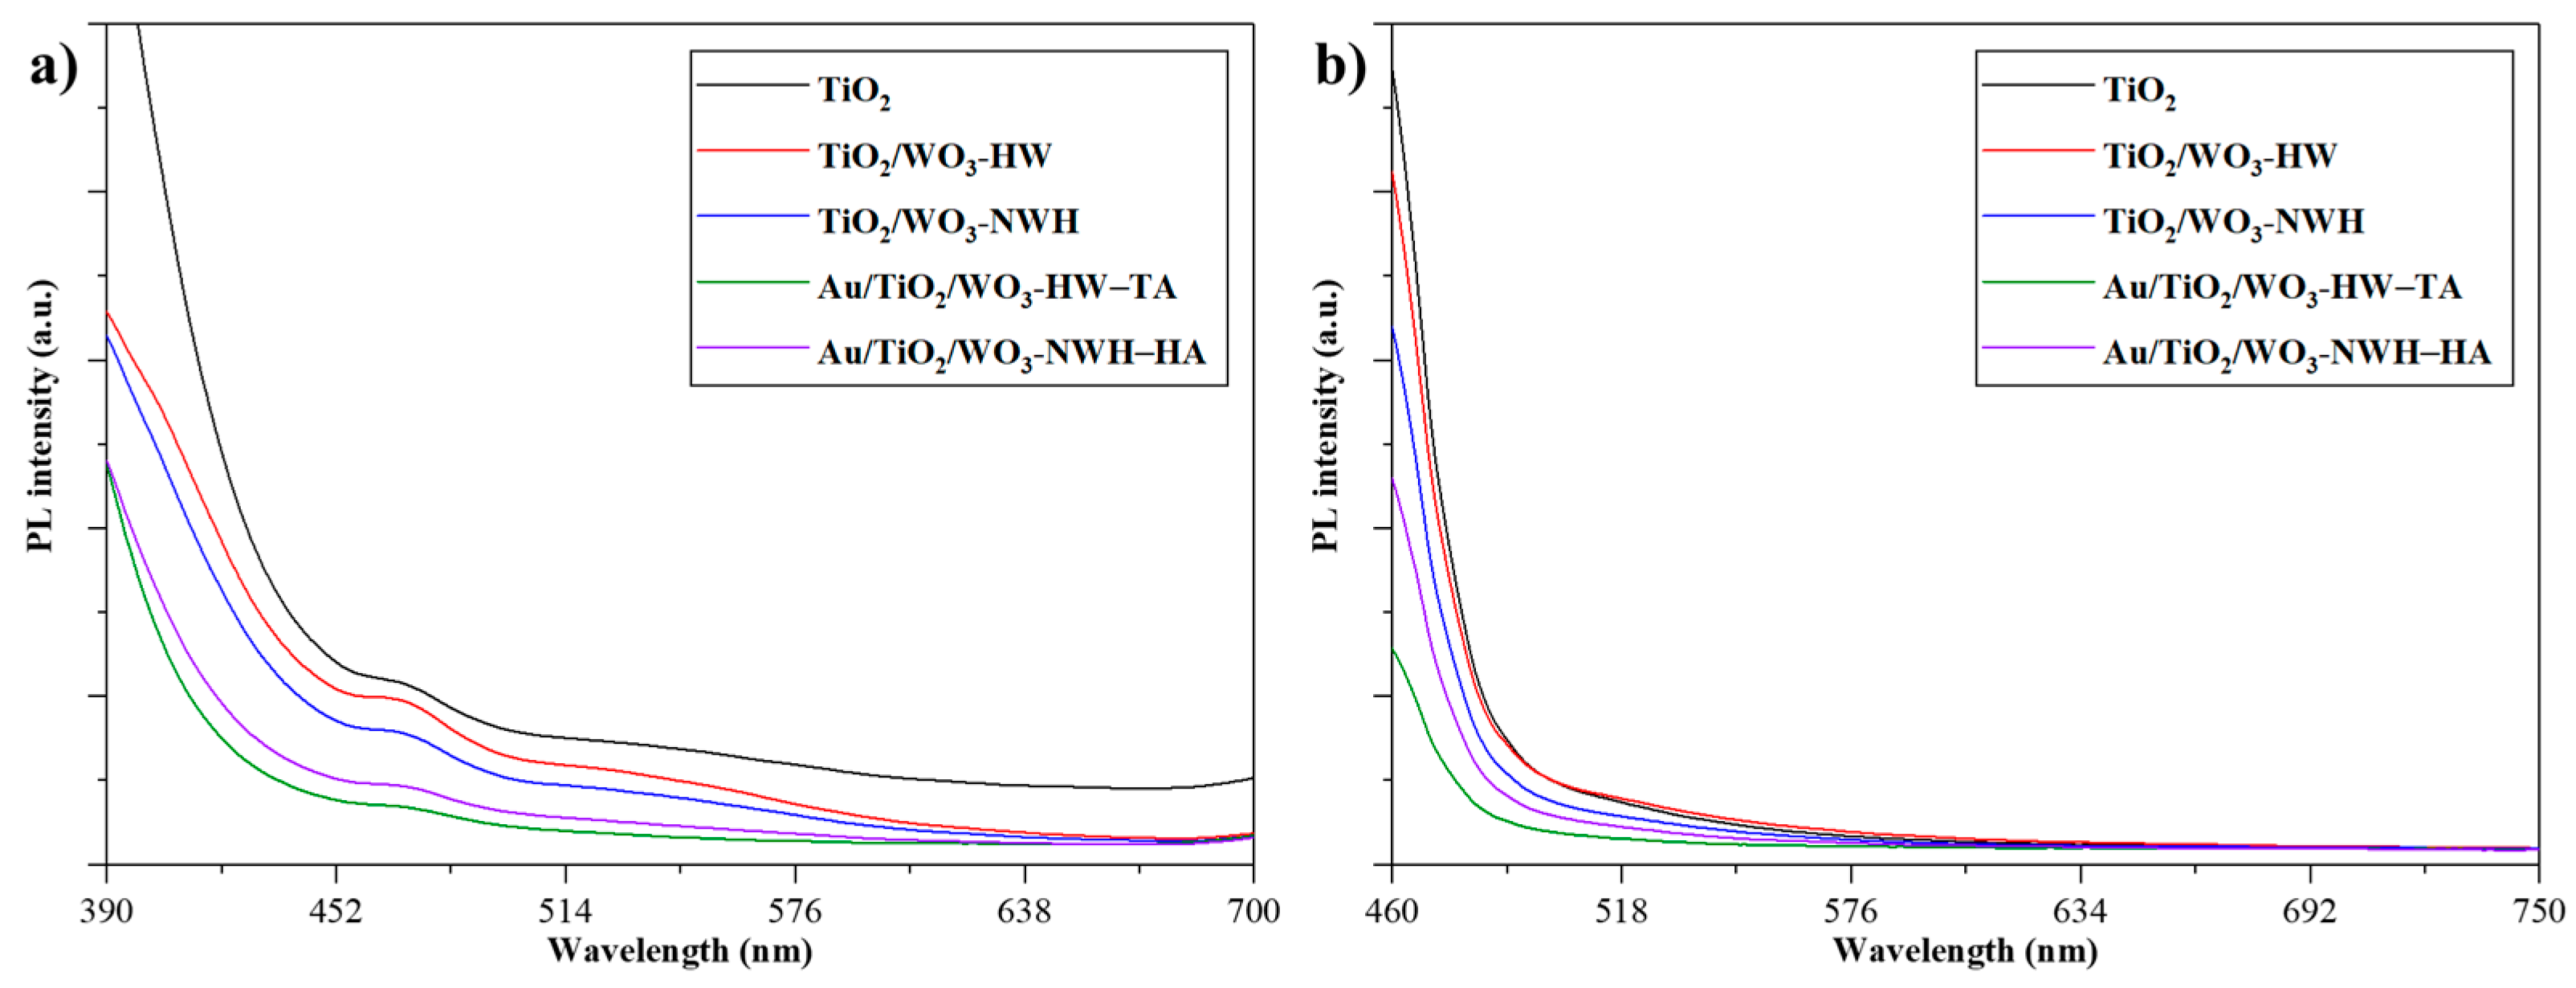
2.6.1. Photoluminescence (PL) of the Au/TiO2/WO3 Heterostructures
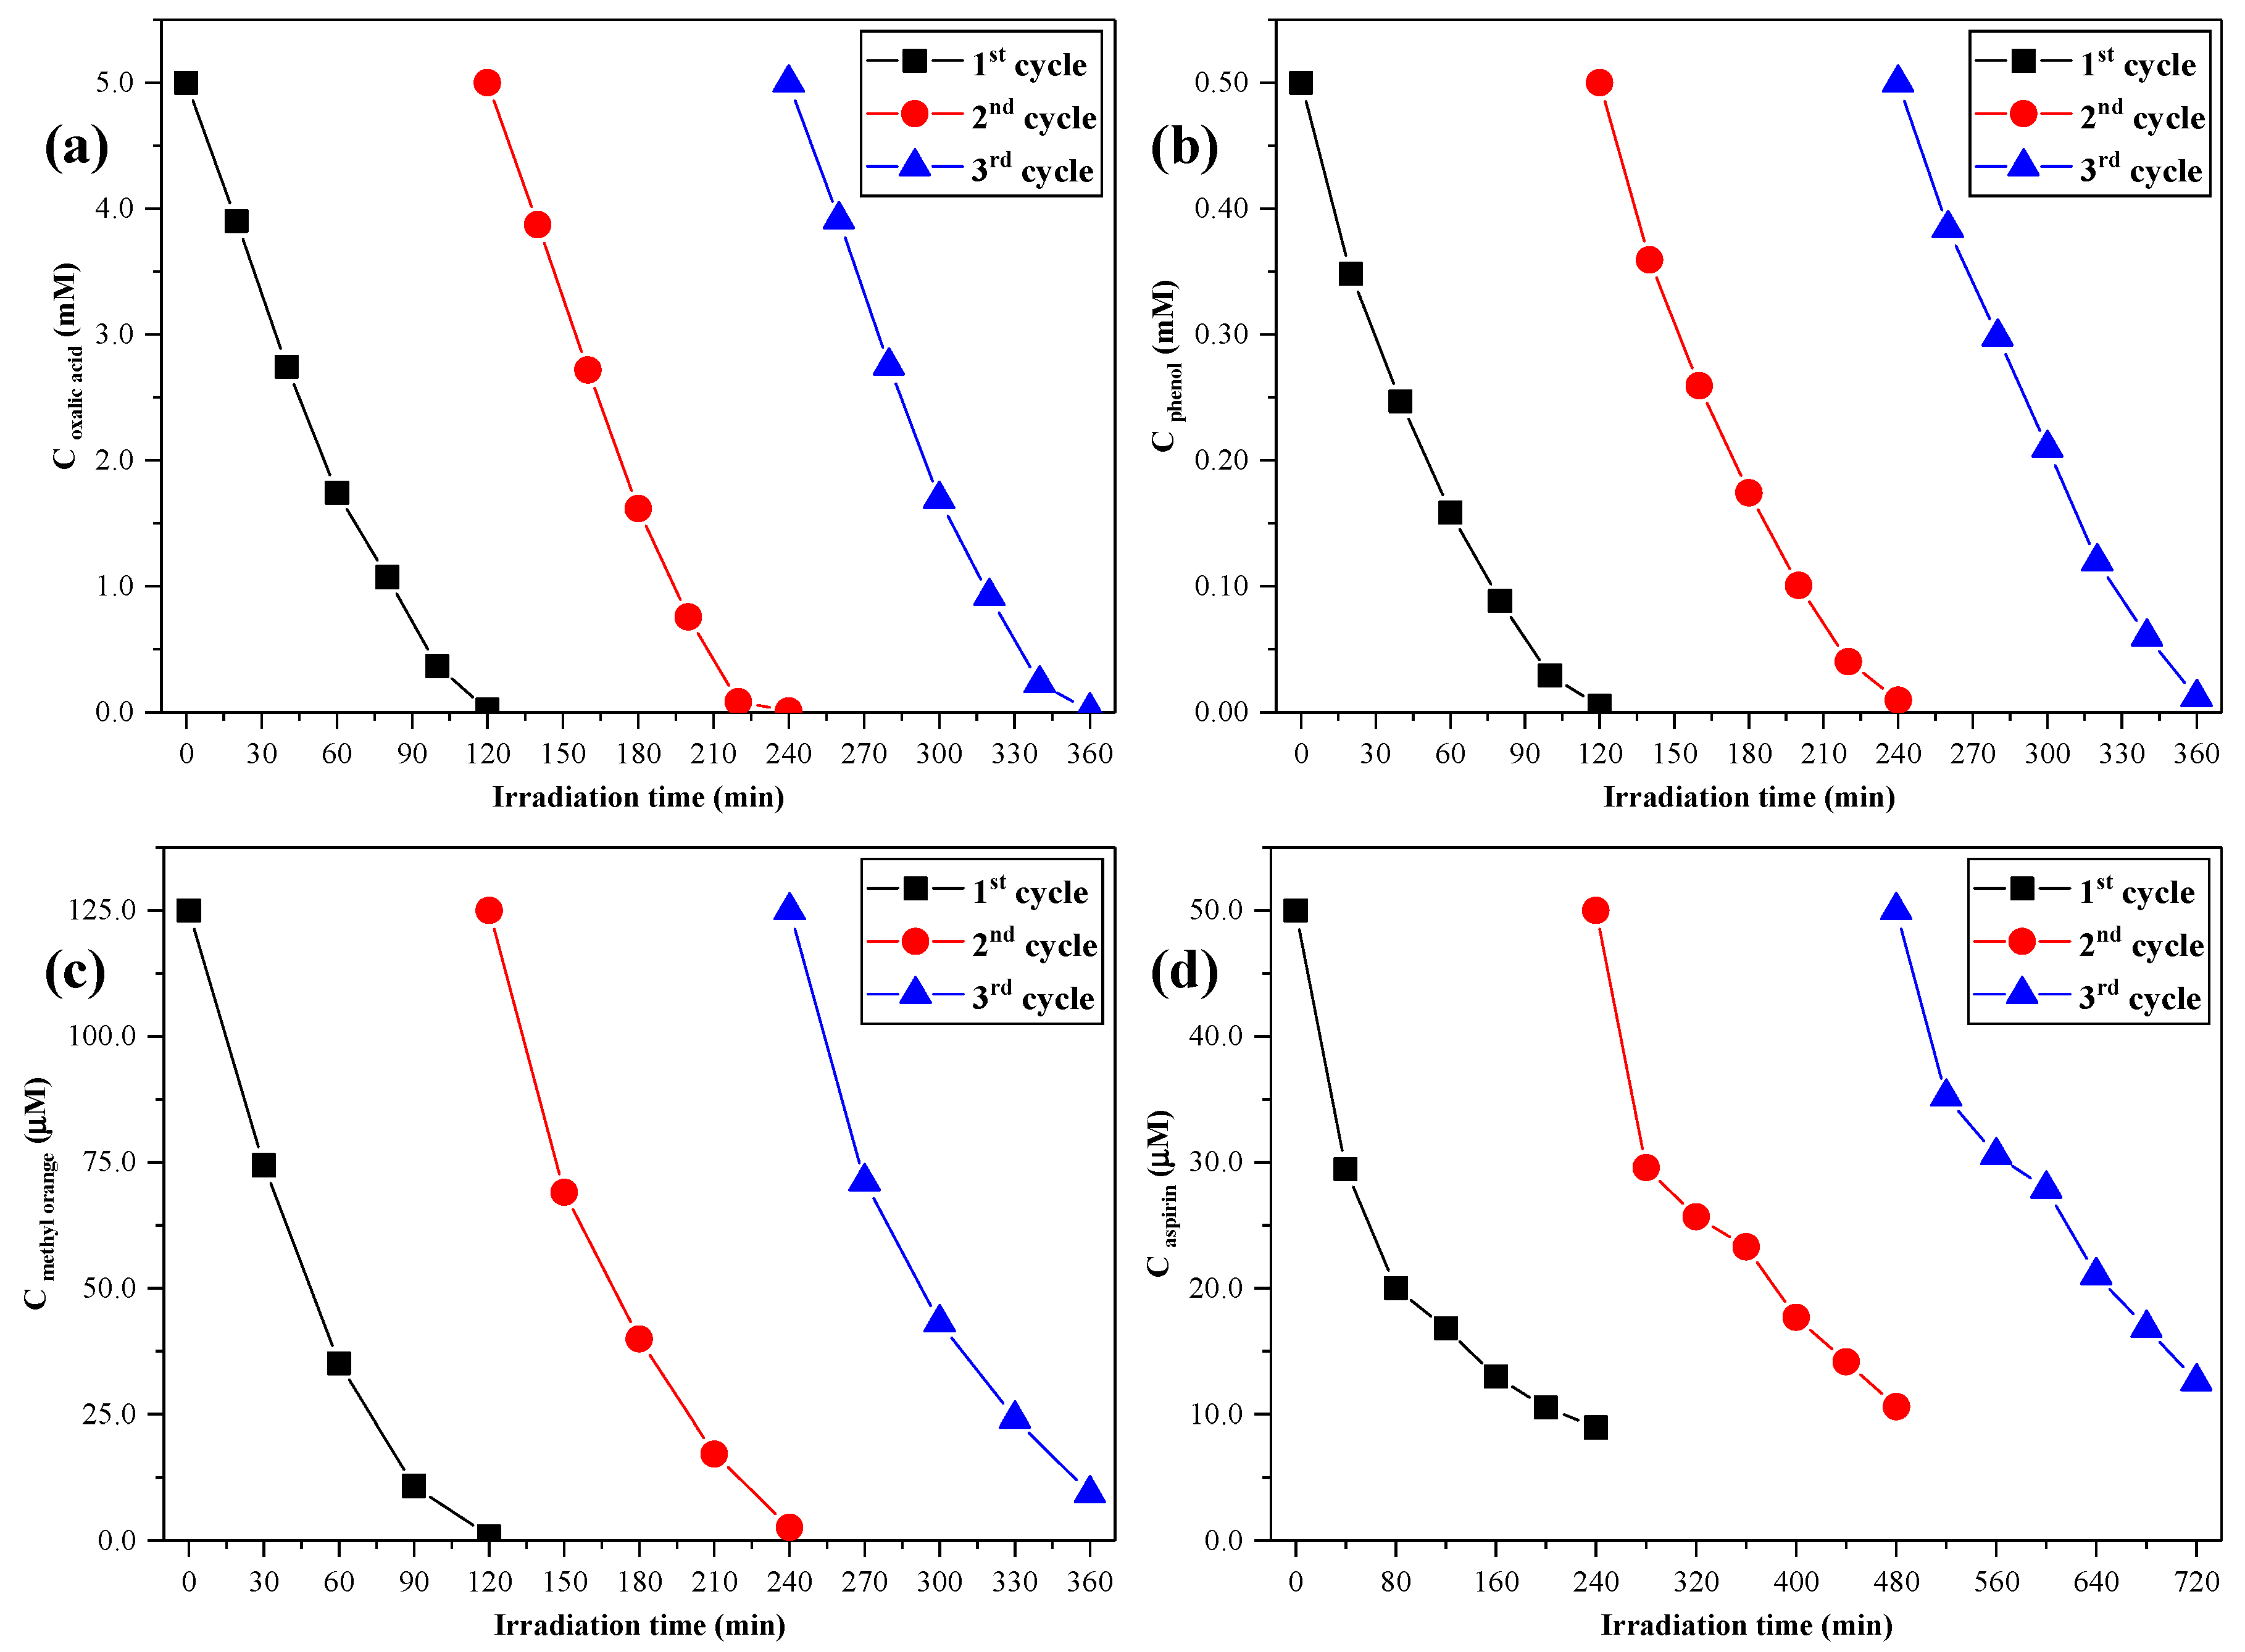
2.6.2. Photocatalytic Recyclability and Stability of the Au/TiO2/WO3 Heterostructures
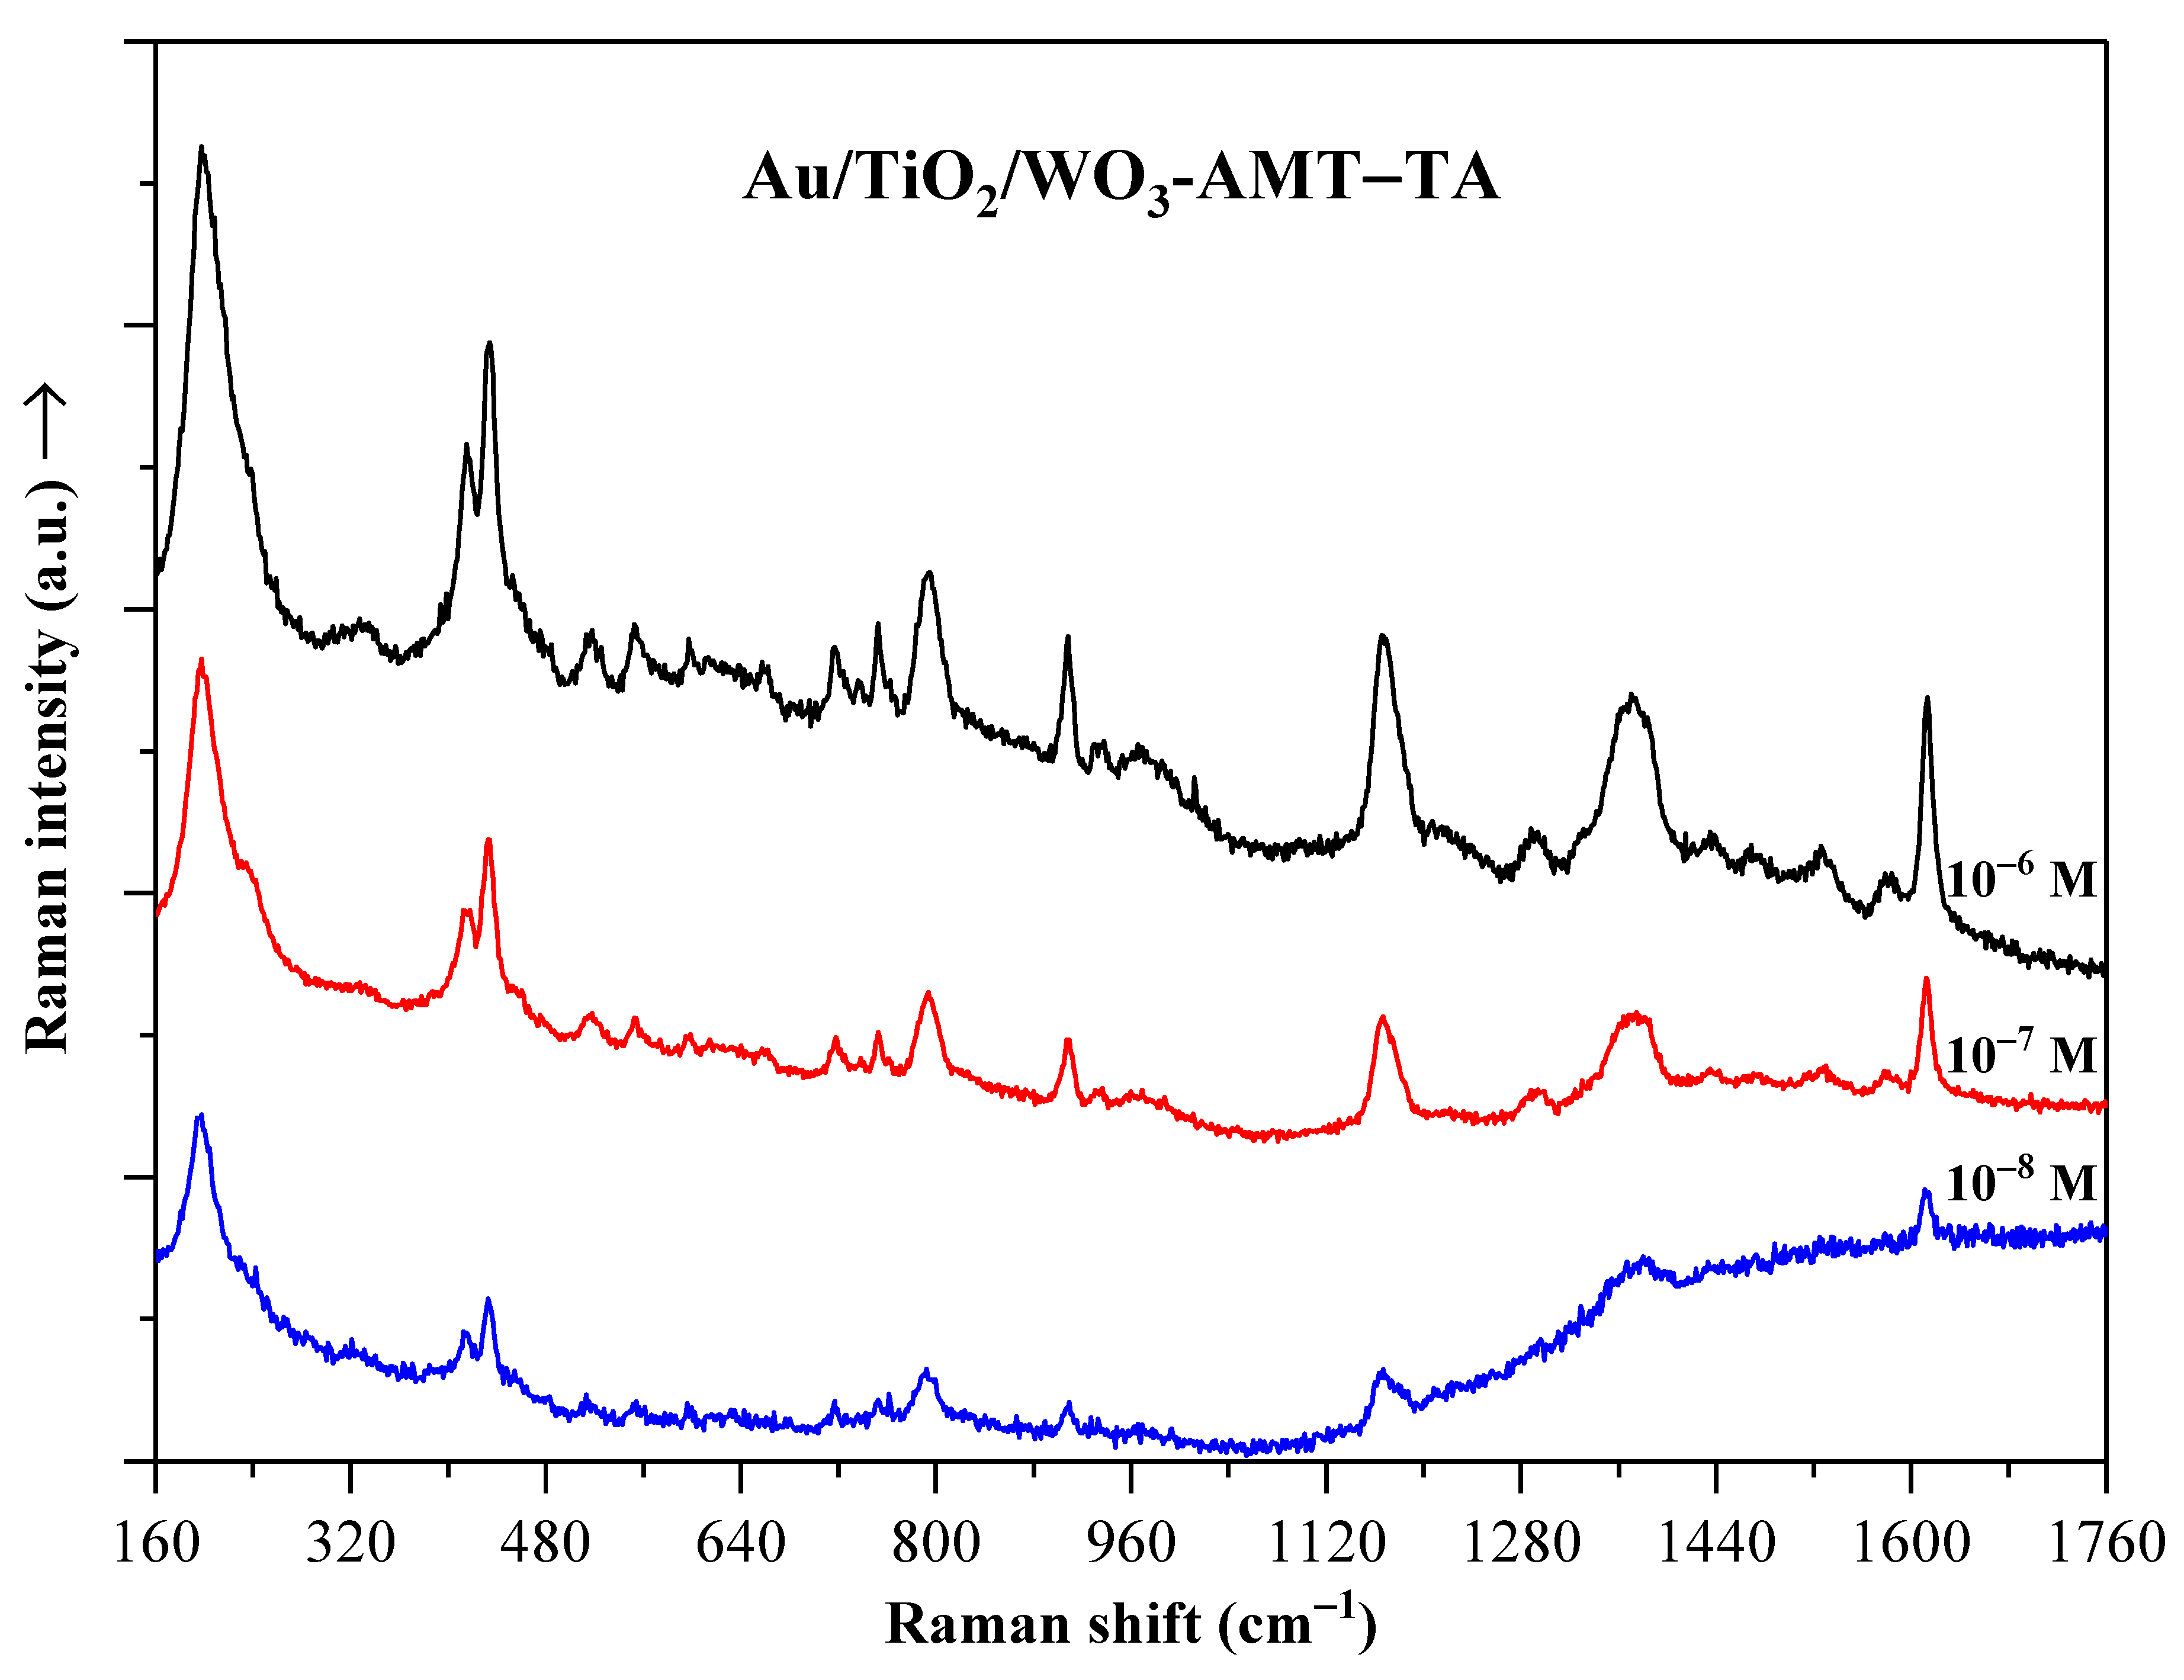
2.7. Crystal Violet Dye Detection on Au/TiO2/WO3 Heterostructures Using SERS
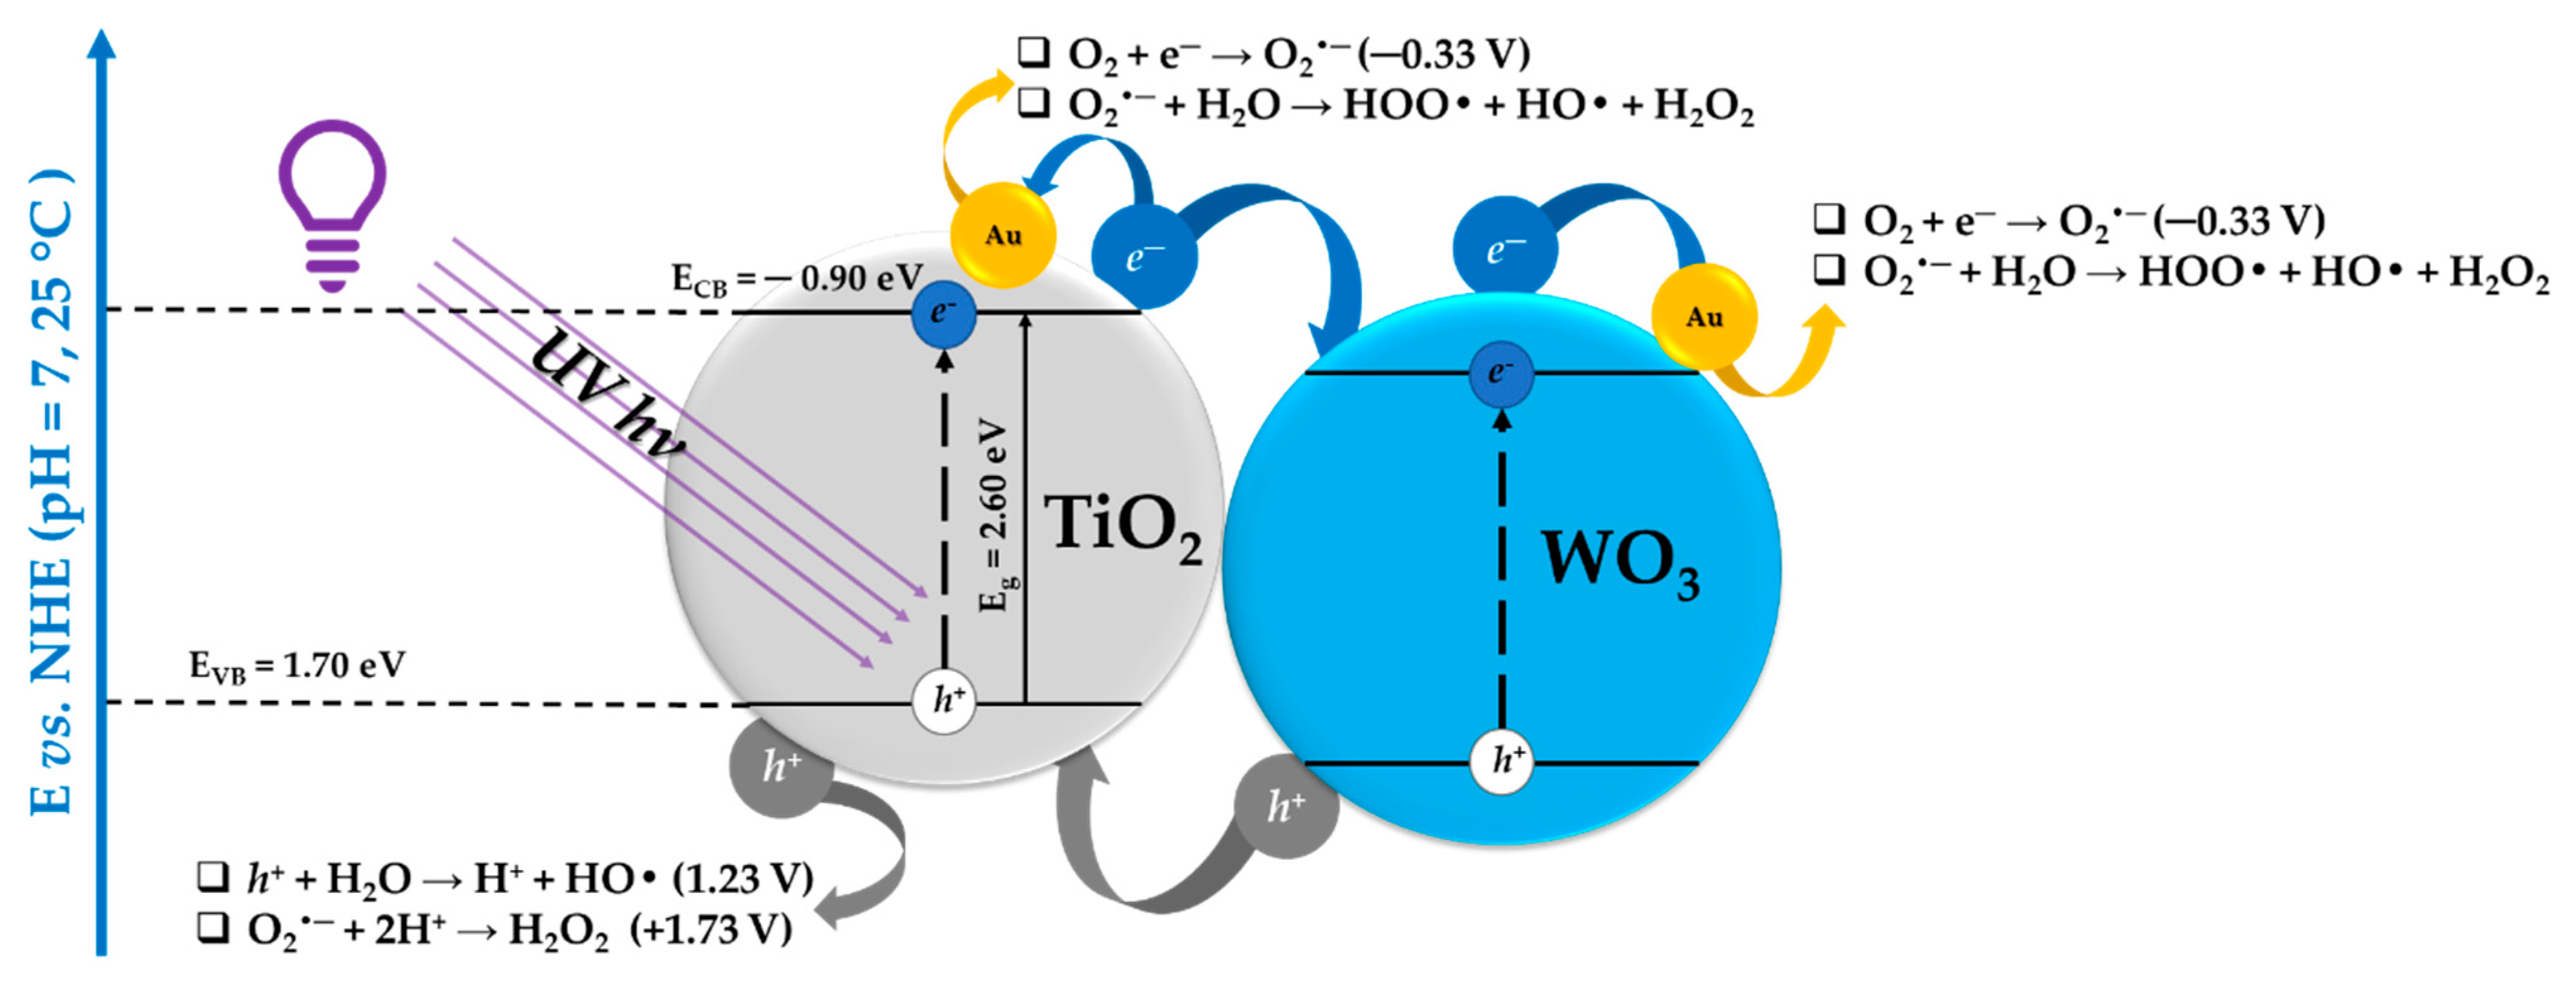
3. Correlations between the Morpho-Structural Properties and Photocatalytic Activity of the Heterostructures
4. Materials and Methods
4.1. Chemicals
4.2. Synthesis Routes of the Au/TiO2/WO3 Ternary Composites
4.3. Methods and Instrumentation and Assessment of Photocatalytic Activity
5. Conclusions
Supplementary Materials
Author Contributions
Funding
Data Availability Statement
Conflicts of Interest
References
- Rhaman, M.M.; Ganguli, S.; Bera, S.; Rawal, S.B.; Chakraborty, A.K. Visible-light responsive novel WO3/TiO2 and Au loaded WO3/TiO2 nanocomposite and wastewater remediation: Mechanistic inside and photocatalysis pathway. J. Water Process Eng. 2020, 36, 101256. [Google Scholar] [CrossRef]
- Yang, X.; Fu, H.; Wang, W.; Xiong, S.; Han, D.; Deng, Z.; An, X. Enhanced solar light photocatalytic performance based on a novel Au-WO3@TiO2 ternary core–shell nanostructures. Appl. Surf. Sci. 2020, 505, 144631. [Google Scholar] [CrossRef]
- Tahir, M.; Siraj, M.; Tahir, B.; Umer, M.; Alias, H.; Othman, N. Au-NPs embedded Z–scheme WO3/TiO2 nanocomposite for plasmon-assisted photocatalytic glycerol-water reforming towards enhanced H2 evolution. Appl. Surf. Sci. 2020, 503, 144344. [Google Scholar] [CrossRef]
- Zhu, Z.; Huang, W.R.; Chen, C.Y.; Wu, R.J. Preparation of Pd-Au/TiO2-WO3 to enhance photoreduction of CO2 to CH4 and CO. J. CO2 Util. 2018, 28, 247–254. [Google Scholar] [CrossRef]
- Karbalaei Akbari, M.; Hai, Z.; Wei, Z.; Detavernier, C.; Solano, E.; Verpoort, F.; Zhuiykov, S. ALD-Developed Plasmonic Two-Dimensional Au-WO3-TiO2 Heterojunction Architectonics for Design of Photovoltaic Devices. ACS Appl. Mater. Interfaces 2018, 10, 10304–10314. [Google Scholar] [CrossRef]
- Zhang, B.; Yin, X.; Zhen, D.; Gu, W.; Liu, Y.; Cai, Q. Au nanoparticle-modified WO3 nanoflowers/TiO2 nanotubes used for the SERS detection of dyes. New J. Chem. 2017, 41, 13968–13973. [Google Scholar] [CrossRef]
- Iliev, V.; Tomova, D.; Rakovsky, S.; Eliyas, A.; Puma, G.L. Enhancement of photocatalytic oxidation of oxalic acid by gold modified WO3/TiO2 photocatalysts under UV and visible light irradiation. J. Mol. Catal. A Chem. 2010, 327, 51–57. [Google Scholar] [CrossRef]
- Karácsonyi, É.; Baia, L.; Dombi, A.; Danciu, V.; Mogyorósi, K.; Pop, L.C.; Kovács, G.; Coşoveanu, V.; Vulpoi, A.; Simon, S.; et al. The photocatalytic activity of TiO2/WO3/noble metal (Au or Pt) nanoarchitectures obtained by selective photodeposition. Catal. Today 2013, 208, 19–27. [Google Scholar] [CrossRef]
- Kovács, G.; Baia, L.; Vulpoi, A.; Radu, T.; Karácsonyi, É.; Dombi, A.; Hernádi, K.; Danciu, V.; Simon, S.; Pap, Z. TiO2/WO3/Au nanoarchitectures’ photocatalytic activity, “from degradation intermediates to catalysts’ structural peculiarities”, Part I: Aeroxide P25 based composites. Appl. Catal. B Environ. 2014, 147, 508–517. [Google Scholar] [CrossRef]
- Baia, L.; Vulpoi, A.; Radu, T.; Karácsonyi, É.; Dombi, A.; Hernádi, K.; Danciu, V.; Simon, S.; Norén, K.; Canton, S.E.; et al. TiO2/WO3/Au nanoarchitectures’ photocatalytic activity “from degradation intermediates to catalysts’ structural peculiarities” Part II: Aerogel based composites—Fine details by spectroscopic means. Appl. Catal. B Environ. 2014, 148–149, 589–600. [Google Scholar] [CrossRef]
- Turkevich, J.; Stevenson, P.C.; Hillier, J. A study of the nucleation and growth processes in the synthesis of colloidal gold. Discuss. Faraday Soc. 1951, 11, 55–75. [Google Scholar] [CrossRef]
- Frens, G. Controlled Nucleation for the Regulation of the Particle Size in Monodisperse Gold Suspensions. Nat. Phys. Sci. 1973, 241, 20–22. [Google Scholar] [CrossRef]
- Rusu, M.; Baia, M.; Pap, Z.; Danciu, V.; Baia, L. Structural investigations of TiO2-WO3-Au porous composites. J. Mol. Struct. 2014, 1073, 150–156. [Google Scholar] [CrossRef]
- Lu, X.; Dandapat, A.; Huang, Y.; Zhang, L.; Rong, Y.; Dai, L.; Sasson, Y.; Zhang, J.; Chen, T. Tris base assisted synthesis of monodispersed citrate-capped gold nanospheres with tunable size. RSC Adv. 2016, 6, 60916–60921. [Google Scholar] [CrossRef]
- Sotnikov, D.V.; Berlina, A.N.; Ivanov, V.S.; Zherdev, A.V.; Dzantiev, B.B. Adsorption of proteins on gold nanoparticles: One or more layers? Colloids Surf. B Biointerfaces 2019, 173, 557–563. [Google Scholar] [CrossRef] [PubMed]
- Sotnikov, D.V.; Byzova, N.A.; Zherdev, A.V.; Dzantiev, B.B. Retention of Activity by Antibodies Immobilized on Gold Nanoparticles of Different Sizes: Fluorometric Method of Determination and Comparative Evaluation. Nanomaterials 2021, 11, 3117. [Google Scholar] [CrossRef] [PubMed]
- Dileseigres, A.S.; Prado, Y.; Pluchery, O. How to Use Localized Surface Plasmon for Monitoring the Adsorption of Thiol Molecules on Gold Nanoparticles? Nanomaterials 2022, 12, 292. [Google Scholar] [CrossRef]
- Pan, Y.; Liu, X.; Qian, L.; Cui, Y.; Zheng, X.; Kang, Y.; Fu, X.; Wang, S.; Wang, P.; Wang, D. A hand-held optoelectronic tongue for the identification of heavy-metal ions. Sens. Actuators B Chem. 2022, 352, 130971. [Google Scholar] [CrossRef]
- Cai, J.; Wu, X.; Li, S.; Zheng, F. Synthesis of TiO2@WO3/Au Nanocomposite Hollow Spheres with Controllable Size and High Visible-Light-Driven Photocatalytic Activity. ACS Sustain. Chem. Eng. 2016, 4, 1581–1590. [Google Scholar] [CrossRef]
- Momeni, M.M.; Ghayeb, Y. Fabrication, characterization and photocatalytic properties of Au/TiO2-WO3 nanotubular composite synthesized by photo-assisted deposition and electrochemical anodizing methods. J. Mol. Catal. A Chem. 2016, 417, 107–115. [Google Scholar] [CrossRef]
- Wang, X.; Pan, H.; Sun, M.; Zhang, Y. Au single atom-anchored WO3/TiO2 nanotubes for the photocatalytic degradation of volatile organic compounds. J. Mater. Chem. A 2021, 10, 6078–6085. [Google Scholar] [CrossRef]
- Cao, Q.; Yuan, K.; Liu, Q.; Liang, C.; Wang, X.; Cheng, Y.F.; Li, Q.; Wang, M.; Che, R. Porous Au-Ag Alloy Particles Inlaid AgCl Membranes as Versatile Plasmonic Catalytic Interfaces with Simultaneous, in Situ SERS Monitoring. ACS Appl. Mater. Interfaces 2015, 7, 18491–18500. [Google Scholar] [CrossRef]
- Cao, Q.; Liu, X.; Yuan, K.; Yu, J.; Liu, Q.; Delaunay, J.J.; Che, R. Gold nanoparticles decorated Ag(Cl,Br) micro-necklaces for efficient and stable SERS detection and visible-light photocatalytic degradation of Sudan I. Appl. Catal. B Environ. 2017, 201, 607–616. [Google Scholar] [CrossRef]
- Cheng, Y.F.; Cao, Q.; Zhang, J.; Wu, T.; Che, R. Efficient photodegradation of dye pollutants using a novel plasmonic AgCl microrods array and photo-optimized surface-enhanced Raman scattering. Appl. Catal. B Environ. 2017, 217, 37–47. [Google Scholar] [CrossRef]
- Zhou, L.; Zou, J.; Yu, M.; Lu, P.; Wei, J.; Qian, Y.; Wang, Y.; Yu, C. Green synthesis of hexagonal-shaped WO3·0.33H2O nanodiscs composed of nanosheets. Cryst. Growth Des. 2008, 8, 3993–3998. [Google Scholar] [CrossRef]
- Shiraishi, Y.; Hirakawa, H.; Togawa, Y.; Sugano, Y.; Ichikawa, S.; Hirai, T. Rutile crystallites isolated from degussa (Evonik) P25 TiO2: Highly efficient photocatalyst for chemoselective hydrogenation of nitroaromatics. ACS Catal. 2013, 3, 2318–2326. [Google Scholar] [CrossRef]
- Liu, X.; Zhang, J.; Yang, T.; Guo, X.; Wu, S.; Wang, S. Synthesis of Pt nanoparticles functionalized WO3 nanorods and their gas sensing properties. Sens. Actuators B Chem. 2011, 156, 918–923. [Google Scholar] [CrossRef]
- Theodorakopoulos, G.V.; Katsaros, F.K.; Papageorgiou, S.K.; Beazi-Katsioti, M.; Romanos, G.E. Engineering Commercial TiO2 powder into Tailored Beads for Efficient Water Purification. Materials 2022, 15, 326. [Google Scholar] [CrossRef]
- Scarpelli, F.; Mastropietro, T.F.; Poerio, T.; Godbert, N. Mesoporous TiO2 Thin Films: State of the Art. In Titanium Dioxide—Material for a Sustainable Environment; Yang, D., Ed.; IntechOpen: Rijeka, Croatia, 2018. [Google Scholar]
- Kong, Y.; Sun, H.; Fan, W.; Wang, L.; Zhao, H.; Zhao, X.; Yuan, S. Enhanced photoelectrochemical performance of tungsten oxide film by bifunctional Au nanoparticles. RSC Adv. 2017, 7, 15201–15210. [Google Scholar] [CrossRef]
- Székely, I.; Kovács, G.; Baia, L.; Danciu, V.; Pap, Z. Synthesis of shape-tailored WO3 micro-/nanocrystals and the photocatalytic activity of WO3/TiO2 composites. Materials 2016, 9, 258. [Google Scholar] [CrossRef] [PubMed]
- Hatel, R.; Baitoul, M. Nanostructured tungsten trioxide (WO3): Synthesis, structural and morphological investigations. J. Phys. Conf. Ser. 2019, 1292, 12014. [Google Scholar] [CrossRef]
- Li, D.; Chen, S.; You, R.; Liu, Y.; Yang, M.; Cao, T.; Qian, K.; Zhang, Z.; Tian, J.; Huang, W. Titania-morphology-dependent dual-perimeter-sites catalysis by Au/TiO2 catalysts in low-temperature CO oxidation. J. Catal. 2018, 368, 163–171. [Google Scholar] [CrossRef]
- Chen, S.; Li, D.; Cao, T.; Huang, W. Size-Dependent Structures and Catalytic Performances of Au/TiO2-{001} Catalysts for Propene Epoxidation. J. Phys. Chem. C 2020, 124, 15264–15274. [Google Scholar] [CrossRef]
- Pang, Q.; Zhong, X.; Yan, W.; Ma, H.; Ren, H.; Song, L.; Lv, Z.; Li, L.; Chen, C.; Wang, H.; et al. Role of percentage of {001} crystal facets in TiO2 supports toward the water-gas shift reaction over Au-TiO2 catalysts. Chem. Eng. J. 2022, 446, 137010. [Google Scholar] [CrossRef]
- Paradowska, E.; Arkusz, K.; Pijanowska, D.G. Comparison of Gold Nanoparticles Deposition Methods and Their Influence on Electrochemical and Adsorption Properties of Titanium Dioxide Nanotubes. Materials 2020, 13, 4269. [Google Scholar] [CrossRef] [PubMed]
- Tada, K.; Maeda, Y.; Koga, H.; Okumura, M. TiO2 Crystal Structure Dependence of Low-temperature CO Oxidation Catalyzed by Au/TiO2. Chem. Lett. 2018, 47, 200–203. [Google Scholar] [CrossRef]
- Tang, Y.; Chen, Y.; Liu, X.; Wang, C.; Zhao, Y.; Chen, R.; Shan, B. Facet-dependent activity of shape-controlled TiO2 supported Au nanoparticles for the water–gas shift reaction. Catal. Sci. Technol. 2022, 12, 1530–1538. [Google Scholar] [CrossRef]
- Yang, G.; Zhu, X.; Cheng, G.; Chen, R.; Xiong, J.; Li, W.; Wei, Y. Engineered tungsten oxide-based photocatalysts for CO2 reduction: Categories and roles. J. Mater. Chem. A 2021, 9, 22781–22809. [Google Scholar] [CrossRef]
- Pap, Z.; Tóth, Z.R.; Danciu, V.; Baia, L.; Kovács, G. Differently Shaped Au Nanoparticles: A Case Study on the Enhancement of the Photocatalytic Activity of Commercial TiO2. Materials 2015, 8, 162–180. [Google Scholar] [CrossRef]
- Martins, P.; Kappert, S.; Nga Le, H.; Sebastian, V.; Kühn, K.; Alves, M.; Pereira, L.; Cuniberti, G.; Melle-Franco, M.; Lanceros-Méndez, S. Enhanced Photocatalytic Activity of Au/TiO2 Nanoparticles against Ciprofloxacin. Catalysts 2020, 10, 234. [Google Scholar] [CrossRef]
- Chen, T.M.; Xu, G.Y.; Ren, H.; Zhang, H.; Tian, Z.Q.; Li, J.F. Synthesis of Au@TiO2 core-shell nanoparticles with tunable structures for plasmon-enhanced photocatalysis. Nanoscale Adv. 2019, 1, 4522–4528. [Google Scholar] [CrossRef] [PubMed]
- Yan, J.; Wu, G.; Guan, N.; Li, L.; Li, Z.; Cao, X. Understanding the effect of surface/bulk defects on the photocatalytic activity of TiO2: Anatase versus rutile. Phys. Chem. Chem. Phys. 2013, 15, 10978–10988. [Google Scholar] [CrossRef]
- Alotaibi, A.M.; Sathasivam, S.; Parkin, I.P. Aerosol assisted chemical vapour deposition of a ZrO2-TiO2 composite thin film with enhanced photocatalytic activity. RSC Adv. 2015, 5, 67944–67950. [Google Scholar] [CrossRef]
- Anandan, S.; Wu, J.J. Ultrasound assisted synthesis of TiO2-WO3 heterostructures for the catalytic degradation of Tergitol (NP-9) in water. Ultrason. Sonochem. 2014, 21, 1284–1288. [Google Scholar] [CrossRef] [PubMed]
- Baba, K.; Bulou, S.; Quesada-Gonzalez, M.; Bonot, S.; Collard, D.; Boscher, N.D.; Choquet, P. Significance of a Noble Metal Nanolayer on the UV and Visible Light Photocatalytic Activity of Anatase TiO2 Thin Films Grown from a Scalable PECVD/PVD Approach. ACS Appl. Mater. Interfaces 2017, 9, 41200–41209. [Google Scholar] [CrossRef]
- Green, S.V.; Kuzmin, A.; Purans, J.; Granqvist, C.G.; Niklasson, G.A. Structure and composition of sputter-deposited nickel-tungsten oxide films. Thin Solid Film. 2011, 519, 2062–2066. [Google Scholar] [CrossRef]
- Cui, Y.; Pan, L.; Chen, Y.; Afzal, N.; Ullah, S.; Liu, D.; Wang, L.; Zhang, X.; Zou, J.J. Defected ZnWO4-decorated WO3 nanorod arrays for efficient photoelectrochemical water splitting. RSC Adv. 2019, 9, 5492–5500. [Google Scholar] [CrossRef]
- Mohan, V.V.; Anjana, P.M.; Rakhi, R.B. A study on the effect of phase conversion of tungsten nanostructures on their electrochemical energy storage performance. Mater. Adv. 2022, 3, 5900–5910. [Google Scholar] [CrossRef]
- Zeng, N.; Wang, Y.C.; Neilson, J.; Fairclough, S.M.; Zou, Y.; Thomas, A.G.; Cernik, R.J.; Haigh, S.J.; Lewis, D.J. Rapid and Low-Temperature Molecular Precursor Approach toward Ternary Layered Metal Chalcogenides and Oxides: Mo1-xWxS2 and Mo1-xWxO3 Alloys (0 ≤ x ≤ 1). Chem. Mater. 2020, 32, 7895–7907. [Google Scholar] [CrossRef] [PubMed]
- Leghari, S.A.K.; Sajjad, S.; Chen, F.; Zhang, J. WO3/TiO2 composite with morphology change via hydrothermal template-free route as an efficient visible light photocatalyst. Chem. Eng. J. 2011, 166, 906–915. [Google Scholar] [CrossRef]
- Stefanov, P.; Shipochka, M.; Stefchev, P.; Raicheva, Z.; Lazarova, V.; Spassov, L. XPS characterization of TiO2 layers deposited on quartz plates. J. Phys. Conf. Ser. 2008, 100, 012039. [Google Scholar] [CrossRef]
- Jaleh, B.; Etivand, E.S.; Mohazzab, B.F.; Nasrollahzadeh, M.; Varma, R.S. Improving wettability: Deposition of TiO2 nanoparticles on the O2 plasma activated polypropylene membrane. Int. J. Mol. Sci. 2019, 20, 3309. [Google Scholar] [CrossRef]
- Zhao, B.; Zhang, X.; Mao, J.; Wang, Y.; Zhang, G.; Zhang, Z.C.; Guo, X. Crystal-Plane-Dependent Guaiacol Hydrodeoxygenation Performance of Au on Anatase TiO2. Catalysts 2023, 13, 699. [Google Scholar] [CrossRef]
- Leung, D.Y.C.; Fu, X.; Ye, D.; Huang, H. Effect of oxygen mobility in the lattice of Au/TiO2 on formaldehyde oxidation. Kinet. Catal. 2012, 53, 239–246. [Google Scholar] [CrossRef]
- Székely, I.; Baia, M.; Magyari, K.; Boga, B.; Pap, Z. The effect of the pH adjustment upon the WO3-WO3·0.33H2O-TiO2 ternary composite systems’ photocatalytic activity. Appl. Surf. Sci. 2019, 490, 469–480. [Google Scholar] [CrossRef]
- Kedves, E.-Z.; Székely, I.; Baia, L.; Baia, M.; Csavdári, A.; Pap, Z. The Comparison of the Photocatalytic Performance Shown by TiO2 and TiO2/WO3 Composites—A Parametric and Kinetic Study. J. Nanosci. Nanotechnol. 2018, 19, 356–365. [Google Scholar] [CrossRef] [PubMed]
- Székely, I.; Kedves, E.-Z.; Pap, Z.; Baia, M. Synthesis Design of Electronegativity Dependent WO3 and WO3∙0.33H2O Materials for a Better Understanding of TiO2/WO3 Composites’ Photocatalytic Activity. Catalysts 2021, 11, 779. [Google Scholar] [CrossRef]
- Boga, B.; Székely, I.; Focșan, M.; Baia, M.; Szabó, T.; Nagy, L.; Pap, Z. Sensor surface via inspiration from Nature: The specific case of electron trapping in TiO2/WO3(∙0.33H2O) and reaction center/WO3(∙0.33H2O) systems. Appl. Surf. Sci. 2022, 572, 151139. [Google Scholar] [CrossRef]
- Tóth, Z.R.; Debreczeni, D.; Gyulavári, T.; Székely, I.; Todea, M.; Kovács, G.; Focșan, M.; Magyari, K.; Baia, L.; Pap, Z.; et al. Rapid Synthesis Method of Ag3PO4 as Reusable Photocatalytically Active Semiconductor. Nanomaterials 2023, 13, 89. [Google Scholar] [CrossRef] [PubMed]
- Bakar, S.K.; Niazi, S. Stability of aspirin in different media. J. Pharm. Sci. 1983, 72, 1024–1026. [Google Scholar] [CrossRef]
- Skibinski, R.; Komsta, L. The stability and degradation kinetics of acetylsalicylic acid in different organic solutions revisited—An UHPLC-ESI-QTOF spectrometry study. Curr. Issues Pharm. Med. Sci. 2016, 29, 39–41. [Google Scholar] [CrossRef]
- Boga, B.; Székely, I.; Pap, Z.; Baia, L.; Baia, M. Detailed Spectroscopic and Structural Analysis of TiO2/WO3 Composite Semiconductors. J. Spectrosc. 2018, 2018, 6260458. [Google Scholar] [CrossRef]
- Chen, Z.; Fu, M.L.; Huang, X.D.; Yuan, B.; Yang, J.C.E. Magnetic infrared responsive photocatalyst: Fabrication, characterization, and photocatalytic performance of β-NaYF4:Yb3+,Tm3+/TiO2/Fe3O4@SiO2 composite. Res. Chem. Intermed. 2018, 44, 6369–6385. [Google Scholar] [CrossRef]
- Luna-Flores, A.; Sosa-Sánchez, J.L.; Morales-Sánchez, M.A.; Agustín-Serrano, R.; Luna-López, J.A. An easy-made, economical and efficient carbon-doped amorphous TiO2 photocatalyst obtained bymicrowave assisted synthesis for the degradation of Rhodamine B. Materials 2017, 10, 1447. [Google Scholar] [CrossRef]
- Movlaee, K.; Periasamy, P.; Krishnakumar, T.; Ganjali, M.R.; Leonardi, S.G.; Neri, G.; Chavali, M.; Siril, P.F.; Devarajan, V.P. Microwave-assisted synthesis and characterization of WOx nanostructures for gas sensor application. J. Alloys Compd. 2018, 762, 745–753. [Google Scholar] [CrossRef]
- Choy, J.H.; Kim, Y.I.; Yoon, J.B.; Choy, S.H. Temperature-dependent structural evolution and electrochromic properties of peroxopolytungstic acid. J. Mater. Chem. 2001, 11, 1506–1513. [Google Scholar] [CrossRef]
- Yuksel, R.; Durucan, C.; Unalan, H.E. Ternary nanocomposite SWNT/WO3/PANI thin film electrodes for supercapacitors. J. Alloys Compd. 2016, 658, 183–189. [Google Scholar] [CrossRef]
- Kalaiarasi, S.; Jose, M. Streptomycin loaded TiO2 nanoparticles: Preparation, characterization and antibacterial applications. J. Nanostructure Chem. 2017, 7, 47–53. [Google Scholar] [CrossRef]
- Maulidiyah; Wibowo, D.; Hikmawati; Salamba, R.; Nurdin, M. Preparation and characterization of activated carbon from coconut shell-doped TiO2 in water medium. Orient. J. Chem. 2015, 31, 2337–2342. [Google Scholar] [CrossRef]
- Kedves, E.-Z.; Fodor, C.; Fazekas, Á.; Székely, I.; Szamosvölgyi, Á.; Sápi, A.; Kónya, Z.; Cristian Pop, L.; Baia, L.; Pap, Z. α-MoO3 with inhibitive properties in Fenton reactions and insights on its general impact on OH radical based advanced oxidation processes. Appl. Surf. Sci. 2023, 624, 156914. [Google Scholar] [CrossRef]
- Kedves, E.-Z.; Bárdos, E.; Ravasz, A.; Tóth, Z.-R.; Mihálydeákpál, S.; Kovács, Z.; Pap, Z.; Baia, L. Photoinhibitive Properties of α-MoO3 on Its Composites with TiO2, ZnO, BiOI, AgBr, and Cu2O. Materials 2023, 16, 3621. [Google Scholar] [CrossRef] [PubMed]
- Fateixa, S.; Nogueira, H.I.S.; Trindade, T. Surface-Enhanced Raman Scattering Spectral Imaging for the Attomolar Range Detection of Crystal Violet in Contaminated Water. ACS Omega 2018, 3, 4331–4341. [Google Scholar] [CrossRef]
- Wu, J.; Yang, X.; Fang, J. Convective combined interfacial assembly of surfactantless ordered Au nanoparticles and SERS performance. J. Nanoparticle Res. 2019, 21, 78. [Google Scholar] [CrossRef]
- Cañamares, M.V.; Chenal, C.; Birke, R.L.; Lombardi, J.R. DFT, SERS, and single-molecule SERS of crystal violet. J. Phys. Chem. C 2008, 112, 20295–20300. [Google Scholar] [CrossRef]
- Wang, J.; Gao, X.; Sun, H.; Su, B.; Gao, C. Monodispersed graphene quantum dots encapsulated Ag nanoparticles for surface-enhanced Raman scattering. Mater. Lett. 2016, 162, 142–145. [Google Scholar] [CrossRef]
- Lin, S.C.; Zhang, X.; Zhao, W.C.; Chen, Z.Y.; Du, P.; Zhao, Y.M.; Wu, Z.L.; Xu, H.J. Quantitative and sensitive detection of prohibited fish drugs by surface-enhanced Raman scattering. Chin. Phys. B 2018, 27, 028707. [Google Scholar] [CrossRef]
- Morovvati, B.; Malekfar, R. Surface Enhanced Raman Scattering of Crystal Violet with Low Concentrations Using Self-Assembled Silver and Gold-Silver Core-Shell Nanoparticles. Int. J. Opt. Photonics 2019, 13, 89–96. [Google Scholar] [CrossRef]
- Škrabić, M.; Kosović, M.; Gotić, M.; Mikac, L.; Ivanda, M.; Gamulin, O. Near-infrared surface-enhanced raman scattering on silver-coated porous silicon photonic crystals. Nanomaterials 2019, 9, 421. [Google Scholar] [CrossRef]
- Ma, H.; Xu, L.; Tian, Y.; Jiao, A.; Zhang, M.; Li, S.; Chen, M. Design of a thermally stable and highly active SERS optical sensor for the ultrasensitive detection of dye molecules at high-temperature. Opt. Mater. Express 2021, 11, 2001. [Google Scholar] [CrossRef]
- Smitha, S.L.; Gopchandran, K.G.; Smijesh, N.; Philip, R. Size-dependent optical properties of Au nanorods. Prog. Nat. Sci. Mater. Int. 2013, 23, 36–43. [Google Scholar] [CrossRef]
- Camerlingo, C.; Portaccio, M.; d’Apuzzo, F.; Nucci, L.; Perillo, L.; Lepore, M. μ-FTIR, μ-Raman, and SERS Analysis of Amide I Spectral Region in Oral Biofluid Samples during Orthodontic Treatment. Sensors 2022, 22, 7874. [Google Scholar] [CrossRef] [PubMed]
- Xue, L.; Yan, B.; Li, Y.; Tan, Y.; Luo, X.; Wang, M. Surface-enhanced raman spectroscopy of blood serum based on gold nanoparticles for tumor stages detection and histologic grades classification of oral squamous cell carcinoma. Int. J. Nanomed. 2018, 13, 4977–4986. [Google Scholar] [CrossRef] [PubMed]
- Indrasekara, A.S.D.S.; Thomas, R.; Fabris, L. Plasmonic properties of regiospecific core-satellite assemblies of gold nanostars and nanospheres. Phys. Chem. Chem. Phys. 2014, 17, 21133–21142. [Google Scholar] [CrossRef] [PubMed]
- Pattabiraman, V.R.; Bode, J.W. Rethinking amide bond synthesis. Nature 2011, 480, 471–479. [Google Scholar] [CrossRef] [PubMed]
- Alfano, A.I.; Lange, H.; Brindisi, M. Amide Bonds Meet Flow Chemistry: A Journey into Methodologies and Sustainable Evolution. ChemSusChem 2022, 15, e202102708. [Google Scholar] [CrossRef] [PubMed]
- Darienzo, R.E.; Chen, O.; Sullivan, M.; Mironava, T.; Tannenbaum, R. Au nanoparticles for SERS: Temperature-controlled nanoparticle morphologies and their Raman enhancing properties. Mater. Chem. Phys. 2020, 240, 122143. [Google Scholar] [CrossRef]
- Nikoobakht, B.; Burda, C.; Braun, M.; Hun, M.; El-Sayed, M.A. The Quenching of CdSe Quantum Dots Photoluminescence by Gold Nanoparticles in Solution. Photochem. Photobiol. 2002, 75, 591. [Google Scholar] [CrossRef] [PubMed]
- Vilela, D.; Cristina González, M.; Escarpa, A. Gold-nanosphere formation using food sample endogenous polyphenols for in-vitro assessment of antioxidant capacity. Anal. Bioanal. Chem. 2012, 404, 341–349. [Google Scholar] [CrossRef] [PubMed]
- Kang, M.; Liang, J.; Wang, F.; Chen, X.; Lu, Y.; Zhang, J. Structural design of hexagonal/monoclinic WO3 phase junction for photocatalytic degradation. Mater. Res. Bull. 2020, 121, 110614. [Google Scholar] [CrossRef]
- Jaiswal, M.K.; Choudhury, B. Hydrated Orthorhombic/Hexagonal Mixed-Phase WO3 Core-Shell Nanoribbons for Hole-Mediated Photocatalysis. ACS Appl. Nano Mater. 2022, 5, 3599–3610. [Google Scholar] [CrossRef]
- Lin, R.; Wan, J.; Xiong, Y.; Wu, K.; Cheong, W.; Zhou, G.; Wang, D.; Peng, Q.; Chen, C.; Li, Y. Quantitative Study of Charge Carrier Dynamics in Well-Defined WO3 Nanowires and Nanosheets: Insight into the Crystal Facet Effect in Photocatalysis. J. Am. Chem. Soc. 2018, 140, 9078–9082. [Google Scholar] [CrossRef] [PubMed]
- Enesca, A.; Isac, L. The influence of light irradiation on the photocatalytic degradation of organic pollutants. Materials 2020, 13, 2494. [Google Scholar] [CrossRef] [PubMed]


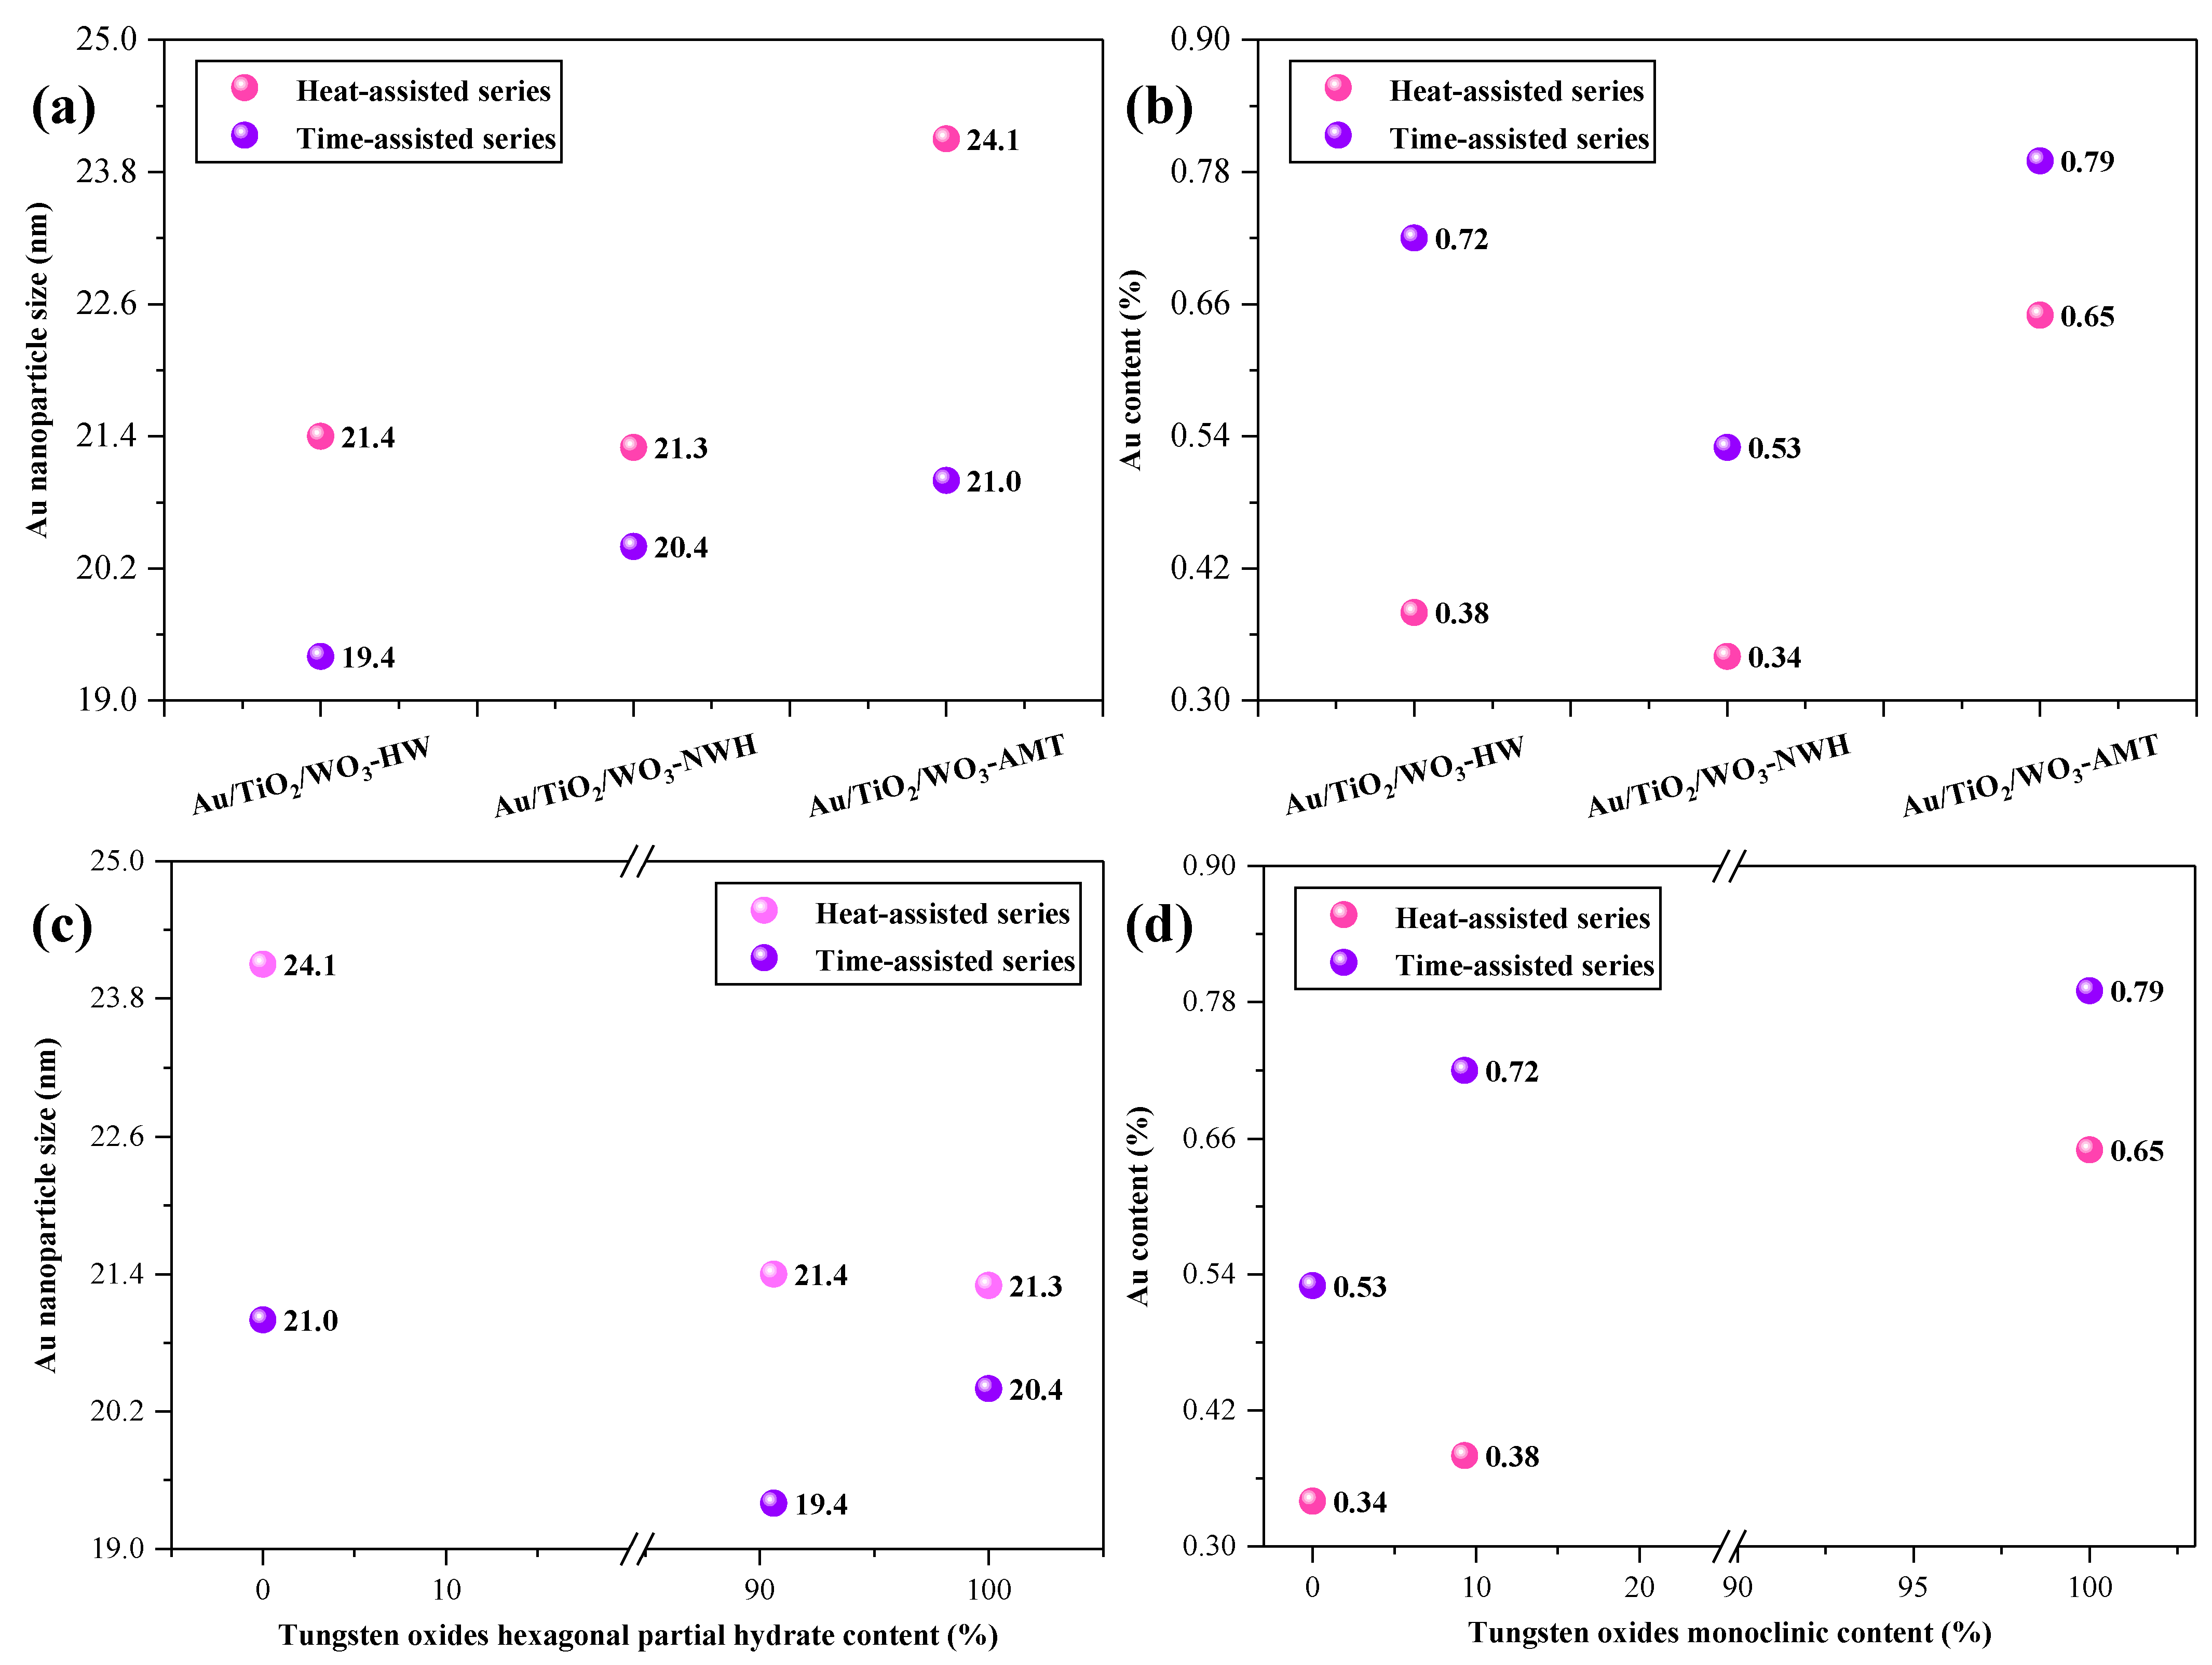
| Sample | Diameter (nm) | Standard Deviation (SD) |
|---|---|---|
| Au/TiO2/WO3-HW−HA | 21.4 | ±5.2 nm |
| Au/TiO2/WO3-HW−TA | 19.4 | ±5.4 nm |
| Au/TiO2/WO3-NWH−HA | 21.3 | ±5.2 nm |
| Au/TiO2/WO3-NWH−TA | 20.4 | ±4.2 nm |
| Au/TiO2/WO3-AMT−HA | 24.1 | ±6.7 nm |
| Au/TiO2/WO3-AMT−TA | 21.0 | ±4.4 nm |
| Sample | Elemental Composition (%) | ||||||
|---|---|---|---|---|---|---|---|
| Au | O | Na | Al | Cl | Ti | W | |
| Au/TiO2/WO3-HW−HA | 0.38 | 54.81 | 1.90 | 1.05 | 0.48 | 28.98 | 12.40 |
| Au/TiO2/WO3-HW−TA | 0.72 | 45.60 | 3.00 | 1.12 | 1.38 | 33.29 | 14.89 |
| Au/TiO2/WO3-NWH−HA | 0.34 | 48.26 | 1.00 | 2.68 | 0.27 | 37.54 | 9.91 |
| Au/TiO2/WO3-NWH−TA | 0.53 | 52.66 | 3.34 | 1.01 | 0.83 | 32.92 | 8.70 |
| Au/TiO2/WO3-AMT−HA | 0.65 | 48.02 | 1.25 | 0.68 | 0.68 | 38.76 | 9.96 |
| Au/TiO2/WO3-AMT−TA | 0.79 | 47.02 | 2.68 | 0.87 | 1.18 | 39.80 | 7.67 |
| Sample | Lattice Parameters | ||||||
|---|---|---|---|---|---|---|---|
| Hexagonal Partial Hydrate | Monoclinic | ||||||
| a | b | b | a | b | c | β | |
| Au/TiO2/WO3-HW-HA | 4.431 | 4.432 | 7.304 | 7.311 | 7.532 | 7.633 | 104.110 |
| Au/TiO2/WO3-HW-TA | 4.429 | 4.431 | 7.873 | 7.426 | 7.527 | 7.724 | 103.680 |
| Au/TiO2/WO3-NWH-HA | 4.416 | 4.416 | 7.738 | - | - | - | - |
| Au/TiO2/WO3-NWH-TA | 4.416 | 4.416 | 7.744 | - | - | - | - |
| Au/TiO2/WO3-AMT-HA | - | - | - | 7.297 | 7.527 | 7.610 | 105.060 |
| Au/TiO2/WO3-AMT-TA | - | - | - | 7.522 | 7.540 | 7.905 | 103.873 |
| Sample | TiO2 | WO3-HW | WO3-NWH | WO3-AMT | TiO2/WO3-HW | TiO2/WO3-NWH | TiO2/WO3-AMT |
|---|---|---|---|---|---|---|---|
| Band gap value (eV) | 3.11 | 2.75 | 2.69 | 2.25 | 3.00 | 2.97 | 3.10 |
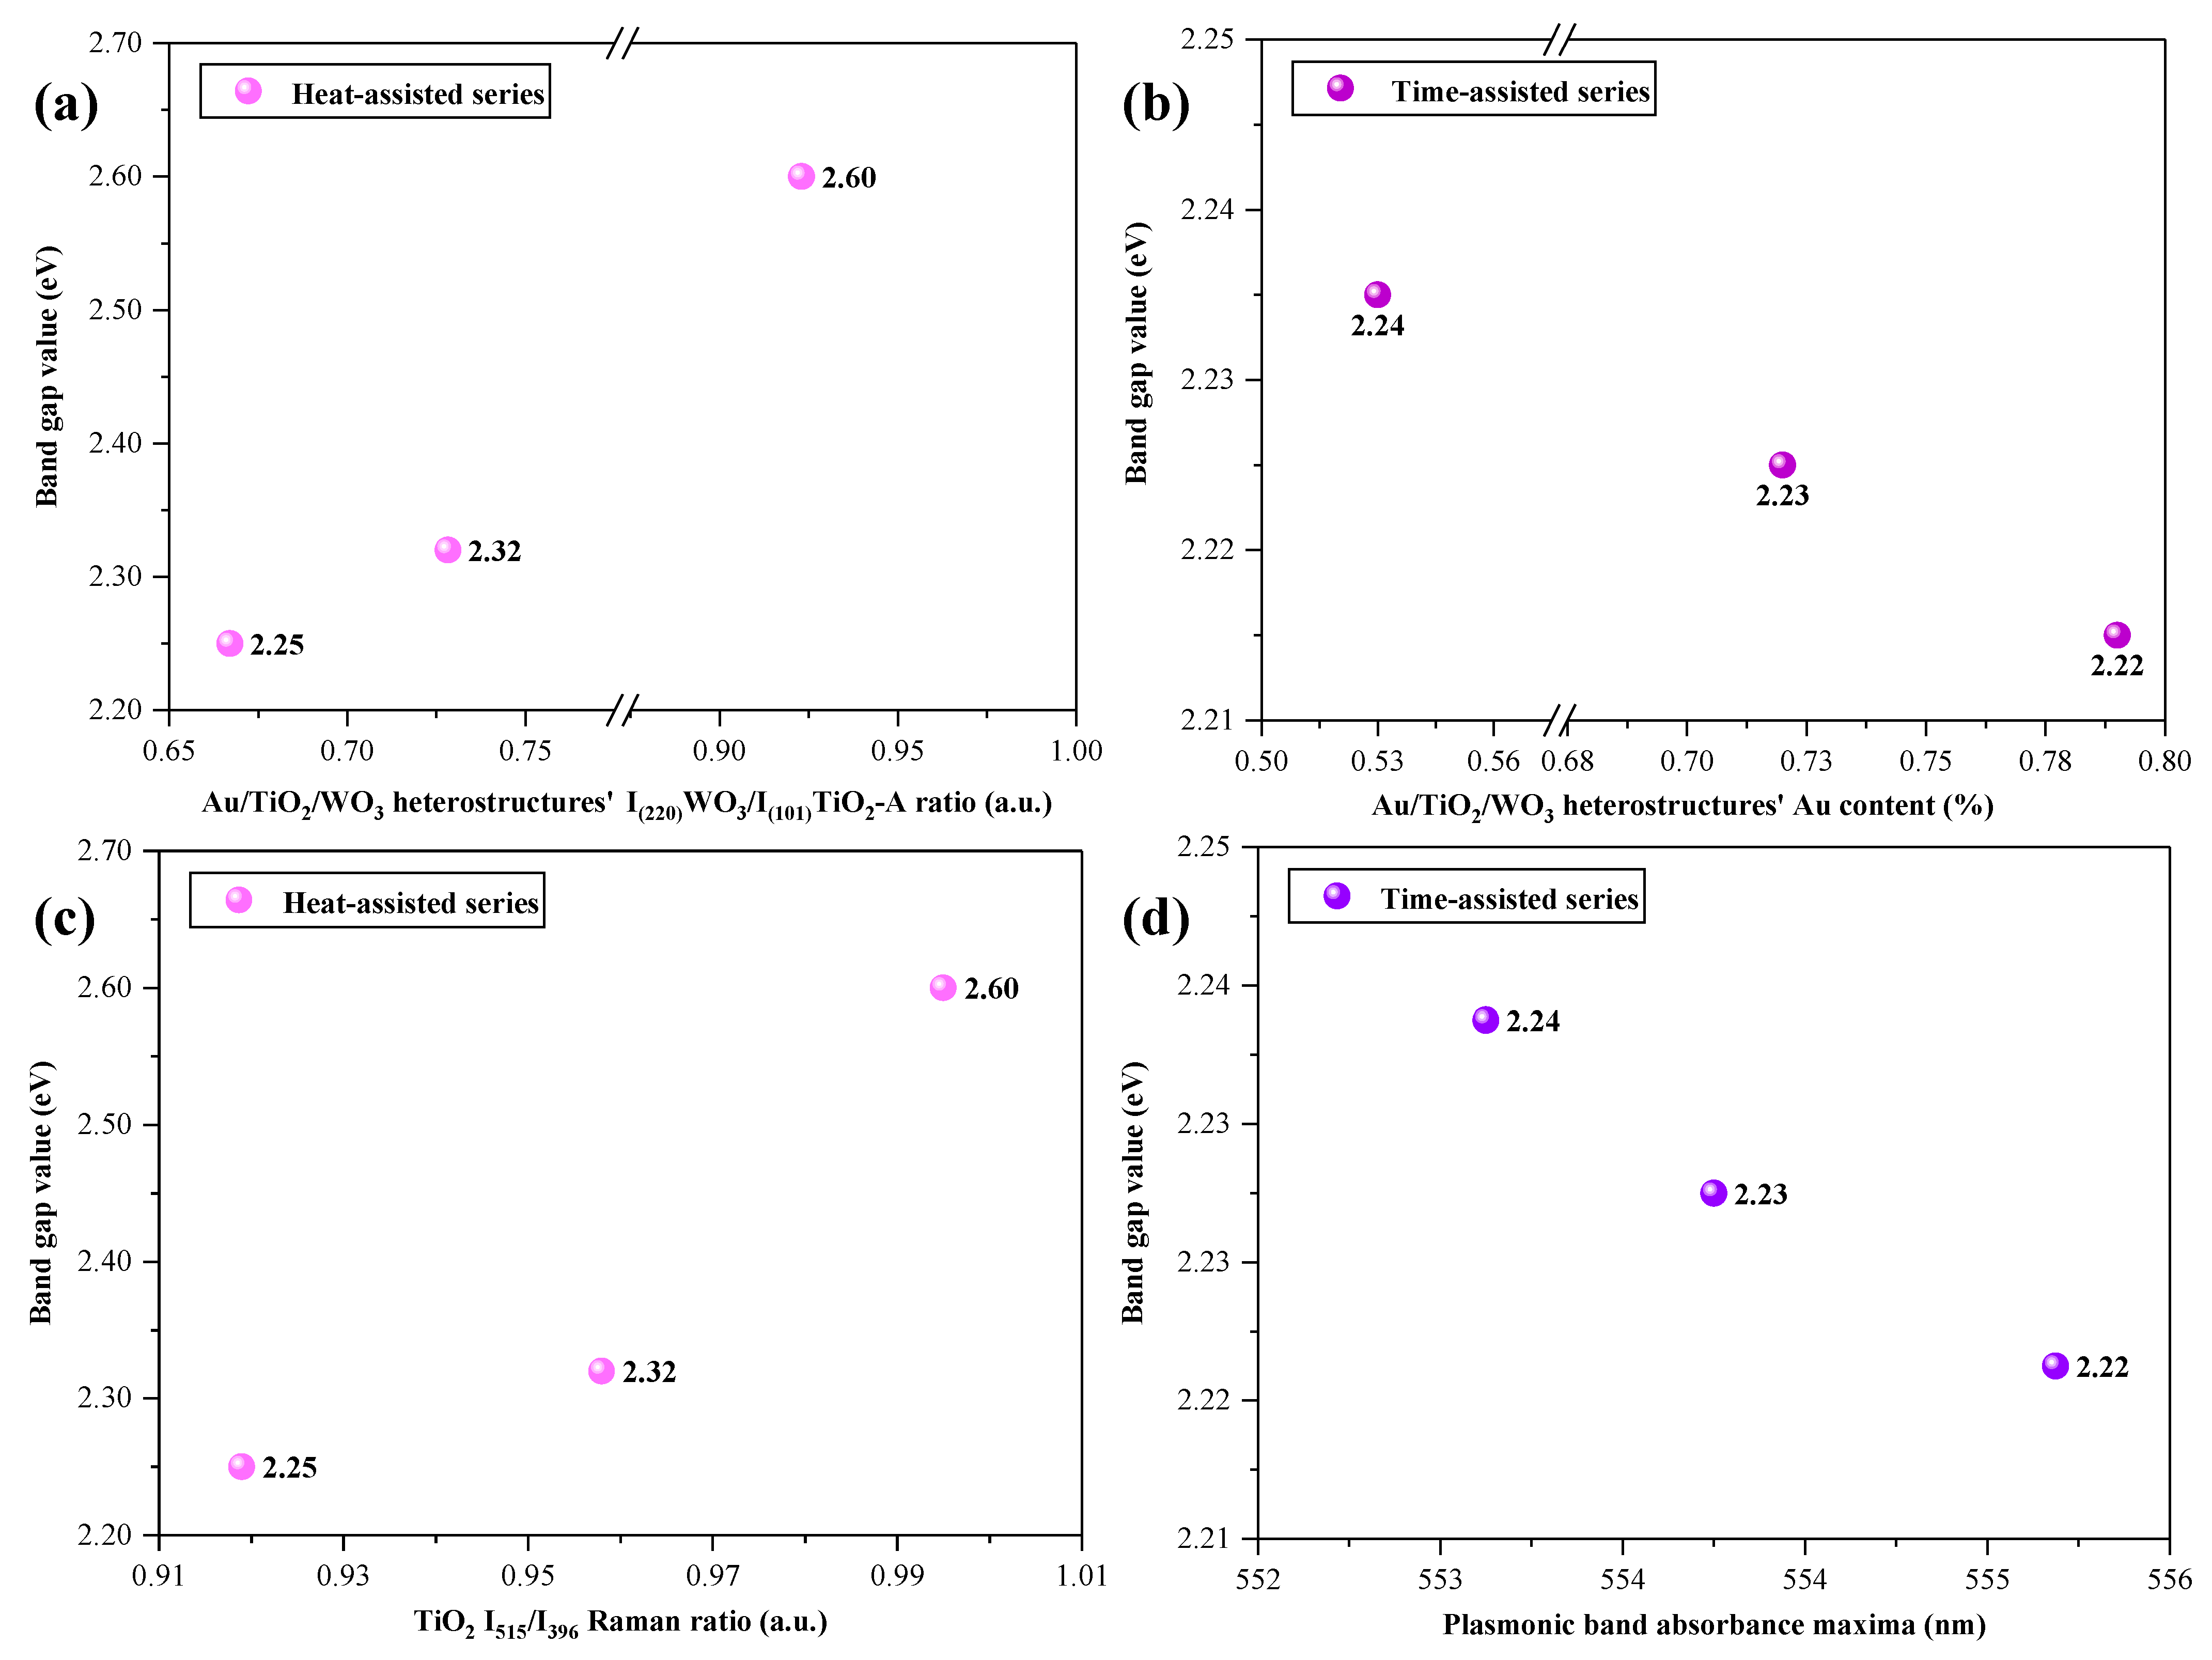
| Sample | Au/TiO2/WO3-HW−HA | Au/TiO2/WO3-HW−TA | Au/TiO2/WO3-NWH−HA | Au/TiO2/WO3-NWH−TA | Au/TiO2/WO3-AMT−HA | Au/TiO2/WO3-AMT−TA |
|---|---|---|---|---|---|---|
| Band gap value (eV) | 2.25 | 2.23 | 2.60 | 2.24 | 2.32 | 2.22 |
| Au wt. % | 0.38 | 0.72 | 0.34 | 0.53 | 0.65 | 0.79 |
| Sample | I515/I396 (TiO2 Bands Ratio) | I810/I926 (WO3 Bands Ratio) | WO3 Crystal Phases |
|---|---|---|---|
| Au/TiO2/WO3-HW−HA | 0.919 | 0.952 | Mixed |
| Au/TiO2/WO3-HW−TA | 0.879 | 0.921 | Mixed |
| Au/TiO2/WO3-NWH−HA | 0.995 | 0.986 | Hexagonal partial hydrate |
| Au/TiO2/WO3-NWH−TA | 0.928 | 0.986 | Hexagonal partial hydrate |
| Au/TiO2/WO3-AMT−HA | 0.958 | 0.993 | Monoclinic |
| Au/TiO2/WO3-AMT−TA | 0.962 | 0.997 | Monoclinic |
| Sample | Atomic Composition (%) | ||||
|---|---|---|---|---|---|
| O | C | Ti | W | Au | |
| Au/TiO2/WO3-HW-HA | 38.17 | 51.79 | 8.36 | 1.55 | 0.13 |
| Au/TiO2/WO3-HW-TA | 41.65 | 46.23 | 8.99 | 2.97 | 0.16 |
| Au/TiO2/WO3-NWH-HA | 35.07 | 54.07 | 9.84 | 0.95 | 0.07 |
| Au/TiO2/WO3-NWH-TA | 42.92 | 43.88 | 10.89 | 2.19 | 0.11 |
| Au/TiO2/WO3-AMT-HA | 33.59 | 57.77 | 7.34 | 1.23 | 0.07 |
| Au/TiO2/WO3-AMT-TA | 39.76 | 48.39 | 10.42 | 1.26 | 0.17 |
| Sample | eV | ||
|---|---|---|---|
| Eg | CB | VB | |
| Au/TiO2/WO3-HW-HA | 2.25 | −0.56 | 1.69 |
| Au/TiO2/WO3-HW-TA | 2.23 | −0.56 | 1.67 |
| Au/TiO2/WO3-NWH-HA | 2.60 | −0.90 | 1.70 |
| Au/TiO2/WO3-NWH-TA | 2.24 | −0.77 | 1.47 |
| Au/TiO2/WO3-AMT-HA | 2.32 | −0.83 | 1.49 |
| Au/TiO2/WO3-AMT-TA | 2.22 | −0.35 | 1.87 |
| Sample | Limit of Detection (M) | Au wt.% | WO3 Crystal Phases |
|---|---|---|---|
| Au/TiO2/WO3-HW−HA | 10−7 | 0.38 | Mixed |
| Au/TiO2/WO3-HW−TA | 10−8 | 0.72 | Mixed |
| Au/TiO2/WO3-NWH−HA | 10−7 | 0.34 | Hexagonal partial hydrate |
| Au/TiO2/WO3-NWH−TA | 10−7 | 0.53 | Hexagonal partial hydrate |
| Au/TiO2/WO3-AMT−HA | 10−7 | 0.65 | Monoclinic |
| Au/TiO2/WO3-AMT−TA | 10−8 | 0.79 | Monoclinic |
Disclaimer/Publisher’s Note: The statements, opinions and data contained in all publications are solely those of the individual author(s) and contributor(s) and not of MDPI and/or the editor(s). MDPI and/or the editor(s) disclaim responsibility for any injury to people or property resulting from any ideas, methods, instructions or products referred to in the content. |
© 2023 by the authors. Licensee MDPI, Basel, Switzerland. This article is an open access article distributed under the terms and conditions of the Creative Commons Attribution (CC BY) license (https://creativecommons.org/licenses/by/4.0/).
Share and Cite
Székely, I.; Kovács, Z.; Rusu, M.; Gyulavári, T.; Todea, M.; Focșan, M.; Baia, M.; Pap, Z. Tungsten Oxide Morphology-Dependent Au/TiO2/WO3 Heterostructures with Applications in Heterogenous Photocatalysis and Surface-Enhanced Raman Spectroscopy. Catalysts 2023, 13, 1015. https://doi.org/10.3390/catal13061015
Székely I, Kovács Z, Rusu M, Gyulavári T, Todea M, Focșan M, Baia M, Pap Z. Tungsten Oxide Morphology-Dependent Au/TiO2/WO3 Heterostructures with Applications in Heterogenous Photocatalysis and Surface-Enhanced Raman Spectroscopy. Catalysts. 2023; 13(6):1015. https://doi.org/10.3390/catal13061015
Chicago/Turabian StyleSzékely, István, Zoltán Kovács, Mihai Rusu, Tamás Gyulavári, Milica Todea, Monica Focșan, Monica Baia, and Zsolt Pap. 2023. "Tungsten Oxide Morphology-Dependent Au/TiO2/WO3 Heterostructures with Applications in Heterogenous Photocatalysis and Surface-Enhanced Raman Spectroscopy" Catalysts 13, no. 6: 1015. https://doi.org/10.3390/catal13061015
APA StyleSzékely, I., Kovács, Z., Rusu, M., Gyulavári, T., Todea, M., Focșan, M., Baia, M., & Pap, Z. (2023). Tungsten Oxide Morphology-Dependent Au/TiO2/WO3 Heterostructures with Applications in Heterogenous Photocatalysis and Surface-Enhanced Raman Spectroscopy. Catalysts, 13(6), 1015. https://doi.org/10.3390/catal13061015