Article

Gas-Phase Deoxygenation of Biomass Pyrolysis Tar Catalyzed by Rare Earth Metal Loaded Hβ Zeolite

1
Department of Chemical Engineering, University of Al-Qadisiyah, Al-Qadisiyah 58002, Iraq
2
Institute of Chemical and Environmental Engineering, Faculty of Chemical and Food Technology, Slovak University of Technology, Radlinského 9, 812 37 Bratislava, Slovakia
*
Author to whom correspondence should be addressed.
Catalysts 2023, 13(6), 1016; https://doi.org/10.3390/catal13061016
Submission received: 15 May 2023 / Revised: 8 June 2023 / Accepted: 12 June 2023 / Published: 17 June 2023

Abstract

:
Biomass pyrolysis tar (BPT) with a higher heating value of 24.23 MJ/kg was used as raw feed for the catalytic gas-phase deoxygenation (GDO) process using Hβ zeolite loaded with different amounts of active elements (Ce, La, and Nd). Acetone molecule was chosen as a model compound to test the activity of pure Hβ zeolite, 1 wt% Ce/Hβ zeolite, 5 wt% Ce/Hβ zeolite, 1 wt% La/Hβ zeolite, 5 wt% La/Hβ zeolite, 1 wt% Nd/Hβ zeolite, and 5 wt% Nd/Hβ zeolite at 400 °C and process time of 3 h. BPT characterization showed a wide range of oxygenated compounds with the main components including water: 0.71%, furfural: 5.85%, 4-ethylguaiacol: 2.14%, phenol: 13.63%, methylethyl ketone: 5.34%, cyclohexanone: 3.23%, isopropanol: 4.78%, ethanol: 3.67%, methanol: 3.13%, acetic acid: 41.06%, and acetone: 16.46%. BPT conversion using 1 wt% Ce/Hβ zeolite catalyst showed the highest values of degree of deoxygenation (DOD) (68%) and conversion (16% for phenol, 88% for acetic acid, and 38% for 4-ethlyguaiacol). Yields of water, liquid phase, and gas phase in the GDO reaction using 1%Ce/Hβ zeolite were 18.33%, 47.42%, and 34.25%, respectively. Alkyl-substituted phenols and aromatic hydrocarbons achieved the highest yields of 37.34% and 35.56%, respectively. The main interaction pathways for BPT-GDO are also proposed.

1. Introduction

Biomass utilization as a source of renewable energy has received great attention due to its CO2 mitigation and abundant availability [1]. The biomass of lignocellulosic origin consists mainly of cellulose (20–50%), hemicellulose (15–40%), and lignin (15–35%) in addition to water and some organic and inorganic compounds [2]. Such biomass can be converted into bioenergy or biofuel using thermochemical processes i.e., gasification and pyrolysis [3]. Through the pyrolysis process, biomass is converted into tar, char, and pyrolysis gas; tar being the main product of the process with a heating value of up to 20 MJ/kg which makes it an expected source of biofuel [4]. Unfortunately, due to its high oxygen content, biomass pyrolysis tar (BPT) has many drawbacks when used as biofuel such as instability, high viscosity, high acidity, and lower calorific value [5].
Thus, similar to the catalytic hydrotreatment process for petroleum oil refining can also be used for BPT upgrading which is known as the catalytic deoxygenation (DO) process [6]. DO process upgrades tar oil by removing oxygen, decreasing coke generation, increasing the H/C of the produced biofuel, and producing chemicals of high added value [7]. Literature sources report that BPT contains a high amount of oxygenated compounds such as ketones, phenols, furans, organic acids, ethers, and aldehydes [8]. Most of the previous studies focused on a single model compound for BPT-DO process analysis, such as furfural [9], 2-methylfuran [10], phenol [11], quaiacol [12], acetic acid [13], 2-furyl methyl ketone [14], and acetone [15].
Some researchers explained the interaction between oxygenated BPT compounds and proposed reaction routes using a mixture of model compounds due to the complexity of BPT. However, the studies analyze the DO process for a mixture of model compounds using noble and non-noble metal catalysts [16,17] or zeolite catalysts [18,19]. Among the most recent works, Yu et al. found that the highest conversion in the hydrogenation of a mixture of acetic acid and furfural was 57% for furfural with selectivity to esters and alcohols of 66.5% when using Al2(SiO3)3 as a support with 5% Pd-loaded catalyst. Moreover, they reported that the presence of other oxygenated molecules (such as acetic acid) led to only a small interaction effect [20]. Wang et al. investigated DO of a mixture of p-crysol and acetic acid in the aqueous phase using carbon support loaded with Ru as an active catalyst, which yielded high selectivity towards methylcyclohexane showing the preference of DO reaction of p-crysol in the presence of acetic acid [21].
In addition, Chen et al. tested the DO of a mixture composed of phenol, n-butanal, and acetic acid using a mixture of HZSM-5 zeolite and a carbon supported Ru-active catalyst. The yield of butyl acetate and butanol was 98.5% from n-butanal compared to 93.8% for cyclohexyl acetate and cyclohyxanol from phenol [22]. A mixture of formic acid and phenol DO have also been investigated by other researchers using MCM-41 loaded with different active elements (Ru, Pt, and Pd) and showing that the increase of phenol to formic acid ratio decreases the degree of phenol DO [23]. Another study reported high esterification activity and 100% DO yield using a mixture of propanoic acid and quaiacol with hierarchical ZSM-5 loaded with Ni-active catalyst [24].
Moreover, two phenol mixtures (phenol/anisole and M-crysole/anisole) using Pd-loaded carbon and Pt-loaded Al2O3 were studied and showed weak interaction of model compounds and adsorption competition on active sites [25]. In yet another work, ZSM-5 zeolite loaded with Ni2P active catalyst was used for DO of a mixture of acetic acid and quaiacol, where competition between acetic acid and quaiacol on the active sites led to the inhibition in the quaiacol DO [26]. In a recent study, interactions between model compounds were investigated for DO of two different mixtures, the first one composed of phenol and acetic acid and the second one composed of water, furfural, 4-ethylguaiacolis, phenol, acetic acid, and acetone as a simulated bio-oil, using HZSM-5 loaded with Ni2P active catalyst and proposing a reaction network for the process. The authors found that HZSM-5 activity increased when Ni2P was loaded into the surface of the blank zeolite, thus increasing the conversion of acetic acid and decreasing the conversion of phenol with the increasing temperature due to the adsorption competition on the active sites. Moreover, higher temperatures led to increased production of aromatics and substituted phenols through the alkyl substitution of benzene and phenol, respectively [13].
Hβ zeolite has a high content of silica, a highly acidic nature, and a unique channel structure of large pores which provide suitable conversion of palm oil into hydrocarbons [27]. Adding rare earth metals to the structure of zeolite decreased the dealumination, resulting in increased rate of hydrogen transfer and zeolite activity per weight [28]. Deoxygenation processes usually run in liquid phase under high pressure for maintaining existence of the liquid phase and better sorption of hydrogen into it. In this work, a different approach was selected. Liquid products are still in the form of vapors when leaving the pyrolysis reactor. That is why a deoxygenation in gaseous phase was selected and tested. The present work provides important data regarding the use of BPT to solve the problem of the accumulation of it from the pyrolysis process of wooden chips. To the best of our knowledge, no previous work has been conducted on real biomass pyrolysis tar using Hβ zeolite. Modified Hβ zeolites using salts of rare earth metals will affect the general framework of zeolites, it will form bridges between atoms of rare metals and oxygen atoms, which leads to the strengthening and fixing of these metals on zeolites, thus increasing the stability of the catalyst. In addition to increasing the acidic bronsted sites of the catalyst because the ionic diameter of the rare metals will increase and thus the efficiency of the simultaneous reactions that will be conducted in this research will increase.
Thus, the present work is focused on the investigation of the BPT GDO using Hβ zeolite loaded with different amounts of Ce, La, and Nd active catalysts. The rare earth metal loaded Hβ zeolite catalyst was prepared using insipient wetness impregnation method and characterized before and after regeneration using X-ray diffraction (XRD), X-ray florescence spectroscopy (XRF), Ammonia–Temperature programmed desorption (Ammonia-TPD), Pyridine-Fourier Transform Infra-Red Spectroscopy (Pyr-FTIR), Thermo-Gravimetric and Differential Thermo gravimetric analysis (TGA and DTG), and Brunauer–Emmett–Teller analysis (BET). The effects of reaction conditions (process time, temperature, rare earth metal loading type, and amount) on the biofuel yield are studied. BPT characterization showed a highly complicated composition containing a wide range of oxygenated compounds with the main components including water, furfural, 4-ethylguaiacol, phenol, methylethyl ketone, cyclohexanone, acetic acid, and acetone. The main interaction pathways for acetone and BPT-GDO are also proposed.

2. Results

2.1. Zeolite Characterization

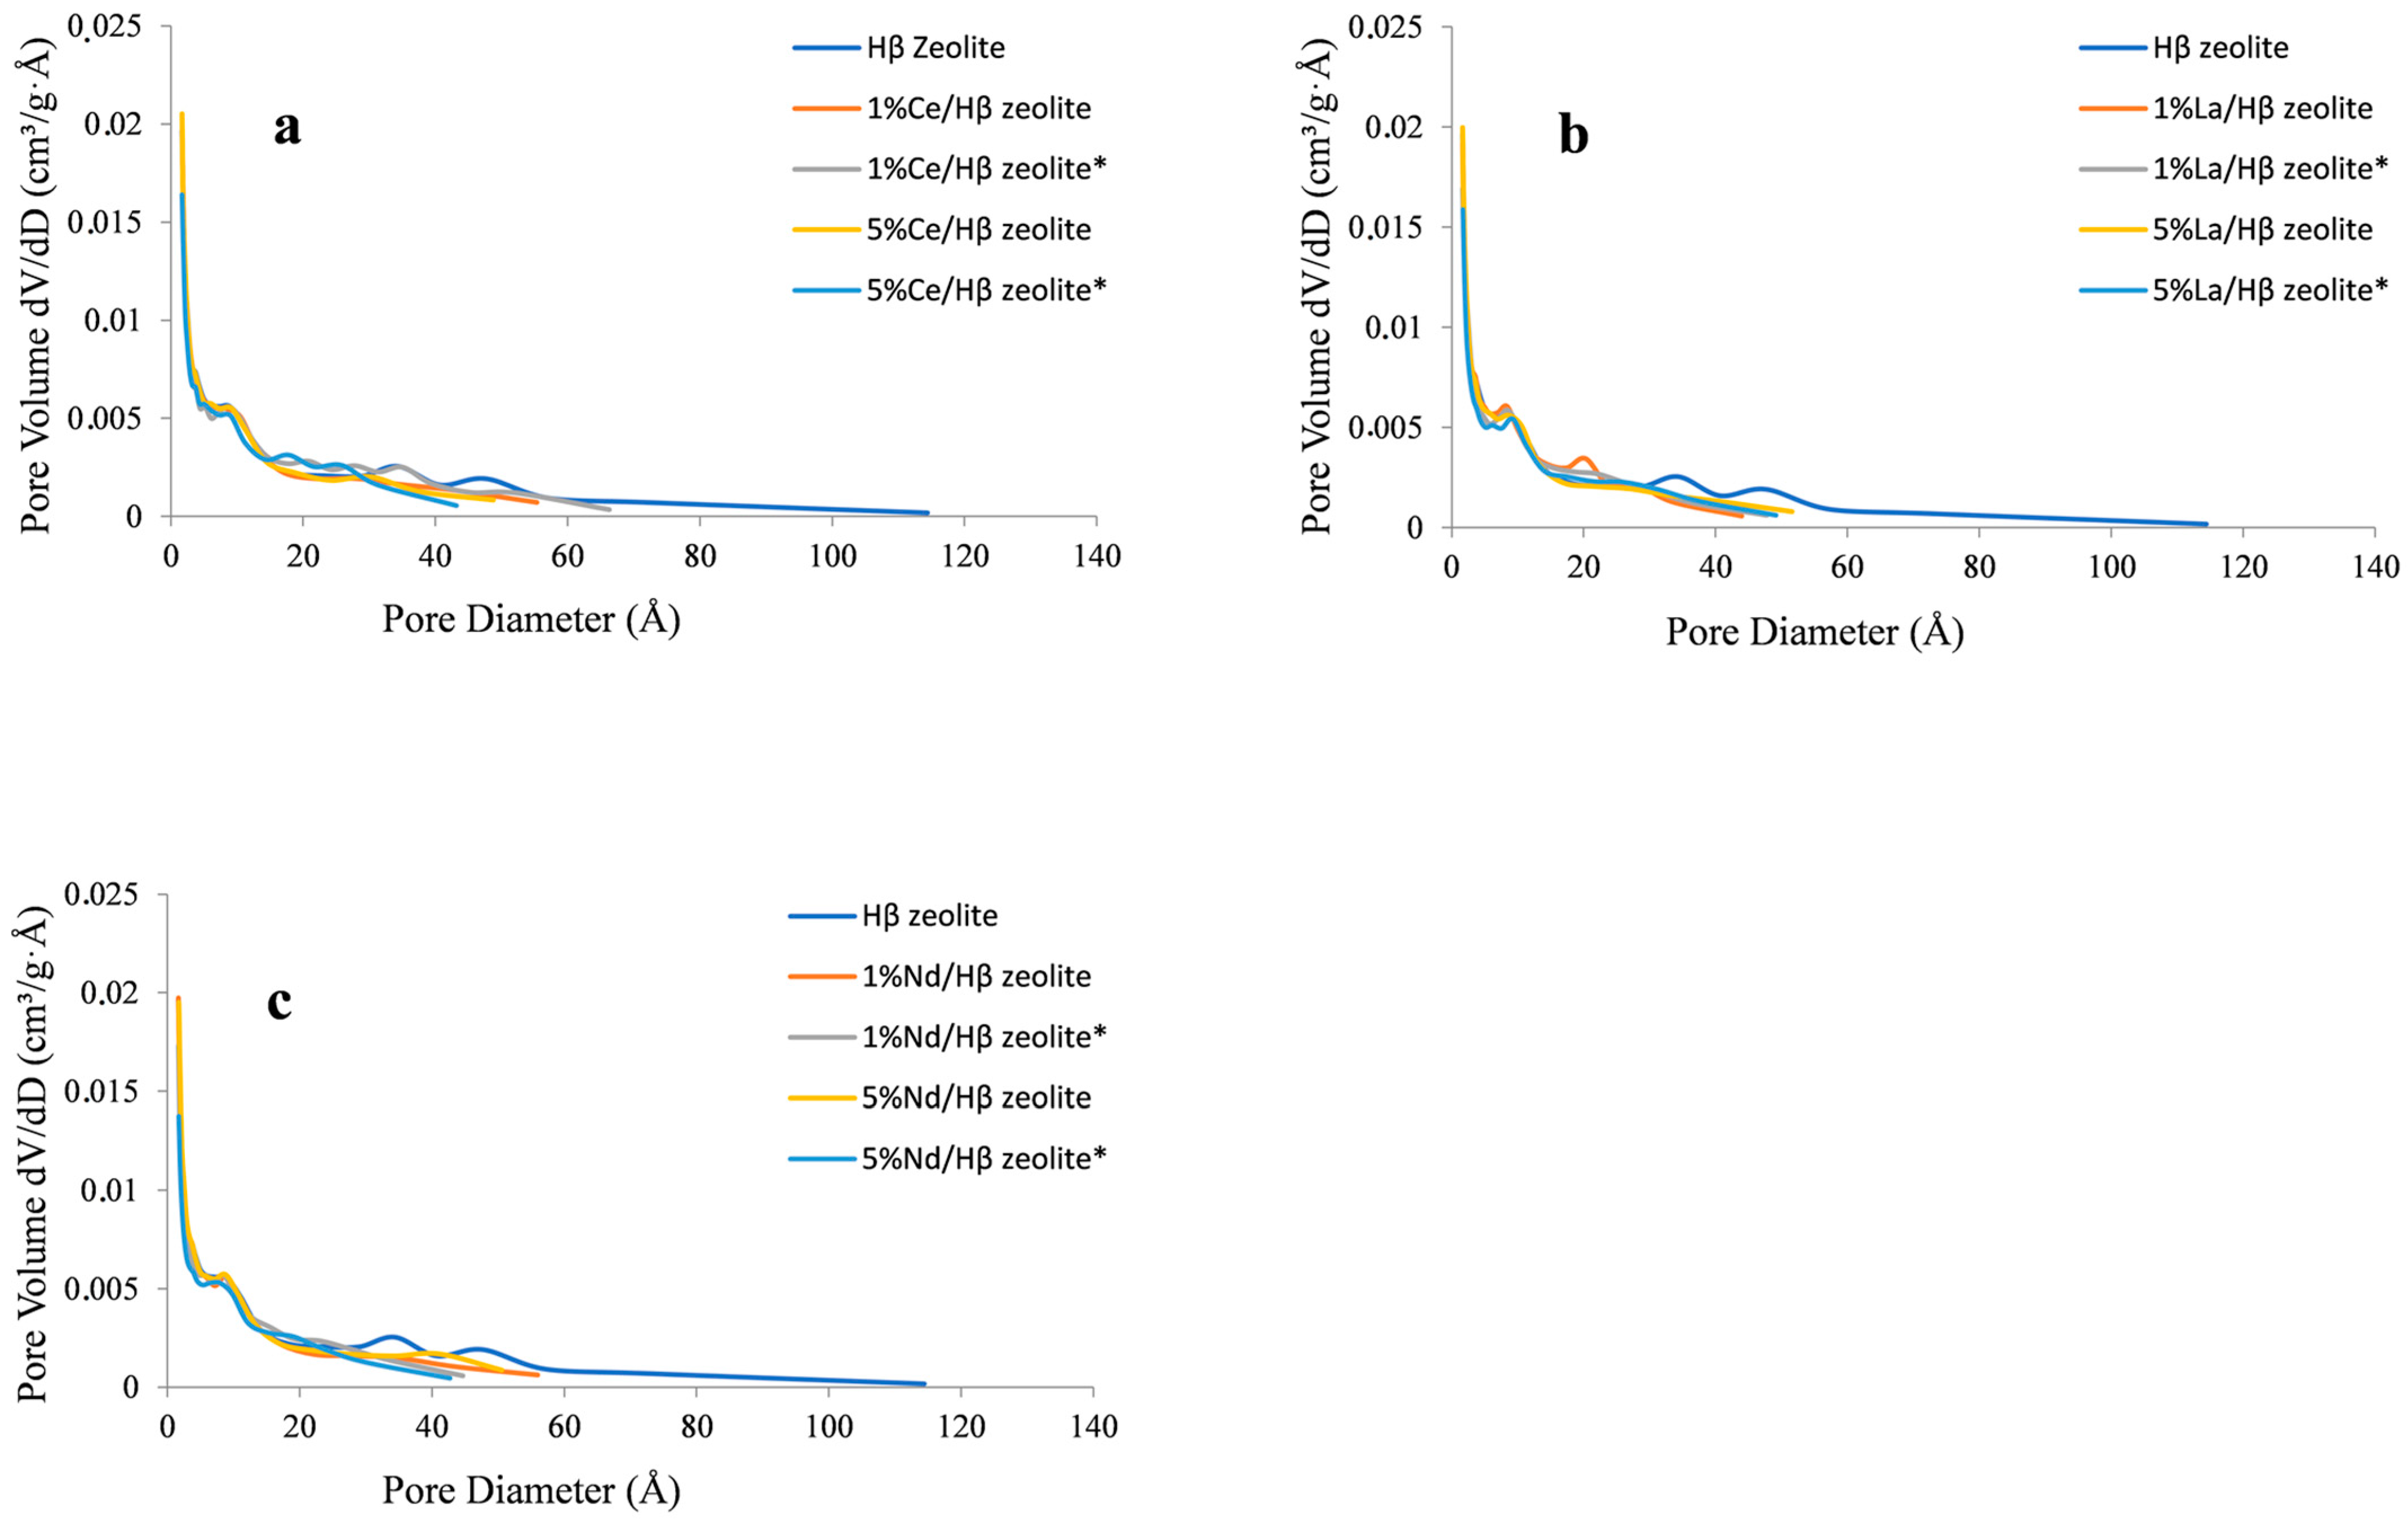
Isotherms of N2 adsorption–desorption for pure Hβ zeolite, 1 wt% Ce/Hβ zeolite, 5 wt% Ce/Hβ zeolite, 1 wt% La/Hβ zeolite, 5 wt% La/Hβ zeolite, 1 wt% Nd/Hβ zeolite, and 5 wt% Nd/Hβ zeolite before and after their regeneration at 800 °C (2 h) are shown in Figure 1. An addition of rare earth metals into the structure of Hβ zeolite decreased the surface area of the catalysts depending on the diameter of the rare earth metal ion added; a large diameter led to a more significant decrease in surface area and pore volume and an increase in the average pore volume (Table 1). Isotherms for pure Hβ zeolite, 1 wt% Ce/Hβ zeolite, 5 wt% Ce/Hβ zeolite, 1 wt% La/Hβ zeolite, 5 wt% La/Hβ zeolite, 1 wt% Nd/Hβ zeolite, and 5 wt% Nd/Hβ zeolite are of type I due to high adsorption volume at low and high pressure which is characteristic for micro and mesoporous materials with an average pore diameter of 3.89 nm (Table 1). Although the surface area of modified catalysts decreased, the mesopore size increased significantly as the added rare earth metals cover the external surface area and block micropores. Figure 2 shows the pore size distribution for pure Hβ zeolite, 1 wt% Ce/Hβ zeolite, 5 wt% Ce/Hβ zeolite, 1 wt% La/Hβ zeolite, 5 wt% La/Hβ zeolite, 1 wt% Nd/Hβ zeolite, and 5 wt% Nd/Hβ zeolite before and after their regeneration at 800 °C for 2 h.
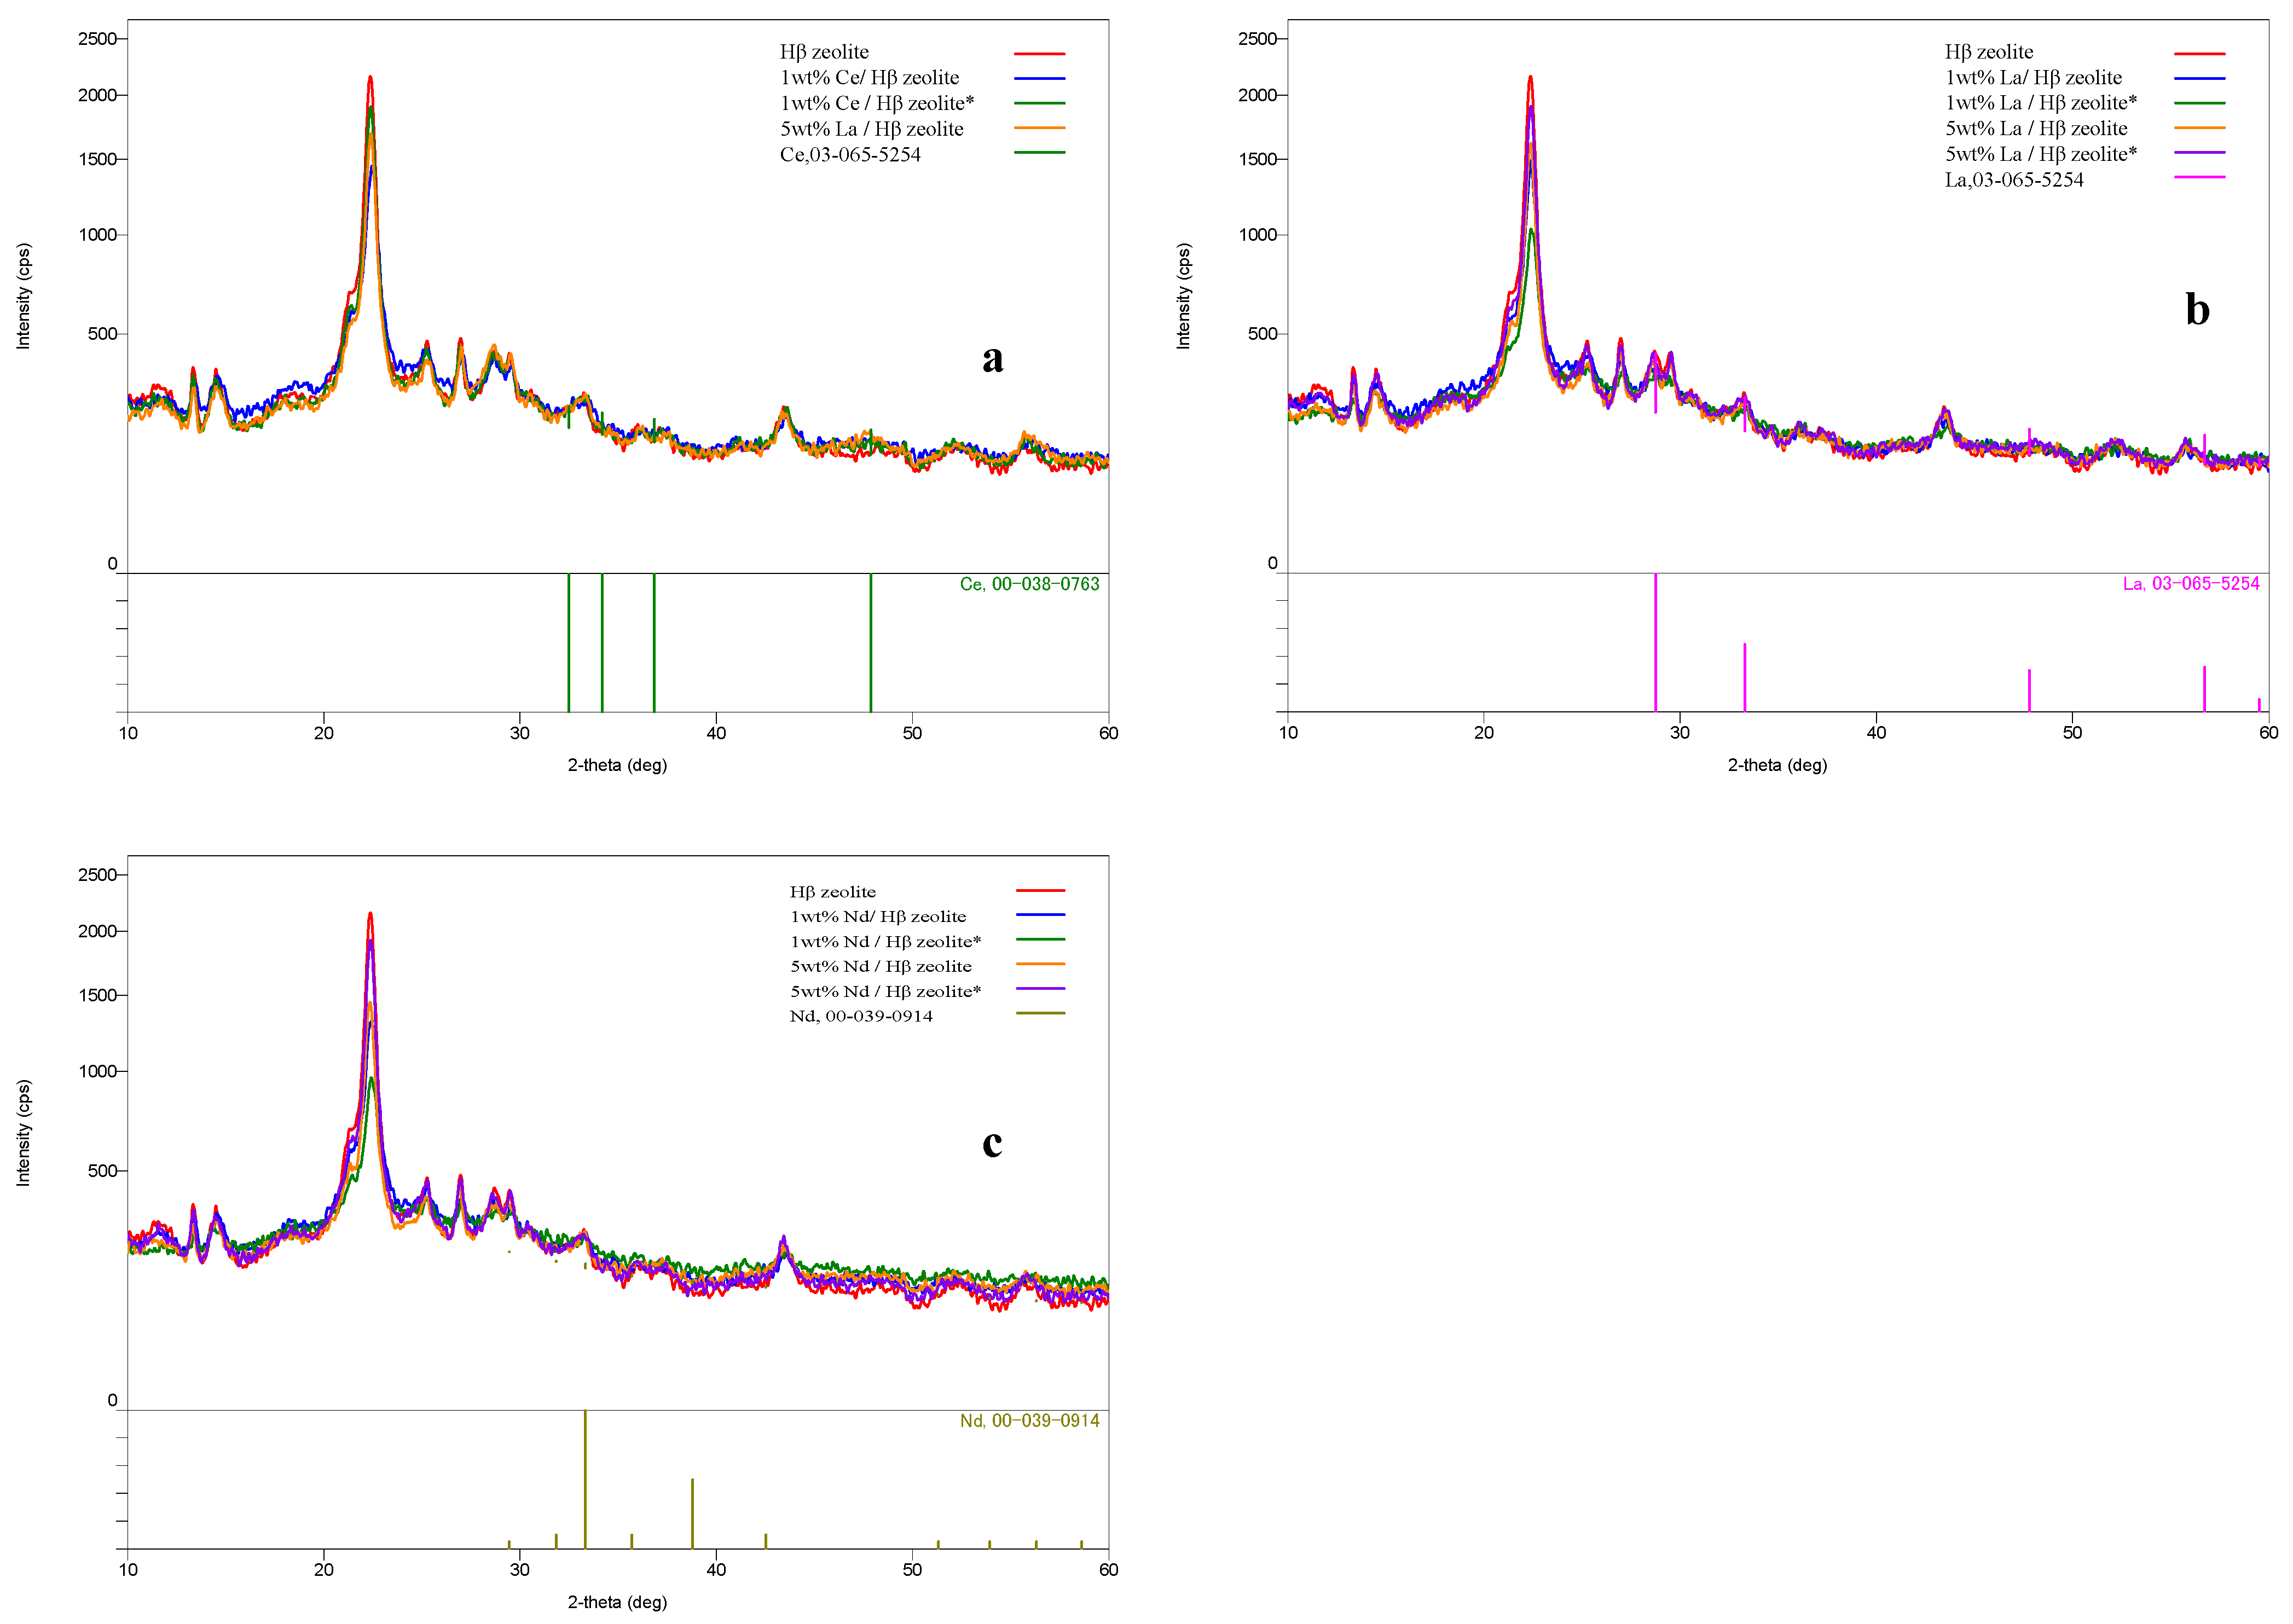
TG and DTG thermographs for the 5 wt% Ce/Hβ zeolite, 5 wt% La/Hβ zeolite, and 5 wt% Nd/Hβ zeolite after regeneration at 800 °C for 2 h are shown in Figure 3. Weight loss of pure Hβ zeolite and the rare earth-modified catalysts started at 100 °C due to moisture content vaporization and then between 200–500 °C due to the organic and non-interacted materials degradation within zeolite pores. Therefore, all catalysts in the present work were calcined at 550 °C. Figure 3 shows also the results of DTG of rare earth metal-modified catalysts with peaks for weight loss at 150 °C due to moisture evaporation, and in the temperature range of 200–500 °C due to the degradation of organic and non-interacted species in the catalyst pores. Finally, at 550 °C, there is a gradual decrease in weight due to the removal of the remaining organic materials at the acid sites by oxidation decomposition (Huang, Su, and Guo 2009). DTG graphs for all catalysts are similar and indicate their high stability at high temperatures; moreover, their structure did not change due to the addition of rare earth metals. Results of TG and DTG analyses are in agreement with the XRD results shown in Figure 4 and in the literature [29,30]. Moreover, SEM photographs of calcined Hβ zeolite at 550 °C are provided in our previous work and showed a spherical shape [29].
XRD results for pure Hβ zeolite, 1 wt% Ce/Hβ zeolite, 5 wt% Ce/Hβ zeolite, 1 wt% La/Hβ zeolite, 5 wt% La/Hβ zeolite, 1 wt% Nd/Hβ zeolite, and 5 wt% Nd/Hβ zeolite before and after their regeneration at 800 °C for 2 h are shown in Figure 4. All XRD spectra for the rare earth metal-modified zeolites showed a change in their structure compared to pure Hβ zeolite as it can be concluded from the decreased intensity of the XRD peaks indicating the decrease of modified zeolites crystallinity due to the addition of rare earth metals. Pure Hβ zeolite shows higher intensity at the values of 2θ = 7.6° (101), 21.4°−22.4° (302), which is characteristic of Hβ zeolite [31]. The intensity of these peaks in modified Hβ zeolites diffractograms was lower (lower crystallinity) compared with that of pure Hβ zeolite. The degree of crystallinity (Dc) of the catalyst samples was calculated according to Equation (1) and the values are presented in Table 2:
D c % = I m z , 2 θ = 21.4 ° 22.4 ° I r s , 2 θ = 21.4 ° 22.4 ° × 100 %
where Imz,2θ = 21.4°−22.4° stands for the intensity of rare earth metal-modified Hβ zeolite, and Irs,2θ = 21.4°−22.4° is the intensity of reference sample.
Moreover, the X-ray absorption coefficients for rare earth metal compounds are high and make it reach into cationic sites of Na+ and Al3+ and decrease the crystallinity of the rare earth metal-modified catalysts [32]. Some Al species from the structure of modified zeolites may be lost in the solution and thus reduce the zeolites crystallinity in the presence of the acid environment [33]. Rare earth metal concentrations obtained by XRF analysis for all modified catalysts are listed in Table 2. The crystallinity of the modified catalysts decreased with the increasing weight percentage of the rare earth metals added to the Hβ zeolite structure. Phases of the rare earth metal oxides were not detected for the concentration of 1 wt% of rare metal due to its high dispersion on the surface of the Hβ zeolite (monolayer dispersion threshold), which means that the crystal structure of the Hβ zeolite was not affected by such an addition [34]. The crystallinity of the rare earth metal-modified Hβ zeolite catalysts is provided for each rare earth metal weight percentage in Table 2 compared to 100% crystallinity of the pure Hβ zeolite catalyst. In addition, the regenerated catalysts have the same MFI structure as the fresh ones, which means that the catalysts can be reused after coke removal without a significant change in their activity.
Acidity test results obtained by the ammonia-TPD method for pure Hβ zeolite, 1 wt% Ce/Hβ zeolite, 5 wt% Ce/Hβ zeolite, 1 wt% La/Hβ zeolite, 5 wt% La/Hβ zeolite, 1 wt% Nd/Hβ zeolite, and 5 wt% Nd/Hβ zeolite are shown in Figure S1. Ammonia-TPD curves for the catalysts showed a decrease in the acidity in the trend: 5 wt% Nd/Hβ zeolite > 1 wt% Nd/Hβ > 5 wt% Ce/Hβ zeolite > 1 wt% Ce/Hβ zeolite > 5 wt% La/Hβ zeolite > 1 wt% La/Hβ zeolite > pure Hβ zeolite. Mainly, Hβ zeolite has two acid sites of different strengths; weak acid sites are determined from the TPD-curves at low-temperature desorption while strong acid sites are determined from the desorption at high temperature. Acid sites for pure Hβ zeolite are mainly weak while the strong ones are very low as the peak intensity at high temperature is very low. For rare earth metal-modified Hβ zeolites, both types of acid sites were found at low and high temperatures. In addition, there is a slight shift in the peaks towards high temperatures for different rare earth metal types and weight percentages. The exchange of rare earth metal ions increased the peak area leading to an increased number of acid sites also their strength and quantity in the rare earth metal-modified Hβ zeolite catalysts [35]. Table 2 lists the acidity for pure Hβ zeolite, 1 wt% Ce/Hβ zeolite, 5 wt% Ce/Hβ zeolite, 1 wt% La/Hβ zeolite, 5 wt% La/Hβ zeolite, 1 wt% Nd/Hβ zeolite, and 5 wt% Nd/Hβ zeolite. The combined effect of size and charge of the rare earth metal on the acidity of the rare earth metal-modified Hβ zeolite catalysts is high; a higher charge-to-size ratio means higher acidity. The strength of Lewis and Bronsted acid sites was quantified by the strong base molecule pyridine which bonded with the Lewis acid sites of the catalyst and was detected by FTIR with peaks at 1410 cm−1, while bonds with the Bronsted acid sites show peaks at 1540 and 1640 cm−1. In addition, a band of the combination of Lewis and Bronsted was detected at 1490 cm−1 as shown in Figure S2. The addition of rare earth metals into the structure of Hβ zeolite increases the ratio of Lewis/Bronsted acid sites, i.e., an increase in the Lewis acid sites, and it can be concluded that the GDO reaction is controlled by the Lewis acidity.

2.2. Acetone Model Component

2.2.1. Catalyst Activity

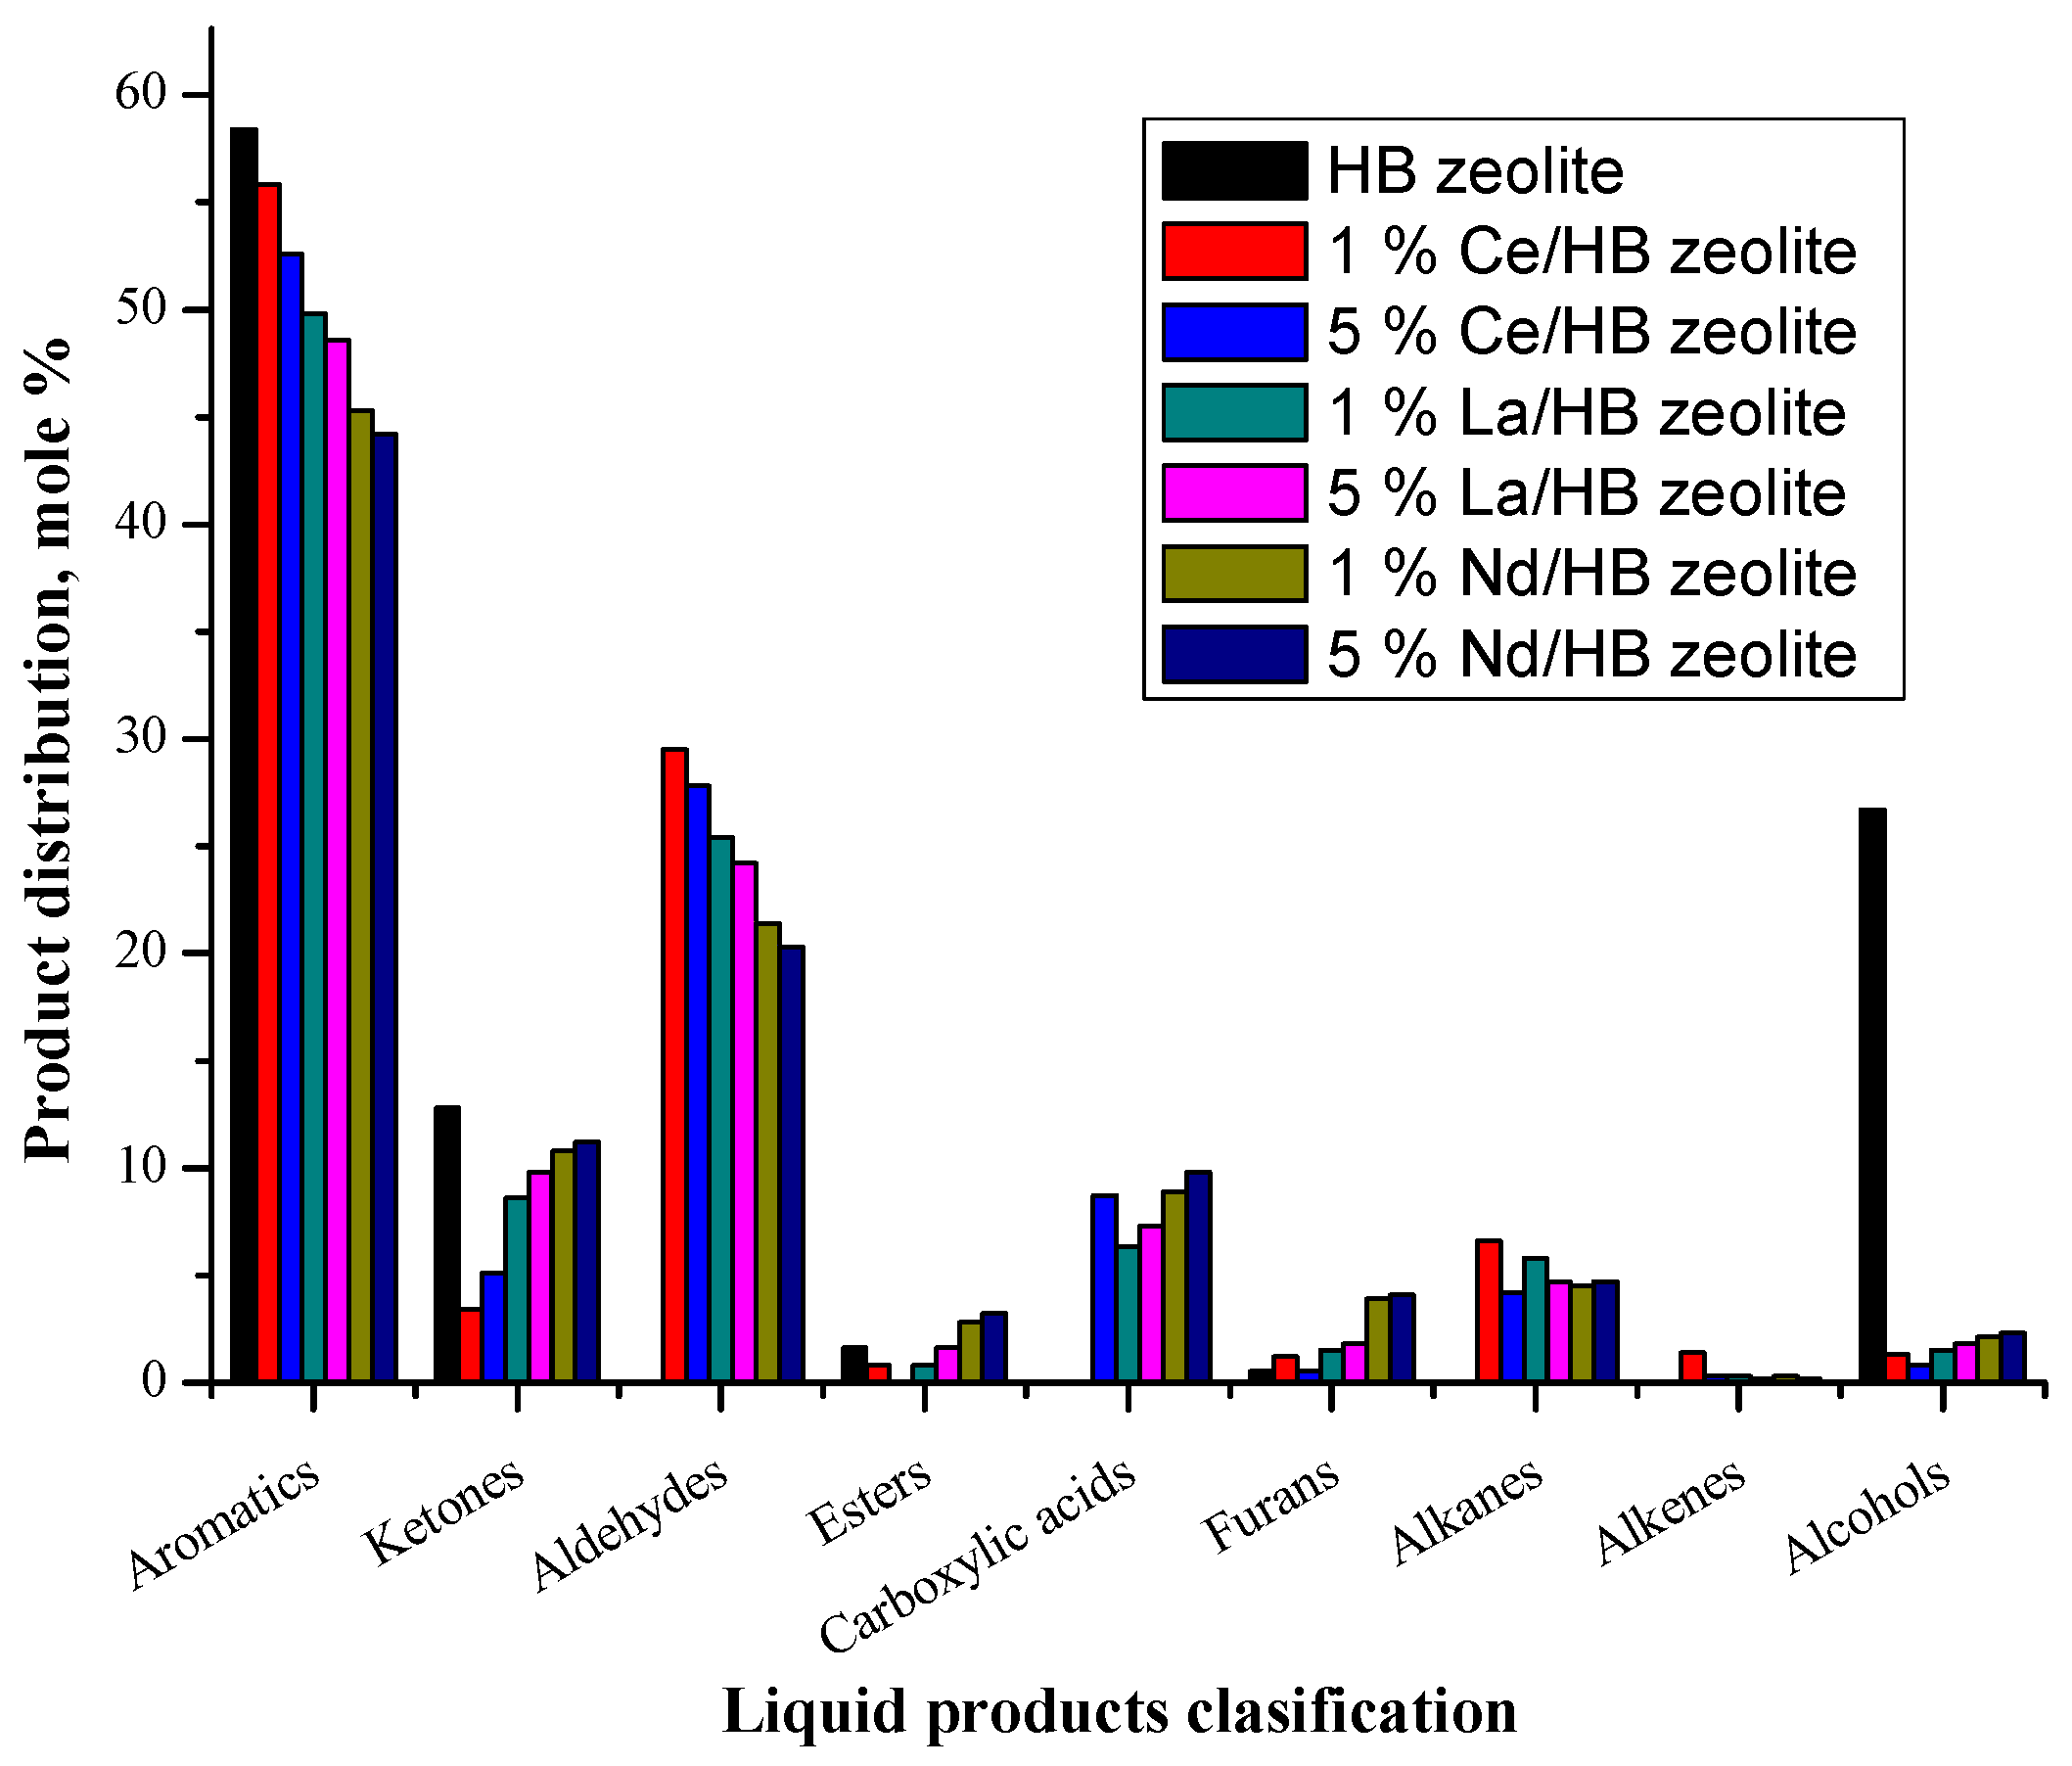
Biocrude oil contains up to 14% of ketones [13] while there are around 22% of ketones in the raw BPT used in the present work. Due to the complex nature of BPT, the reaction paths for the products interact and intertwine so the activity of the catalyst would be difficult to understand. The acetone molecule model was chosen in the DO reaction on the surface of 5% Ni2P/HZSM-5 catalyst and showed a high conversion rate of 91% [15]. Therefore, acetone was initially chosen as a model compound (due to its abundance in BPT and as it is a good indicator of catalyst activity) to test the activity of pure Hβ zeolite, 1 wt% Ce/Hβ zeolite, 5 wt% Ce/Hβ zeolite, 1 wt% La/Hβ zeolite, 5 wt% La/Hβ zeolite, 1 wt% Nd/Hβ zeolite, and 5 wt% Nd/Hβ zeolite. Figure 5 shows the variation of DOD and conversion rate of the catalysts. The highest DOD (79.5%) and conversion rate (88.7%) were achieved using 1 wt% Ce/Hβ zeolite while the lowest DOD (35.4%) and conversion rate (39.8%) were obtained with pure Hβ zeolite. This is due to the Lewis and Bronsted acidity strength of the catalysts prepared in the present work [36]. The acetone molecule can be converted through the GDO reaction into an intermediate compound of alcohols and the C-O bond can be adsorbed on the acid sites of pure and rare earth metal modified Hβ zeolite catalysts. The addition of rare earth metals increases the acidity of the catalyst as mentioned in the ammonia-TPD results. Active sites on modified Hβ zeolite provide atomic hydrogen for the GDO reaction [37]. The highest catalyst activity was observed for a 1% rare earth metal modified zeolite due to the high dispersion of rare earth metals on the surface of the Hβ zeolite; increased concentration of added rare earth metal decreases the dispersion which together with the high surface area increases the efficiency of the reaction [38]. The distribution of the GDO liquid products is shown in Figure 6 and their detailed chemical composition is provided in Table S1. The main products of the GDO reaction using pure Hβ zeolite are aromatic hydrocarbons and alcohols in the ratio of 58.4% and 26.7%, respectively. Main products of the reaction using rare earth metal modified Hβ zeolites are aromatic hydrocarbons and aldehydes in the ratio of 55.8% and 29.5%, respectively. Acetic acid was produced at the rate of 8.7% with 5 wt% Ce/Hβ zeolite catalyst due to the high number of active sites on the catalyst surface which led to self-ketonization of acetic acid with water-producing acetone [39] and finally to reduction of the acetone conversion rate. For BPT-GDO, 1 wt% Ce/Hβ zeolite was chosen as the catalyst due to the high DOD and conversion rate in the case of the acetone model compound.

2.2.2. Contact Time

The effect of contact time on the GDO reaction depends on the catalyst bed size and feed flow rate [40,41]. Catalyst bed size in the present study was fixed by using a 15 g catalyst and the feed flow rate was changed through the H2 and acetone flow rates at 400 °C using 1 wt% Ce/Hβ zeolite as the catalyst. The dependence of the conversion rate and distribution of liquid product compounds on the contact time (tc) is shown in Table 3. High amounts of aromatics were produced by the acetone GDO; the most significant products are shown in Table S1. Table 3 shows that the increase of contact time from 0.31 s to 0.63 s increased the conversion rate from 82% to 88%, while the production of aromatic hydrocarbons increased significantly due to increased DO, hydrogenation, isomerization, and aldol condensation reactions. Alkanes and alkenes were produced due to further hydrogenation and decarbonylation of methyl isobutyl ketone [42]. Moreover, Benzene-Toluene-Xylene (BTX) production increased significantly with the contact time increase from 0.31 s to 0.63 s, containing 15.78%, 9.23%, and 1.12% of xylene, toluene, and benzene, respectively. The flow rate of acetone changed from 0.05 to 0.31 mL/min (contact time = 0.71 to 0.31 s) and the composition of BTX increased with the decreasing contact time from 0.71 to 0.63 s but decreased after decreasing the contact time to 0.31 s. From Table 3, it can be concluded that a conversion of 100% can be reached. BTX production consumes a high amount of acetone, and the reaction was conducted in several complicated steps requiring long contact time to reach the catalyst active sites at the medium flow rate of 0.31 mL/min.

2.2.3. Effect of Gas-Phase Deoxygenation Temperature

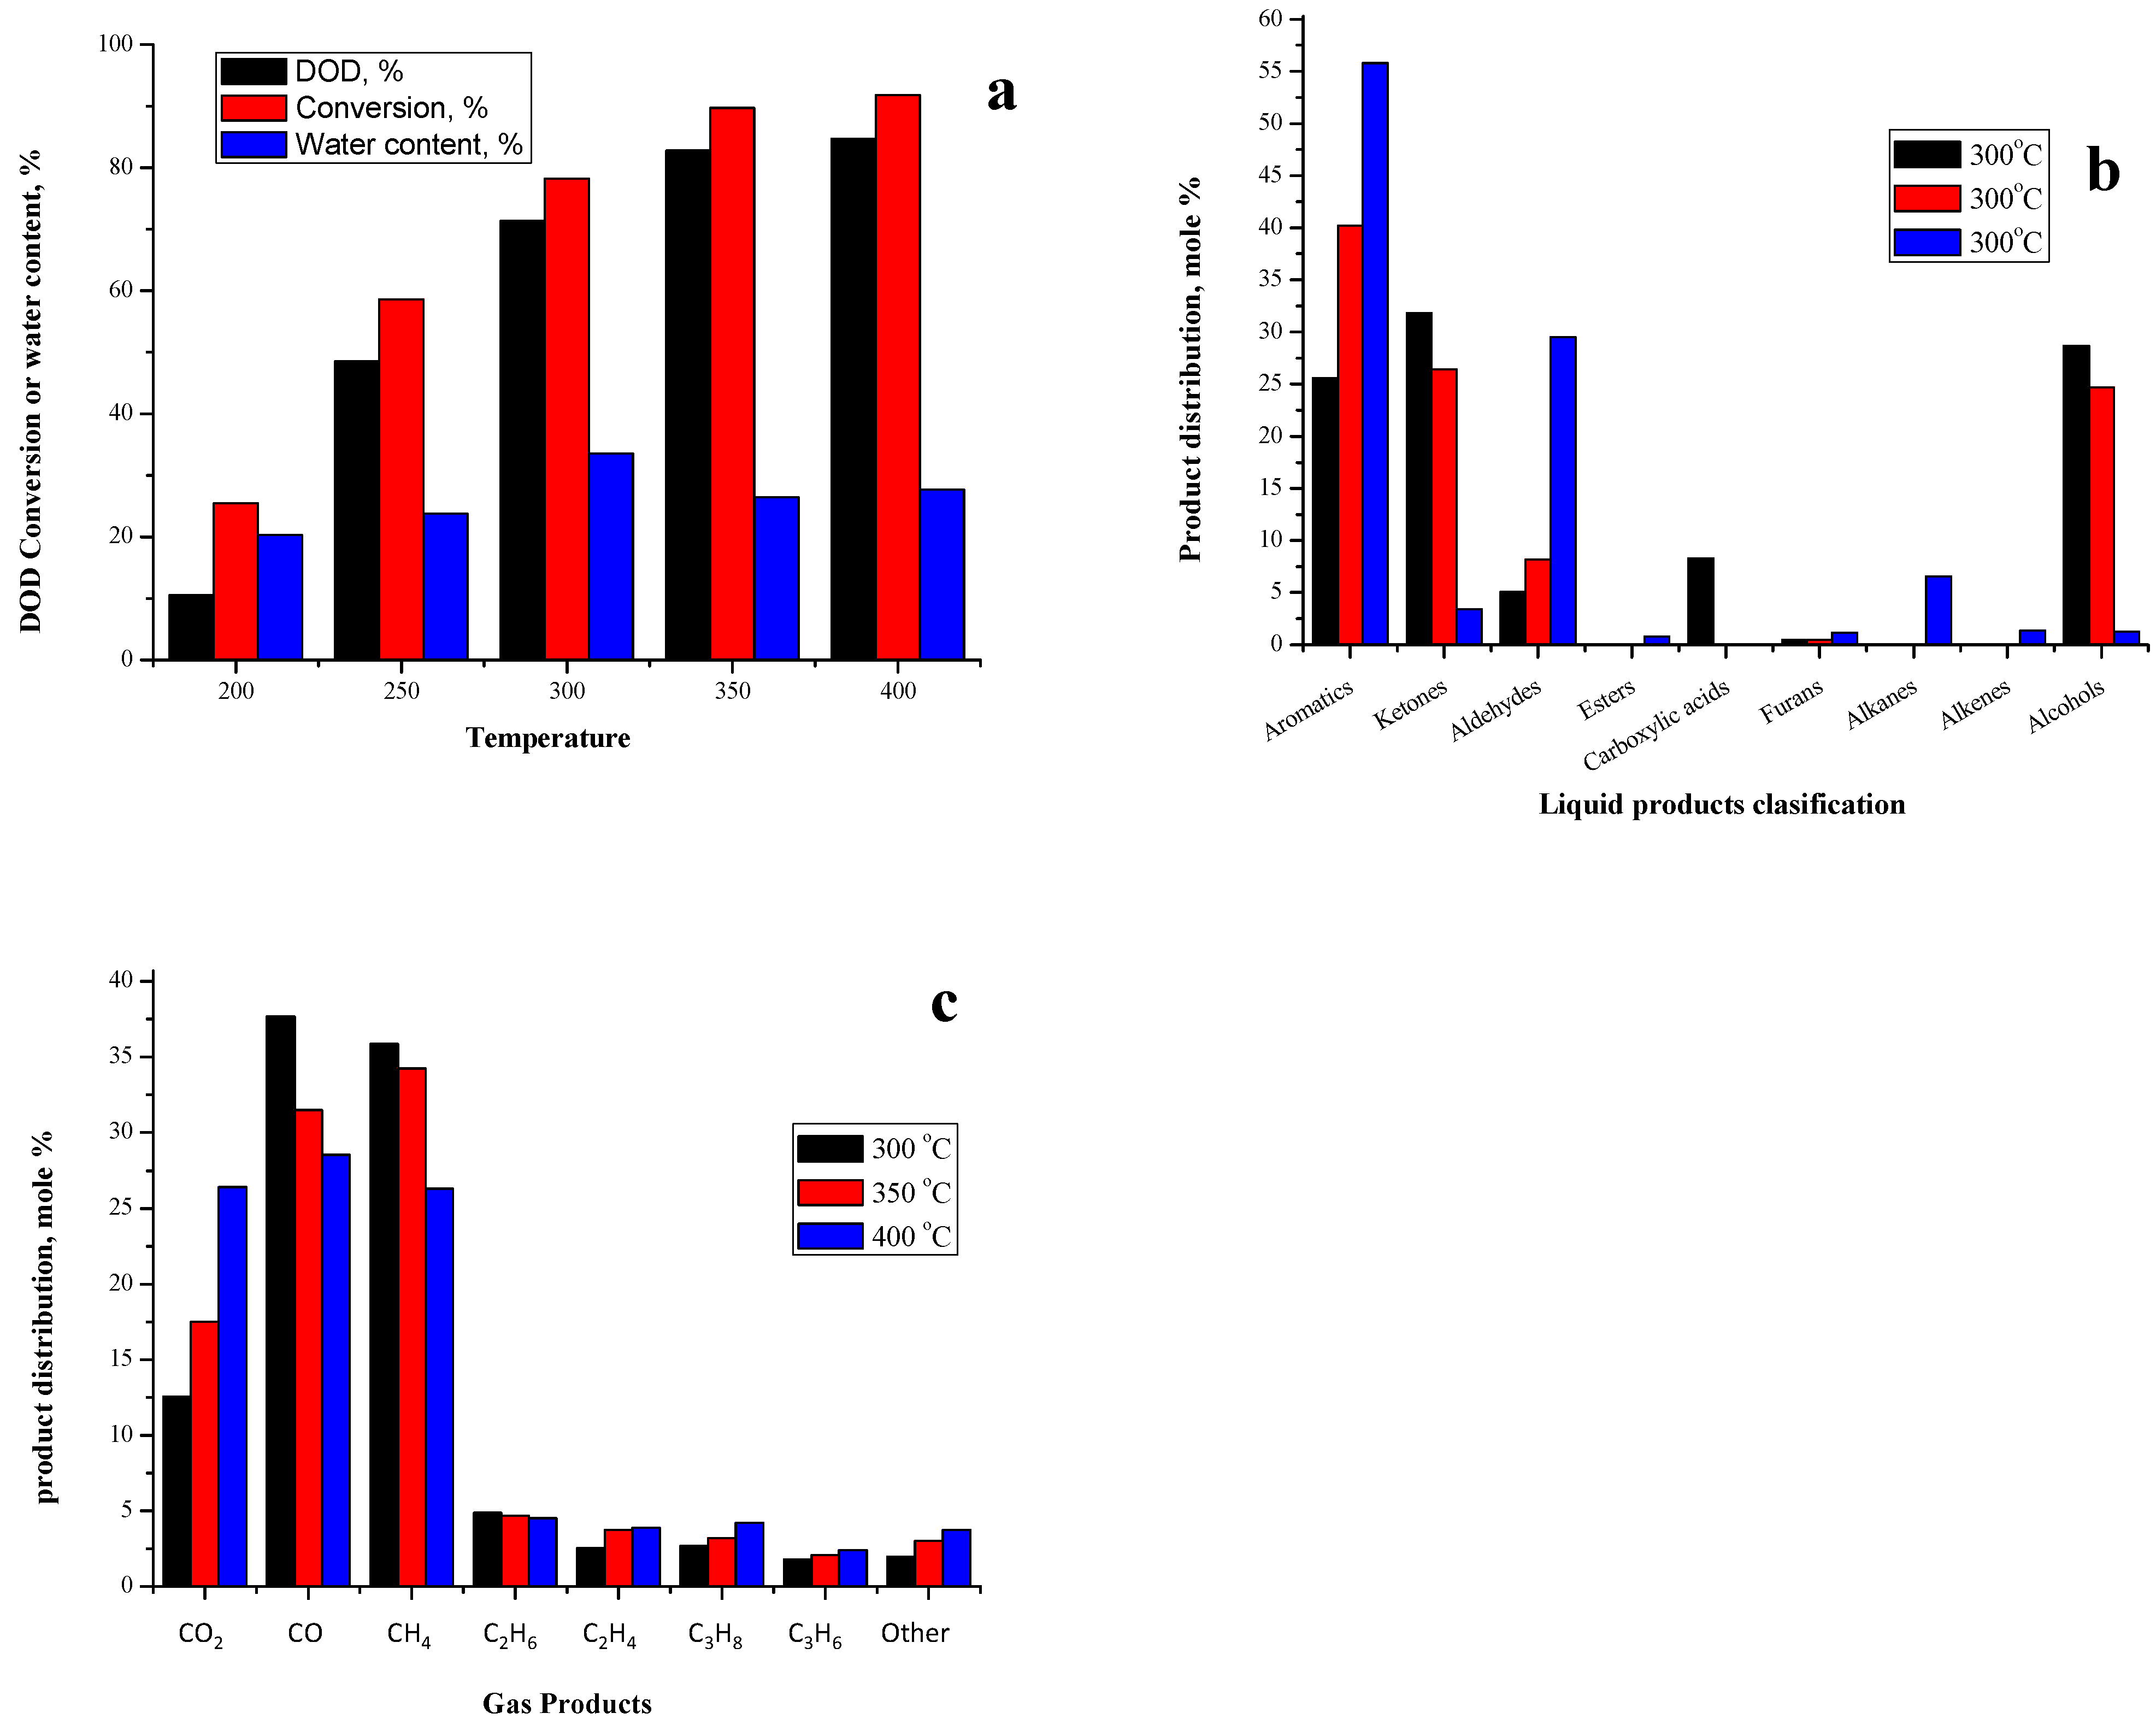
Figure 7a shows the variation of water content, DOD, and conversion rate with the reaction temperature in the range of 200–400 °C with 1 wt% Ce/Hβ zeolite as the catalyst. The values of DOD and conversion rate increased with increasing temperature from 15.6% to 84.7% and from 25.5% to 91.8%, respectively. While higher water content of 33.6% was determined at 300 °C which can be explained by the decreased composition of methyl isobutyl ketone and its dehydration with temperature increasing up to 300 °C, then the water content started to decrease due to the cleavage of the C-C bond and increased acetic acid production and subsequent production of CO and CO2 as the secondary products. Figure 7b indicates the dependence of the composition of the main product compounds on temperature. The highest composition of BTX and aldehydes at 400 °C was 55.8% and 29.5%, respectively. The BTX composition was very low at 300 °C and increased rapidly with the increasing temperature while that of ketones at 350 °C was 26.4% due to aldol condensation of acetone; these results are in agreement with the literature [43,44]. Limitations of acetone hydrogenation to methyl isobutyl ketone were assumed, with the strongest limitation being the condensation of acetone and methyl isobutyl ketone into aromatic compounds [45,46]. Regarding the gas products of the acetone GDO reaction, Figure 7c shows the composition of gas products as a function of temperature. The main product gases were CO2, CO, CH4, C2H6, C2H4, C3H8, and C3H6. At 300 °C, the main products were C3H8, C3H6, and a small quantity of CO as the hydrogenation reaction favors the low temperature of 300 °C; the composition of C3H8 decreased with the increasing temperature up to 350 °C but the trend changed with increasing C3H8 composition and producing considerable amount of CO and CO2 at 400 °C due to the cracking of carbonyl and carboxyl groups [47]. At 400 °C, the main gas products were C2H6, CO2, C3H8, and C3H6. The increase in the production of CO2 gas can be ascribed to the reaction of CO with water vapor in the water–gas shift step [15]. In addition, C2H6 production increased due to the cracking of the C-C bond in acetone and the formation of acetic acid followed by the deoxygenation and DO steps. Moreover, C3H8 and C3H6 can be produced directly from acetone in the deoxygenation and DO steps.

2.2.4. Reaction Network for Acetone Model Compound

Table S1 shows the main products of the GDO reaction using acetone as a model compound. Acetone was converted at the optimum conditions proposed in the previous sections. Figure S3 shows the reaction network for the GDO of the acetone model compound. Pathway (1) involved intermediate step reactions of acetone demethylation into acetaldehyde then after successive substeps into acetic acid (pathway (7)) which is the primary DO product together with methane [48] while ethanol was considered as the secondary DO product. Pathway (2) shows that acetaldehyde DO was produced through pathway (1) with ethanol as the secondary product [49]. In addition, pathway (3) shows the hydrogenation of acetone into isopropanol on the surface of rare earth metal-modified Hβ zeolite catalyst, which is followed by the dehydration into propene in the presence of acid sites provided by the rare earth metals in pathway (4) [50]. Pathway (5) shows the self-aldol condensation of acetone to methyl isobutyl ketone on the rare earth metal acid sites of the modified Hβ zeolite [46]. Pathway (6) is the hydrogenation of acetone to propane. Mesitylene, BTX, ethylbenzene, and other aromatic hydrocarbons were formed through aldol condensation, hydrogenation and dehydration of acetone and methyl isobutyl ketone [51]. Moreover, other pathways for DO and isomerization of the intermediates of ketones between C5-10 which can be converted into alkyl benzene compounds can be assumed. Moreover, pathway (7) shows the reversible reaction of acetic acid and acetone. Finally, decarbonylation and decarboxylation steps are shown in pathways (8) and (9).

2.3. Biomass Pyrolysis Tar

2.3.1. Catalyst Activity

Composition of BPT is highly complex and it was detected using GC-MS characterization, the main components with high concentration include water: 0.71%, furfural: 5.85%, 4-ethylguaiacol: 2.14%, phenol: 13.63%, methylethyl ketone: 5.34%, cyclohexanone: 3.23%, isopropanol: 4.78%, ethanol: 3.67%, methanol: 3.13%, acetic acid: 41.06%, and acetone: 16.46%. As the catalyst, 1 wt% Ce/Hβ zeolite was chosen, and the BPT-GDO reaction conditions were chosen in the previous section for acetone GDO. An initial experiment were conducted on a mixture of (20% Phenol, 23% Acetone, and 57% Acetic Acid, the mixture has a slightly different phenol/acetone and acetic acid/acetone ratio than the BPT) as raw material to test the GDO activity of 1 wt% Ce/Hβ zeolite and showed a high conversion rate of 95% and those result led to the use of 1 wt% Ce/Hβ zeolite catalyst for GDO of BPT compared to the pure Hβ zeolite in the next part of the paper.
The values of DOD, conversion, and yield were compared with the reaction with pure Hβ zeolite catalyst and are presented in Table 4. Acetone conversion in GDO using pure Hβ zeolite was -185% due to the production of acetone through acetic acid self-ketonization while it reached 79% when 1 wt% Ce/Hβ zeolite catalyst was used as the Ce active material inhibits acetic acid self-ketonization. In addition, 1 wt% Ce/Hβ zeolite catalyzed reaction provided DOD of 68% and conversion of 16% for phenol, 88% for acetic acid, and 38% for 4-ethylguaiacol; these values are higher compared to those obtained using pure Hβ zeolite catalyst. However, the conversion of smaller molecules decreased as the micropores were closed by the Ce active material. The increase in phenol production can be explained as a result of de-methoxylation and de-ethylation of 4-ethlyguaiacol [52]. The furfural molecule has a moderate size so that the GDO conversion for this molecule into furans was high with both pure Hβ zeolite and 1%Ce/Hβ zeolite. The yield of water, liquid phase, and gas phase in the GDO reaction using 1wt%Ce/Hβ zeolite was: 18.33%, 47.42%, and 34.25%, respectively.

2.3.2. Liquid Products

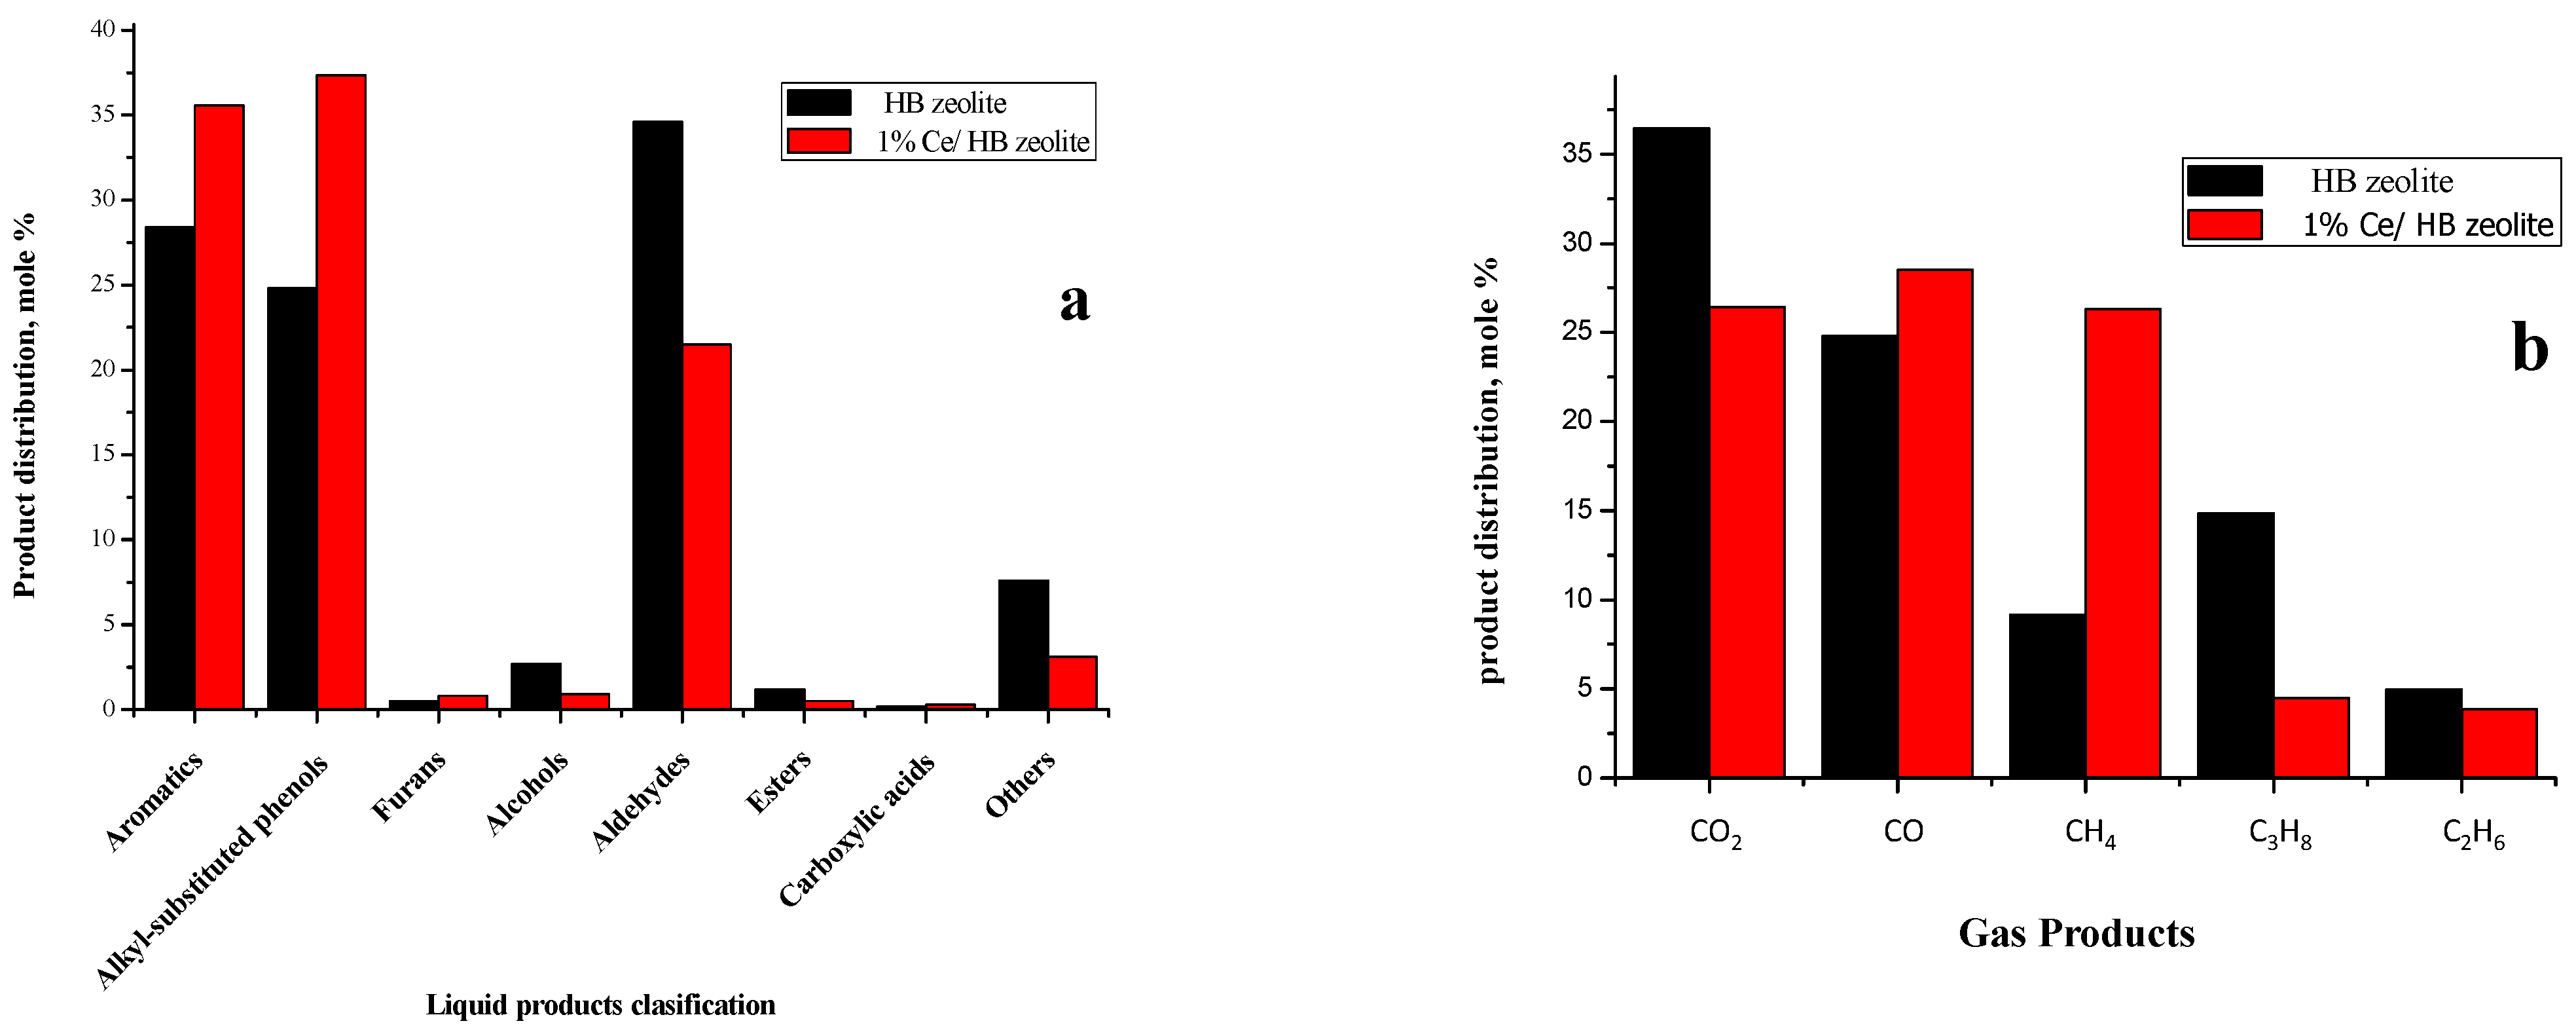
Alkyl-substituted phenols (2,4-dimethylphenol, cresol, etc.), aromatic hydrocarbons (BTX, etc.), and aldehydes (acetaldehyde), with small amounts of alcohols (dimethylbenzeneethanol) and furans (furan and 2-methylfuran) were the liquid products of the GDO reaction using 1 wt% Ce/Hβ zeolite catalyst, liquid phase composition is presented in Figure 8a. Ketone aldol condensation led to the production of aromatic hydrocarbons [53]. Another route is direct phenol dehydroxylation followed by alkyl substitution of phenol or benzene and increased conversion of 4-ethylguaiacol followed by alkyl substitution to achieve the highest alkyl substituted phenols and aromatic hydrocarbons distribution ( i ) of 37.34% and 35.56%, respectively. While acetic acid dehydration led to the production of 41.32% of acetaldehyde. Moreover, the methyl ethyl ketone and benzene molecules underwent substitution leading to the production of a small quantity of dimethylbenzeneethanol. Formaldehyde which is a product of 4-ethylguaiacol, furfural, and acetic acid decomposition, as well as acetaldehyde intermediates, can be converted into methyl ethyl ketone by aldol condensation. The use of 1 wt% Ce/Hβ zeolite enhanced the production of alkyl-substituted phenols, aldehydes, and aromatic hydrocarbons as shown in Figure 8a.

2.3.3. Gas Products

Figure 8b shows the gas products and the composition of the gas phase of the GDO reaction with 1 wt% Ce/Hβ zeolite catalyst. Gases produced by BPT-GDO using 1 wt% Ce/Hβ zeolite were 26.44% of CO2, 28.52% of CO, 26.31% of CH4, 4.51% of C3H8, and 3.87% of C2H6. CH4 and CO were formed through the formyl elimination from Furfural [54], CO2 hydrogenation, and 4-ethylguaiacol methoxyl removal [55], while CO2 was produced by acetic acid self-ketonization and decarboxylation. In addition, acetone hydrogenation and acetic acid dehydration are the sources of C3H8, and C2H6, respectively. The use of 1 wt% Ce/Hβ zeolite catalyst decreased the production of CO2 by acetic acid self-ketonization compared to pure Hβ zeolite almost four times as it can be seen from the ratio of CO2/CH4 of (1:1) for 1 wt% Ce/Hβ zeolite compared to (4:1) for pure Hβ zeolite. Finally, using 1 wt% Ce/Hβ zeolite, C2H6 production increased by 10% compared to using pure Hβ zeolite due to the GDO activity of the Ce material on the surface of Hβ zeolite.

2.3.4. Effect of Gas-Phase Deoxygenation Temperature

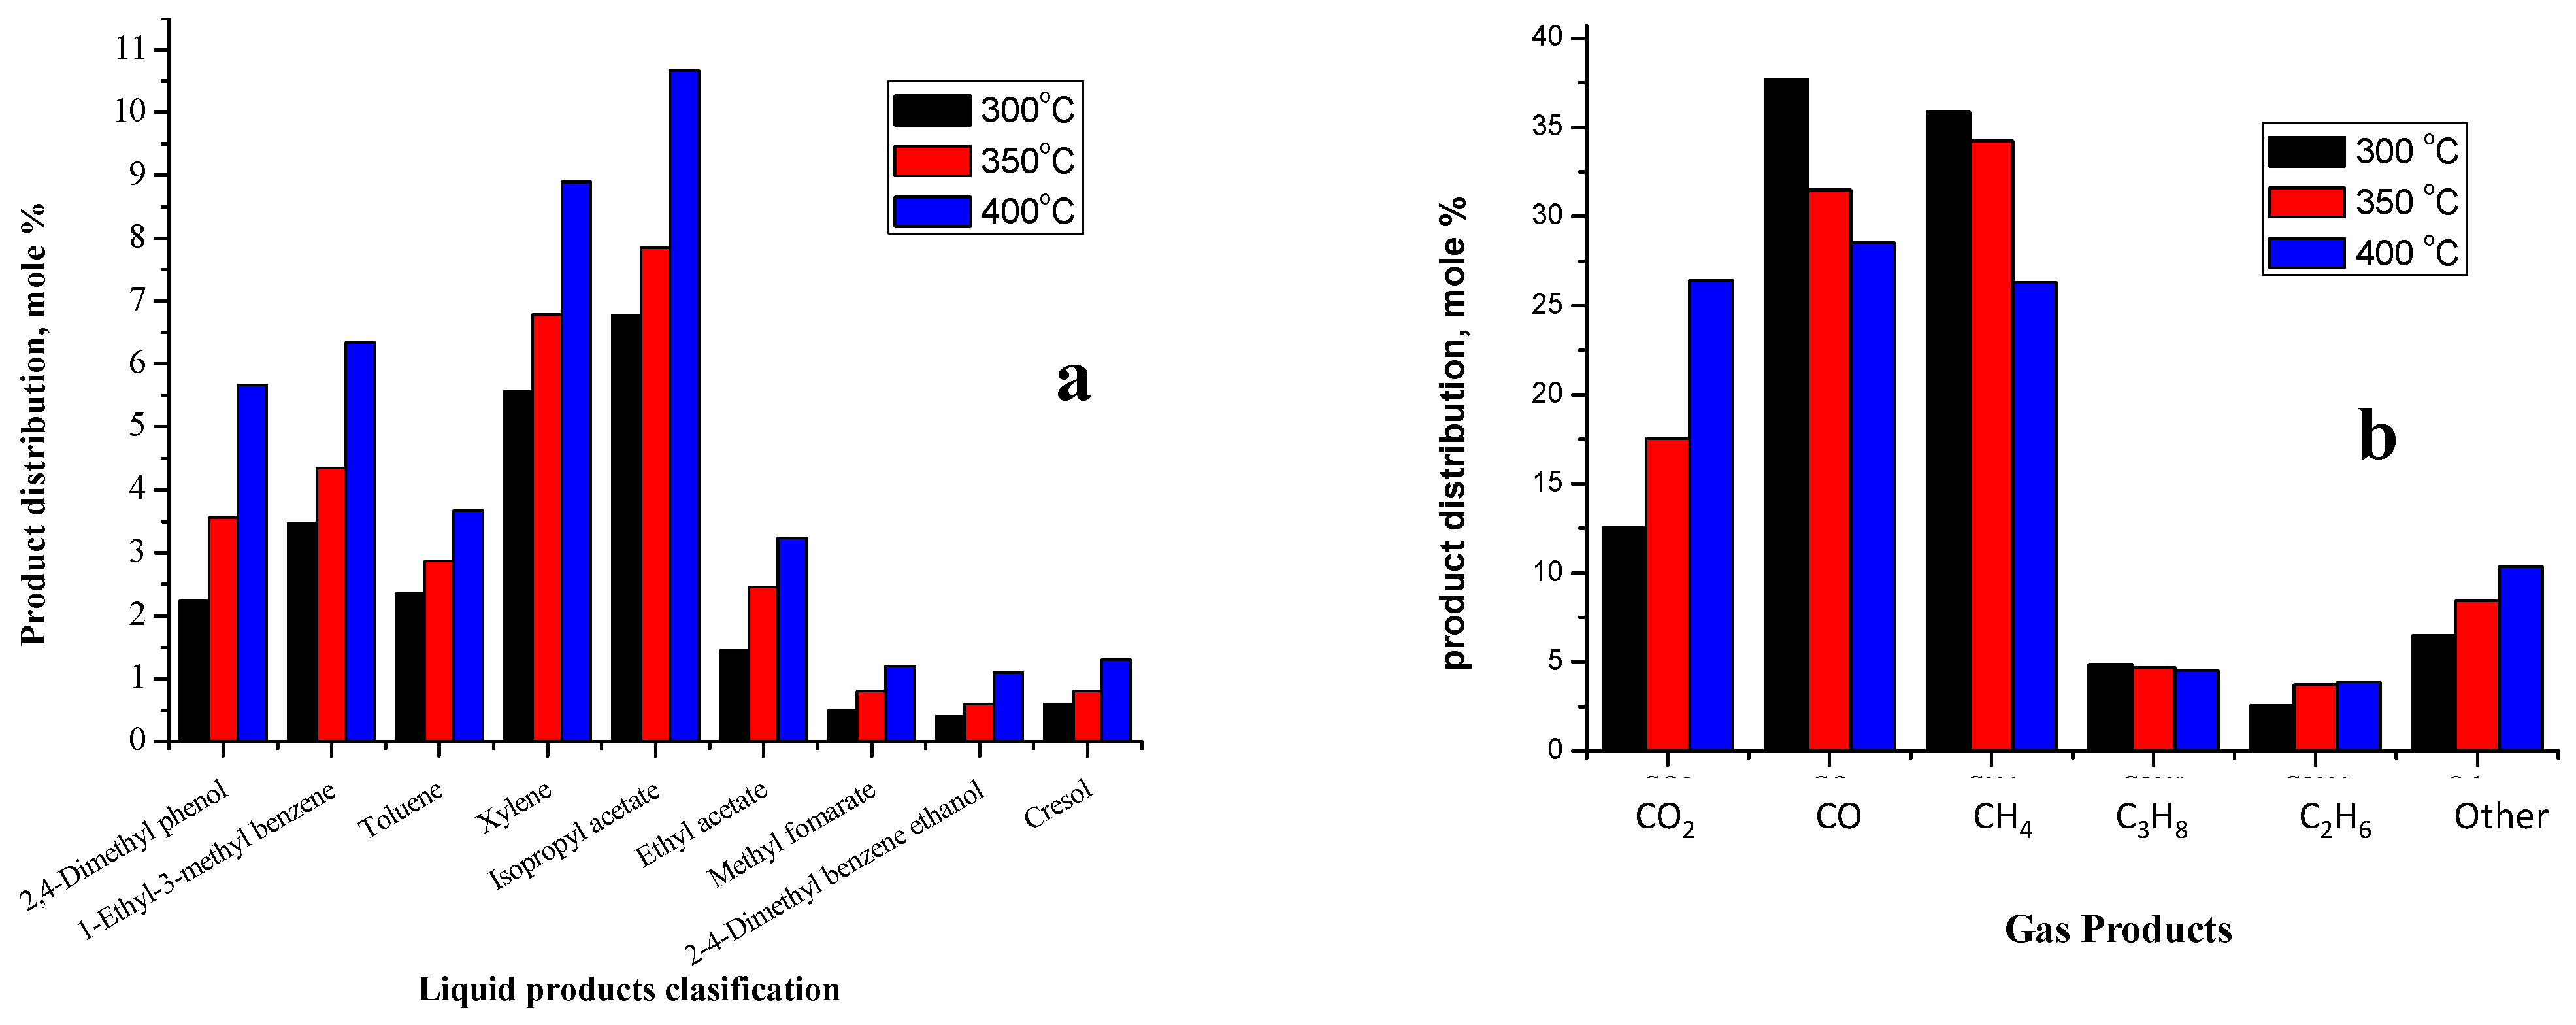
Table 5 presents the dependence of yield, DOD, and conversion rate on the reaction temperature in the range of 300–400 °C using 1 wt% Ce/Hβ zeolite as the catalyst of BPT-GDO. Conversion of 4-ethylguaiacol, acetic acid, and acetone increased up to the temperature of 350 °C and then flattened while that of phenol showed a reverse trend probably due to the 4-ethylguaiacol methoxyl removal and deethylation or the competition reaction with other molecules. On the other hand, furfural molecule conversion was not affected by temperature change. The yield of the gas phase and water increased with increasing temperature while the liquid phase yield decreased due to the dehydration and cracking suppression at higher temperatures. Figure 9a shows the liquid phase product distribution dependence on temperature using 1 wt% Ce/Hβ zeolite as the catalyst of BPT-GDO. At 350 °C, esters production due to isopropanol and ethanol esterification with acetic acid, and methanol with formic acid intermediate was observed [56]. Ethanol was produced by the dehydration of acetic acid and 4-ethylguaiacol was converted into formaldehyde and methanol through methoxyl bond breaking and through the hydration and hydrogenation of formic acid [57]. Acetone hydrogenation is the source of the isopropanol intermediate. Low temperature favors the production of esters, while higher temperatures favor the production of aromatic hydrocarbons due to side reactions including alkyl benzene substitution and isomerization, alkyl-substituted phenols dehydroxylation, cycloaddition of ethylene with 2, 5-dimethylfuran Diels-Alder followed by dehydration to xylene, and condensation of small molecules [58]. Benzene and methyl ethyl ketone undergo a substitution followed by hydrogenation reactions to produce dimethylbenzeneethanol. In addition, phenol molecules were alkyl substituted with methyl groups and produced 2,4-dimethylphenol which decreased with the temperature increase to 400 °C due to the dehydroxylation and demethylation of 2,4-dimethylphenol. Methyl substitution of phenol led to the production of cresol between 350 °C and 400 °C. Figure 9b shows the gas phase product distribution dependence on temperature using 1 wt% Ce/Hβ zeolite at the catalyst of BPT-GDO. Due to acetic acid self-ketonization and decarboxylation, which is favored at higher temperatures, CO2 production increased significantly while that of CH4 and CO decreased with the increasing temperature due to CH4 condensation with dienes and olefins into xylene and toluene and the water-gas shift in CO to CO2 conversion [59]. The highest CH4 and CO conversion of 35.87% and 35.67%, respectively, was obtained at 300 °C. C2H6 production increased slightly to 3.87% by increasing the temperature from 300 to 400 °C due to the 4-ethylguaiacol de-ethylation, while C3H8 production decreased slightly to 4.51% due to acetone hydrogenation to C3H8, which then undergoes conversion to aromatic hydrocarbons. The main interaction pathways for BPT-GDO are shown in Figure S4. As a good material balance indication, the content of the liquid and solid products were more than 99% in Table 1. All the catalysts were tested for reusability for five cycles and the activity nearly still having the same activity in the case of acetone raw material without regeneration while having to be regenerated in each cycle in the case of using BPT.

3. Materials and Methods

3.1. Materials

Hβ zeolite (Si/Al = 25, particle size < 20 μm), cerium(III) nitrate hexahydrate (99.9%), lanthanum(III) nitrate hexahydrate (99.9%), and neodymium(III) nitrate hexahydrate (99.9%) were purchased from Sigma-Aldrich (Darmstadt, Germany). Acetone (99.8%), methanol (99.9%), ethanol (99.9%), isopropanol (99.9%), furfural (99.9%), 4-ethylguaiacol (99.9%), phenol (99.9%), methylethyl ketone (99.9%), cyclohexanone (99.9%), and acetic acid (99.9%) were procured from Microchem (Pezinok, Slovakia). The chemicals used are analytical reagents. Ultimate analyses of BPT, liquid, and solid products were conducted using a Vario Macro Cube® (Elementar, Langenselbold, Germany) Elemental analyzer. A CHNS module with a combustion tube temperature of 1150 °C and a reduction tube temperature of 850 °C was used. Calorific values of BPT, liquid, and solid products were analyzed using an isoperibolic bomb calorimeter (Fire Testing Technology Limited, East Grinstead, UK). BPT raw material originated from our previous research and the physicochemical analysis of BPT, liquid, and solid products from tar are presented in Table 6.

3.2. Synthesis of Modified Hβ Zeolite

Hβ zeolite was obtained by calcination of zeolite β with ammonium (Si/Al ratio = 25) for 5 h at 550 °C. Three rare earth elements (Ce, La, and Nd) were loaded in different wt% on the surface of Hβ zeolite by the incipient wetness impregnation method [60]. A suitable amount of rare earth metal nitrate hex hydrate (as an example 0.3099 g for the preparation of 1% Ce loaded Hβ zeolite) was dissolved in 40 mL of distilled water to fill the pore volume and added to 10 g of Hβ zeolite dropwise until the Hβ zeolite powder became wet and all the 40 mL was added; the wet powder was left for 24 h for neutralization and water maturation. Then, a hot plate was used to remove water vapor from the prepared catalysts and was then kept in an air-dry oven at 110 °C for 16 h to vaporize the rest of the water. Finally, the catalysts were calcined in an air muffle furnace at 550 °C for 5 h. Six catalyst samples were prepared (1 wt% Ce/Hβ zeolite, 5 wt% Ce/Hβ zeolite, 1 wt% All) and calcined at 550 °C for 3 h before being tested in the GDO packed bed reactor.

3.3. Catalyst Characterization

Adsorption–desorption phenomena of N2 in a Surfer equipment (Thermo ScientificTM, Waltham, MA, USA) were used to test the BET surface area and pore volume. In the beginning, the catalyst samples were degassed at 200 °C for 1 h and N2 adsorption and desorption were started. TGA and DTG were conducted using a simultaneous TG/DSC analyzer (Netzsch STA 409 PC Luxx, Selb, Germany) for the loaded Hβ zeolite catalysts by increasing the temperature in the range between 25 °C to 800 °C at a rate of 10 °C every one minute under the nitrogen flow of 30 mL/min. A D5000 diffractometer (Cu anode, and Kα = 1.5406 Å, Siemens / Bruker Munich, Germany) was used for the X-ray diffraction test of the loaded Hβ zeolite samples before and after their regeneration to check the phases and d-spacing values. The angle of the instrument was changed in the range of (2θ = 10–60°) with a scanning rate of 0.03° at an operation voltage of 40 kV and current of 30 mA.
In addition, X-ray fluorescence spectroscopy analysis using an Axiosm AX XRF (PANalytical BV, Netherlands) instrument was used for elemental analysis of the catalyst samples to detect the amount of Ce, La, and Nd in the loaded Hβ zeolite samples before and after their regeneration. The ammonia temperature programmed desorption (Ammonia-TPD) method was used to test the catalyst acidity using a CHEM-BET 3000 instrument (Quantachrome, Boynton Beach, FL, USA). Catalyst sample of 0.1 g was degassed at 450 °C for 1 h in nitrogen atmosphere followed by cooling to 0 °C and passing gas mixture of ammonia and nitrogen of 1 mol% for 1 h. In addition, the catalyst samples were heated to 100 °C to achieve equilibrium and the temperature was then increased at the rate of 10 °C/min until 900 °C were reached and the desorbed ammonia was detected by a thermal conductivity detector (TCD). Pyridine–Fourier Transform Infra-Red Spectroscopy (Pyr-FTIR) was used for the quantitative analysis of Bronsted and Lewis acid sites using a Bruker Tensor II Instrument (Bruker Optics GmbH, Ettlingen, Germany). The resulting spectra were in the range of 4000–400 cm−1 with a resolution of 4 cm−1. First, 10 mg of the sample was taken without treatment with pyridine (as Wo) and after treatment with pyridine as W1. The pyridine absorbed is W1–Wo. Then, divide the weight of pyridine by the weight of the sample used for acid site identification. Second, recollect the amount of pyridine adsorbed by heating the sample (W1) and analyze the amount of pyridine by using chromatography method. Finally, by comparing the intensity of the representative peaks of Lewis and Bronsted acid sites and multiplying them with the amount of pyridine absorbed, the concentration of the acid sites was calculated.

3.4. Biomass Pyrolysis Tar Purification

The biomass type was wooden chips (oak wood) with a diameter 1–1.5 mm pyrolyzed at 550 °C with residence time of approximately 15 min with feedstock moisture content of 5%. BPT used in the present work was extracted from biomass pyrolysis liquid fraction captured in isopropanol from a previous work of our research group (Volatile products were passed through water-cooled condenser where most of the tar condensed. To achieve higher purity of the gas, pyrolysis gas leaving the condenser passed through series of scrubbers filled with isopropanol. After each experiment, isopropanol was removed from tar by vacuum distillation at 50 mbar) [4] and purified to be used as raw material in the GDO reaction. BPT purification steps are described here. BPT liquid mixture contained considerable amount of isopropanol and a sample of 800 g of this mixture was taken and filtered under vacuum to remove any solids. Isopropanol was removed from the mixture by atmospheric distillation to the final temperature of 82 °C. Mass of the distillation residue was around 260 g in every run and this fraction contained a considerable amount of water which was removed in the following successive steps. First, the distillation residue was mixed with double the amount of dichloromethane and the mixture was left to settle for 3 h forming two phases.
Most BPT was extracted into the dichloromethane layer; dichloromethane was then removed from BPT by atmospheric distillation in the temperature range of 40–50 °C. To minimize the water content in the distillation residue even further, solid sodium sulfate was gradually added into BPT after distillation until it stopped settling on the bottom of the flask and its crystals started to float in BPT. The produced slurry was then filtered under vacuum. Thus, purified BPT with minimum water content was produced. Final mass of the product (purified BPT) was around 60 g in each run (Real tar certainly contains significant amount of water. However, to keep the catalyst testing conditions consistent, solids and water were removed. Thus, pump fouling was prevented and only produced water was captured among liquid products. Waxes and highly viscous compounds were also removed during tar purification, which also led to easier handling of the tar feedstock and lower fouling of the reactor and tested catalysts).

3.5. Gas-Phase Deoxygenation

The GDO process was carried out in a tubular stainless-steel reactor (length = 470 mm, inner diameter = 17 mm) packed with inert packing up to half of the reactor length; middle hot zone of the reactor was packed with cylindrical pellets of unloaded and rare earth metal loaded Hβ zeolite catalyst (length = 8 mm, inner Diameter = 8 mm). Schematic diagram of the GDO process is shown in Figure 10. For each experimental run, liquid acetone or BPT was fed into the reactor at the rate of 0.31 mL/min using a membrane dosing pump, while H2 gas was fed from a pressure cylinder at the flow rate of 33 L/h into the reactor filled with 15 g of catalyst pellets, the feed was controlled by a control valve (hydrogen flow was selected according to capability of our lab flow meters. Then acetone feed was calculated according to the Ratio of H2/Acetone nearly equal to 64/36). The stainless-steel reactor is fixed inside an electrical tube furnace with a controller for the temperature and time (temperature was controlled and measured by the heating furnace during the experiments. However, Ni-based thermal sensor was inserted into open heated-up reactor outside of experiments. Temperature of the hotspot, where catalyst was located differed from furnace’s preset temperature by max. of 5 °C. Temperature dropped towards top and bottom of the reactor. For example, the temperature of inert filling located under the catalyst was approximately 10 °C lower than furnace preset temperature). The outlet of the reactor is connected to a system of three scrubbers filled with 50 mL of methanol; glass beds are fixed in a cryostat system at −10 °C to ensure the absorption of product vapors. In addition, scrubbers’ outlet is connected through a three-way valve for GC-gas sampling to a bubble flowmeter and the flue gas vent. Before starting any experiments, the reactor is inertized using N2 gas at the flow rate of 25 L/h for 15 min to ensure the removal of air from the system. After each run, the catalyst is regenerated in the reactor at 800 °C for 2 h under airflow of 30 L/h to ensure the removal of char from the catalyst active sites. Each experiment was performed for 3 h in the temperature range of 200–400 °C and a total of six GC-gas samples (one sample taken for each 30 min) were taken for each run using a 40 cm3 syringe and injected into the GC gas analysis system. Hydrogen pressure was kept at 110 kPa (abs). The whole apparatus was considered as atmospheric. Slight overpressure of inlet hydrogen was selected to overcome pressure loss in the catalyst bed and in the scrubbers. Finally, the accumulated products with methanol solvent in the scrubbers were collected and weighted for final GC-liquid sampling while the solid products from BPT were collected from inside the reactor for later analysis using an elemental analyzer. Catalyst was regenerated after each experiment. However, in some cases, the reactor was cooled down after the experiment without catalyst regeneration so the extent of coke formation could be evaluated. After the coked catalyst was weighed it was inserted back into the reactor and regenerated. Coke formed on the surface of the catalyst was calculated by weighing fresh and used catalyst and the difference is the coke weight. Parameters affecting the GDO of BPT studied included rare earth metal loading, reaction contact time, and reaction temperature. Each experiment was repeated three times and the average value was used.

3.6. Biomass Pyrolysis Tar and Product Analysis

GC analysis for the gas product samples was performed using Agilent GC 7890A9 (Agilent Technologies, Santa Clara, CA, USA) equipped with two columns (J& W W113–4362 260 °C, 60 m × 320 μm × 50 μm connected to a flame ionization detector (FID) with the temperature set to 250 °C, and Agilent PLOTQ + MOLSIEVE 260 °C, 65 m × 530 μm × 50 μm connected to a thermal conductivity detector (TCD) and temperature set to 190 °C) and helium as the carrier gas. Liquid samples collected from the scrubbers were tested using Agilent GC 6890 N (Agilent Technologies, USA) equipped with a PEG column at 90 °C and connected to FID at 240 °C. However, GC analysis was carried out at 3 temperatures (60, 90, and 200 °C). Higher temperature of the GC column would cause several compounds to overlap, especially alcohols. The lowest GC temperature was applied for measuring alcohol aldehyde content, ketones content, middle temperature for measuring acetic acid, toluene, and xylene and the highest temperature for measuring furfural, phenol, and others. Provided calibration was used to calculate content of each selected compound. Weight fractions of the main liquid components identified by GC were calculated by dividing the peak area of the identified component by the total peak area of the total identified peaks including methanol (Calibration lines were created for all monitored compounds (ethanol, acetic acid, phenol) using pure compounds of known weight dissolved in methanol). In addition, BPT and the liquid products were characterized using gas chromatography-mass spectroscopy (GC-MS QP2010S, Shimadzu, Tokyo, Japan) employing column specifications: chromatographic column type HP-1MS, diameter = 0.25 mm, length = 30 m, thickness = 0.25 µm. The oven temperature increased from the initial value of 40 °C for 15 min at the rate of 10 °C/min to 250 °C which was maintained for 10 min. Moreover, elemental analysis was conducted for BPT and the liquid and solid products. Karl Fischer’s titration method was used to determine the water content in BPT and liquid products using a Metrohm 870 Titrino Plus instrument (Metrohm, Herisau, Switzerland). Total mass of the detected organic compounds was subtracted from the total mass of the liquid. To analyze the process results and interactions, reaction conversion (X), product distribution ( ( i ) ), degree of deoxygenation (DOD), yield( ( Y i ) ), water content ( ( W c o n t . ) ), and contact time were calculated according to the following equations. Reaction conversion (X) of acetone or BPT was calculated according to Equation (2):
X % = n f n l p n f × 100 %
where nf is the amount of feed injected acetone or BPT in moles, and nlp is the amount of liquid product.
Product distribution ( i ) was calculated according to Equation (3):
i % = n i n t p × 100 %
where ni is the amount of product i in moles, and ntp is the total amount of products in moles.
Deoxygenation degree (DOD) was calculated according to Equation (4):
D O D % = 1 m o l p m o f × 100 %
where molp is the mass of oxygen in liquid products, and mof is the mass of oxygen in the injected feed.
Yields of liquid, gas, and water products ( Y i ) were calculated according to Equation (5):
Y i % = m p i m f × 100 %
where mpi is the mass of product i, and mf is the mass of the feed (acetone or BPT).
Water content ( W c o n t . ) was calculated according to Equation (6):
W c o n t . % = m w , l p m l p × 100 %
where mw,lp is the mass of water in the liquid product, and mlp is the mass of liquid product.
Contact time ( t c ) for the GDO reaction was calculated according to Equation (7):
t c % = V s Q f v + Q H 2 × 100 %
where Vs is the volume of the void fraction between catalyst particles, Qfv is the flow rate (mL/s) of vapor feed (acetone or BPT), and QH2 is the flow rate (mL/s) of hydrogen gas at normal pressure.

4. Conclusions

The addition of rare earth metals into the structure of Hβ zeolite decreased the surface area of the catalysts depending on the diameter of the rare earth metal ion added; a large diameter led to a more significant decrease in surface area and pore volume and an increase in the average pore volume. Although the surface area of modified catalysts decreased, the mesopore size increased significantly as the added rare earth metals cover the external surface area and block micropores. DTG graphs for all catalysts are similar and indicate their high stability at high temperatures; moreover, their structure did not change due to the addition of rare earth metals. The addition of rare earth metals into the structure of Hβ zeolite increases the ratio of Lewis/Bronsted acid sites, i.e., an increase in the Lewis acid sites, and it can be concluded that the GDO reaction is controlled by the Lewis acidity. The regenerated catalysts have the same MFI structure as the fresh ones, which means that the catalysts can be reused after coke removal without a significant change in their activity. The highest activity (DOD of 79.5% and conversion rate of 88.7%) was achieved for the 1 wt% Ce/Hβ zeolite catalyst and the main products were aromatic hydrocarbons and aldehydes in the ratio of 55.8% and 29.5%, respectively. Contact time and temperature had the most significant effect on acetone GDO. A considerable amount of CO and CO2 are produced at 400 °C due to the cracking of carbonyl and carboxyl groups. The composition of BPT was detected using GC-MS characterization and the main components were water: 0.71%, furfural: 5.85%, 4-ethylguaiacol: 2.14%, phenol: 13.63%, methylethyl ketone: 5.34%, cyclohexanone: 3.23%, isopropanol: 4.78%, ethanol: 3.67%, methanol: 3.13%, acetic acid: 41.06%, and acetone: 16.46%. The yields of water, liquid phase, and gas phase were 18.33%, 47.42%, and 34.25%, respectively. The Ce active material inhibited acetic acid self-ketonization at 400 °C. However, the conversion of smaller molecules decreased as the micropores were closed by the Ce active material. Alkyl-substituted phenols and aromatic hydrocarbons achieved the highest conversion of 37.34% and 35.56%, respectively. While acetic acid dehydration led to the production of 41.32% of acetaldehyde in the liquid phase, 26.44% of CO2, 28.52% of CO, 26.31% of CH4, 4.51% of C3H8, and 3.87% of C2H6 were the main gas phase products. Low-temperature GDO favored the esterification reaction. The main interaction pathways for the BPT-GDO with the 1 wt% Ce/Hβ zeolite catalyst at 400 °C and a process time of 3 h have also been proposed.

Supplementary Materials

The following supporting information can be downloaded at https://www.mdpi.com/article/10.3390/catal13061016/s1, Figure S1: Ammonia-TPD profiles for pure Hβ zeolite, 1 wt% loaded Hβ zeolite, and 5 wt% loaded Hβ zeolite before and after their regeneration at 800 °C for 2 h (a) Ce loaded Hβ zeolite, (b) La loaded Hβ zeolite, and (c) Nd loaded Hβ zeolite (All catalysts were calcined for 6 h at 550 °C), Figure S2: Pyridine-Fourier-Transform Infra-Red Spectroscopy, Table S1: GC-FID analysis of liquid phase products of the GDO reaction of acetone, Figure S3: Reaction network for GDO of acetone model compound at 400 °C using 1 wt% Ce/ Hβ zeolite as the catalyst, Figure S4: Main interaction pathways for biomass pyrolysis of tar GDO using 1 wt% Ce/ Hβ zeolite as the catalyst at 400 °C and process time of 3 h.

Author Contributions

A.A.J.: Data curation, Writing—Original draft preparation, Visualization, Investigation, Validation. J.H. (Juma Haydary): Supervision, Writing- Reviewing and Editing. S.A.A.: Conceptualization, Methodology, Software, Writing—Reviewing and Editing. J.H. (Jakub Husár): Conceptualization, Methodology, Software, Writing—Reviewing and Editing. All authors have read and agreed to the published version of the manuscript.

Funding

This research was supported by the Slovak Research and Development Agency under contract No. APVV-19-0170.

Data Availability Statement

The data presented in this study are available on request from the corresponding author. The data are not publicly available due to privacy.

Acknowledgments

Authors of the paper appreciate all support from any person and institute especially, the Faculty of Chemical Engineering and Food Technology, Department of Chemical Engineering, and the Department of Biology, University of Al Qadisiyah.

Conflicts of Interest

No conflicts, informed consent, or human or animal rights are applicable to this study.

References

  1. Hasan, N.H.; Jazie, A.A. Hydrothermal Liquefaction Conversion of Lignocelluloses and waste Biomass Using Zeolite Catalyst. IOP Conf. Series Earth Environ. Sci. 2021, 790, 012036. [Google Scholar] [CrossRef]
  2. Nolte, M.W.; Shanks, B.H. A Perspective on Catalytic Strategies for Deoxygenation in Biomass Pyrolysis. Energy Technol. 2017, 5, 7–18. [Google Scholar] [CrossRef]
  3. Yek, P.N.Y.; Mahari, W.A.W.; Kong, S.H.; Foong, S.Y.; Peng, W.; Ting, H.; Liew, R.K.; Xia, C.; Sonne, C.; Tabatabaei, M.; et al. Pilot-scale co-processing of lignocellulosic biomass, algae, shellfish waste via thermochemical approach: Recent progress and future directions. Bioresour. Technol. 2022, 347, 126687. [Google Scholar] [CrossRef] [PubMed]
  4. Husár, J.; Šuhaj, P.; Haydary, J. Experimental validation of complex mathematical model of screw reactor coupled with particle model describing pyrolysis of lignocellulosic biomass. J. Environ. Chem. Eng. 2021, 9, 105543. [Google Scholar] [CrossRef]
  5. Vignesh, N.S.; Soosai, M.R.; Chia, W.Y.; Wahid, S.N.; Varalakshmi, P.; Moorthy, I.M.G.; Ashokkumar, B.; Arumugasamy, S.K.; Selvarajoo, A.; Chew, K.W. Microwave-assisted pyrolysis for carbon catalyst, nanomaterials and biofuel production. Fuel 2022, 313, 123023. [Google Scholar] [CrossRef]
  6. Zhang, Z.; Li, H. Water-mediated catalytic hydrodeoxygenation of biomass. Fuel 2022, 310, 122242. [Google Scholar] [CrossRef]
  7. Shukla, S.S.; Chava, R.; Appari, S.; Bahurudeen, A.; Kuncharam, B.V.R. Sustainable use of rice husk for the cleaner production of value-added products. J. Environ. Chem. Eng. 2022, 10, 106899. [Google Scholar] [CrossRef]
  8. Qin, Q.; Zhou, J.; Zhou, L.; Guo, Q. Investigation on effect of coal fly ash on properties of corn straw pyrolysis products. J. Energy Inst. 2022, 100, 213–224. [Google Scholar] [CrossRef]
  9. Lee, W.-S.; Wang, Z.; Zheng, W.; Vlachos, D.; Bhan, A. Catalysis Science & Technology 2-methylfuran on molybdenum carbide catalysts †. Catal. Sci. Technol. 2014, 4, 2340–2352. [Google Scholar] [CrossRef]
  10. Li, G.; Li, N.; Yang, J.; Wang, A.; Wang, X.; Cong, Y.; Zhang, T. Synthesis of renewable diesel with the 2-methylfuran, butanal and acetone derived from lignocellulose. Bioresour. Technol. 2013, 134, 66–72. [Google Scholar] [CrossRef]
  11. Mortensen, P.M.; Grunwaldt, J.-D.; Jensen, P.A.; Jensen, A.D. Influence on nickel particle size on the hydrodeoxygenation of phenol over Ni/SiO2. Catal. Today 2016, 259, 277–284. [Google Scholar] [CrossRef]
  12. Sulman, A.; Mäki-Arvela, P.; Bomont, L.; Alda-Onggar, M.; Fedorov, V.; Russo, V.; Eränen, K.; Peurla, M.; Akhmetzyanova, U.; Skuhrovcová, L.; et al. Kinetic and Thermodynamic Analysis of Guaiacol Hydrodeoxygenation. Catal. Lett. 2019, 149, 2453–2467. [Google Scholar] [CrossRef] [Green Version]
  13. Wang, J.; Abdelouahed, L.; Xu, J.; Brodu, N.; Taouk, B. Catalytic Hydrodeoxygenation of Model Bio-oils Using HZSM-5 and Ni2P/HZM-5 Catalysts: Comprehension of Interaction. Chem. Eng. Technol. 2021, 44, 2126–2138. [Google Scholar] [CrossRef]
  14. Ly, H.V.; Galiwango, E.; Kim, S.-S.; Kim, J.; Choi, J.H.; Woo, H.C.; Othman, M.R. Hydrodeoxygenation of 2-furyl methyl ketone as a model compound of algal Saccharina Japonica bio-oil using iron phosphide catalyst. Chem. Eng. J. 2017, 317, 302–308. [Google Scholar] [CrossRef]
  15. Wang, J.; Jabbour, M.; Abdelouahed, L.; Mezghich, S.; Estel, L.; Thomas, K.; Taouk, B. Catalytic upgrading of bio-oil: Hydrodeoxygenation study of acetone as molecule model of ketones. Can. J. Chem. Eng. 2021, 99, 1082–1093. [Google Scholar] [CrossRef]
  16. Ju, C.; Li, M.; Fang, Y.; Tan, T. Efficient Hydro-Deoxygenation of Lignin Derived Phenolic Compounds over Bifunctional Catalysts with Optimized Acid/Metal Interactions. Green Chem. 2018, 20, 4492–4499. [Google Scholar] [CrossRef]
  17. Li, Z.; Xu, X.; Jiang, E.; Han, P.; Sun, Y.; Zhou, L.; Zhong, P.; Fan, X. Alkane from hydrodeoxygenation (HDO) combined with in-situ multistage condensation of biomass continuous pyrolysis bio-oil via mixed supports catalyst Ni/HZSM-5-γ-Al2O3. Renew. Energy 2020, 149, 535–548. [Google Scholar] [CrossRef]
  18. Yan, P.; Bryant, G.; Li, M.M.-J.; Mensah, J.; Kennedy, E.; Stockenhuber, M. Shape selectivity of zeolite catalysts for the hydrodeoxygenation of biocrude oil and its model compounds. Microporous Mesoporous Mater. 2020, 309, 110561. [Google Scholar] [CrossRef]
  19. Wu, Y.; Xu, X.; Sun, Y.; Jiang, E.; Fan, X.; Tu, R.; Wang, J. Gas-phase hydrodeoxygenation of guaiacol over Ni-based HUSY zeolite catalysts under atmospheric H2 pressure. Renew. Energy 2020, 152, 1380–1390. [Google Scholar] [CrossRef]
  20. Yu, W.; Tang, Y.; Mo, L.; Chen, P.; Lou, H.; Zheng, X. One-step hydrogenation–esterification of furfural and acetic acid over bifunctional Pd catalysts for bio-oil upgrading. Bioresour. Technol. 2011, 102, 8241–8246. [Google Scholar] [CrossRef]
  21. Wan, H.; Chaudhari, R.V.; Subramaniam, B. Aqueous Phase Hydrogenation of Acetic Acid and Its Promotional Effect on p-Cresol Hydrodeoxygenation. Energy Fuels 2013, 27, 487–493. [Google Scholar] [CrossRef]
  22. Chen, W.; Luo, Z.; Yu, C.; Li, G.; Yang, Y.; Zhang, J.; Lu, K. Catalytic transformations of acids, aldehydes, and phenols in bio-oil to alcohols and esters. Fuel 2014, 135, 55–62. [Google Scholar] [CrossRef]
  23. Zeng, Y.; Wang, Z.; Lin, W.; Song, W. In situ hydrodeoxygenation of phenol with liquid hydrogen donor over three supported noble-metal catalysts. Chem. Eng. J. 2017, 320, 55–62. [Google Scholar] [CrossRef]
  24. Sankaranarayanan, T.; Kreider, M.; Berenguer, A.; Gutiérrez-Rubio, S.; Moreno, I.; Pizarro, P.; Coronado, J.; Serrano, D. Cross-reactivity of guaiacol and propionic acid blends during hydrodeoxygenation over Ni-supported catalysts. Fuel 2018, 214, 187–195. [Google Scholar] [CrossRef]
  25. Funkenbusch, L.T.; Mullins, M.E.; Salam, M.A.; Creaser, D. Catalytic Hydrotreatment of Pyrolysis Oil Phenolic Compounds over Pt/Al2O3 and Pd/C. Fuel 2019, 243, 441–448. [Google Scholar] [CrossRef]
  26. Gutiérrez-Rubio, S.; Moreno, I.; Serrano, D.P.; Coronado, J.M. Hydrotreating of Guaiacol and Acetic Acid Blends over Ni2P/ZSM-5 Catalysts: Elucidating Molecular Interactions during Bio-Oil Upgrading. ACS Omega 2019, 4, 21516–21528. [Google Scholar] [CrossRef] [Green Version]
  27. Azreena, I.N.; Lau, H.L.N.; Asikin-Mijan, N.; Izham, S.M.; Hassan, M.A.; Kennedy, E.; Stokenhuber, M.; Taufiq-Yap, Y.H. Hydrodeoxygenation of oleic acid for effective diesel-like hydrocarbon production using zeolite-based catalysts. React. Kinet. Catal. Lett. 2021, 134, 1069–1083. [Google Scholar] [CrossRef]
  28. Sousa-Aguiar, E.F.; Trigueiro, F.E.; Zotin, F.M.Z. The role of rare earth elements in zeolites and cracking catalysts. Catal. Today 2013, 218–219, 115–122. [Google Scholar] [CrossRef]
  29. Jazie, A.A.; Haydary, J.; Abed, S.A.; Al-Dawody, M.F. Hydrothermal liquefaction of Fucus vesiculosus algae catalyzed by Hβ zeolite catalyst for Biocrude oil production. Algal Res. 2022, 61, 102596. [Google Scholar] [CrossRef]
  30. Zhang, Y.; Wang, Y.; Bu, Y.; Mi, Z.; Wu, W.; Min, E.; Han, S.; Fu, S. Beckmann rearrangement of cyclohexanone oxime over Hβ zeolite and Hβ zeolite-supported boride. Catal. Commun. 2005, 6, 53–56. [Google Scholar] [CrossRef]
  31. Zhang, Q.; Ming, W.; Ma, J.; Zhang, J.; Wang, P.; Li, R. De novo assembly of a mesoporous beta zeolite with intracrystalline channels and its catalytic performance for biodiesel production. J. Mater. Chem. A 2014, 2, 8712–8718. [Google Scholar] [CrossRef]
  32. Fei, J.; Hou, Z.; Zhu, B.; Lou, H.; Zheng, X. Synthesis of dimethyl ether (DME) on modified HY zeolite and modified HY zeolite-supported Cu–Mn–Zn catalysts. Appl. Catal. A Gen. 2006, 304, 49–54. [Google Scholar] [CrossRef]
  33. Otomo, R.; Yokoi, T.; Kondo, J.N.; Tatsumi, T. Dealuminated Beta zeolite as effective bifunctional catalyst for direct transformation of glucose to 5-hydroxymethylfurfural. Appl. Catal. A Gen. 2014, 470, 318–326. [Google Scholar] [CrossRef]
  34. Liu, X.; Liu, Y.; Li, X.; Xiang, S.; Zhang, Y.; Ying, P.; Wei, Z.; Can, L. Cyclopropanation on a highly active heterogeneous catalyst. Appl. Catal. A Gen. 2003, 239, 279–286. [Google Scholar] [CrossRef]
  35. Wang, H.; Zou, Y. Modified Beta Zeolite as Catalyst for Fries Rearrangement Reaction. Catal. Lett. 2003, 86, 163–167. [Google Scholar] [CrossRef]
  36. Zaiku, X.; Qingling, C.; Chengfang, Z.; Jiaqing, B.; Yuhua, C. Influence of Citric Acid Treatment on the Surface Acid Properties of Zeolite Beta. J. Phys. Chem. B 2000, 104, 2853–2859. [Google Scholar] [CrossRef]
  37. Berenguer, A.; Bennett, J.A.; Hunns, J.; Moreno, I.; Coronado, J.M.; Lee, A.F.; Pizarro, P.; Wilson, K.; Serrano, D.P. Catalytic hydrodeoxygenation of m-cresol over Ni 2 P/hierarchical ZSM-5. Catal. Today 2018, 304, 72–79. [Google Scholar] [CrossRef] [Green Version]
  38. Li, Y.; Yang, X.; Zhu, L.; Zhang, H.; Chen, B. Hydrodeoxygenation of phenol as a bio-oil model compound over intimate contact noble metal–Ni2P/SiO2 catalysts. RSC Adv. 2015, 5, 80388–80396. [Google Scholar] [CrossRef]
  39. Choi, I.-H.; Lee, H.-J.; Hwang, K.-R. Understanding the effect of co-reactants on ketonization of carboxylic acids in the aqueous-phase pyrolysis oil of wood. Wood Sci. Technol. 2021, 55, 1745–1764. [Google Scholar] [CrossRef]
  40. Oyama, S.T.; Onkawa, T.; Takagaki, A.; Kikuchi, R.; Hosokai, S.; Suzuki, Y.; Bando, K. Production of Phenol and Cresol from Guaiacol on Nickel Phosphide Catalysts Supported on Acidic Supports. Top. Catal. 2015, 58, 201–210. [Google Scholar] [CrossRef]
  41. Parikh, J.K.; Srivastava, S.; Jadeja, G.C. Selective Hydrogenation of Furfural to Tetrahydrofurfuryl Alcohol Using Supported Nickel–Cobalt Catalysts. Ind. Eng. Chem. Res. 2019, 58, 16138–16152. [Google Scholar] [CrossRef]
  42. Alotaibi, M.A.; Kozhevnikova, E.F.; Kozhevnikov, I.V. Efficient hydrodeoxygenation of biomass-derived ketones over bifunctional Pt-polyoxometalate catalyst. Chem. Commun. 2012, 48, 7194–7196. [Google Scholar] [CrossRef]
  43. Kong, L.; Liu, C.; Gao, J.; Wang, Y.; Dai, L. Efficient and controllable alcoholysis of Kraft lignin catalyzed by porous zeolite-supported nickel-copper catalyst. Bioresour. Technol. 2019, 276, 310–317. [Google Scholar] [CrossRef]
  44. Zhang, W.; Zhang, Y.; Zhao, L.; Wei, W. Catalytic Activities of NiMo Carbide Supported on SiO2 for the Hydrodeoxygenation of Ethyl Benzoate, Acetone, and Acetaldehyde. Energy Fuels 2010, 24, 2052–2059. [Google Scholar] [CrossRef]
  45. Nikolopoulos, A.; Jang, B.-L.; Spivey, J. Acetone condensation and selective hydrogenation to MIBK on Pd and Pt hydrotalcite-derived MgAl mixed oxide catalysts. Appl. Catal. A Gen. 2005, 296, 128–136. [Google Scholar] [CrossRef]
  46. Gamman, J.J.; Jackson, S.D.; Wigzell, F.A. Synthesis of Methyl Isobutyl Ketone over Pd/MgO/SiO2. Ind. Eng. Chem. Res. 2010, 49, 8439–8443. [Google Scholar] [CrossRef]
  47. Zhang, H.; Xiao, R.; Jin, B.; Xiao, G.; Chen, R. Biomass catalytic pyrolysis to produce olefins and aromatics with a physically mixed catalyst. Bioresour. Technol. 2013, 140, 256–262. [Google Scholar] [CrossRef] [PubMed]
  48. Simakova, I.L.; Murzin, D.Y. Transformation of bio-derived acids into fuel-like alkanes via ketonic decarboxylation and hydrodeoxygenation: Design of multifunctional catalyst, kinetic and mechanistic aspects. J. Energy Chem. 2016, 25, 208–224. [Google Scholar] [CrossRef]
  49. Nakagawa, Y.; Liu, S.; Tamura, M.; Tomishige, K. Catalytic Total Hydrodeoxygenation of Biomass-Derived Polyfunctionalized Substrates to Alkanes. Chemsuschem 2015, 8, 1114–1132. [Google Scholar] [CrossRef]
  50. Witsuthammakul, A.; Sooknoi, T. Selective Hydrodeoxygenation of Bio-Oil Derived Products: Ketones to Olefins. Catal. Sci. Technol. 2015, 5, 3639–3648. [Google Scholar] [CrossRef]
  51. Bej, S.; Thompson, L. Acetone condensation over molybdenum nitride and carbide catalysts. Appl. Catal. A Gen. 2004, 264, 141–150. [Google Scholar] [CrossRef]
  52. Mullery, A.A.; Hoang, J.N.; Nguyen, A.T.; Luong, C.D.; Ledesma, E.B. Thermal decomposition pathways of 4-ethylguaiacol under fast pyrolysis and gasification conditions. J. Anal. Appl. Pyrolysis 2017, 123, 83–91. [Google Scholar] [CrossRef]
  53. Kunkes, E.L.; Simonetti, D.A.; West, R.M.; Serrano-ruiz, J.C.; Gärtner, C.A.; Dumesic, J.A. Catalytic Conversion of Biomass. Science 2008, 1381, 417–421. [Google Scholar] [CrossRef]
  54. Jaatinen, S.K.; Karinen, R.; Lehtonen, J.S. Liquid Phase Furfural Hydrotreatment to 2-Methylfuran with Carbon Supported Copper, Nickel, and Iron Catalysts. ChemistrySelect 2017, 2, 51–60. [Google Scholar] [CrossRef]
  55. Mante, O.D.; Rodriguez, J.A.; Babu, S.P. Selective defunctionalization by TiO2 of monomeric phenolics from lignin pyrolysis into simple phenols. Bioresour. Technol. 2013, 148, 508–516. [Google Scholar] [CrossRef] [PubMed]
  56. Xu, Y.; Zhang, L.; Chang, J.; Zhang, X.; Ma, L.; Wang, T.; Zhang, Q. One step hydrogenation–esterification of model compounds and bio-oil to alcohols and esters over Raney Ni catalysts. Energy Convers. Manag. 2016, 108, 78–84. [Google Scholar] [CrossRef]
  57. Li, W.; Wang, H.; Wu, X.; Betancourt, L.E.; Tu, C.; Liao, M.; Cui, X.; Li, F.; Zheng, J.; Li, R. Ni/hierarchical ZSM-5 zeolites as promising systems for phenolic bio-oil upgrading: Guaiacol hydrodeoxygenation. Fuel 2020, 274, 117859. [Google Scholar] [CrossRef]
  58. Williams, C.L.; Chang, C.-C.; Do, P.; Nikbin, N.; Caratzoulas, S.; Vlachos, D.G.; Lobo, R.F.; Fan, W.; Dauenhauer, P.J. Cycloaddition of Biomass-Derived Furans for Catalytic Production of Renewable p-Xylene. ACS Catal. 2012, 2, 935–939. [Google Scholar] [CrossRef]
  59. Kumar, R.; Strezov, V.; Lovell, E.; Kan, T.; Weldekidan, H.; He, J.; Dastjerdi, B.; Scott, J. Bio-oil upgrading with catalytic pyrolysis of biomass using Copper/zeolite-Nickel/zeolite and Copper-Nickel/zeolite catalysts. Bioresour. Technol. 2019, 279, 404–409. [Google Scholar] [CrossRef]
  60. Kosri, C.; Deekamwong, K.; Sophiphun, O.; Osakoo, N.; Chanlek, N.; Föttinger, K.; Wittayakun, J. Comparison of Fe/HBEA catalysts from incipient wetness impregnation with various loading on phenol hydroxylation. React. Kinet. Catal. Lett. 2017, 121, 751–761. [Google Scholar] [CrossRef]
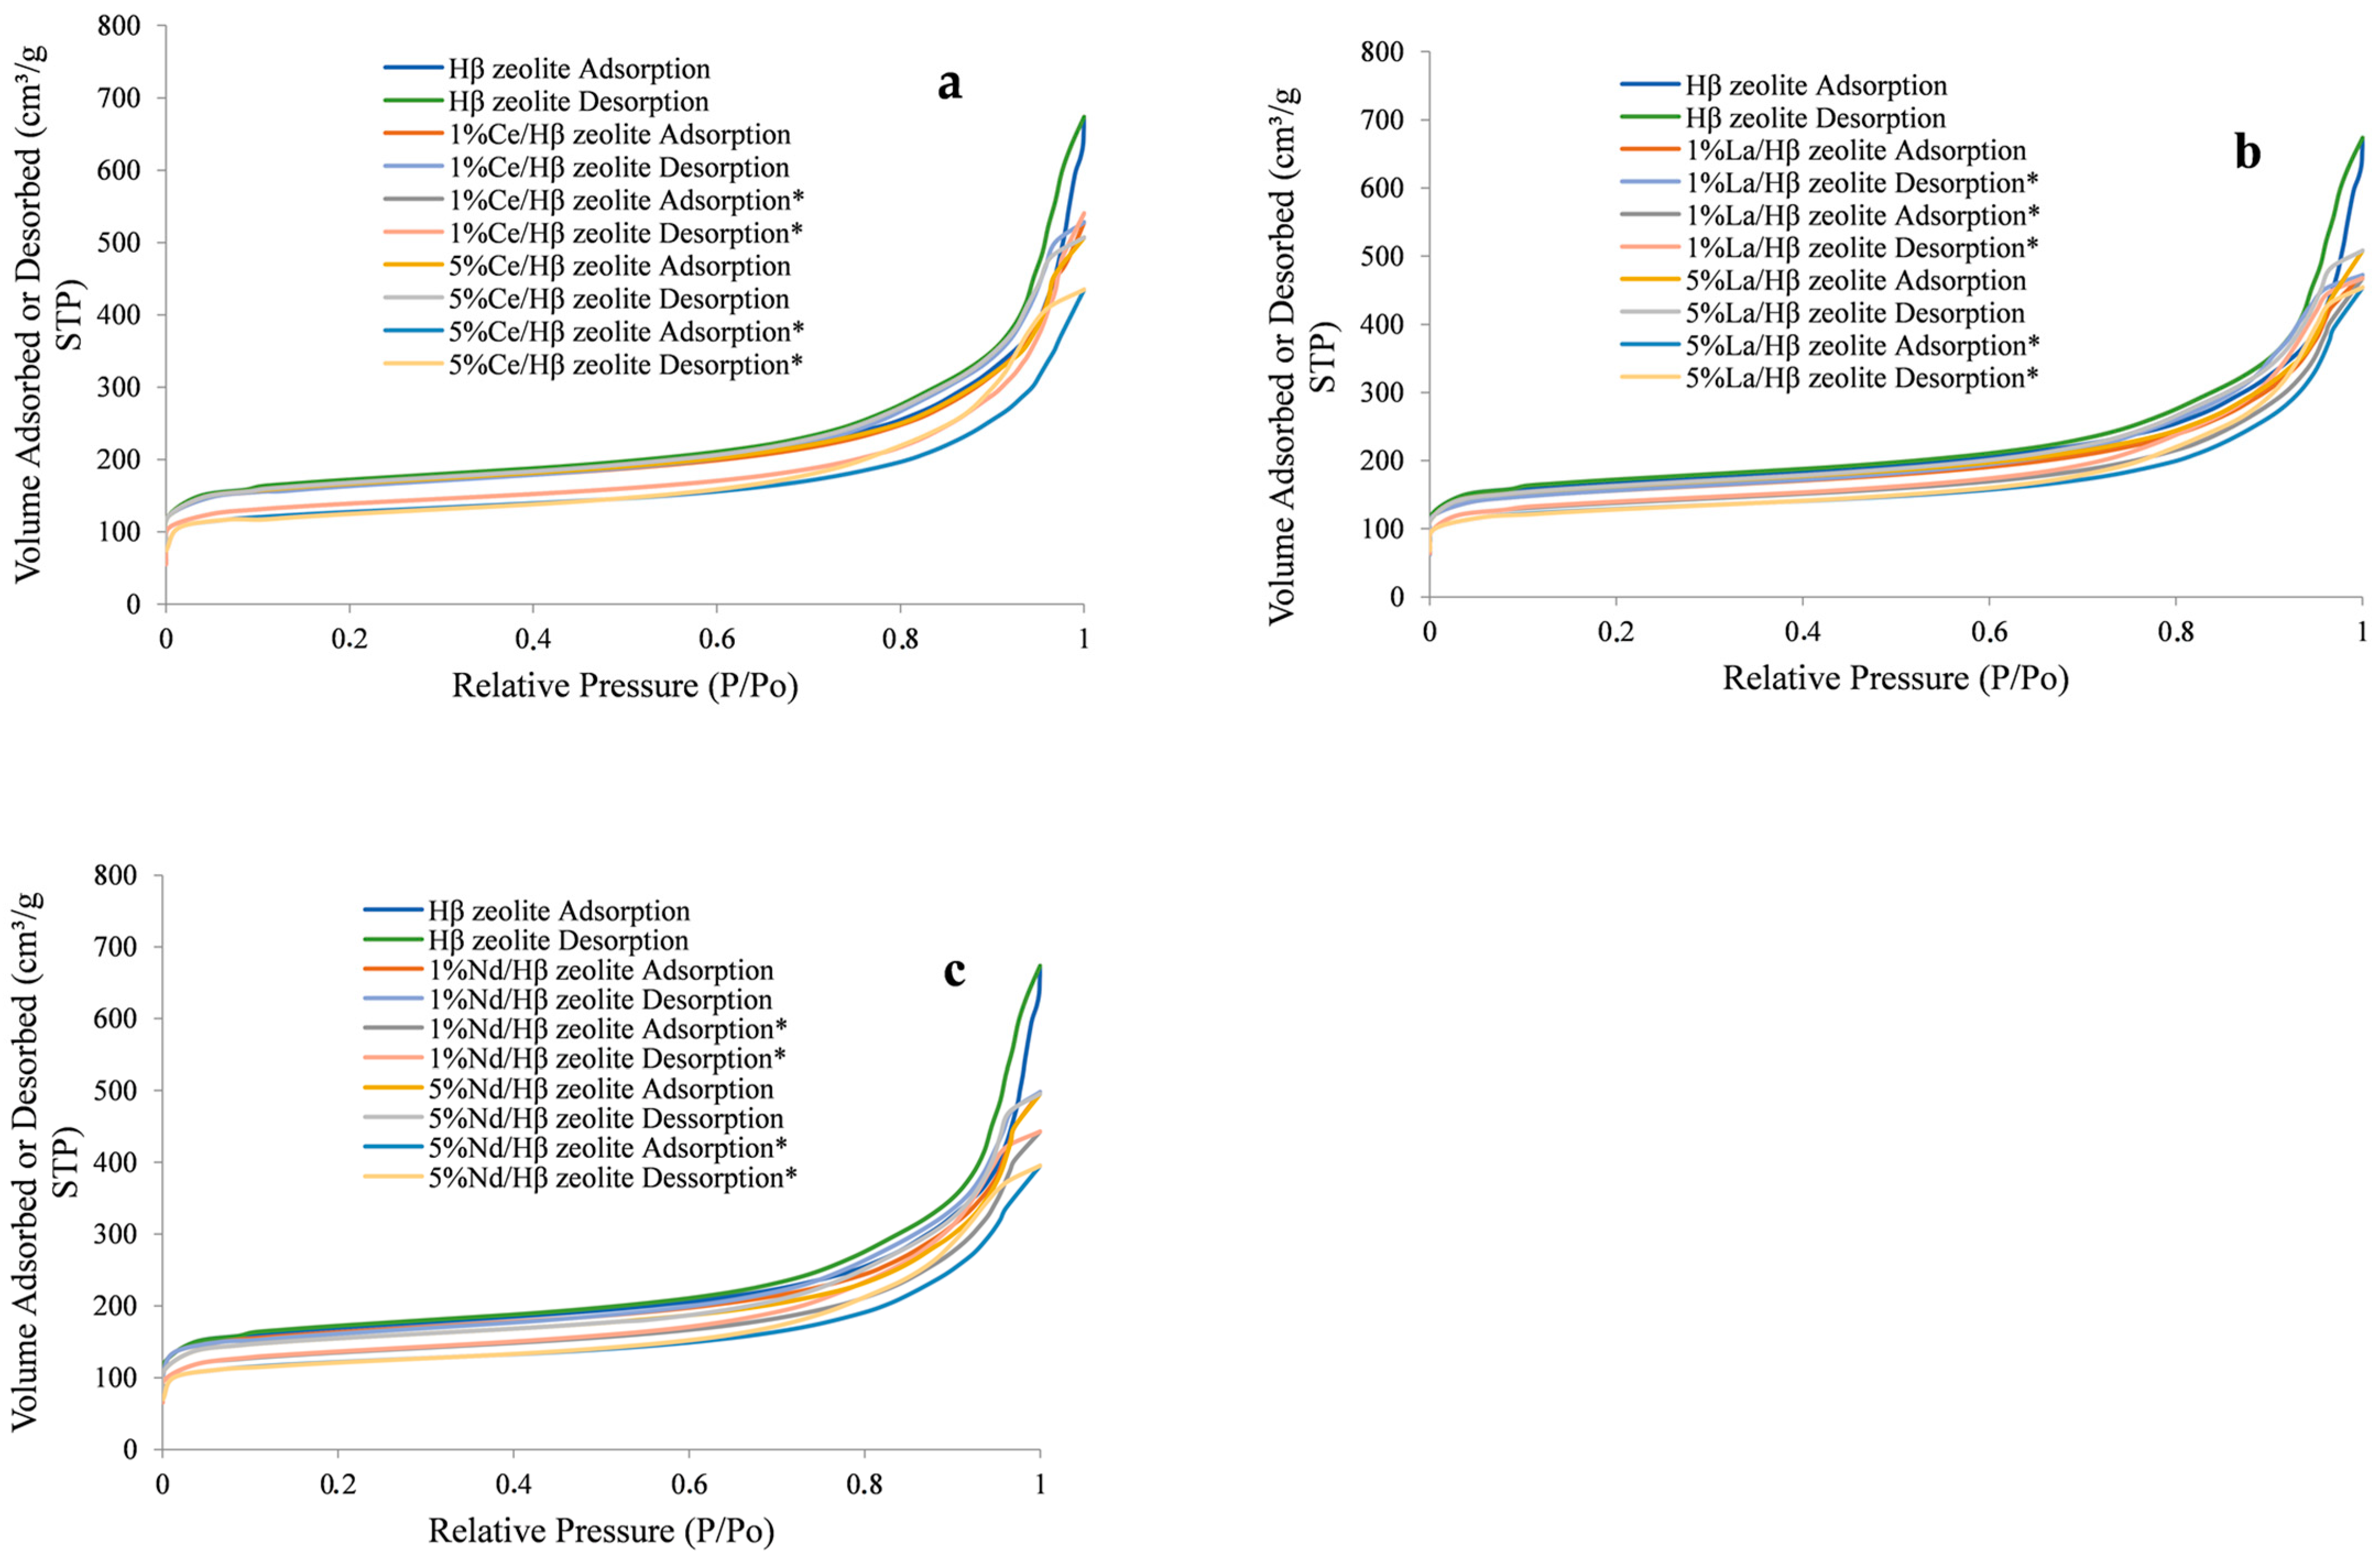
Figure 1. Adsorption–desorption isotherm for pure Hβ zeolite, 1 wt% loaded Hβ zeolite, and 5 wt% loaded Hβ zeolite before and after their regeneration at 800 °C for 2 h (a) Ce-loaded Hβ zeolite, (b) La-loaded Hβ zeolite, and (c) Nd-loaded Hβ zeolite (All catalysts were calcined for 6 h at 550 °C). * Catalysts are regenerated for 2 h at 800 °C.
Catalysts 13 01016 g001
Figure 2. Pore size distribution for pure Hβ zeolite, 1 wt% loaded Hβ zeolite, and 5 wt% loaded Hβ zeolite before and after their regeneration at 800 °C for 2 h (a) Ce-loaded Hβ zeolite, (b) La-loaded Hβ zeolite, and (c) Nd-loaded Hβ zeolite (All catalysts were calcined for 6 h at 550 °C). * Catalysts are regenerated for 2 h at 800 °C.
Catalysts 13 01016 g002
Figure 3. (a) TG and (b) DTG thermographs for 5 wt% Ce/Hβ zeolite, 5 wt% La/Hβ zeolite, and 5 wt% Nd/Hβ zeolite after their regeneration at 800 °C for 2 h (All catalysts were calcined for 6 h at 550 °C and used in the gas phase deoxygenation).
Catalysts 13 01016 g003
Figure 4. X-ray diffraction diffractogram for pure Hβ zeolite, 1 wt% loaded Hβ zeolite, and 5 wt% loaded Hβ zeolite before and after their regeneration at 800 °C for 2 h (a) Ce loaded Hβ zeolite, (b) La loaded Hβ zeolite, and (c) Nd loaded Hβ zeolite (All catalysts were calcined for 6 h at 550 °C). * Catalysts are regenerated for 2 h at 800 °C.
Catalysts 13 01016 g004
Figure 5. DOD and conversion rate for pure Hβ zeolite, 1 wt% Ce/Hβ zeolite, 5 wt% Ce/Hβ zeolite, 1 wt% La/Hβ zeolite, 5 wt% La/Hβ zeolite, 1 wt% Nd/Hβ zeolite, and 5 wt% Nd/Hβ zeolite using acetone as a model compound at 400 °C and reaction time of 3 h.
Catalysts 13 01016 g005
Figure 6. Distribution of GDO liquid products for pure and metal loaded Hβ zeolites, using acetone as a model component at 400 °C and reaction time of 3 h.
Catalysts 13 01016 g006
Figure 7. Variation of (a) water content, DOD, and conversion rate, (b) liquid phase, and (c) gas phase products distribution with reaction temperature in the range of 200–400 °C using 1 wt% Ce/Hβ zeolite as the catalyst.
Catalysts 13 01016 g007
Figure 8. (a) Liquid and (b) gas products and the composition of liquid and gas phase of GDO reaction using 1 wt% Ce/Hβ zeolite catalyst at 400 °C and process time of 3 h.
Catalysts 13 01016 g008
Figure 9. (a) Liquid and (b) gas phase product distribution in dependence on temperature using 1 wt% Ce/Hβ zeolite as the catalyst of biomass pyrolysis tar GDO (orginal composition of BPT: water, 0.71%, furfural, 5.85%, 4-ethylguaiacol, 2.14%, phenol, 13.63%, methylethyl ketone, 5.34%, cyclohexanone, 3.23%, isopropanol, 4.78%, ethanol, 3.67%, methanol, 3.13%, acetic acid, 41.06%, and acetone, 16.46%).
Catalysts 13 01016 g009
Figure 10. Set-up of fixed packed bed continuous GDO reactor (1: gas flow meter and control; 2: liquid pump; 3: liquid/BPT reservoir; 4: fixed packed bed reactor heated by electrical furnace; 5: bubble flow meter for product gas).
Catalysts 13 01016 g010
Table 1. Surface area, pore volume, and pore size of studied catalysts before and after their regeneration at 800 °C for 2 h (All catalysts were calcined for 6 h at 550 °C).
SampleSpecific Area (m2/g)Pore Volume (cm3/g)Pore Size (Å)
SBETSmicroSexternalVTotalVmicroVBJHDaverageDBJH
Hβ zeolite525.98225.56300.421.040.080.9624.7126.61
1 wt% Ce/Hβ496.63198.78297.850.770.060.7113.9615.79
1 wt% Ce/Hβ *423.68195.65228.030.690.060.6213.4015.66
5 wt% Ce/Hβ510.16199.89310.270.740.060.6814.4916.64
5 wt% Ce/Hβ *390.46187.88202.580.610.060.5512.7514.84
1 wt% La/Hβ481.12189.89291.230.770.080.6915.6317.29
1 wt% La/Hβ *418.73187.75230.980.820.080.7419.2921.36
5 wt% La/Hβ508.49198.93309.560.740.070.6713.9315.75
5 wt% La/Hβ *400.74185.78214.960.670.070.6014.2516.62
1 wt% Nd/Hβ500.08195.87304.210.720.070.6413.0715.12
1 wt% Nd/Hβ *419.20189.88229.320.720.070.6614.5316.65
5 wt% Nd/Hβ481.64188.78292.860.790.070.7214.3916.47
5 wt% Nd/Hβ *373.66165.78207.880.680.070.6115.5317.35
* Catalysts are regenerated for 2 h at 800 °C.
Table 2. XRF concentrations, crystallinity, Bronsted acidity, and Lewis acidity for pure and metal-loaded zeolites before and after their regeneration at 800 °C for 2h (All catalysts were calcined for 6 h at 550 °C).
CatalystMetal (wt%)Crystallinity (%)Bronsted Acidity (mmol/gm)Lewis Acidity (mmol/gm)
Hβ zeolite0.001000.560.28
1 wt% Ce/Hβ1.04950.790.91
1 wt% Ce/Hβ *1.03940.790.91
5 wt% Ce/Hβ4.98940.820.93
5 wt% Ce/Hβ *4.97930.810.92
1 wt% La/Hβ1.05930.670.61
1 wt% La/Hβ *1.04920.670.61
5 wt% La/Hβ4.96920.710.63
5 wt% La/Hβ *4.95910.700.62
1 wt% Nd/Hβ1.06930.640.54
1 wt% Nd/Hβ *1.05920.640.54
5 wt% Nd/Hβ5.09920.670.58
5 wt% Nd/Hβ *5.08910.650.57
* Catalysts are regenerated for 2 h at 800 °C.
Table 3. Variation of conversion rate and distribution of liquid product compounds with contact time (tc) at 400 °C using 1 wt% Ce/Hβ zeolite as the catalyst.
Contact Time, SecConversion, %Mesitylene,%Benzene, %Toluene, %Xylene, %Alkanes and Alkenes, %
0.31821.010.643.423.632.45
0.63881.311.129.2315.788.00
0.71920.611.619.0211.672.29
1.031000.521.428.899.842.17
Table 4. DOD, conversion, and yield of biomass pyrolysis tar GDO using 1%Ce/Hβ zeolite compared with pure Hβ zeolite.
DOD, Conversion, or Yield (wt%)Hβ Zeolite1wt%Ce/Hβ Zeolite
DOD59.868.6
Acetic acid conversion74.888.3
Acetone conversion−185.479.5
Furfural conversion100100
4-ethlyguaiacol conversion47.638.5
Phenol conversion4.316.4
Yield of water21.3518.33
Yield of liquid products49.7647.42
Yield of gas products28.8934.25
Table 5. DOD, conversion, and yield dependence on reaction temperature in the range of 300–400 °C using 1 wt% Ce/Hβ zeolite as the catalyst of biomass pyrolysis tar GDO.
DOD, Conversion, or Yield (wt%)300 °C350 °C400 °C
DOD54.762.468.6
Acetic acid conversion46.858.588.3
Acetone conversion37.249.879.5
Furfural conversion100100100
4-ethlyguaiacol conversion26.731.438.5
Phenol conversion24.518.316.4
Yield of water9.6815.1518.33
Yield of liquid products64.7557.4547.42
Yield of gas products24.7628.6534.25
Table 6. Physicochemical analysis of biomass pyrolysis tar raw material, liquid, and solid products of biomass pyrolysis tar GDO.
MaterialHHV (MJ/kg) **Ultimate Analysis (wt%) **
C (wt%)H (wt%)N (wt%)S (wt%)O (wt%) *Ash
Biomass pyrolysis tar24.23 ± 0.0659.06 ± 0.089.50 ± 0.090.32 ± 0.040.00 ± 0.025.54 ± 0.075.58 ± 0.06
Liquid product from tar27.34 ± 0.0876.80 ± 0.058.24 ± 0.040.90 ± 0.020.00 ± 0.013.06 ± 0.070.00 ± 0.00
Solid product from tar ***12.78 ± 0.0535.29 ± 0.0912.37 ± 0.070.12 ± 0.010.05 ± 0.117.56 ± 0.0734.61 ± 0.09
* Data are calculated using the formula O = 100 − (Ash + C + H + N + S), ** Data are shown as mean ± standard deviation, *** Solid product is the polymerized and asphalting compounds.
Disclaimer/Publisher’s Note: The statements, opinions and data contained in all publications are solely those of the individual author(s) and contributor(s) and not of MDPI and/or the editor(s). MDPI and/or the editor(s) disclaim responsibility for any injury to people or property resulting from any ideas, methods, instructions or products referred to in the content.