Article

New Platinum Complexes from Salen- and Hydroxy-Substituted Salpn-Naphthalene Ligands with CO2 Reduction Activity

by
Javier O. Rivera-Reyes
1,2,
Joesene Soto-Pérez
1,2,
Miguel Sepulveda-Pagán
3,
Linguo Lu
1,
Justin Borrero-Negrón
3,
Alanys V. Luna-Ramírez
1,2,
Pedro Trinidad-Pérez
1,2,
Yomaira Pagán-Torres
3,
Zhongfang Chen
1,
Carlos R. Cabrera
4,
William C. West
5,
John-Paul Jones
5 and
Dalice M. Piñero Cruz
1,2,*
1
Chemistry Department, College of Natural Sciences, Rio Piedras Campus, University of Puerto Rico, San Juan, PR 00931-3346, USA
2
Molecular Science Research Center, University of Puerto Rico, 1390 Ponce de León, San Juan, PR 00926, USA
3
Department of Chemical Engineering, University of Puerto Rico-Mayagüez Campus, Mayagüez, PR 00681-9000, USA
4
Department of Chemistry, University of Texas, 500 West University Avenue, El Paso, TX 79968, USA
5
Jet Propulsion Laboratory, California Institute of Technology, Pasadena, CA 91109, USA
*
Author to whom correspondence should be addressed.
Catalysts 2023, 13(5), 911; https://doi.org/10.3390/catal13050911
Submission received: 27 January 2023 / Revised: 27 March 2023 / Accepted: 9 April 2023 / Published: 22 May 2023
(This article belongs to the Section Electrocatalysis)

Abstract

:
The electrocatalytic reduction of carbon dioxide (CO2) into added-value products is a promising alternative to completing the cycle of atmospheric CO2. We report two new platinum complexes—a salen-like naphthalene (PtL1) and a hydroxy-substituted salpn naphthalene (PtL2)—that are capable of activating CO2 to produce carbon monoxide (CO). The predominant keto tautomer of the non-innocent ligands was determined using DFT calculations and UV-Vis spectroscopy. The PtL2 complex has a CO Faradaic efficiency >40% in the presence of water as a sacrificial proton source at −2.5 V vs. Fc/Fc+. The addition of the hydroxy group in combination with water as a proton source decreased the reduction potential and increased the CO formation tenfold when compared to PtL1.

Graphical Abstract

1. Introduction

The lack of sustainable energy sources has resulted in a significant dependence on fossil fuels as the primary global energy source [1]. This has consequently led to an increase in the production of anthropogenic carbon dioxide (CO2), which is associated with global warming and climate change [2]. The electrocatalytic reduction of CO2 is an attractive alternative for the production of value-added products while decreasing the excessive CO2 concentrations in the atmosphere [3,4,5]. The high stability and the relative inertness of CO2 molecules present a challenge for the electrochemical CO2 reduction reaction (CO2RR) [6,7]. Coordination complexes such as those synthesized from salen-like ligands provide a means to overcome the high stability of CO2 by employing careful ligand design strategies to enhance selectivity, catalytic activity, and overpotential for the CO2RR [7,8,9].
Salen ligands are well known for the coordination of metals ions by acting as N, N, O, O tetradentate Schiff bases (SB), and are readily obtained by means of a condensation reaction between a diamine and a hydroxy-substituted aryl ketone or aldehyde. Salen and salen-like complexes have been less extensively studied for electrochemical CO2 reduction compared to their counterparts, porphyrins and phthalocyanines [3,10,11,12,13,14,15,16,17,18,19,20]. In addition, salen-like complexes offer advantages in terms of ease of synthesis and relatively short reaction times [21,22]. Ligand substitution on salen and salpn systems can assist in CO2 reduction activity and selectivity, as confirmed in previous studies by Nichols et al. [9] and Bose et al. [17]. In addition, articles using salen complexes as electrocatalysts for CO2RR have focused on 3d metal centers such as Co, Ni, and Cu in order to reduce the cost of the catalysts [4,16,17,18]. Nonetheless, these provide a mixture of products and may follow reaction pathways that compete with the Hydrogen Evolution Reaction (HER). Precious metals are known to have exceptional catalytic activity in a wide range of reactions such as metal-catalyzed coupling, water oxidation, and olefin metathesis reactions, among others [21,22,23,24,25]. Even though 3d metal complexes provide low-cost materials, the synthetic procedure and multiple purification steps taken to reach the desired metal complex increase the gross cost. Usually, noble metals have greater electrocatalytic activity; therefore, we set ourselves the task of developing Pt salen-like complexes as electrocatalysts for CO2RR.
Herein, we present a previously reported salen naphthalene ligand (L1) and a newly synthesized hydroxy-substituted salen-like ligand (L2), and their respective Pt complexes (PtL1 and PtL2) [26]. The reported L1 and L2 ligands have been confirmed to exist as an equilibrium of tautomers, wherein the keto tautomer is the main contributor to the solid-state bulk product [26]. Through UV-Vis and DFT calculations, it was confirmed that the predominant structure is the keto tautomer in both L1 and L2 in liquid state. The synthesis pathway for the ligands and complexes is shown in Figure 1. Structural analysis was performed by means of single-crystal X-ray diffraction (SCXRD) experiments, from which we observed the square planar geometry of the PtL1 and a more distorted configuration for PtL2 due to having less angle strain in the imine moieties. Finally, the compounds were electrochemically characterized by cyclic voltammetry and studied with respect to their catalytic activity towards CO2RR. The hydroxy-group-substituted PtL2 complex has a Faradaic Efficiency (FE) above 40% for the formation of carbon monoxide (CO). In contrast, the PtL1 complex has an FE of ~5%, demonstrating the influence of the hydroxy substituent on the diamine bridge of the metal complexes. To the best of our knowledge, these are the first SB Pt complexes that have been reported to display catalytic activity towards the electroreduction of CO2. Mechanistic studies by means of DFT calculation were performed to elucidate the mechanism of CO formation from CO2 using PtL1 and PtL2. It was found that the PtL2-*COOH intermediate was of lower energy than in the case of PtL1; nonetheless, the CO release for PtL2 displayed a higher Gibbs free energy due to its high degree of hydrogen bonding.

2. Results and Discussion

2.1. Spectroscopic Properties

The UV-Vis spectra of the reported complexes L1, L2, PtL1, and PtL2 were recorded in CH2Cl2 at a concentration of 0.3 mM (Figures S6–S9). The first ligand, L1, had three peaks located at 325 nm, 416 nm, and 434 nm. The first absorption peak at 325 nm of L1 is attributable to a π-π* intra-ligand transition of the naphtholate chromophore [1,2,3,4]. The remaining two absorption peaks correspond to π-π* transitions of the lone pair electrons in the azomethine bonds [3]. Likewise, L2 presents absorption peaks at similar wavelengths to those of L1, at 332 nm, 408 nm, and 432 nm. The hypochromic shifts observed in the L2 azomethine bands were caused by the inductive effect due to the presence of the hydroxyl group, which is electron-donating through sigma bonds [27]. In addition, the L1 and L2 spectra showed shoulders at 385 nm and 389 nm, respectively, which also corresponds to C=N chromophores. Moreover, the coordination complexes PtL1 and PtL2 have absorption peaks analogous to those of the free ligands. The platinum complex with L1 had peaks located at 323 nm, 434 nm, and 460 nm. The lower energy transitions due to the azomethine groups were lower in intensity as well, as a result of the short Pt-N bond length [28]. In contrast, the PtL2 complex exhibited three absorption peaks at 302 nm, 427 nm, and 442 nm, respectively. The first absorption IIh is attributable to naphtholate chromophore shifting to a lower wavelength due to coordination with the metal center. By applying the Tauc plot method to the UV-vis data, the experimental band gaps (Eg) for L1, PtL1, L2, and PtL2 were calculated to be 2.73 eV, 2.67 eV, 2.76 eV, and 2.66 eV, respectively (Table 1) [21,29,30,31,32].

2.2. Structural Characterization

Two new crystal structures are reported herein for the PtL1 and PtL2 complexes. The PtL1 complex crystallizes under the monoclinic P21/c space group with a square planar geometry for the metal center. The torsion angles on the O1-N1-N2-O2 and O1-N1-N2-Pd bonds are −0.28° and −179.4°, respectively. Additionally, the square planar geometry of the PtL1 complex was confirmed using the tau parameters (τ4 and τ′4), which have values very close to zero (Table S3). Meanwhile, PtL2 crystallizes in the orthorhombic space group P212121; the geometry of this complex differs from that of PtL1 due to the longer carbon chain in the imine bridge of L2. The complex presents a distorted geometry compared with that of PtL1, as shown in Figure 2. The determined O1-N1-N2-O2 and O1-N1-N2-M torsion angles and tau parameter of PtL2 shown in Table S4 confirm the deviation from the square planar geometry.

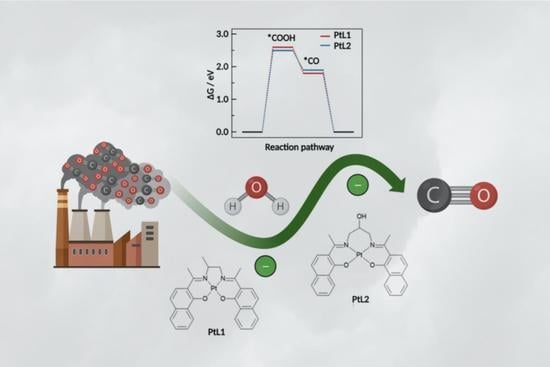
2.3. DFT Calculations

Geometry optimizations were performed using the Gaussian 09 software at the B3LYP/6-31+G(d,p)/def2-TZVP theory level to corroborate the crystal structure parameters and the experimental optical band gap values of the studied compounds. Comparison of selected bond lengths of the optimized geometries with the crystallographic data demonstrated good accordance (Tables S4–S7). Furthermore, the theoretical band gap values obtained from the computational calculation followed the same trend as our experimental HOMO/LUMO gaps (Table S2). The theoretical band gap values of the enol form of the ligands differed greatly from the experimental data. As expected, the keto form resembled the experimental band gap value, validating the results of our previous study [26]. The enol tautomers of L1 and L2 phenolate oxygens had interatomic distances of 5.256 Å and 3.710 Å, respectively (Figure 3). In contrast, the L1 and L2 keto tautomer phenolate O1–O2 interatomic distances were 6.933 Å and 6.724 Å, respectively (Figure 3). The larger O1–O2 interatomic distance observed in the keto form of the ligands minimizes repulsion, thereby making the keto tautomer the more predominant.
To understand the higher performance in terms of the catalytic activity of PtL2 for the CO2RR, we performed DFT computations to examine the Gibbs free energy changes along the pathway for CO production on both catalysts. We focused on the formation of the *COOH intermediate, where the C atom is adsorbed in an η1©-CO2− (C-down) configuration, leading to the production of CO, as shown in Figure 4a. Our results showed that the adsorption of CO2 on both catalysts was endothermic, with the Pt site serving as the active site. The rate-determining step (RDS) was the *COOH process. Interestingly, we observed hydrogen bond interactions between the *COOH intermediate and the naphtholate oxygen on PtL1 and PtL2. Notably, the *COOH intermediate with PtL2 exhibited an additional hydrogen bond interaction between the C=O group and hydrogen on the diamine bridge. This extra hydrogen bond may explain the larger Gibbs free energy obtained for CO release with PtL2 compared to PtL1 (see Figure 4b). The Hirschfeld charge analysis revealed that the Pt site in PtL2 lost electrons (from 0.243 au to 0.323 au) upon *COOH adsorption, while the one in PtL1 gained more (0.233 au to 0.318 au). This charge transfer trend in PtL1 resulted in additional higher potential and presented a higher voltage demand compared to the general direction of charge transfer in the C-down configuration, in which the C plays the role of a Lewis acid. We also noted that the distances between the *CO and Pt sites were greater than 3 Å in both PtL1 and PtL2, indicating classical physisorption. The final step of the proposed catalytic cycle was the release of CO from the Pt complex, leading to the recuperation of the neutral complex for subsequent CO2RR.

2.4. Electrochemical Studies

Cyclic voltammetry (CV) was used to study the electrochemical behavior of compounds using a three-electrode cell with a 0.1 M TBAPF6 in N,N-dimethylformamide (DMF) as the electrolyte solution. The L1 voltammogram in an N2-saturated environment presented a single oxidation peak at Ea = 0.47 V vs. Fc/Fc+ and a reduction peak at Ec = −2.49 V vs. Fc/Fc+ (Figure 5a, red line) [26]. The observed oxidation was attributed to the formation of the [L1]+ species by Gutierrez et al. [26] A similar reduction peak was observed in all complexes; therefore, we hypothesize that this reduction is caused by the formation of the [L1] species. The voltammogram for L2 (Figure 5b, red line) under an N2 atmosphere displayed a similar irreversible oxidation and reduction peak as that of L1 at Ea = 0.35 V vs. Fc/Fc+ and Ec = −2.38 V vs. Fc/Fc+. Similar to L1, the initial oxidation was a result of the formation of the charged species [L2]+, and the reduction was attributed to the [L2] species.
The blue line in Figure 5a corresponds to the CV of PtL1, the ligand-based oxidation and reduction peaks are shifted cathodically to Ea = 0.38 V vs. Fc/Fc+ and Ec = −2.55 V vs. Fc/Fc+, respectively. The PtL1 complex has an absent pre-peak in the voltammogram, suggesting greater stability following the initial oxidation than the free ligand. Furthermore, the PtL1 complex shows an additional irreversible reduction at negative potentials of Ec = −2.90 V vs. Fc/Fc+. In the reverse sweep, two new oxidation peaks were observed at Ea = −2.40 V and −1.69 V vs. Fc/Fc+, which were related to the two above-mentioned reduction processes. The reduction observed at −2.55 V vs. Fc/Fc+ corresponds to the formation of [PtL1] species; this process occurs at the metal center. The cyclic voltammogram of PtL2 (Figure 5b, blue line) under an inert atmosphere showed that the characteristic irreversible ligand oxidation shifted to Ea = 0.43 V vs. Fc/Fc+. At negative potentials, multiple indistinguishable reduction processes can be seen at 100 mV/s, but they are not distinguishable from each other. Reduction of the scan rate to 50 mV/s enabled a clear visualization of three irreversible reductions at Ec = −2.21, −2.53, and −2.86 V vs. Fc/Fc+ (Figure S12).

2.5. CO2 Reduction

The CO2 reduction activity of the reported compounds was tested by saturating the cell with CO2; CVs were recorded to identify the peaks associated with the CO2RR. The CV of ligands L1 and L2 showed no catalytic activity towards CO2RR under a CO2 saturation atmosphere, as observed in Figure S13a,b. The current densities of ligands (L1 and L2) were reduced by factors (JCO2/JN2) of 0.74 and 0.40, respectively. This suggests catalyst poisoning in the presence of CO2 and a less reactive CO2 adduct [33]. Nevertheless, the voltammograms of the PtL1 and PtL2 complexes showed increased current densities after complexation, which is in accordance with the results observed from DFT mechanistic calculations (Figure S13a,b).
The CV of PtL1 in the presence of CO2 shows a sharp reduction process increment at Ec = −2.68 V vs. Fc/Fc+ with a current density of Jc = −0.90 mA/cm2 under aprotic conditions (Figure 6a, red line). The current density increased by a factor of 3.46 compared to the voltammogram in the inert atmosphere. Adding water to the PtL1 complex under CO2 saturation had a negative effect by inhibiting the current density response, as can be observed in Figure 6a (JH2O/JN2 = 0.67), which is indicative of the complex poor stability in the presence of water [34]. Increasing the water concentration under CO2 saturation shifted the CO2RR peak and onset potential to positive values (Figure S14b). The current density response of the PtL2 complex under CO2 saturation was lower than that observed for PtL1, yet the peak associated with the CO2 reduction occurred at a lower potential, Ec = −2.53 V vs. Fc/Fc+. This result validates the hypothesis that the addition of the hydroxy group enhances CO2 reduction.
The PtL2 complex forms an adduct that facilitates the reduction of CO2 by lowering the onset potential and increasing the interaction with CO2 [33]. Furthermore, a pre-catalytic wave that is characteristic of the formation of a PtL2-COOH adducts was observed [15]. Finally, the activity of the PtL2 complex CO2RR in the presence of water and CO2 did not lower the catalytic activity of the complex as it did in PtL1. The addition of water as a proton source to the PtL2 enhanced its current density and resulted in an anodic shift of onset potential and a CO2RR peak (−2.53 V to −2.51 V vs. Fc/Fc+). At 3 M of water, the current density reached its peak, and further addition of water inhibited the CO2RR peak (Figure S14b). A linear plot was obtained from the Log–Log plot of the current density response versus the water concentration added to the electrochemical cell, indicating first-order kinetics with increasing water concentration (Figure S15). The negative slope corresponding to PtL1, shown in Figure S15, suggests that the complex was not stable with the increase concentration of water present during CO2RR [34].
The quantification of gaseous products using a gas chromatograph enabled the accurate determination of the FE of the studied electrocatalysts. The conditions selected for the bulk electrolysis experiments were based on the CV experiments performed to determine the optimal product formation. The PtL1 complex had a calculated CO FE (FECO) of 5.5% under aprotic conditions at a reduction potential of −2.7 V vs. Fc/Fc+ after one hour of electrolysis (Table 2). Under protic conditions, the FECO (5.4%) of PtL1 did not show any major improvement, as expected from the cyclic voltammograms. The benign effect of the FECO after the addition of water to the PtL1 solution can be attributed to not possessing any hydroxy groups capable of activating CO2. The PtL2 complex displayed a similar performance under aprotic conditions to PtL1. Nonetheless, the addition of 3 M H2O promoted CO2RR, as was observed from CV, by lowering the onset and reduction potential of CO2RR. The bulk electrolysis experiments using PtL2 with 3 M water as the proton source yielded the best performance, increasing the selectivity for CO formation to a total of 42.0% FE. After 3 h had elapsed, the FECO dropped to 17.1% (Table S10). The decay of the FECO is characteristic of degradation and/or poisoning of the electrocatalyst over the course of the bulk electrolysis [34]. Moreover, applying different potentials under protic conditions demonstrated that the optimal potential for PtL1 and PtL2 are −2.5 and −2.7 V vs. Fc/Fc+, respectively (Table 2 and Figure S18).
Additionally, sealed cell experiments under an inert atmosphere (N2) and in the presence of metal complexes were performed to confirm that the detected CO was due to CO2 electrolysis and not degradation of the metal complexes or the DMF (Table 2). Ex situ UV-Vis spectroscopy following the bulk electrolysis experiments was performed to evaluate any possible degradation of the material. The UV-Vis spectra of both metal complexes after electrolysis showed a significant decrease in the characteristic band intensities, as can be observed in Figure S19. The results presented confirm that metal complexes indeed degrade upon reduction of the CO2RR; however, the degradation mechanism does not contribute to the CO observed from the CO2RR. A reaction mechanism for PtL2 as a CO2RR catalyst is proposed in Figure 7. We hypothesize that hydrogen bonding interactions arising from the hydroxy group, CO2, and water cause an increment in the CO2 molecule residence time, hindering the release of the formed CO (Figure 7, step 4.5). The proposed mechanism, presented in Figure 6, follows a five-step process involving an overall two-electron transfer to achieve the desired CO product. The water in the system acts as a protonating agent of the intermediates formed during CO2 reduction. Step 4.5 is thought to be crucial due to the high degree of hydrogen bonding, causing the CO2 to be retained longer, shortening the life of the electrocatalyst material.

3. Experimental Section

3.1. Materials and Methods

All reactions were performed under an N2 atmosphere using a Schlenk line, and the solvents were dried using standard techniques. Reagents and solvents were used as received unless otherwise specified. Reagents and solvents were obtained from CCSI, Toa Baja, Puerto Rico, Thermo Fisher Scientific, Cayey, Puerto Rico, and VWR, Manatí, Puerto Rico. FTIR, UV-Vis, NMR, and single-crystal X-ray crystallography measurements were recorded using a Nicolet iS50 (Rochester, NY, USA), Shimadzu UV-1800 (Kyoto, Japan), Bruker Ascend Aeon 500 MHz (Faellanden, Switzerland), and Rigaku SuperNova equipped with a HyPix3000 X-ray detector, a Cu-Kα (λ = 1.5417 Å) radiation source (The Woodlands, TX, USA), respectively. Cyclic voltammetry (CV) was used to characterize the electrochemical properties of the compounds with an Autolab PGSTAT30 (Riverview, FL, USA) potentiostat. Bulk electrolysis experiments were performed using a BioLogic SP-150 potentiostat (Knoxville, TN, USA).

3.2. Synthesis and Characterization

Synthesis and characterization of L1 (2′-((1′,1′E)-(propane-1,2-diylbis(azaneylylidene))bis(ethan-1-yl-1-ylidene))bis(naphthalen-1-ol)) and L2 (2′-((1′,1′E)-((2-hydroxypropane-1,3-diyl)bis(azaneylylidene))bis(ethan-1-yl-1-ylidene))bis(naphthalen-1-ol)): The synthesis of L1 was performed as reported by Gutierrez et al. [26]: 1.50 g (8.1 mmol) of 1-hydroxy-2-acetonaphthone and 0.37 g (5.0 mmol) of 1-2-diaminopropane. L1 yield: 1.40 g, 85% based on 1-hydroxy-2-acetonaphthone. λmax (DCM)/(nm): 325 (ε/dm3 mol−1 cm−1 2990), 416 (5639), 434 (5259). FTIR (Vmax/cm−1): 3368 (OH, br), 1584 (conj. cycl. C=N, s), 1532 (C=C aromatic ring, s), 1271 (CO, s). 1H-NMR (500 MHz, CDCl3): ppm 1.58–1.60 (3H, d, -CH3, J = 6.45 Hz), 2.41 (3H, s, N=C-CH3), 2.46 (3H, s, N=C-CH3), 3.83–3.94 (2H, m, -CH2), 4.35–4.41 (1H, sept, -CH, J = 6.48 Hz), 6.84–6.87 (2H, dd, Ar-H, J1 = 4.3 Hz, J2 = 9.1), 7.27–7.28 (1H, d, Ar-H, J = 5.30 Hz), 7.41–7.44 (2H, t, Ar-H, J = 15.1 Hz), 7.51–7.54 (2H, t, Ar-H, J = 14.7 Hz), 7.60–7.62 (2H, d, Ar-H, J = 7.75 Hz), 8.46–8.47 (2H, d, Ar-H, J = 8.15 Hz). For the synthesis of L2, 1.00 g (5.4 mmol) of 1-hydroxy-2-acetonaphthone was added to a round-bottom flask along with MeOH until dissolved. In a separate container, 0.27 g (3.0 mmol) of 1,3-diamino-2-propanol was weighed and dissolved in MeOH and added to the round-bottom flask. The reaction mixture was refluxed until a yellow solid appeared. The obtained solid was isolated by vacuum filtration and washed several times with EtOH and Et2O. L2 yield: 0.93g, 84% based on 1-hydroxy-2-acetonaphthone. λmax (DCM)/(nm): 332 (ε/dm3 mol−1 cm−1 7995), 385 (3134), 408 (4383), and 432 (4901). FTIR (cm−1): 3374 (OH, br), 1594 (conj. cycl. C=N, s), 1546 (C=C aromatic ring, s), 1271 (CO, s). 1H-NMR (500 MHz, DMSO-d6): ppm 2.54 (6H, s, N=C-CH3), 3.71–3.76 (2H, ddd, H-CH, J1 = 5.28 Hz, J2 = 7.00 Hz, J3 = 12.5 Hz) 3.87–3.83 (2H, dt, H-CH, J1 = 4.6 Hz, J2 = 14.0 Hz), 4.14 (1H, m, C-H), 5.85 (1H, s br, OH), 6.75–6.76 (2H, d, Ar-H, J = 9.20), 7.34–7.38 (2H, td, Ar-H, J1 = 1.21 Hz, J2 = 6.95 Hz), 7.46–7.48 (2H, d, Ar-H, J = 9.22), 7.50–7.53 (2H, td, Ar-H, J1 = 1.33 Hz, J2 = 6.93 Hz), 7.61–7.63 (2H, d, Ar-H, J = 7.82), 8.35–8.37 (2H, dt, Ar-H, J1 = 1.25 Hz, J2 = 8.13 Hz).
Synthesis and characterization of PtL1 and PtL2: To a round-bottom flask, 150 mg (0.4 mmol) of L1 was added and dissolved in 5 mL of DMF; the solution was stirred at 75 °C until dissolved. Afterward, 2 equivalents of NaOAc were suspended in the L1 solution. Then, a 2 mL solution of DMSO with 150 mg of K2PtCl4 (0.4 mmol) was added to the mixture. The reaction was constantly stirred and heated continuously at 75 °C for 24 h. Subsequently, the crude was purified by column chromatography using silica gel as the stationary phase and a mobile phase consisting of CH2Cl2:Ethyl acetate. X-ray-quality single crystals were obtained from vapor diffusion of Et2O into a CH2Cl2 solution. PtL1 yield: 58.5 mg, 28%. λmax (DCM)/(nm): 323 (ε/dm3 mol−1 cm−1 8898), 434 (2209), and 460 (1751). FTIR (cm−1): 1585 (C=C aromatic ring, s), 1452 (conj. cycl. C=N, s) 1273 (C-O, s). 1H-NMR (500 MHz, DMSO-d6): ppm 1.34–1.35 (3H, d, CH3, J = 6.35 Hz), 2.41 (3H, s, N=C-CH3), 2.44 (3H, s, N=C-CH3), 3.88–3.91 (2H, dd, H-CH, J1 = 5.38 Hz, J2 = 13.0 Hz), 4.37–4.42 (1H, m, C-H), 7.05–7.07 (2H, d, Ar-H, J = 9.15 Hz), 7.51–7.55 (2H, t, Ar-H, J = 15.1 Hz), 7.6118–7.6412 (2H, t, Ar-H, J = 14.7 Hz), 7.73–7.78 (5H, m, Ar-H), 8.70–8.72 (2H, d, Ar-H, J = 8.3 Hz). PtL2 was synthesized following a similar method to that used for PtL1, but using L2. L2 150 mg (0.4 mmol) was added to K2PtCl4 150 mg (0.4 mmol). The resulting solution was purified by column chromatography using silica gel and EtOAC:CH2Cl2 as the eluent. X-ray-quality single crystals were obtained from vapor diffusion of Et2O into a CH2Cl2 solution of the complex. PtL2 yield: 42.1 mg, 20%. λmax (DCM)/(nm): 302 (ε/dm3 mol−1 cm−1 12,270), 427 (3908), and 442 (3720). FTIR (cm−1): 1577 (conj. cycl. C=N, s), 1552 (C=C aromatic ring, s), 1252 (C-O, s). 1H-NMR (500 MHz, DMSO-d6): ppm 2.41 (6H, s, N=C-CH), 3.57–3.62 (2H, m, CH-H), 4.13–4.16 (2H, dd, CH-H, J1 = 3.58 Hz, J2 = 14.4 Hz), 4.61–4.66 (1H, m, C-H), 5.68 (1H, d, OH, J = 4.76 Hz), 6.95–6.97 (2H, d, Ar-H, J = 9.04 Hz), 7.43–7.46 (2H, t, Ar-H, J = 15.1 Hz), 7.51–7.57 (4H, Ar-H, m), 7.65–7.67 (2H, d, Ar-H, J = 8.00 Hz), 8.53–8.54 (2H, d, Ar-H, J = 8.24 Hz).

3.3. DFT Calculations

Geometry optimizations, single-point energy, and frequency calculations were performed using the Gaussian 09 software package using the B3LYP functional with the 6-31+G(d,p) basis set for H, C, N, and O atoms, and def2-TZVP (with effective core potentials) for Pt [35]. Frequency calculations performed on each structure confirmed that the optimized geometry had reached the minimum values on the basis of the absence of negative frequencies. Reaction pathway computations were performed by DFT with the DMol3 package [36,37]. The Perdew, Burke, and Ernzerhof (PBE) functional within the generalized gradient approximation (GGA) was used to describe exchange–correlation interactions. Dispersion corrections were treated by the Tkatchenko and Scheffler (TS) scheme [38]. The double numerical plus polarization (DNP) basis sets were adopted with a global orbital cutoff of 4.5 Å. The energy and force convergences were set as 10–5 Ha and 0.002 Ha/Å, respectively. To simulate the solvent environment, a conductor-like screening model (COSMO) was used with a dielectric constant of 78.54. The standard hydrogen electrode (SHE) [38] was used, but then converted to the Fc/Fc+ reference to compare with experiment data. The Gibbs free energy difference between steps was determined as ∆G = ∆E + ∆ZPE − T∆S, where ∆E, ∆ZPE, ∆S, and T are the electronic energy difference, zero-point energy difference, entropy difference, and temperature, respectively.

3.4. Electrochemical Setup

The electrochemical setup consisted of three electrodes and a sealed electrochemical cell. The cell was cleaned with aqua regia before each experiment; it was composed of a glassy carbon (GC) working electrode (⌀ = 3 mm), a nonaqueous Ag/AgNO3 reference electrode, and a graphite counter electrode. The GC electrode was physically cleaned by polishing the GC surface in an eight-form pattern with different granular pore sizes (1.0, 0.5, and 0.03 µm) of alumina micro-polish (Buehler) and pure water. The solution of all the compounds consisted of 1 mM in 0.1 M TBAPF6 in DMF as a supporting electrolyte. All the voltammogram electrochemical potentials were corrected with respect to the Fc/Fc+ redox couple. The N2 and CO2 saturation atmospheres were obtained by bubbling the DMF electrolyte solution for 20 min.
Bulk electrolysis experiments were carried out in a five-port EuroCell. For each experiment, 30 mL of 0.1 M TBAPF6 in DMF solution was added to the cell. The working electrode was a 100 mm graphite rod (Ø = 6.7 mm), the counter electrode was graphite, and a nonaqueous Ag/AgNO3 reference electrode was used. The counter electrode was isolated from the main solution by a glass frit separator. Enough catalyst was added to create a 1 mM solution, and if necessary, water was added to the 1 mM catalyst solution as a proton source. Inlet and outlet gas concentrations from electrolysis experiments were measured using an online gas chromatograph (Shimadzu GC-2014) equipped with flame ionization detector (FID), thermal conductivity detector (TCD), and methanizer assembly for the detection of low levels of CO2 and CO through conversion to methane by FID.

4. Conclusions

In conclusion, we synthesized two new platinum salen-like naphthalene complexes (PtL1 and PtL2). All ligands and metal complexes were structurally characterized by single-crystal X-ray diffraction methods. The use of UV-Vis was crucial to determining the spectroscopic properties as well as the optical band gap, which was used as a descriptor when performing DFT calculation to define the predominant tautomer of the ligands. DFT calculations confirmed that the keto form was predominant over the enol form in solution, as well as the crystal structure of L1 and L2 [26]. Geometry optimizations using DFT corroborated the reported crystal structure bond lengths and angles. Additional DFT calculations were performed to elucidate the CO2RR mechanism, and it was observed that PtL2 was better able to stabilize the *COOH intermediate than PtL1. However, since multiple hydrogen bonding sites were available for PtL2, hindering the release of CO, it displayed a higher Gibbs free energy than PtL1 (Figure 4b). In terms of the electrochemical properties of the reported compounds, the ligands were classified as non-innocent due to characteristic redox processes after metal coordination present in their respective CV (Figure 4). For the PtL1 complex under a CO2-saturated environment in aprotic and protic conditions, the CO2RR performance was substandard with a FECO of 5.5% and 5.4%, respectively. In addition, the optimal potential for the CO2RR using PtL1 was determined to be −2.7 V vs. Fc/Fc+. Meanwhile, PtL2 showed a lower optimum reduction potential for CO2 than its PtL1 counterpart, at −2.5 V vs. Fc/Fc+. The CO2RR peak and onset potential of PtL2 shifted to positive potentials when water was added, with an FECO of 42.0% being achieved. Conversely, when water was not present, the FECO was 4.4%. The electrocatalyst was found to be stable for 1 h; afterwards, a significant decrease in FECO was observed due to the degradation of the electrocatalyst. This degradation did not result in the production of CO, as it was not detected during the bulk electrolysis experiments under N2 atmosphere. Moreover, the electrocatalysis kinetics were of the first order with respect to water. In the case of PtL1, the negative slope of the Log[J(mA/cm2)] vs. Log[H2O] plot is indicative of the complex’s lack of stability in the presence of water, unlike in the case of PtL2, where the synergy between the ligand’s hydroxy group and water as the sacrificial proton source enhanced the catalytic activity of CO2RR. Although deactivation of the reported electrocatalysts is an issue that needs to be addressed, the high selectivity at the optimal potential of PtL2 and the facile synthesis of PtL1 and PtL2 demonstrate the possibility of using them as CO2RR electrocatalysts. Future studies include optimization of the ligand backbone by adding different substituents, enhancing ligands’ rigidity and the study of the CO2RR catalytic activity of these ligands’ coordination complexes with 3d metal ions.

Supplementary Materials

The following supporting information can be downloaded at: https://www.mdpi.com/article/10.3390/catal13050911/s1. Figure S1: 1H-NMR in CDCl3 of L1; Figure S2: 1H-NMR in DMSO of L2; Figure S3: 1H-NMR in DMSO of PtL1; Figure S4: 1H-NMR in DMSO of PtL2; Figure S5: FTIR spectra of PtL2, PtL1, L2, and L1; Table S1: Lambda max (λmax) and molar absorptivity coefficient (ε) of all compounds; Figure S6: UV-Vis spectra and Tauc plot of L1; Figure S7: UV-Vis spectra and Tauc plot of L2; Figure S8: UV-Vis spectra and Tauc plot of PtL1; Figure S9: UV-Vis spectra and Tauc plot of PtL2; Table S2: Crystallographic data of PtL1, and PtL2 (CCDC Reference numbers: 2129562 and 2128738); Figure S10: Front, side, and packing of PtL1 crystal structure; PtL1; Table S3: Selected bond lengths and bond angles of L1, and PtL1; Figure S11: Front, side, and packing of PtL2 crystal structure; Table S4: Selected bond lengths and bond angles of PtL2; Table S5: Selected bond lengths and bond angles of L1, PdL1, and PtL1 optimized geometry; Table S6: Selected bond lengths and bond angles of L2, PdL2, and PtL2 optimized geometry; Table S7: Theoretical HOMO, LUMO, and bandgap (Eg) values of the studied compounds at B3LYP/6-31+G* level of theory; Figure S12: Cyclic voltammograms of 1 mM PtL2 at 100 mV/s and 50 mV/s in DMF with 0.1M TBAPF6 under N2 inert atmosphere; Table S8: Redox processes of L1, L2, PtL1, and PtL2 referenced to ferrocene internal standard under N2 saturation; Figure S13: Cyclic voltammograms of 1 mM of L1, L2, PtL1, and PtL2 at 100 mV/s in DMF with 0.1M TBAPF6. (a) L1 and (b) L2 samples under CO2 atmosphere; Figure S14: Cyclic voltammograms of 1 mM of (a) PtL1 and (b) PtL2 at 100 mV/s in DMF with 0.1M TBAPF6 under CO2 saturation and addition of water as a sacrificial proton source; Figure S15: Log-Log plot of CV under CO2 saturation and various H2O of PtL1, and PtL2 at 1 mM; Figure S16: Bulk electrolysis of 1 mM of PtL1 (black) at −2.7 V vs. Fc/Fc+ and PtL2 (blue) −2.5 V vs. Fc/Fc+ for 4500 s in DMF with 0.1 M TBAPF6 under CO2 saturation; Table S9: Product quantification for CO2RR under aprotic conditions of 1 mM of PtL1 and PtL2; Figure S17: Bulk electrolysis of 1 mM of PtL1 (black) at −2.7 V vs. Fc/Fc+ and PtL2 (blue) −2.5 V vs. Fc/Fc+ for 12000 s in DMF with 0.1M TBAPF6 under CO2 saturation; Table S10: Product quantification for CO2RR under protic conditions (3M H2O) of 1 mM of PtL1 and PtL2; Figure S18: CO formation at different potentials for (a) PtL1 (−2.3, −2.5, and −2.7 V vs. Fc/Fc+) and (b) PtL2 (−2.5, −2.7, and −2.9 V vs. Fc/Fc+). Conditions: working electrode and counter electrode were graphite rods, reference electrode was 0.01 M AgNO3, and 3 M H2O; Figure S19: UV-Vis spectra before and after CO2RR (a) PtL1 and (b) PtL2. NOTE: Solutions after electrolysis were diluted from 1 mM to 0.3 mM to avoid UV-Vis signal saturation using the 0.1 M TBAPF6 in DMF electrolyte solution [21,26,29,32,39,40].

Author Contributions

Conceptualization, J.O.R.-R. and D.M.P.C.; methodology, J.O.R.-R., D.M.P.C., C.R.C. and Y.P.-T.; software, J.-P.J. and Z.C.; validation, D.M.P.C., J.-P.J., W.C.W., C.R.C., Y.P.-T. and Z.C.; formal analysis, J.O.R.-R., L.L. and D.M.P.C.; investigation, J.O.R.-R., J.S.-P., J.B.-N., M.S.-P., A.V.L.-R., L.L. and P.T.-P.; resources, D.M.P.C., Z.C., Y.P.-T., C.R.C., W.C.W. and J.-P.J.; data curation, J.O.R.-R. and L.L.; writing—original draft preparation, J.O.R.-R., D.M.P.C. and J.-P.J.; writing—review and editing, D.M.P.C., J.-P.J., Y.P.-T. and W.C.W.; visualization, J.O.R.-R. and D.M.P.C.; supervision, D.M.P.C., Z.C., C.R.C., W.C.W., Y.P.-T. and J.-P.J.; project administration, D.M.P.C.; funding acquisition, D.M.P.C. All authors have read and agreed to the published version of the manuscript.

Funding

This research was funded by PR Space Grant Consortium and NASA Cooperative Agreement grant number 80NSSC20M0052 and the Department of Energy, Office of Basic Energy Sciences under Award Number DE-SC0023418. Part of the research was carried out at the Jet Propulsion Laboratory, California Institute of Technology, under a contract with the National Aeronautics and Space Administration (80NM0018D0004). The single-crystal X-ray diffractometer was acquired through the support of the National Science Foundation under the Major Research Instrumentation Award Number CHE-1626103. J.B.N., M.S.P., Y.P.T., and L.L. acknowledge support from the NASA MIRO-Puerto Rico Space Partnership for Research, Education, and Training (PR-SPRInT) under grant no. 80NSSC19M0236.

Data Availability Statement

Data can be available on request.

Acknowledgments

The authors acknowledge the contribution of Keily Gutierrez, who pioneered the synthesis of the reported (L1) ligand. We thank Eduardo Nicolau for providing the BioLogic SP-150 potentiostat used for the electrochemical measurements.

Conflicts of Interest

The authors declare no conflict of interest.

References

  1. Du, C.; Wang, X.; Chen, W.; Feng, S.; Wen, J.; Wu, Y.A. CO2 Transformation to Multicarbon Products by Photocatalysis and Electrocatalysis. Mater Today Adv. 2020, 6, 100071. [Google Scholar] [CrossRef]
  2. Roy, S.C.; Varghese, O.K.; Paulose, M.; Grimes, C.A. Toward Solar Fuels: Photocatalytic Conversion of Carbon Dioxide to Hydrocarbons. ACS Nano 2010, 4, 1259–1278. [Google Scholar] [CrossRef]
  3. Cramer, H.H.; Chatterjee, B.; Weyhermüller, T.; Werlé, C.; Leitner, W. Controlling the Product Platform of Carbon Dioxide Reduction: Adaptive Catalytic Hydrosilylation of CO2 Using a Molecular Cobalt(II) Triazine Complex. Angew. Chem.-Int. Ed. 2020, 15681, 15674–15681. [Google Scholar] [CrossRef]
  4. Chiong, M.R.; Paraan, F.N.C. Controlling the Nucleophilic Properties of Cobalt Salen Complexes for Carbon Dioxide Capture. RSC Adv. 2019, 9, 23254–23260. [Google Scholar] [CrossRef]
  5. Sun, L.; Reddu, V.; Fisher, A.C.; Wang, X. Electrocatalytic Reduction of Carbon Dioxide: Opportunities with Heterogeneous Molecular Catalysts. Energy Environ. Sci. 2020, 13, 374–403. [Google Scholar] [CrossRef]
  6. Costentin, C.; Robert, M.; Savéant, J.-M. Catalysis of the Electrochemical Reduction of Carbon Dioxide. Chem. Soc. Rev. 2013, 42, 2423–2436. [Google Scholar] [CrossRef]
  7. Jiang, C.; Nichols, A.W.; Machan, C.W. A Look at Periodic Trends in D-Block Molecular Electrocatalysts for CO2 Reduction. Dalton Trans. 2019, 48, 9454–9468. [Google Scholar] [CrossRef]
  8. Francke, R.; Schille, B.; Roemelt, M. Homogeneously Catalyzed Electroreduction of Carbon Dioxide—Methods, Mechanisms, and Catalysts. Chem. Rev. 2018, 118, 4631–4701. [Google Scholar] [CrossRef]
  9. Nichols, A.W.; Hooe, S.L.; Kuehner, J.S.; Dickie, D.A.; Machan, C.W. Electrocatalytic CO2 Reduction to Formate with Molecular Fe(III) Complexes Containing Pendent Proton Relays. Inorg. Chem. 2020, 59, 5854–5864. [Google Scholar] [CrossRef]
  10. Zhu, G.; Li, Y.; Zhu, H.; Su, H.; Chan, S.H.; Sun, Q. Curvature-Dependent Selectivity of CO2 Electrocatalytic Reduction on Cobalt Porphyrin Nanotubes. ACS Catal. 2016, 6, 6294–6301. [Google Scholar] [CrossRef]
  11. Inglis, J.L.; MacLean, B.J.; Pryce, M.T.; Vos, J.G. Electrocatalytic Pathways towards Sustainable Fuel Production from Water and CO2. Coord. Chem. Rev. 2012, 256, 2571–2600. [Google Scholar] [CrossRef]
  12. Yoshida, T.; Kamato, K.; Tsukamoto, M.; Iida, T.; Schlettwein, D.; Wöhrle, D.; Kaneko, M. Selective Electroacatalysis for CO2 Reduction in the Aqueous Phase Using Cobalt Phthalocyanine/Poly-4-Vinylpyridine Modified Electrodes. J. Electroanal. Chem. 1995, 385, 209–225. [Google Scholar] [CrossRef]
  13. Nie, W.; Tarnopol, D.E.; McCrory, C.C.L. Enhancing a Molecular Electrocatalyst’s Activity for CO2 Reduction by Simultaneously Modulating Three Substituent Effects. J. Am. Chem. Soc. 2021, 143, 3764–3778. [Google Scholar] [CrossRef]
  14. Abe, T.; Yoshida, T.; Tokita, S.; Taguchi, F.; Imaya, H.; Kaneko, M. Factors Affecting Selective Electrocatalytic CO2 Reduction with Cobalt Phthalocyanine Incorporated in a Polyvinylpyridine Membrane Coated on a Graphite Electrode. J. Electroanal. Chem. 1996, 412, 125–132. [Google Scholar] [CrossRef]
  15. Costentin, C.; Passard, G.; Robert, M.; Savéant, J.-M. Pendant Acid–Base Groups in Molecular Catalysts: H-Bond Promoters or Proton Relays? Mechanisms of the Conversion of CO2 to CO by Electrogenerated Iron(0) Porphyrins Bearing Prepositioned Phenol Functionalities. J. Am. Chem. Soc. 2014, 136, 11821–11829. [Google Scholar] [CrossRef]
  16. Singh, S.; Phukan, B.; Mukherjee, C.; Verma, A. Salen Ligand Complexes as Electrocatalysts for Direct Electrochemical Reduction of Gaseous Carbon Dioxide to Value Added Products. RSC Adv. 2015, 5, 3581–3589. [Google Scholar] [CrossRef]
  17. Bose, P.; Mukherjee, C.; Golder, A.K. A NiII Complex of the Tetradentate Salen Ligand H2LNH2 Comprising an Anchoring -NH2 Group: Synthesis, Characterization and Electrocatalytic CO2 Reduction to Alcohols. Inorg. Chem. Front. 2019, 6, 1721–1728. [Google Scholar] [CrossRef]
  18. Bose, P.; Mukherjee, C.; Kumar Golder, A. Reduction of CO2 to Value-Added Products on a Cu(II)-Salen Complex Coated Graphite Electrocatalyst. ChemistrySelect 2020, 5, 9281–9287. [Google Scholar] [CrossRef]
  19. Liu, Y.; Guo, J.H.; Dao, X.Y.; Zhang, X.D.; Zhao, Y.; Sun, W.Y. Coordination Polymers with a Pyridyl-Salen Ligand for Photocatalytic Carbon Dioxide Reduction. Chem. Comm. 2020, 56, 4110–4113. [Google Scholar] [CrossRef]
  20. Kong, X.; Liu, Y.; Li, P.; Ke, J.; Liu, Z.; Ahmad, F.; Yan, W.; Li, Z.; Geng, Z.; Zeng, J. Coordinate Activation in Heterogeneous Carbon Dioxide Reduction on Co-Based Molecular Catalysts. Appl. Catal. B 2020, 268, 118452. [Google Scholar] [CrossRef]
  21. Ulusoy, M.; Birel, Ö.; Şahin, O.; Büyükgüngör, O.; Cetinkaya, B. Structural, Spectral, Electrochemical and Catalytic Reactivity Studies of a Series of N2O2 Chelated Palladium(II) Complexes. Polyhedron 2012, 38, 141–148. [Google Scholar] [CrossRef]
  22. Oliveira, Y.A.; Olean-Oliveira, A.; Teixeira, M.F.S. Short Communication: Molecular Architecture Based on Palladium-Salen Complex/Graphene for Low Potential Water Oxidation. J. Electroanal. Chem. 2021, 880, 114928. [Google Scholar] [CrossRef]
  23. Ghabdian, M.; Nasseri, M.A.; Allahresani, A.; Motavallizadehkakhky, A. Pd Salen Complex@CPGO as a Convenient, Effective Heterogeneous Catalyst for Suzuki–Miyaura and Heck–Mizoroki Cross-Coupling Reactions. Res. Chem. Intermed. 2021, 47, 1713–1728. [Google Scholar] [CrossRef]
  24. Movassagh, B.; Parvis, F.S.; Navidi, M. Pd(II) Salen Complex Covalently Anchored to Multi-Walled Carbon Nanotubes as a Heterogeneous and Reusable Precatalyst for Mizoroki-Heck and Hiyama Cross-Coupling Reactions. Appl. Organomet. Chem. 2015, 29, 40–44. [Google Scholar] [CrossRef]
  25. Lwin, S.; Wachs, I.E. Olefin Metathesis by Supported Metal Oxide Catalysts. ACS Catal. 2014, 4, 2505–2520. [Google Scholar] [CrossRef]
  26. Gutierrez, K.; Corchado, J.; Lin, S.; Chen, Z.; Piñero Cruz, D.M. A Non-Innocent Salen Naphthalene Ligand and Its Co2+, Ni2+ and Cu2+ Metal Complexes: Structural, Electrochemical, and Spectroscopic Characterization and Computational Studies. Inorg. Chim. Acta 2018, 474, 118–127. [Google Scholar] [CrossRef]
  27. Kamounah, F.S.; Salman, S.R.; Mahmoud, A.A.K. Substitution and Solvent Effect of Some Substituted Hydroxy Schiff Bases. Spectrosc. Lett. 1998, 31, 1557–1567. [Google Scholar] [CrossRef]
  28. Gutiérrez, K.J.; Pedreira, W.M.; Piñero Cruz, D.M. Synthesis, Structural, Electrochemical and Spectroscopic Characterization, and Theoretical Calculations of Two New Cu(II) and Ni(II) Complexes from 2-(1-((Pyridine-2-Ylmethyl)Imino)Ethyl)Naphtalen-1-ol. J. Coord. Chem. 2019, 72, 2654–2668. [Google Scholar] [CrossRef]
  29. Zhang, J.; Zhao, F.; Angeles, L.; Zhu, X.; Wong, W. New Phosphorescent Platinum (II) Schiff Base Complexes for PHOLED. J. Mater. Chem. 2012, 22, 16448–16457. [Google Scholar] [CrossRef]
  30. Bosnich, B. An Interpretation of the Circular Dichroism and Electronic Spectra of Salicylaldimine Complexes of Square-Coplanar Diamagnetic Nickel (II). J. Am. Chem. Soc. 1968, 90, 627–632. [Google Scholar] [CrossRef]
  31. Houjou, H.; Hoga, Y.; Ma, Y.-L.; Achira, H.; Yoshikawa, I.; Mutai, T.; Matsumura, K. Dinuclear Fused Salen Complexes of Group-10 Metals: Peculiarity of the Crystal Structure and near-Infrared Luminescence of a Bis(Pt-Salen) Complex. Inorg. Chim. Acta 2017, 461, 27–34. [Google Scholar] [CrossRef]
  32. Tauc, J. States in the Gap. J. Non-Cryst. Solids 1972, 10, 569–585. [Google Scholar] [CrossRef]
  33. Nichols, A.W.; Chatterjee, S.; Sabat, M.; Machan, C.W. Electrocatalytic Reduction of CO2 to Formate by an Iron Schiff Base Complex. Inorg. Chem. 2018, 57, 2111–2121. [Google Scholar] [CrossRef]
  34. Solomon, M.B.; Chan, B.; Kubiak, C.P.; Jolliffe, K.A.; D’Alessandro, D.M. The Spectroelectrochemical Behaviour of Redox-Active Manganese Salen Complexes. Dalton Trans. 2019, 48, 3704–3713. [Google Scholar] [CrossRef]
  35. Frisch, M.J.; Trucks, G.W.; Schlegel, H.B.; Robb, M.A.; Cheeseman, J.R.; Scalmani, G.; Barone, V.; Petersson, G.A.; Nakatsuji, H.; Caricato, M.; et al. Gaussian 09, Revision A.02; Gaussian, Inc.: Wallingford, CT, USA, 2016. [Google Scholar]
  36. Delley, B. From Molecules to Solids with the DMol3 Approach. J. Chem. Phys. 2000, 113, 7756–7764. [Google Scholar] [CrossRef]
  37. Nørskov, J.K.; Rossmeisl, J.; Logadottir, A.; Lindqvist, L.; Kitchin, J.R.; Bligaard, T.; Jónsson, H. Origin of the Overpotential for Oxygen Reduction at a Fuel-Cell Cathode. J. Phys. Chem. B 2004, 108, 17886–17892. [Google Scholar] [CrossRef]
  38. Tkatchenko, A.; Scheffler, M. Accurate Molecular Van Der Waals Interactions from Ground-State Electron Density and Free-Atom Reference Data. Phys. Rev. Lett. 2009, 102, 073005. [Google Scholar] [CrossRef]
  39. Sathrum, A.J.; Kubiak, C.P. Kinetics and limiting current densities of homogeneous and heterogeneous electrocatalysts. J. Phys. Chem. Lett. 2011, 2, 2372–2379. [Google Scholar] [CrossRef]
  40. Hooe, S.L.; Dressel, J.M.; Dickie, D.A.; Machan, C.W. Highly efficient electrocatalytic reduction of CO2 to CO by a molecular chromium complex. ACS Catal. 2019, 10, 1146–1151. [Google Scholar] [CrossRef]
Figure 1. Two-step reaction synthesis pathway for PtL2 and PtL1.
Catalysts 13 00911 g001
Figure 2. ORTEP figure of (a) PtL1 and (b) PtL2 with 30% thermal ellipsoids.
Catalysts 13 00911 g002
Figure 3. Optimized structures at the theory level of B3LYP/6-31+G* of L1 and L2 ligands (enol and keto forms), PtL1 and PtL2.
Catalysts 13 00911 g003
Figure 4. The reaction pathway with (a) structure generation and (b) Gibbs free energy diagram.
Catalysts 13 00911 g004
Figure 5. Cyclic voltammograms of 1 mM of L1, L2, PtL1, and PtL2 at 100 mV/s in DMF with 0.1 M TBAPF6. (a) L1 and (b) L2 samples under N2 atmosphere. Arrows indicated the direction of the scan.
Catalysts 13 00911 g005
Figure 6. Cyclic voltammograms of 1 mM of (a) PtL1 and (b) PtL2 at 100 mV/s in DMF with 0.1 M TBAPF6 under CO2 saturation and highest catalytic activity with water as the sacrificial proton source.
Catalysts 13 00911 g006
Figure 7. Proposed mechanism for the CO2 of the PtL2 complex under protic conditions.
Catalysts 13 00911 g007
Table 1. Experimental HOMO, LUMO, and optical band gap (Eg) values of the studied compounds.
CompoundExperimental Eg (eV) a
L12.73
L22.76
PtL12.67
PtL22.66
a The Eg was estimated from the UV-Vis spectra using the Tauc plot method.
Table 2. Product quantification for CO2RR under aprotic and protic conditions.
Metal ComplexAtmosphereVoltage (V vs. Fc/Fc+)H2O (M)CO FE (%)
PtL1CO2−2.705.5
CO2−2.735.4
CO2−2.530.8
CO2−2.930.9
N2−2.70N.D.
N2−2.73N.D.
PtL2CO2−2.504.4
CO2−2.5342.0
CO2−2.334.15
CO2−2.730.8
N2−2.50N.D.
N2−2.53N.D.
Disclaimer/Publisher’s Note: The statements, opinions and data contained in all publications are solely those of the individual author(s) and contributor(s) and not of MDPI and/or the editor(s). MDPI and/or the editor(s) disclaim responsibility for any injury to people or property resulting from any ideas, methods, instructions or products referred to in the content.

