Article

Improving the Kinetics of H2-Fueled Biological Methanation with Quinone-Based Redox Mediators

1
Water Research Institute (IRSA), National Research Council (CNR), Monterotondo, 00015 Rome, Italy
2
National Biodiversity Future Center, 90133 Palermo, Italy
*
Author to whom correspondence should be addressed.
Catalysts 2023, 13(5), 859; https://doi.org/10.3390/catal13050859
Submission received: 17 March 2023 / Revised: 24 April 2023 / Accepted: 6 May 2023 / Published: 9 May 2023

Abstract

:
The biomethanation process involves the conversion of CO2 into a valuable energy carrier (i.e., methane) by methanogenic archaea. Since it can be operated at mild conditions, it is more sustainable than traditional chemical approaches. Nevertheless, the efficacy of biomethanation is limited by the low kinetics of the microbiological reaction and the poor solubility of H2 in water. Herein, the effect of soluble (i.e., AQDS) and insoluble (i.e., biochar) quinone-based redox mediators on the kinetics of H2-fueled biological methanation in bench-scale microcosms was investigated. Microcosms were set up in 120 mL serum bottles and were initially inoculated with a methanogenic sludge deriving from a lab-scale anaerobic digester treating food waste. As a result, the kinetics of H2 consumption and CH4 generation were greatly increased (p < 0.05) in presence of AQDS as compared to the control, accounting for up to +160% and +125% in the last experimental cycle, respectively. These findings could be explained by a two-step mechanism, whereby microbes used H2 to quickly reduce AQDS into the highly soluble AH2QDS, which in turn served as a more efficient electron donor for methanogenesis. In contrast, the used biochar had apparently an adverse effect on the biomethanation process.

1. Introduction

The release of carbon dioxide into the atmosphere is one of the main causes of global warming and ocean acidification [1]. These phenomena are, in turn, (co)responsible for several negative side-effects on the environment, such as the rise in sea levels, the reduction in ice caps and glaciers and the worsening of extreme events (i.e., heat waves, wildfire, floods, droughts and cyclones), thus threatening the whole biosphere [2]. It is well-known that human activities such as fossil fuels combustion and deforestation are the main contributors of CO2 emissions [3], and, unfortunately, the trend of atmospheric CO2 emissions is on the rise [4]. The Paris agreement adopted at the UN Climate Change Conference (COP 21) and adopted by 196 nations aims to take action against global warming and to limit the temperature increase to 1.5 °C above pre-industrial levels [5]. Mitigation strategies, such as carbon capture and storage (CCS) and carbon capture and utilization (CCU), are considered to be valid approaches to reduce the impact of CO2 emissions [6]. For example, the conversion of CO2 into methane via hydrogenation (i.e., methanation) couples the removal of CO2 with the production of a valuable energy carrier [7], according to the following equation:
4H2 + CO2 → CH4 + 2H2O
Methanation is also utilized to upgrade the biogas produced during the anaerobic digestion process, as CO2 is the main impurity present in the raw biogas, up to 45% by volume [8]. The molecular hydrogen necessary to carry out methanation is usually provided by means of water electrolysis, following the power-to-gas approach [9]. In this way, the surplus of energy generated by nonprogrammable renewable energy sources such as wind and photovoltaic can be stored in form of CH4. It is worth noticing that methane is a more versatile chemical feedstock than H2, since it allows easier and safer transportation and storage, has fewer barriers for commercial implementation and can count on the well-established natural gas industry and networks [10]. Furthermore, the energy density of CH4 per volume (35.88 MJ m−3) is significantly higher than that of H2 (10.79 MJ m−3) [11].
Traditionally, methanation from H2 and CO2 is carried out with a chemical process known as Sabatier reaction, which is carried out at high-temperature (e.g., 300–550 °C), pressure (e.g., 1–100 bar) and in presence of a metal catalyst (e.g., Ni, Fe, Ru) [12,13]. At present, chemical methanation is at a high technological readiness level (TRL) and currently is deployed at a pilot scale at different sites [14]. Conversely, low-temperature methanation can be achieved using biological processes, where CO2 to CH4 conversion is catalyzed by methanogenic archaea, in the so-called biomethanation [15]. The high energy consumption of the Sabatier process (26–35 kWh m³ CH4) [16], makes it less economically and environmentally sustainable than biomethanation.
Besides mild reaction conditions, biomethanation has several other advantages over catalytic methanation: (i), irreversibility of the biochemical reactions, (ii) less byproducts, (iii) insensitivity to the impurities and (iv) does not need a H2:CO2 ratio of 4 or higher in the feedstock gas mixture [17]. Furthermore, the self-replicating nature of the biological catalyst makes it less susceptible to irreversible inhibition by sulfur compounds and ammonia, allowing for a more robust process [18,19].
Nevertheless, main limitation factors of the biomethanation process include the relatively low intrinsic kinetics of the microbiological reaction and the sluggish H2 mass transfer mainly due to its low solubility in water (i.e., 23 times lower than that of CO2) [20]. As a matter of fact, these combined factors ultimately require substantially larger reactor dimensions with respect to the catalytic methanation process [17,21,22].
In recent years, different strategies have been proposed to address some of these limitations, such as operating biomethanation reactors at high pressures (e.g., 10 bar) to increase the equilibrium concentration of dissolved H2 and thus the concentration driving force for H2 gas–liquid mass transfer or at high temperatures (e.g., 55 °C) to increase the kinetics of microbial reaction. For both strategies, however, the advantage of reduced capital expenses triggered by the smaller needed biomethanation reactor has to be balanced against the increase in operational expenses (OPEX) for the energy needed for operation at higher pressures or temperatures [23].
Soluble redox mediators such as anthraquinone-2,6-disulfonate (AQDS), neutral red and cysteine have also been being studied for the improvement of CH4 generation in anaerobic digestion processes [24,25,26,27]. These electron shuttles can promote direct interspecies electron transfer (DIET) mechanisms [28], thus increasing the kinetics of biomethanogenesis. In particular, AQDS is a humic substance analogue that is widely used as model electron shuttle to stimulate microbial metabolism [29,30,31].
Analogously, biochar has also been studied as an amendment for increasing CH4 content and reducing the residual CO2 in anaerobic digesters [32]. Biochar is a carbonaceous material produced by pyrolysis of lignocellulosic biomass, such as agricultural residues [33]. This material can indeed enhance methanogenesis in several different ways: (i) providing a large surface area for microbial colonization, (ii) enriching the microbial communities, (iii) acting as a stimulator for buffering capacity and (iv) increasing the DIET between fermentative bacteria and methanogens thanks to its conductivity and to the redox properties of its surface-bound quinone moieties [33,34,35].
In this work, the impact of two different quinone-based redox mediators, one soluble (i.e., AQDS) and one insoluble (i.e., biochar), on the kinetics of H2-fueled biological methanation in bench-scale microcosms was studied. The performances were evaluated in terms of hydrogen consumption, methane and VFAs generation with respect to unamended controls. The running hypothesis of this study is that mediators, upon reduction, could serve as direct electron donors for methanogenesis and sustain methane production at higher rates relative to H2 alone, due to their higher solubility and/or availability in the liquid phase. Overall, the results of this study have relevance in the development of biogas upgrading technologies and power-to-gas processes to store renewable electric energy in form of methane.

2. Results and Discussion

2.1. Impact of Quinone-Based Mediators on H2 Consumption and CH4 Production

The trends of H2 consumption and CH4 and VFAs generation, in all the microcosms, over three successive feeding cycles is depicted in Figure 1. It is apparent that H2 consumption was strictly linked with the production of CH4. VFAs production was also present, but in much lower extent, accounting for less than 10% of H2 utilization in all microcosms.
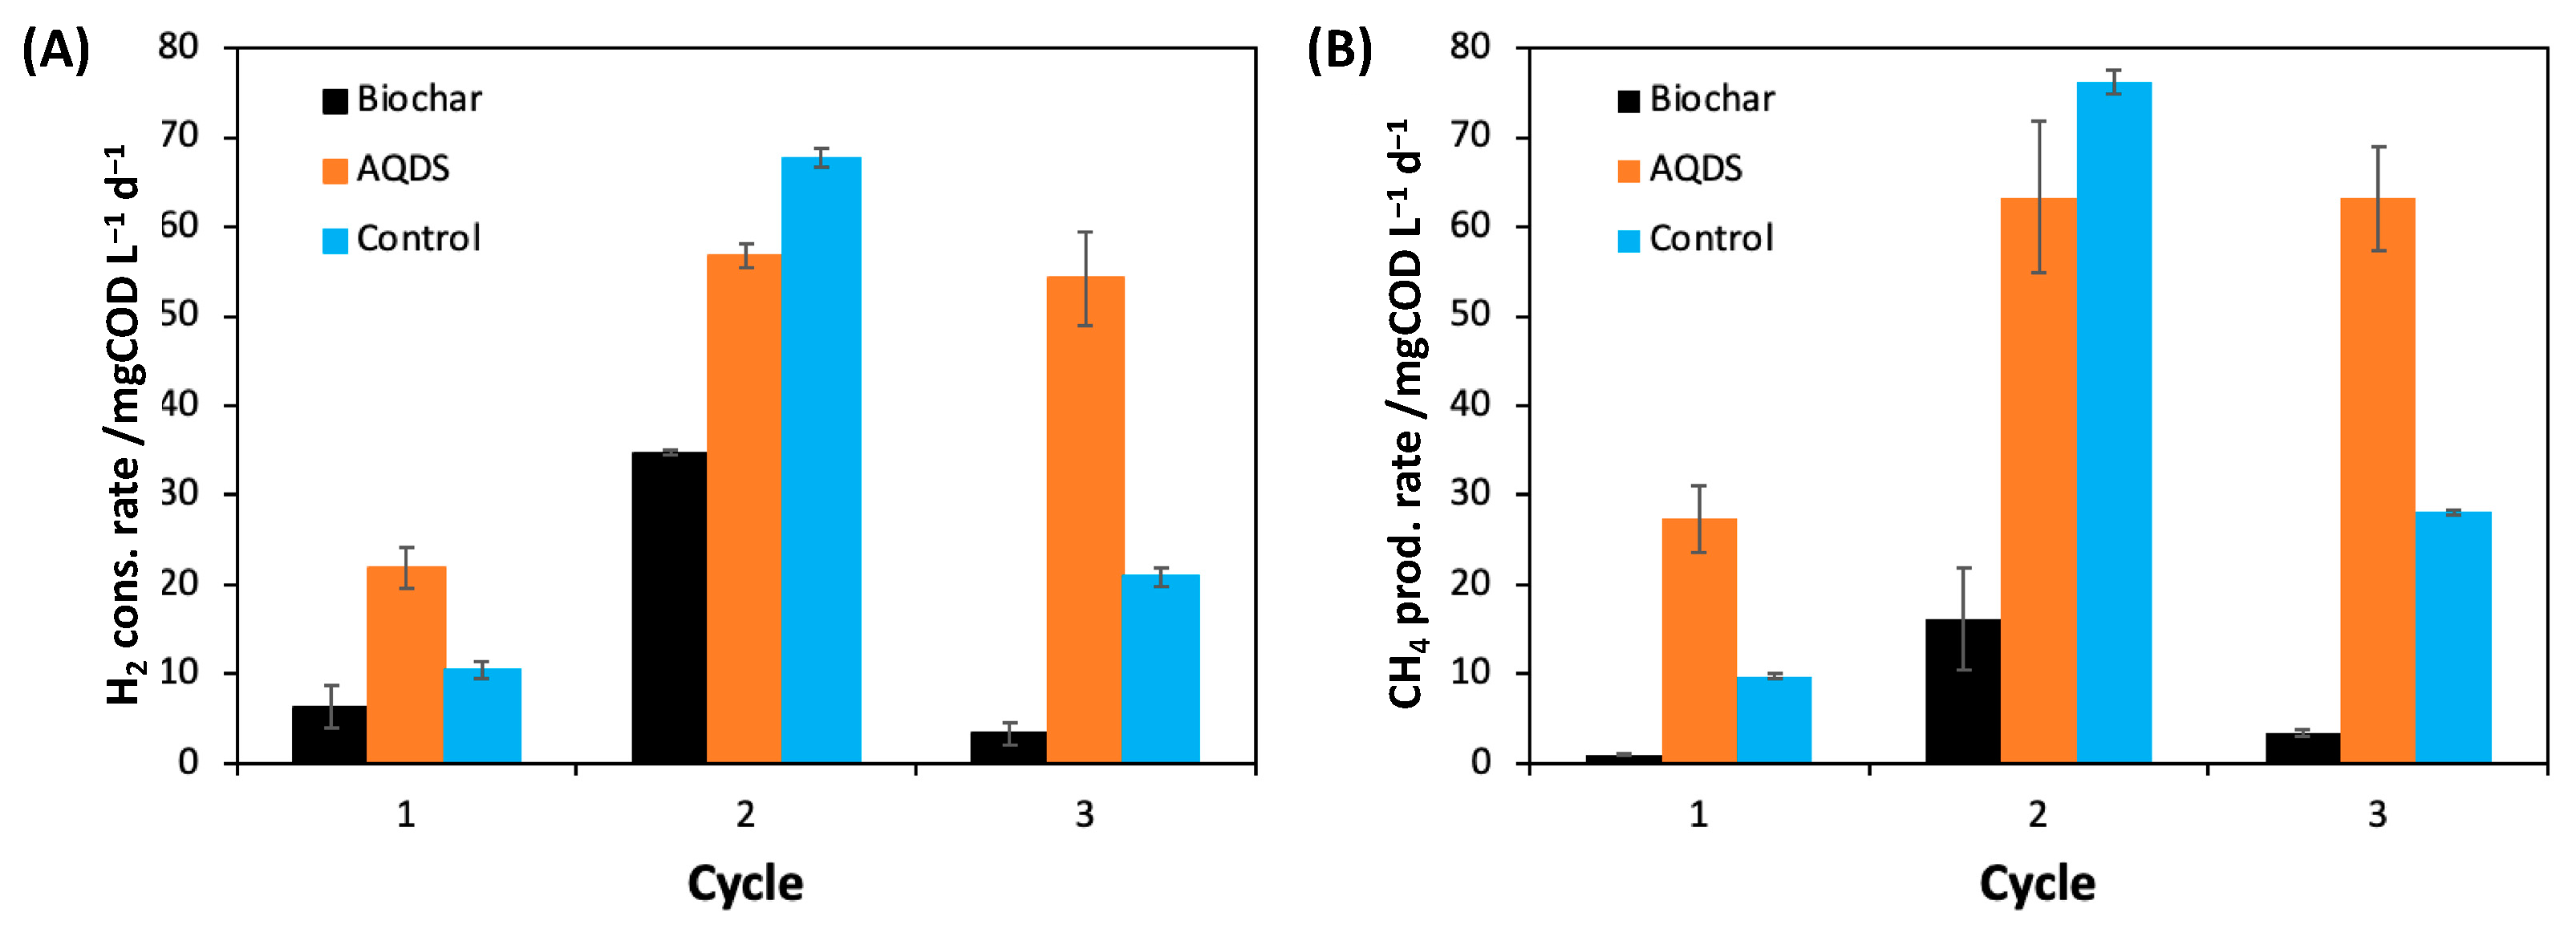
During the first feeding cycle, the average value of H2 utilization rate in the microcosms supplemented with AQDS was 21.9 ± 2.3 mgCOD L−1 d−1 (Figure 2A), hence nearly twice as much the value observed in the unamended controls (10.4 ± 1.2 mgCOD L−1 d−1). By contrast, the rate of H2 utilization in the biochar-supplemented microcosms was substantially lower (6.3 ± 2.4 mgCOD L−1 d−1) than in the unamended controls, suggesting a possible inhibitory effect exerted by the conductive material. A slightly different picture was noticed during the second feeding cycle, whereby H2 utilization in the control microcosms and in those supplemented with AQDS (67.7 ± 4.4 mgCOD L−1 d−1 vs. 56.8 ± 1.3 mgCOD L−1 d−1) was statistically indistinguishable (p = 0.14). However, this apparent discrepancy is consistent with the fact that, although at the start of the cycle all bottles received the same dose of H2, the resulting initial nominal concentration in the control microcosms (i.e., 278 mgCOD L−1 d−1) was almost 60% higher than the one measured in the AQDS microcosms (i.e., 180 mgCOD L−1 d−1), since the unamended controls had only partially consumed the H2 supplied during the previous cycle. Accordingly, the positive effect of the quinone mediator on the kinetics of H2 utilization in the AQDS-amended microcosms was masked by the higher H2 concentration in the unamended controls. Moreover, in this second cycle H2 utilization in the biochar-amended microcosms was lower (34.7 ± 0.2 mgCOD L−1 d−1) and strongly delayed compared to the other treatments.
At the start of the third cycle, all the microcosms were supplied with the same initial H2 concentration, and the rate of H2 consumption in the AQDS-amended microcosms (54.2 ± 5.3 mgCOD L−1 d−1) returned to be substantially (p < 0.05) higher than in the control microcosms (20.9 ± 0.1 mgCOD L−1 d−1), as expected. Besides that, this third feeding cycle further confirmed the apparent inhibitory effect of biochar on H2 utilization, which proceeded at lower rate (3.3 ± 1.2 mgCOD L−1 d−1) as compared to the unamended controls.
The low performance of the biochar amended microcosms seems to be in apparent contrast with many findings reported in the literature, whereby biochar is used to enhance methanogenesis [33]. In the majority of these studies, however, biochar was applied during the anaerobic digestion of (waste) organic compounds, while here the only carbon source for methanogens was CO2. Hence, this behaviour could possibly be ascribed to the adsorption properties of biochar itself, whose capability of capturing CO2 may have resulted in a reduced substrate availability for the methanogens, and in turn in a limited methanogenic activity [36,37,38].
As previously noted, H2 consumption was closely linked to CH4 production in all treatments, and also acetate production to a lesser extent. Figure 2B shows the average rate of CH4 production in the different microcosms over the three feeding cycles, which nicely mirrored the values and trends reported for H2 consumption. Concerning VFAs, a slightly higher production (Figure 1) was obtained in the presence of biochar (up to nearly 25 mgCOD L−1, at the end of the second feeding cycle), but the relative contribution to H2 utilization remained, however, substantially lower than 10%, in all treatments.
Finally, Table 1 presents an overall COD balance for the above reported experiments relative to the whole experimental period. Notably, the conversion of the consumed H2 into metabolic products (i.e., methane and VFAs) ranged between 101–117% in all treatments, thus confirming that all key metabolic processes were properly identified and quantified.

2.2. Deciphering the Mechanisms of AQDS-Enhanced Methanogenesis

Results of the above-described microcosm incubations highlighted the intriguing capacity of AQDS, a soluble quinone-based redox mediator, to enhance the kinetics of H2 bioconversion into CH4. This finding could be explained by assuming the following two-step reaction mechanism: firstly, AQDS is rapidly reduced by H2 into AH2QDS, this latter then served as a direct electron donor for CH4 generation (Figure 3), according to the following reaction stoichiometry:
Step 1: 4H2 + 4AQDS → 4AH2QDS
Step 2: 4AH2QDS + CO2 → CH4 + 4AQDS + 2H2O
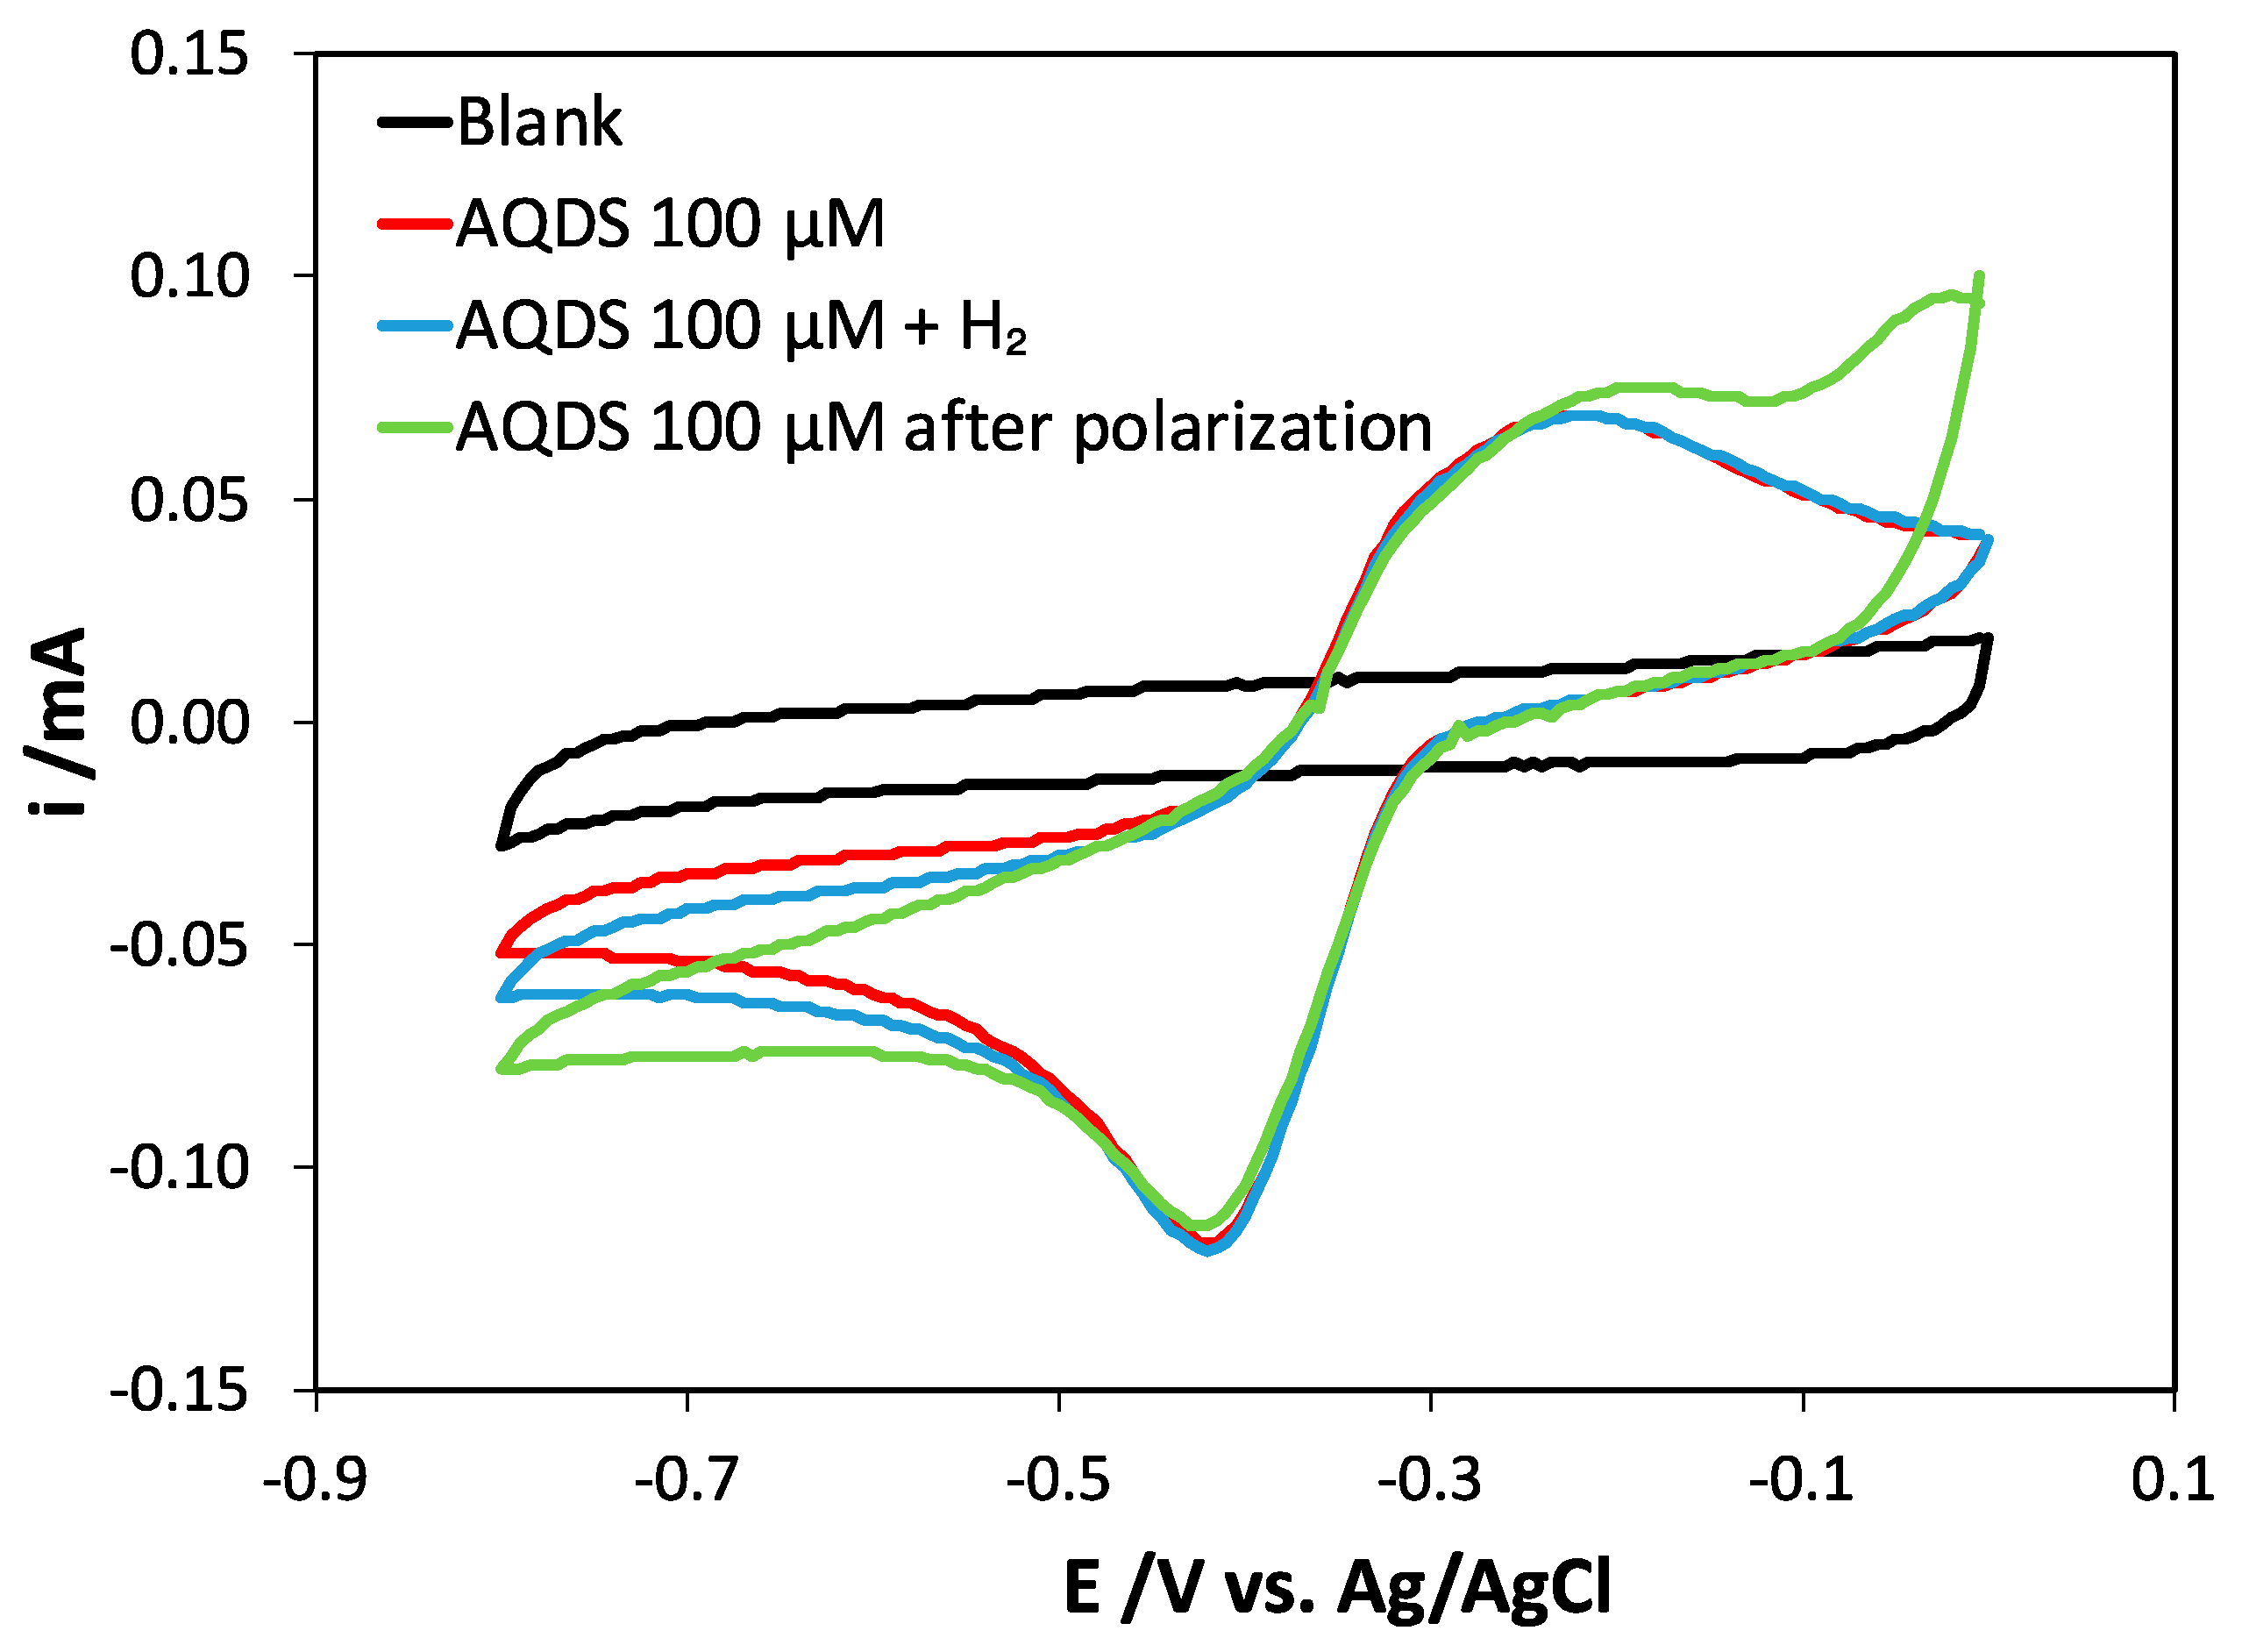
The finding that H2 utilization in the presence of AQDS proceeded at higher rates relative to the unamended controls clearly indicates that mediator reduction is a faster reaction compared to CO2 reduction. To ascertain whether the H2-driven reduction of AQDS into AH2QDS was a biotic or abiotic process, ad hoc cyclic voltammetry (CV) experiments were carried, as depicted in Figure 4. To start with, a CV conducted in an anaerobic mineral medium supplemented with 0.1 mM AQDS was recorded, which revealed the characteristic redox signature of the mediator, with a couple of clearly identifiable anodic and cathodic peaks with formal potential Ef −0.30 V vs. Ag/AgCl. To verify whether H2 could abiotically reduce AQDS, an excess of H2 (60 mL) was added to the headspace of the bioelectrochemical cell, which was kept vigorously stirred at 500 rpm for 24 h to favour H2 dissolution into the liquid phase, and possibly its reaction with AQDS. Thereafter, the CV was repeated to ascertain the possible accumulation of AH2QDS which, in principle, would result in an increased intensity of the anodic oxidation peak in the CV. Interestingly, the CVs of AQDS recorded both in the absence and in presence of H2 were almost indistinguishable, thus indicating that H2 could not abiotically reduce AQDS under the tested conditions. Based on this result, it could be then hypothesized that the reduction of AQDS into AH2QDS during the microcosm experiments was biologically catalyzed by microorganisms occurring in the anaerobic sludge used as inoculum. Indeed, the capability of AQDS to serve as a respiratory electron acceptor by anaerobic microorganisms which use H2 as electron donor has been widely documented in the literature [39]. Finally, a positive control experiment was carried out to confirm that the employed electrochemical technique was sensitive enough to detect changes in the concentration of AH2QDS. In brief, the working electrode was kept polarized (for 24 h) at −0.7 V vs. Ag/AgCl to electrochemically reduce the mediator in solution. Notably, the CV recorded at the end of the chronoamperometry (Figure 4) clearly revealed a substantial increase in the intensity of the anodic current, thus confirming the validity of the adopted experimental approach.
Based on these experiments, the enhancement in the H2 utilization rate could be attributed to the presence within the microbial culture of microorganisms capable to “respire” AQDS and rapidly convert it into AH2QDS using H2 as electron donor. On the other hand, the observed corresponding enhancement of the rate of CH4 production warrants further considerations. One possibility is that, since AH2QDS is more soluble than H2 and was supplied at a relatively high concentration (i.e., 0.5 g L−1), the reduced form of the mediator pooled up in the bulk liquid, ultimately driving methane production at higher rates compared to H2. Another intriguing possibility is that, while H2 could only serve as an electron donor in the metabolism of hydrogenophilic methanogens, AH2QDS could fuel methane production by both hydrogenophilic and acetoclastic methanogens, thereby increasing the overall concentration of active biocatalysts participating in the methanation process.
Regardless the underlying mechanisms ultimately responsible for the observed enhancement of methane production, it is worth noting that the herein reported results are fully in agreement with the few previous literature studies investigating the impact of AQDS on methane production that documented its stimulatory effect (Figure 5).
As an example, Xu and colleagues [24] observed a 10-fold enhancement of methane production from acetate (10 mmol L−1) as compared to an unamended control in presence of AQDS (initial concentration 5 mmol L−1). A five-fold enhancement was instead observed when the mediator was provided at a lower concentration of 0.5 mmol L−1. Microbiological analyses indicated that methane production was most likely catalyzed by Methanosarcina species, microorganisms capable of producing methane from either acetate, H2 and CO2 as well as other simple substrates such as methanol. In a more recent study, 0.1 mmol L−1 AQDS enhanced by nearly 30% the production of methane from acetate by Methanosaeta [25]. Using paddy soil as inoculum and propionate as electron donor, Zhuang and colleagues [27] reported a 15% increase in the rate of methane production in the presence of AQDS. The hydrogenophilic methanogen Methanobacterium was the microorganisms most likely responsible for methane production.
Taken as a whole, the above-reported studies seem to confirm that the capability to use AH2QDS as electron donor is widely distributed among methanogenic organisms.

3. Materials and Methods

3.1. Chemicals

All chemicals used for the experiments were of analytical grade and were purchased from Merck KGaA (Darmstadt, Germany). De-ionized water (Millipore, Darmstadt, Germany) was used to prepare the microbial medium and all other solutions.

3.2. Microcosms Setup

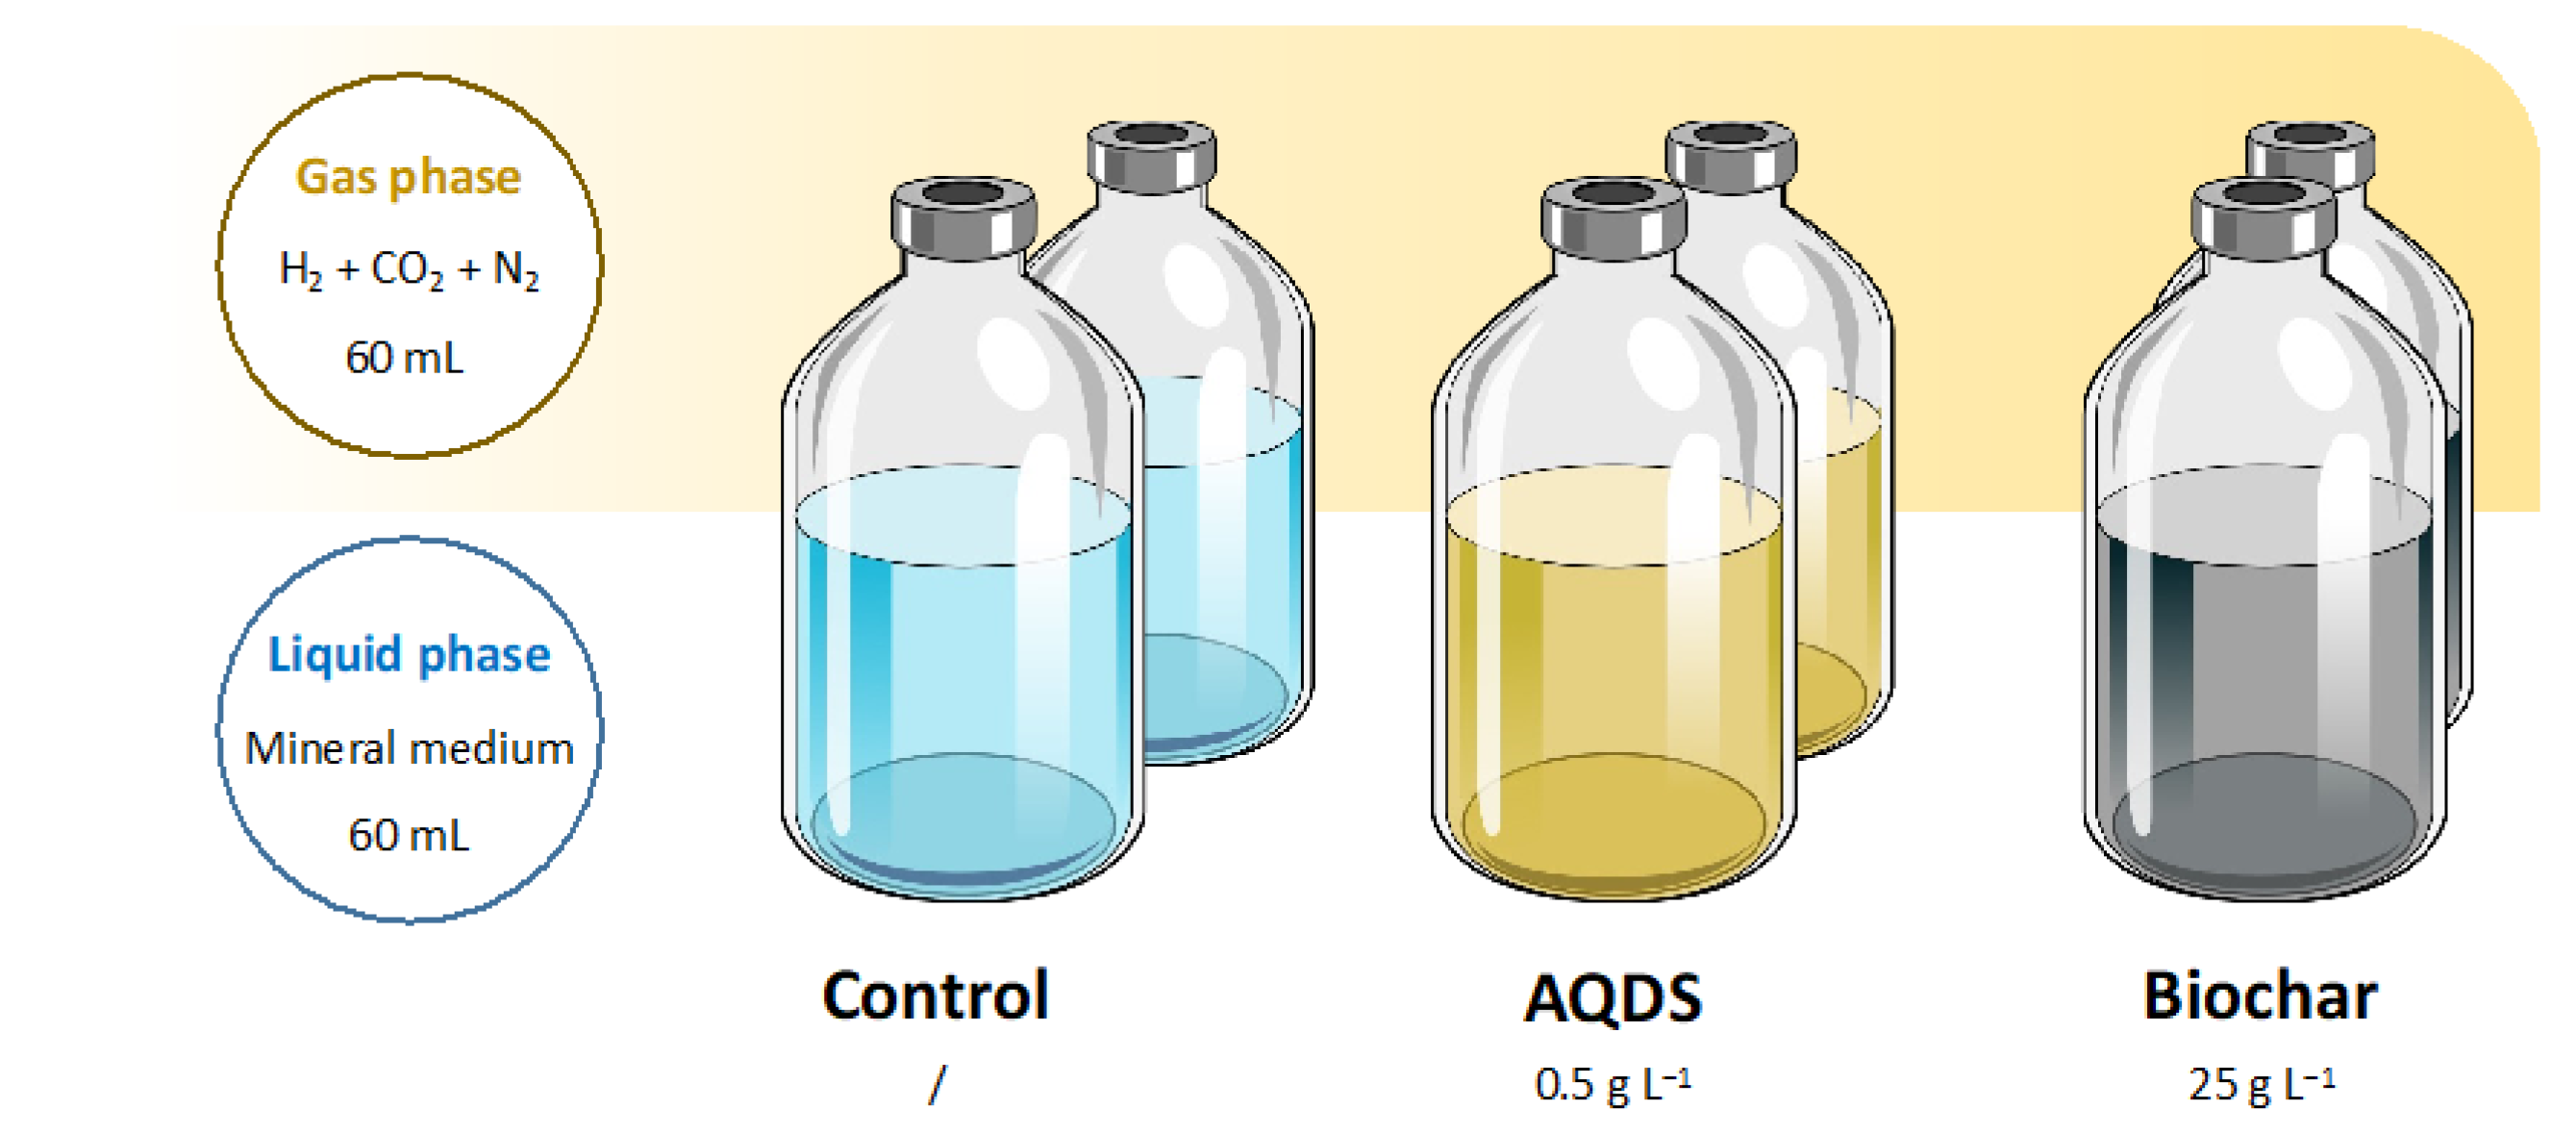
The microcosms were prepared using 120 mL serum bottles sealed with Teflon-faced butyl rubber stoppers. The bottles were filled with 60 mL of mineral medium, prepared as follows (g/L): NaHCO3 4.2; NH4Cl 0.5; MgCl2•6H2O 0.1; CaCl2•2H2O 0.05; K2HPO4 8; KH2PO4 8. To the mineral medium, 10mL L−1 of trace metal solution and 1ml L−1 of vitamin solution were added. The trace metal solution contained (g L−1): Nitrilotriacetic acid 4.5; FeSO4•7H2O 0.556; MnSO4•H2O 0.086; CoCl2•6H2O 0.17; ZnSO4•7H2O 0.21; H3BO3 0.019; NiCl2 0.02; Na2MoO4 0.01. The vitamin solution was composed of (g L−1): Biotin (B7) 0.02; Folic acid (B9) 0.02; Pyridoxine (B6) 0.1; Thiamine (B1) 0.05; Riboflavin (B2) 0.05; Nicotinic acid (B3) 0.05; Pantothenic acid (B5) 0.05; Cyanocobalamin (B12) 0.002; 4-aminobenzoic acid (B10) 0.05. The final pH of the medium was 7. The microcosms were amended by adding the selected redox mediator in each bottle, as shown in Figure 6. In this way, three different conditions were tested: in the first type 5 g L−1 of AQDS (Merck KGaA, Darmstadt, Germany) were added, the second type was amended with 25 g L−1 of biochar powder, and finally no mediator was supplemented in the control microcosms.
The biochar powder used for this study was obtained by gasifying pine wood at approximately 850 °C. The elemental composition of the material is as follows: 78%C; 4.18%Ca; 1.48% K; 0.67%Si; 0.64%Mn and 0.46%Fe. Furthermore, this biochar consisted in a micro-mesoporous material, having a specific surface area of 343 ± 2 m2 g−1, an electrical conductivity >2 S m−1, and a pore volume value of 0.383 cm3 g−1. The micro- and mesopores are continuously distributed in a 20–1000 Å range, and appear most abundant in the 20–100 Å range. No pre-treatments were conducted on the biochar prior to its use in the experiments. Additional information on the material can be found elsewhere [40].
After that, the microcosms were inoculated with 6 mL of anaerobic sludge (~25 gVSS/L) collected from a lab-scale anaerobic digester treating food waste. All microcosms were purged with a N2/CO2 (70/30 v/v) gas mixture to remove O2 and establish anaerobic conditions. Subsequently, 15 mL of headspace were replaced with pure H2, resulting in a H2/CO2 ratio of 25/22% (v/v). During the whole study, the microcosms were constantly stirred by means of a magnetic stirrer and kept at room temperature (24 ± 3 °C).
The experiment lasted for 25 days during which three feeding cycles were performed. At the beginning of each cycle, H2 was provided in the headspace of the microcosms. At the end of cycles 2 the headspace was purged with N2/CO2 (70/30 v/v) to restore the CO2 level and remove the produced CH4.

3.3. Analytical Methods

The liquid phase of the microcosms was constantly analyzed during the experiments to monitor the production of VFAs. Liquid samples (1 µL) were filtered (0.45 μm, nylon, Sartorius, IT), acidified with 100 µL of oxalic acid 3M and injected with a syringe into a gas-chromatograph (GC, Perkin–Elmer 8500, Waltham, MA, USA) equipped with a flame ionization detector (FID), mounting a glass-packed column (Carbopack B-DA80/120 4% CW20M; ID 2 mm; length 2 m; Supelco) and operated as follows: gas carrier N2; flux 40 mL min−1; column temperature 175 °C; injector temperature 200 °C; detector temperature 200 °C.
In order to monitor H2 consumption and CH4 generation, 50 μL of gaseous samples were collected with a gastight syringe (Hamilton, Reno, NV, USA) from the headspace of the bottles and injected into a gas-chromatograph (GC, Perkin–Elmer Auto System, Waltham, MA, USA) equipped with a thermal conductivity detector (TCD), mounting a steel packed column (60/80 Carbopack B/1% SP-1000; ID 2mm; length 2 m; Supelco) and operated as follows: gas carrier N2; flux 20 mL min−1; column temperature 150 °C; injector temperature 200 °C; detector temperature 200 °C. Gas-phase concentrations were converted into nominal concentrations (i.e., total mass divided by the liquid phase in the bottle concentrations) using tabulated Henry’s Law constants [41].

3.4. Cyclic Voltammograms

To study the redox activity of AQDS, a two-chamber electrochemical cell was set up, with a three-electrode configuration. In brief, a glassy carbon rod (length: 7.5 cm, ø: 0.5 cm, HTW GmbH, Thierhaupten, Germany) served as the working electrode, a graphite rod (purity: 99.995%, length: 7.5 cm, ø: 0.6 cm; Sigma-Aldrich, Milan, Italy) was the counter electrode, and an Ag/AgCl electrode was used as reference. Both chambers were filled with phosphate buffer 0.5 M, pH 7 and were kept separated by Nafion® membrane (Dupont Co., Wilmington, DE, USA), which was pretreated as follows: the membrane is initially placed in a boiling solution of H2O2 3% for 2 h, then it is soaked in boiling demineralized water for 2 h, after that it is put in a boiling solution of H2SO4 for 2 h, and finally it is soaked again in boiling demineralized water for 2 h [42]. AQDS was added to the chamber of the working electrode in a concentration of 100 µM. With this setup, cyclic voltammetries were performed at a scan rate of 20 mV s−1 by means of an IVIUMnSTAT potentiostat (IVIUM Technologies, The Netherlands). First of all, the voltammograms were recorded in absence of externally supplied H2. Then, 60 mL of H2 were injected in the headspace of the half-cell where the working electrode was present, and the voltammetry was repeated. Finally, the working electrode was polarized at −0.7 V vs. Ag/AgCl for three days in order to reduce all AQDS present in solution, and the cyclic voltammetry was repeated once more.

3.5. Calculations

The concentrations of H2, CH4 and VFAs were converted into mgCOD L−1 using the following conversion factors (mg mgCOD−1): acetic acid 1.066; propionic acid 1.51; butyric acid 1.81; H2 8; CH4 4.
The average rates of H2 consumption and CH4 production were calculated for each cycle as the slope of the linear regression line obtained from the concentration vs. time plot. The regression line was calculated using a function of the program Microsoft Excel® (Microsoft, Redmond, WA, USA).

4. Conclusions

This study shows that soluble quinone-based redox molecules such as AQDS can substantially improve the kinetics of H2-fueled biological methanation. Indeed, the kinetics of H2 consumption and CH4 generation were greatly increased in presence of AQDS as compared to the controls. As a matter of fact, the hydrogen consumption rates in AQDS-amended microcosms were increased by 110 and 160% as compared to the unamended controls during the first and the third cycle, respectively, while methane generation rates were 181 and 125% higher. These results could be explained by assuming a two-step reaction mechanism, where AQDS is rapidly reduced into AH2QDS by H2, and then this latter is used as direct electron donor for methanogenesis. Since we demonstrated with a series of cyclic voltammetries in presence ad absence of H2 that AQDS could not be reduced abiotically, it seems likely that the increase in the H2 consumption rate could be due to the presence of microorganisms capable to “respire” AQDS using H2 as electron donor, according to a process widely reported in the literature [39]. We hypothesized two possible mechanisms that explain the increased rate of methanogenesis: (i) AH2QDS pooled up in the bulk liquid, thus increasing the availability of electron donors for the methanogens as compared to the less soluble H2, or (ii) unlike H2, AH2QDS was metabolized by both hydrogenophilic and acetoclastic methanogens, thus increasing the overall concentration of active biocatalysts participating in the methanation process.
It is worth noticing that the results obtained in this work are fully in agreement with the few literature studies that investigated the stimulatory effect of AQDS on methane production.
On the contrary, biochar had an adverse effect on methane production, which seems in contrast with the many pieces of literature evidence that report its positive effect on methanogenesis. However, in most studies biochar was applied to the anaerobic digestion of organic compounds, while in the present study CO2 was the only carbon source. Therefore, this phenomenon is probably due to the absorption capability of biochar: the capture of CO2 may have resulted in a reduced substrate availability for the methanogens, and thus in a reduced methanogenic activity.
These findings pave the way for innovative applications of AQDS-assisted methanogenesis, such as in the field of CH4 generation in microbial electrolysis cells (MECs). Furthermore, the presented results have relevance in the development of biogas upgrading technologies and power-to-gas processes, that allow the storage of renewable electric energy in form of methane. Clearly, further work is needed to define the optimal mediator supplementation strategies as well as to examine its long-term chemical and biochemical activity within anaerobic bioreactors.

Author Contributions

Conceptualization, F.A., M.T. and C.C.V.; methodology, F.A. and S.C.; validation, S.C. and M.T.; formal analysis, S.C. and M.T.; investigation, S.C.; data curation, S.C. and M.T.; writing—original draft preparation, F.A. and M.T.; writing—review and editing, F.A; visualization, M.T.; supervision, F.A.; project administration, F.A.; funding acquisition, F.A. All authors have read and agreed to the published version of the manuscript.

Funding

This research received no external funding.

Data Availability Statement

Data will be provided upon request.

Conflicts of Interest

The authors declare no conflict of interest.

References

  1. Raven, J.A.; Beardall, J. Influence of Global Environmental Change on Plankton. J. Plankton Res. 2021, 43, 779–800. [Google Scholar] [CrossRef]
  2. Ghiat, I.; Al-Ansari, T. A Review of Carbon Capture and Utilisation as a CO2 abatement Opportunity within the EWF Nexus. J. CO2 Util. 2021, 45, 101432. [Google Scholar] [CrossRef]
  3. Pachauri, R.K.; Allen, M.R.; Barros, V.R.; Broome, J.; Cramer, W.; Christ, R.; Church, J.A.; Clarke, L.; Dahe, Q.; Dasgupta, P.; et al. Climate Change 2014: Synthesis Report. Contribution of Working Groups I, II and III to the Fifth Assessment Report of the Intergovernmental Panel on Climate Change; IPCC: Geneva, Switzerland, 2014. [Google Scholar]
  4. Kamkeng, A.D.N.; Wang, M.; Hu, J.; Du, W.; Qian, F. Transformation Technologies for CO2 Utilisation: Current Status, Challenges and Future Prospects. Chem. Eng. J. 2021, 409, 128138. [Google Scholar] [CrossRef]
  5. UNFCCC. What Is the Paris Agreement? UNFCCC: Rio de Janeiro, Brazil; New York, NY, USA, 2020. [Google Scholar]
  6. Bui, M.; Adjiman, C.S.; Bardow, A.; Anthony, E.J.; Boston, A.; Brown, S.; Fennell, P.S.; Fuss, S.; Galindo, A.; Hackett, L.A.; et al. Carbon Capture and Storage (CCS): The Way Forward. Energy Environ. Sci. 2018, 11, 1062–1176. [Google Scholar] [CrossRef]
  7. Spiess, S.; Sasiain Conde, A.; Kucera, J.; Novak, D.; Thallner, S.; Kieberger, N.; Guebitz, G.M.; Haberbauer, M. Bioelectrochemical Methanation by Utilization of Steel Mill Off-Gas in a Two-Chamber Microbial Electrolysis Cell. Front. Bioeng. Biotechnol. 2022, 10, 972653. [Google Scholar] [CrossRef] [PubMed]
  8. Sposob, M.; Wahid, R.; Fischer, K. Ex-Situ Biological CO2 Methanation Using Trickle Bed Reactor: Review and Recent Advances. Rev. Environ. Sci. Biotechnol. 2021, 20, 1087–1102. [Google Scholar] [CrossRef]
  9. Barbaresi, A.; Morini, M.; Gambarotta, A. Review on the Status of the Research on Power-to-Gas Experimental Activities. Energies 2022, 15, 5942. [Google Scholar] [CrossRef]
  10. Lewandowska-Bernat, A.; Desideri, U. Opportunities of Power-to-Gas Technology in Different Energy Systems Architectures. Appl. Energy 2018, 228, 57–67. [Google Scholar] [CrossRef]
  11. Dong, Z.; Ding, Y.; Chen, F.; Zhu, X.; Wang, H.; Cheng, M.; Liao, Q. Enhanced Carbon Dioxide Biomethanation with Hydrogen Using Anaerobic Granular Sludge and Metal–Organic Frameworks: Microbial Community Response and Energy Metabolism Analysis. Bioresour. Technol. 2022, 362, 127822. [Google Scholar] [CrossRef]
  12. Vogt, C.; Monai, M.; Kramer, G.J.; Weckhuysen, B.M. The Renaissance of the Sabatier Reaction and Its Applications on Earth and in Space. Nat. Catal. 2019, 2, 188–197. [Google Scholar] [CrossRef]
  13. Lee, W.J.; Li, C.; Prajitno, H.; Yoo, J.; Patel, J.; Yang, Y.; Lim, S. Recent Trend in Thermal Catalytic Low Temperature CO2 Methanation: A Critical Review. Catal. Today 2021, 368, 2–19. [Google Scholar] [CrossRef]
  14. Thema, M.; Bauer, F.; Sterner, M. Power-to-Gas: Electrolysis and Methanation Status Review. Renew. Sustain. Energy Rev. 2019, 112, 775–787. [Google Scholar] [CrossRef]
  15. Jiang, B.; Hu, X.; Söderlind, U.; Göransson, K.; Zhang, W.; Yu, C. Identification of the Biomethanation Pathways during Biological CO2 Fixation with Exogenous H2 Addition. Fuel Process. Technol. 2022, 238, 107478. [Google Scholar] [CrossRef]
  16. Geppert, F.; Liu, D.; van Eerten-Jansen, M.; Weidner, E.; Buisman, C.; ter Heijne, A. Bioelectrochemical Power-to-Gas: State of the Art and Future Perspectives. Trends Biotechnol. 2016, 34, 879–894. [Google Scholar] [CrossRef] [PubMed]
  17. Rönsch, S.; Schneider, J.; Matthischke, S.; Schlüter, M.; Götz, M.; Lefebvre, J.; Prabhakaran, P.; Bajohr, S. Review on Methanation—From Fundamentals to Current Projects. Fuel 2016, 166, 276–296. [Google Scholar] [CrossRef]
  18. Diender, M.; Uhl, P.S.; Bitter, J.H.; Stams, A.J.M.; Sousa, D.Z. High Rate Biomethanation of Carbon Monoxide-Rich Gases via a Thermophilic Synthetic Coculture. ACS Sustain. Chem. Eng. 2018, 6, 2169–2176. [Google Scholar] [CrossRef]
  19. Rachbauer, L.; Voitl, G.; Bochmann, G.; Fuchs, W. Biological Biogas Upgrading Capacity of a Hydrogenotrophic Community in a Trickle-Bed Reactor. Appl. Energy 2016, 180, 483–490. [Google Scholar] [CrossRef]
  20. Pauss, A.; Andre, G.; Perrier, M.; Guiot, S.R. Liquid-to-Gas Mass Transfer in Anaerobic Processes: Inevitable Transfer Limitations of Methane and Hydrogen in the Biomethanation Process. Appl. Environ. Microbiol. 1990, 56, 1636–1644. [Google Scholar] [CrossRef]
  21. Alfaro, N.; Fdz-Polanco, M.; Fdz-Polanco, F.; Díaz, I. Evaluation of Process Performance, Energy Consumption and Microbiota Characterization in a Ceramic Membrane Bioreactor for Ex-Situ Biomethanation of H2 and CO2. Bioresour. Technol. 2018, 258, 142–150. [Google Scholar] [CrossRef]
  22. Götz, M.; Lefebvre, J.; Mörs, F.; McDaniel Koch, A.; Graf, F.; Bajohr, S.; Reimert, R.; Kolb, T. Renewable Power-to-Gas: A Technological and Economic Review. Renew. Energy 2016, 85, 1371–1390. [Google Scholar] [CrossRef]
  23. Wegener Kofoed, M.V.; Jensen, M.B.; Mørck Ottosen, L.D. Biological Upgrading of Biogas through CO2 Conversion to CH4. In Emerging Technologies and Biological Systems for Biogas Upgrading; Aryal, N., Ottosen, L.D.M., Kofoed, M.V.W., Pant, D., Eds.; Elsevier: Amsterdam, The Netherlands, 2021; pp. 321–362. ISBN 978-0-12-822808-1. [Google Scholar]
  24. Xu, J.; Zhuang, L.; Yang, G.; Yuan, Y.; Zhou, S. Extracellular Quinones Affecting Methane Production and Methanogenic Community in Paddy Soil. Microb. Ecol. 2013, 66, 950–960. [Google Scholar] [CrossRef] [PubMed]
  25. Xu, J.; Xie, J.; Wang, Y.; Xu, L.; Zong, Y.; Pang, W.; Xie, L. Effect of Anthraquinone-2,6-Disulfonate (AQDS) on Anaerobic Digestion under Ammonia Stress: Triggering Mediated Interspecies Electron Transfer (MIET). Sci. Total Environ. 2022, 828, 154158. [Google Scholar] [CrossRef] [PubMed]
  26. Beckmann, S.; Welte, C.; Li, X.; Oo, Y.M.; Kroeninger, L.; Heo, Y.; Zhang, M.; Ribeiro, D.; Lee, M.; Bhadbhade, M.; et al. Novel Phenazine Crystals Enable Direct Electron Transfer to Methanogens in Anaerobic Digestion by Redox Potential Modulation. Energy Environ. Sci. 2016, 9, 644–655. [Google Scholar] [CrossRef]
  27. Zhuang, L.; Ma, J.; Tang, J.; Tang, Z.; Zhou, S. Cysteine-Accelerated Methanogenic Propionate Degradation in Paddy Soil Enrichment. Microb. Ecol. 2017, 73, 916–924. [Google Scholar] [CrossRef]
  28. Hernandez, M.E.; Newman, D.K. Extracellular Electron Transfer. Cell. Mol. Life Sci. 2001, 58, 1562–1571. [Google Scholar] [CrossRef] [PubMed]
  29. Bai, Y.; Mellage, A.; Cirpka, O.A.; Sun, T.; Angenent, L.T.; Haderlein, S.B.; Kappler, A. AQDS and Redox-Active NOM Enables Microbial Fe(III)-Mineral Reduction at Cm-Scales. Environ. Sci. Technol. 2020, 54, 4131–4139. [Google Scholar] [CrossRef]
  30. Chen, M.; Tong, H.; Liu, C.; Chen, D.; Li, F.; Qiao, J. A Humic Substance Analogue AQDS Stimulates Geobacter Sp. Abundance and Enhances Pentachlorophenol Transformation in a Paddy Soil. Chemosphere 2016, 160, 141–148. [Google Scholar] [CrossRef]
  31. An, W.; Wu, C.; Xue, S.; Liu, Z.; Liu, M.; Li, W. Effects of Biochar/AQDS on As(III)-Adsorbed Ferrihydrite Reduction and Arsenic (As) and Iron (Fe) Transformation: Abiotic and Biological Conditions. Chemosphere 2022, 291, 133126. [Google Scholar] [CrossRef]
  32. Chen, Y.; Wang, Y.; Xie, H.; Cao, W.; Zhang, Y. Varied Promotion Effects and Mechanisms of Biochar on Anaerobic Digestion (AD) under Distinct Food-to-Microorganism (F/M) Ratios and Biochar Dosages. Waste Manag. 2023, 155, 118–128. [Google Scholar] [CrossRef]
  33. Patel, M.R.; Rathore, N.; Panwar, N.L. Influences of Biochar in Biomethanation and CO2 Mitigation Potential. Biomass Convers. Biorefinery 2021. [Google Scholar] [CrossRef]
  34. Shen, Y.; Linville, J.L.; Urgun-Demirtas, M.; Schoene, R.P.; Snyder, S.W. Producing Pipeline-Quality Biomethane via Anaerobic Digestion of Sludge Amended with Corn Stover Biochar with in-Situ CO2 Removal. Appl. Energy 2015, 158, 300–309. [Google Scholar] [CrossRef]
  35. Saif, I.; Thakur, N.; Zhang, P.; Zhang, L.; Xing, X.; Yue, J.; Song, Z.; Nan, L.; Yujun, S.; Usman, M.; et al. Biochar Assisted Anaerobic Digestion for Biomethane Production: Microbial Symbiosis and Electron Transfer. J. Environ. Chem. Eng. 2022, 10, 107960. [Google Scholar] [CrossRef]
  36. Palanisamy, G.; Jung, H.-Y.; Sadhasivam, T.; Kurkuri, M.D.; Kim, S.C.; Roh, S.-H. A Comprehensive Review on Microbial Fuel Cell Technologies: Processes, Utilization, and Advanced Developments in Electrodes and Membranes. J. Clean. Prod. 2019, 221, 598–621. [Google Scholar] [CrossRef]
  37. Guo, S.; Li, Y.; Wang, Y.; Wang, L.; Sun, Y.; Liu, L. Recent Advances in Biochar-Based Adsorbents for CO2 Capture. Carbon Capture Sci. Technol. 2022, 4, 100059. [Google Scholar] [CrossRef]
  38. Cao, L.; Zhang, X.; Xu, Y.; Xiang, W.; Wang, R.; Ding, F.; Hong, P.; Gao, B. Straw and Wood Based Biochar for CO2 Capture: Adsorption Performance and Governing Mechanisms. Sep. Purif. Technol. 2022, 287, 120592. [Google Scholar] [CrossRef]
  39. Dantas, J.M.; Ferreira, M.R.; Catarino, T.; Kokhan, O.; Pokkuluri, P.R.; Salgueiro, C.A. Molecular Interactions between Geobacter Sulfurreducens Triheme Cytochromes and the Redox Active Analogue for Humic Substances. Biochim. Biophys. Acta-Bioenerg. 2018, 1859, 619–630. [Google Scholar] [CrossRef]
  40. Viggi, C.C.; Tucci, M.; Resitano, M.; Matturro, B.; Crognale, S.; Feigl, V.; Molnár, M.; Rossetti, S.; Aulenta, F. Passive Electrobioremediation Approaches for Enhancing Hydrocarbons Biodegradation in Contaminated Soils. Sci. Total Environ. 2022, 845, 157325. [Google Scholar] [CrossRef]
  41. Sander, R. Compilation of Henry’s Law Constants (Version 4.0) for Water as Solvent. Atmos. Chem. Phys. 2015, 15, 4399–4981. [Google Scholar] [CrossRef]
  42. Aulenta, F.; Canosa, A.; Reale, P.; Rossetti, S.; Panero, S.; Majone, M. Microbial Reductive Dechlorination of Trichloroethene to Ethene with Electrodes Serving as Electron Donors without the External Addition of Redox Mediators. Biotechnol. Bioeng. 2009, 103, 85–91. [Google Scholar] [CrossRef]
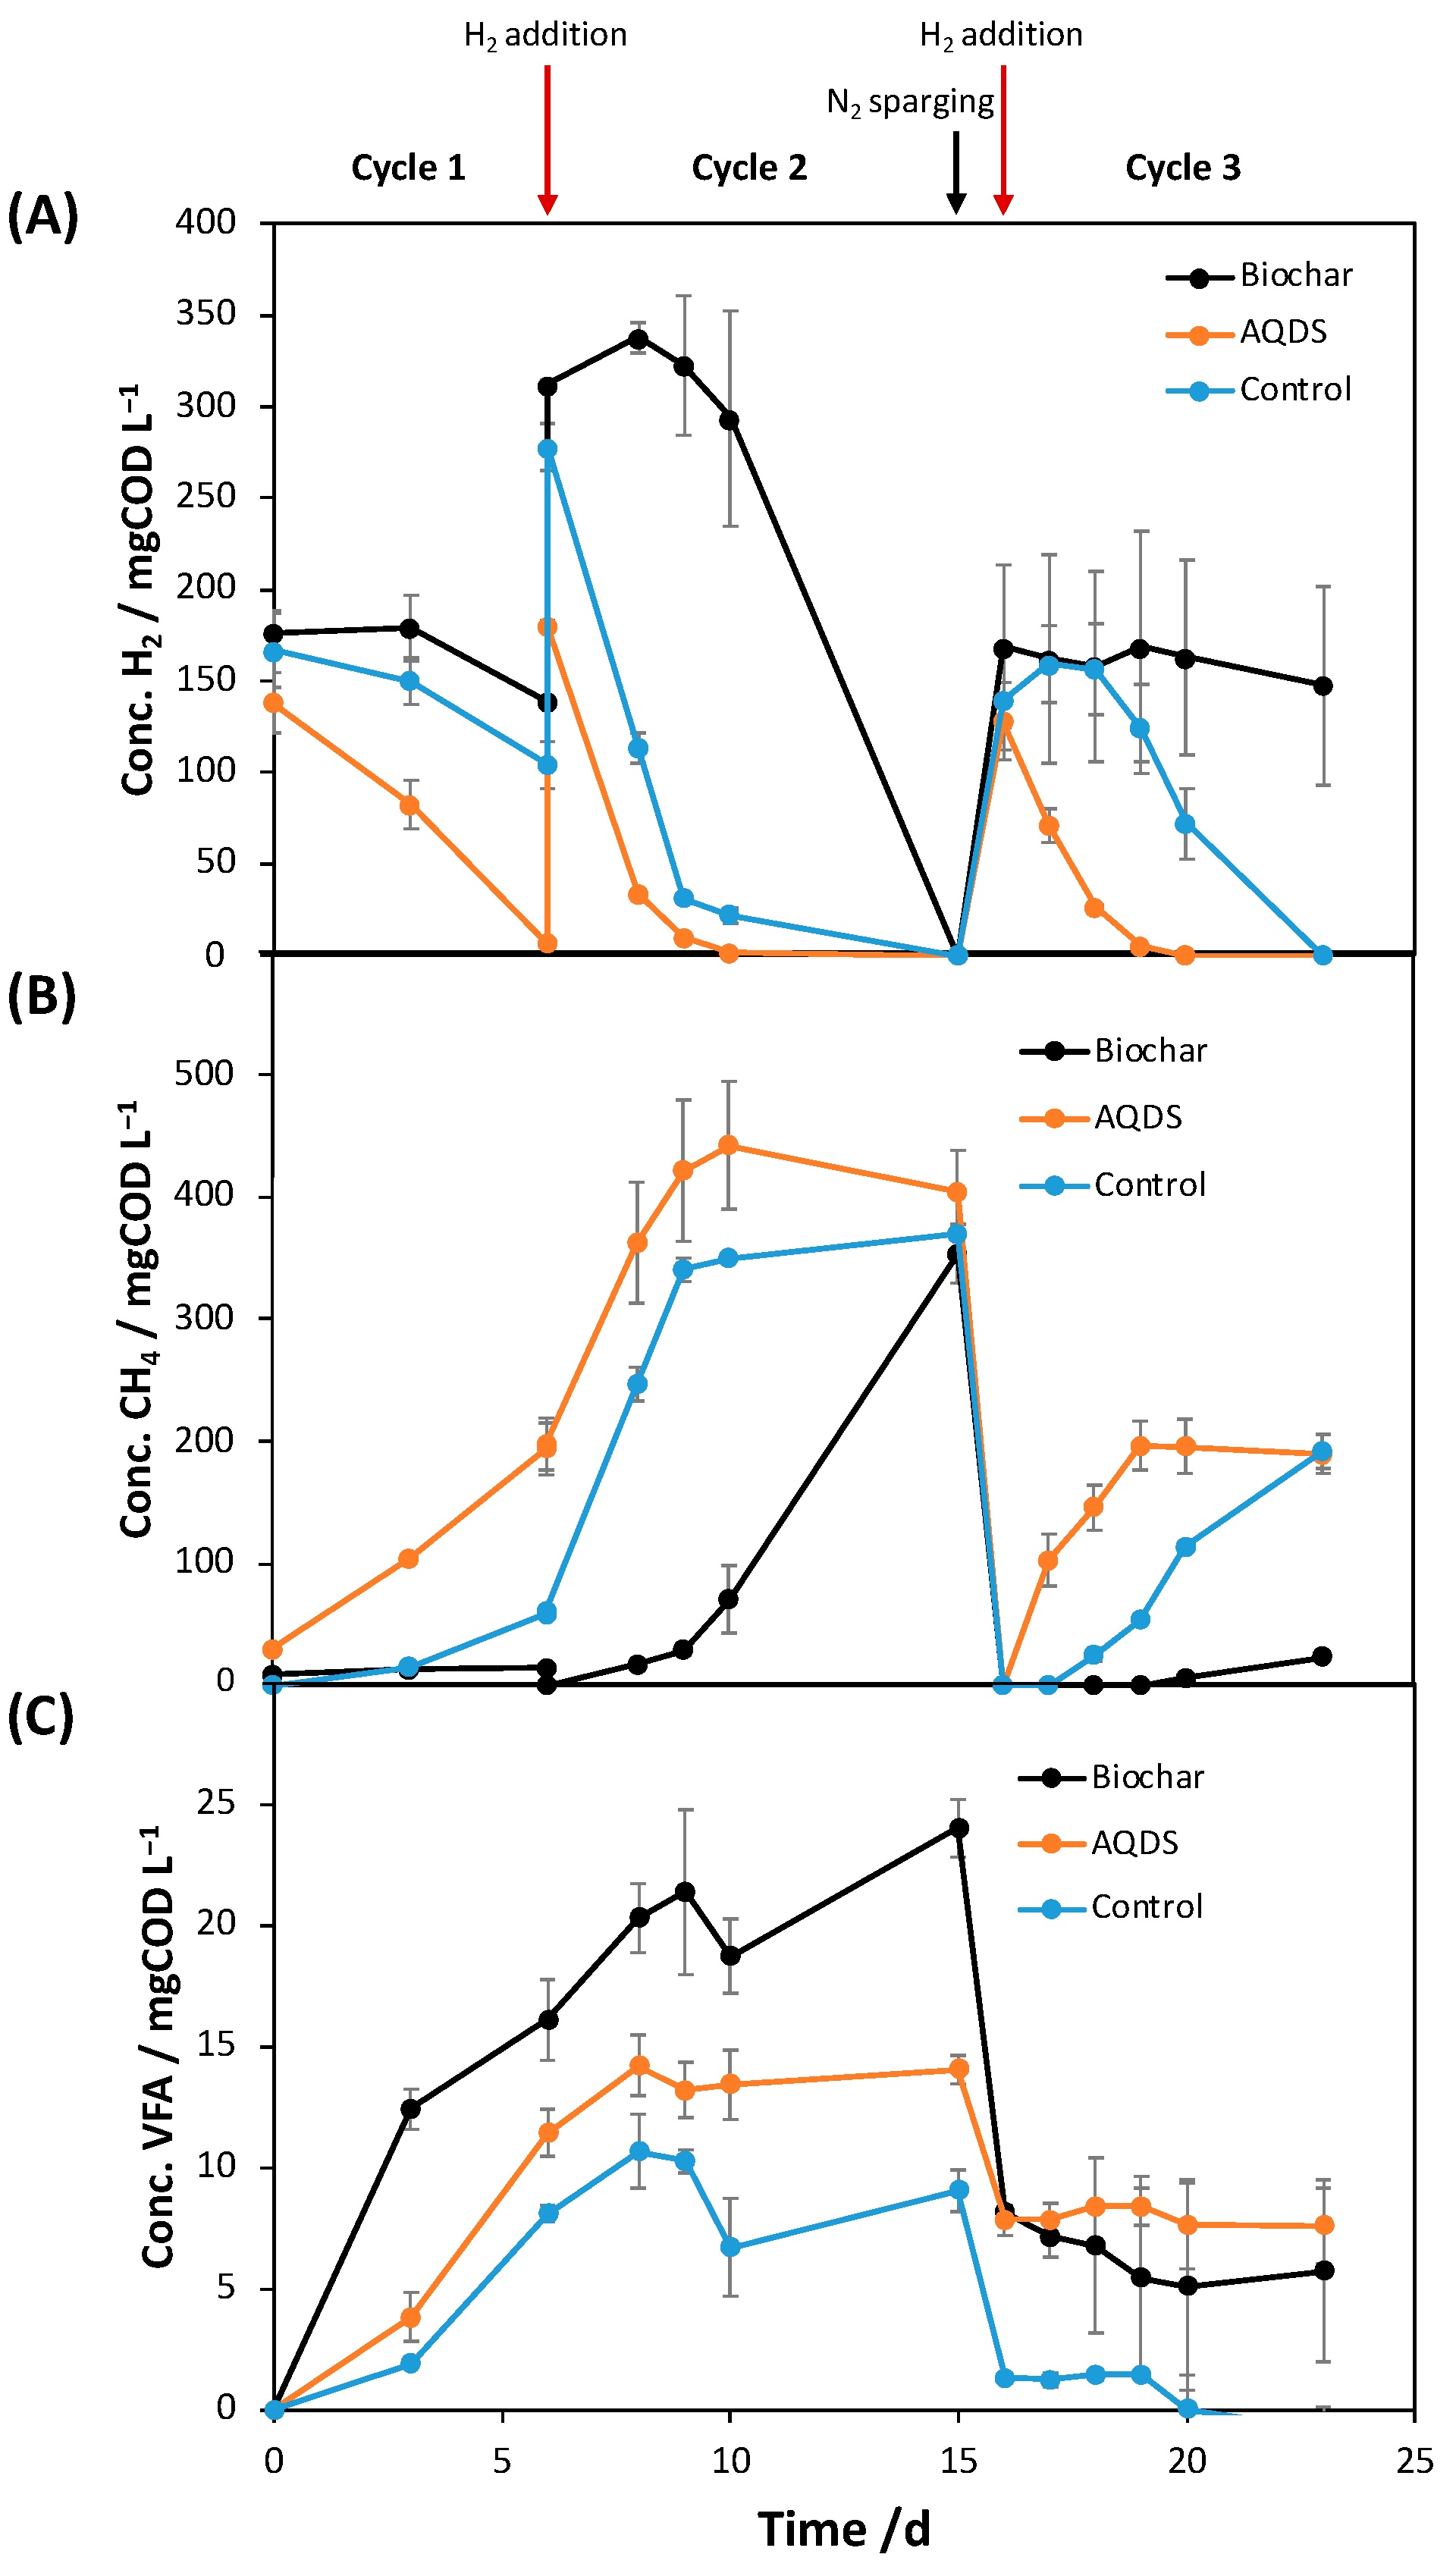
Figure 1. Trends of the nominal concentrations of (A) H2, (B) CH4 and (C) VFAs during the three successive feeding cycles.
Catalysts 13 00859 g001
Figure 2. Average rates of H2 consumption (A) and CH4 production (B) throughout the different working cycles.
Catalysts 13 00859 g002
Figure 3. Schematic representation of the hypothesized mechanism for hydrogenophilic methanogenesis in presence (A) and absence (B) of AQDS.
Catalysts 13 00859 g003
Figure 4. Abiotic cyclic voltammograms on a glassy carbon electrode: only phosphate buffer pH 7 (black line), after the addition of 100 µM of AQDS (red line), following the addition of H2 (blue line) and then after the electrode was polarized at 0.7 V vs. Ag/AgCl for 24 h.
Catalysts 13 00859 g004
Figure 5. Effect of AQDS liquid phase concentration on the enhancement of CH4-production rate relative to unamended controls. The electron donor and the applied concentration are also reported in brackets [24,25,27].
Catalysts 13 00859 g005
Figure 6. Setup of the different microcosms used in the study.
Catalysts 13 00859 g006
Table 1. Mass balance for all treatments, relative to the whole experimental period.
Consumed H2/mgCOD L−1Produced CH4+ VFAs/mgCOD L−1Recovery/%
Biochar513 ± 36516 ± 2101
AQDS610 ± 53717± 68117
Control639 ± 14725 ± 16113
Disclaimer/Publisher’s Note: The statements, opinions and data contained in all publications are solely those of the individual author(s) and contributor(s) and not of MDPI and/or the editor(s). MDPI and/or the editor(s) disclaim responsibility for any injury to people or property resulting from any ideas, methods, instructions or products referred to in the content.