Abstract
Strontium titanate (STO) photocatalysts were prepared via a slightly modified Pechini sol–gel method. A unique rapid calcination technique with a short exposure time was used to obtain crystalline products. The samples were characterized by X-ray diffractometry, scanning electron microscopy, diffuse reflectance spectroscopy, infrared spectroscopy, nitrogen adsorption–desorption measurements, and X-ray photoelectron spectroscopy. Their photocatalytic activity was evaluated by the photocatalytic oxidation of phenol, oxalic acid, and chlorophenol under UV light irradiation using commercial STO as a reference. These pollutants, together with glucose and propanol, were used to investigate the stability of the samples against various functional groups. All our samples exhibited higher photocatalytic activity than the commercial STO reference. With increasing calcination temperature, the crystallinity and primary crystallite sizes increased while the band gaps and specific surface areas decreased. The photocatalytic activity of the most efficient sample was explained by the presence of SrCO3 on its surface. The STO catalysts were highly stable as they largely retained their crystalline composition after exposure to chemicals with different functional groups. Finally, we compared the costs associated with the unique calcination technique with a more conventional one and found that our method is ~35% more cost-effective.
1. Introduction
Strontium titanate (STO) is a perovskite-type photocatalyst with a band gap of 3.2 eV and a promising candidate for water splitting [1,2] and photodegradation of organic pollutants [1,2,3,4]. It has advantages, such as low cost, high photocatalytic activity, photocorrosion resistance, and nontoxicity. The main drawback of STO is that it can absorb only a limited range of solar energy (approximately 5%) due to its wide band gap. The relatively wide band gap restricts its application for photocatalytic degradation under UV light [1,5]. Therefore, most of the studies have focused on the modification of STO by techniques, such as anion doping [6,7,8], metal doping [9,10], generating oxygen deficiencies [11], noble metal deposition [12], composite preparation [13], and dye sensitization [14].
The most common ways to synthesize STO include reverse microemulsion, carbon-free combustion, hydrothermal, polymeric precursor, and sol–gel methods [15,16]. Among these techniques, the sol–gel method has drawn the interest of researchers due to its simplicity and high flexibility [16,17]. The Pechini method is a sol–gel technique widely used to obtain highly pure oxides [18,19]. On the other hand, the preparation of perovskites by sol–gel techniques requires a costly calcination step at a high temperature [20]. Calcination temperature has a strong influence on the physical–chemical properties of photocatalysts. Jia et al. investigated the effect of calcination temperature on the properties of doped STO photocatalysts and found that their stability and photocatalytic activity are strongly influenced by it [5]. Despite the research on the sol–gel synthesis of STO, several aspects remain unclear, such as the influence of calcination parameters on photoactivity. It is known that calcination influences primary crystallite size, specific surface area, and crystallinity to a great extent, while it can modify other parameters such as morphology and band gap [21,22]. Calcination offers an efficient and controllable way to crystallize amorphous materials; however, this simple characteristic is rarely investigated [17,22,23]. Using bare, non-modified STO prepared with optimal calcination parameters could result in more economical catalysts while maintaining their relatively high photoactivity [17].
In most cases, the focus of research is achieving as high a photocatalytic activity as possible. However, for practical applicability, preparing photocatalysts that are stable is equally as important [24,25,26,27]. To the best of our knowledge, the stability of STO against pollutants of various functional groups has not been investigated so far.
In this paper, non-modified STO photocatalysts were prepared by applying a unique rapid heat treatment technique at different temperatures. The effect of this calcination method on the properties of the samples was studied. Their photocatalytic activity for phenol, chlorophenol, and oxalic acid degradations under UV irradiation, as well as their stability against compounds of various functional groups, were investigated. Finally, the economic benefits of the calcination method applied in this work were also evaluated.
2. Results and Discussion
2.1. Characterization of the Photocatalysts
After carrying out the synthesis, a pale yellow xerogel was obtained. A thermal gravimetric (TG) measurement was carried out to determine the minimum temperature required for calcination. No mass loss was observed past 600 °C (Figure S1). Therefore, calcination temperatures between 600–1000 °C were used to prepare the STO samples by the rapid heating short exposure (RHSE) technique.
Figure 1 shows the X-ray diffraction (XRD) patterns of our own and commercial STO samples. The XRD patterns at 22.7°, 32.3°, 39.9°, 46.5°, 57.7°, and 67.7° 2θ degrees were attributed to the (100), (110), (111), (200), (211), (220), and (310) crystallographic planes of STO (JCPDS 35-0734), respectively [28]. The reflections at 25.1°, 25.7°, 29.1°, 36.5°, and 44.1° could be ascribed to the (111), (021), (002), (130), and (132) crystallographic planes of SrCO3 (JCPDS 05-0418), respectively [29,30,31,32]. As expected, the primary crystallite sizes (Table 1) increased in accordance with the calcination temperature. They varied between 15.6 nm (STO_RHSE_600) and 35.9 nm (STO_RHSE_1000). The broadening of diffraction peaks obtained at relatively lower calcination temperatures can be attributed to the relatively small size of the STO crystals [33]. The degree of crystallization also increased with increasing temperature, as demonstrated by the higher peak areas.
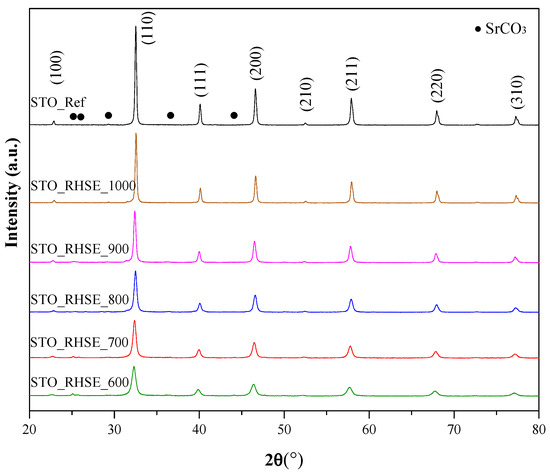
Figure 1.
XRD patterns for commercial STO reference and STO samples calcined at different temperatures.

Table 1.
Average crystallite size, specific surface area, band gap, and reaction rate for model pollutants of the investigated STO samples.
The results of the nitrogen adsorption measurements are summarized in Table 1. As expected, the specific surface areas decreased significantly with increasing calcination temperature. This result is in good accordance with the increasing primary crystallite sizes. Commercial STO_Ref had the highest crystallinity but the lowest specific surface area.
The results of scanning electron microscopy (SEM) measurements are shown in Figure 2. The STO_RHSE samples were polycrystalline containing plates, rods, and other shapeless particles and could not be characterized with a well-defined morphology. They assembled into aggregated structures, resulting in a polydisperse size distribution.
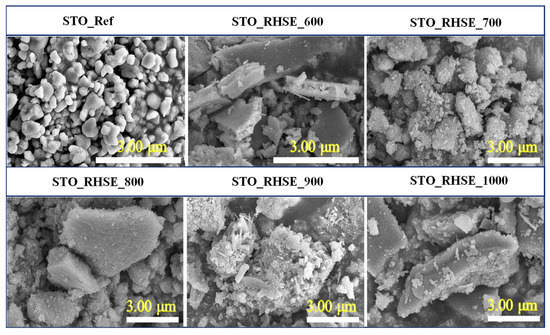
Figure 2.
SEM micrographs of commercial STO and STO photocatalysts calcined at various temperatures.
The absorbance (Figure 3a) and first-order derivative (Figure 3b) diffuse reflectance (DR) spectra of the samples were recorded to investigate optical properties and calculate band gap values. The latter ranged from 3.20 to 3.25 eV. A red shift could be observed as the band gap energies expressed in wavelengths increased with increasing calcination temperature. This phenomenon was already observed in our previous publication [24] and the literature [1] for TiO2. Since the difference in the band gap values of the samples (including STO_Ref) is rather small, it will presumably not affect photocatalytic activity significantly.
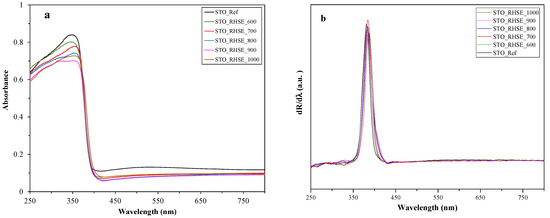
Figure 3.
DR (a) absorbance and (b) first-order derivative spectra of the STO_RHSE and STO_Ref samples.
2.2. Photocatalytic Activity Measurements
The photocatalytic activity of the samples was evaluated via the photocatalytic oxidation of different model pollutants, including phenol, chlorophenol, and oxalic acid (Figure 4). The surface normalized turnover rates (TOR) were also calculated and included in Table 1. Before turning on the lamps, the photocatalysts were stirred in the dark to reach adsorption–desorption equilibrium. No adsorption was observed for phenol and chlorophenol, while the degree of adsorption was less than 5% for oxalic acid. Our STO_RHSE samples were significantly more effective at degrading them than the commercial STO reference. The observed photoactivity order for the STO_RHSE samples generally was in good accordance with the XRD results. With decreasing calcination temperature, the decreasing primary crystallite sizes and increasing specific surface areas predominantly resulted in better conversions; however, the trend was not completely regular. Due to the large crystallite size and small specific surface area, the STO_RHSE_1000 sample was the least efficient in all cases. STO_RHSE_700 was found to be overall the most efficient as it decreased the concentrations of phenol, chlorophenol, and oxalic acid by 23%, 36%, and 55%, respectively. This result was somewhat unexpected due to the photoactivity order otherwise correlating reasonably well with the specific surface areas. Similar findings were reported by Chen et al. [34]. They prepared STO samples via a sol–gel method, calcined them at 600–800 °C, and investigated their efficiency for NOx degradation. They found that the most efficient STO was the one calcined at 700 °C; however, they did not provide an explanation for this peculiar behavior. Based on the XRD, SEM, DR, and nitrogen adsorption results, it can be concluded that the reason for the highest photoactivity of STO_RHSE_700 must be surface related; therefore, X-ray photoelectron spectroscopy (XPS) and infrared (IR) spectroscopy measurements were carried out to clarify this issue.
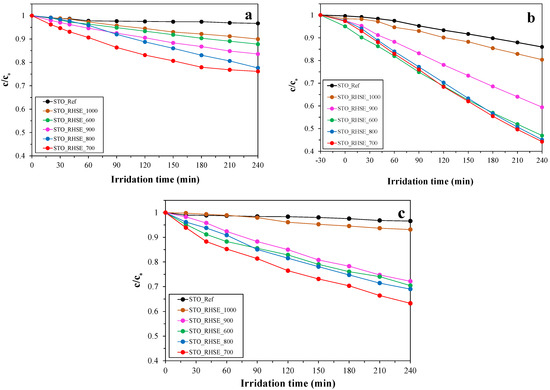
Figure 4.
Degradation curves for: (a) phenol; (b) oxalic acid; (c) chlorophenol.
2.3. XPS and IR Measurements
To investigate the cause of the high photoactivity of STO_RHSE_700, first, its Ti 2p spectrum was recorded (Figure 5a). The presence of Ti4+ was detected (at 458.2 and 463.9 eV) [35,36,37], while Ti3+ could not be observed, as expected. The absence of Ti3+ can be attributed to the syntheses being carried out under non-reductive conditions, as synthetic air was constantly introduced during calcination. Second, the Sr 3d spectrum was considered (Figure 5b). Strontium, an alkaline earth metal, rarely changes its oxidation state (2+). Accordingly, the peaks at 132.8 and 134.6 eV binding energies were ascribed to the Sr2+ 3d5/2 and 3d3/2 orbitals, respectively [36,37]. Third, the O 1s spectrum was collected (Figure 5c), in which “Defect_O” represents oxygen species from surface OH groups and lattice defects, while “Lattice_O” represents oxygen species in the crystal lattice of STO. The former was observed at 531.4 eV (36.93 at%), while the latter was at 529.2 eV (63.07 at%) [36,37]. Since the XPS measurements did not yield results that could be used to explain the high photoactivity of STO_RHSE_700 (such as Ti3+ centers or unique O species), IR measurements were carried out.
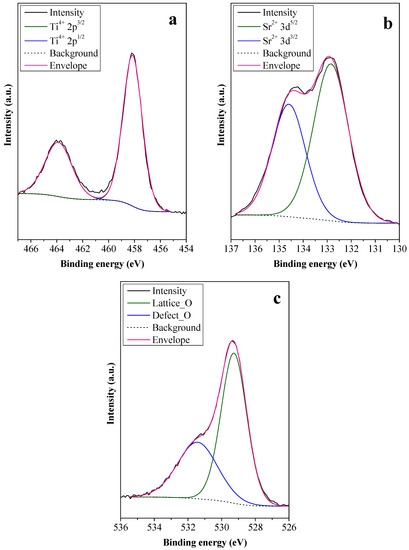
Figure 5.
Ti 2p (a), Sr 3d (b), and O 1s (c) XPS spectra of STO_RHSE_700.
The results of IR measurements are shown in Figure 6. Surface OH groups were identified based on bands between 1625–1630 cm−1 [24,38]. The band between 520 and 560 cm−1 could be associated with Ti–O [39,40], while the one at 460 cm−1 could be attributed to TiO6 vibrations [41]. The intensity of these vibrations increased with the decrease in calcination temperature. The shoulder at 745 cm−1 within the wide band between 500–900 cm−1 corresponds to Sr–O vibrations [39]. The band at 3400 cm−1 was attributed to the stretching and bending vibrations of surface OH/H2O groups [24,38]. The intensity of these bands predominantly decreased with increasing temperature, while the STO_Ref had the highest intensity for all bands.
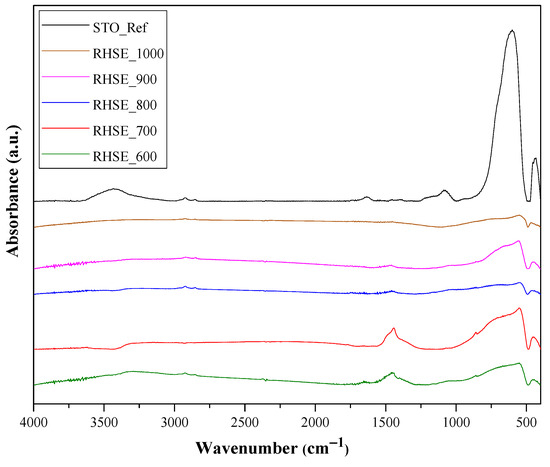
Figure 6.
IR spectra of STO_RHSE and STO_Ref photocatalysts.
Based on the characterization results shown so far, the reason for the highest photocatalytic activity of STO_RHSE_700 could not be identified (morphological changes, band-gap-related differences, or new crystalline phases could not be detected). However, an interesting change in the evolution of IR bands was observed as a function of temperature. The signal at ~1475 cm−1 can be attributed to carbonate species [42], more precisely to SrCO3. This statement was made after considering several alternatives: (i) N-related species, such as N–H bending vibrations from amides or N–O vibrations in nitro groups; (ii) sulfur-related species (S=O); and (iii) C–H bending vibrations in aldehydes or methyl groups. The first two can be excluded because the reactants used for the synthesis did not contain N or S. The third one can be excluded, too, since the intensity of this band (for individual methyl groups) is usually very low, even at high concentrations. Moreover, in our case, XPS measurements cannot clearly identify SrCO3 because: (i) in the O 1s spectrum, carbonate produces a signal around 531 eV, which overlaps with several oxygen species; and (ii) in the C 1s spectrum (measured, but now shown) carbonate-specific signals tend to overlap with C=O signals, which in the present work might originate from the decomposition of citrate-containing organic matter. Additionally, the carbonate amount is presumably below 1–2 wt%, making its detection challenging.
The prominent photocatalytic activity of STO_RHSE_700 can be explained based on the presence of SrCO3. SrCO3 is known to act as a co-catalyst in SrTiO3/SrCO3 systems. SrCO3 improves charge separation since the photogenerated electrons in the conduction band of SrTiO3 can be trapped by SrCO3, decreasing the recombination rate and ultimately increasing photoactivity [26,43]. To calculate SrCO3 content, the Sr–O and Ti–O bands were used as reference bands (Figure 7a). The photoactivity trend we observed corresponds reasonably well (Figure 7b) to the ratio of these bands (Ioxide/ICO3). The lowest Ioxide/ICO3 ratio (i.e., the highest carbonate content) was observed for the most efficient STO_RHSE_700 (1.42). The second (1.96) and third (3.75) highest carbonate contents were calculated for STO_RHSE_600 and STO_RHSE_800, which were the third- and second-best samples overall, respectively. Although the quantity of SrCO3 is higher in STO_RHSE_600 (compared to that in STO_RHSE_800), it is most likely more amorphous due to the lower calcination temperature. This means that it is less likely to participate in charge separation processes. STO_RHSE_700 is more crystalline and a higher amount of SrCO3 forms; however, SrCO3 thermally decomposes with increasing calcination temperature.

Figure 7.
(a) Changes of M–O and SrCO3 IR bands as a function of calcination temperature. The spectra were normalized, and a Savitzky–Golay smoothing was applied for the calculations; (b) correlation between Ioxide/ICO3 IR band ratios and the measured phenol degradation efficiency.
2.4. Stability Measurements
The stability of our STO_RHSE samples was also investigated against pollutants with various functional groups, including the already investigated phenol (phenolic −OH), chlorophenol (–Cl), and oxalic acid (–COOH). Additionally, glucose (–CHO) and propanol (alcoholic –OH) were also considered. These measurements were carried out by investigating the XRD patterns (Figure S2) and morphology (Figure S3) of the samples after their exposure to the aqueous solutions of these materials for 4 h. All photocatalysts retained their crystalline composition against each compound except for oxalic acid (Figure S2). The peak area of the diffraction at 29.1 2θ°, attributed to SrCO3, increased. Some new diffraction peaks were observed with very low intensities, such as the ones at ~31 and ~39 2θ°, which could be attributed to the (210) and (211) crystallographic planes of Sr(OH)2, respectively [44]. These differences might be attributed to the relatively high concentration of oxalic acid (5 mM) we applied, which resulted in a low pH. These measurements were also carried out at oxalic acid concentrations of 1 mM and 3 mM; however, 16.6 and 13.2% of oxalic acid were adsorbed in these cases after 30 min, respectively. Due to the irregular morphology of the samples, the results of SEM measurements were inconclusive (Figure S3). Based on the SEM micrographs taken after stability measurements, the samples still consisted of plates, rods, and other shapeless particles; thus, no significant change could be observed. Based on these results, we concluded that our STO_RHSE samples proved to be stable against most investigated compounds, except for oxalic acid.
2.5. Cost Efficiency Comparison of Conventional Calcination and RHSE Method
Not only did the STO_RHSE samples have reasonably good photoactivity (while being stable), but the synthesis method we used was more cost-efficient than conventional calcination. A calculation was made to compare the energy required to prepare STO_RHSE_700 to the energy to prepare an STO sample by conventional calcination (i.e., 700 °C temperature, 5 °C∙min−1 heating rate, and 2 h exposure). The calculations were made considering the following:
- Sample surface of 1 cm2 and depth of 1 mm;
- Heat transfer is achieved via convection (due to the introduction of air);
- Natural convection is neglectable due to the experimental conditions (indicated by the Nusselt and Reynolds numbers of the system);
- Local heat transfer occurs only on the surface;
- The preparation of STO_RHSE_700 and STO_700 by conventional calcination requires the same starting materials; thus, chemistry-related issues (enthalpy, entropy, heat conduction, specific heat capacity, etc.) can be ruled out.
The energy (P) required for the synthesis can be calculated based on the following equations, where T is the temperature, v is the vectorial sum of the hydrodynamic parameters, and j is the sum of the intrinsic properties of the material, the latter being 0:
For the calculations, the vectorial amount of T was considered. Since the heat transfer can be regarded as one-directional and the same starting materials were calcined using the same air flux, the vectorial amount of v is also 0. Hence, power consumption in this case depends solely on the temperature change during the heat-up phase and the equilibrium between the settled (i.e., non-changing after reaching 700 °C) temperature of the furnace and airflow. Hence, the integration of the heating curve (t vs. T, where t is the time) provides the electrical power required for the heat-up phase. The heat loss equation via convection gives the energy needed to maintain heat at a specific temperature. Moreover, it should be noted that for all heat treatments and heat efficiency calculations, we considered the nature of heat transfer and the time required to achieve thermal equilibrium. STO has a thermal conductivity of 12 W·m−1·K−1 at room temperature [45] (for reference, steel and borosilicate glass have thermal conductivities of 44.2 and 1.11 W·m−1·K−1, respectively). Considering this and that only 400 mg of evenly distributed samples were used for each calcination, heat equilibrium was reached rather quickly (even if these values decrease with increasing temperatures), both in the bulk and on the surface. Based on the considerations presented above, 1120 kW energy is required to prepare STO_RHSE_700 (using the reactant amounts presented in the experimental section), while 1742 kW is needed to produce STO_700 by conventional calcination.
3. Materials and Methods
3.1. Materials
Strontium nitrate (Molar Chemicals, Halásztelek, Hungary; Fluka >97%) and titanium(IV) butoxide (Sigma-Aldrich, Schnelldorf, Germany; reagent grade, ≥97%) were used as STO precursors. Ethylene glycol (VWR Chemicals, Debrecen, Hungary; Reag. Ph. Eur.) and ultrapure Millipore Milli-Q water (Budapest, Hungary) were used as solvents. Citric acid (VWR Chemicals, Chemicals, Debrecen, Hungary; Reag. Ph. Eur.) was used as a chelating agent. Phenol (Spektrum 3D, Debrecen, Hungary; analytical grade), oxalic acid (Sigma-Aldrich, Schnelldorf, Germany; ≥99%), and chlorophenol (Sigma-Aldrich, Schnelldorf, Germany; ≥97%) were used for photocatalytic activity measurements. In addition to phenol, oxalic acid, and chlorophenol, two other compounds, that is, glucose (VWR Chemicals, Debrecen, Hungary; Reag. Ph. Eur.) and propanol (VWR Chemicals, Debrecen, Hungary; Reag. Ph. Eur.) were employed to test the stability. Commercial STO (Alfa Aesar, Kandel, Germany; 99%) was used as a reference.
3.2. Synthesis
The samples were prepared using a slightly modified Pechini sol–gel method based on the publications of Chen et al. and Lu et al. [34,46]. First, 4.23 g of Sr(NO3)2 was first dissolved in deionized water and heated slowly under constant magnetic stirring. Second, 5.76 g of citric acid was added to the mixture (citric acid:strontium cation molar ratio = 1.5:1). Then, 6.8 mL of titanium(IV) butoxide (Sr:Ti molar ratio = 1:1) was added to the mixture, which was followed by the dropwise addition of 6.69 mL of ethylene glycol. The solution was heated at 100 °C on a magnetic stirrer for 4 h, then transferred into an oven (Memmert UNB500) for drying for 15 h at 100 °C. Finally, the amorphous product was collected and dried, and the xerogel was ground in an agate mortar.
As the next step, calcination was carried out based on the publication of Pap et al. [17]. The amorphous powder obtained via the sol–gel process was calcinated by heating in a ceramic boat placed in a tube furnace (Thermolyne 21100; total length 38 cm, quartz tube length 64 cm, tube interior diameter 5.5 cm, quartz tube diameter 4 cm). During calcination, a constant air supply (0.5 L∙min−1) was provided. A high heating rate was applied in three successive steps (60, 20, and 10 °C∙min−1). As the temperature approached the target temperature (600, 700, 800, 900, and 1000 °C), the heating rate was reduced to prevent the furnace from overheating. After reaching the target temperature, the samples were kept at that temperature for 5 min. The materials were named as follows: “STO” stands for “strontium titanate,” “RHSE” stands for “rapid heating, short exposure,” and the number corresponds to the temperature applied during calcination.
3.3. Characterization Methods and Instrumentation
XRD measurements were performed with a Rigaku Miniflex II diffractometer (Rigaku, Neu-Isenburg; Germany) using the following parameters: λCu Kα = 0.15406 nm, 30 mA and 40 kV, 20–80 (2θ°) region. The Scherrer equation was used to calculate the average crystallite sizes of the catalysts based on the full width at half maximum values of the (110) crystallographic planes [47]. To investigate the morphology of the samples, we took SEM measurements with a Hitachi S-4700 Type II microscope (Hitachi, Tokyo, Japan) applying 10 kV acceleration voltage. To calculate specific surface areas, we performed nitrogen adsorption measurements with a NOVA 3000e device (Boynton Beach, FL, USA) and used the Brunauer–Emmett–Teller method [48]. To investigate optical properties, we recorded the DR spectra of the samples with a Jasco-V650 spectrophotometer (Jasco, Tokyo, Japan) equipped with an ILV-724-type integration sphere. The band gap energies were calculated from the first-order derivative spectra of the samples. The xerogel was characterized by TG analysis (TA Instruments TGA Q500, New Castle, DE, USA; 10 °C∙min−1 heating rate, 0–900 °C range) to determine the minimum temperature required for calcination. Before and after the photoactivity measurements, the IR spectra of the samples were recorded using a Bruker Vertex 70 device operated in the wavenumber range from 400 to 4000 cm−1, with a resolution of 4 cm−1. Samples were ground together with KBr and pressed into thin pellets. XPS measurements were carried out using a Specs XPS instrument (Berlin, Germany) equipped with an XR50 dual anode X-ray source and a Phoibos 150 hemispherical analyzer. The Al Kα X-ray source was operated with 150 W (14 kV) power. During the measurements, sample charging was negated with an electron flood gun. Survey spectra were recorded using 40 eV pass energy and 1 eV step size, while for the high-resolution spectra, these values were 20 eV pass energy and 0.1 eV step size.
3.4. Photocatalytic Activity and Stability Measurements
The photo-oxidation activity of the samples was evaluated by using phenol (c0, phenol = 0.1 mM), chlorophenol (c0, chlorophenol = 0.1 mM), and oxalic acid (c0, oxalic acid = 5 mM) as pollutants. The photocatalytic experiments were carried out under UV light (λmax = 365 nm) in a double-walled glass vessel (thermostated to 25 °C) which was surrounded by six UV fluorescent tubes (Vilber-Lourmat T-6L, UV-A, 6 W). Synthetic air was continuously supplied into the suspension during the 4 h long measurements to keep the dissolved oxygen level constant. The changes in the concentration of pollutants were measured with a high-performance liquid chromatograph (HPLC) consisting of a Merck Hitachi L-7100 low-pressure gradient pump and a Merck-Hitachi L-4250 UV–vis detector. As eluents, a 50:50 (v/v) methanol/water mixture was used for phenol (λ = 210 nm) and chlorophenol (λ = 223 nm), and a 19.3 mM sulfuric acid solution was used for oxalic acid (λ = 206 nm).
For some additional measurements, the stability of the RHSE samples against compounds with various functional groups was examined. For this purpose, XRD, IR, and SEM measurements were repeated after the photocatalytic activity measurements with phenol (phenolic –OH group), chlorophenol (–Cl group), and oxalic acid (–COOH group). Propanol (alcoholic –OH group) and glucose (–CHO group) were also included in the stability tests.
4. Conclusions
The effect of rapid heat treatment over a short period on the properties of STO photocatalysts was investigated. Primary crystallite sizes increased from 14.7 to 39.2 nm as the temperature was increased from 600 to 1000 °C. At the same time, specific surface areas decreased from 54.5 to 2.1 m2∙g−1, respectively. The morphology and band gap values were largely unaffected; only a slight redshift was observed for the latter. The photocatalysts proved stable as they retained their crystalline composition after exposure to compounds with various functional groups. Most importantly, photocatalytic activities predominantly increased with decreasing calcination temperature. The best sample (for all investigated pollutants, i.e., phenol, chlorophenol, and oxalic acid) was obtained using a calcination temperature of 700 °C, whose photocatalytic activity was mainly attributed to the presence of SrCO3. The photocatalysts were stable against compounds containing phenolic –OH, alcoholic –OH, –Cl, and –CHO functional groups, while slight changes were observed in their crystalline composition after exposure to relatively concentrated oxalic acid (–COOH). The energy requirement for conventional calcination (at 700 °C) was 1742 kW, whereas using the rapid calcination method, it could be reduced by ~35% to 1120 kW.
Supplementary Materials
The following supporting information can be downloaded at: https://www.mdpi.com/article/10.3390/catal13020219/s1, Figure S1: TG curve of the xerogel obtained by the modified Pechini method, Figure S2: XRD patterns of STO_RHSE_600 (a), STO_RHSE_700 (b), STO_RHSE_800 (c), STO_RHSE_900 (d), and STO_RHSE_1000 (e) before and after their exposure to pollutants with various functional groups, Figure S3: SEM micrographs of the catalysts after exposure to compounds with various functional groups, Figure S4: IR spectra of catalysts after their exposure to phenol (a), chlorophenol (b), oxalic acid (c), glucose (d), and propanol (e).
Author Contributions
M.A.: investigation, conceptualization, writing—original draft. Á.S.: investigation. A.S.: investigation. Á.K.: resources. Z.K.: resources. T.G.: conceptualization, supervision, funding acquisition, writing—review and editing. Z.P.: conceptualization, supervision, funding acquisition, writing—review and editing. All authors have read and agreed to the published version of the manuscript.
Funding
This study was financed by the NKFI-PD-138248 project. The authors are grateful for the financial support of the 2019-2.1.13-TÉT_IN-2020-00015 project. Z. Pap acknowledges the Bolyai János scholarship provided by the Hungarian Academy of Sciences. Project no. TKP2021-NVA-19 has been implemented with the support provided by the Ministry of Innovation and Technology of Hungary from the National Research, Development and Innovation Fund, financed under the TKP2021-NVA funding scheme.
Data Availability Statement
Data is contained within the article or Supplementary Materials.
Conflicts of Interest
The authors declare no conflict of interest.
References
- Atkinson, I.; Parvulescu, V.; Cusu, J.P.; Anghel, E.; Voicescu, M.; Culita, D.; Somacescu, S.; Munteanu, C.; Šćepanović, M.; Popovic, Z. Influence of preparation method and nitrogen (N) doping on properties and photo-catalytic activity of mesoporous SrTiO3. J. Photochem. Photobiol. A 2019, 368, 41–51. [Google Scholar] [CrossRef]
- Ganapathy, M.; Hsu, Y.; Thomas, J.; Chang, C.T.; Alagan, V. Co-catalyst free SrTiO3 nano-cube for efficient photocatalytic hydrogen production. J. Mater. Sci. 2021, 56, 18976–18988. [Google Scholar] [CrossRef]
- da Silva, L.F.; Lopes, O.F.; de Mendonça, V.R.; Carvalho, K.T.; Longo, E.; Ribeiro, C.; Mastelaro, V.R. An understanding of the photocatalytic properties and pollutant degradation mechanism of SrTiO3 nanoparticles. Photochem. Photobiol. 2016, 92, 371–378. [Google Scholar] [CrossRef] [PubMed]
- Song, Y.-X.; Ma, W.-Q.; Chen, J.-J.; Xu, J.; Mao, Z.-Y.; Wang, D.-J. Photocatalytic activity of perovskite SrTiO3 catalysts doped with variable rare earth ions. Rare Met. 2021, 40, 1077–1085. [Google Scholar] [CrossRef]
- Jia, A.; Liang, X.; Su, Z.; Zhu, T.; Liu, S. Synthesis and the effect of calcination temperature on the physical–chemical properties and photocatalytic activities of Ni, La codoped SrTiO3. J. Hazard. Mater. 2010, 178, 233–242. [Google Scholar] [CrossRef]
- Asahi, R.; Morikawa, T.; Ohwaki, T.; Aoki, K.; Taga, Y. Visible-light photocatalysis in nitrogen-doped titanium oxides. Science 2001, 293, 269–271. [Google Scholar] [CrossRef]
- Irie, H.; Watanabe, Y.; Hashimoto, K. Nitrogen-concentration dependence on photocatalytic activity of TiO2-xNx powders. J. Phys. Chem. B 2003, 107, 5483–5486. [Google Scholar] [CrossRef]
- Umebayashi, T.; Yamaki, T.; Tanaka, S.; Asai, K. Visible light-induced degradation of methylene blue on S-doped TiO2. Chem. Lett. 2003, 32, 330–331. [Google Scholar] [CrossRef]
- Liu, J.; Chen, G.; Li, Z.; Zhang, Z. Electronic structure and visible light photocatalysis water splitting property of chromium-doped SrTiO3. J. Solid State Chem. 2006, 179, 3704–3708. [Google Scholar] [CrossRef]
- Irie, H.; Maruyama, Y.; Hashimoto, K. Ag+- and Pb2+-doped SrTiO3 photocatalysts. A correlation between band structure and photocatalytic activity. J. Phys. Chem. C 2007, 111, 1847–1852. [Google Scholar] [CrossRef]
- Nakamura, I.; Negishi, N.; Kutsuna, S.; Ihara, T.; Sugihara, S.; Takeuchi, K. Role of oxygen vacancy in the plasma-treated TiO2 photocatalyst with visible light activity for NO removal. J. Mol. Catal. A Chem. 2000, 161, 205–212. [Google Scholar] [CrossRef]
- Dozzi, M.V.; Saccomanni, A.; Altomare, M.; Selli, E. Photocatalytic activity of NH4F-doped TiO2 modified by noble metal nanoparticle deposition. Photochem. Photobiol. Sci. 2013, 12, 595–601. [Google Scholar] [CrossRef]
- Tang, B.; Chen, H.; Peng, H.; Wang, Z.; Huang, W. Graphene modified TiO2 composite photocatalysts: Mechanism, progress and perspective. Nanomaterials 2018, 8, 105. [Google Scholar] [CrossRef]
- Sewvandi, G.A.; Tao, Z.; Kusunose, T.; Tanaka, Y.; Nakanishi, S.; Feng, Q. Modification of TiO2 electrode with organic silane interposed layer for high-performance of dye-sensitized solar cells. ACS Appl. Mater. Interfaces 2014, 6, 5818–5826. [Google Scholar] [CrossRef]
- Gholamrezaei, S.; Salavati Niasari, M.; Dadkhah, M.; Sarkhosh, B. New modified sol–gel method for preparation SrTiO3 nanostructures and their application in dye-sensitized solar cells. J. Mater. Sci. Mater. Electron. 2016, 27, 118–125. [Google Scholar] [CrossRef]
- Kiran, K.; Ashwath Narayana, B.; Lokesh, S. Enhanced photocatalytic activity of perovskite SrTiO3 nanorods. Solid State Technol. 2020, 63, 1913–1920. [Google Scholar]
- Pap, Z.; Karácsonyi, É.; Cegléd, Z.; Dombi, A.; Danciu, V.; Popescu, I.; Baia, L.; Oszkó, A.; Mogyorósi, K. Dynamic changes on the surface during the calcination of rapid heat treated TiO2 photocatalysts. Appl. Catal. B Environ. 2012, 111, 595–604. [Google Scholar] [CrossRef]
- Wu, Y.; Li, M.; Yuan, J.; Wang, X. Low temperature synthesis and photocatalytic performances of pure Bi2SiO5 powders via pechini sol–gel method. J. Mater. Sci. Mater. Electron. 2017, 28, 10406–10410. [Google Scholar] [CrossRef]
- Wattanathana, W.; Nantharak, W.; Wannapaiboon, S.; Jantaratana, P.; Veranitisagul, C.; Koonsaeng, N.; Laobuthee, A. Barium ferrite prepared by modified Pechini method: Effects of chloride and nitrate counter ions on microstructures and magnetic properties. J. Mater. Sci. Mater. Electron. 2018, 29, 1542–1553. [Google Scholar] [CrossRef]
- Fuentes, S.; Zarate, R.; Chavez, E.; Munoz, P.; Díaz-Droguett, D.; Leyton, P. Preparation of SrTiO3 nanomaterial by a sol–gel-hydrothermal method. J. Mater. Sci. 2010, 45, 1448–1452. [Google Scholar] [CrossRef]
- Veréb, G.; Gyulavári, T.; Pap, Z.; Baia, L.; Mogyorósi, K.; Dombi, A.; Hernádi, K. Visible light driven photocatalytic elimination of organic-and microbial pollution by rutile-phase titanium dioxides: New insights on the dynamic relationship between morpho-structural parameters and photocatalytic performance. RSC Adv. 2015, 5, 66636–66643. [Google Scholar] [CrossRef]
- Pap, Z.; Danciu, V.; Cegléd, Z.; Kukovecz, Á.; Oszkó, A.; Dombi, A.; Mogyorósi, K. The influence of rapid heat treatment in still air on the photocatalytic activity of titania photocatalysts for phenol and monuron degradation. Appl. Catal. B Environ. 2011, 101, 461–470. [Google Scholar] [CrossRef]
- Mogyorósi, K.; Karácsonyi, E.; Cegléd, Z.; Dombi, A.; Danciu, V.; Baia, L.; Pap, Z. New insights regarding the calcination as a critical parameter in the synthesis of sol–gel made titania powders. J. Sol-Gel Sci. Technol. 2013, 65, 277–282. [Google Scholar] [CrossRef]
- Gyulavári, T.; Veréb, G.; Pap, Z.; Dombi, A.; Hernádi, K. Associating low crystallinity with peroxo groups for enhanced visible light active photocatalysts. Catal. Today 2018, 313, 231–238. [Google Scholar] [CrossRef]
- Tóth, Z.-R.; Maity, S.K.; Gyulavári, T.; Bárdos, E.; Baia, L.; Kovács, G.; Garg, S.; Pap, Z.; Hernadi, K. Solvothermal Crystallization of Ag/AgxO-AgCl Composites: Effect of Different Chloride Sources/Shape-Tailoring Agents. Catalysts 2021, 11, 379. [Google Scholar] [CrossRef]
- Jin, S.; Dong, G.; Luo, J.; Ma, F.; Wang, C. Improved photocatalytic NO removal activity of SrTiO3 by using SrCO3 as a new co-catalyst. Appl. Catal. B Environ. 2018, 227, 24–34. [Google Scholar] [CrossRef]
- Wang, Y.; Yang, X.; Hou, C.; Yin, F.; Wang, G.; Zhu, X.; Jiang, G.; Li, C. Improved Catalytic Activity and Stability of Ba Substituted SrTiO3 Perovskite for Oxidative Coupling of Methane. ChemCatChem 2021, 13, 4182–4191. [Google Scholar]
- Le, M.-V.; Vo, N.-Q.-D.; Le, Q.-C.; Tran, V.A.; Phan, T.-Q.-P.; Huang, C.-W.; Nguyen, V.-H. Manipulating the structure and characterization of Sr1−x LaxTiO3 nanocubes toward the photodegradation of 2-naphthol under artificial solar light. Catalysts 2021, 11, 564. [Google Scholar] [CrossRef]
- Gyulavári, T.; Dusnoki, D.; Márta, V.; Yadav, M.; Abedi, M.; Sápi, A.; Kukovecz, Á.; Kónya, Z.; Pap, Z. Dependence of Photocatalytic Activity on the Morphology of Strontium Titanates. Catalysts 2022, 12, 523. [Google Scholar] [CrossRef]
- Asgari-Fard, Z.; Sabet, M.; Salavati-Niasari, M. Synthesis and characterization of strontium carbonate nanostructures via simple hydrothermal method. High Temp. Mater. Process. 2016, 35, 215–220. [Google Scholar] [CrossRef]
- Da Silva, L.F.; Maia, L.; Bernardi, M.I.B.; Andres, J.; Mastelaro, V.R. An improved method for preparation of SrTiO3 nanoparticles. Mater. Chem. Phys. 2011, 125, 168–173. [Google Scholar] [CrossRef]
- Tunç Parlak, T.; Apaydin, F.; Yildiz, K. Formation of SrTiO3 in mechanically activated SrCO3–TiO2 system. J. Therm. Anal. Calorim. 2017, 127, 63–69. [Google Scholar] [CrossRef]
- Kudo, A.; Tanaka, A.; Domen, K.; Onishi, T. The effects of the calcination temperature of SrTiO3 powder on photocatalytic activities. J. Catal. 1988, 111, 296–301. [Google Scholar] [CrossRef]
- Chen, L.; Zhang, S.; Wang, L.; Xue, D.; Yin, S. Preparation and photocatalytic properties of strontium titanate powders via sol–gel process. J. Cryst. Growth 2009, 311, 746–748. [Google Scholar] [CrossRef]
- Xiong, L.; Li, J.; Yang, B.; Yu, Y. Ti3+ in the Surface of Titanium Dioxide: Generation, Properties and Photocatalytic Application. J. Nanomater. 2012, 2012, 9. [Google Scholar] [CrossRef]
- Jiang, D.; Sun, X.; Wu, X.; Shi, L.; Du, F. Hydrothermal synthesis of single-crystal Cr-doped SrTiO3 for efficient visible-light responsive photocatalytic hydrogen evolution. Mater. Res. Express 2020, 7, 015047. [Google Scholar] [CrossRef]
- Zhou, M.; Chen, J.; Zhang, Y.; Jiang, M.; Xu, S.; Liang, Q.; Li, Z. Shape-controlled synthesis of golf-like, star-like, urchin-like and flower-like SrTiO3 for highly efficient photocatalytic degradation and H2 production. J. Alloys Compd. 2020, 817, 152796. [Google Scholar] [CrossRef]
- Gyulavári, T.; Pap, Z.; Kovács, G.; Baia, L.; Todea, M.; Hernádi, K.; Veréb, G. Peroxo group enhanced nanorutile as visible light active photocatalyst. Catal. Today 2017, 284, 129–136. [Google Scholar] [CrossRef]
- Roque-Ruiz, J.; Meraz-Angel, J.; Farias, R.; Meléndez-Lira, M.; Reyes-López, S. Sol-gel synthesis of strontium titanate nanofibers by electrospinning. J. Ceram. Sci. Technol. 2019, 10, 29–38. [Google Scholar]
- Wang, Z.; Jiang, S.; Li, G.; Xi, M.; Li, T. Synthesis and characterization of Ba1−xSrxTiO3 nanopowders by citric acid gel method. Ceram. Int. 2007, 33, 1105–1109. [Google Scholar] [CrossRef]
- Xian, T.; Yang, H.; Di, L.; Ma, J.; Zhang, H.; Dai, J. Photocatalytic reduction synthesis of SrTiO3-graphene nanocomposites and their enhanced photocatalytic activity. Nanoscale Res. Lett. 2014, 9, 327. [Google Scholar] [CrossRef] [PubMed]
- Lu, P.; Hu, X.; Li, Y.; Zhang, M.; Liu, X.; He, Y.; Dong, F.; Fu, M.; Zhang, Z. One-step preparation of a novel SrCO3/gC3N4 nano-composite and its application in selective adsorption of crystal violet. RSC Adv. 2018, 8, 6315–6325. [Google Scholar] [CrossRef] [PubMed]
- Boga, B.; Steinfeldt, N.; Moustakas, N.G.; Peppel, T.; Lund, H.; Rabeah, J.; Pap, Z.; Cristea, V.-M.; Strunk, J. Role of SrCO3 on Photocatalytic Performance of SrTiO3-SrCO3 Composites. Catalysts 2022, 12, 978. [Google Scholar] [CrossRef]
- Ciliberto, E.; Condorelli, G.; La Delfa, S.; Viscuso, E. Nanoparticles of Sr(OH)2: Synthesis in homogeneous phase at low temperature and application for cultural heritage artefacts. Appl. Phys. A 2008, 92, 137–141. [Google Scholar] [CrossRef]
- Zhang, L.; Li, N.; Wang, H.-Q.; Zhang, Y.; Ren, F.; Liao, X.-X.; Li, Y.-P.; Wang, X.-D.; Huang, Z.; Dai, Y. Tuning the thermal conductivity of strontium titanate through annealing treatments. Chin. Phys. B 2017, 26, 016602. [Google Scholar] [CrossRef]
- Lu, X.; Pine, T.S.; Mumm, D.R.; Brouwer, J. Modified Pechini synthesis and characterization of Y-doped strontium titanate perovskite. Solid State Ion. 2007, 178, 1195–1199. [Google Scholar] [CrossRef]
- Jenkins, R.; Snyder, R.L. Introduction to X-ray Powder Diffractometry; Wiley Online Library: Hoboken, NJ, USA, 1996; Volume 138. [Google Scholar]
- Leite, E.R.; Nobre, M.A.; Cerqueira, M.; Longo, E.; Varela, J.A. Particle growth during calcination of polycation oxides synthesized by the polymeric precursors method. J. Am. Ceram. Soc. 1997, 80, 2649–2657. [Google Scholar] [CrossRef]


Disclaimer/Publisher’s Note: The statements, opinions and data contained in all publications are solely those of the individual author(s) and contributor(s) and not of MDPI and/or the editor(s). MDPI and/or the editor(s) disclaim responsibility for any injury to people or property resulting from any ideas, methods, instructions or products referred to in the content. |
© 2023 by the authors. Licensee MDPI, Basel, Switzerland. This article is an open access article distributed under the terms and conditions of the Creative Commons Attribution (CC BY) license (https://creativecommons.org/licenses/by/4.0/).