Article

An Evaluation of the Kinetic Properties Controlling the Combined Chemical and Biological Treatment of Toxic Recalcitrant Organic Compounds from Aqueous Solution

by
Seshibe Makgato
1,* and
Evans Nkhalambayausi-Chirwa
2
1
Department of Chemical Engineering, College of Science, Engineering and Technology, University of South Africa (UNISA), c/o Christiaan de Wet & Pioneer Avenue, Johannesburg 1710, South Africa
2
Water Utilisation and Environmental Engineering Division, Department of Chemical Engineering, University of Pretoria, Pretoria 0002, South Africa
*
Author to whom correspondence should be addressed.
Catalysts 2022, 12(9), 965; https://doi.org/10.3390/catal12090965
Submission received: 19 July 2022 / Revised: 20 August 2022 / Accepted: 22 August 2022 / Published: 29 August 2022

Abstract

:
Due to their high toxicity, propensity for cancer, teratogenicity, mutagenicity, and genotoxicity, hazardous water-soluble phenolic compounds must be controlled immediately. In this study, a model was created to simulate the degradation of harmful recalcitrant organic compounds in a combined chemical and biological treatment system. The parameter estimations with inhibition coefficient (Haldane model) and without inhibition coefficient (Michaelis-Menten model) were assessed over a wide range of initial concentrations using the Monod-like model. The kinetic parameters were optimized using AQUASIM 2.0 software. At a 50 mg·L−1 feed concentration of 4-chlorophenol, removal efficiencies of more than 98% were attained under these circumstances. The primary kinetic parameters were identified and their values models were validated using the fitted parameter values that reached a good degree of agreement (R2 = 0.998). We may better comprehend and make use of the complex phenolic compounds’ biodegradation processes, such as progress optimization and scale-up, by understanding the mechanisms of substrate interaction and the new kinetic models that have been provided in this work.

1. Introduction

The manufacturing of plastics, resin and dyes, insecticides, pharmaceuticals, paper and other petroleum products all heavily rely on phenols or phenolic chemicals [1]. As a result, numerous contaminants are frequently detected in the effluent water from these enterprises, the most prevalent of which is chlorophenol [2], which is reportedly exceedingly harmful to both humans and aquatic life [3]. The levels of 4-chlorophenol (4-CP) in the effluents from the manufacturers of these products range in concentration from 10 mg·L−1 to 200 mg·L−1 [4]. Numerous derivatives of chlorophenol are refractory, which makes them resistant to biological deterioration. These compounds’ recalcitrance is caused by the extremely difficult-to-cleave carbon-hydrogen bond [2]. Additionally, the toxicity of chlorophenols may rise with an increase in their chlorine atom, and the toxicity is also influenced by the difficulty of its microbial degradation [5]. The US Environmental Protection Agency (EPA) and the European Union (EU) have designated chlorophenols as “priority pollutants”, meaning that their presence in the aquatic environment needs to be continuously monitored [6]. Because of their high toxicity [3], carcinogenic potential [1], teratogenic potential [7], mutagenic potential [8], genotoxicity [8], mutagenicity, and genotoxicity, hazardous water-soluble phenolic compounds need to be addressed urgently. Over the past few decades, research into various emerging treatment approaches for wastes and waste streams that are chlorophenol-rich has received much attention due to the awareness that chlorophenols are poisonous and harmful.
A few researchers [9,10,11,12,13,14,15,16] examined ways to improve the physical, chemical and biological processes of degrading chlorophenols from wastewater in order to address these problems. However, the first two techniques can be pricey [10], and in certain situations, they may not completely remove the contaminants, causing issues with the generation of dangerous by-products of even more toxic species [17] that call for additional treatments for further mineralization or disposal [18]. Advanced oxidation processes (AOPs), on the other hand, have restricted applications, incur high costs due to the need for energy and chemicals, are slow at higher concentrations or largely useless at low contamination levels, and cannot destroy recalcitrant organic matter [19,20]. All of these significant flaws render these technologies uncompetitive and restrict their ability to be used in real-world scenarios.
More effort has been put into figuring out how to use cultures of microorganisms to treat chlorophenol-contaminated sediments and water. However, the most environmentally sound, economically viable and ecologically sound method of mineralizing biodegradable micropollutants is through biological processes [16]. However, as these treatments are designed to decompose biodegradable organic pollutants, direct biodegradation treatment is not appropriate due to the abundance of non-biodegradable and recalcitrant organic contaminants [17]. As a result, the use of AOPs as pre-treatment technologies could be used to increase biodegradability and decrease the charge of these molecules in any given wastewater. By integrating chemical and biological processes, uncommon advancements have been made in alternative techniques for efficiently removing pollutants in wastewater [16]. Sarria et al. [18] stated that AOPs have been generally shown to be effective when paired with other cutting-edge technologies. In a combined chemical and biological process, AOPs pre-treatment aimed to alter the structure of pollutants by converting them into less toxic and quickly biodegradable intermediates, enabling the subsequent biological degradation to be completed in less time and at a lower cost [18].
The kinetic characteristics of the organic contaminants involved and the kinetics of the processes must be understood when designing combined chemical and biological treatments [21]. According to Malato et al. [22], scaling up of combined chemical and biological treatments is nevertheless hampered by the absence of kinetic parameter da-ta to compare integrated chemical and biological processes with other technologies. Therefore, it is essential to have a kinetics equation that, for the design of a combined chemical and biological treatment system and the optimization of operating settings, specifies the dependence of the reaction rate on some other relevant quantity [21]. Even while Wade et al. [23] have shown that deterministic modelling of reactor systems, often using a set of coupled ordinary differential equations, gives a vital knowledge of these frequently complicated processes, it has been proved to be successful, particularly in identifying adjustments to the dynamic systems given perturbations in the inputs. Currently, there is no open literature on the kinetic characteristics evaluation of a combined chemical and biological treatment system of harmful refractory organic compounds in a two-stage continuous stirred tank reactors system (CSTRs) system, despite the mathematical complexity and simplicity of both batch and continuous systems. However, there hasn’t been a lot of research done on the analysis of kinetic data and optimization of process parameters for the degradation of 4-CP pollutants at higher concentrations (i.e., 2000 mg·L−1). The objective of the study is to create a model of the controlling the combined chemical and biological treatment system simulated harmful recalcitrant organic compound degradation process. The Monod-like model was used to evaluate the parameter estimations with inhibition coefficient (Haldane model) and without inhibition coefficient (Michaelis-Menten model).

2. Results and Discussion

2.1. Chemical Reactor Rate Coefficients Estimation

The 4-chlorophenol is utilized for cell upkeep, metabolic products, and cell biomass. Equations (1) and (2) are used in order to create a model for the photochemical reactor:
r 1 = kC 1 C oh
where k = the first-order maximum reaction rate coefficient (T−1), C1 = chemical reactor-calculated effluent concentration (M·L−3), and Coh = calculated concentration of (OH) radicals (M·L−3).
C oh = C ohmax + a ( 1 + e ( t t 0 ) b ) c
where     C ohmax = Initial concentration of (OH) radicals (M·L−3), t = Time (T), t0 = Initial boundary value for accumulation of (OH) radicals (T), a = Kinetic parameter constant for accumulation of (OH) radicals (T), b = Kinetic parameter constant for accumulation of (OH) radicals (T), and c = Kinetic parameter constant for accumulation of (OH) radicals (T).
Now, substituting Equation (1) on Equation (2) gives:
r 1 = kC 1 ( C ohmax + a ( 1 + e ( t t 0 ) b ) c )
Substituting for Equation (3) on Equation (4) gives Equation (5):
r S = ( Q V ) ( C in C )
kC 1 ( C ohmax + a ( 1 + e ( t t 0 ) b ) c ) = ( Q V ) ( C in C )
A straightforward model, Equation (5), illustrates the wide range of behaviors of chemical reactors in a combined chemical and biological treatment system. As a result, utilizing Equation (5) and optimization, a satisfactory solution for the kinetic parameters of a chemical reactor was discovered based on the goodness of fit (R2 = 0.98) over a range of influent concentrations. Table 1 lists the computed average kinetic parameters as follows: a = 648.78 mg·L−1, b = 14.27 h−1, c = 249.39, t0 = 10.13 h, k = 1.97 ×10⁻⁵ L−3·mg−1·h−1, Cohmax = 534.82 mg·L−1, and χ2 = 1046. 55.
The kms value is 0.046 at a dose of 50 mg·L−1 and it rises to 0.057 at a concentration of 100 mg·L−1. However, kms rose from 0.064 to 0.089 when hydrogen peroxide (H2O2) was added as a liquid catalyst. The kms values for the chemical reactor system were found to generally rise with rising chlorophenol concentration and further rise with rising H2O2 dosage. Constant a, b and c values, on the other hand, were found to follow the opposite pattern from the kms values. Hydrogen peroxide (H2O2) was added as a liquid catalyst and caused the a, b, and c values in the instances of those values to decrease. The chemical reactor’s kinetic parameter values matched those in the literature in a reliable manner. According to Yang et al. [24], kms values for 50, 100, and 200 mg·L−1 with additional H2O2 were reported to be 0.0997, 0.0480, and 0.0307, respectively. These values compared well with the kms values in the current investigation. Due to variations in the experimental procedures used by Albarrán and Mendoza [25], there is a slight discrepancy between the values found in the literature and the values acquired in this work. Additionally, Ghaly et al. [26] found that the pseudo-first-order rate constants (kms) of chlorophenol with (OH) radicals were 0.15 in another scenario. Even while the result of Ghaly et al. [26] appears high in comparison with our results, this is because Ghaly et al. [26] employed light intensity measurements of 60 W, which is seven times greater than the 9 W light used in the current investigation. In terms of engineering, Equation (5) is more intriguing since it offers the chance to push the system to the edge of its operational viability without sacrificing its capabilities.

2.2. Steady-State Estimation of Biological Parameters

A model was created for a biological reactor that took into account both the Haldane and Monod growth models, similar to how one would for a photochemical reaction chamber. Since the majority of the samples were taken during the logarithmic phase of bacterial development, as was the case with Patel et al. [4], we made the assumption that no by-products of 4-CP’s biodegradation would be produced. Additionally, we believed that cells’ maintenance coefficient would be negligible [27,28]. In order to obtain the following Equations (6) and (7), two reaction rate models were replaced into Equation (6):
C in C = ( V Q ) [ k ms C ( X 0 e ( Yk ms K S k d ) ) t K S + C ]
where Cin = influent substrate concertation (M·L−3), C = effluent substrate concentration (M·L−3), rs = reaction rate (M·L−3·T−1), Q = flow rate across the reactor (L3·T−1), V = operating volume of the reactor (L3). kms = maximum specific reaction rate coefficient (T−1), Ks = half velocity concentration (M·L−3), X0 = the viable cell concentration in the reactor (M·L−3), Y = The cell growth yield, kd = Endogenous decay coefficient (T−1) and t = Time (T).
And Equation (7)
C in C = ( V Q ) [ k ms C ( X 0 e ( Yk ms K S k d ) ) t K S + C + C 2 K I ]
where KI = coefficient of inhibition (M·L−3).
The Haldane model, which takes into account the inhibitory impact of the substrate exerts during biodegradation, is utilized to characterize the biodegradation kinetics in Equation (7). The vast spectrum of biological reactor behavior when a chemical and a biological treatment system are combined is therefore represented by quasi-second-order simple models in Equations (6) and (7). The relative toxicity of 4-CP concentration can be evaluated quantitatively under various experimental settings thanks to the inclusion of the Haldane equation in the kinetic model and the application of the inhibition coefficient Ki. The values of the kinetic parameters Ks, kms, and KI in the continuous process were calculated from the experimental data in a quasi-steady state and are provided as indicated in Table 2.
It was discovered that the bacteria’s specific growth rate increased as the concentration of 4-CP increased and that 4-CP acts as an inhibitor based on the fact that kms decreased as the original 4-CP concentration increased. The first-order maximum reaction rate coefficient, kms, in the chemical reactor was higher than the maximum specific reaction rate coefficient, kms, in the biological reactor. This shows that the chemical reactor destroyed 4-CP more quickly than the biological reactor. According to the results of the current investigation, removal rates were decreased at high 4-CP concentrations, and the Haldane substrate-inhibition model could be used to predict removal rates at the concentrations examined.
The half velocity constant (Ks) and maximal specific removal rate fell within the ranges described in the literature [29]. In order to find the model that best captures the intended process, the Michaelis–Menten and Haldane models were also evaluated.
When the initial 4-CP concentration was increased from its lower level of 50 mg·L−1 to its higher level of 200 mg·L−1 with H2O2, KI values in the range of 25–274 mg·L−1 were reported. Higher KI values signify a stronger inhibitory effect due to the C2/KI term’s contribution to the Haldane equation, which is sensitive to the substrate’s inhibitory characteristics. The substrate-inhibition constant, on the other hand, was substantially greater than Assadi et al. [29] had previously observed (KI = 609.7 mg·L−1). As a result, only a short period of time was needed to achieve the maximum removal rate from mixed-acclimated sludge, which suggests that it has a high tolerance for the harmful chemical 4-CP. This finding is consistent with that of Sahinkaya and Dilek [30] who have noted significant inhibition constants for phenol breakdown in mixed cultures. In contrast to the Haldane model, the Michaelis–Menten model was shown to have an extremely low substrate constant (Ks) as shown in Table 3. The Haldane model’s high KI suggests that the inhibition was quite strong, which indicates that the bacteria were likely thriving primarily on 4-CP intermediates rather than the genuine 4-CP. Additionally, the KI values were fairly comparable with those of other researchers [31,32,33,34]. The findings demonstrate that the Haldane model is more accurate since it takes into account the inhibition coefficient, which in this study’s circumstance could not have been disregarded.
Overall, the degradation rates of 4-CP in inoculum samples were 88.78%, 66.3%, 61.70%, 79.89%, and 94.71% for 50 mg·L−1, 100 mg·L−1, 50 mg·L−1 + H2O2, 100 mg·L−1 + H2O2, and 200 mg·L−1 + H2O2, respectively, in 200 h. Therefore, 200 mg·L−1 with 96% additional H2O2 provided the maximum removal effectiveness for 4-CP degradation.

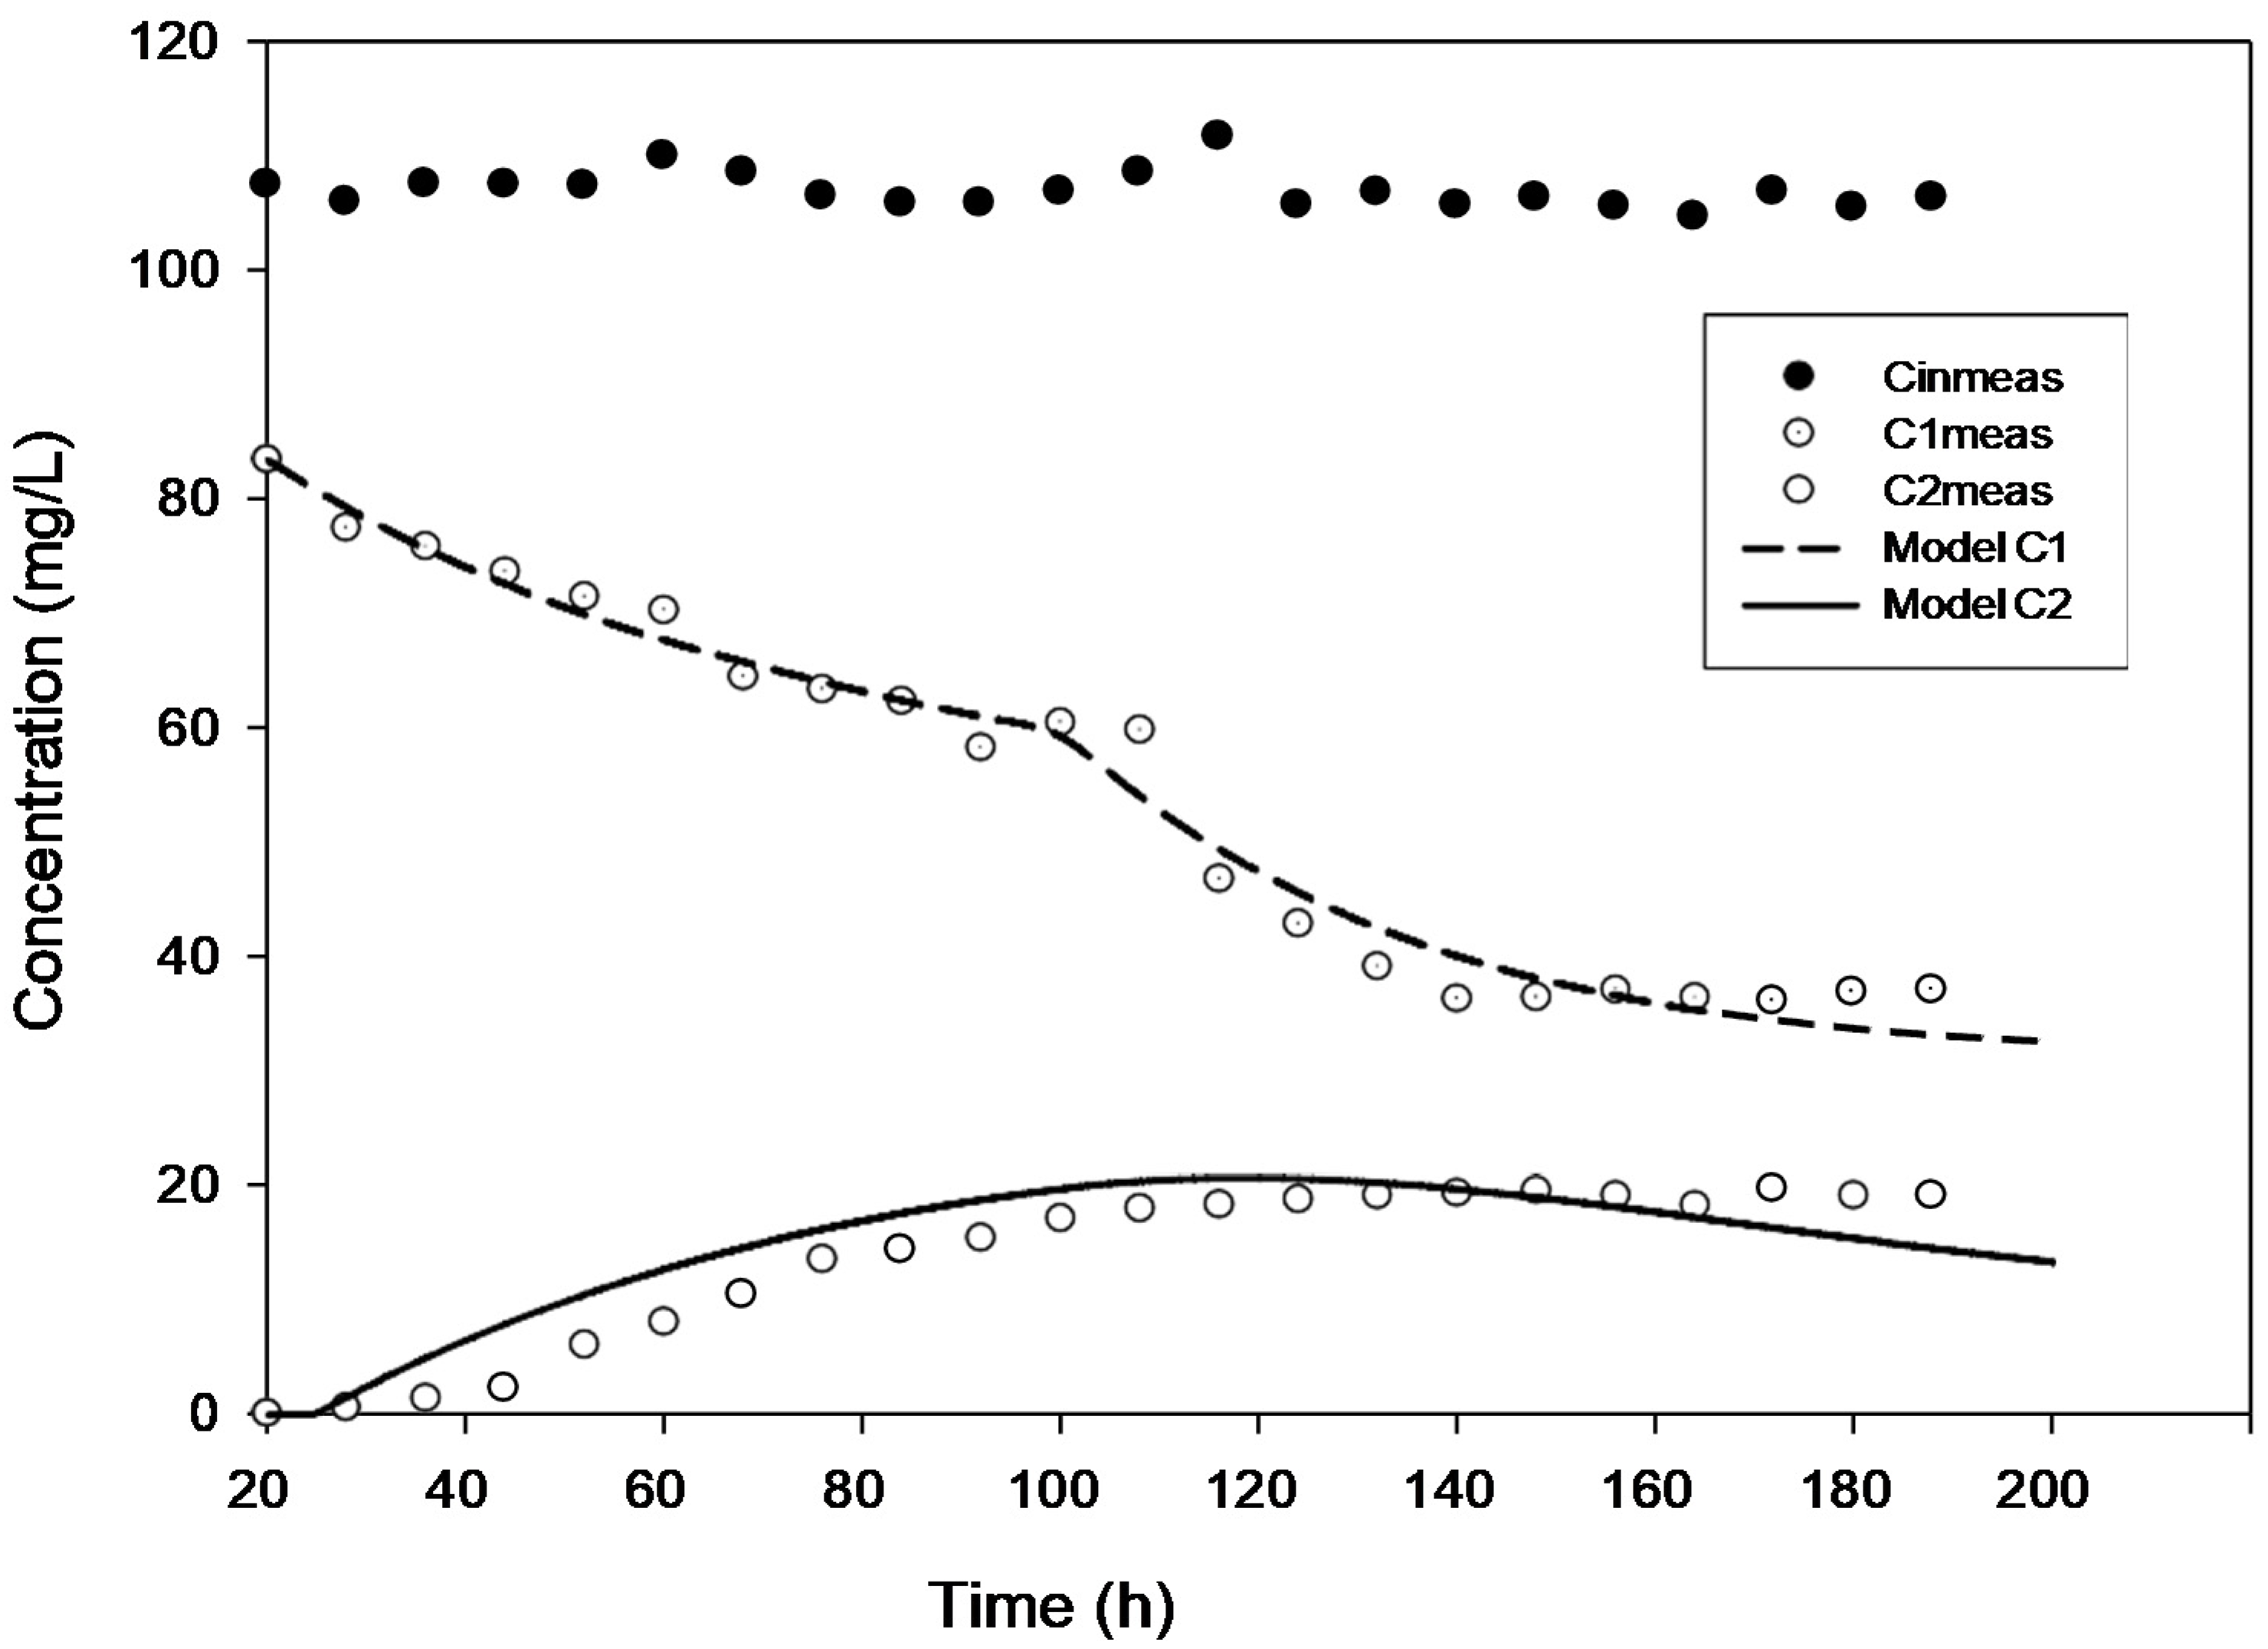
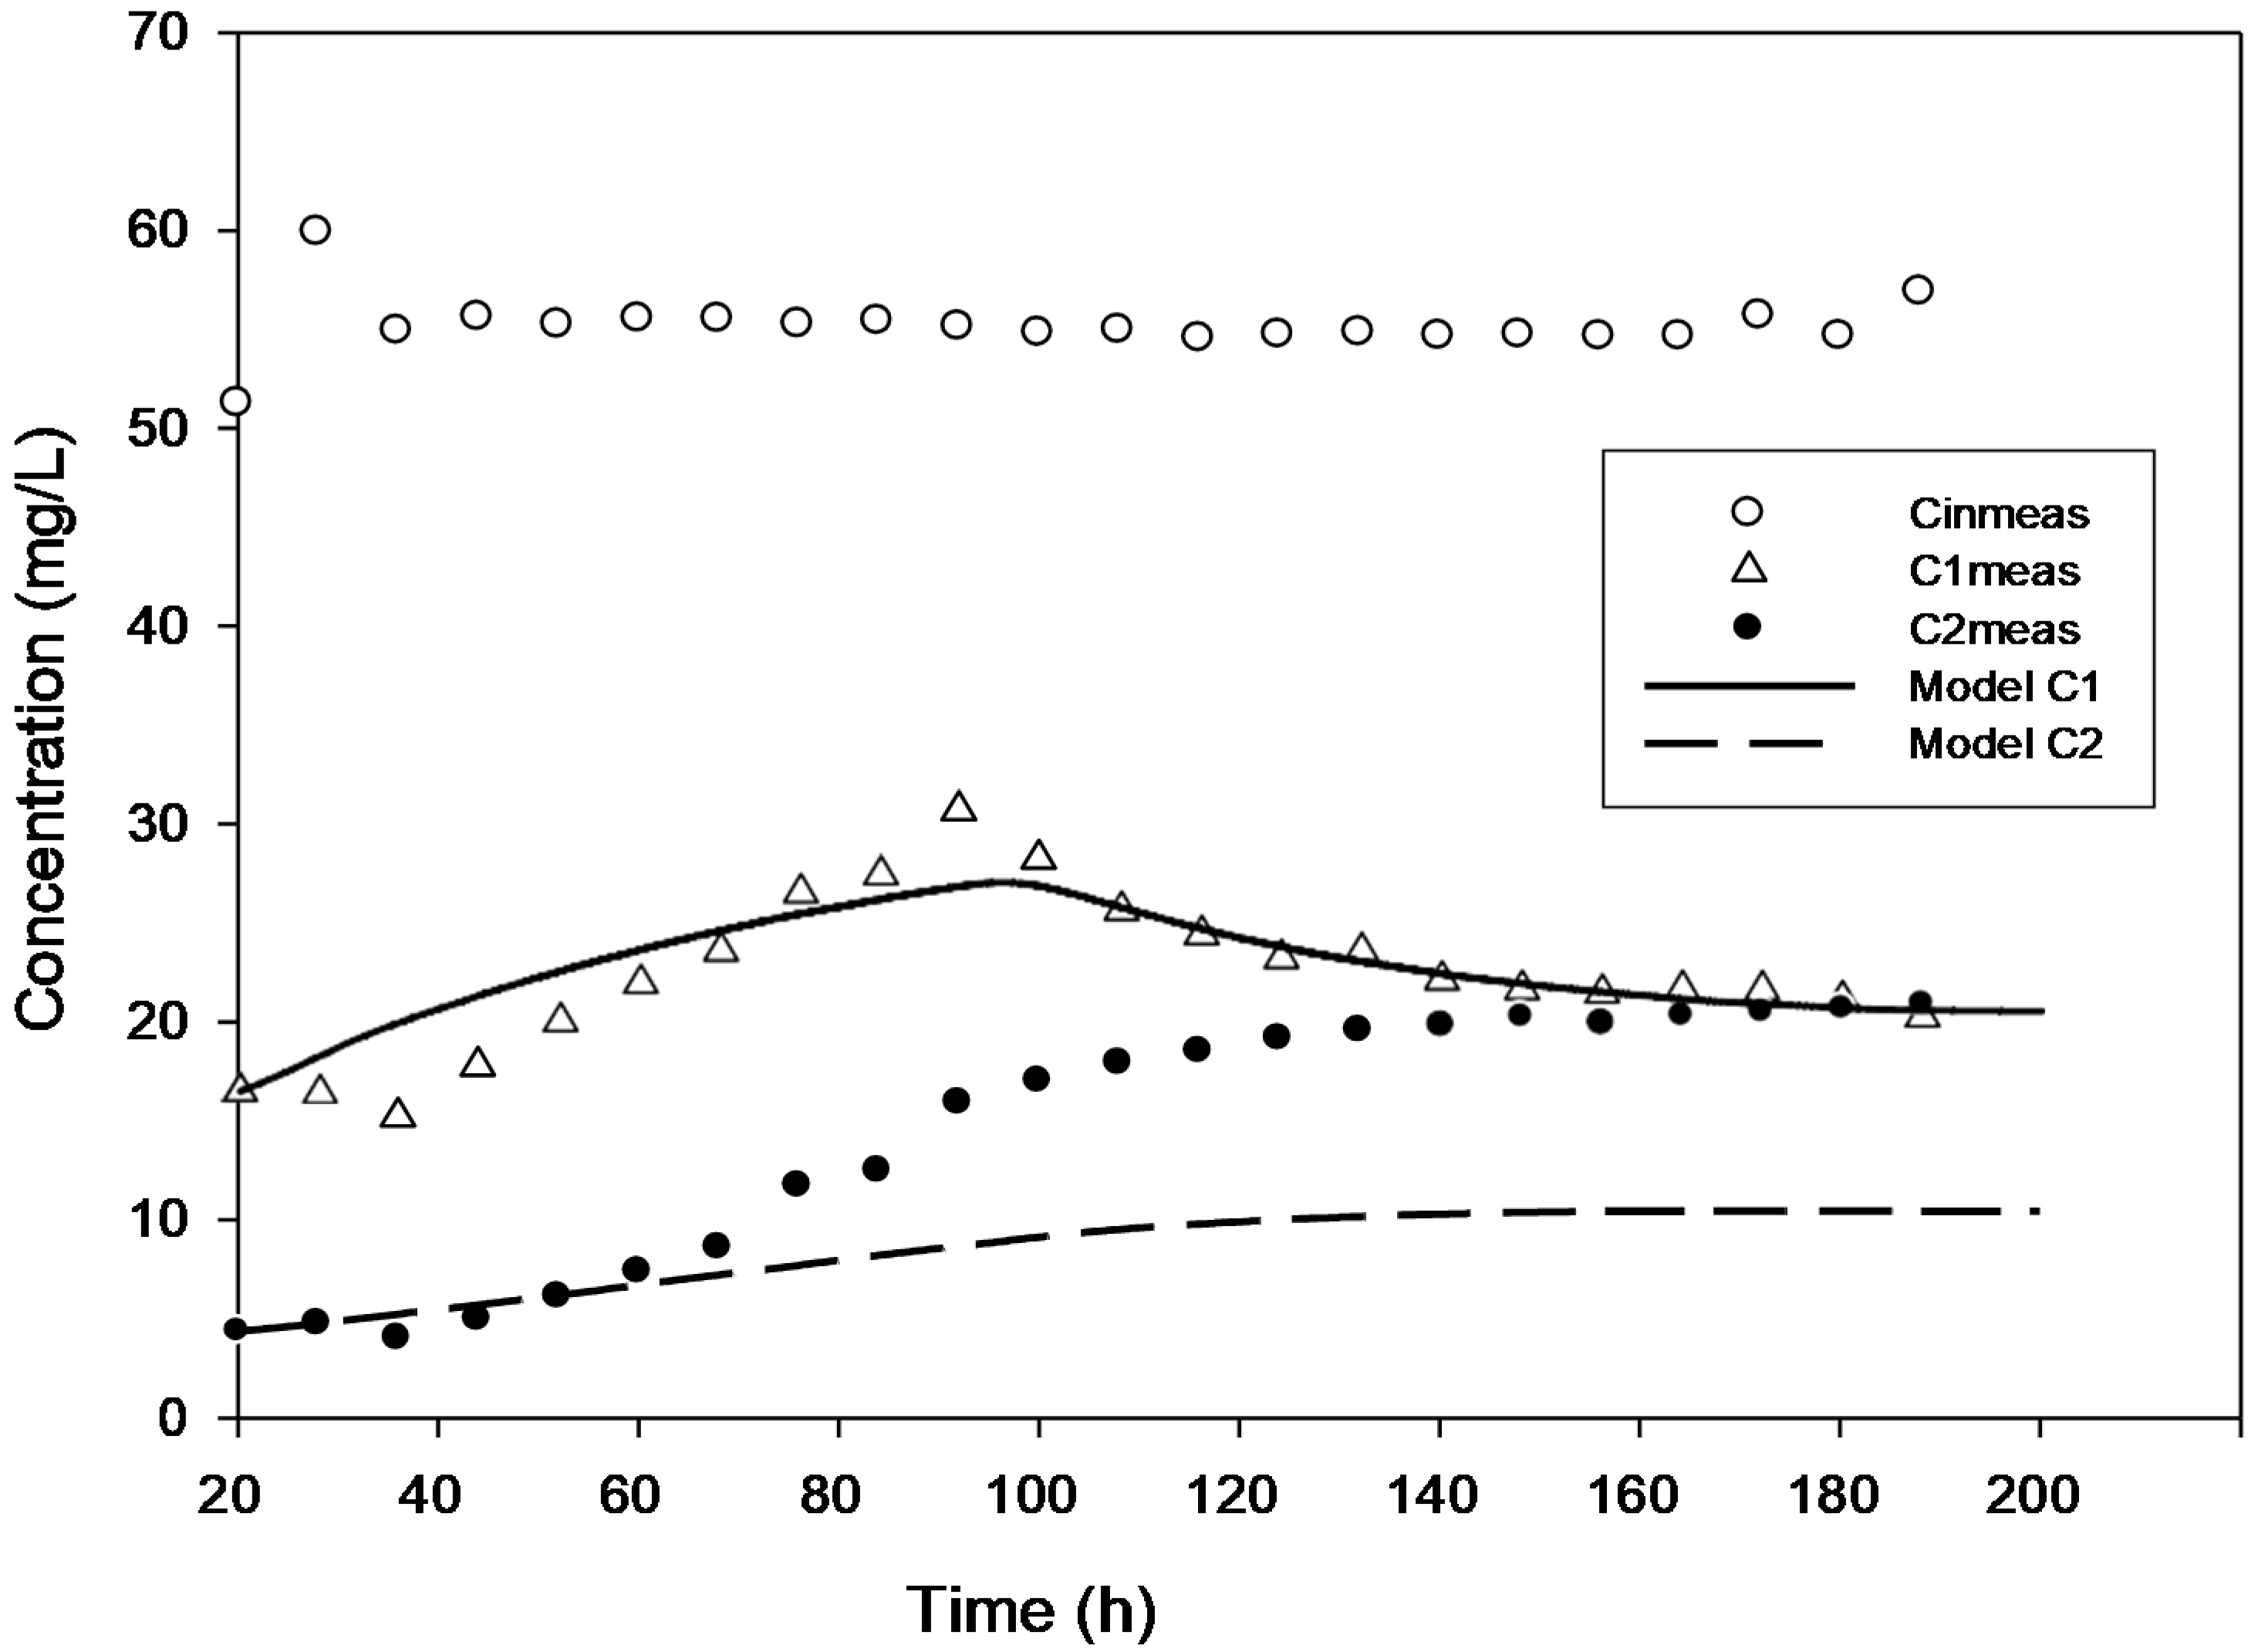
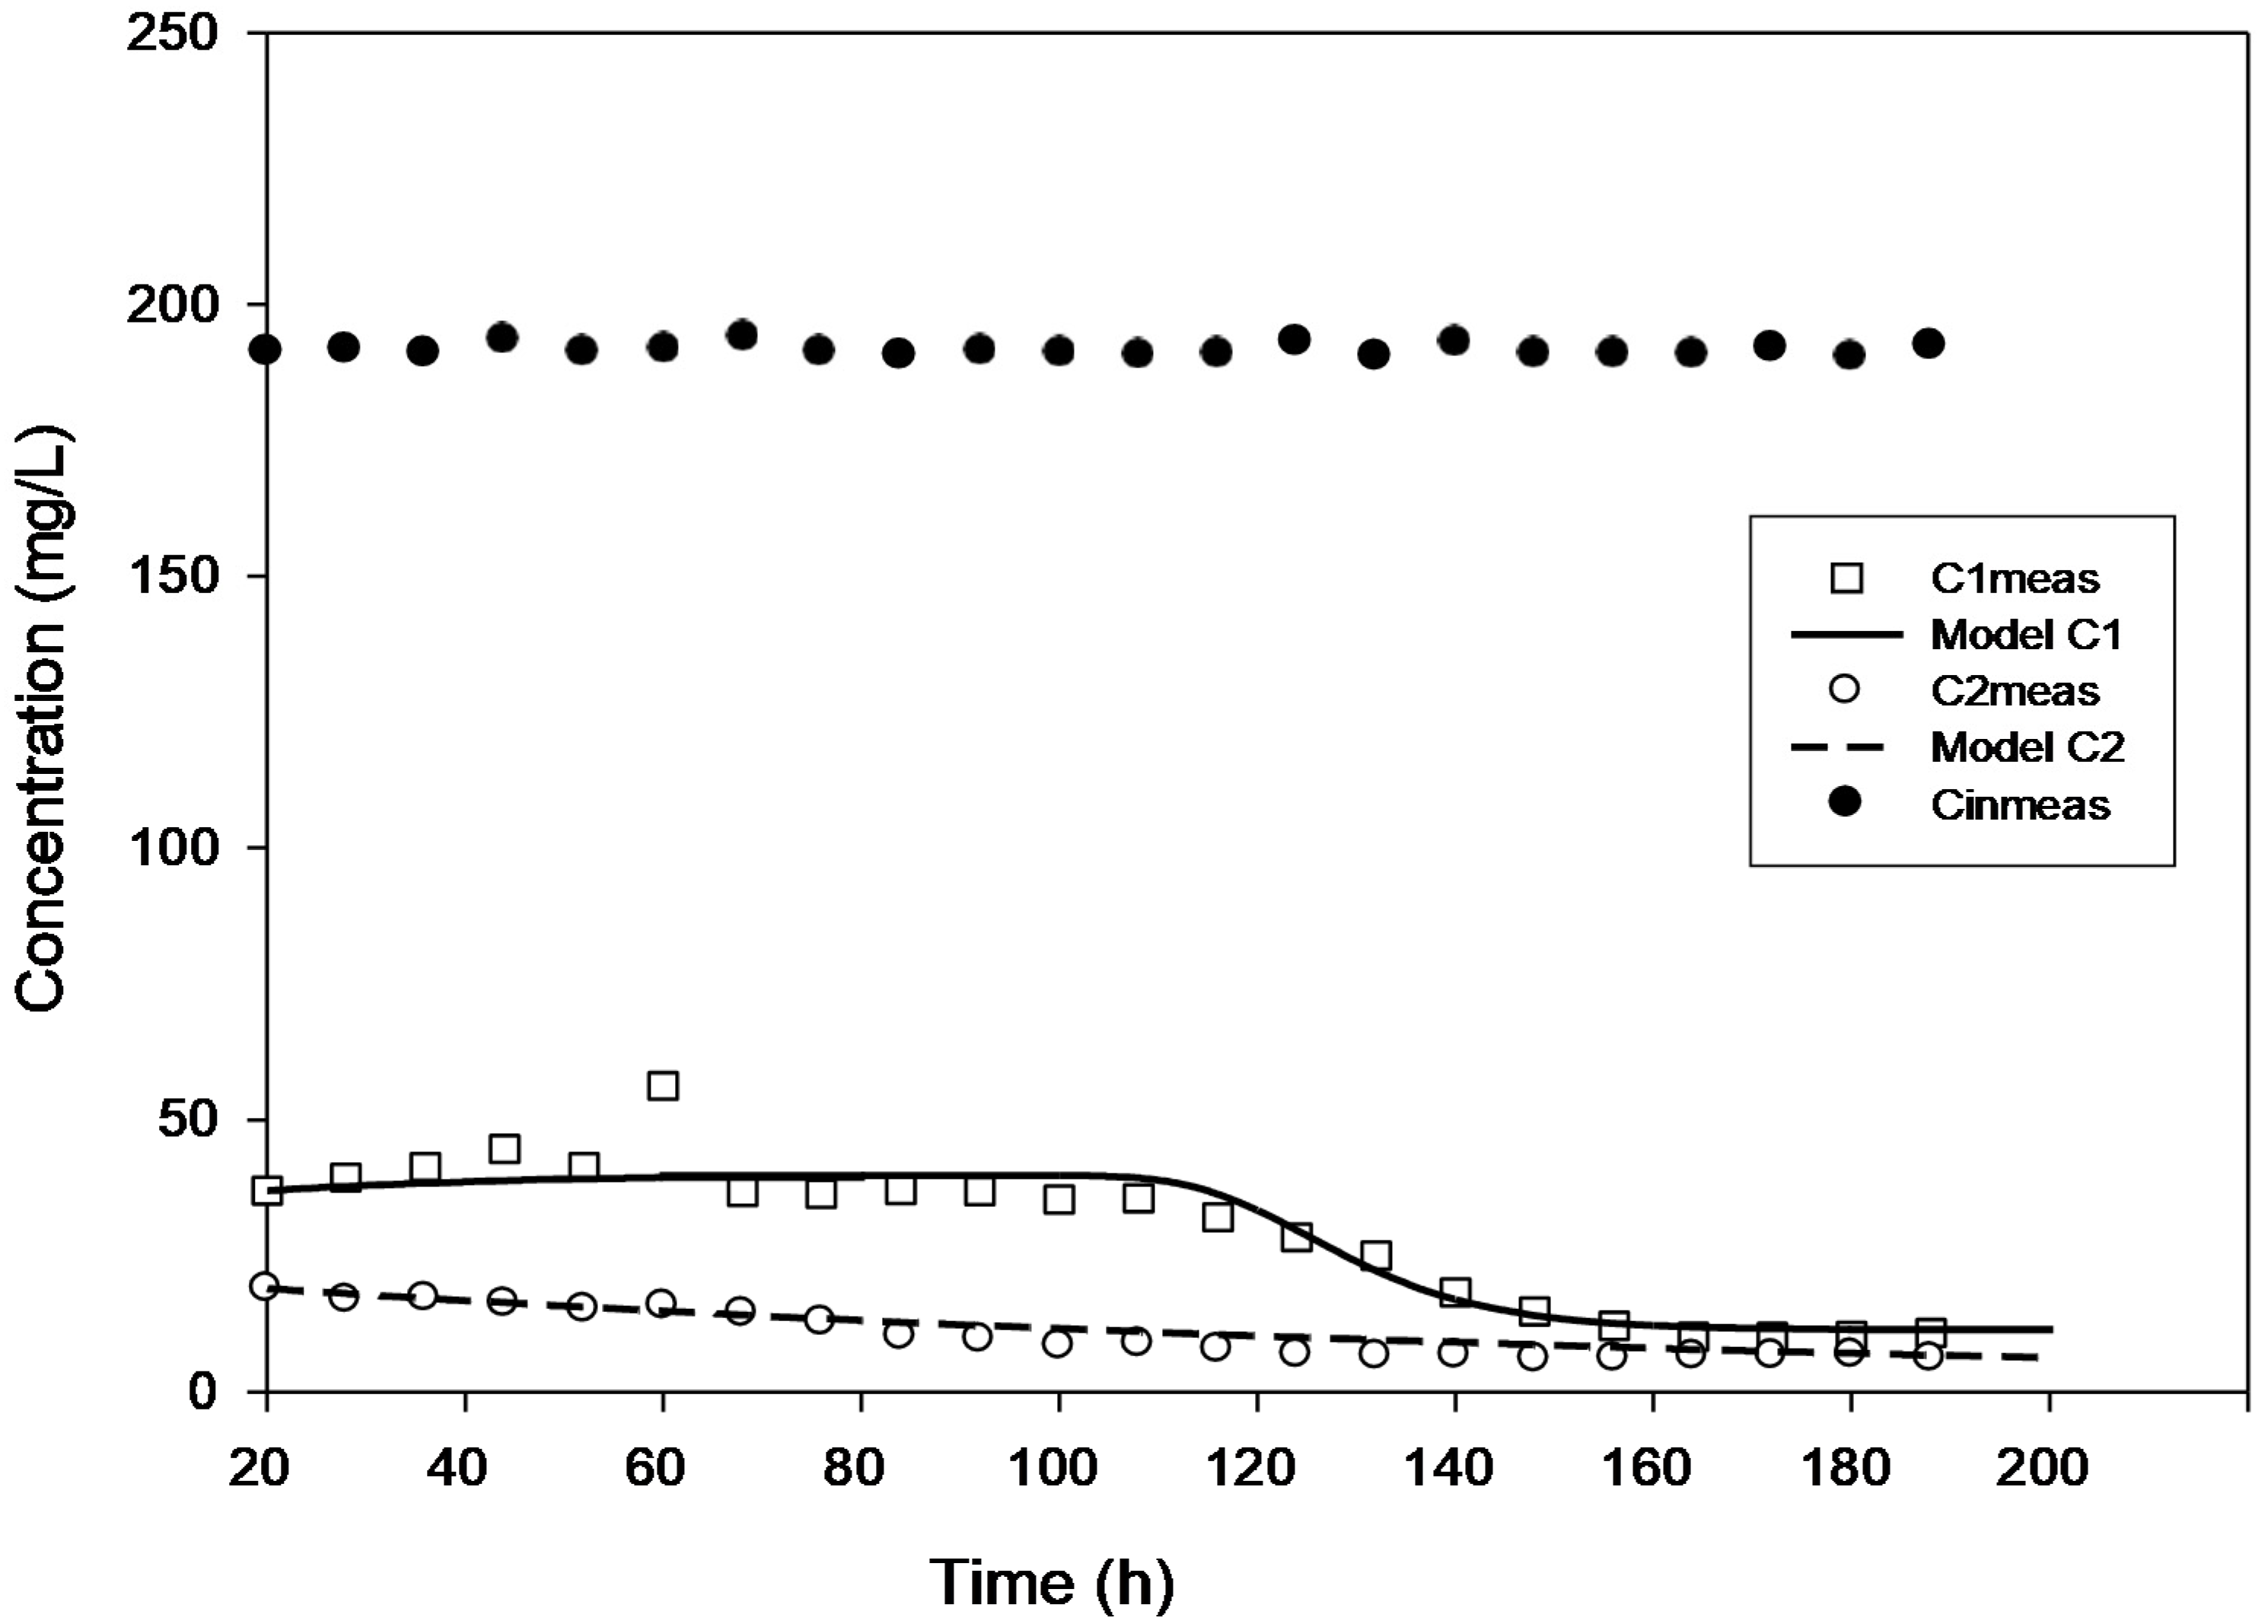
2.3. Developed Model Validations

True steady state conditions were not possible because the reactor was run at 2–3 HRTs every cycle. However, the reaction-rate kinetics were assessed under a transient condition using AQUASIM 2.0 software in order to create a more realistic modelling effort. The findings of comparing experimental and modelled concentration values for the various initial 4-CP concentrations utilized in the current study are shown in Figure 1, Figure 2, Figure 3, Figure 4 and Figure 5. These findings show that with the exception of Figure 3, where the model was unable to accurately monitor the 4-CP concentration profile, the model’s simulation of the experimental data and its fitting to those data are both satisfactory. A perfect stoichiometric chloride release was recorded, and prior research on the bio-degradation of chlorophenols revealed that the accumulation of intermediates was low [35]. This is supported by the experimental data’s reasonably strong fit (R2 > 0.97) given that the Haldane model was said to be insufficient in the presence of those metabolic intermediates [33].
In order to compare these data with the experimental results, an effort was made to match the researched kinetic parameter values on an optimized model. Both the Haldane model’s and the Michaelis-Menten model’s kinetic parameter values for the 4-CP degradation were examined using AQUASIM 2.0, and the results are listed in Table 4 and Table 5. As the original 4-CP concentration increased, we discovered that the values of kms, Ks and KI did exhibit a continuous trend of increasing. The results show that the Haldane model is more accurate since it considers the inhibition coefficient, which in the context of this investigation could not have been ignored. This outcome is fairly consistent with Oh et al’s experimental findings [33]. Overall, the degradations of 4-CP in inoculum samples were about 98%, 82%, 63%, 85%, and 97% for 50 mg·L−1, 100 mg·L−1, 50 mg·L−1 + H2O2, 100 mg·L−1 + H2O2, and 200 mg·L−1 + H2O2, respectively, in 200 h. Consequently, a 98% removal efficiency for 4-CP degradation was attained at 50 mg·L−1. However, the biodegradation rate was further enhanced when hydrogen peroxide (H2O2) was used as a liquid catalyst, increasing the rate to 200 mg·L−1 with a 97% overall efficiency. However, with an influent concentration of 4-chlorophenol of 300 mg·L−1 and higher, the system was unable to reach a quasi-steady-state condition and was instead characterized by a large loss of viable biomass because it was unable to scavenge OH radicals under the conditions of high H2O2 concentrations. According to Fu et al. [8], when there are too many unreacted (OH) radicals present and there is not enough organic feed, the radicals recombine to produce water with no beneficial interaction with the organics. This remark is in line with the findings of the study.

3. Materials and Methods

3.1. Experimental Set-Up

The combined chemical and biological treatment system employed in this study included a 22.8 L photoreaction chamber, followed by a 32.7 L biological reactor, both made of Perspex glass, a 9-Watt (W) UV lamp, a feed pump, and a UV-recycle pump. The biological reactor’s dimensions were 447 × 348 × 246 mm (L × B × H), whereas the photoreactor’s dimensions were 300 × 295 × 295 × 295 mm (L × B × H). The two reactors were run as CSTRs that were connected in series. It was anticipated that Reactor 2 will use phenolic compound breakdown products as carbon sources. A continuous influent feed was introduced at a flowrate of 0.200 Lh−1 to allow enough retention for degradation of 4-CP in only one pass through the reactor. Since the model had to account for these radicals, a degradation reaction was created. The functions of effluent C1 from reactor 1, a chemical reactor, and C2 from reactor 2, a biological reactor, are used to represent the reaction rates in Figure 6. Equations (1) and (8) are the formulas for the generalized rate equation for the degradation of 4-CP.
r 2 = ( k ms C 2 X 0 ) ( K S + C 2 + C 2 K I )
where: kms = Maximum specific reaction rate coefficient (T−1), C2 = Biological reactor calculated effluent concentration (M·L−3), X0 = Attached viable cells concentration in the reactor (M·L−3), KS = Half velocity concentration (M·L−3), KI = Coefficient of inhibition (M·L−3).
And
X = X 0 e ( Yk ms C 2 K s ) t
where Y = The cell growth yield and t = Time (T).

3.2. Operating Conditions for Chemical and Biological Reactors

One experimental run was operated under 4-CP feed concentration range from 50 to 1000 mg·L−1. The amount of H2O2 necessary to achieve the highest treatment efficiency is another crucial factor to take into account in AOPs and biological treatment procedures that are coupled. Using an H2O2 dose of 0.1 mg·L−1, the impact of oxidant H2O2 addition was studied over the loading range of 50 to 1000 mg·L−1. The breakdown of hydrogen peroxide into water and oxygen is a quick process that takes less than 5 min to complete. The authors did not anticipate finding considerable levels of H2O2 in the influent of the bioreactor because the retention time of the chemical reactor was significantly longer (about 6 h). The additional peroxide’s 0.1 mg·L−1 concentration was intended to be adequate for a speedy reaction and the elimination of all residuals in the effluent.

3.3. Chemicals, Media, and Microorganisms

A mixed culture of activated sludge bacteria was initially gathered from sand-drying beds at a neighboring wastewater treatment plant (WWTP) in Brits (Northwest Province). In a chemical reactor, the first stage of AOP dehalogenation was carried out (1st stage). Because of this, highly aromatic particular microorganisms are not necessarily required in the biological reactor’s second stage. This study did not include the selection and acclimatization step that would have produced a highly specialized culture.
The culture was grown in basal mineral medium (BMM), which was made by dissolving the following ingredients in one liter of distilled water: 0.54 g of NH4Cl, 10.74 g of NaH2PO4, 2.72 g of K2HPO4, 0.05 g of MgSO4, 7.95 g of FeSO4, 0.01 g of ZnCl2, 0.03 g of CuCl2, 0.01 g of NaBr, and 0.01 g of Na2MoO4. BMM is a media for the growth of bacteria. These flasks served as the biological reactor’s inoculation source once the bacteria entered their exponential growth phase. To begin the experiment with a healthy culture, 2 g·L−1 of D-glucose was added to the feed solution at starting. The reagents used in the experiments, which were of analytical purity and used as received, were supplied by MERCK Chemicals (Johannesburg, South Africa). Ultrapure water was used in all the experiments.

3.4. Chlorophenol Concentration Determination

Using HPLC (high-performance liquid chromatography, Waters Alliance 2695), the concentration of 4-CP was determined (Meadows Instrumentation Inc., Bristol, WI, USA). The Waters 626 LC System, 717 Plus Autosampler, and 996 Photodiode Array Detector made up the HPLC system. The column was a Waters PAH C18 Symmetry Column (4.6 mm 250 mm, 5 m). First, a 5 mL syringe filter with a 0.45 m pore size was used to filter the samples. An amount of 10 L was used for the injection, and a 254 nm wavelength was used for the detection. One percent acetic acid in water and one percent acetic acid in acetonitrile made up the mobile phases A and B, respectively. The Millennium 2010 Chromatography Manager translated the data. Filtered samples from the collection process were quantified using HPLC Waters 9625 after being passed through a 0.2 m mixed cellulose filter.

3.5. Simulation Analysis Using AQUASIM 2.0 Software

Data simulation with AQUASIM 2.0 uses the DASSL algorithm, which is based on the implicit (backward differencing), variable-step, variable-order Gear integration technique [36]. This method uses a system of partial and ordinary differential equations that are numerically integrated in time while also resolving the algebraic equations. Using conservative finite difference techniques, partial differential equations are spatially discretized [36]. The equation below was created using AQUASIM 2.0 and was obtained using differential conservation law. Additionally, the DASSL algorithm implementation permits the use of the full or branded Jacobian matrix Equation (10) in the solution of the nonlinear system of algebraic equations [36]:
p ̑ dt = j ̑ z + r ̑
Equation (10) is discretized as Equation (11):
d dt p ̑ ( x i , t ) = j ̑ num ( x i + 0.5 , t ) j ̑ num ( x i 0.5 , t ) x i + 0.5 x i 0.5 + r ̑ ( x i , t )
  J   _ = F y
  J   _ = [ f 1 x 1 f 1 dy f 2 x 2 df 2 dy ]

3.6. Parameter Estimation

Using the fourth-order Runge–Kutta method, AQUASIM 2.0’s mass balance was quantitatively assessed (RK-4). AQUASIM 2.0’s simplex method was used to determine the parameters by minimizing the Chi-square (χ2) values between the model data and the actual data. By minimizing Equation (13) with the constraints ( min , i i max , i ) , Aquasim’s estimate model parameters are represented by constant variables [36]. The weighted deviations between the measurements and the predicted model results are expressed as the sum of the squares in this equation [36]. A simplex method or secant algorithm is used to minimize Equation (14) [36].
x 2 ( ) = i = 1 n [ U meas , i U i ( ) α meas , i ] 2
where U meas , i = i-th measurement, α meas , i = standard deviation, U i ( ) = calculated value of the model variable corresponding to the i-th measurement and evaluated at the time and location of this measurement, = ( i , , m ) = model parameters; min , i   and   max , i = minimum and maximum constant variable representing i ; n = the number of points; and x 2 = the sum of the deviation for all the fit targets.

3.7. Sensitivity Analysis of the Estimated Parameters

Combining identifiability and uncertainty analysis allows AQUASIM 2.0 to address sensitivity analysis problems [36]. In order to determine if the model parameters can be estimated exclusively using the available data, identifiability analysis with AQUASIM 2.0 is used. This study also aims to calculate the uncertainty of the parameter estimations. This is accomplished by estimating the parameters’ correlation coefficients and standard errors during parameter estimation [36]. AQUASIM 2.0 distinguishes Equations (15)–(18):
δ y , a , a = y
δ y , r , a = 1 y y
δ y , a , r = p y
δ y , r , r = p y y
where y = arbitrary variable calculated by AQUASIM and ℓ = model parameter by a constant.
δ y = i = 1 m ( y i ) 2 δ i 2
where i = uncertainty model parameter, δ i = standard deviations, y ( i , , m ) = solution of the model equations for a given variable at a given location and time, δy = approximate standard deviation of the model result. The error contribution of each parameter is given as:
δ y err = y δ
AUASIM 2.0 calculates Equations (15)–(18) and (20) using the derivatives as follows:
y i y ( i + Δ i ) y ( i ) Δ i
where ∆ i = 1% of the standard deviation δ i , of the parameter ∆ i .

3.8. General Mass Balance of 4-Chlorophenol in CSTR

The mass balances of 4-CP were suggested in order to model the reaction and acquire the theoretical evolution of the concentrations of the dangerous reactive organic molecules. According to the findings of various authors [27,28], the following reasonable assumptions were made: (1) differential conversion at each pass in the photoreaction chamber, (2) properly mixed reaction medium, (3) reaction at the solid–liquid interface, (4) negligible photolysis, and (5) mass transfer constraints can be disregarded. Fogler [37] developed the generalized mass balance surrounding a fully mixed photoreactor, and Equation (22) can be used to express it for 4-CP:
V dC dt = Q ( C in C ) + r s V
where Cin = influent substrate concentration (M·L−3), C = effluent substrate concentration (M·L−3), rs = reaction rate (M·L−3·T−1), Q = flow rate across the reactor (L3·T−1), and V = operating volume of the reactor (L3). Therefore, during steady-state operation, the left-hand derivative approaches zero i.e., V· dC dt 0 . As a result, Equation (22) simplifies to Equation (23):
r s = ( Q V ) ( C in C )
Now, considering the single-reactant kinetics in the photoreaction chamber, we assume first order rate kinetics, −rs = ks.C, such that, the rate constant can be estimated during steady-state operation from the influent and effluent concentration as shown in Equation (24):
C C in = 1 1 + k s τ
where τ = the hydraulic retention time (V/Q) (T) and ks = first-order maximum reaction rate coefficient (T−1).
Two reaction rate models, however, for the biological reactor, were assessed. The first was the reaction without inhibition as given by the Michaelis-Menten substrate utilization rate kinetics.
r s = k ms CX K s + C and the reaction with substrate level inhibition, which was widely used to evaluate the growth kinetics when the cells grew on a single substrate with the Briggs and Haldane model [38]: r s = k ms CX K s + C + C 2 K I , where kms = maximum specific reaction rate coefficient (T−1), Ks = half velocity concentration (M·L−3), KI = coefficient of inhibition (M·L−3), and X = the viable cell concentration in the reactor (M·L−3). The reaction rate is substituted into the reactor mass balance in Equation (22):
V dC dt = Q ( C in C ) + ( k ms CX K s + C ) V
which resolves to:
X τ C in C = ( K s k ms ) 1 C + 1 k ms
The cell production in the reactor is proportional to the substrate used by the bacteria there, as shown by Equation (26) derived from the cell mass balance across the reactor, i.e., X = mass of cells per mass of substrate utilized. Only if hydraulic retention time (HRT) is brief enough to make cell death inside the reactor insignificant does Equation (26)’s expression hold true. However, as can be shown in Equation (27), the mass balance equation that resulted from the replacement of the inhibitory kinetics was more complicated:
V dC dt = Q ( C in C ) + ( k ms CX K s + C + C 2 K I ) V
which resolves to:
C in C = ( V Q ) ( k ms C . X K s + C + C 2 K I ) V
Equation (28) can be solved numerically.

4. Conclusions

The modelling of the system behavior was successfully carried out in a combined chemical and biological treatment system under 4-CP concentrations loading range of 50–1000 mg·L−1. Optimized operating parameters were achieved using AQUASIM 2.0 software. Moreover, it led to an overall degradation efficiency of 98% and 97% at a 50 mg·L−1 and 200 mg·L−1 with added H2O2 feed concentrations respectively, which is significantly higher as compared to the photocatalytic performance of chlorophenols degradation reported in previous studies. The results indicated that the Monod model with inhibition coefficient (Haldane model) well described the 4-CP degradation. The findings demonstrate that the Haldane model is more accurate since it takes into account the inhibition coefficient, which in this study’s circumstance could not have been disregarded. Moreover, the degradation kinetics values and the experimental results matched well with a good degree of agreement (R2 = 0.998). The results of the current study are encouraging enough to support additional investigation utilizing continuous or semi-continuous systems. They may also be useful for wastewater compositions containing 4-CP and other chlorinated monophenols and can be utilized as a starting point for design calculations that could eventually lead to the scaling up of continuous combined chemical and biological treatment system treating 4-CP in industrial waste streams.

Author Contributions

S.M.; writing–original draft preparation, conceptualization, methodology, AQUASIM 2.0 software, validation, and formal analysis, E.N.-C.; writing–review and editing, funding acquisition. All authors have read and agreed to the published version of the manuscript.

Funding

This research received no external funding.

Data Availability Statement

Not Applicable.

Conflicts of Interest

The authors declare no conflict of interest.

Nomenclature

ParameterUnitParameter description
a(T)Kinetic parameter constant for accumulation of (OH) radicals
b(T)Kinetic parameter constant for accumulation of (OH) radicals
c(T)Kinetic parameter constant for accumulation of (OH) radicals
Cin(M·L−3)Influent targeted substrate concentration
C1(M·L−3)Chemical reactor calculated effluent concentration
C2(M·L−3)Biological reactor calculated effluent concentration
C(M·L−3)Concentration at steady-state
Cohmax(M·L−3)Initial concentration of (OH) radicals
Coh(M·L−3)Calculated concentration of (OH) radicals
V(L3)Reactor volume
Q(L3·T−1)Flow rate across the reactor
kms(T−1)Maximum specific reaction rate coefficient
Ks(M·L−3)Half velocity concentration
KI(M·L−3)Coefficient of inhibition
X0(M·L−3)Attached viable cells concentration in the reactor
Y The cell growth yield
t0(T)Initial boundary value for accumulation of (OH) radicals
X(g)Mass of cells per mass of substrate utilized.
kd(T−1)Endogenous decay coefficient
Symbols
U meas , i i-th measurement
α meas , i standard deviation
U i ( ) calculated value of the model variable corresponding to the i-th
measurement and evaluated at the time and location of this measurement
= ( i , , m ) model parameters
min , i , max , i minimum and maximum constant variable representing
i n number of points
x 2   the sum of the deviation for all the fit targets
i   uncertainty model parameter
δistandard deviations
y ( i , , m ) solution of the model equations for a given variable at a given location and time
δ y approximate standard deviation of the model result
y arbitrary variable calculated by AQUASIM
model parameter by a constant
4-CP4-chlorophenol

References

  1. Wang, J.; Ma, X.; Liu, S.; Sun, P.; Fan, P.; Xia, C. Biodegradation of phenol and 4-chlorophenol by Candida tropicalis W1. Procedia Environ. Sci. 2012, 16, 299–303. [Google Scholar] [CrossRef]
  2. Mohammadi, M.; Sabbaghi, S. Photo-catalytic degradation of 2,4-DCP wastewater using MWCNT/TiO2 nano-composite activated by UV and solar light. Environ. Nanotechnol. Monit. Manag 2014, 1, 24–29. [Google Scholar] [CrossRef]
  3. Sgherza, D.; Pentassuglia, S.; Altieri, V.; Mascolo, G.; De Sanctis, M.; Di Iaconi, C. Integrating biodegradation and ozone-catalysed oxidation for treatment and reuse of biomass gasification wastewater. J. Water Process Eng. 2021, 43, 102297. [Google Scholar] [CrossRef]
  4. Patel, N.; Shahane, S.; Bhunia, B.; Mishra, U.; Chaudhary, V.K.; Srivastav, A.L. Biodegradation of 4-chlorophenol in batch and continuous packed bed reactor by isolated Bacillus subtilis. J. Environ. Manag. 2021, 301, 113851. [Google Scholar] [CrossRef]
  5. Zhang, J.; Liu, X.; Xu, Z.; Chen, H.; Yang, Y. Degradation of chlorophenols catalyzed by laccase. Int. Biodeterior. Biodegradation 2008, 61, 351–356. [Google Scholar] [CrossRef]
  6. Hamdaoui, O.; Naffrechoux, E. Sonochemical and photosonochemical degradation of 4-chlorophenol in aqueous media. Ultrason. Sonochemistry 2008, 15, 981–987. [Google Scholar] [CrossRef]
  7. Ahmadi, M.; Samarbaf, S.; Golshan, M.; Jorfi, S.; Ramavandi, B. Data on photo-catalytic degradation of 4- chlorophenol from aqueous solution using UV/ZnO/persulfate. Data Brief 2018, 20, 582–586. [Google Scholar] [CrossRef]
  8. Fu, T.; Gong, X.; Guo, J.; Yang, Z.; Liu, Y. Zn-CNTs-Cu catalytic in-situ generation of H2O2 for efficient catalytic wet peroxide oxidation of high-concentration 4-chlorophenol. J. Hazard. Mater. 2020, 401, 123392. [Google Scholar] [CrossRef]
  9. Gomez, M.; Murcia, M.D.; Christofi, N.; Gómez, E.G.; Gómez, J. Photodegradation of 4-chlorophenol using XeBr, KrCl and Cl2 barrier-discharge excilamps: A comparative study. Chem. Eng. J. 2010, 158, 120–128. [Google Scholar] [CrossRef]
  10. Rodriguez-Narvaez, O.M.; Peralta-Hernandez, J.M.; Goonetilleke, A.; Bandala, E.R. Treatment technologies for emerging contaminants in water: A review. Chem. Eng. J. 2017, 323, 361–380. [Google Scholar] [CrossRef] [Green Version]
  11. Wang, J.; Bai, Z. Fe-based catalysts for heterogeneous catalytic ozonation of emerging contaminants in water and wastewater. Chem. Eng. J. 2017, 312, 79–98. [Google Scholar] [CrossRef]
  12. Deng, J.; Wu, G.; Yuan, S.; Zhan, X.; Wang, W.; Hu, Z. Ciprofloxacin degradation in UV/chlorine advanced oxidation process: Influencing factors, mechanisms and degradation pathways. J. Photochem. Photobiol. A 2019, 371, 151–158. [Google Scholar] [CrossRef]
  13. Wang, J.; Wang, S. Preparation, modification and environmental application of biochar: A review. J. Clean. Prod. 2019, 227, 1002–1022. [Google Scholar] [CrossRef]
  14. Long, M.; Zeng, C.; Wang, Z.; Xia, S.; Zhou, C. Complete dechlorination and mineralization of para-chlorophenol (4-CP) in a hydrogen-based membrane biofilm reactor (MBfR). J. Clean. Prod. 2020, 276, 123257. [Google Scholar] [CrossRef]
  15. Zhang, K.; Yang, W.; Liu, Y.; Zhang, K.; Chen, Y.; Yin, X. Laccase immobilized on chitosan-coated Fe3O4 nanoparticles as reusable biocatalyst for degradation of chlorophenol. J. Mol. Struct. 2020, 1220, 128769. [Google Scholar] [CrossRef]
  16. Patidar, R.; Srivastava, V.C. Mechanistic and kinetic insights of synergistic mineralization of ofloxacin using a sono-photo hybrid process. Chem. Eng. J. 2020, 403, 125736. [Google Scholar] [CrossRef]
  17. Munoz, M.; de Pedro, Z.M.; Casas, J.A.; Rodriguez, J.J. Improved wet peroxide oxidation strategies for the treatment of chlorophenols. Chem. Eng. J. 2013, 228, 646–654. [Google Scholar] [CrossRef]
  18. Sarria, V.; Parra, S.; Adler, N.; Péringer, P.; Benitez, N.; Pulgarin, C. Recent developments in the coupling of photoassisted and aerobic biological processes for the treatment of biorecalcitrant compounds. Catal. Today 2002, 76, 301–315. [Google Scholar] [CrossRef]
  19. González, L.F.; Sarria, V.; Sanchez, O.F. Degradation of chlorophenols by sequential biological-advanced oxidative process using Trametes pubescens and TiO2/UV. Bioresour. Technol. 2010, 101, 3493–3499. [Google Scholar] [CrossRef] [PubMed]
  20. Gaya, U.I.; Abdullah, A.H.; Zainal, Z.; Hussein, M.Z. Photocatalytic treatment of 4-chlorophenol in aqueous ZnO suspensions: Intermediates, influence of dosage and inorganic anions. J. Hazard. Mater. 2009, 168, 57–63. [Google Scholar] [CrossRef]
  21. Camera-Roda, G.; Santarelli, F.; Martin, C.A. Design of photocatalytic reactors made easy by considering the photons as immaterial reactants. Sol. Energ. 2005, 79, 343–352. [Google Scholar] [CrossRef]
  22. Malato, S.; Fernandez-Ibañez, P.; Maldonado, M.I.; Blanco, J.; Gernjak, W. Decontamination and disinfection of water by solar photocatalysis: Recent overview and trends. Catal. Today 2009, 147, 1–59. [Google Scholar] [CrossRef]
  23. Wade, M.J.; Pattinson, R.W.; Parker, N.G.; Dolfing, J. Emergent behavior in a chlorophenol-mineralising three-tiered microbial ‘food web’. J. Theor. Biol. 2016, 389, 171–186. [Google Scholar] [CrossRef]
  24. Yang, K.; Zhao, Y.; Ji, M.; Li, Z.; Zhai, S.; Zhou, X.; Wang, Q.; Wang, C.; Liang, B. Challenges and opportunities for the biodegradation of chlorophenols: Aerobic, anaerobic and bioelectrochemical processes. Water Res. 2021, 193, 116862. [Google Scholar] [CrossRef] [PubMed]
  25. Albarrán, G.; Mendoza, E. Radiolysis induced degradation of 1,3-dichlorobenzene and 4-chlorophenol in aqueous solution. Radiat. Phys. Chem. 2020, 109318. [Google Scholar] [CrossRef]
  26. Ghaly, M.Y.; Hartel, G.; Mayer, R.; Haseneder, R. Photochemical oxidation of p-chlorophenol by UV/H2O2 and photo-Fenton process. A comparative study. Waste Manag. 2001, 21, 41–47. [Google Scholar]
  27. Tolosana-Moranchel, A.; Manassero, A.; Satuf, M.L.; Alfano, A.M.; Casas, J.A.; Bahamonde, A. TiO2-rGO photocatalytic degradation of an emerging pollutant: Kinetic modelling and determination of intrinsic kinetic parameters. J. Environ. Chem. Eng. 2019, 7, 103406. [Google Scholar] [CrossRef]
  28. Satuf, M.L.; Brandi, R.J.; Cassano, A.E.; Alfano, O.M. Photocatalytic degradation of 4-chlorophenol: A kinetic study. Appl. Catal. B Environ. 2008, 82, 37–49. [Google Scholar] [CrossRef]
  29. Assadi, A.; Alimoradzadeh, R.; Movahedyan, H.; Amin, M.M. Intensified 4-chlorophenol biodegradation in an aerobic sequencing batch reactor: Microbial and kinetic properties evaluation. Environ. Technol. Innov. 2020, 21, 101243. [Google Scholar] [CrossRef]
  30. Sahinkaya, E.; Dilek, F.B. Biodegradation of 4-CP and 2.4-DCP mixture in a rotating biological reactor (RBC). Biochem. Eng. J. 2006, 31, 141–147. [Google Scholar] [CrossRef]
  31. Sharma, S.; Mukhopadhyay, M.; Murthy, Z.V.P. Rate parameter estimation for 4-chlorophenol degradation by UV and organic oxidants. J. Ind. Eng. Chem. 2012, 18, 249–254. [Google Scholar] [CrossRef]
  32. Czaplicka, M. Photo-degradation of chlorophenols in the aqueous solution. J. Hazard. Mater. 2006, 134, 45–59. [Google Scholar] [CrossRef]
  33. Oh, W.D.; Lim, P.E.; Seng, S.E.; Sujari, A.N.A. Kinetic modeling of bioregeneration of chlorophenol-loaded granular activated carbon in simultaneous adsorption and biodegradation processes. Bioresour. Technol. 2012, 114, 179–187. [Google Scholar] [CrossRef] [PubMed]
  34. Konya, I.; Eker, S.; Kargi, F. Mathematical modelling of 4-chlorophenol inhibition on COD and 4-chlorophenol removals in an activated sludge unit. J. Hazard. Mater. 2007, 143, 233–239. [Google Scholar] [CrossRef]
  35. Kayan, I.; Oz, N.A.; Kantar, C. Comparison of treatability of four different chlorophenol-containing wastewater by pyrite-Fenton process combined with aerobic biodegradation: Role of sludge acclimation. J. Environ. Manag. 2020, 279, 111781. [Google Scholar] [CrossRef] [PubMed]
  36. Rechert, P. Computer Program for the Identification and Simulation of Aquatic Systems, AQUASIM 2.0: User Manual; Swiss Federal Institute for Environmental Science and Technology (EAWAG): Dübendorf, Switzerland, 1998. [Google Scholar]
  37. Fogler, H.S. Elements of Chemical Reaction Engineering, 3rd ed.; Pearson Education Limited: Hongkong, China, 1999; ISBN 9780135317167. [Google Scholar]
  38. Briggs, G.E.; Haldane, J.B.S. A Note on the Kinetics of Enzyme Action. Biochem. J. 1925, 19, 338–339. [Google Scholar] [CrossRef] [Green Version]
Figure 1. Model validation for the concentration of 50 mg·L−1.
Catalysts 12 00965 g001
Figure 2. Model validation for the concentration of 100 mg·L−1.
Catalysts 12 00965 g002
Figure 3. Model validation for the concentration of 50 mg·L−1 with added H2O2.
Catalysts 12 00965 g003
Figure 4. Model validation for the concentration of 100 mg·L−1 with added H2O2.
Catalysts 12 00965 g004
Figure 5. Model validation for the concentration of 200 mg·L−1 with added H2O2.
Catalysts 12 00965 g005
Figure 6. Schematic representation of the combined system.
Catalysts 12 00965 g006
Table 1. The operating conditions for the chemical reactor.
Conc
(mg·L−1)
Cin
(mg·L−1)
Cout
(mg·L−1)
ηa (mg·L−1)b (h)ct0 (h)kms (h−1)Cohmax
(mg·L−1)
50556.1788.78377.8710.73877.07974.860.046648.78
10010736.0266.34243.95302.80414.5417.850.057414.27
50 + H2O25521.1961.47100.21508.46690.72137.850.064249.39
100 +H2O210621.3279.899.666.04104.818.070.08210.13
200 + H2O219110.1194.711.55 × 10−52.19 × 10−51.25 × 10−51.29 × 10−50.0892.30
Table 2. Kinetic parameter estimation for the biological reactor at different initial concentrations using measured data (Haldane model).
Conc (mg·L−1)Cin (mg·L−1)Cout (mg·L−1)Removal
Efficiency
KI (mg·L−1)kms (h−1)Ks (mg·L−1)χ2 (mg·L−1)R2
506.171.1481.52250.18454050.976
10036.0219.0147.221440.22874300.997
50 + H2O221.1920.363.921500.22684110.995
100 +H2O221.3216.1024.482590.328234230.991
200 + H2O210.116.0040.652740.316304680.994
Table 3. Kinetic parameter estimation for the biological reactor at different initial concentrations using measured data (Michaelis–Menten model).
Conc (mg·L−1)Cin (mg·L−1)Cout (mg·L−1)Removal
Efficiency
kms (h−1)Ks (mg·L−1)χ2 (mg·L−1)R2
506.171.1481.520.0460.944050.993
10036.0219.0147.220.0572.934300.994
50 + H2O221.1920.363.920.0643.984110.995
100 +H2O221.3216.1024.480.0823.714230.999
200 + H2O210.116.0040.650.0893.844680.989
Table 4. Kinetic parameter estimation for the biological reactor at different initial concentrations using AQUASIM (Haldane model).
Conc (mg·L−1)Cin (mg·L−1)Cout (mg·L−1)Overall
Efficiency
KI (mg·L−1)kms (h−1)Ks (mg·L−1)χ2 (mg·L−1)R2
50551.1498%1650.18184050.921
10010719.0182%2840.205104300.995
50 + H2O25520.3663%2900.221114110.991
100 +H2O210616.1085%3990.260264230.989
200 + H2O21916.0097%4240.320334680.992
Table 5. Kinetic parameter estimation for the biological reactor at different initial concentrations using AQUASIM (Michaelis-Menten model).
Conc (mg·L−1)Cin (mg·L−1)Cout (mg·L−1)Overall
Efficiency
kms (h−1)Ks (mg·L−1)χ2 (mg·L−1)R2
50551.1498%0.0810.964050.93
10010719.0182%0.0921.204300.94
50 + H2O25520.3663%0.0991.334110.95
100 +H2O210616.1085%0.1173.134230.99
200 + H2O21916.0097%0.1443.984680.98
Publisher’s Note: MDPI stays neutral with regard to jurisdictional claims in published maps and institutional affiliations.

