Article

Effect of Platinum Precursor on the Properties of Pt/N-Graphene Catalysts in Formic Acid Decomposition

by
Vladimir V. Chesnokov
*,
Vladimir V. Kriventsov
,
Igor P. Prosvirin
and
Evgeny Yu. Gerasimov
Boreskov Institute of Catalysis SB RAS, Prospekt Akademika Lavrentieva 5, 630090 Novosibirsk, Russia
*
Author to whom correspondence should be addressed.
Catalysts 2022, 12(9), 1022; https://doi.org/10.3390/catal12091022
Submission received: 8 August 2022 / Revised: 31 August 2022 / Accepted: 5 September 2022 / Published: 8 September 2022
(This article belongs to the Special Issue Advances in Graphene/Nanocomposites for Catalytic Applications)

Abstract

:
Properties of a novel catalytic material, Pt/N-graphene, in gas-phase decomposition of formic acid to obtain pure hydrogen were studied. The graphene powder doped with nitrogen atoms was used as the carbon support. The following methods were used to characterize the synthesized catalysts: X-ray photoelectron spectroscopy (XPS), high-resolution transmission electron microscopy (HRTEM), EXAFS and CO chemisorption. It was determined that the platinum precursor substantially affects the state of the metal in the Pt/N-graphene catalysts. When Pt(NO3)4 was used as the precursor, platinum on the catalyst surface was in the form of nanocrystals. Meanwhile, the use of H2PtCl6 led to the formation of atomically dispersed platinum stabilized on the surface of N-graphene. Carbon structures containing defects in the graphene layer surrounded by four nitrogen atoms had strong interactions with platinum atoms and acted as the sites where atomic platinum was stabilized.

1. Introduction

Hydrogen is a prospective fuel due to its possible applications, including fuel cells. However, several existing technical problems related to the storage and transportation of hydrogen limit its wide use. Various methods based on physical or chemical storage have been developed to solve these problems. The physical methods assume storage of molecular hydrogen in vessels at high pressure and low temperatures or hydrogen adsorption on high surface area materials, like porous carbon. However, both of these methods lead to large energy losses; therefore, such storage may appear inefficient. The chemical method implies hydrogen storage in a chemical bounded form, in molecules with high hydrogen content. Among them, let us mention boron- and nitrogen-containing compounds [1,2,3,4,5]. Today, formic acid (FA) is considered to be one of the most promising liquid carriers of hydrogen because it has a high hydrogen concentration (4.4 wt.%), is chemically stable and is not toxic [6,7]. FA can be synthesized from cellulose by chemical reactions [8,9]. Moreover, FA can be directly produced by biomass processing [10,11,12,13].
Catalytic decomposition of FA can follow two pathways leading to the formation of H2 and CO2 or H2O and CO. Consequently, a catalyst has to provide simultaneously high reaction rate and, especially, selectivity to hydrogen in a wide temperature range. FA dehydration yields CO, which is a poison for the fuel cell catalysts. Therefore, there is great demand in developing catalysts that can selectively convert FA to H2 and CO2.
The use of carbon materials as the catalyst supports is of great interest due to their inertness, the possibility of controlling their porosity and modifying the carbon surface by introducing various functional groups that can facilitate controlled synthesis of metal nanoparticles with high dispersity. Carbon nanomaterials are often used as catalyst supports in heterogeneous catalysis, including FA decomposition [14,15,16,17,18].
It has been shown [19,20,21,22,23] that nitrogen sites of nitrogen-doped carbon supports have a positive role in stabilization of metal ions (Pt, Pd, Ru) exhibiting high activity and selectivity to decomposition of FA. Their activity was shown to decrease in the series: Pt > Pd > Ru. Therefore, platinum was chosen as the active component of the catalyst for decomposition of FA. The catalytic activity is known to depend on the dispersity of the catalytically active metal. Atomically dispersed platinum is expected to have the highest activity in the Pt/C catalyst. Hence, substantial efforts were devoted to obtaining atomically dispersed platinum on the surface of carbon supports [14,21]. It was shown that the deposition method determines the interaction of the metal (Pt) with specific surface sites of N-CNT [24].
Among the variety of carbon materials, graphene attracts special attention as the support for metal catalysts used for various reactions due to its high specific surface area, electric conductivity and stability [25]. Quantum chemical calculations demonstrated [26] that hydrogen could be formed selectively by decomposition of FA over atomic palladium deposited on defective graphene. The authors determined the optimal configuration of single Pd atoms on the graphene surface. It was found that the location of the Pd atom over a single vacancy in the graphene layer is the most favorable [26]. In this case, the palladium atom is coordinated to three carbon atoms. In addition, the search for the optimal configuration of a single Pd atom stabilized over a double vacancy in the graphene plane was performed. In the optimal state, the palladium atom located above the graphene surface was found to be coordinated to four adjacent identical carbon atoms. Such a catalyst can be efficient and selective for dehydrogenation of FA to generate hydrogen. The Pd atom stabilized over the double vacancy was shown to be a more active catalyst than the one with the Pd atom stabilized over a single vacancy. The former catalyst had the rate-determining step energy barrier of only 0.90 eV. Meanwhile, for the latter catalyst it was equal to 1.26 eV. The prospects of this support in the FA decomposition were also confirmed in other theoretical studies [27,28] where the positive role of graphene doping with nitrogen was demonstrated. However, reduced graphene oxide, including the one modified with amine groups to improve the hydrophilicity of the support, was most often used in practical experiments on the FA decomposition in the liquid phase [29,30,31,32].
EXAFS was used in conjunction with other methods to study such nanosized platinum supported on various oxide and carbon supports [33,34,35,36,37,38]. This method seems be promising and capable of delivering additional information during structural studies and determination of the phase composition of the supported active component in various finely dispersed and low-percentage catalysts.
This paper is devoted to the effect of the platinum precursor on the properties of Pt/N-graphene catalysts in FA decomposition.

2. Results and Discussion

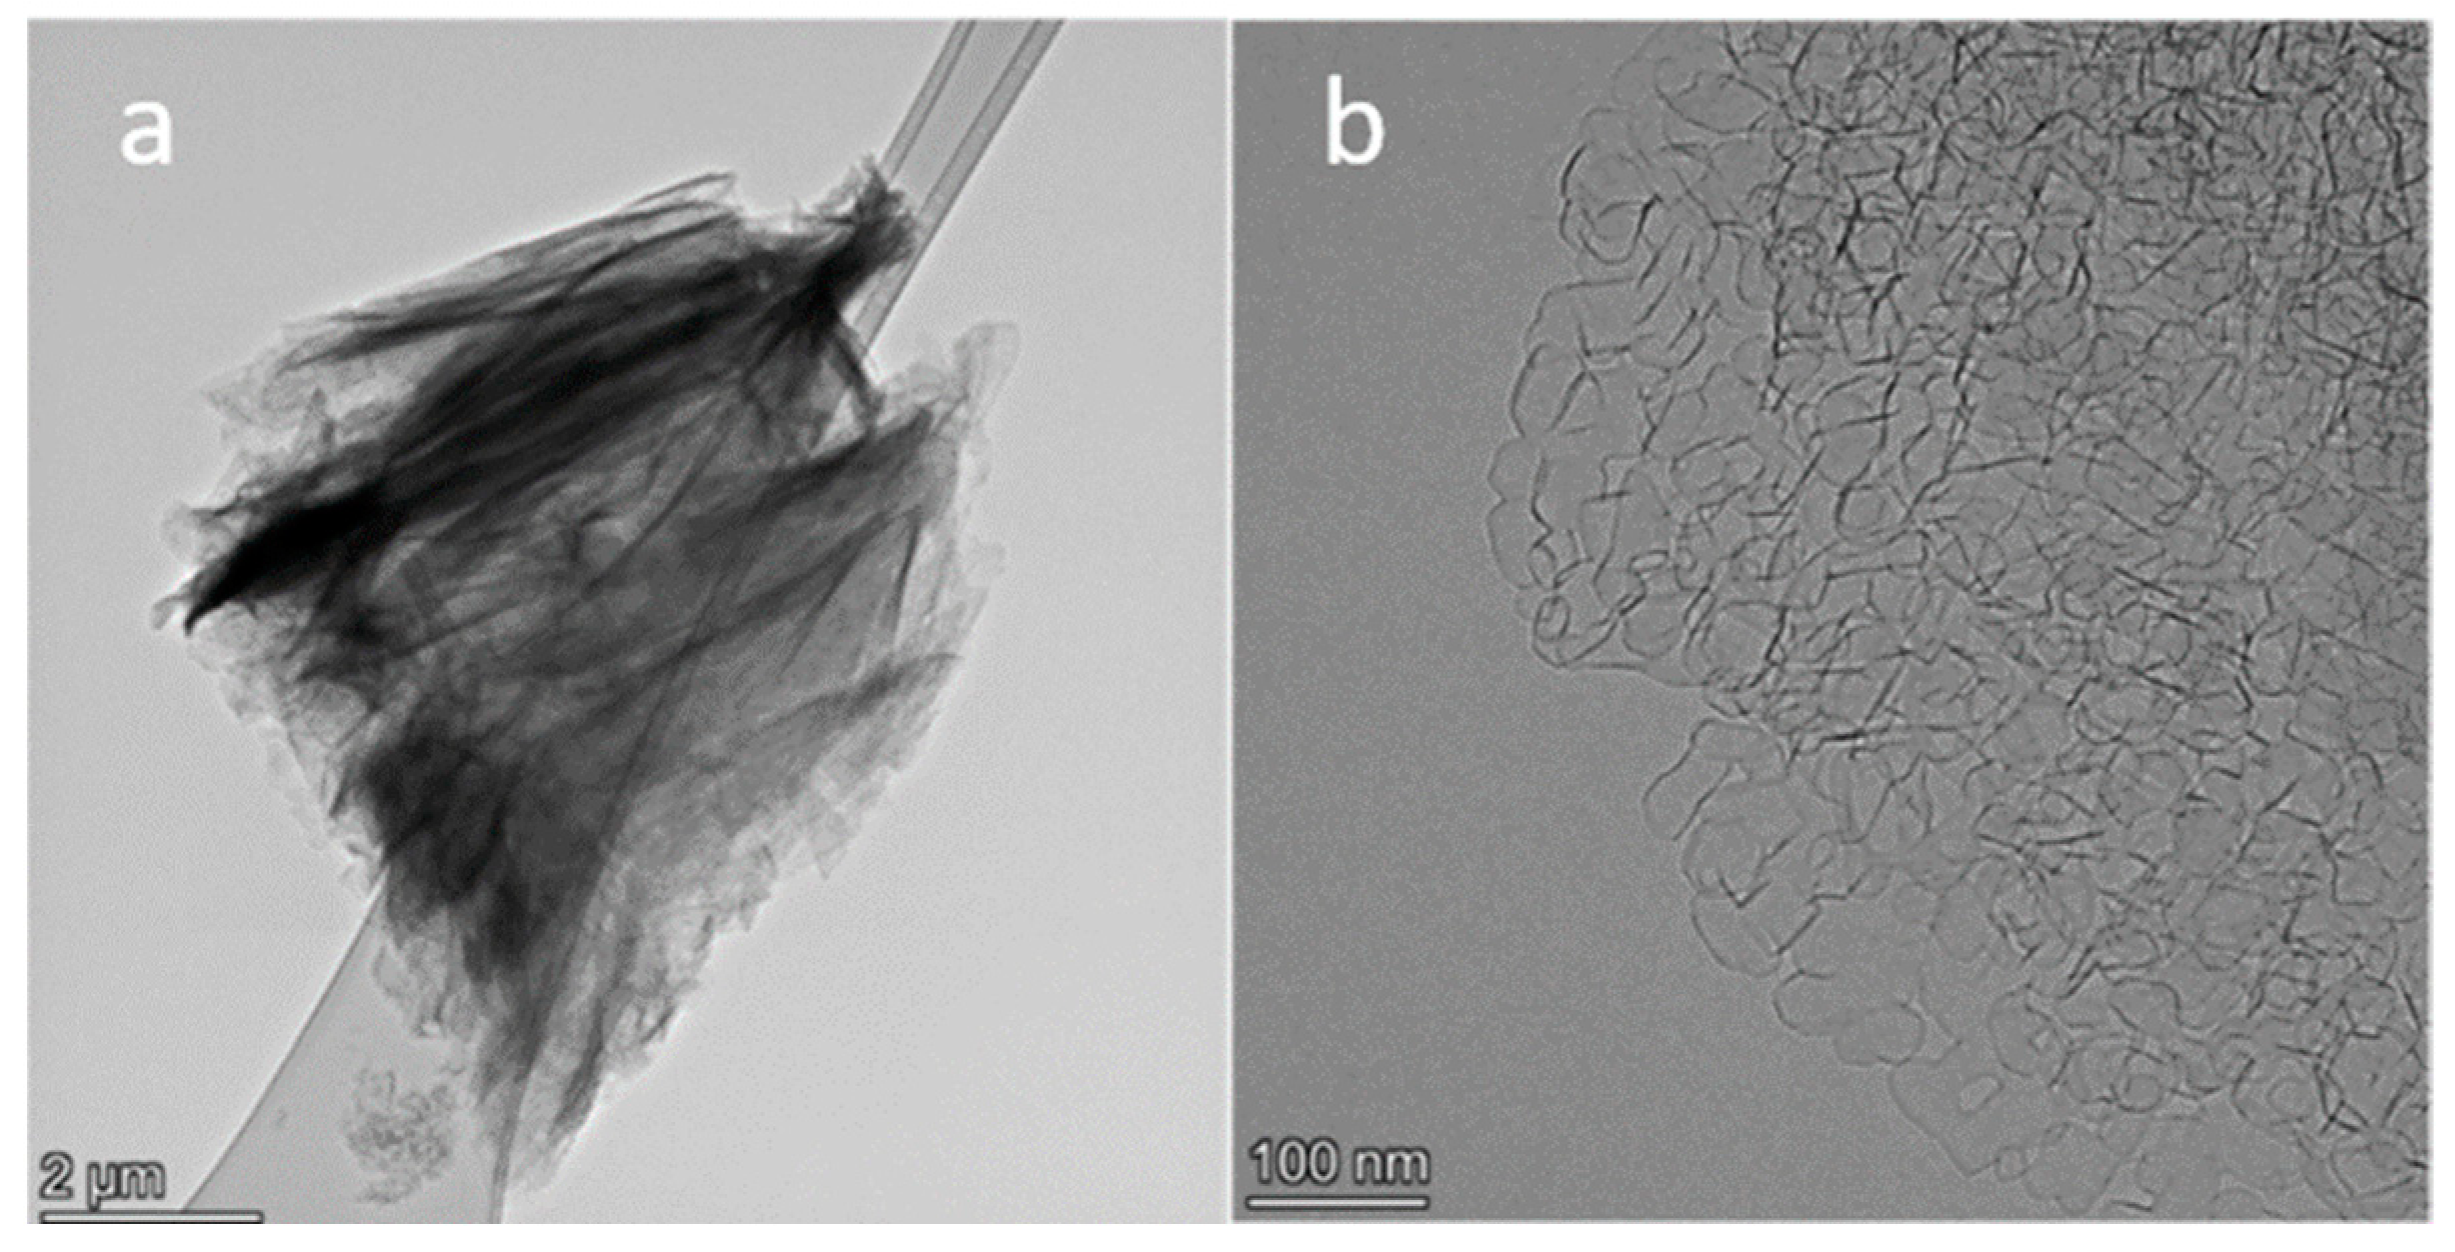
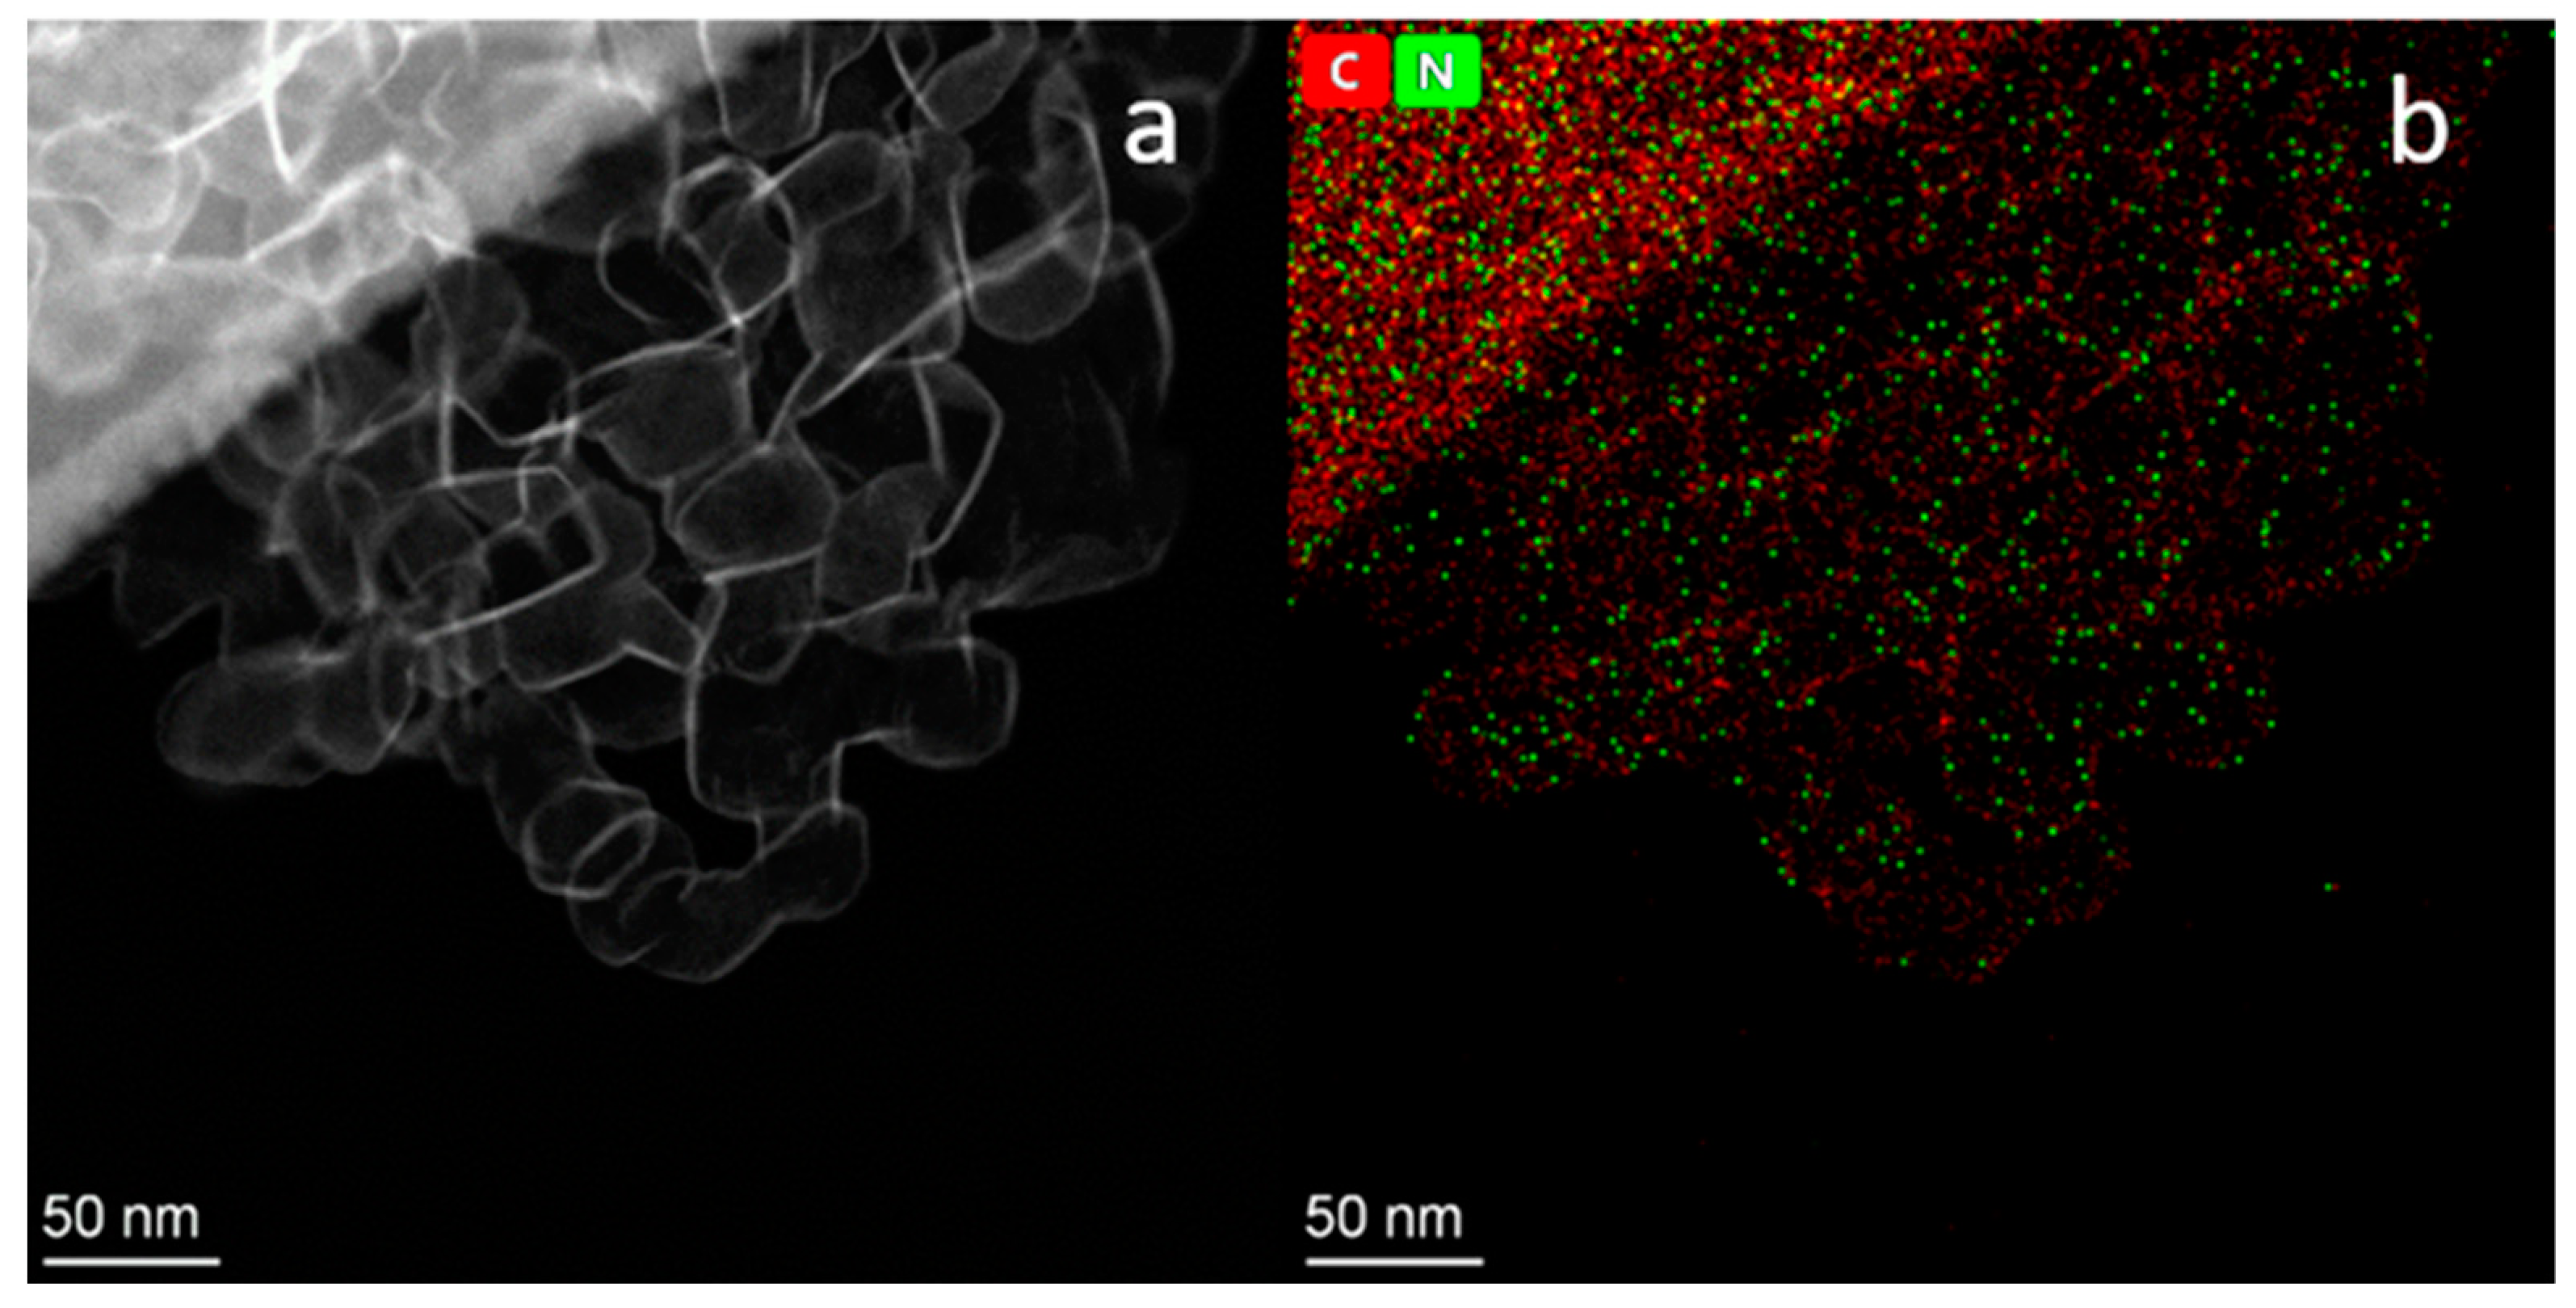
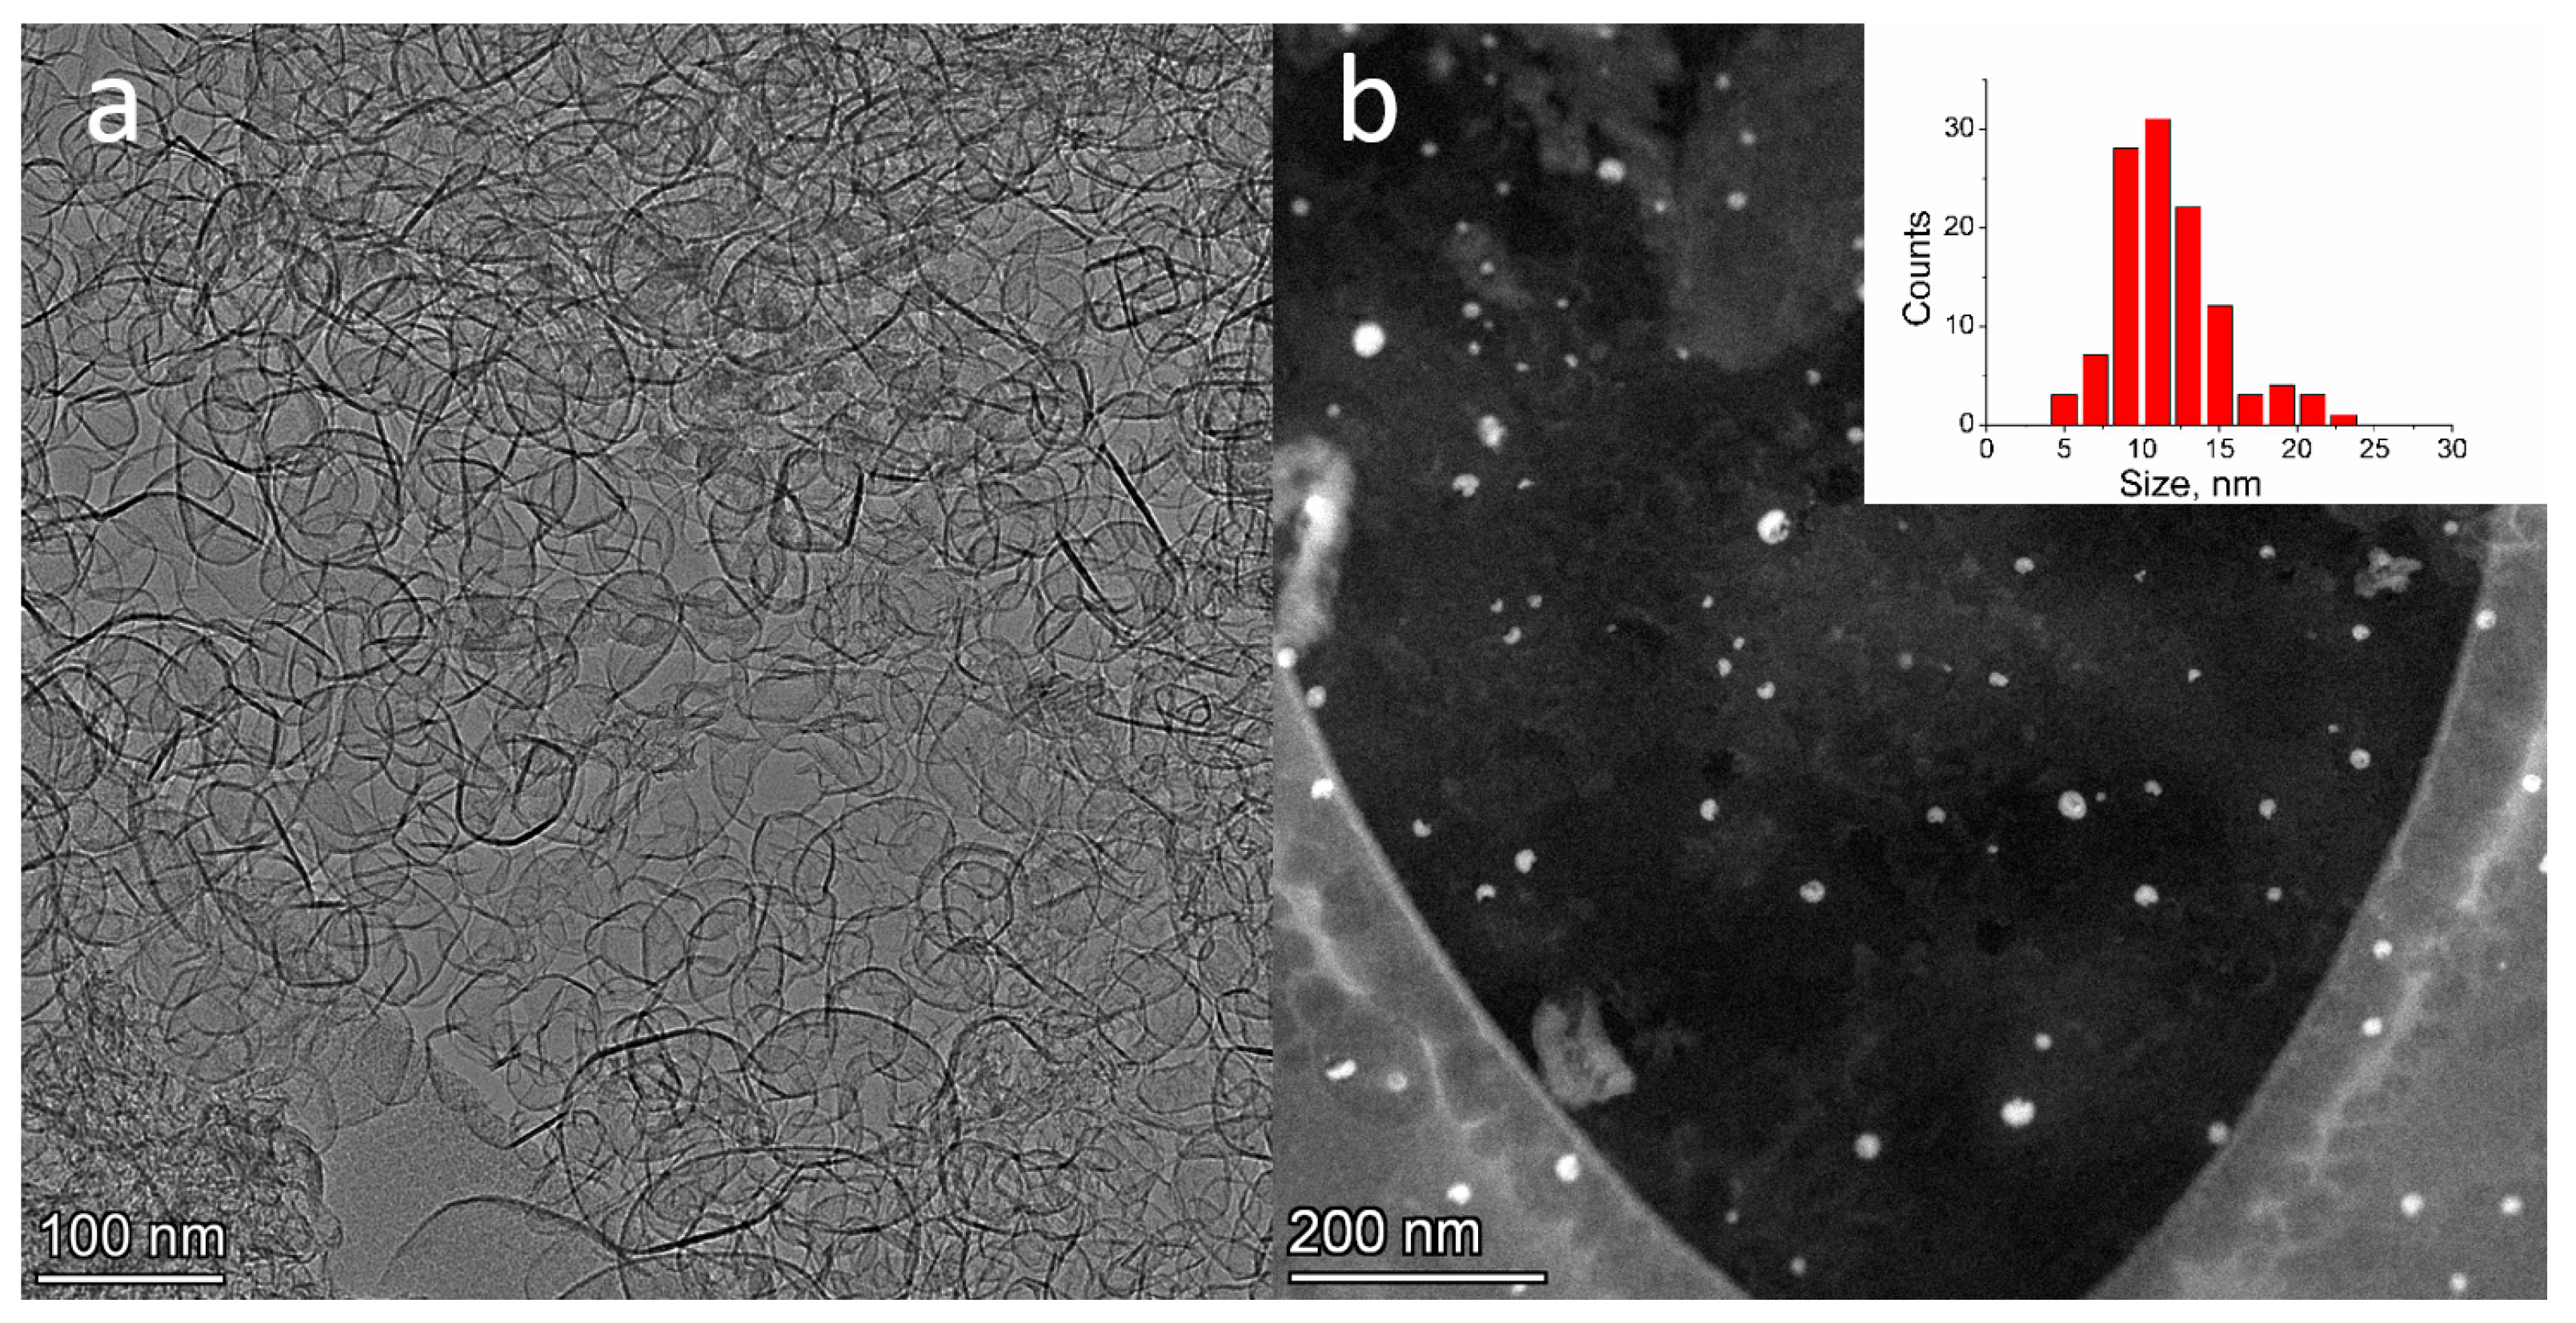
2.1. TEM Study of N-Graphene

TEM images of N-graphene at different magnifications are shown in Figure 1.
One can see that graphene aggregates have a plate-like shape with a developed porous structure and dimensions of about 1 μm (Figure 1a). At higher magnification, the N-graphene particles have a globular shape (Figure 1b). The size of the carbon globules is about 30–50 nm.

2.2. TEM Study of Pt/N-Graphene Catalysts Prepared Using Pt(NO3)4

Figure 2a presents a TEM image of N-graphene used as a support in this study. The HAADF STEM image of the 0.2 wt.% Pt/N-graphene (Pt(NO3)4) catalyst shown in Figure 2b demonstrates that the average Pt particle size in this catalyst was about 12 nm.
The TEM data on the determination of the platinum particle size for Pt/N-graphene catalysts are in a good agreement with the CO chemisorption data (Table 1).
One can see that an increase in the platinum concentration in the catalyst led to a decrease in the CO/Pt ratio, suggesting that the platinum dispersity went down as well.
The obtained results indicate that platinum on the surface of N-graphene was in the form of nanocrystals larger than 10 nm. Therefore, the use of Pt(NO3)4 as a precursor did not yield finely dispersed catalysts. In [39,40], Pt(IV)-nitrate solutions were used for synthesis of Pt/Al2O3 catalysts. However, the authors failed to obtain finely dispersed catalysts due to hydrolysis taking place after dilution and/or interaction with the basic surface of the support. The alkalization of the Pt(IV)-nitrate solutions was found not to lead to light-yellow mononuclear [Pt(OH)6]2− solution because the bridged OH ligands stabilized oligomeric Pt nitrate complexes.

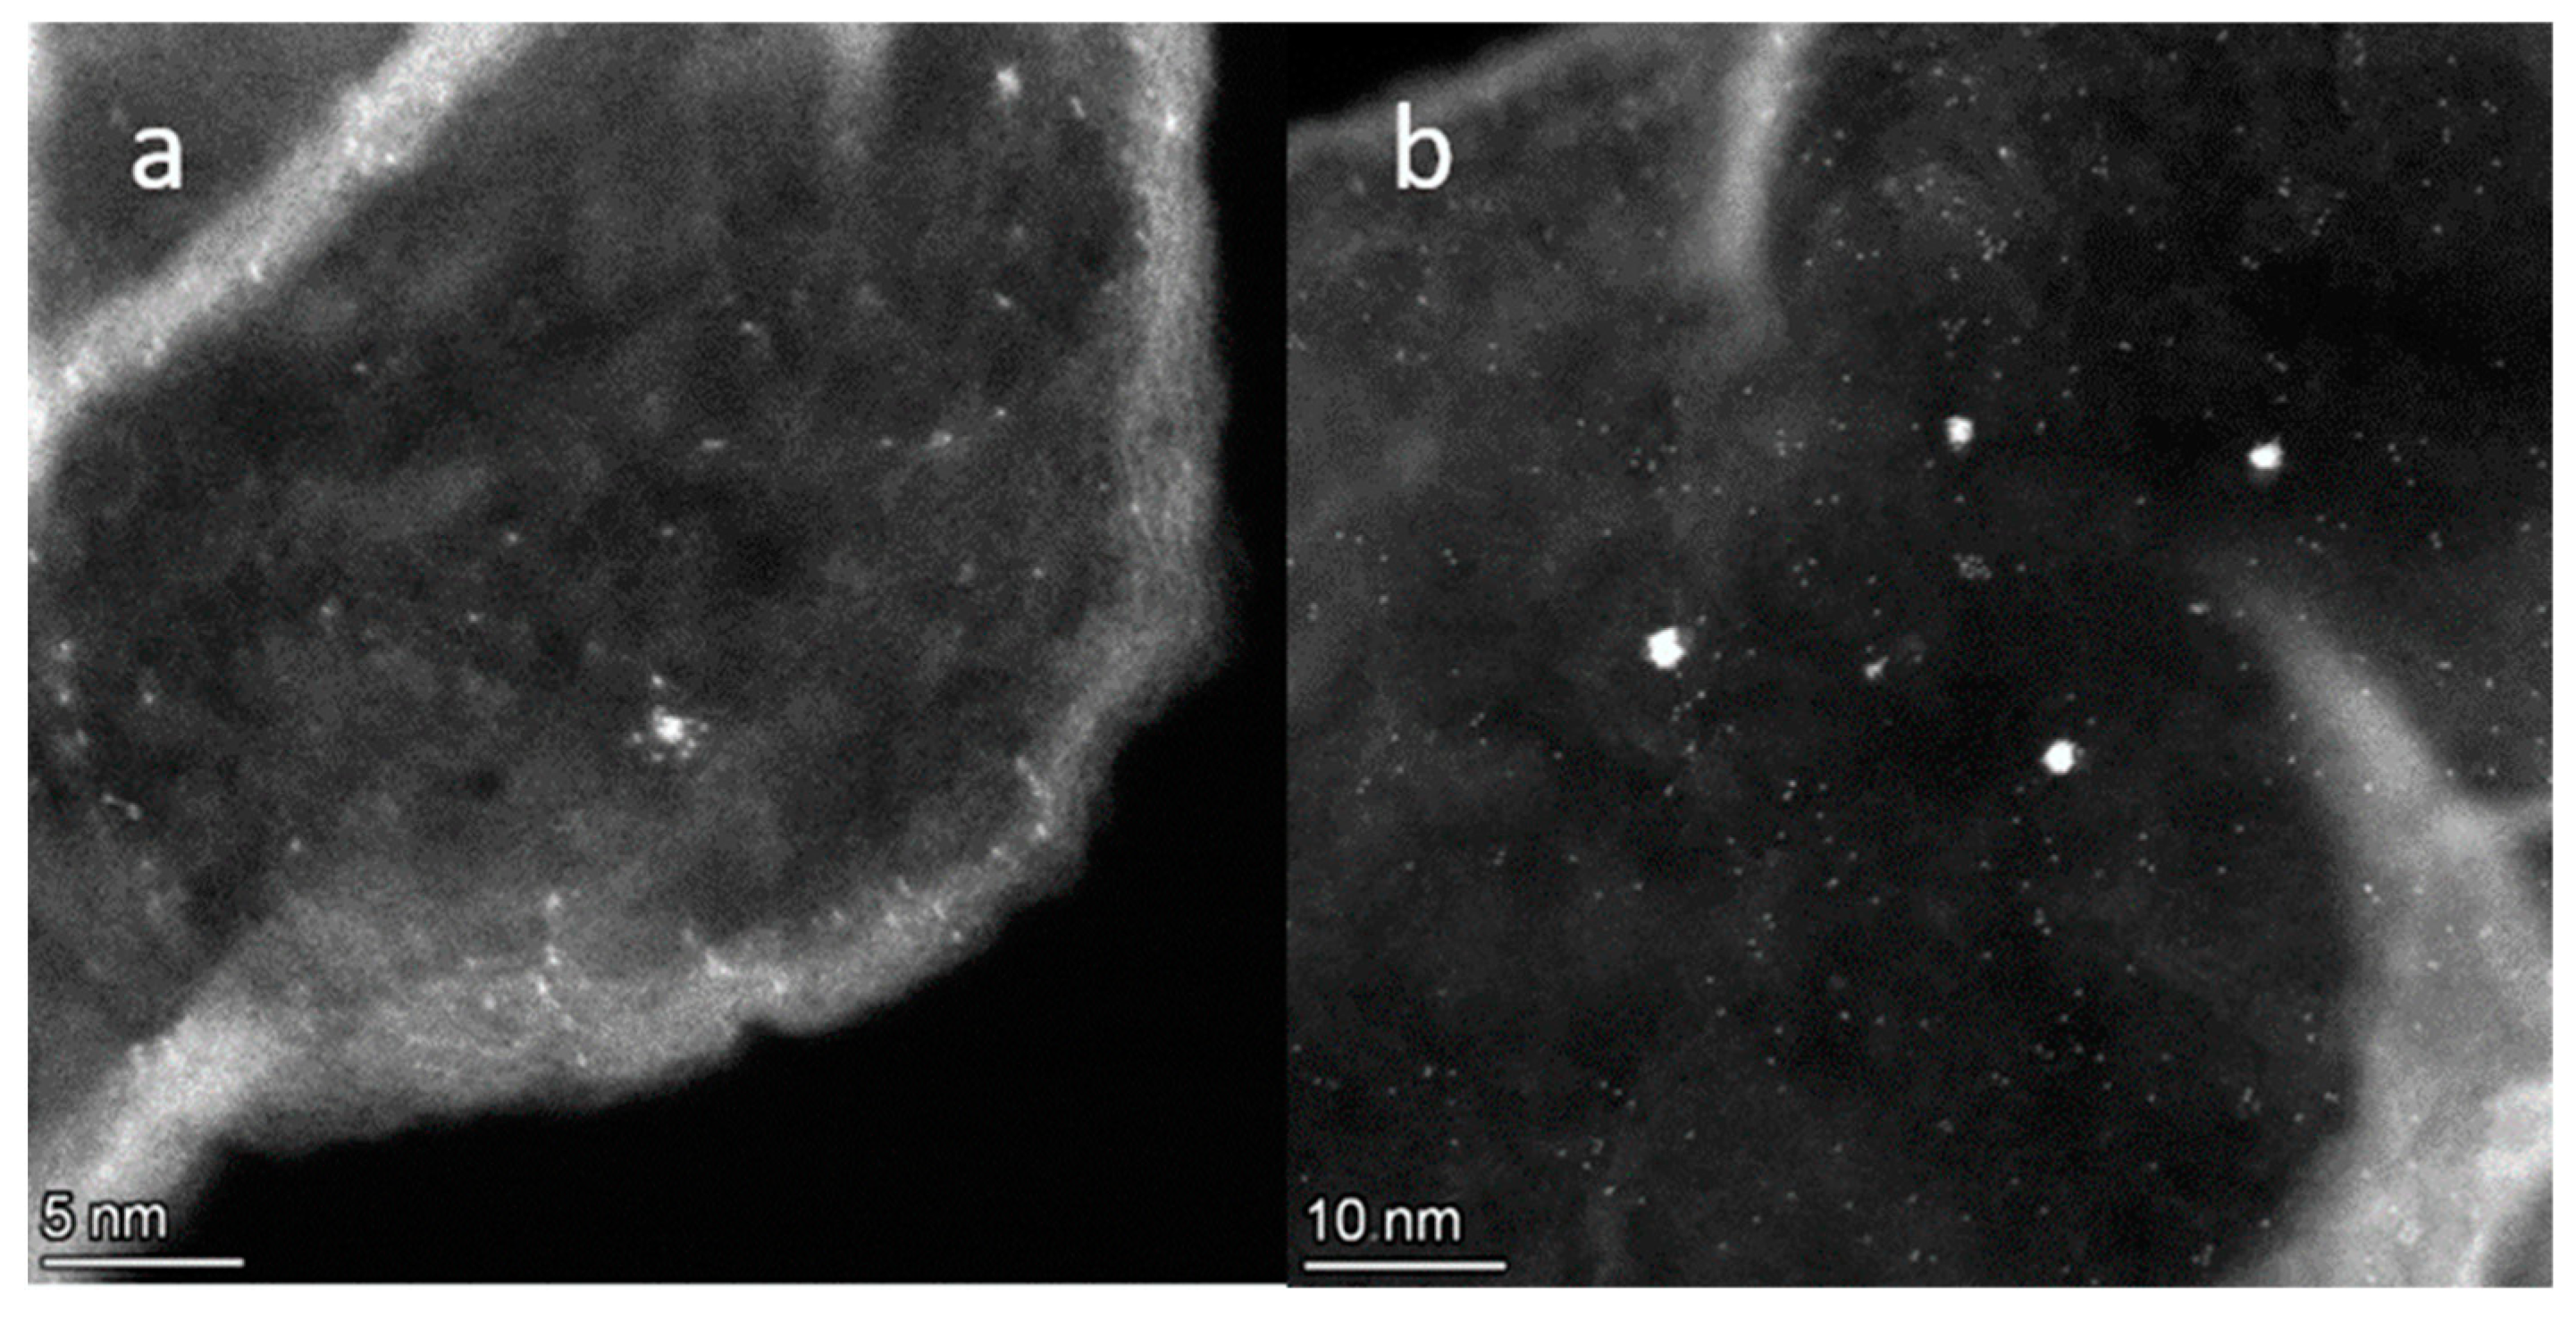
2.3. TEM Study of Pt/N-Graphene Catalysts Prepared Using H2PtCl6

According to the chemical mapping data (Figure 3b), carbon and nitrogen atoms are evenly distributed in N-graphene. Platinum particles were not observed in low-magnification HAADF STEM images (Figure 3a).
This conclusion was confirmed by high-resolution HAADF STEM images (Figure 4a). The measurement of 250 platinum particles gave the average particle size of 2 ± 0.5 Å. The obtained size was close to single atom sizes. A similar distribution was observed for 1% Pt/N-graphene (H2PtCl6). However, as one can see from the image (Figure 4b), the number of particles with the size of about 1 nm increased.
Bulushev et al. [21] conducted a study of the change of platinum nanoparticles size for 0.3% Pt/N-CNFs and 1% Pt/N-CNFs catalysts. HAADF STEM measurements demonstrated that the catalysts contained single-atom species and nanoparticles with a mean size of 1.0 nm. These results are consistent with our data. The platinum dispersion increases with a decrease in the platinum concentration in Pt/N-CNFs catalysts. However, a narrower particle size distribution was observed in this paper. Therefore, the 1% Pt/N-graphene (H2PtCl6) catalyst had a higher catalytic activity in the FA decomposition than the 1% Pt/N-CNFs catalyst.

2.4. Determination of the Platinum Particle Size in Pt/N-Graphene Catalysts Prepared Using H2PtCl6

The Ptsurface/Pttotal ratio in the studied catalysts was determined by CO chemisorption. The results are reported in Table 2.
According to the chemisorption data, platinum species are 2.5 nm in average size in the 1% Pt/graphene (H2PtCl6) catalyst [41]. The CO chemisorption data obtained for the Pt/N-graphene (H2PtCl6) catalysts suggest that the platinum particles in these are larger. However, this conclusion clearly contradicts with the electron microscopy data. Apparently, atomically dispersed platinum stabilized on nitrogen sites is unable to adsorb CO. This effect was earlier reported for Pd/N-CNF catalysts [20].
Therefore, the platinum on the N-graphene surface prepared using H2PtCl6 precursor is in an atomically dispersed state in contrast to that synthesized using Pt(NO3)4, which forms platinum nanocrystals. Therefore, the state of atomically dispersed platinum in Pt/N-graphene (H2PtCl6) catalysts was studied in more detail.

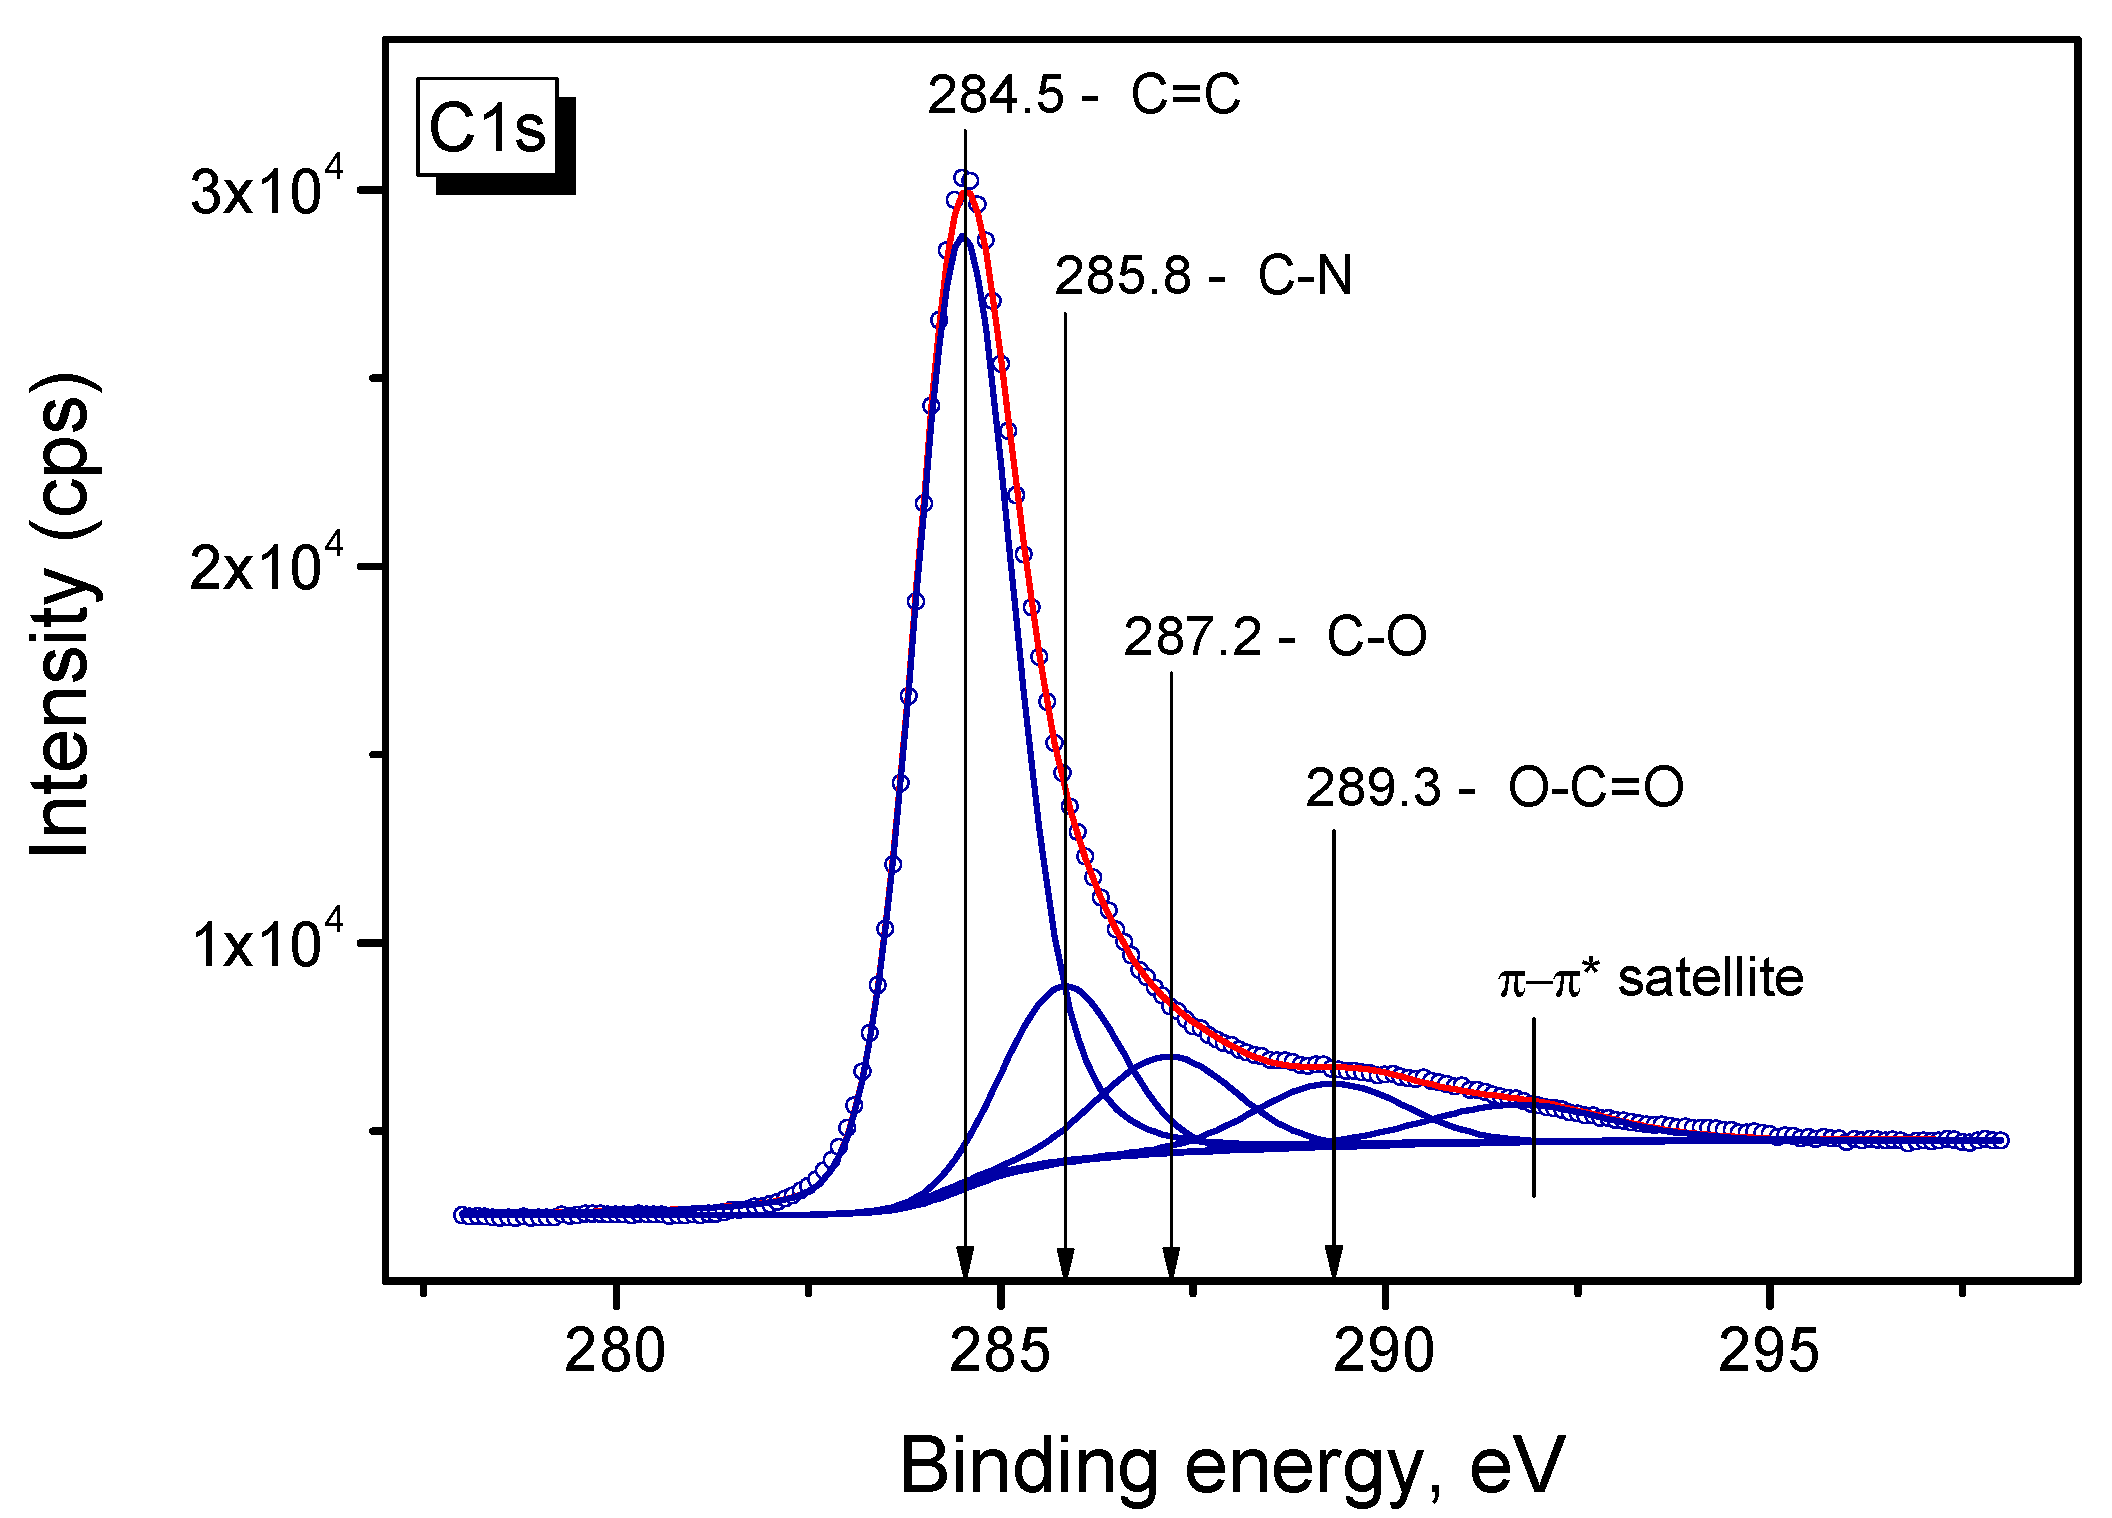
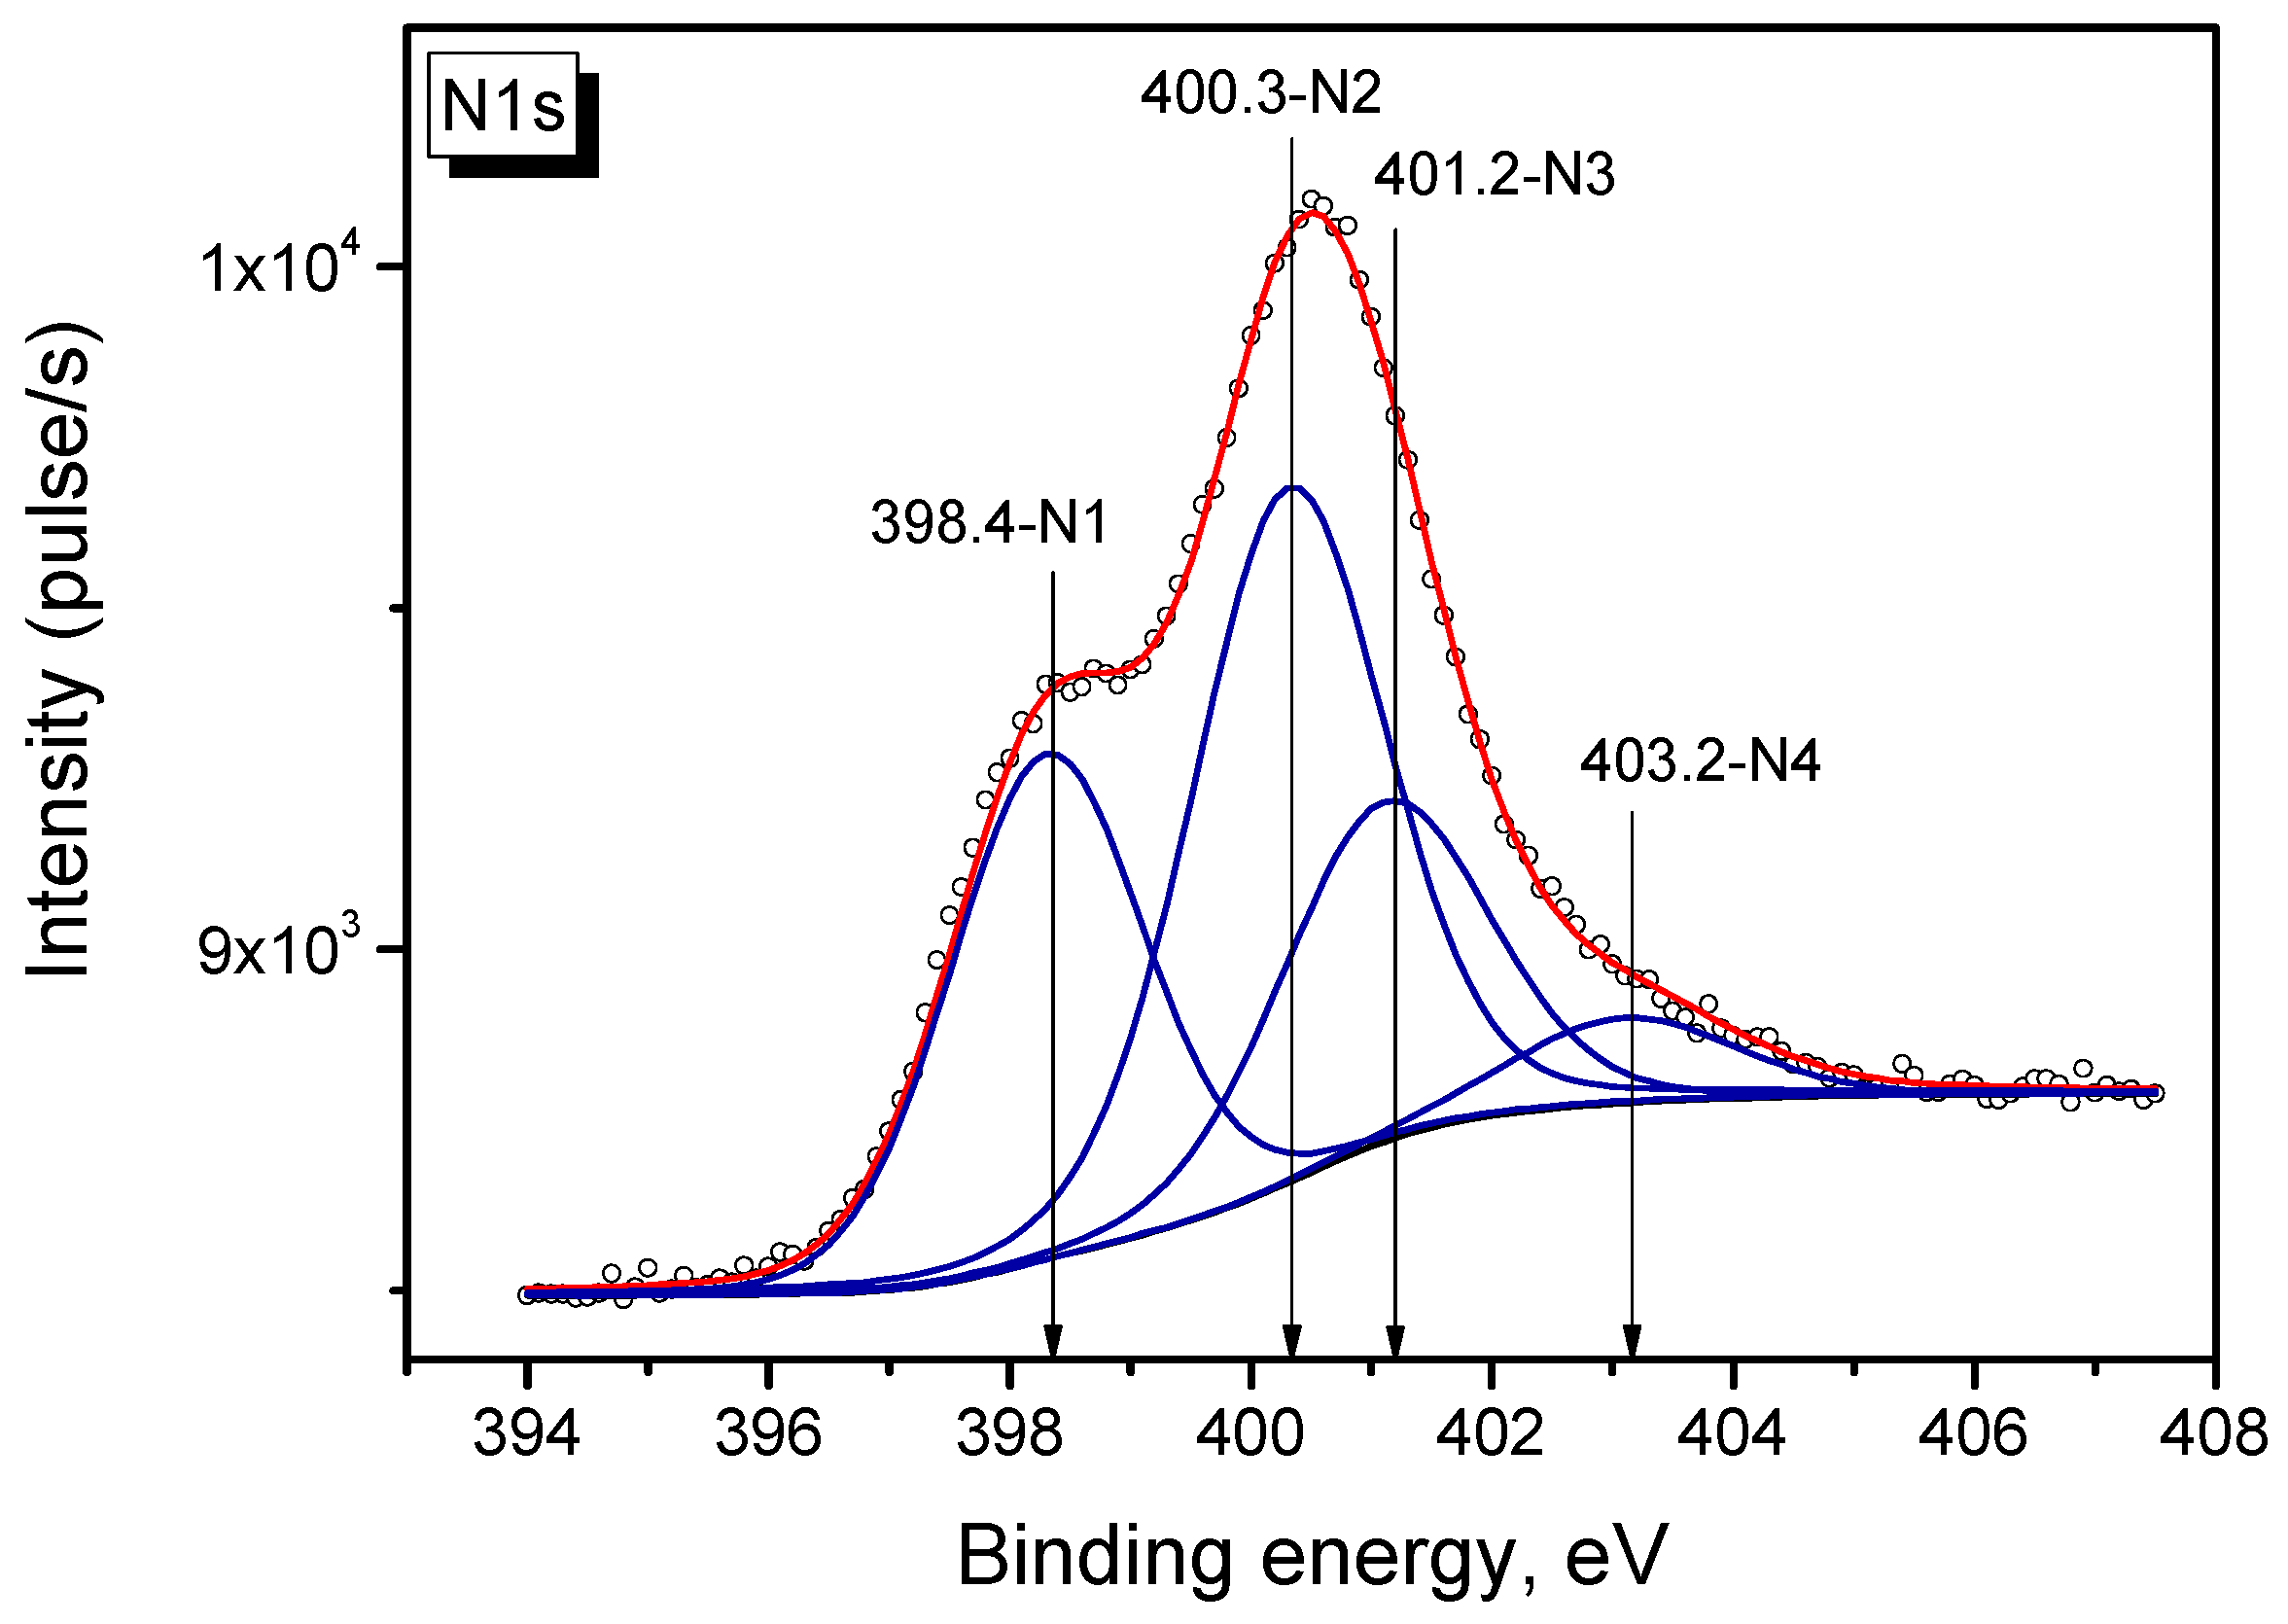
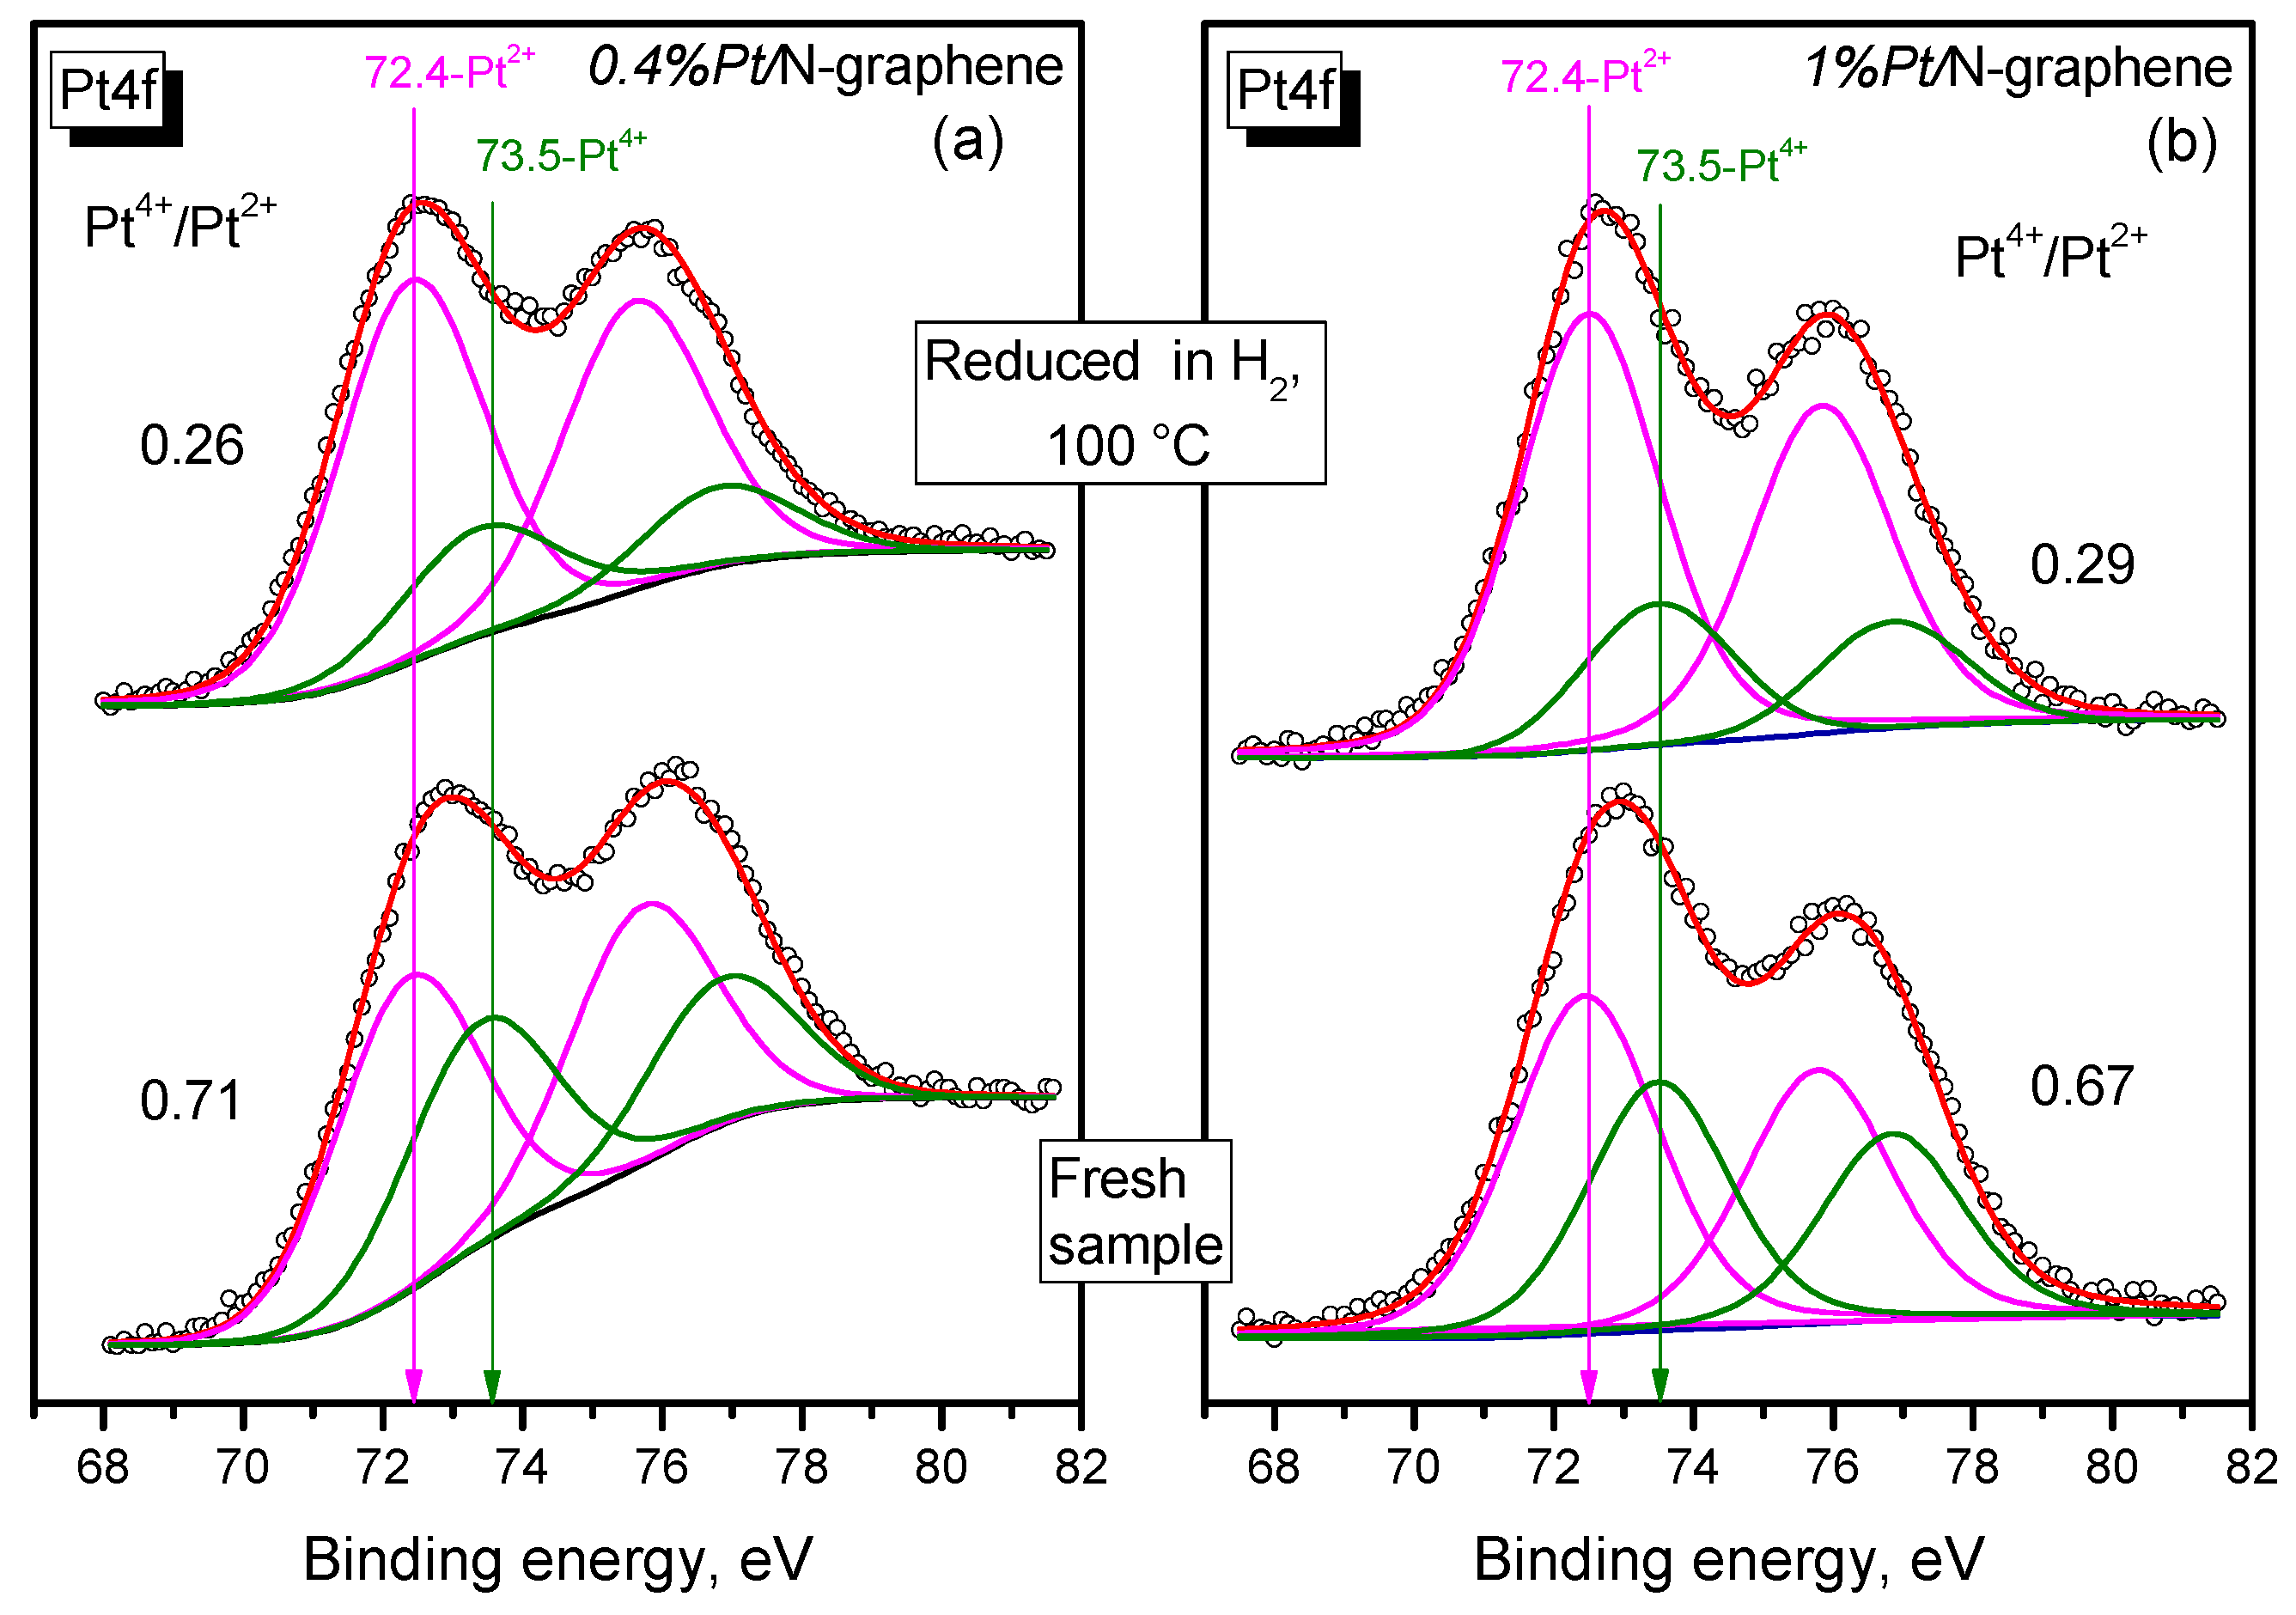
2.5. XPS Study of Pt/N-Graphene Catalysts Prepared Using H2PtCl6

A typical C1s spectrum of the Pt/N-graphene sample is presented in Figure 5.
The value of the binding energy of the main peak C1s (284.5 eV) can be attributed to the sp2 hybridization state of carbon. This assignment was additionally confirmed by a typical satellite peak at the binding energy of about 291 eV, attributed to the π-π* transition. The high-resolution C1s spectrum can be divided into four individual peaks (Figure 5), respectively referring to C=C (284.5 eV), C-N (285.8 eV), C-O (287.2 eV) and O-C=O (289.3 eV) [42,43,44].
A typical N1s spectrum of nitrogen-doped graphene with deconvolution to individual components is presented in Figure 6. In accordance with the literature data, components N1 and N3 can be assigned to the pyridine-like and graphite-like nitrogen species [45,46]. Component N2, with the binding energy intermediate between those of N1 and N3, is usually assigned to amino groups and pyrrole nitrogen species on the surface of carbon materials [47,48]. Component N4, with the binding energy of more than 403 eV, belongs to oxidized forms of nitrogen (e.g., pyridine-N-oxide). Therefore, the following nitrogen species are present in N-graphene: pyridine (N1), pyrrole or amino (N2), graphite-like (N3) and oxidized (N4). The concentration of nitrogen atoms in N-graphene is 5.0 wt.%.
The nitrogen sites described above are located on the external surface of the support, as spherical N-graphene particles consist of 2–4 graphene layers and do not have bulk atoms [49,50].
Pt4f spectra of 0.4% Pt/N-graphene and 1.0% Pt/N-graphene catalyst samples before and after reduction in the spectrometer chamber are shown in Figure 7.
Prior to recording XPS spectra, the initial catalyst samples were already reduced in a quartz flow reactor in the 50% H2-Ar mixture at 250 °C for 30 min. In Figure 7, they are denoted as fresh samples. One can see that the platinum on the surface of the fresh samples was in the form of Pt2+ and Pt4+ ions. The Pt4+/Pt2+ratio equaled 0.71 in 0.4% Pt/N-graphene and 0.67 in 1.0% Pt/N-graphene. After these samples were reduced in the spectrometer chamber, the amount of Pt4+ decreased significantly. The Pt4+/Pt2+ratio was now equal to 0.26 in 0.4% Pt/N-graphene and 0.29 in 1.0% Pt/N-graphene. Consequently, after reduction, platinum was predominantly present in the form of Pt2+ ions stabilized on the nitrogen sites of N-graphene.

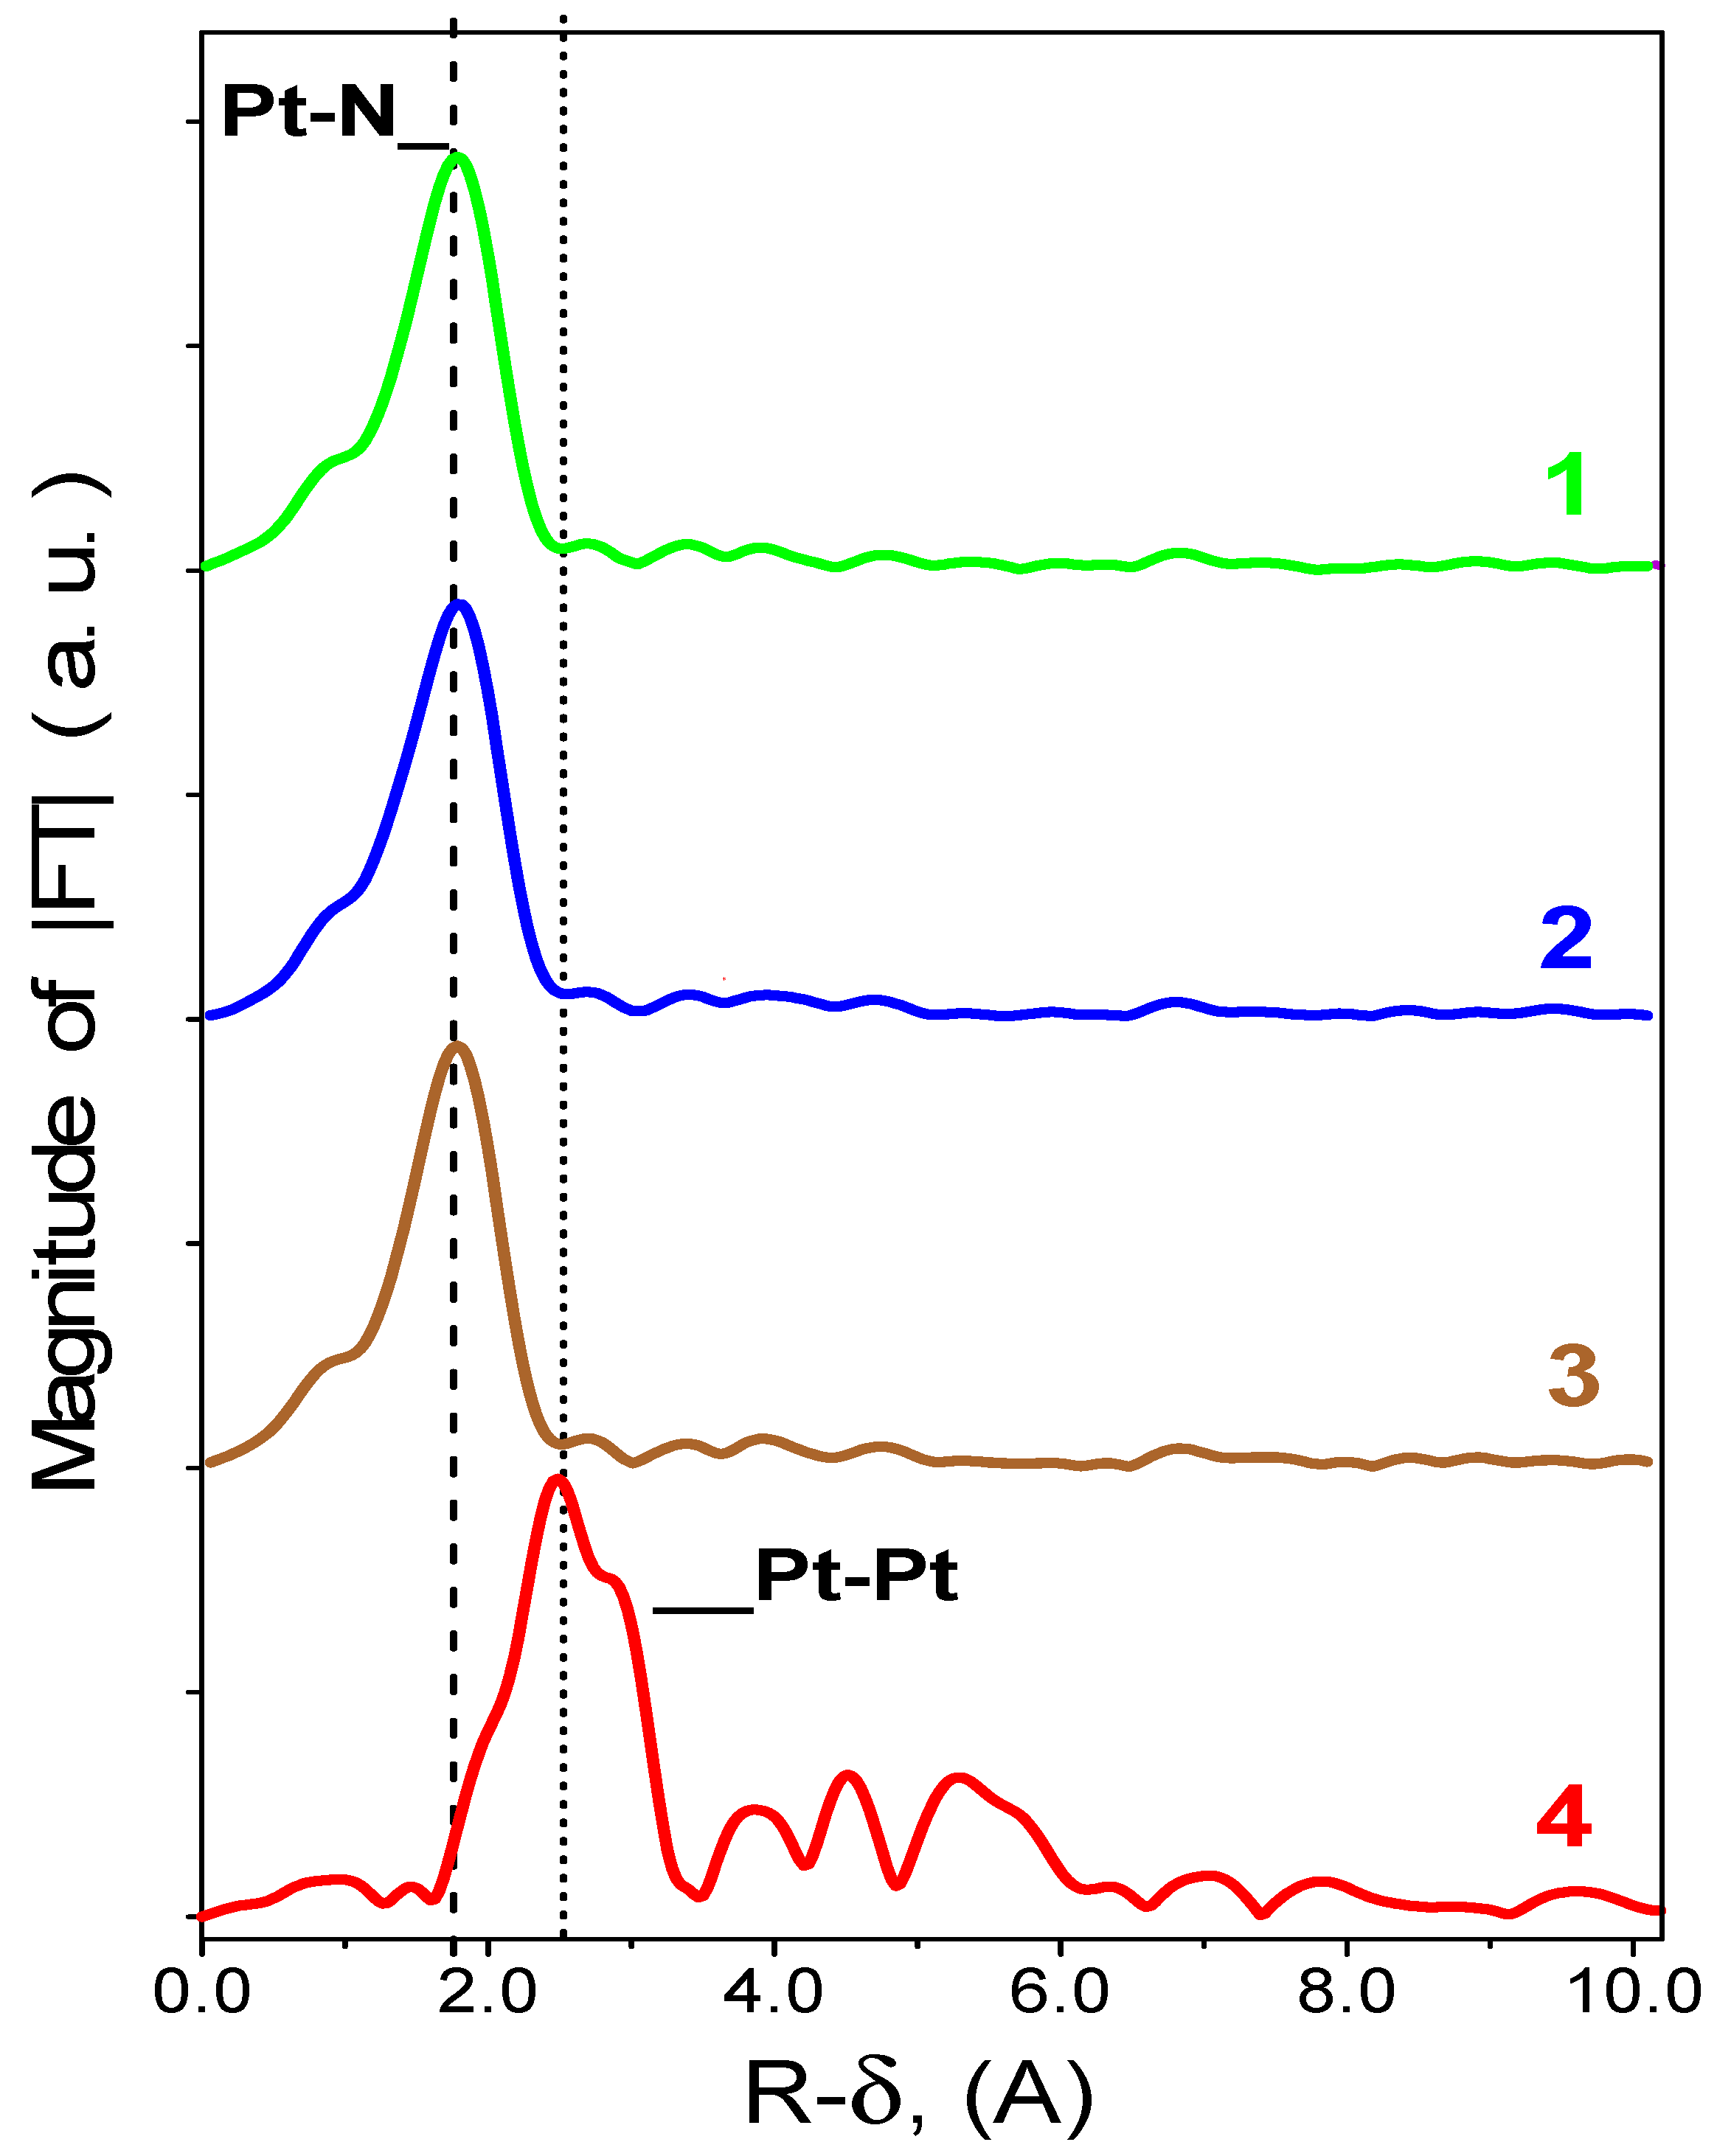
2.6. EXAFS Studies of Pt/N-Graphene Catalysts Prepared Using H2PtCl6

Radial distribution functions (RDFs) of atoms of the platinum local arrangement obtained from the EXAFS spectra of the studied samples and Pt-foil bulk reference are shown in Figure 8.
The following conclusions can be made based on the EXAFS data obtained for the studied catalysts. Figure 8 clearly shows that RDF curves for Pt/N-graphene (H2PtCl6) samples with different platinum concentrations (0.2–1.0%) are similar. Only one meaningful peak was observed for all the catalysts. The observed peak with a maximum at 1.79–1.81 Å corresponded to R ≈ 2.12–2.14 Å, which matches the Pt–N distance (values plotted along the x axis in Figure 8 are R-δ, where δ is the phase correction resulting from the experimental method, δ is about ~0.32–0.35 Å). These peaks corresponded best to Pt-N distances calculated for various nitrogen sites, including square planar sites, where platinum–nitrogen distances can be as long as 2.08 Å [51]. The fitting performed for 0.2–1.0% Pt/N-graphene catalysts supported this assignment and gave practically the same sets of distances between atoms (R) and coordination numbers (CN). The obtained data were within RPt-N = 2.12–2.14, CN = 3.7–3.9. Some differences of the obtained data from the model ones can be attributed to contributions from other possible nitrogen sites with low coordination or possible structural deformation of the graphene globule, leading to distortion the square planar nitrogen environment (platinum distortion from the surface and consequent increase of the platinum–nitrogen distance).
The RDF curve of the Pt-foil bulk reference (Figure 8 (4)) demonstrated peaks corresponding to the metal Pt-Pt distances only. The first significant peak referred to the shortest Pt-Pt distance in the FCC metal structure (RPt-Pt ~ 2.75–2.77Å, CN = 12) [33,38,52], while the other distant peaks corresponded to the following longer Pt-Pt distances. The completed fitting for the Pt-foil bulk reference provided a similar set for the first peak: RPt-Pt ~ 2.76Å, CN = 11.8. It should be noted that no bulk metal Pt0 was detected within the EXAFS method limitation in the studied Pt/N-graphene (H2PtCl6) samples because there was no peak corresponding to the value R ≈ 2.76Å typical for Pt-Pt bulk metal distances in the studied samples.
This is unambiguous proof of the structural disordering and substantial contribution of isolated platinum that does not have other platinum atoms in the nearest coordination arrangement. This result makes it possible to conclude that no bulk platinum metal was present in the studied samples. The obtained EXAFS data unambiguously indicate that atomically dispersed platinum strongly bound to the N-graphene surface was present in the studied samples. Its properties are very different from those of the bulk metal as no CO chemisorption takes place on it.
The analysis of the data obtained by EXAFS led us to the conclusion that the majority of supported platinum in the Pt/N-graphene samples was in an atomically dispersed form. Apparently, it localized on nitrogen sites where it could be stabilized in the form resembling platinum four-coordinated by nitrogen atoms, Figure 9.
Similar results were earlier reported for Pd/NC materials [19,20,53]. The results obtained by EXAFS are in a good agreement with the HRTEM data for the studied samples.

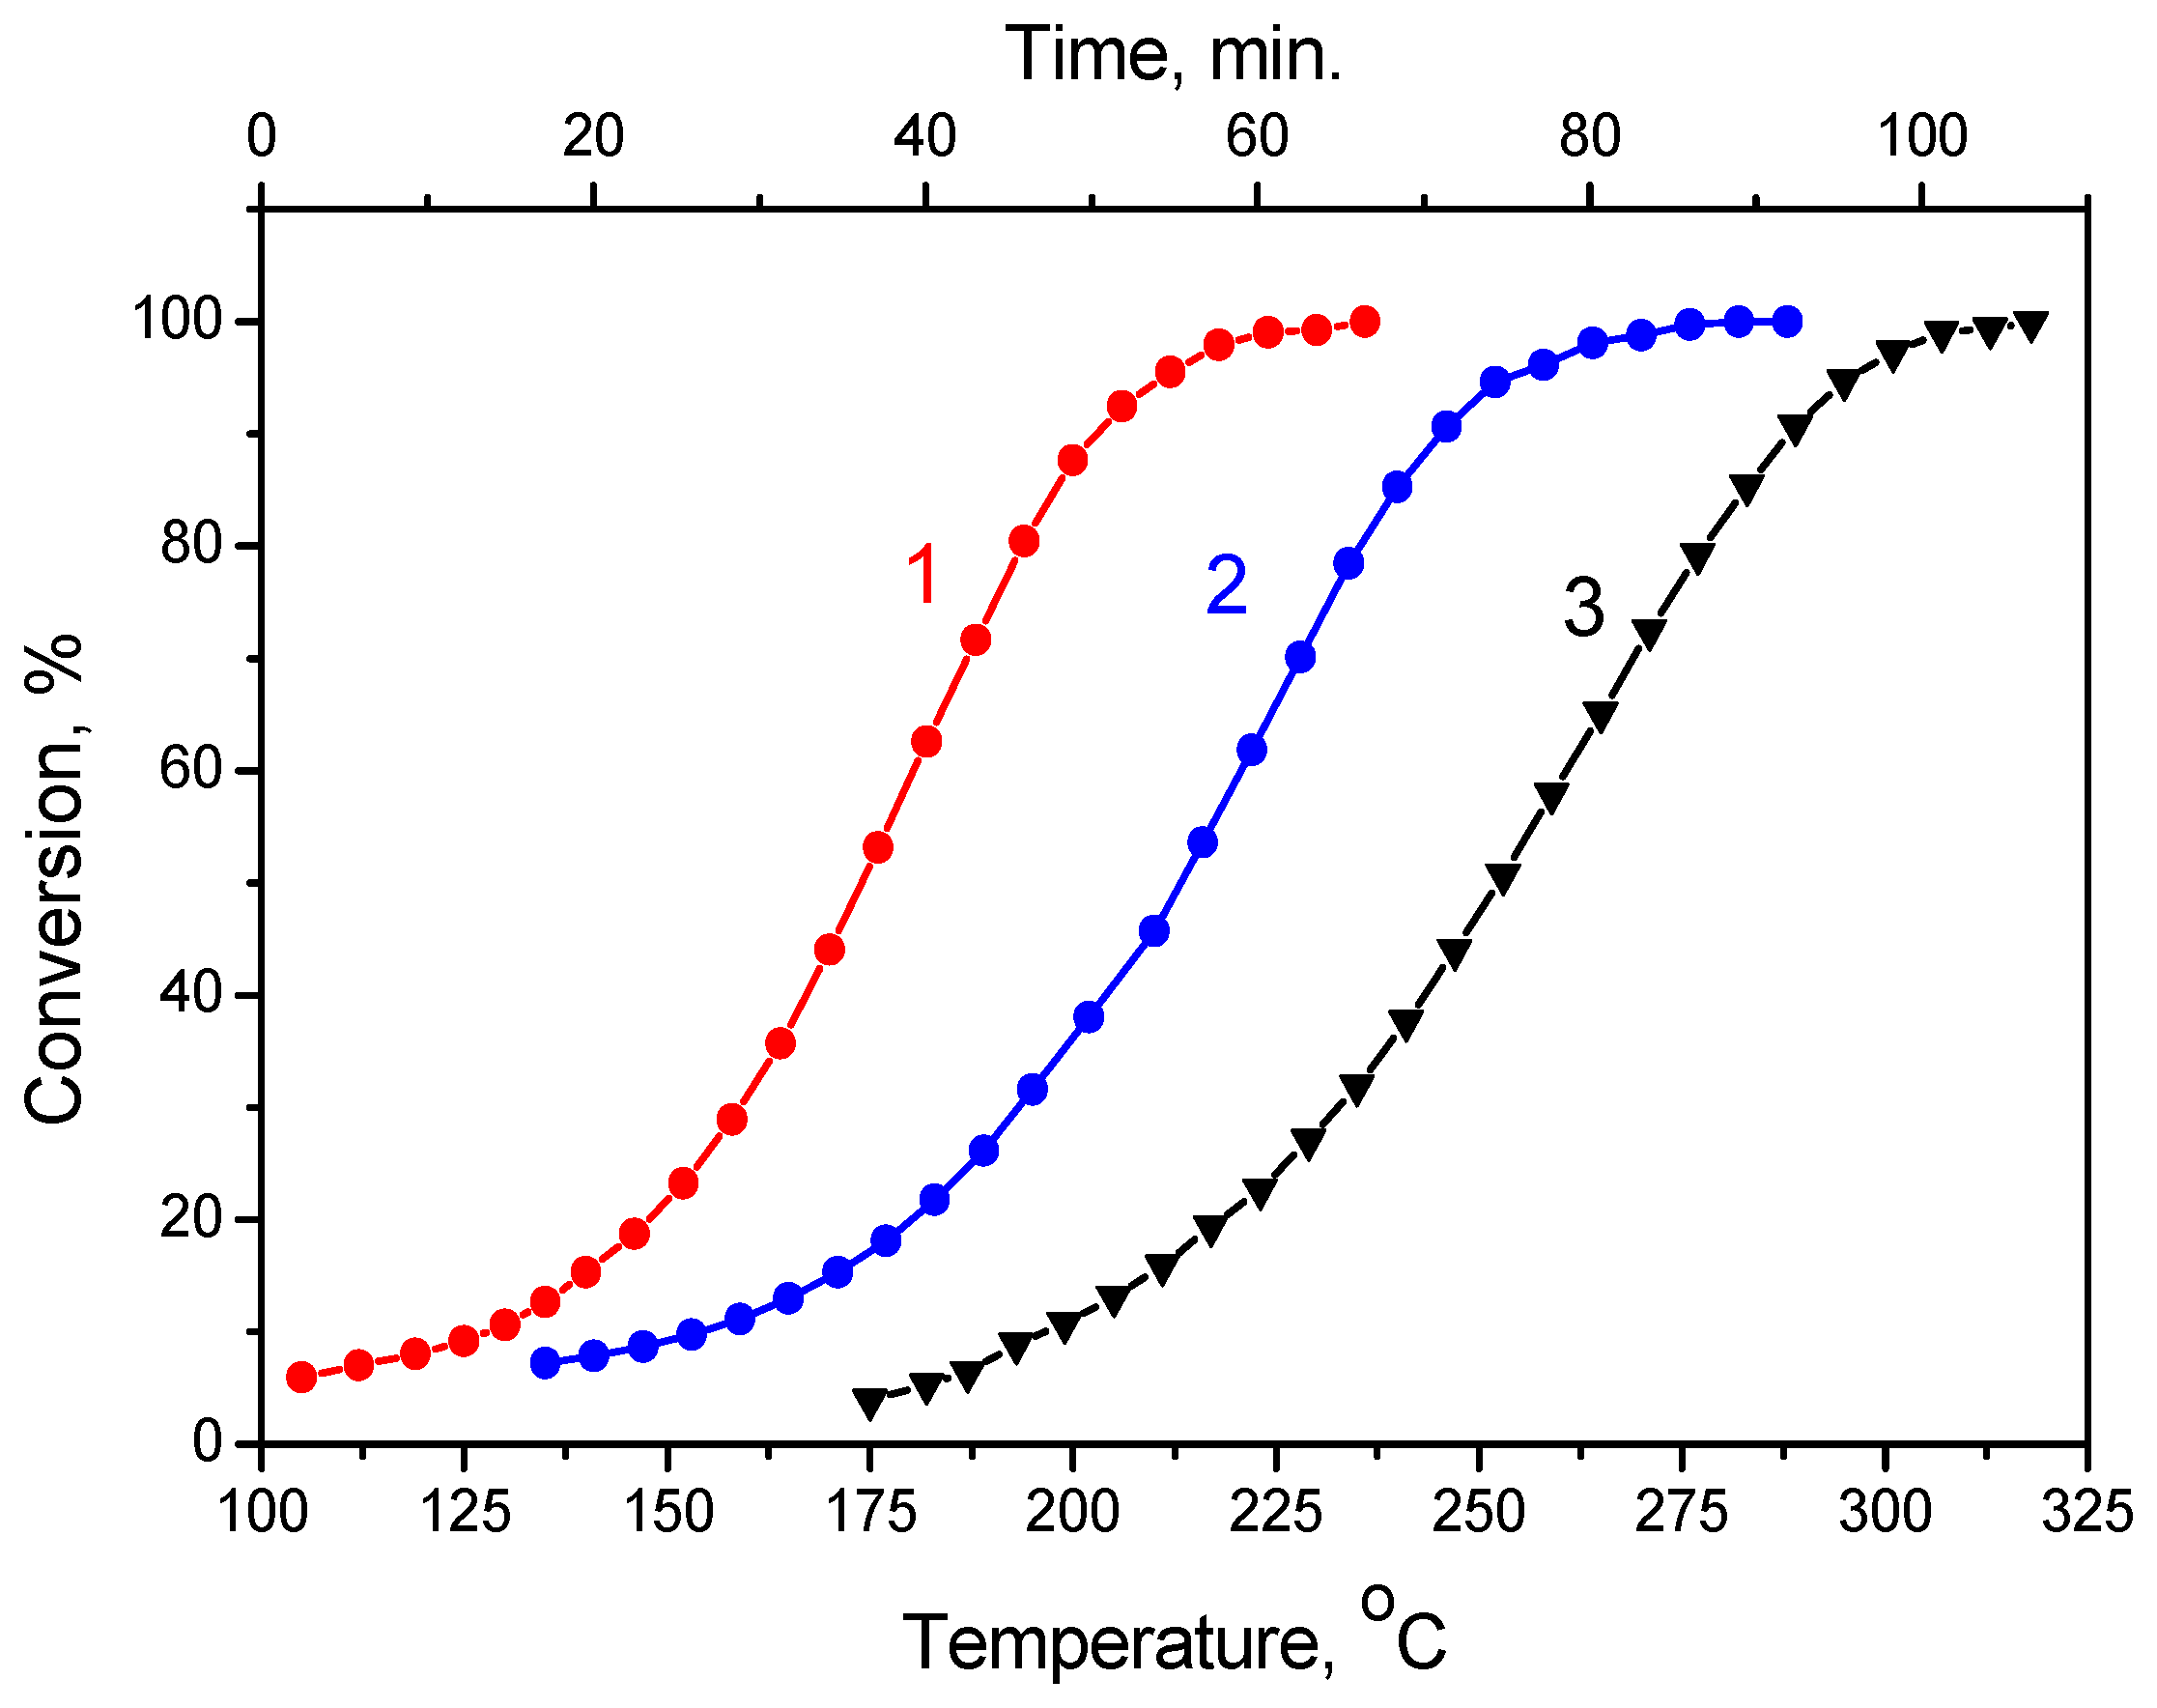
2.7. Formic Acid Decomposition over Pt/Graphene and Pt/N-Graphene Catalysts Synthesized Using Pt(NO3)4

Firstly, Pt/N-graphene catalysts prepared using Pt(NO3)4 were studied. The results of the catalytic conversion of FA over N-graphene support and Pt/N-graphene catalysts are shown in Figure 10.
The activity of the catalysts in FA decomposition can be characterized by the temperature of the 50% conversion. This value can be determined more accurately than temperatures of low conversions at the starting sections of the kinetic curves. The results are reported in Table 3.
According to the obtained data, N-graphene itself can catalyze the FA decomposition. However, its activity and selectivity were very low (Figure 10 and Figure 11, Table 3).
Deposition of 0.2 wt.% Pt on N-graphene resulted in a substantial increase in the catalytic activity (Figure 10). The temperature of the 50% FA conversion went down from 245 °C for N-graphene to 213 °C for 0.2% Pt/N-graphene. A further increase in the Pt concentration to 1.0 wt.% resulted in an additional increase in the catalytic activity.
An important characteristic of the studied catalysts was their selectivity in the FA decomposition.
As it was noted above, the N-graphene had low activity in the FA decomposition. The selectivity of this reaction over N-graphene was also not spectacular, going down from 96.4% at 160 °C to 92.3% at 290 °C. The selectivity of the 0.2% Pt/N-graphene catalyst was found to decrease from 97.3% at 150 °C to 93.4% at 290 °C. The increase in the platinum concentration in the catalyst to 1 wt.% improved the selectivity to H2 and CO2 during the FA decomposition. The selectivity of the 1% Pt/N-graphene catalyst varied from 99.6% at 105 °C to 97.7% at 235 °C. Therefore, an increase in the platinum concentration in Pt/N-graphene catalysts favored the selectivity to the pathway leading to the formation of H2 and CO2. The observed difference in the selectivity of the catalysts with different platinum concentrations may relate to the different contributions of Pt and the support in the FA decomposition.

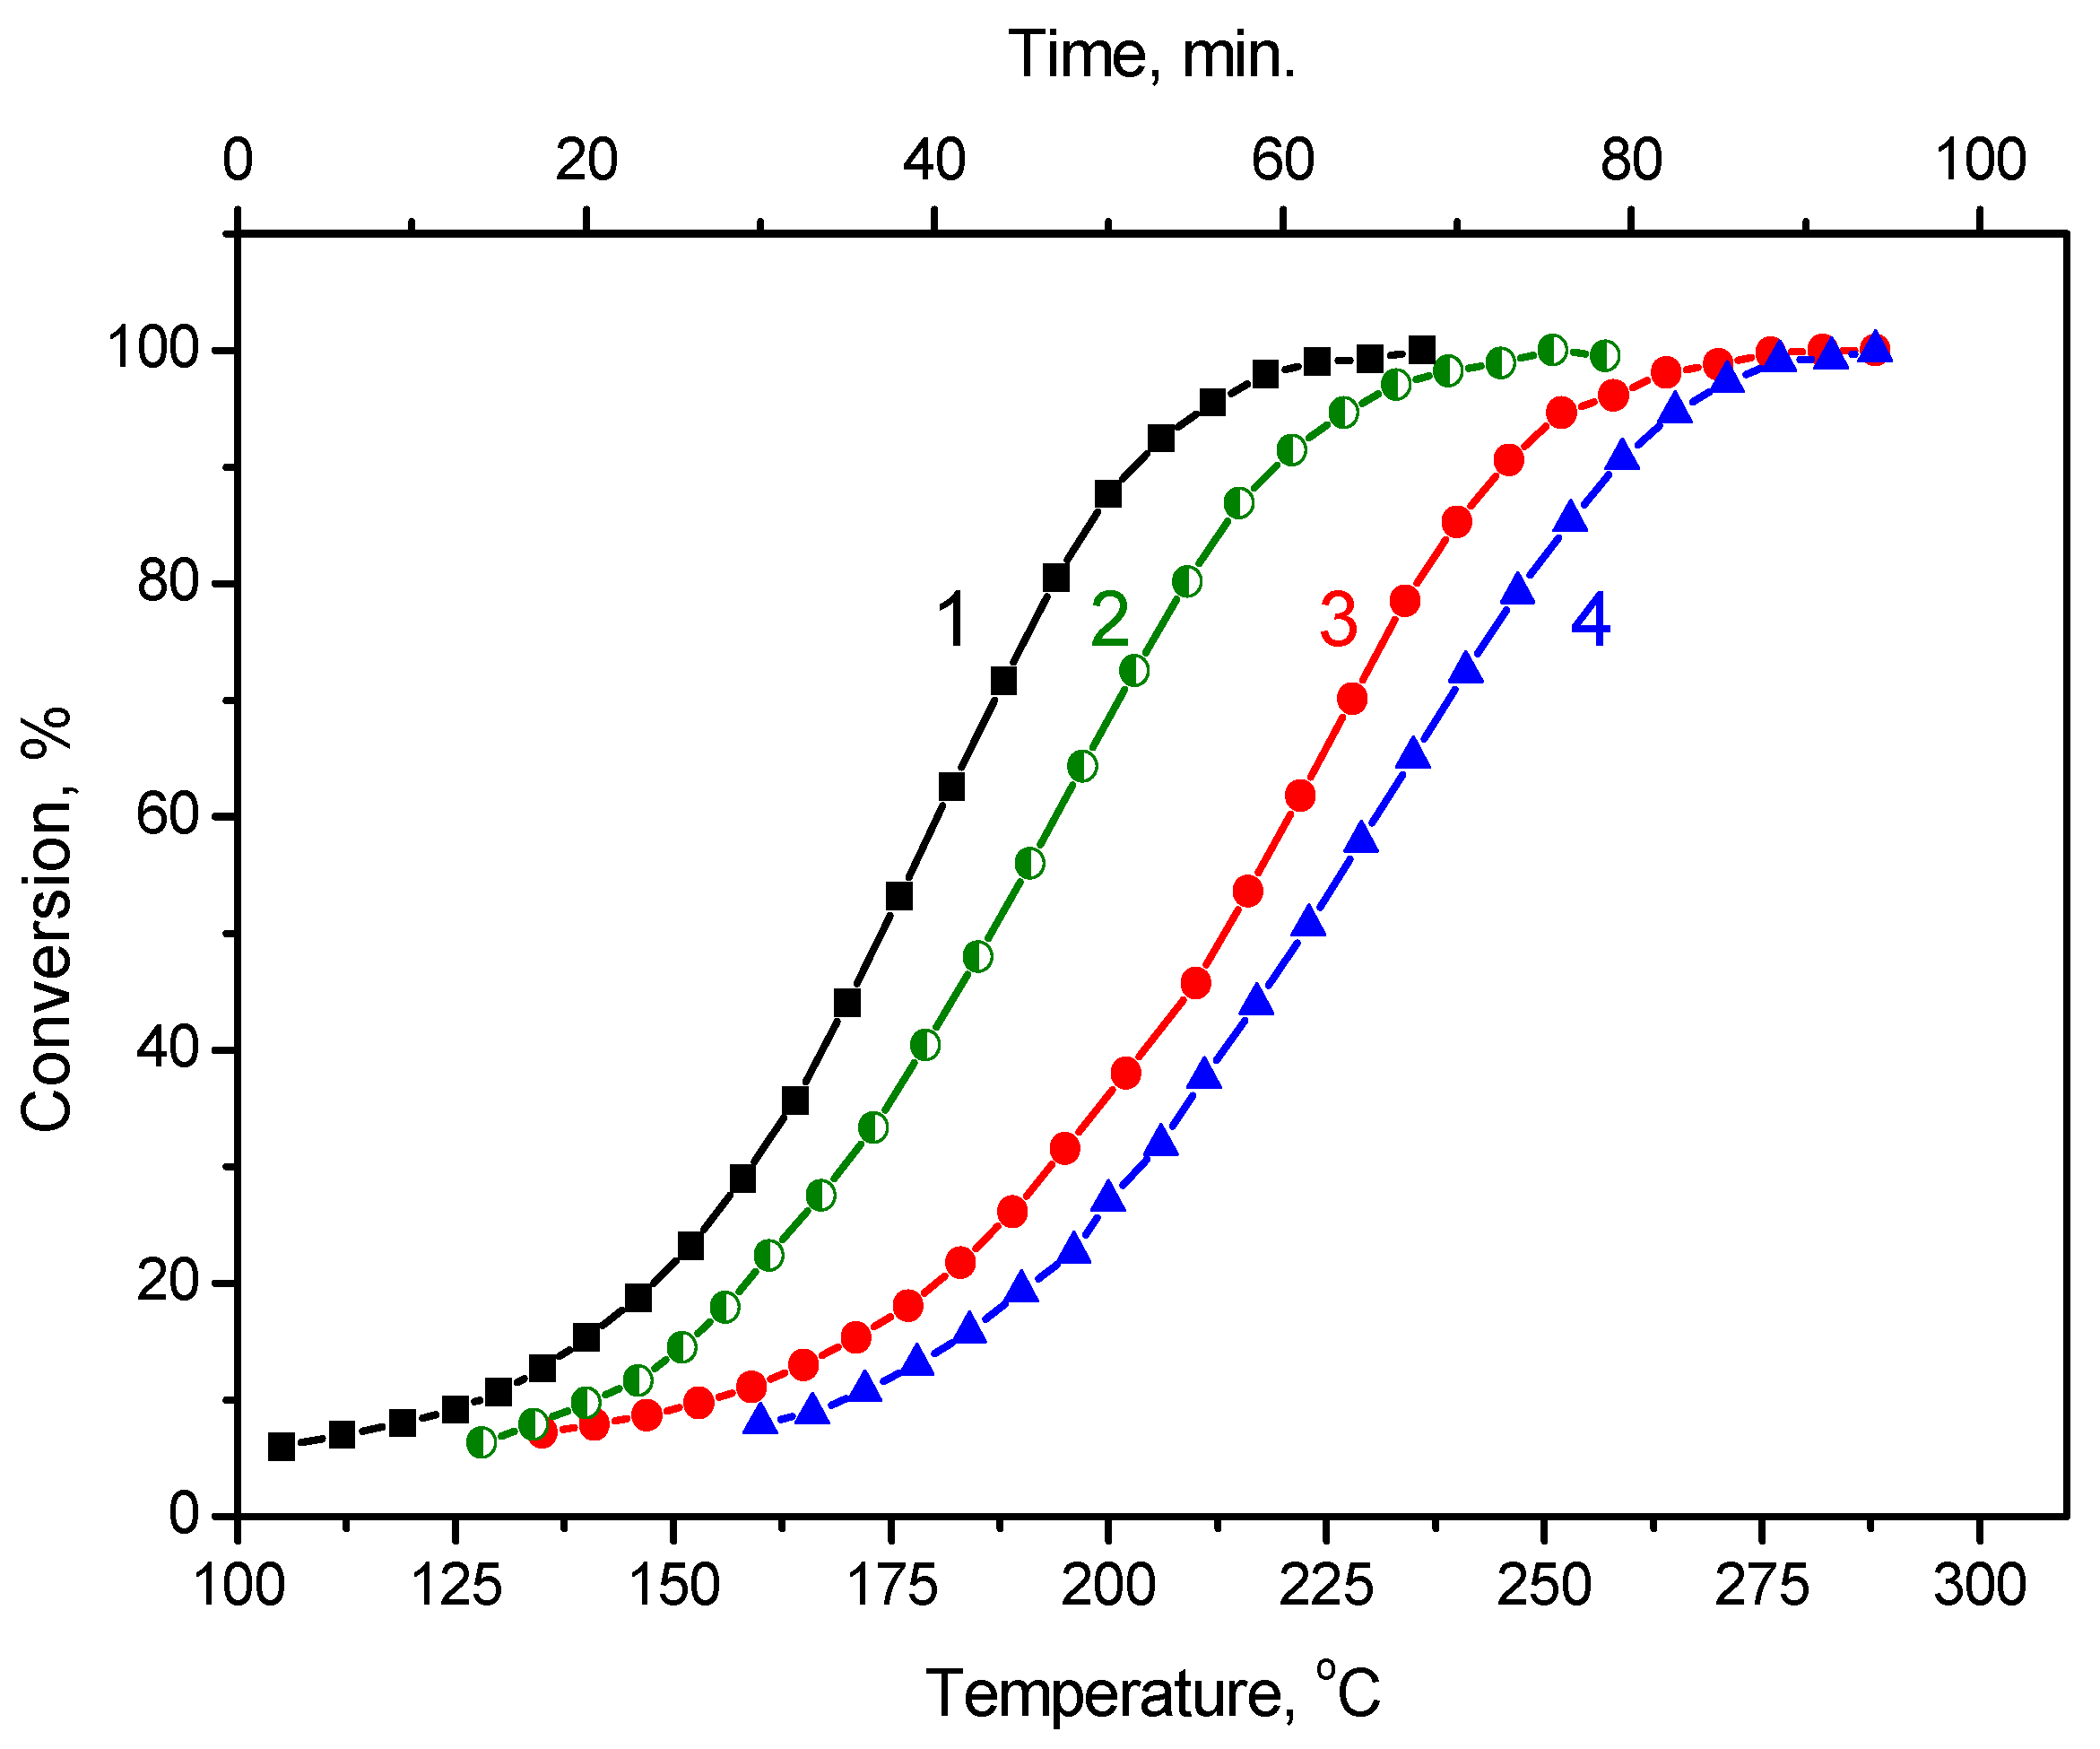
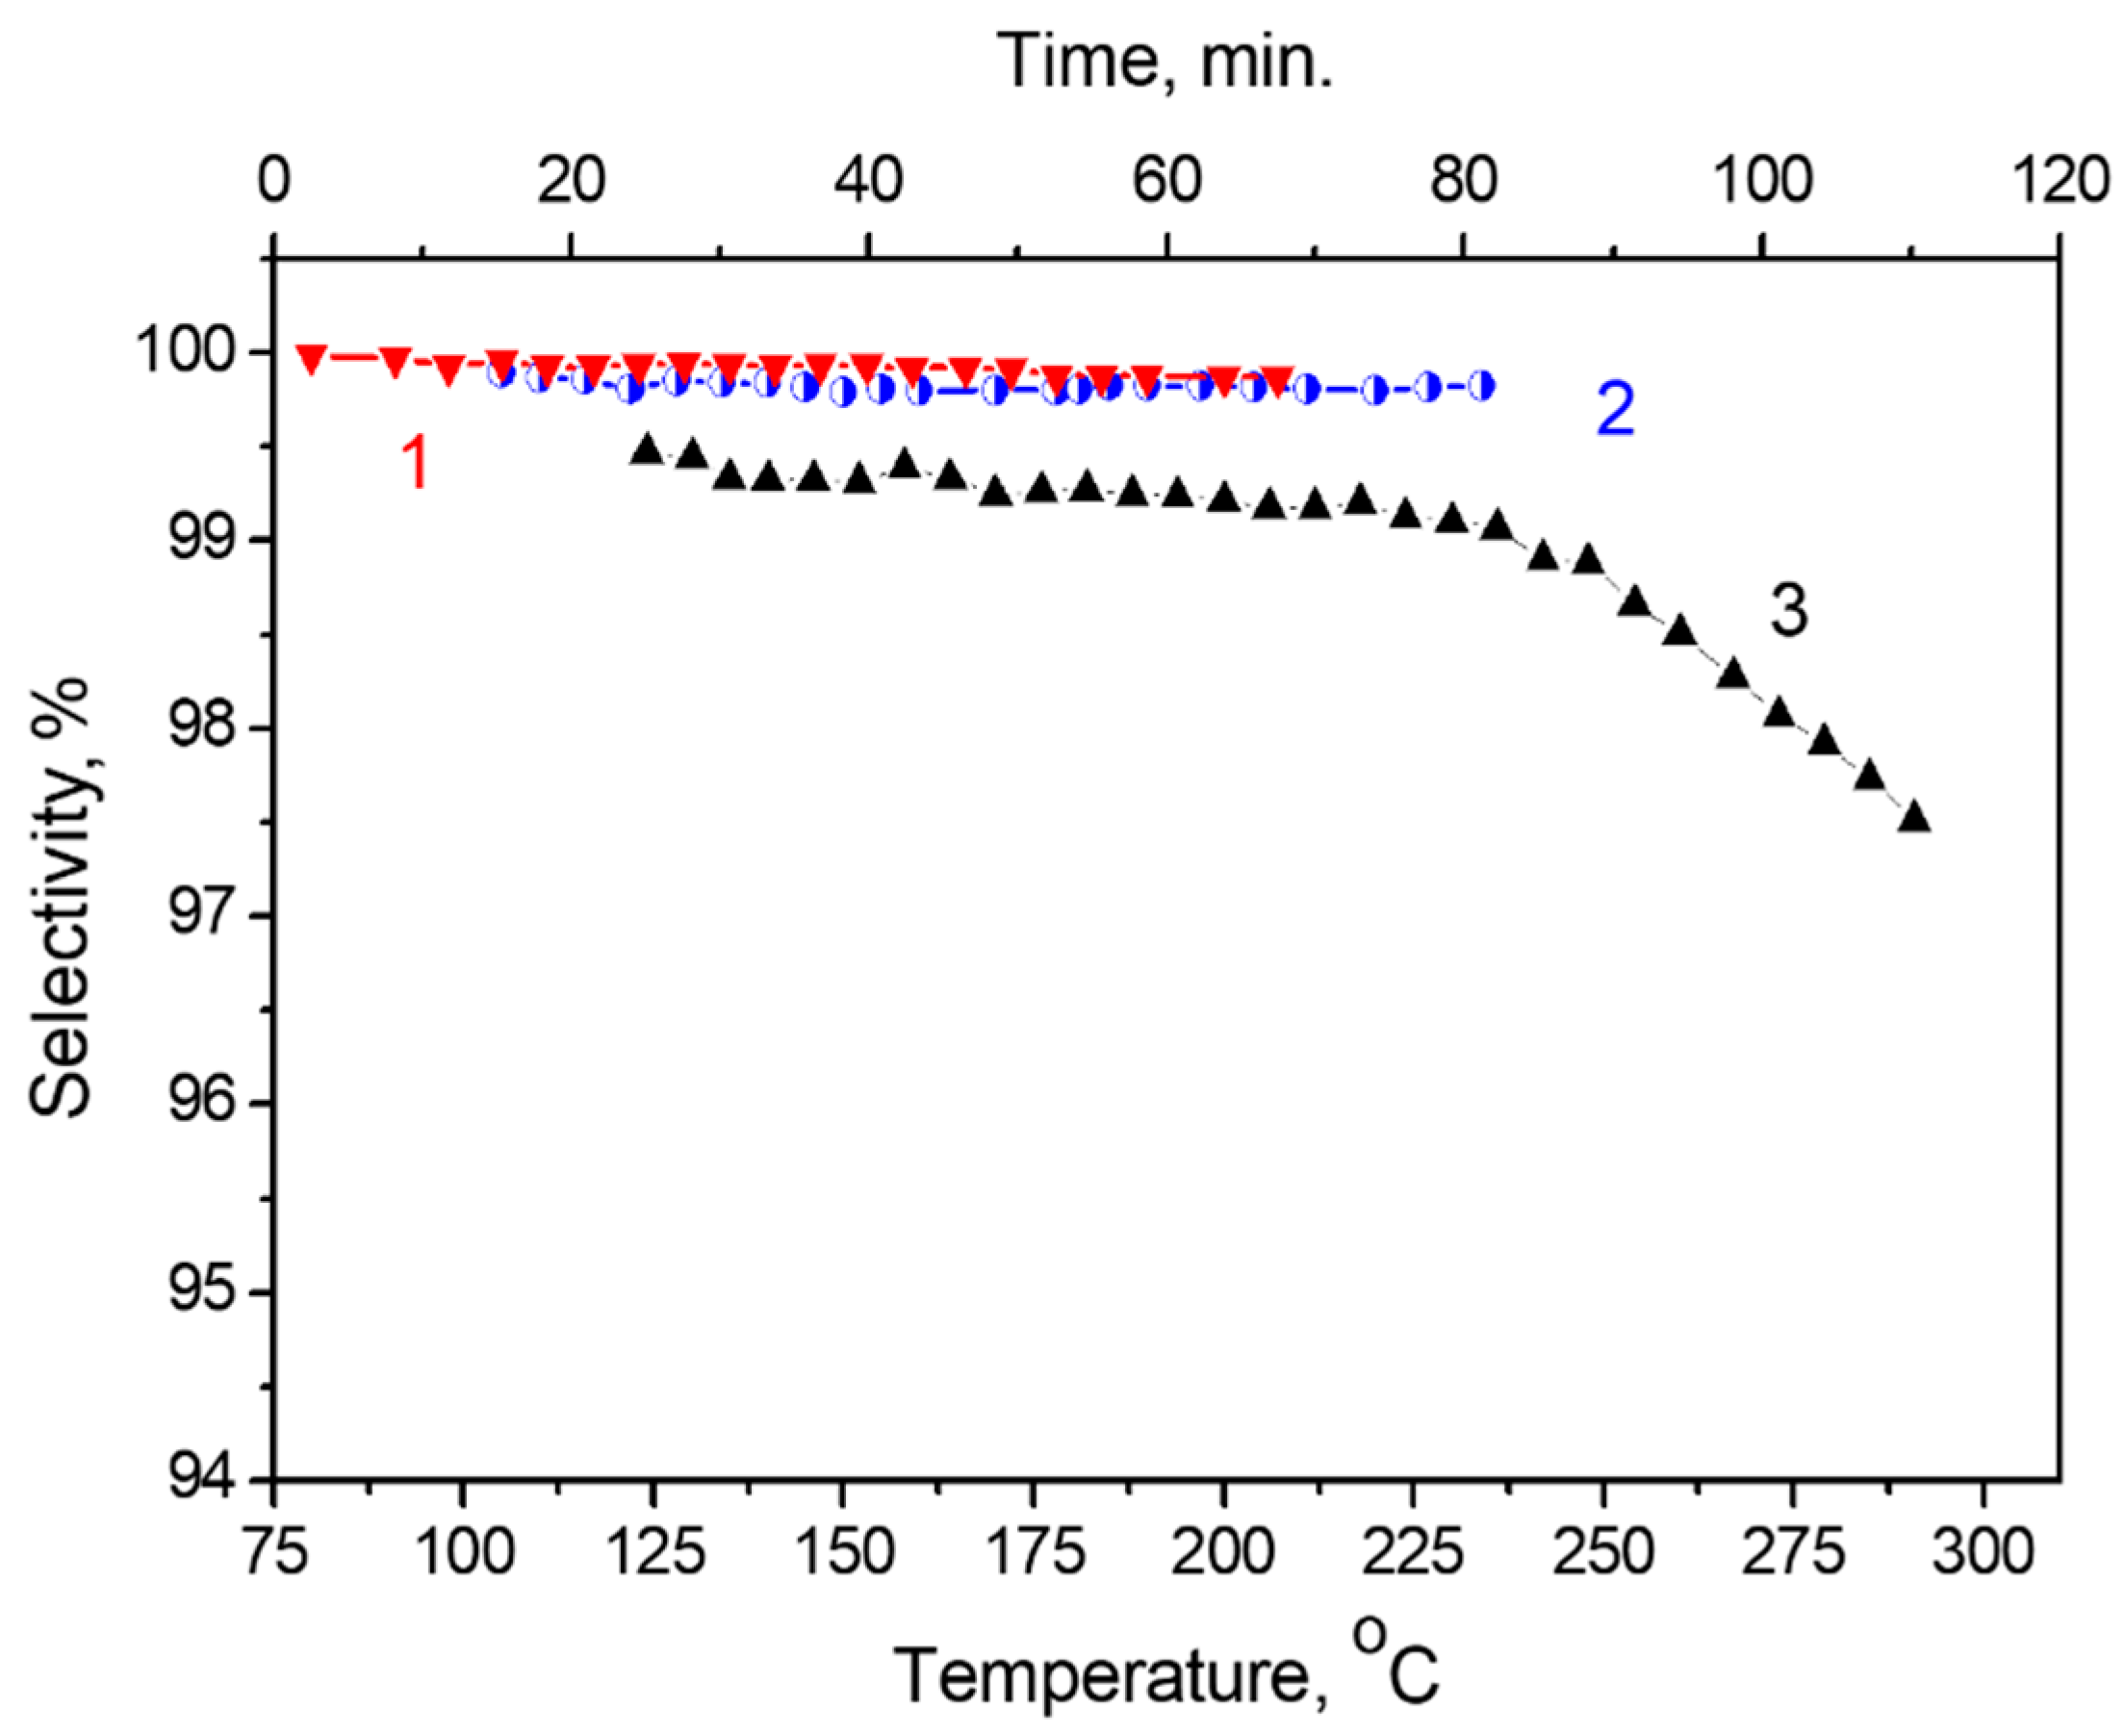
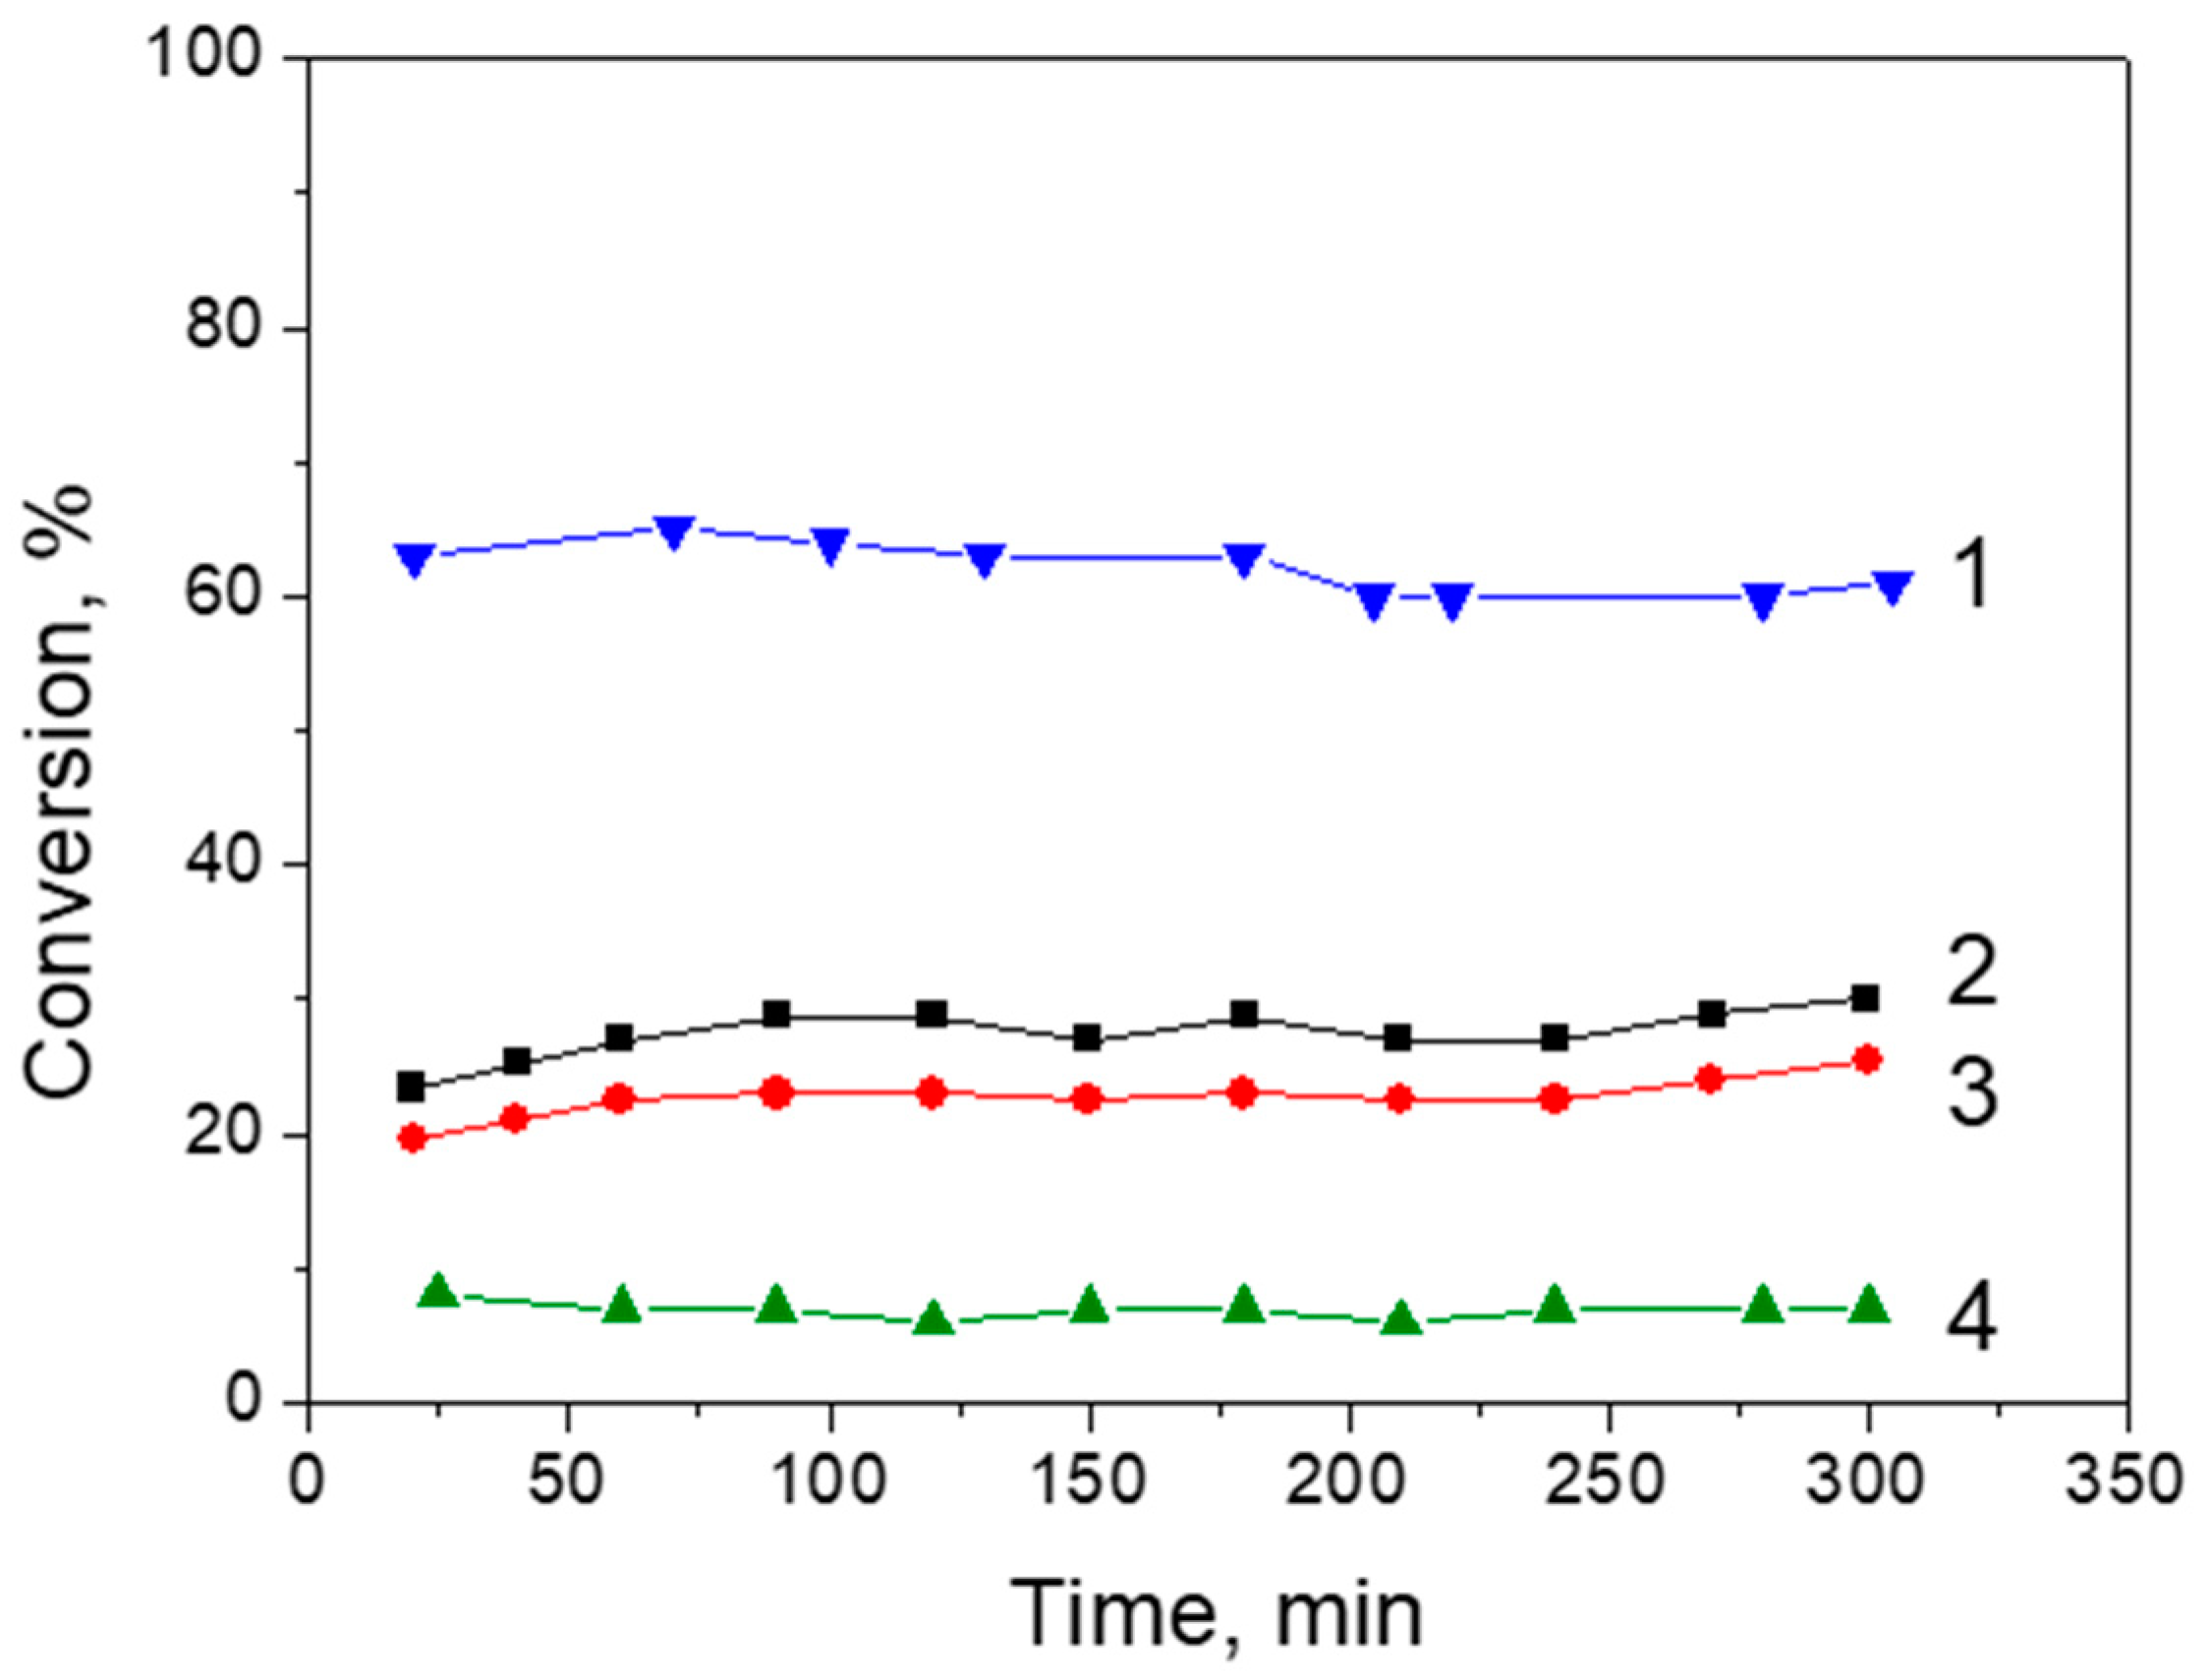
2.8. Formic Acid Decomposition over Pt/Graphene and Pt/N-Graphene Catalysts Synthesized Using H2PtCl6

Pt/N-graphene catalysts with different platinum concentrations (0.2–1.0 wt.%) were studied in the FA decomposition.
The obtained data (Figure 12, Table 3) demonstrate that Pt/N-graphene catalysts synthesized using H2PtCl6 as the precursor were more active than the ones prepared using Pt (NO3)4. The temperature of the 50% FA conversion over the catalysts prepared using H2PtCl6 were lower by 13–19 °C than over the catalysts prepared using Pt(NO3)4. The catalytic activity of the Pt/N-graphene catalysts synthesized using H2PtCl6 as the precursor increased primarily due to higher platinum dispersion.
At 125 °C TOF of the 1% Pt/N-graphene (H2PtCl6) was 0.42 s−1. Various metals or alloys (Pd, Pt, Co, Au) supported on oxides (SiO2, CeO2, ZrO2) or carbon materials were used as the catalysts [54]. According to the analysis reported in [55], the reaction rate in TOF units can vary from 436 to 2268 h−1 in the gas phase. Therefore, significant differences in the TOF values can be explained both by the nature of the active metals and by the properties of the supports.
Literature data on the catalytic activity of Pd and Pt catalysts are reported in Table 4. The metals were deposited on carbon supports doped with nitrogen atoms.
The concentration of formic acid in the reaction mixture was 2 or 5 vol.%. TOFs were normalized to the total Pd or Pt content. The data were taken from refs. [18,21,56,57,58]. Consequently, the TOF value obtained in this study was quite high.
Platinum introduction resulted in an increase in the selectivity in the FA decomposition to hydrogen and CO2 for 0.2% Pt/N-graphene in comparison with N-graphene (Figure 11 and Figure 13).
The selectivity of 0.2% Pt/N-graphene varied from 99.5% at 120 °C to 97.5% at 290 °C (Figure 13). An increase in the platinum concentration in the catalysts to 0.4 and 1 wt.% led to an increase in the selectivity of FA decomposition to hydrogen and CO2 to 99.8–100%.
Therefore, the selectivity of FA decomposition following the pathway yielding H2 and CO2 was higher over the Pt/N-graphene catalysts synthesized using H2PtCl6 as the precursor than over the ones prepared using Pt (NO3)4.
An important characteristic of catalysts is their stability. Consequently, we studied the stability of our Pt/N-graphene catalysts in decomposition of FA (5 vol.% НCООН/Не) at 150 °C for 5 h. The dependence of the FA catalytic conversion on time over Pt/N-graphene catalysts is shown in Figure 14.
Figure 14 demonstrates that the activity of Pt/N-graphene catalysts synthesized using H2PtCl6 was proportional to the platinum concentration in the catalysts (curves 1, 3, 4). This resulted from the same platinum dispersity in these catalysts. Their catalytic activity is in an excellent agreement with the data obtained in the temperature-programmed reaction mode. The presented data also show that the catalysts were stable for at least 5 h. These data agree well with the data obtained in [21]. The 1% Pt/N-CNFs catalyst showed good stability in the FA decomposition reaction for 43 h at 175 °C [21]. The high stability of Pt/N-graphene catalysts was caused by their high selectivity to the formic acid decomposition pathway yielding H2 and CO2, and, consequently, low CO concentration in the reaction products. It is worthy of note that Pt/N-graphene (H2PtCl6) catalysts did not chemisorb CO at all at low temperatures.

3. Methods of Investigation

3.1. Synthesis of Graphene Doped with Nitrogen Atoms

Graphene was synthesized by the template method described in more detail earlier [49,50,59]. For N-graphene synthesis, magnesium oxide was heated in the argon flow to the desired temperature (650–750 °C). Then, the argon flow was switched off and the feed flow was opened. Magnesium oxide was subjected to carbonization with a 40% NH3–1% C2H2-C2H4 mixture in a quartz flow reactor equipped with a McBain spring balance, which made it possible to monitor the weight on the sample during the experiment. The surface area of the MgO precursor was 70 m2/g. A precursor mixture containing nitrogen (40%NH3–1%C2H2-C2H4) was used for the synthesis of nitrogen-modified graphene (N-graphene) because components of this mixture favored the formation of carbon deposits by the consecutive mechanism [60] via polymerization and condensation. Ammonia present in this mixture can be embedded into the carbon chains of the intermediate products. Thus, the forming carbon material is modified with nitrogen atoms. The carbon film was purified from MgO by treatment with an aqueous solution of ultra-pure hydrochloric acid. The specific surface area of the synthesized N-graphene was 1300 m2/g.

3.2. Synthesis of Pt/N-Graphene Catalysts

Platinum was deposited on N-graphene from an aqueous Pt(NO3)4 solution containing 250 μg/mL of platinum. A calculated amount of the Pt(NO3)4 solution was diluted with 10–15 mL distilled water. Then, 1.0 g of the carbon support was added under continuous mixing with a magnetic stirrer. After the water evaporation, the dry residue was moved to a porcelain dish and heated in a muffle furnace at 150 °C for 30 min. The platinum concentration in the catalyst was varied from 0.2 to 1 wt.%. Platinum deposition on N-graphene using an aqueous H2PtCl6 solution was performed in a similar way. Before the catalytic experiments, the Pt/N-graphene catalysts were reduced in a quartz flow reactor in a 50% H2-Ar flow at 250 °C for 30 min.
Hereafter, catalysts prepared using Pt(NO3)4 are denoted as “X% Pt/N-graphene Pt(NO3)4”. Catalysts prepared using H2PtCl6 are denoted as “X% Pt/N-graphene (H2PtCl6)”.

3.3. Formic Acid Decomposition over Pt/N-graphene Catalysts

The activity of the catalysts in decomposition of FA (5 vol.% НCООН/Не) was measured using a flow setup. A 20 mg catalyst sample was uniformly mixed with 0.5 cm3 of quartz sand (grain size of 0.25–0.5 mm). The reaction mixture preheated to 100 °C in a special box was fed into the reactor at the rate of 20 cm3/min. The experiments were carried out in the temperature-programmed mode at a ramp rate of 2 °/min with chromatographic analysis of the gas mixture. Before measuring the activity, the catalyst was reduced in a 10% H2/He mixture at 200 °C for 1 h. The reaction was monitored by measuring the CO and CO2 evolution. The chromatographic method has low sensitivity to CO. Therefore, before analysis, the carbon monoxide was converted to methane. The FA conversion was determined as the ratio of the sum of CO and CO2 concentrations to the initial FA concentration. The selectivity to CO2 (and H2) was determined as the ratio of the CO2 concentration to the sum of CO and CO2 concentrations.
The apparent turnover frequency (TOF) was calculated as a ratio of the reaction rate measured at low (<20%) conversions to the total number of platinum atoms in the catalysts.

3.4. Physicochemical Methods for Investigation of Pt/N-Graphene Catalysts

High-resolution transmission electron microscopy (HRTEM) using a ThemisZ (Thermo Fisher Scientific, Waltham, MA, USA) electron microscope with accelerating voltage of 200 kV and maximum lattice resolution of 0.07 nm was used for investigation of the structure and microstructure of the catalysts. The TEM images were recorded with a Ceta 16 (Thermo Fisher Scientific, Waltham, MA, USA) CCD matrix. High-angle annular dark-field imaging (HAADF STEM image) was performed using a standard ThemisZ detector. The samples for the HRTEM study were deposited on a holey carbon film mounted on a copper grid by the ultrasonic dispersal of the catalyst suspension in ethanol. The particle size distribution was calculated using microscopy images in ImageJ software.
XPS spectra were recorded using a SPECS XPS spectrometer with AlKα irradiation (hν = 1486.6 eV, 150 W). The binding energy scale (Eb) was calibrated using the positions of the base energy levels of gold and copper, Au4f7/2 (84.0 eV) and Cu2p3/2 (932.67 eV). Both survey spectra and specific spectral regions (Pt4f, C1s, N1s and O1s) were recorded at the analyst transmission energy of 20 eV. The spectral analysis and deconvolution of the measured photoelectron spectra were performed using the XPS Peak 4.1 computer program ver.6.1 (Raymund Kwok, freeware, Hong Kong, China) [61].
The EXAFS Station of the Siberian Synchrotron and Terahertz Radiation Center (SSTRC, Novosibirsk, Russia) was used to study the spectra of the Pd-K edge. The source of radiation used was the storage ring VEPP-3 [62] with the electron beam energy of 2 GeV and the average stored current of 80 mA. A channel-cut Si (111) monochromator was used to monitor the X-ray energy and all spectra were recorded under fluorescent and transmission mode, in ~1.5 eV steps.
Previously reported standard procedures were used to treat the EXAFS spectra [63,64]. Briefly, the background was removed by extrapolating the pre-edge region (in the forms of polynomials) onto the EXAFS region and the smooth part of the absorption coefficient was constructed by the three cubic splines. The initial point (k = 0) of the EXAFS spectrum was the inflection point of the edge of the X-ray absorption spectrum. Fourier transform modulus in the wave number interval of 3.0–12.0Å−1 was used to calculate the radial distribution of the atoms (RDF) function from the EXAFS spectra in k3χ(k). The interatomic distances (R) and coordination numbers (CN) were determined using the curve-fitting procedure with VIPER [64] and EXCURV92 [65] codes. After a preliminary Fourier filtering using the known XRD literature data for the bulk compounds, k3χ(k) in similar wave number intervals was realized. It should be noted that the values of Debye–Waller factors were fixed as 2σ2 = 0.009–0.014 Å2 and values of R-factor (%) were within ~7–12%.
Chemisorption experiments were performed using an AutoChem II 2920 (Micromeritics, Norcross, GA, USA) instrument in the pulse mode [66]. A helium mixture with CO was used for chemisorption. The catalyst samples were additionally reduced in hydrogen at 100 °C prior to the CO chemisorption. After cooling to 20 ± 1 °C, CO was dosed in the measurement chamber until the sample was saturated with CO. The fractions of exposed metal atoms (Ptsurface/Pttotal, DCO) were calculated assuming that the adsorption stoichiometry CO/Ptsurface was equal to 1.
The surface areas and porosity of the synthesized materials were determined by the BET method [67,68] using an ASAP-2400 (Micrometrics, Norcross, GA, USA) instrument.

4. Conclusions

The properties of a new catalytic system, Pt/N-graphene, were studied in the gas-phase FA decomposition to pure hydrogen. Graphene powder doped with nitrogen atoms was used as the carbon support. The graphene aggregates were found to have a plate-like shape, developed pore structure and size of about 1 μm. TEM studies showed that N-graphene particles consisting of 2–4 graphene layers had a globular shape, with the size ranging between 30–50 nm depending on the geometric parameters of the MgO template. The 0.2% Pt/N-graphene, 0.4% Pt/N-graphene and 1% Pt/N-graphene catalysts were synthesized by impregnation. According to the chemical mapping data, C and N atoms in N-graphene were evenly distributed in the analysis region.
The platinum precursor was found to have a substantial effect on the state of the metal in Pt/N-graphene catalysts. The platinum formed nanocrystals on the catalyst surface when Pt(NO3)4 was used as the precursor. The use of H2PtCl6 resulted in the formation of atomically dispersed platinum stabilized on the N-graphene surface.
XPS studies showed that the initial surface of platinum particles in the studied catalysts was predominantly in the oxidized state (Pt2+ and Pt4+). The peak with the binding energy of 72.4 eV can be assigned to the Pt2+ state formed due to the interaction with nitrogen sties of N-graphene. After reduction of the Pt/N-graphene catalysts in hydrogen in the spectrometer chamber at 100 °C, a significant amount of platinum remained in the Pt2+ state. Most likely, the presence of platinum in the Pt2+ state related to the strong interaction with nitrogen sites of the support (N-graphene).
Carbon structures with defects surrounded by four nitrogen atoms in the graphene layer feature strong interactions with platinum atoms and can be the stabilization sites of atomic platinum. The state of platinum on the surface affects the catalytic properties of Pt/N-graphene catalysts in the FA decomposition. The change of the Pt(NO3)4 precursor for H2PtCl6 leads to an increase in the catalytic activity, whereas the selectivity to the pathway resulting in the formation of H2 and CO2 reaches 100%. The studied catalysts were stable for at least 5 h.

Author Contributions

V.V.C.: conceptualization, methodology, data analysis and writing; V.V.K.: investigation, EXAFS spectroscopy; I.P.P.: investigation, photoelectron spectroscopy (XPS); E.Y.G.: investigation, high-resolution transmission electron microscopy (HRTEM). All authors have read and agreed to the published version of the manuscript.

Funding

This work was supported by the Ministry of Science and Higher Education of the Russian Federation (Agreement No. 075-15-2022-263).

Acknowledgments

The experiments were performed using large-scale research facilities “EXAFS spectroscopy beamline”. The study was performed at the shared research center SSTRC on the basis of the VEPP-4-VEPP-2000 complex at BINP SB RAS.

Conflicts of Interest

The authors declare no conflict of interest.

References

  1. Gil-San-Millan, R.; Grau-Atienza, A.; Johnson, D.; Rico-Francés, S.; Serrano, E.; Linares, N.; García-Martínez, J. Improving hydrogen production from the hydrolysis of ammonia borane by using multifunctional catalysts. Int. J. Hydrogen Energy 2018, 43, 17100–17111. [Google Scholar] [CrossRef]
  2. Shen, J.; Yang, L.; Hu, K.; Luo, W.; Cheng, G. Rh nanoparticles supported on graphene as efficient catalyst for hydrolytic dehydrogenation of amine boranes for chemical hydrogen storage. Int. J. Hydrogen Energy 2015, 40, 1062–1070. [Google Scholar] [CrossRef]
  3. Wang, Y.; Lu, Y.; Wang, D.; Wu, S.; Cao, Z.; Zhang, K.; Liu, H.; Xin, S. Hydrogen generation from hydrolysis of sodium borohydride using nanostructured NiB catalysts. Int. J. Hydrogen Energy 2016, 41, 16077–16086. [Google Scholar] [CrossRef]
  4. Nielsen, M.; Alberico, E.; Baumann, W.; Drexler, H.-J.; Junge, H.; Gladiali, S.; Beller, M. Low-temperature aqueous-phase methanol dehydrogenation to hydrogen and carbon dioxide. Nature 2013, 495, 85–89. [Google Scholar] [CrossRef]
  5. Valera-Medina, A.; Xiao, H.; Owen-Jones, M.; Wif, D.; Bowen, P.J. Ammonia for power. Prog. Energy Combust. Sci. 2018, 69, 63–102. [Google Scholar] [CrossRef]
  6. Zhong, H.; Iguchi, M.; Chatterjee, M.; Himeda, Y.; Xu, Q.; Kawanami, H. Formic Acid-Based Liquid Organic Hydrogen Carrier System with Heterogeneous Catalysts. Adv. Sust. Syst. 2018, 2, 1700161. [Google Scholar] [CrossRef]
  7. Wang, X.; Meng, Q.; Gao, L.; Jin, Z.; Ge, J.; Liu, C.; Xing, X. Recent progress in hydrogen production from formic acid decomposition. Int. J. Hydrogen Energy 2018, 43, 7055–7071. [Google Scholar] [CrossRef]
  8. Grasemann, M.; Laurenczy, G. Formic acid as a hydrogen source—Recent developments and future trends. Energy Environ. Sci. 2012, 5, 8171–8181. [Google Scholar] [CrossRef]
  9. Eppinger, J.; Huang, K.-W. Formic acid as a hydrogen energy carrier. ACS Energy Lett. 2017, 2, 188–195. [Google Scholar] [CrossRef]
  10. Bulushev, D.A.; Ross, J.R.H. Towards Sustainable Production of Formic Acid. ChemSusChem 2018, 11, 821–836. [Google Scholar] [CrossRef] [Green Version]
  11. Reichert, J.; Brunner, B.; Jess, A.; Wasserscheid, P.; Albert, J. Biomass Oxidation to Formic Acid in Aqueous Media Using Polyoxometalate Catalysts—Boosting Fa Selectivity by in-Situ Extraction. Energy Environ. Sci. 2015, 8, 2985–2990. [Google Scholar]
  12. Gromov, N.V.; Medvedeva, T.B.; Sorokina, K.N.; Samoylova, Y.V.; Rodikova, Y.A.; Parmon, V.N. Direct Conversion of Microalgae Biomass to Formic Acid under an Air Atmosphere with Soluble and Solid Mo-V-P Heteropoly Acid Catalysts. ACS Sustain. Chem. Eng. 2020, 8, 18947–18956. [Google Scholar] [CrossRef]
  13. Gromov, N.V.; Taran, O.P.; Delidovich, I.V.; Pestunov, A.V.; Rodikova, Y.A.; Yatsenko, D.A.; Zhizhina, E.G.; Parmon, V.N. Hydrolytic Oxidation of Cellulose to Formic Acid in the Presence of Mo-V-P Heteropoly Acid Catalysts. Catal. Today 2016, 278, 74–81. [Google Scholar] [CrossRef]
  14. Jia, L.; Bulushev, D.A.; Podyacheva, O.Y.; Boronin, A.I.; Kibis, L.S.; Gerasimov, E.Y.; Beloshapkin, S.; Seryak, I.A.; Ismagilov, Z.R.; Ross, J.R.H. Pt nanoclusters stabilized by N-doped carbon nanofibers for hydrogen production from formic acid. J. Catal. 2013, 307, 94–102. [Google Scholar] [CrossRef]
  15. Ayusheev, A.B.; Taran, O.P.; Seryak, I.A.; Podyacheva, O.Y.; Descorme, C.; Besson, M.; Kibis, L.S.; Boronin, A.I.; Romanenko, A.I.; Ismagilov, Z.R.; et al. Ruthenium nanoparticles supported on nitrogen-doped carbon nanofibers for the catalytic wet air oxidation of phenol. Appl. Catal. B 2014, 146, 177–185. [Google Scholar] [CrossRef]
  16. Ismagilov, Z.R.; Shalagina, A.E.; Podyacheva, O.Y.; Barnakov, C.N.; Kozlov, A.P.; Kvon, R.I.; Ismagilov, I.Z.; Kerzhentsev, M.A. Synthesis of nitrogen-containing carbon materials for solid polymer fuel cell cathodes. Kinet. Catal. 2007, 48, 581–588. [Google Scholar] [CrossRef]
  17. Podyacheva, O.Y.; Ismagilov, Z.R. Nitrogen-Doped Carbon Nanomaterials: To the Mechanism of Growth, Electrical Conductivity and Application in Catalysis. Catal. Today 2015, 249, 12–22. [Google Scholar] [CrossRef]
  18. Zacharska, M.; Bulusheva, L.G.; Lisitsyn, A.S.; Beloshapkin, S.; Guo, Y.; Chuvilin, A.L.; Shlyakhova, E.V.; Podyacheva, O.Y.; Leahy, J.J.; Okotrub, A.V.; et al. Factors Influencing the Performance of Pd/C Catalysts in the Green Production of Hydrogen from Formic Acid. ChemSusChem 2017, 10, 720–730. [Google Scholar] [CrossRef]
  19. Chesnokov, V.V.; Kriventsov, V.V.; Malykhin, S.E.; Chichkan, A.S.; Podyacheva, O.Y. Stabilization of Palladium Atoms in Nitrogen-Doped Porphyrin-Like Fragments of Carbon Nanofibers. J. Struct. Chem. 2018, 59, 839–846. [Google Scholar] [CrossRef]
  20. Chesnokov, V.V.; Kriventsov, V.V.; Malykhin, S.E.; Svintsitskiy, D.A.; Podyacheva, O.Y.; Lisitsyn, A.S.; Richards, R.M. Nature of Active Palladium Sites on Nitrogen Doped Carbon Nanofibers in Selective Hydrogenation of Acetylene. Diam. Relat. Mater. 2018, 89, 67–73. [Google Scholar] [CrossRef]
  21. Bulushev, D.A.; Zacharska, M.; Lisitsyn, A.S.; Podyacheva, O.Y.; Hage, F.S.; Ramasse, Q.M.; Bangert, U.; Bulusheva, L.G. Single Atoms of Pt-Group Metals Stabilized by N-Doped Carbon Nanofibers for Efficient Hydrogen Production from Formic Acid. ACS Catal. 2016, 6, 3442–3451. [Google Scholar] [CrossRef]
  22. Zacharska, M.; Podyacheva, O.Y.; Kibis, L.S.; Boronin, A.I.; Senkovskiy, B.V.; Gerasimov, E.Y.; Taran, O.P.; Ayusheev, A.B.; Parmon, V.N.; Leahy, J.J.; et al. Ruthenium Clusters on Carbon Nanofibers for Formic Acid Decomposition: Effect of Doping the Support with Nitrogen. ChemCatChem 2015, 7, 2910–2917. [Google Scholar] [CrossRef]
  23. Golub, F.S.; Beloshapkin, S.; Gusel’nikov, A.V.; Bolotov, V.A.; Parmon, V.N.; Bulushev, D.A. Boosting hydrogen production from formic acid over Pd catalysts by deposition of N-containing precursors on the carbon support. Energies 2019, 12, 3885. [Google Scholar] [CrossRef]
  24. Ning, X.; Li, Y.; Dong, B.; Wang, H.; Yu, H.; Peng, F.; Yang, Y. Electron transfer dependent catalysis of Pt on N-doped carbon nanotubes: Effects of synthesis method on metal-support interaction. J. Catal. 2017, 348, 100–109. [Google Scholar] [CrossRef]
  25. Huang, C.; Li, C.; Shi, G. Graphene based catalysts. Energy Environ. Sci. 2012, 5, 8848–8868. [Google Scholar] [CrossRef]
  26. Luo, Q.; Zhang, W.; Fu, C.F.; Yang, J. Single Pd atom and Pd dimer embedded graphene catalyzed formic acid dehydrogenation: A first-principles study. Int. J. Hydrogen Energy 2018, 43, 6997–7006. [Google Scholar] [CrossRef]
  27. Jeyakumar, T.C.; Sivasankar, C. Dehydrogenation of formic acid catalysed by M-embedded nitrogen-doped graphene (M = Fe, Ru, Os): A DFT study. New J. Chem. 2019, 43, 1440–1448. [Google Scholar] [CrossRef]
  28. Feng, J.R.; Wang, G.C. Theoretical insight into the role of nitrogen in the formic acid decomposition over Pt13/N-GNS. Appl. Surf. Sci. 2021, 539, 148192. [Google Scholar] [CrossRef]
  29. Grad, O.; Mihet, M.; Dan, M.; Blanita, G.; Radu, T.; Berghian-Grosan, C.; Lazar, M.D. Au/reduced graphene oxide composites: Eco-friendly preparation method and catalytic applications for formic acid dehydrogenation. J. Mater. Sci. 2019, 54, 6991–7004. [Google Scholar] [CrossRef]
  30. Li, S.J.; Ping, Y.; Yan, J.M.; Wang, H.L.; Wu, M.; Jiang, Q. Facile synthesis of AgAuPd/graphene with high performance for hydrogen generation from formic acid. J. Mater. Chem. A 2015, 3, 14535–14538. [Google Scholar] [CrossRef]
  31. Zhao, X.; Dai, P.; Xu, D.; Li, Z.; Guo, Q. Ultrafine palladium nanoparticles anchored on NH2-functionalized reduced graphene oxide as efficient catalyst towards formic acid dehydrogenation. Int. J. Hydrogen Energy 2020, 45, 30396–30403. [Google Scholar] [CrossRef]
  32. Yan, J.M.; Li, S.J.; Yi, S.S.; Wulan, B.R.; Zheng, W.T.; Jiang, Q. Anchoring and upgrading ultrafine NiPd on room-temperature-synthesized bifunctional NH2-N-rGO toward low-cost and highly efficient catalysts for selective formic acid dehydrogenation. Adv. Mater. 2018, 30, 1703038. [Google Scholar] [CrossRef]
  33. Moroz, E.M.; Kriventsov, V.V.; Kochubei, D.I. EuroPt-1 catalyst: Radial distribution of electron density X-ray diffraction and EXAFS studies. J. Struct. Chem. 2009, 50, 1082–1087. [Google Scholar] [CrossRef]
  34. Vedyagin, A.A.; Volodin, A.M.; Kenzhin, R.M.; Stoyanovskii, V.O.; Rogov, V.A.; Kriventsov, V.V.; Mishakov, I.V. The Role of Chemisorbed Water in Formation and Stabilization of Active Sites on Pd/Alumina Oxidation Catalysts. Catal. Today 2018, 307, 102–110. [Google Scholar] [CrossRef]
  35. Baklanova, N.I.; Morozova, N.B.; Kriventsov, V.V.; Titov, A.T. Synthesis and microstructure of Iridium coatings on carbon fibers. Carbon 2013, 56, 243–254. [Google Scholar] [CrossRef]
  36. Chistyakov, A.V.; Tsodikov, M.V.; Murzin, V.Y.; Yandieva, F.A.; Zubavichus, Y.V.; Kozitsyna, N.Y.; Gekhman, A.E.; Kriventsov, V.V.; Moiseev, I.I. Cocatalytic effect of Palladium and Zinc in the condensation of alcohol carbon backbones into hydrocarbons. Kinet. Catal. 2011, 52, 258–272. [Google Scholar] [CrossRef]
  37. Loponov, K.N.; Kriventsov, V.V.; Nagabhushana, K.S.; Boennemann, H.; Kochubey, D.I.; Savinova, E.R. Combined in situ EXAFS and Electrochemical Investigation of the Oxygen Reduction Reaction on Unmodified and Se-Modified Ru/C. Catal. Today 2009, 147, 260–269. [Google Scholar] [CrossRef]
  38. Beck, I.E.; Kriventsov, V.V.; Ivanov, D.P.; Zaikovsky, V.I.; Bukhtiyarov, V.I. XAFS Study of Pt/Al2O3 Nanosystem with Metal-Oxide Active Component. Nucl. Instrum. Methods Phys. Res. Sect. A 2009, 603, 108–110. [Google Scholar] [CrossRef]
  39. Beck, I.E.; Kriventsov, V.V.; Fedotov, M.A.; Bukhtiyarov, V.I. Unique Stability of μ-Hydroxo Ligands in Pt(IV) Complexes Towards Alkaline Hydrolysis. Nucl. Instrum. Methods Phys. Res. Sect. A 2009, 603, 182–184. [Google Scholar] [CrossRef]
  40. Beck, I.E.; Kriventsov, V.V.; Ivanov, D.P.; Yakimchuk, E.P.; Novgorodov, B.N.; Zaikovskii, V.I.; Bukhtiyarov, V.I. Study of the Local Structure of Supported Nanostructural Platinum Catalysts. J. Struct. Chem. 2010, 51 (Suppl. S1), S11–S19. [Google Scholar] [CrossRef]
  41. Buyanova, N.E.; Ibragimova, N.B.; Karnaukhov, A.P.; Koroleva, N.G. Separate determination of the surface of complex catalysts by chromatographic methods. III. Palladium on aluminum oxide. Kinet. Catal. 1972, 13, 1295–1302. (In Russian) [Google Scholar]
  42. Gupta, S.; Qiao, L.; Zhao, S.; Xu, H.; Lin, Y.; Devaguptapu, S.V.; Wang, X.; Swihart, M.T.; Wu, G. Highly Active and Stable Graphene Tubes Decorated with FeCoNi Alloy Nanoparticles via a Template-Free Graphitization for Bifunctional Oxygen Reduction and Evolution. Adv. Energy Mater. 2016, 6, 1601198. [Google Scholar] [CrossRef]
  43. Zhang, R.; Jing, X.; Chu, Y.; Wang, L.; Kang, W.; Wei, D.; Li, H.; Xiong, S. Nitrogen/oxygen co-doped monolithic carbon electrodes derived from melamine foam for high-performance supercapacitors. J. Mater. Chem. A 2018, 6, 17730. [Google Scholar] [CrossRef]
  44. Wu, P.; Qian, Y.; Du, P.; Zhang, H.; Cai, C. Facile synthesis of nitrogen-doped graphene for measuring the releasing process of hydrogen peroxide from living cells. J. Mater. Chem. 2012, 22, 6402. [Google Scholar] [CrossRef]
  45. Chesnokov, V.V.; Chichkan, A.S.; Paukshtis, E.A.; Svintsitskiy, D.A.; Ismagilov, Z.R.; Parmon, V.N. Surface Modification of Single-Walled Carbon Nanotubes by Functional Nitrogen-Containing Groups and Study of Their Properties. Dokl. Phys. Chem. 2017, 476, 186–189. [Google Scholar] [CrossRef]
  46. Arrigo, R.; Schuster, M.E.; Xie, Z.; Yi, Y.; Wowsnick, G.; Sun, L.L.; Hermann, K.E.; Friedrich, M.; Kast, P.; Hävecker, M.; et al. Nature of the N–Pd Interaction in Nitrogen-Doped Carbon Nanotube Catalysts. ACS Catal. 2015, 5, 2740. [Google Scholar] [CrossRef]
  47. Shao, Y.; Zhang, S.; Engelhard, M.H.; Li, G.; Shao, G.; Wang, Y.; Liu, J.; Aksay, I.A.; Lin, Y. Nitrogen-doped graphene and its electrochemical applications. J. Mater. Chem. 2010, 20, 7491–7496. [Google Scholar] [CrossRef]
  48. Li, D.; Yu, C.; Wang, M.; Zhang, Y.; Pan, C. Synthesis of nitrogen doped graphene from graphene oxide within an ammonia flame for high performance supercapacitors. RSC Adv. 2014, 4, 55394. [Google Scholar] [CrossRef]
  49. Chesnokov, V.V.; Chichkan, A.S.; Svintsitskiy, D.A.; Gerasimov, E.Y.; Parmon, V.N. A Method for Synthesis of Nitrogen-Doped Graphene with High Specific Surface Area. Dokl. Phys. Chem. 2020, 495, 159–165. [Google Scholar] [CrossRef]
  50. Chesnokov, V.V.; Chichkan, A.S.; Bedilo, A.F.; Shuvarakova, E.I. Synthesis of Carbon-Mineral Composites and Graphene, Fullerenes. Nanotub. Carbon Nanostruct. 2020, 28, 402–406. [Google Scholar] [CrossRef]
  51. Santiago, S.R.M.; Wong, Y.-A.; Lin, T.-N.; Chang, C.-H.; Yuan, C.-T.; Shen, J.-L. Effect of nitrogen doping on the photoluminescence intensity of graphene quantum dots. Optics Lett. 2017, 42, 3642–3645. [Google Scholar] [CrossRef] [PubMed]
  52. NIST Crystallographic Data Center. ICSD Code: 76153 for Bulk Metal Pt0; NIST Crystallographic Data Center: Gaithersburg, MD, USA, 2008. Available online: https://www.nist.gov/programs-projects/crystallographic-databases (accessed on 7 August 2022).
  53. Lu, B.; Liu, Q.; Nichols, F.; Mercado, R.; Morris, D.; Li, N.; Zhang, P.; Gao, P.; Ping, Y.; Chen, S. Oxygen Reduction Reaction Catalyzed by Carbon-Supported Platinum Few-Atom Clusters: Significant Enhancement by Doping of Atomic Cobalt. Research 2020, 2020, 9167829. [Google Scholar] [CrossRef] [PubMed]
  54. Kazakova, M.A.; Selyutin, A.G.; Ishchenko, A.V.; Lisitsyn, A.S.; Koltunov, K.Y.; Sobolev, V.I. Co/multi-walled carbon nanotubes as highly efficient catalytic nanoreactor for hydrogen production from formic acid. Int. J. Hydrogen Energy 2020, 45, 19420–19430. [Google Scholar] [CrossRef]
  55. Tang, C.; Surkus, A.E.; Pohl, M.M.; Agostini, G.; Schneider, M.; Junge, H.; Beller, M. A stable nanocobalt catalyst with highly dispersed CoNx active sites for the selective dehydrogenation of formic acid. Angew. Chem. Int. Ed. 2017, 56, 16616–16620. [Google Scholar] [CrossRef] [PubMed]
  56. Bulushev, D.A.; Bulusheva, L.G. Catalysts with single metal atoms for the hydrogen production from formic acid. Catal. Rev. 2021, 1–40. [Google Scholar] [CrossRef]
  57. Podyacheva, O.; Bulushev, D.; Suboch, A.; Svintsitskiy, D.; Lisitsyn, A.; Modin, E.; Chuvilin, A.; Gerasimov, E.; Sobolev, V.; Parmon, V. Highly Stable Single-atom Catalyst with Ion ic Pd Active Sites Supported on N-doped Carbon Nanotubes for Formic Acid Decomposition. ChemSusChem 2018, 11, 3724–3727. [Google Scholar] [CrossRef]
  58. Podyacheva, O.; Lisitsyn, A.; Kibis, L.; Boronin, A.; Stonkus, O.; Zaikovskii, V.; Suboch, A.; Sobolev, V.; Parmon, V. Nitrogen Doped Carbon Nanotubes and Nanofibers for Green Hydrogen Production: Similarities in the Nature of Nitrogen Species, Metal–Nitrogen Interaction, and Catalytic Properties. Energies 2019, 12, 3976. [Google Scholar] [CrossRef]
  59. Chesnokov, V.V.; Chichkan, A.S.; Bedilo, A.F.; Shuvarakova, E.I.; Parmon, V.N. Template Synthesis of Graphene. Dokl. Phys. Chem. 2019, 488, 154–157. [Google Scholar] [CrossRef]
  60. Buyanov, R.A. Zakoksovanie katalizatorov (Catalyst Coking); Nauka, M., Ed.; Nauka: Novosibirsk, Russia, 1983; p. 207. (In Russian) [Google Scholar]
  61. Available online: http://xpspeak.software.informer.com/4.1/ (accessed on 7 August 2022).
  62. Levichev, E.B. Status and perspectives of VEPP-4 complex. In Particles and Nuclei, Letters; Nauka: Moscow, Russia, 2016; p. 13. (In Russian) [Google Scholar]
  63. Kochubey, D.I. EXAFS Spectroscopy of Catalysts; Nauka: Novosibirsk, Russia, 1992. (In Russian) [Google Scholar]
  64. Klementev, K. Extraction of the fine structure from x-ray absorption spectra. J. Phys. D Appl. Phys. 2001, 34, 209–217. [Google Scholar] [CrossRef]
  65. Binsted, N.; Campbell, J.V.; Gurman, S.J.; Stephenson, P.C. SERC Daresbury Laboratory EXCURV92 Program; Daresbury Laboratory: Warrington, UK, 1991. [Google Scholar]
  66. Kaprielova, K.M.; Yakovina, O.A.; Ovchinnikov, I.I.; Koscheev, S.V.; Lisitsyn, A.S. Preparation of platinum-on-carbon catalysts via hydrolytic deposition: Factors influencing the deposition and catalytic properties. Appl. Catal. A 2012, 449, 203–214. [Google Scholar] [CrossRef]
  67. Gor, G.Y.; Thommes, M.; Cychosz, K.A.; Neimark, A.V. Quenched Solid Density Functional Theory Method for Characterization of Mesoporous Carbons by Nitrogen Adsorption. Carbon 2012, 50, 1583–1590. [Google Scholar] [CrossRef]
  68. Thommes, M.; Kaneko, K.; Neimark, A.V.; Olivier, J.P.; Rodriguez-Reinoso, F.; Rouquerol, J.; Sing, K.S.W. Physisorption of Gases, with Special Reference to the Evaluation of Surface Area and Pore Size Distribution (IUPAC Technical Report). Pure Appl. Chem. 2015, 87, 1051–1069. [Google Scholar] [CrossRef] [Green Version]
Figure 1. TEM images of N-graphene at different magnifications: particle agglomerates (a) and surface morphology (b).
Catalysts 12 01022 g001
Figure 2. TEM and HAADF STEM images of N-graphene (a) and 0.2 wt.% Pt/N-graphene. (Pt(NO3)4) (b).
Catalysts 12 01022 g002
Figure 3. HAADF STEM image of 0.4% Pt/N-graphene (H2PtCl6) catalyst (a) and EDX mapping of nitrogen and carbon atoms (b).
Catalysts 12 01022 g003
Figure 4. HAADF STEM images of 0.4% (a) and 1% Pt/N-graphene (H2PtCl6) (b) catalysts.
Catalysts 12 01022 g004
Figure 5. C1s XPS spectrum of fresh 0.4% Pt/N-graphene catalyst.
Catalysts 12 01022 g005
Figure 6. Deconvolution of N1s XPS spectrum of N-graphene with deconvolution to individual components.
Catalysts 12 01022 g006
Figure 7. Pt4f spectra of 0.4% Pt/N-graphene (a) and 1.0% Pt/N-graphene (b) catalyst samples before and after reduction in the spectrometer chamber.
Catalysts 12 01022 g007
Figure 8. RDF curves of atoms of the platinum local arrangement in 0.2% Pt/N-graphene (H2PtCl6) (1); 0.4% Pt/N-graphene (H2PtCl6) (2); 1.0% Pt/N-graphene (H2PtCl6) (3); Pt-foil*0.5 (4).
Catalysts 12 01022 g008
Figure 9. A model of a Pt atom stabilized on the N-graphene surface.
Catalysts 12 01022 g009
Figure 10. Dependence of the FA conversion on temperature over catalysts prepared using Pt(NO3)4 as the precursor: 1% Pt/N-graphene (Pt(NO3)4) (1); 0.2% Pt/N-graphene (Pt(NO3)4) (2); N-graphene (3).
Catalysts 12 01022 g010
Figure 11. Dependence of the selectivity in the FA decomposition to hydrogen and CO2 on temperature over catalysts prepared using Pt(NO3)4 as the precursor: 1% Pt/N-graphene (Pt(NO3)4) (1); 0.2% Pt/N-graphene (Pt(NO3)4) (2); N-graphene (3).
Catalysts 12 01022 g011
Figure 12. Dependence of the FA conversion on temperature over catalysts prepared using H2PtCl6 as the precursor: 1% Pt/N-graphene (H2PtCl6) (1); 0.4% Pt/N-graphene (H2PtCl6) (2); 0.2% Pt/N-graphene (H2PtCl6) (3); N-graphene (4).
Catalysts 12 01022 g012
Figure 13. Dependence of the selectivity in the FA decomposition to hydrogen and CO2 on temperature Pt/N-graphene catalysts synthesized using H2PtCl6 as the precursor: 1% Pt/N-graphene (H2PtCl6) (1); 0.4% Pt/N-graphene (H2PtCl6) (2); 0.2% Pt/N-graphene (H2PtCl6) (3).
Catalysts 12 01022 g013
Figure 14. Dependence of the FA conversion on time over catalysts: 1% Pt/N-graphene (H2PtCl6) (1); 1% Pt/N-graphene (Pt(NO3)4) (2); 0.4% Pt/N-graphene (H2PtCl6) (3); 0.2% Pt/N-graphene (H2PtCl6) (4). Reaction temperature: 150 °C.
Catalysts 12 01022 g014
Table 1. Fraction of surface platinum atoms determined by CO chemisorption and STEM HAADF images.
SampleThe Average Pt Particle Size, nm
From CO ChemisorptionFrom
STEM HAADF
0.2% Pt/N-graphene (Pt(NO3)4)1012
1% Pt/N-graphene (Pt(NO3)4)1516
Table 2. Average sizes of platinum particles Pt/N-graphene (H2PtCl6) catalysts determined by CO chemisorption and STEM.
SampleCO/Pt, %The Average Pt Particle Size, nm
From CO ChemisorptionFrom
STEM
0.2% Pt/N-graphene (H2PtCl6)2.0500.2
0.4% Pt/N-graphene (H2PtCl6)3.0330.2
1% Pt/N-graphene (H2PtCl6)5.9170.2
1% Pt/graphene (H2PtCl6)24.42.53
Table 3. Temperature of 50% FA conversion over the studied catalysts and the support.
CatalystT50%, °C
Precursor
Without PtPt (NO3)4H2PtCl6
1% Pt/N-graphene170151
0.4% Pt/N-graphene178
0.2% Pt/N-graphene213200
N-graphene245
Table 4. TOFs for the formic acid decomposition reaction at 125 °C over Pd and Pt catalysts (imp-prepared by impregnation, pr-prepared by precipitation) containing a significant content of single-atom sites.
CatalystsTOF, s−1
0.2% Pd/N-CNTs0.07
1% Pd/N-CNTs0.21
1% Pd/N-C0.28
0.2% Pt/N-CNTs pr0.21
0.2% Pt/N-CNTs imp0.26
0.3% Pt/N-CNFs0.25
1% Pt/N-CNFs0.24
1% Pt/N-graphene0.42
Publisher’s Note: MDPI stays neutral with regard to jurisdictional claims in published maps and institutional affiliations.

