1. Introduction
NO
x is a major air pollutant emitted from diesel vehicles. To reduce NO
x, selective catalyst reduction (SCR) systems have been widely used. Catalysts include large and medium pore zeolites such as ZSM-5, MOR, FER, and BEA, and small pore zeolites such as SSZ-13 and SAPO-34 [
1]. Among the NH
3-SCR catalysts, small pore zeolite catalysts such as Cu-SSZ-13 and Cu-SAPO-34 are being actively studied for their excellent NO
x reduction efficiency and good hydrothermal stability [
2,
3,
4]. Cu zeolite has a better SCR performance at low temperatures than Fe zeolite. Cu/SSZ-13 and Cu/SAPO are catalysts suitable for a wide temperature range with excellent hydrothermal stability, operating even below 350 °C [
1].
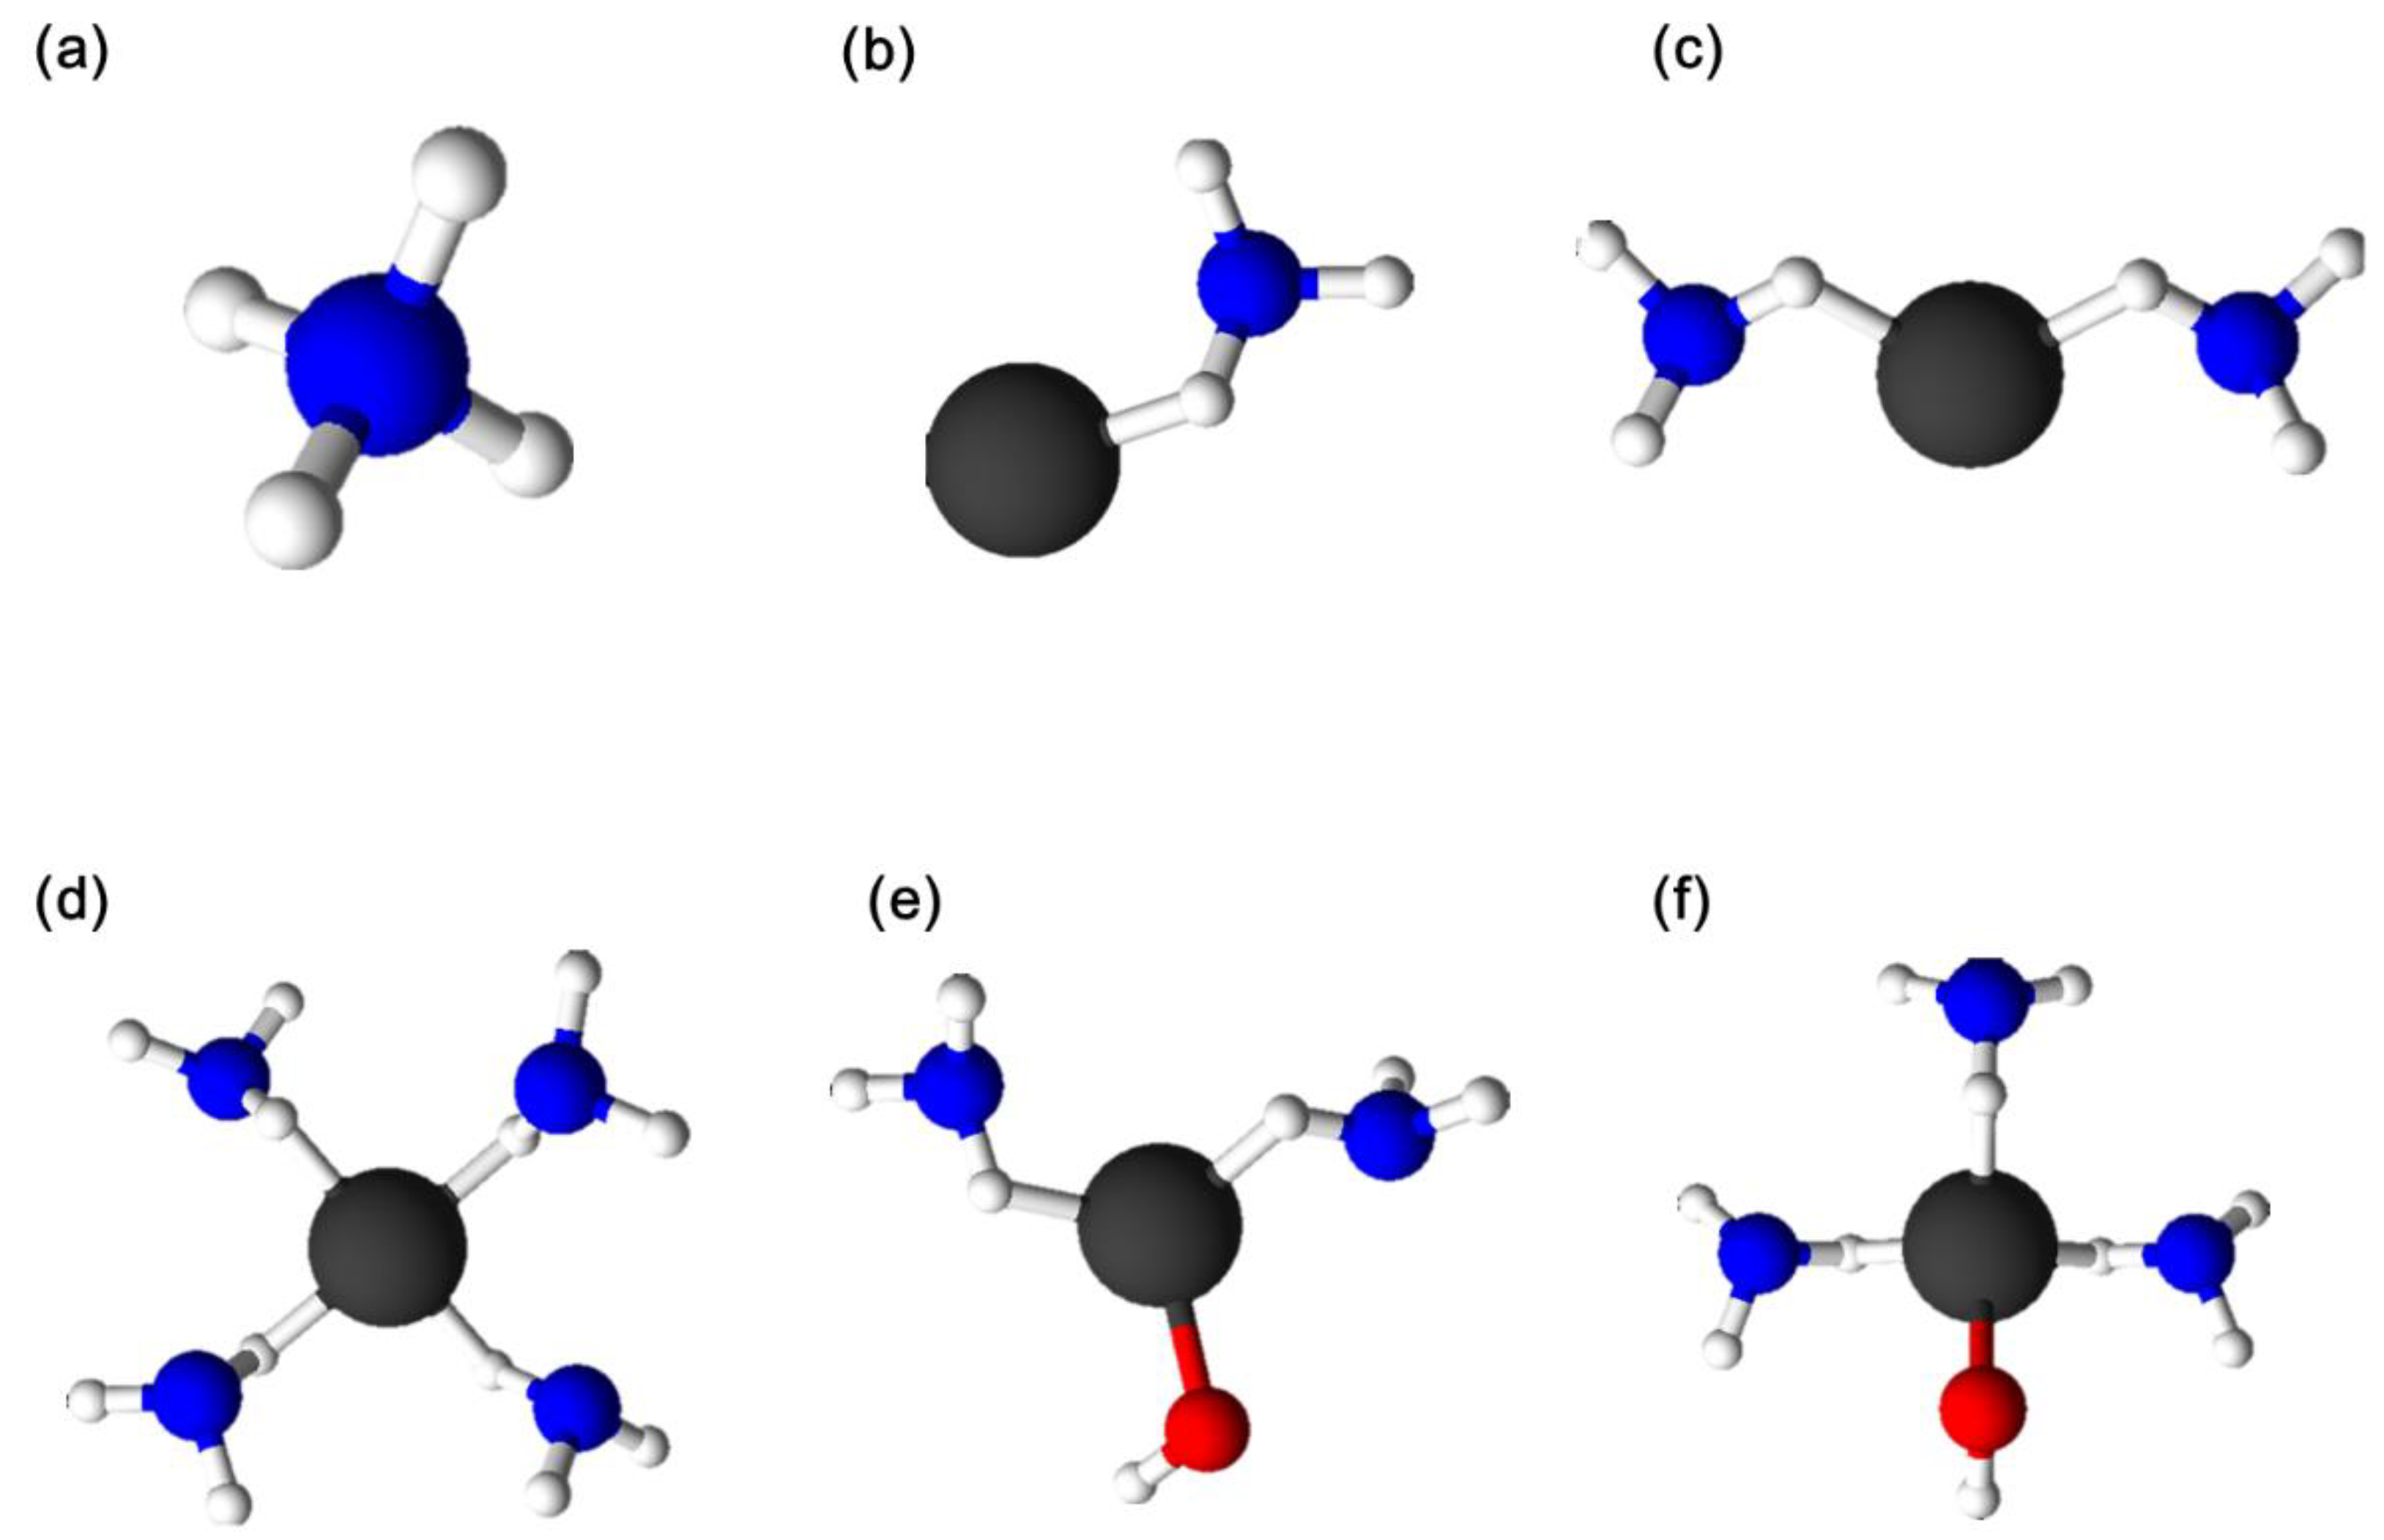
Figure 1 shows the various forms of adsorbed NH
3 on Cu-zeolite, which was proposed by Chen et al. [
5].
Figure 1a shows the NH
3 molecules bonded to the Brønsted acid site (BAS) in the form of NH
4+, and
Figure 1b–f represents NH
3 complexes bonded to Cu ions. The bonding form of Cu ions and NH
3 molecules varies depending on the degree of Cu ionization, the presence of OH- ions, and the number of adsorbed NH
3 molecules. NH
3 combined with Cu ions has a different SCR reaction pathway depending on the oxidation state of Cu. [
6]. The NH
3 bound to the Cu
2+ ion reacts with NO directly to form N
2 and H
2O via an NO-assisted NH
3 activation pathway, and the NH
3 bound to the Cu
2+ ion is converted to Cu
+-H
+ in this process. Also, the Cu
+-H
+ oxidizes to Cu
2+ with a reaction with O
2 and NO
2. In addition, the NH
3 bound to the Cu ion reacts with NO directly via an NO-assisted NH
3 activation pathway. On the other hand, the NH
3 bound to the Brønsted acid site is much less active under low-temperature steady-state conditions [
7]. As such, it is important to understand the binding behavior of NH
3, because the mechanism of the SCR reaction varies depending on the binding state of NH
3.
The adsorption and desorption of NH
3 in an SCR catalyst are important phenomena which affect the SCR reaction. Many studies have investigated NH
3 adsorption and desorption by using various measuring techniques, such as NH
3 temperature-programmed desorption (TPD) and infrared (IR) spectroscopy [
8,
9,
10]. Recent studies [
5,
6,
11] have shown that there are many peaks of NH
3 desorption for Cu-zeolite catalysts according to the temperature range at which NH
3 is desorbed. Lezcano-Gonzalez et al. [
10] observed two NH
3 desorption peaks in H-SSZ-13 and explained their chemical bonding structures. The first peak, called the low-temperature (LT) peak, is a desorption peak at approximately 180 °C. They explained that NH
3 molecules desorbed in the LT peak were weakly bound to the Lewis acid site (LAS) or solvated to NH
4+ ions. The second peak is called the high-temperature (HT) peak, and occurs in the temperature range of approximately 450 °C. It was explained as NH
3 that is strongly bound to the BAS. Lezcano-Gonzalez et al. [
11] compared the NH
3-TPD profiles of H-SSZ-13 and Cu-SSZ-13 and confirmed the absence of an intermediate temperature (IT) peak in H-SSZ-13. Further, when the amount of Cu ion exchange increased, the size of the IT peak increased, while that of the HT peak decreased. This indicates that the Cu ions in the catalyst affect the IT peak.
Chen et al. [
5] explained these peaks by simulating the NH
3-TPD profile of Cu-CHA zeolite using discrete Fourier transform (DFT) calculations. They explained that the LT peak represents the desorption of NH
3 from LAS, along with NH
3 desorption from a [Cu(II)(OH)(NH
3)
3]
+ complex. The IT peak shown at 250–350 °C was attributed to the decomposition of a linear [Cu(I)(NH
3)
2]
+ complex and residual [Cu(II)(OH)(NH
3)
3]
+. The HT peak at 400–500 °C was attributed to NH
3 in the form of NH
4+ adsorbed to the BAS, [Cu(I)(NH
3)]
+, and [Cu(II)(NH
3)
4]
2+.
Table 1 compares the NH
3 bonding mechanisms represented by the studies of Chen et al. [
5] and Lezcano-Gonzalez et al. [
11]. Chen et al. [
5] suggested a more detailed bonding mechanism between Cu ions and NH
3 molecules. In contrast, Lezcano-Gonzalez et al. mentioned NH
3 molecules solvating NH
4+ ions as a cause of the LT peak, and the extra-framework aluminum (EFAL) as a cause of another HT peak, which was not mentioned by Chen et al.
Yoshihisa et al. [
5] compared the NH
3 adsorption and desorption of H-ZSM-5 and Cu-ZSM-5. Similarly to the study by Lezcano-Gonzalez et al. [
11], Yoshihisa et al. observed that H-ZSM-5 had two NH
3 peaks in the LT and HT regions, while Cu-ZSM-5 had an additional peak in the IT region. Additionally, they found that the NO reduction reaction did not occur in the absence of Cu ions in the zeolite. This means that the Cu ion sites are very important for the SCR reaction, and the adsorption and desorption with various forms of NH
3 at the Cu sites should be comprehensively studied.
Gao et al. [
12,
13] and Paolucci et al. [
14] demonstrated the importance of Cu-NH
3 intermediates, such as [Cu(II)(OH)(NH
3)
3]
+ and [Cu(I)(NH
3)
2]
+, in the low-temperature SCR reaction. As a starting point for the SCR reaction, they suggested that [Cu(II)(OH)]
+ adsorbs two NH
3 molecules and forms a complex of [Cu(II)(OH)(NH
3)
3]
+. When an NO molecule is introduced, the [Cu(II)(OH)(NH
3)
3]
+ changes to intermediates of NH
2-Cu(I)-NO or NH
3-Cu(I)-HONO by rearranging the NH
3 and NO ligands. Eventually, N
2 and H
2O are formed from these intermediates. Then, after the adsorption of another NH
3 molecule onto the Cu ion, [Cu(I)(NH
3)
2]
+ is formed. Next, two [Cu(I)(NH
3)
2]
+ intermediates and oxygen molecules combine to form [Cu(I)(NH
3)
2]
+-O
2-[Cu(I)(NH
3)
2]
+. The compound changes again to [Cu(II)(OH)(NH
3)
3]
+ via electron transfer from Cu to O and hydration with H
2O molecules. This means that the adsorption of ammonia to the Cu ion plays an important role in the NO-SCR cycle.
According to previous studies [
15,
16], NO
x removal efficiency at low temperatures can be improved by increasing the amount of NH
3 adsorption in the SCR catalyst. It is well known that NH
3 slip can be prevented by careful control of NH
3 adsorption and desorption at high temperatures. However, much of the previous research regarding NH
3 adsorption control for SCR systems of diesel engines considered the catalyst as a single acid site, even though the adsorption of NH
3 in zeolite is influenced by multiple acid sites with different characteristics. As far as we know, there has been no research showing a detailed experimental process to determine the chemical kinetic parameters of adsorption and desorption of NH
3 for different types of acid sites of a zeolite catalyst.
This study investigated the adsorption and desorption of NH3 on various kinds of acid sites of Cu-SSZ-13 zeolite and attempted to determine their chemical kinetic parameters, which are needed for more precise control of the SCR reaction.
2. Results and Discussion
In the SCR reaction modeling, information on both the NH
3 adsorption rate and desorption rate are necessary. In the single-site model, the NH
3 adsorption rate,
, can be expressed using Equation (1):
where
is the reaction constant and
is the mole concentration of NH
3.
is the surface coverage of the catalyst by NH
3 molecules. It is defined as:
where
is the amount of NH
3 molecules adsorbed on the catalyst and
is the maximum amount of NH
3 molecules adsorbed on the catalyst.
The NH
3 desorption rate,
, of the single-site model is generally expressed as follows:
where
is the reaction constant and
is the mole concentration of NH
3.
is the activation energy. R and T are the universal gas constant and catalyst temperature, respectively.
In this study, we attempted to extend the above single-site model to a multi-site model to provide more detailed information on NH3 adsorption and desorption rates. In the next section, the modified forms of Equations (2) and (3) are shown for the multi-site model.
In this study, only the chemically adsorbed NH
3 molecules were considered.
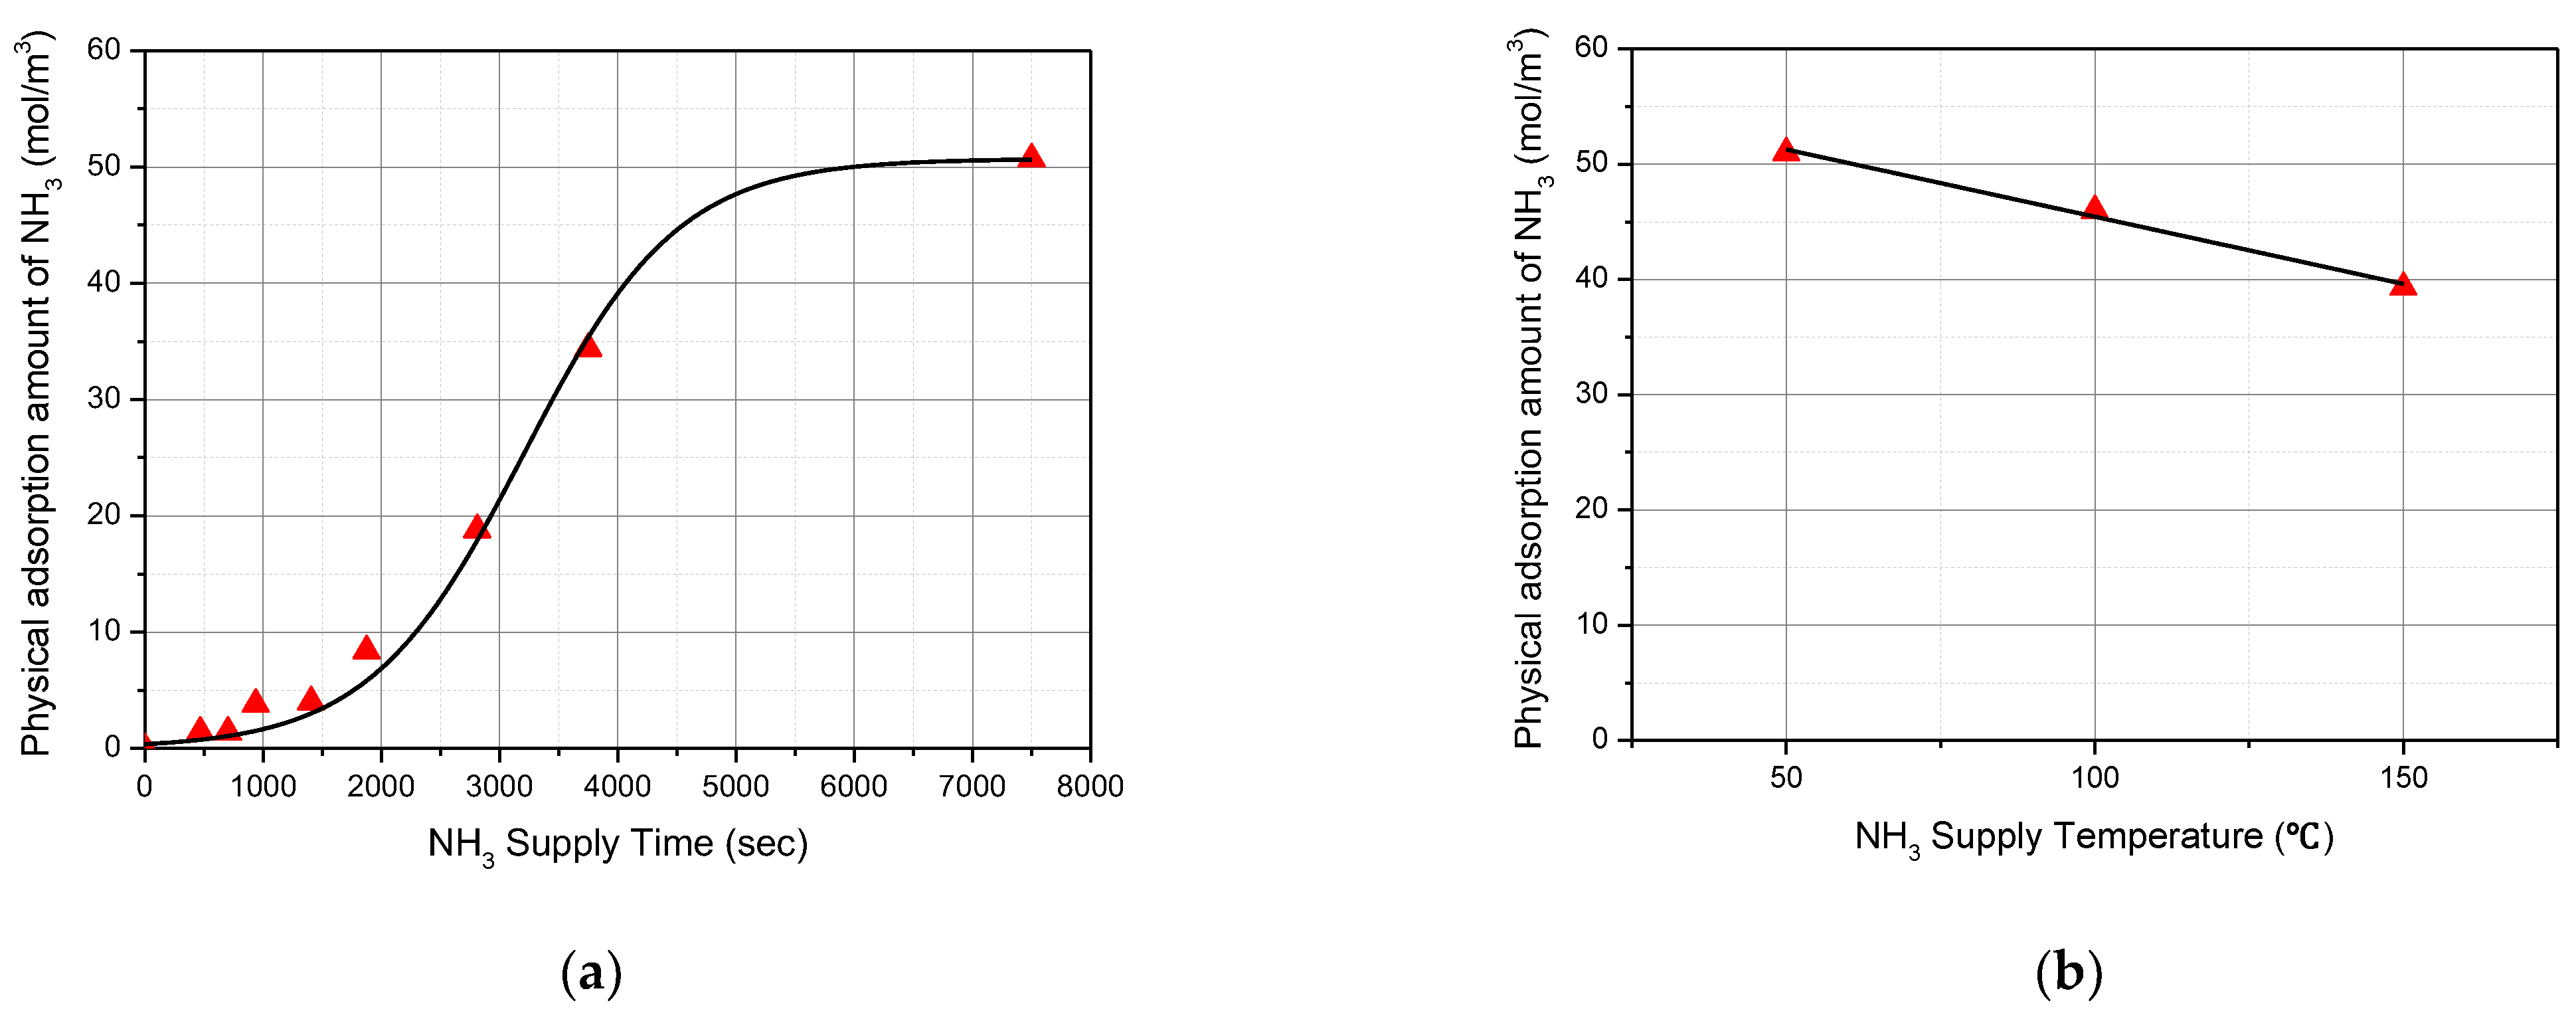
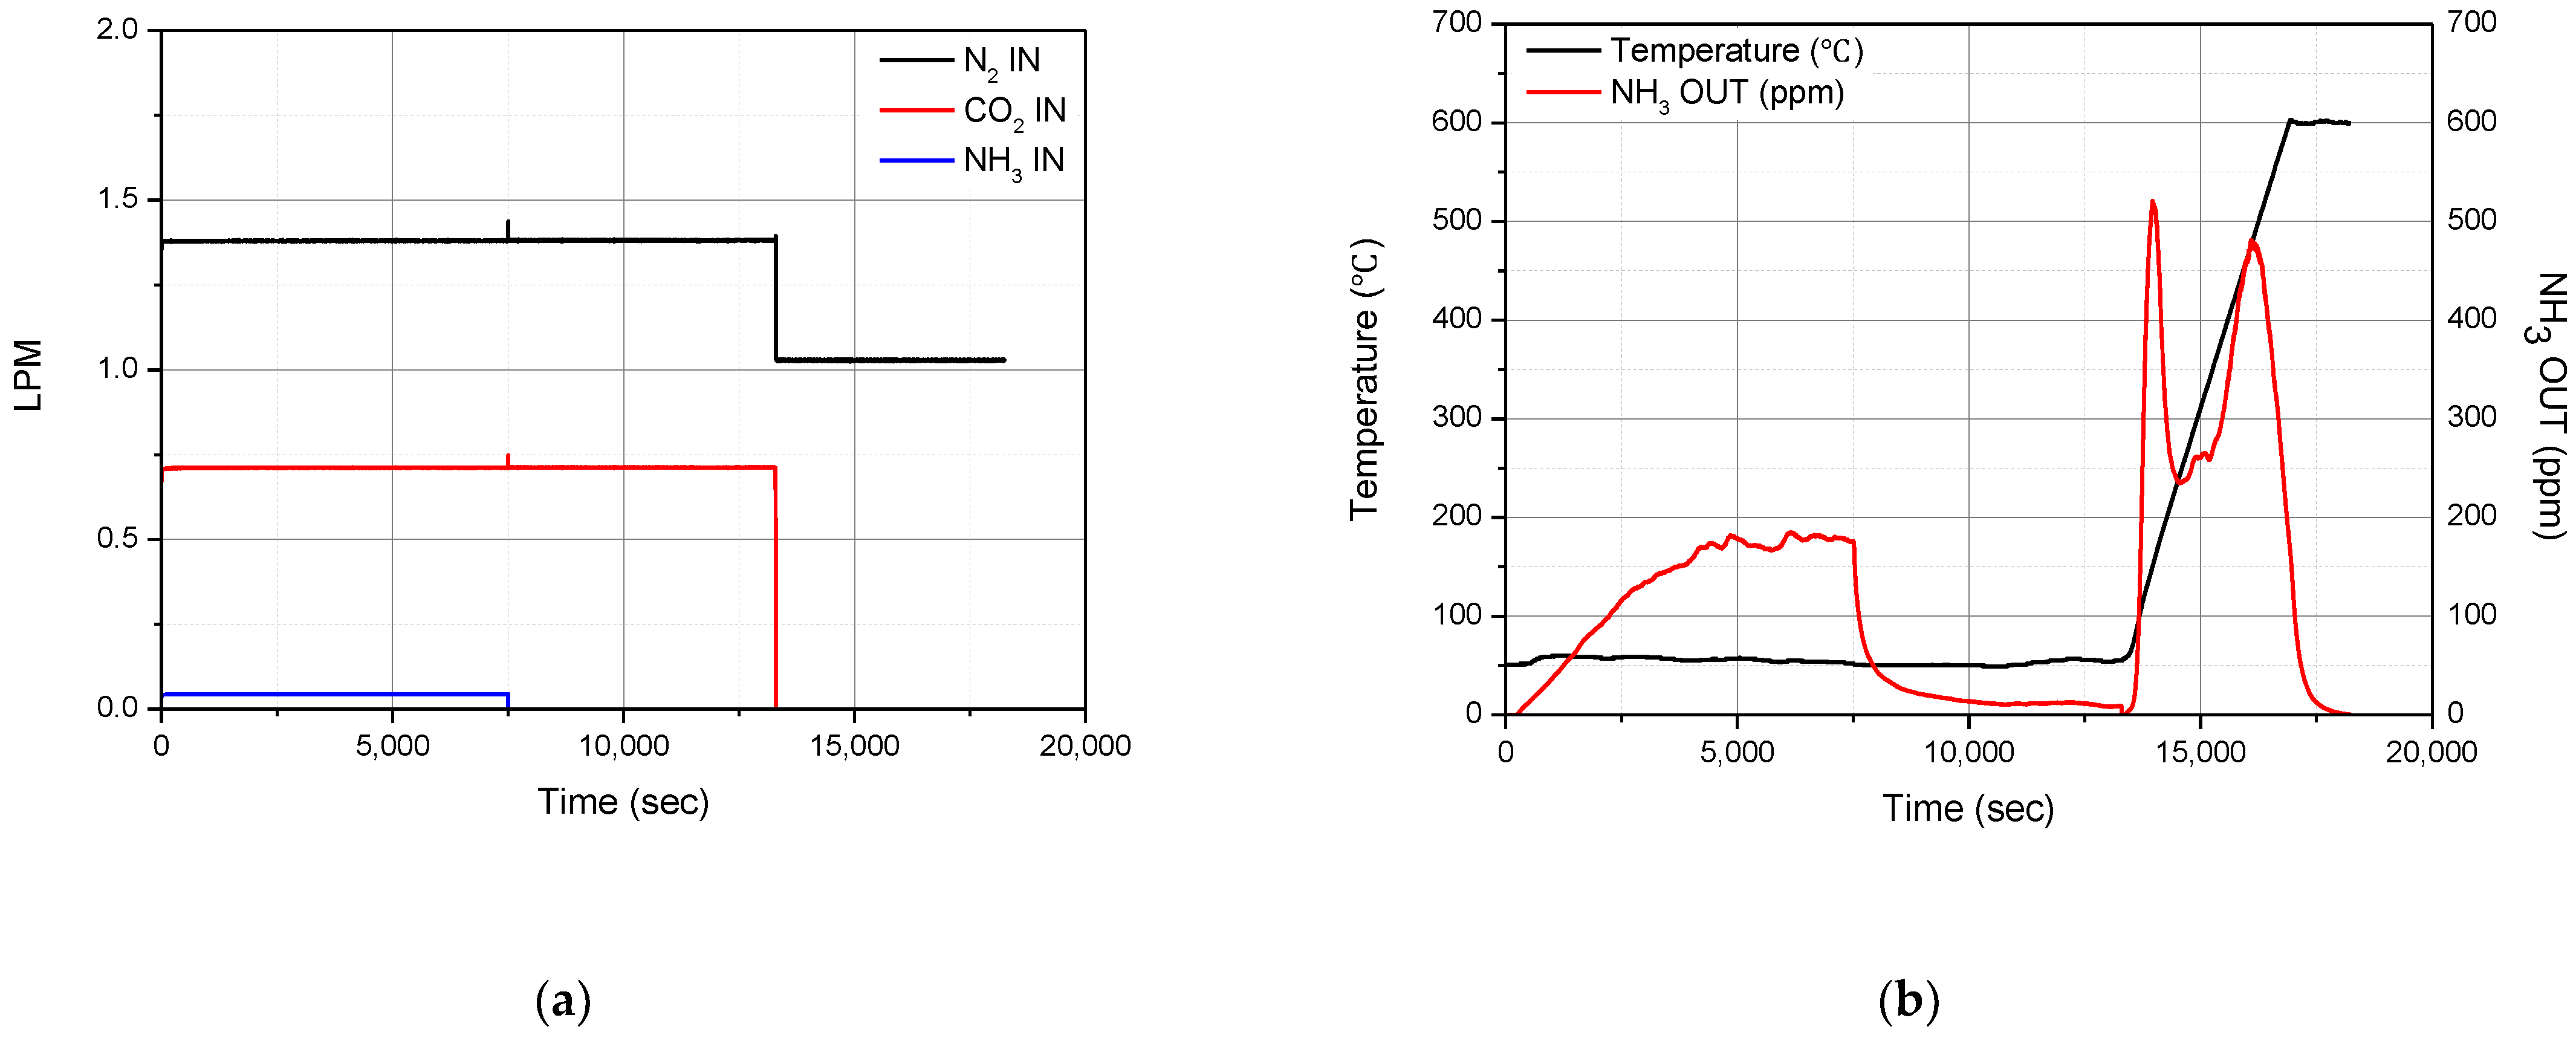
Figure 2a shows that the amount of physically adsorbed NH
3 molecules increased as the NH
3 supply time increased. At the beginning of the NH
3 gas supply, the chemical bonds on the acid sites are superior. Therefore, the physical adsorption rate of NH
3 gas molecules is small. After that, the physical adsorption rate increases, because the number of acid sites available for chemical bonding is decreased. In addition, when a large amount of ammonia molecules are physically adsorbed, the physical adsorption rate decreases again due to the limitation of molecular diffusion. The experimental results also showed that the physical adsorption rate is small at the beginning, then increases rapidly, and decreases at the end. When the ammonia supply in the feed gas is stopped, the physically adsorbed ammonia is desorbed into the feed gas due to the difference between the ammonia concentration in the feed gas and the ammonia concentration on the catalyst surface.
Figure 2b show the effect of temperature on the physically adsorbed NH
3 molecules. It decreases as the NH
3 supply temperature increases. This is because the attraction surface force, which acts between the catalyst surface and ammonia molecules, becomes smaller than the kinetic energy of the ammonia molecules, which is increased when the feed gas temperature increases. S. J. PALMER [
17] presented a mathematical relationship showing that the surface force of water becomes smaller with an increase in temperature, which proves the validity of the results obtained in
Figure 2.
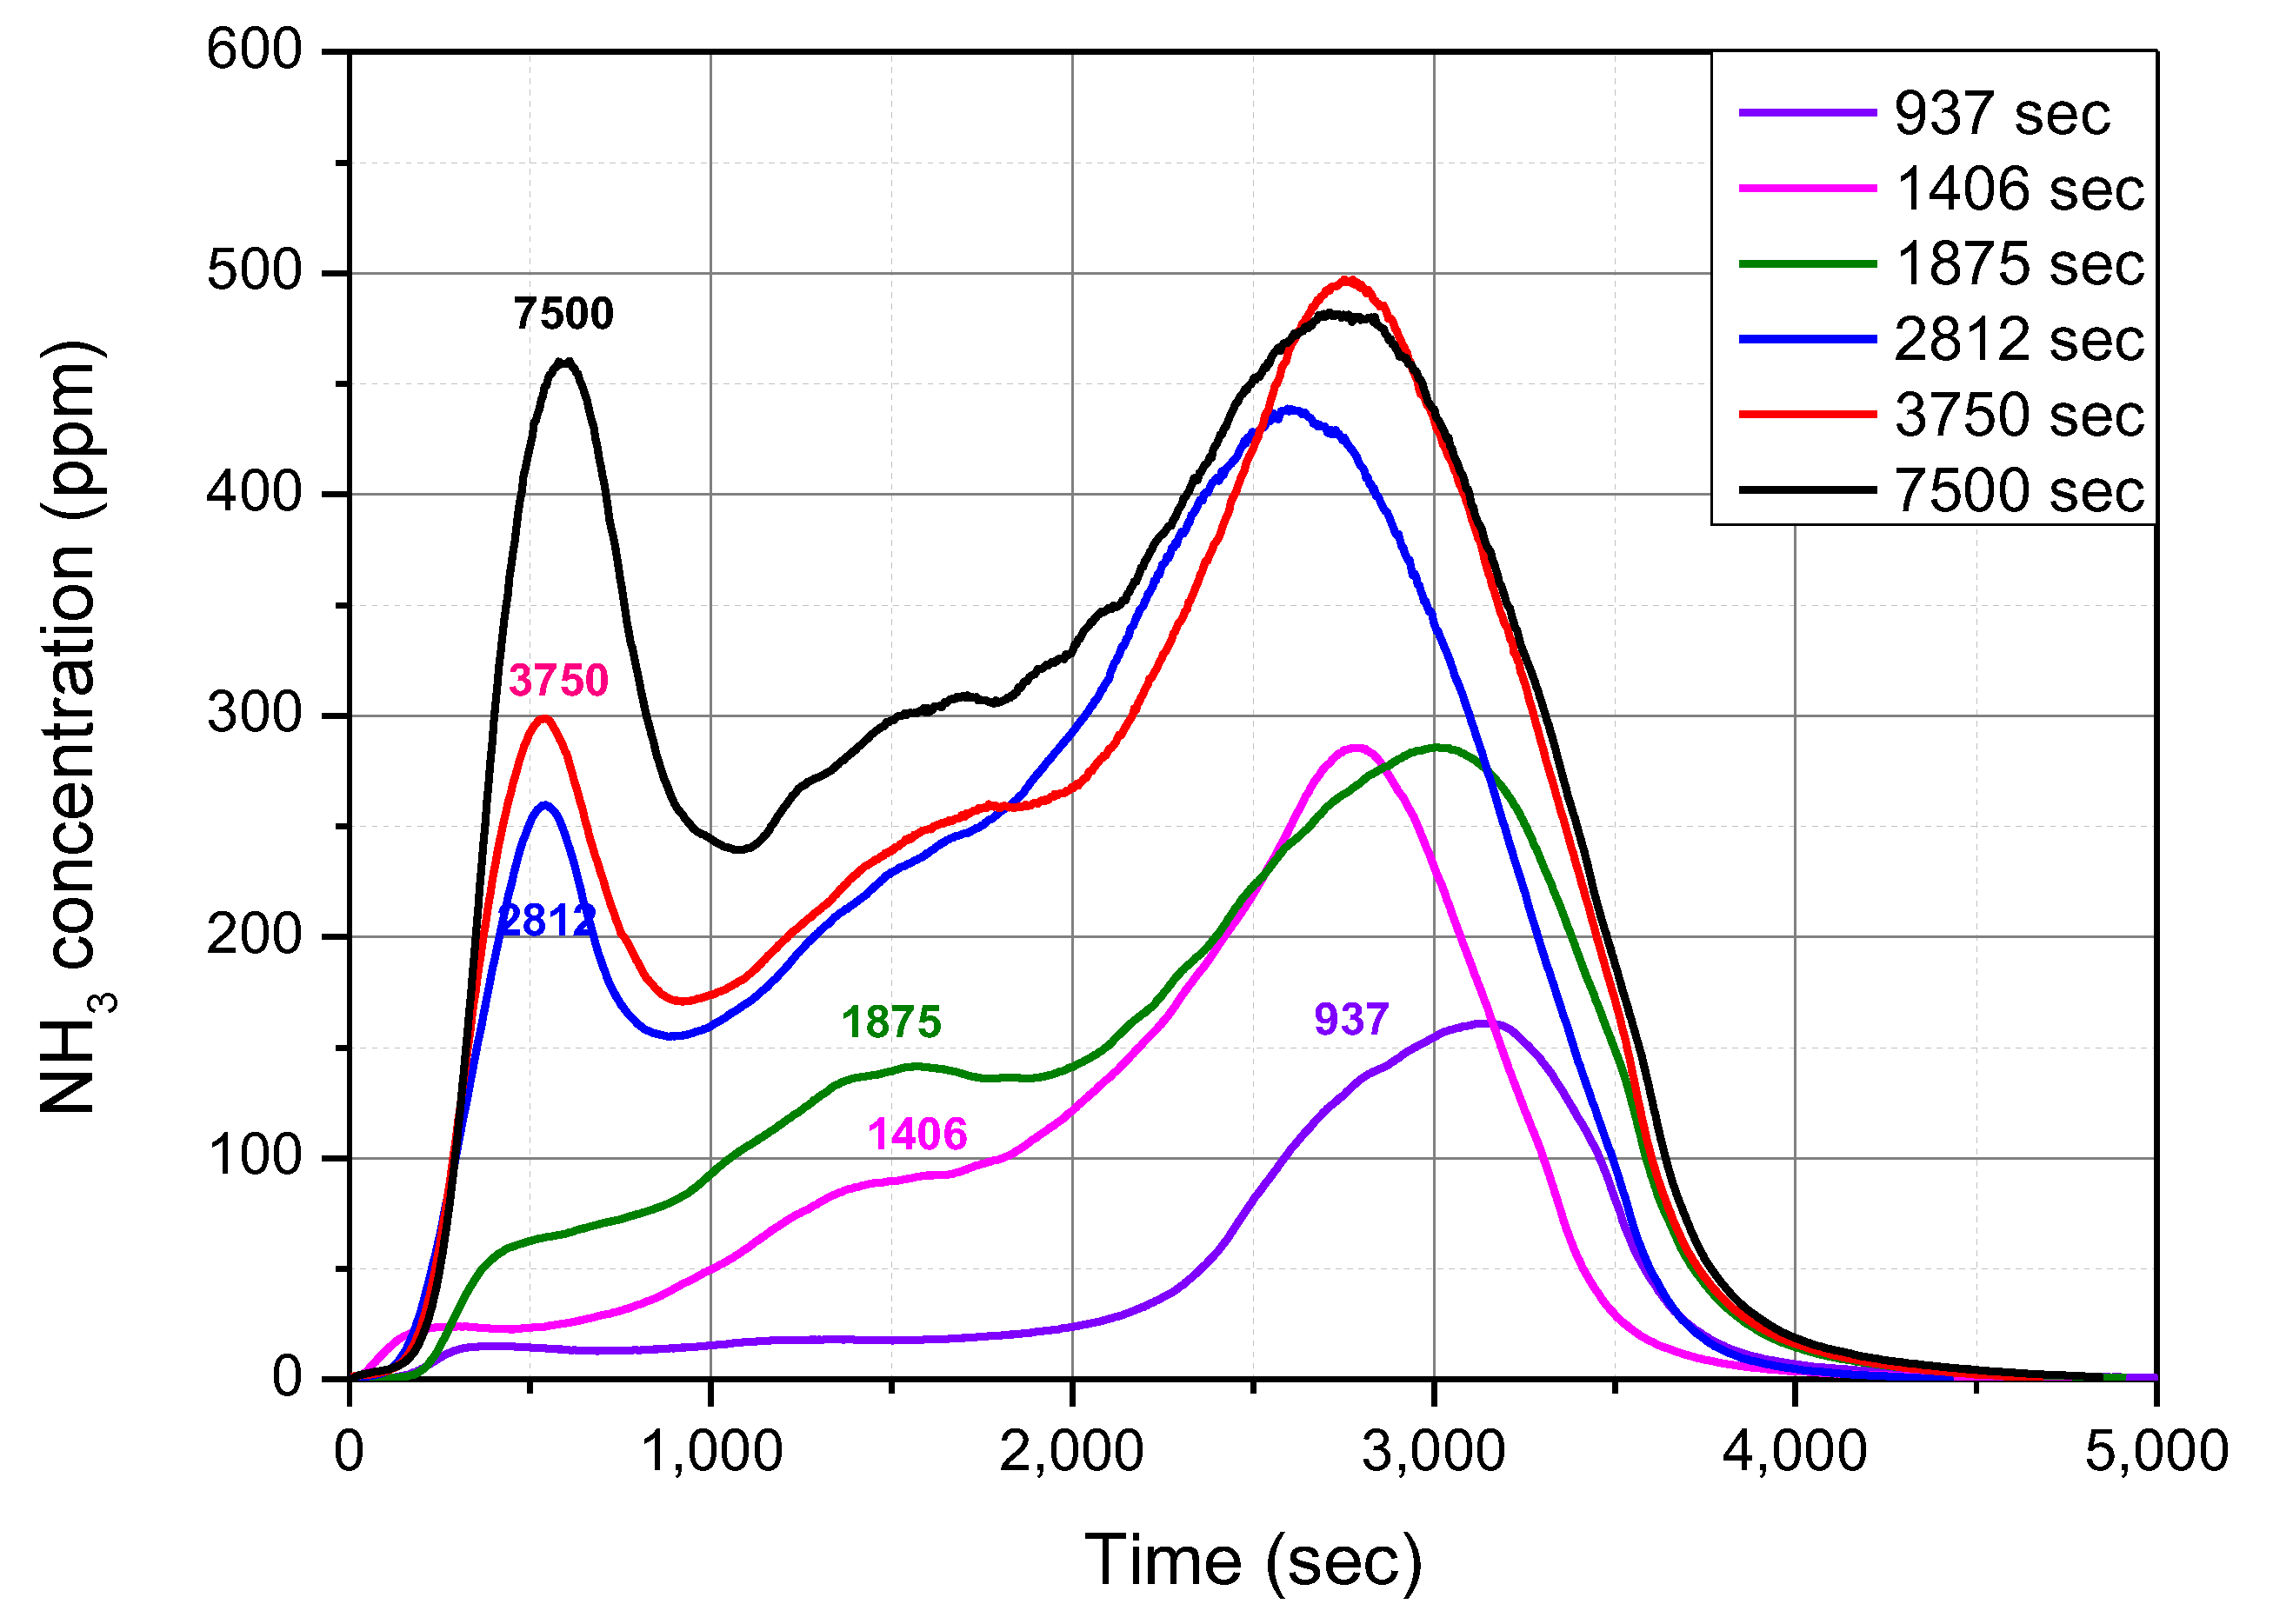
Figure 3 shows the variation of NH
3-TPD curves with the NH
3 supply time. The 7500 s curve consisted of three peaks. Many researchers have found the same results from similar experiments. These three peaks have been called the LT peak (~200 °C), IT peak (200–400 °C), and HT peak (~400 °C). The curves below 937 s show that NH
3 was mainly desorbed at the HT peak of 400 °C or more. This indicates that the initial adsorption of NH
3 molecules occurred in the acid sites of the HT peak, which had a high bonding energy. When the NH
3 supply time was increased to 1406 s, the HT peak grew and the smaller IT peak appeared. Further, when the NH
3 supply time was increased to 1875 s, the LT peak appeared at temperatures below 200 °C. According to studies by several researchers, the HT peak was mainly related to the NH
3 molecules, which are strongly bonded to BAS, and the IT peak was related to the NH
3 molecules that were adsorbed to Cu ions. Additionally, it seems that the LT peak comprised weakly bonded NH
3 molecules in the form of [Cu(II)(OH)(NH
3)
3]
+ or solvated to NH
4+ ions.
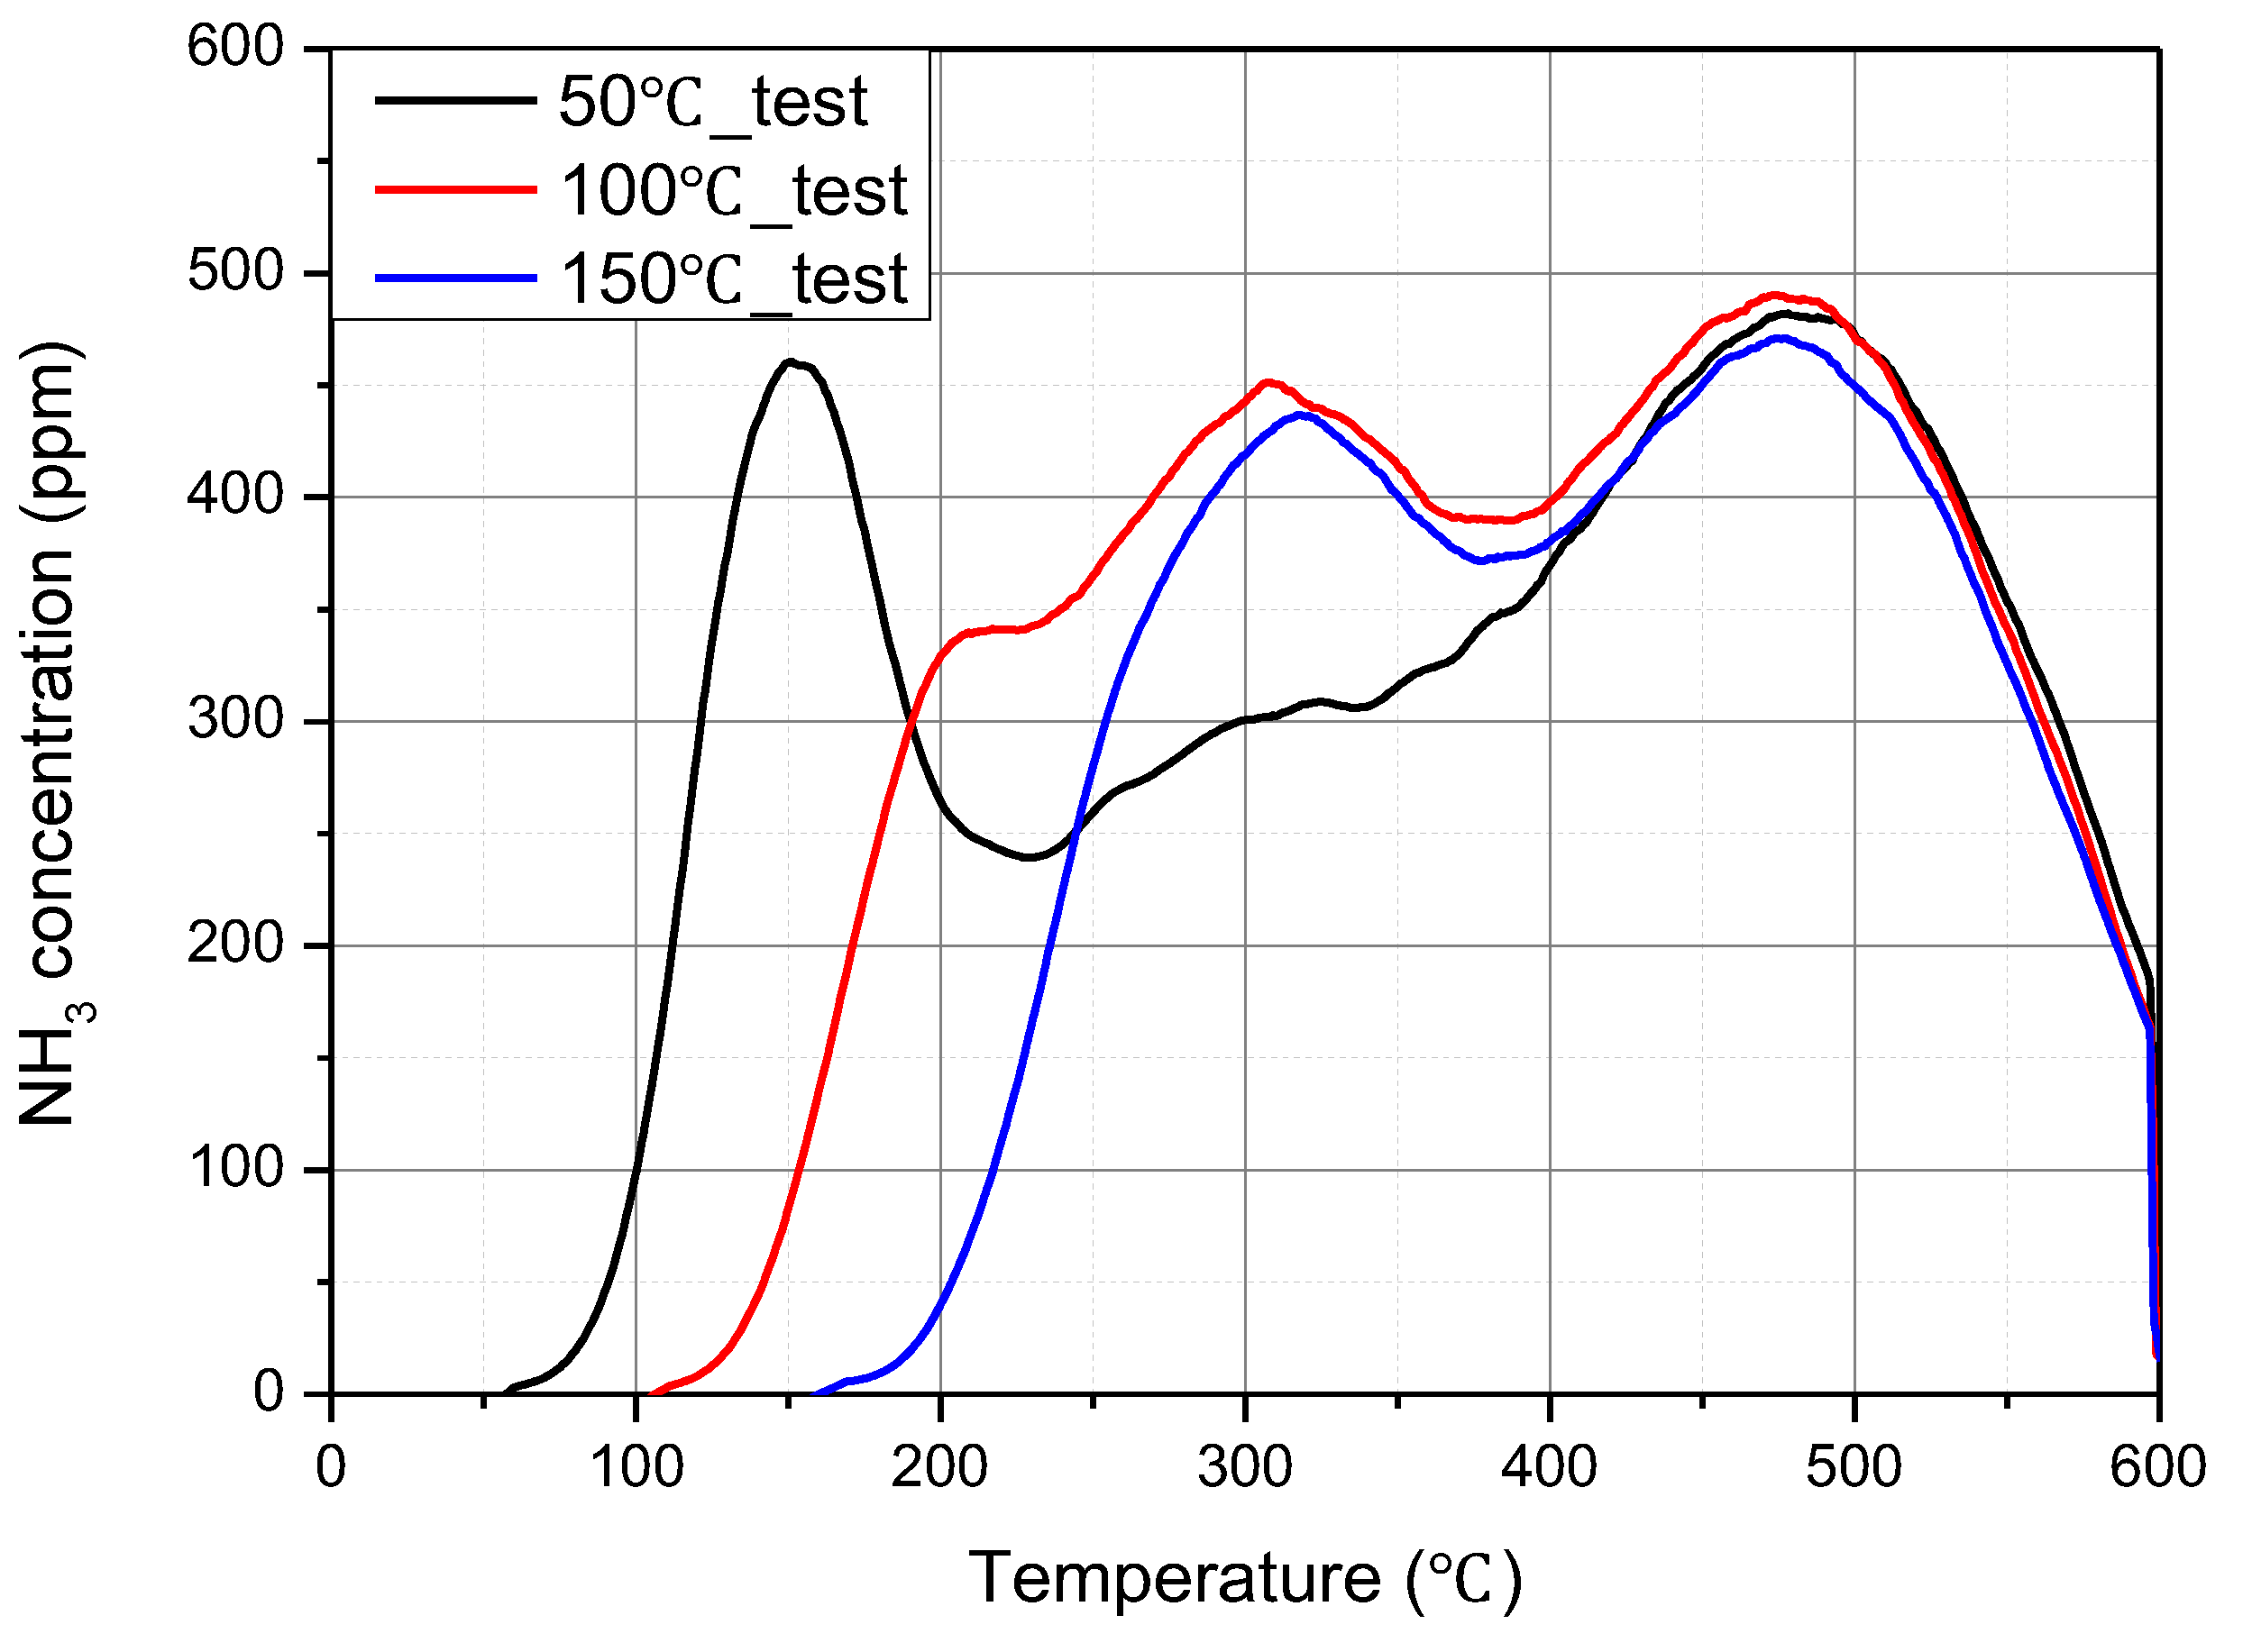
Figure 4 shows the results of NH
3 TPD tests obtained at different NH
3 adsorption temperatures of 50 °C, 100 °C, and 150 °C. In the three experiments, 200 ppm of NH
3 gas was supplied to the catalyst for 7500 s equally. Therefore, the same amount of NH
3 was supplied. According to the results of these experiments, the shapes of the HT peaks of the three different temperature conditions were nearly the same. However, the LT peak disappeared, and the IT peak increased as the NH
3 adsorption temperature increased from 50 °C to 100 °C and then to 150 °C. The large size of the LT peak and the small size of the IT peak at 50 °C indicate that the LT peak interrupts the growth of the IT peak. This means that the LT peak and IT peak are chemically related. As suggested by Chen et al. [
5], the OH of [Cu(II)(OH)(NH
3)
3]
+ in the LT peak is separated at 100 °C or higher, and it is changed to [Cu(I)(NH
3)
2]
+ and moved to the IT peak.
Comparing the HT peaks of 2812 and 7500 s in
Figure 5 and the HT peaks at 50 °C, 100 °C, and 150 °C in
Figure 4, the height and width of the HT peaks are almost the same. This means that when the adsorption time is sufficiently long, the HT peak converges to a certain shape. Therefore, the number of acid sites for the HT peak is finite. Similarly, it seems that the shape of the IT peaks in
Figure 3 and
Figure 4 eventually converged to that of the IT peak at 150 °C, as shown in
Figure 4. To describe the degree of NH
3 adsorption at the acid sites, the term surface coverage (
) was used in this study. Coverage of the HT and IT peaks is defined in Equations (4) and (5), as follows:
where
and
are the amounts of NH
3 molecules adsorbed in the HT and IT peaks, respectively.
and
are the maximum catalyst adsorption capacities of the HT and LT peaks, respectively.
However, the size of the LT peak continued to increase and did not converge, as shown in
Figure 3 and
Figure 4. This means that the rate of NH
3 adsorption of the LT peak was not expressed as a function of coverage.
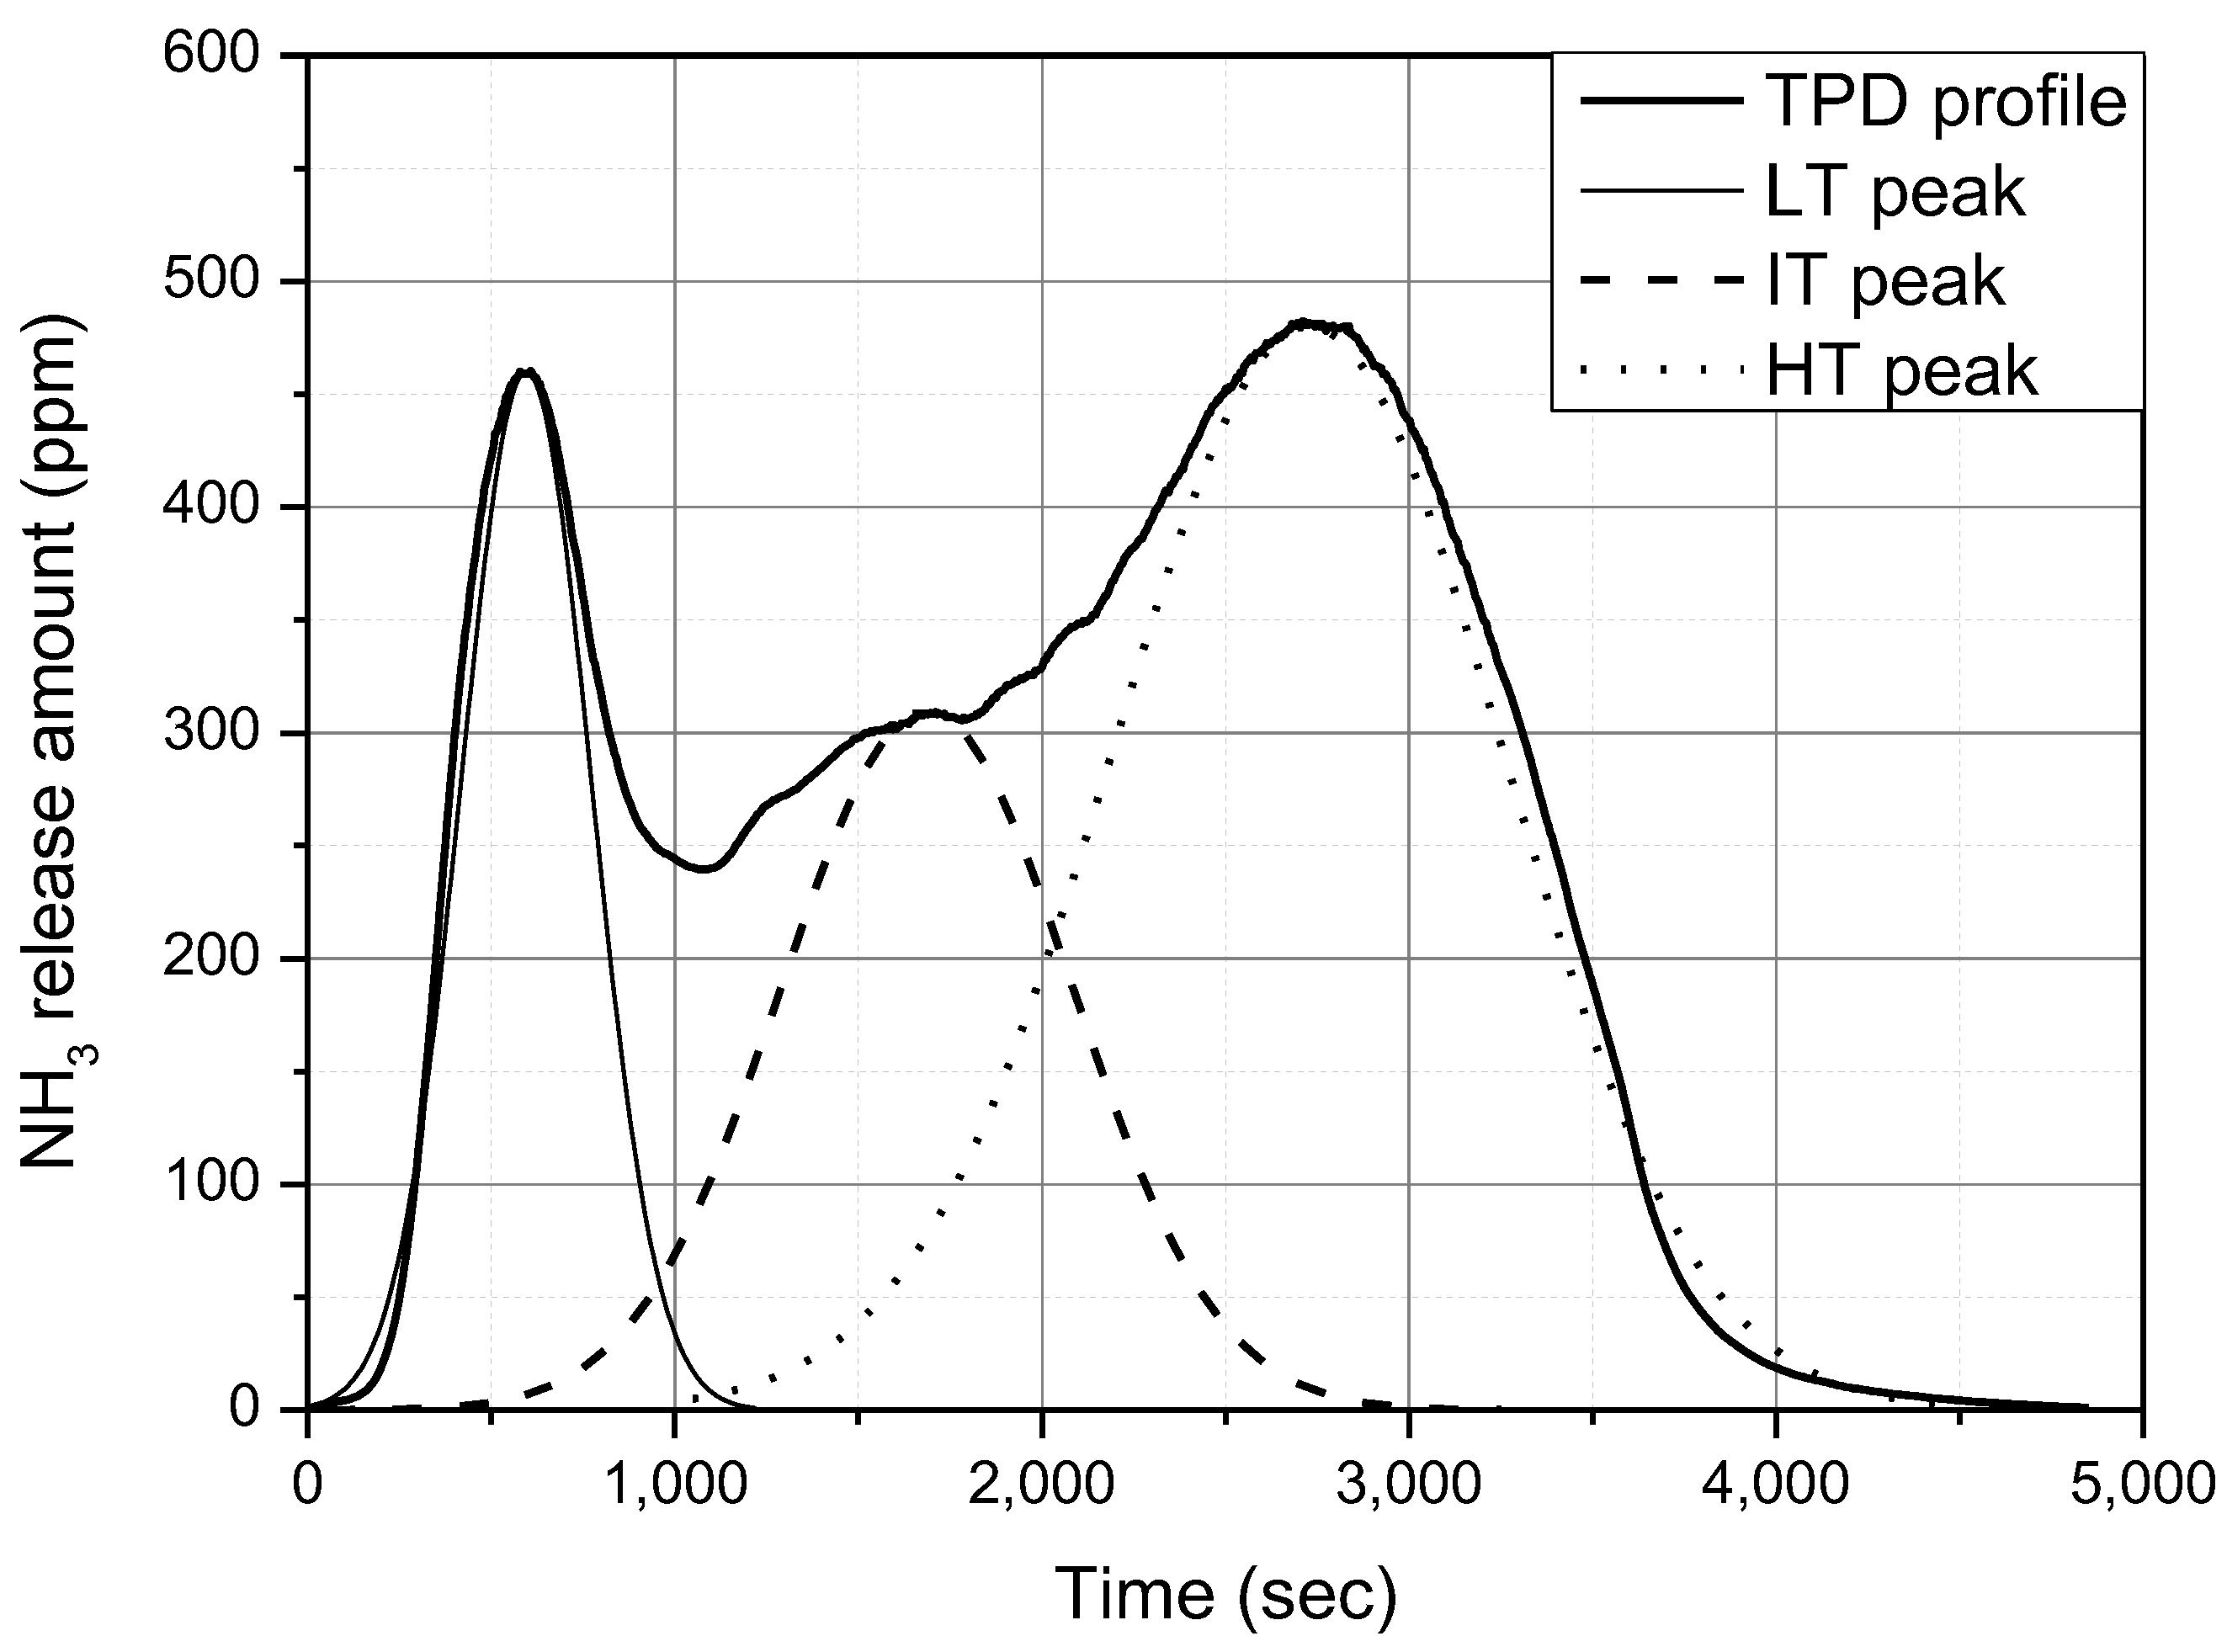
Figure 5 shows an example of curve fitting for the NH
3 TPD test results. This study assumed that the LT, IT, and HT peaks of the TPD curve can be expressed using standard normal distribution curves. In this example, the difference between the total amount of NH
3 adsorption obtained by integrating the TPD curve and that obtained by integrating the three standard normal distribution curves was only 0.56%. Thus, it can be said that analysis using curve fitting did not cause a significant error. The integrated amount of NH
3 of the peaks presented in this paper were obtained from curve fitting with standard normal distribution curves.
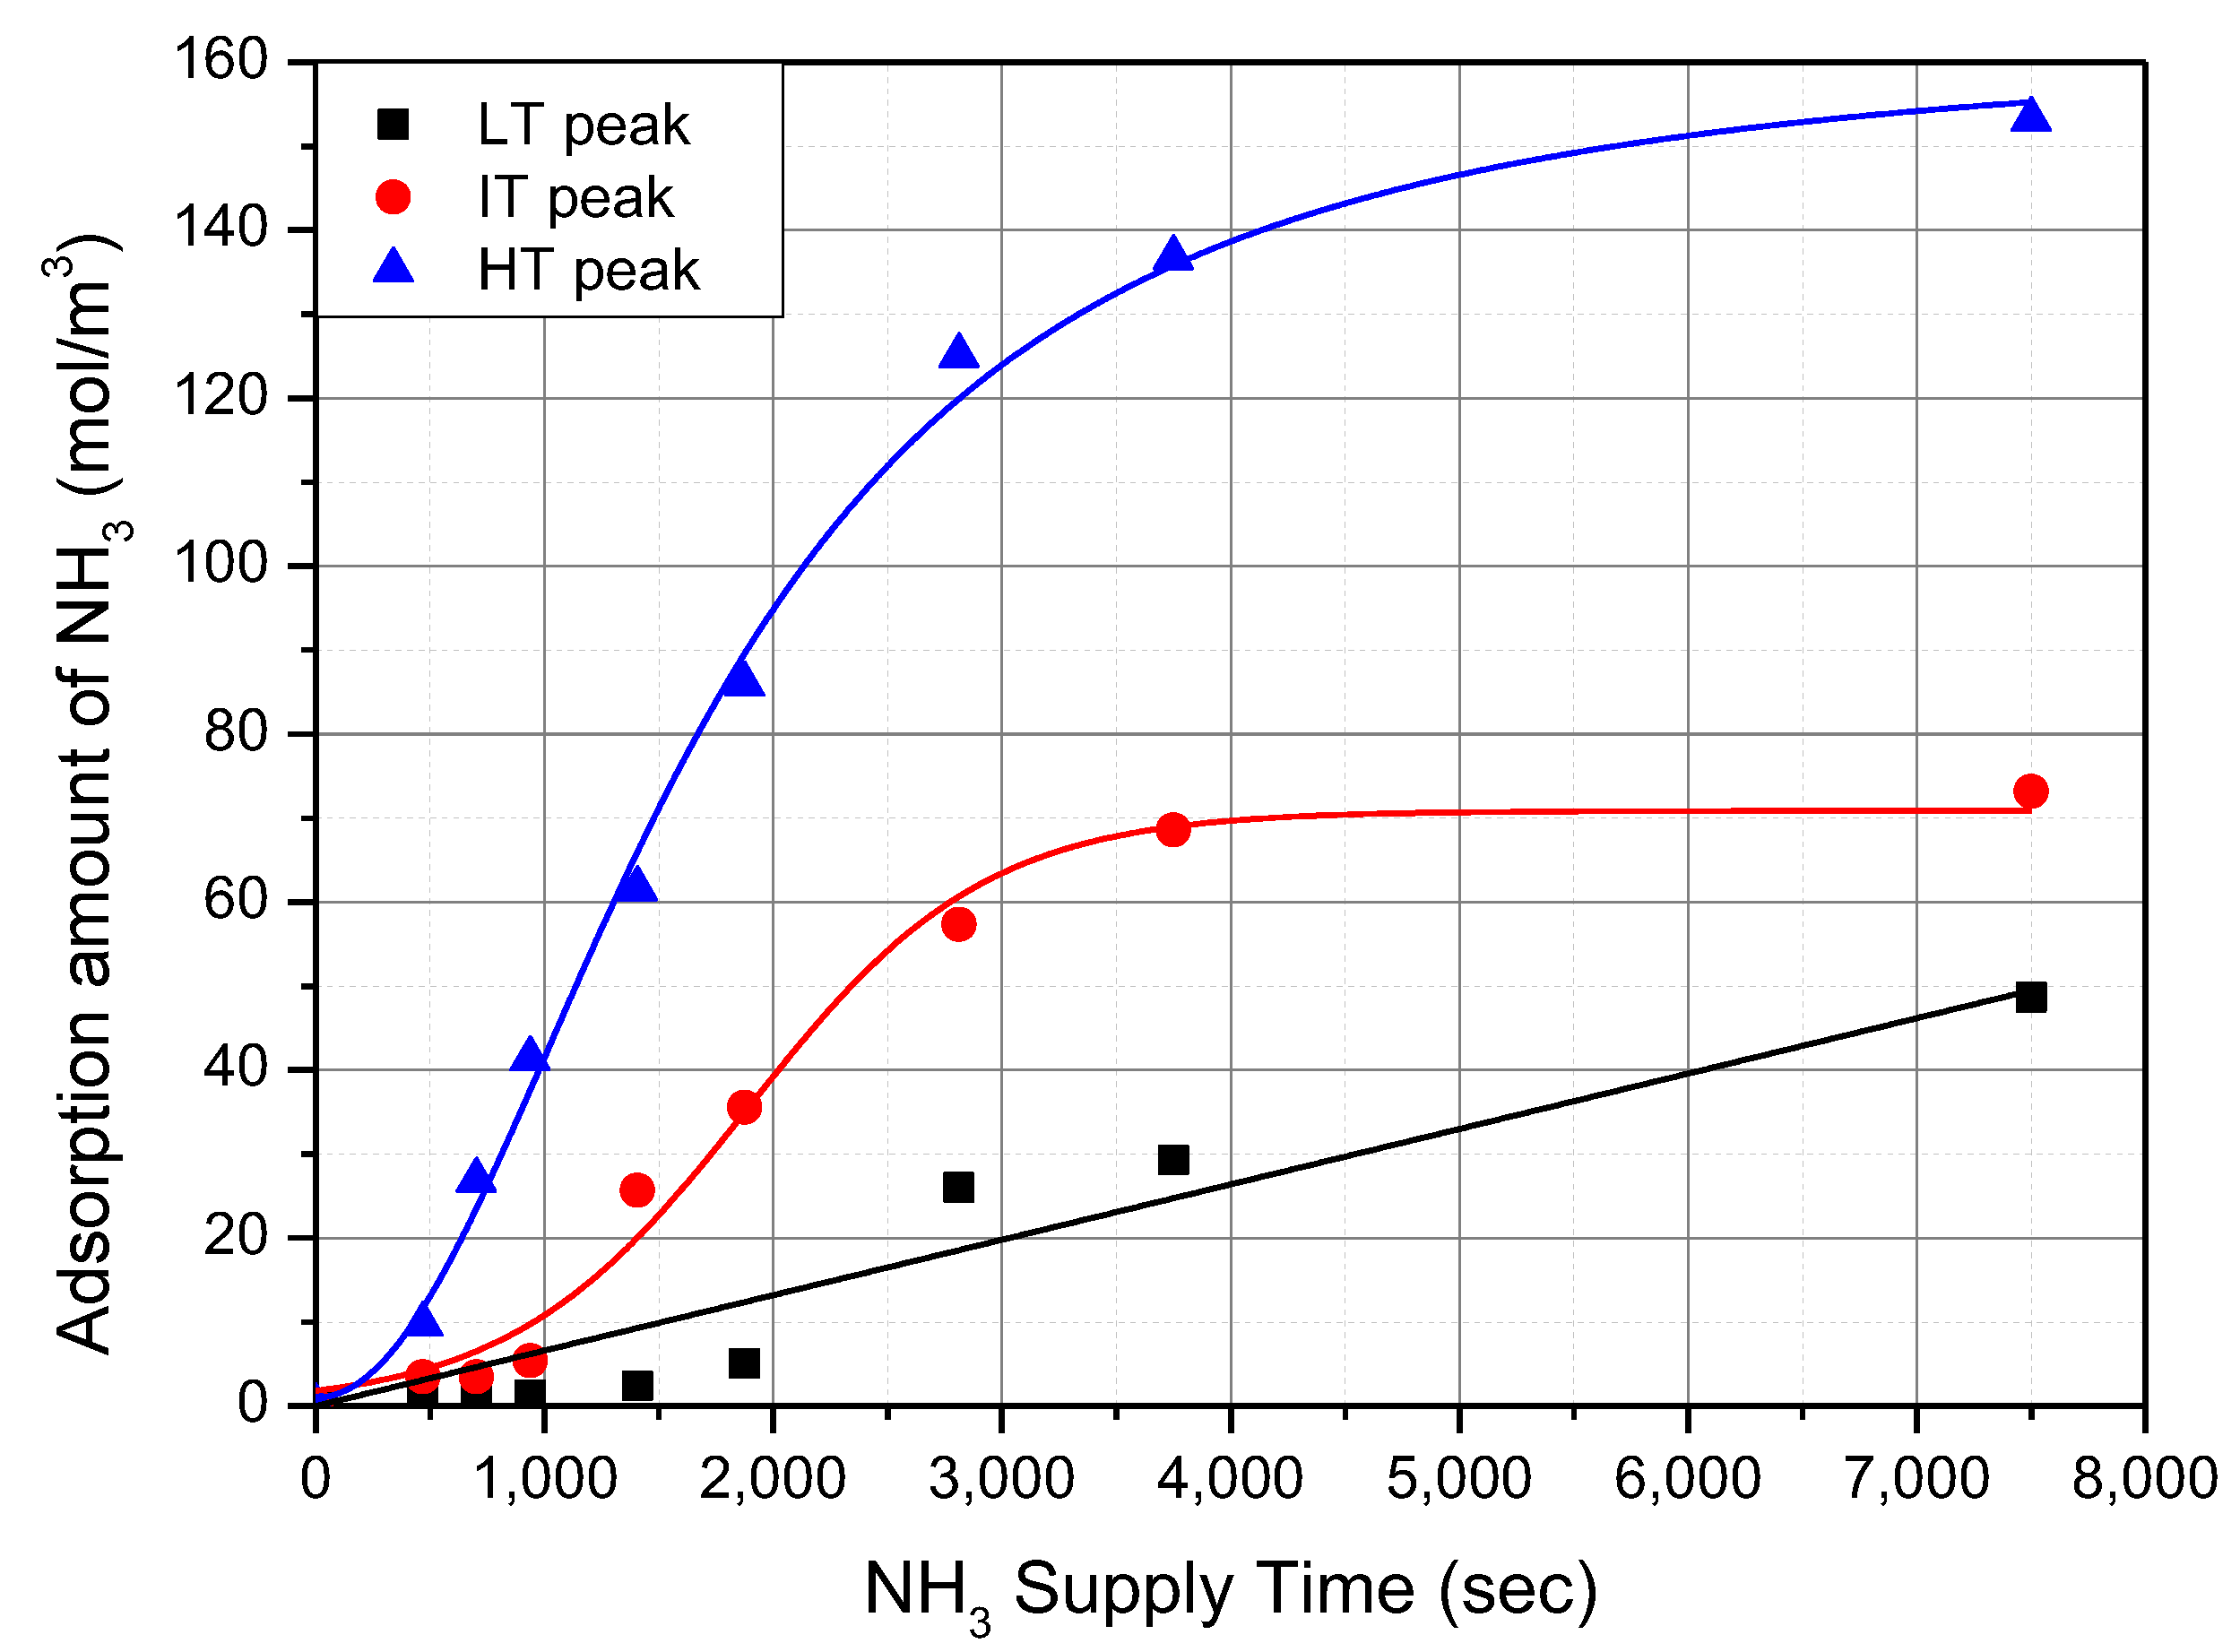
Figure 6 shows the change in the NH
3 adsorption amount of each peak with respect to time. It was obtained from the curves shown in
Figure 5 by integrating the HT, IT, and LT peaks. The NH
3 adsorption amount of the HT and IT peaks increased rapidly at the beginning and then became saturated at a certain value. However, it seems that the saturation of the LT peak was not clear as the NH
3 supply time increased. Many other studies [
11,
18,
19] have shown that solvation of the ammonium Ion (NH
4+) by NH
3 can occur under low temperatures. This solvation is independent to acid sites, and quite a large amount of NH
3 molecules attach as a form of NH
4+·(NH
3)
n. Here, n is the number of NH
3 molecules attached to ammonium ions. Because of this, linear curve fitting was used to describe the development of NH
3 adsorption amount of the LT peak. Additionally, we found that the total amount of NH
3 adsorption of the HT peak was the largest, that of the IT peak was second, and that of the LT peak was the smallest.
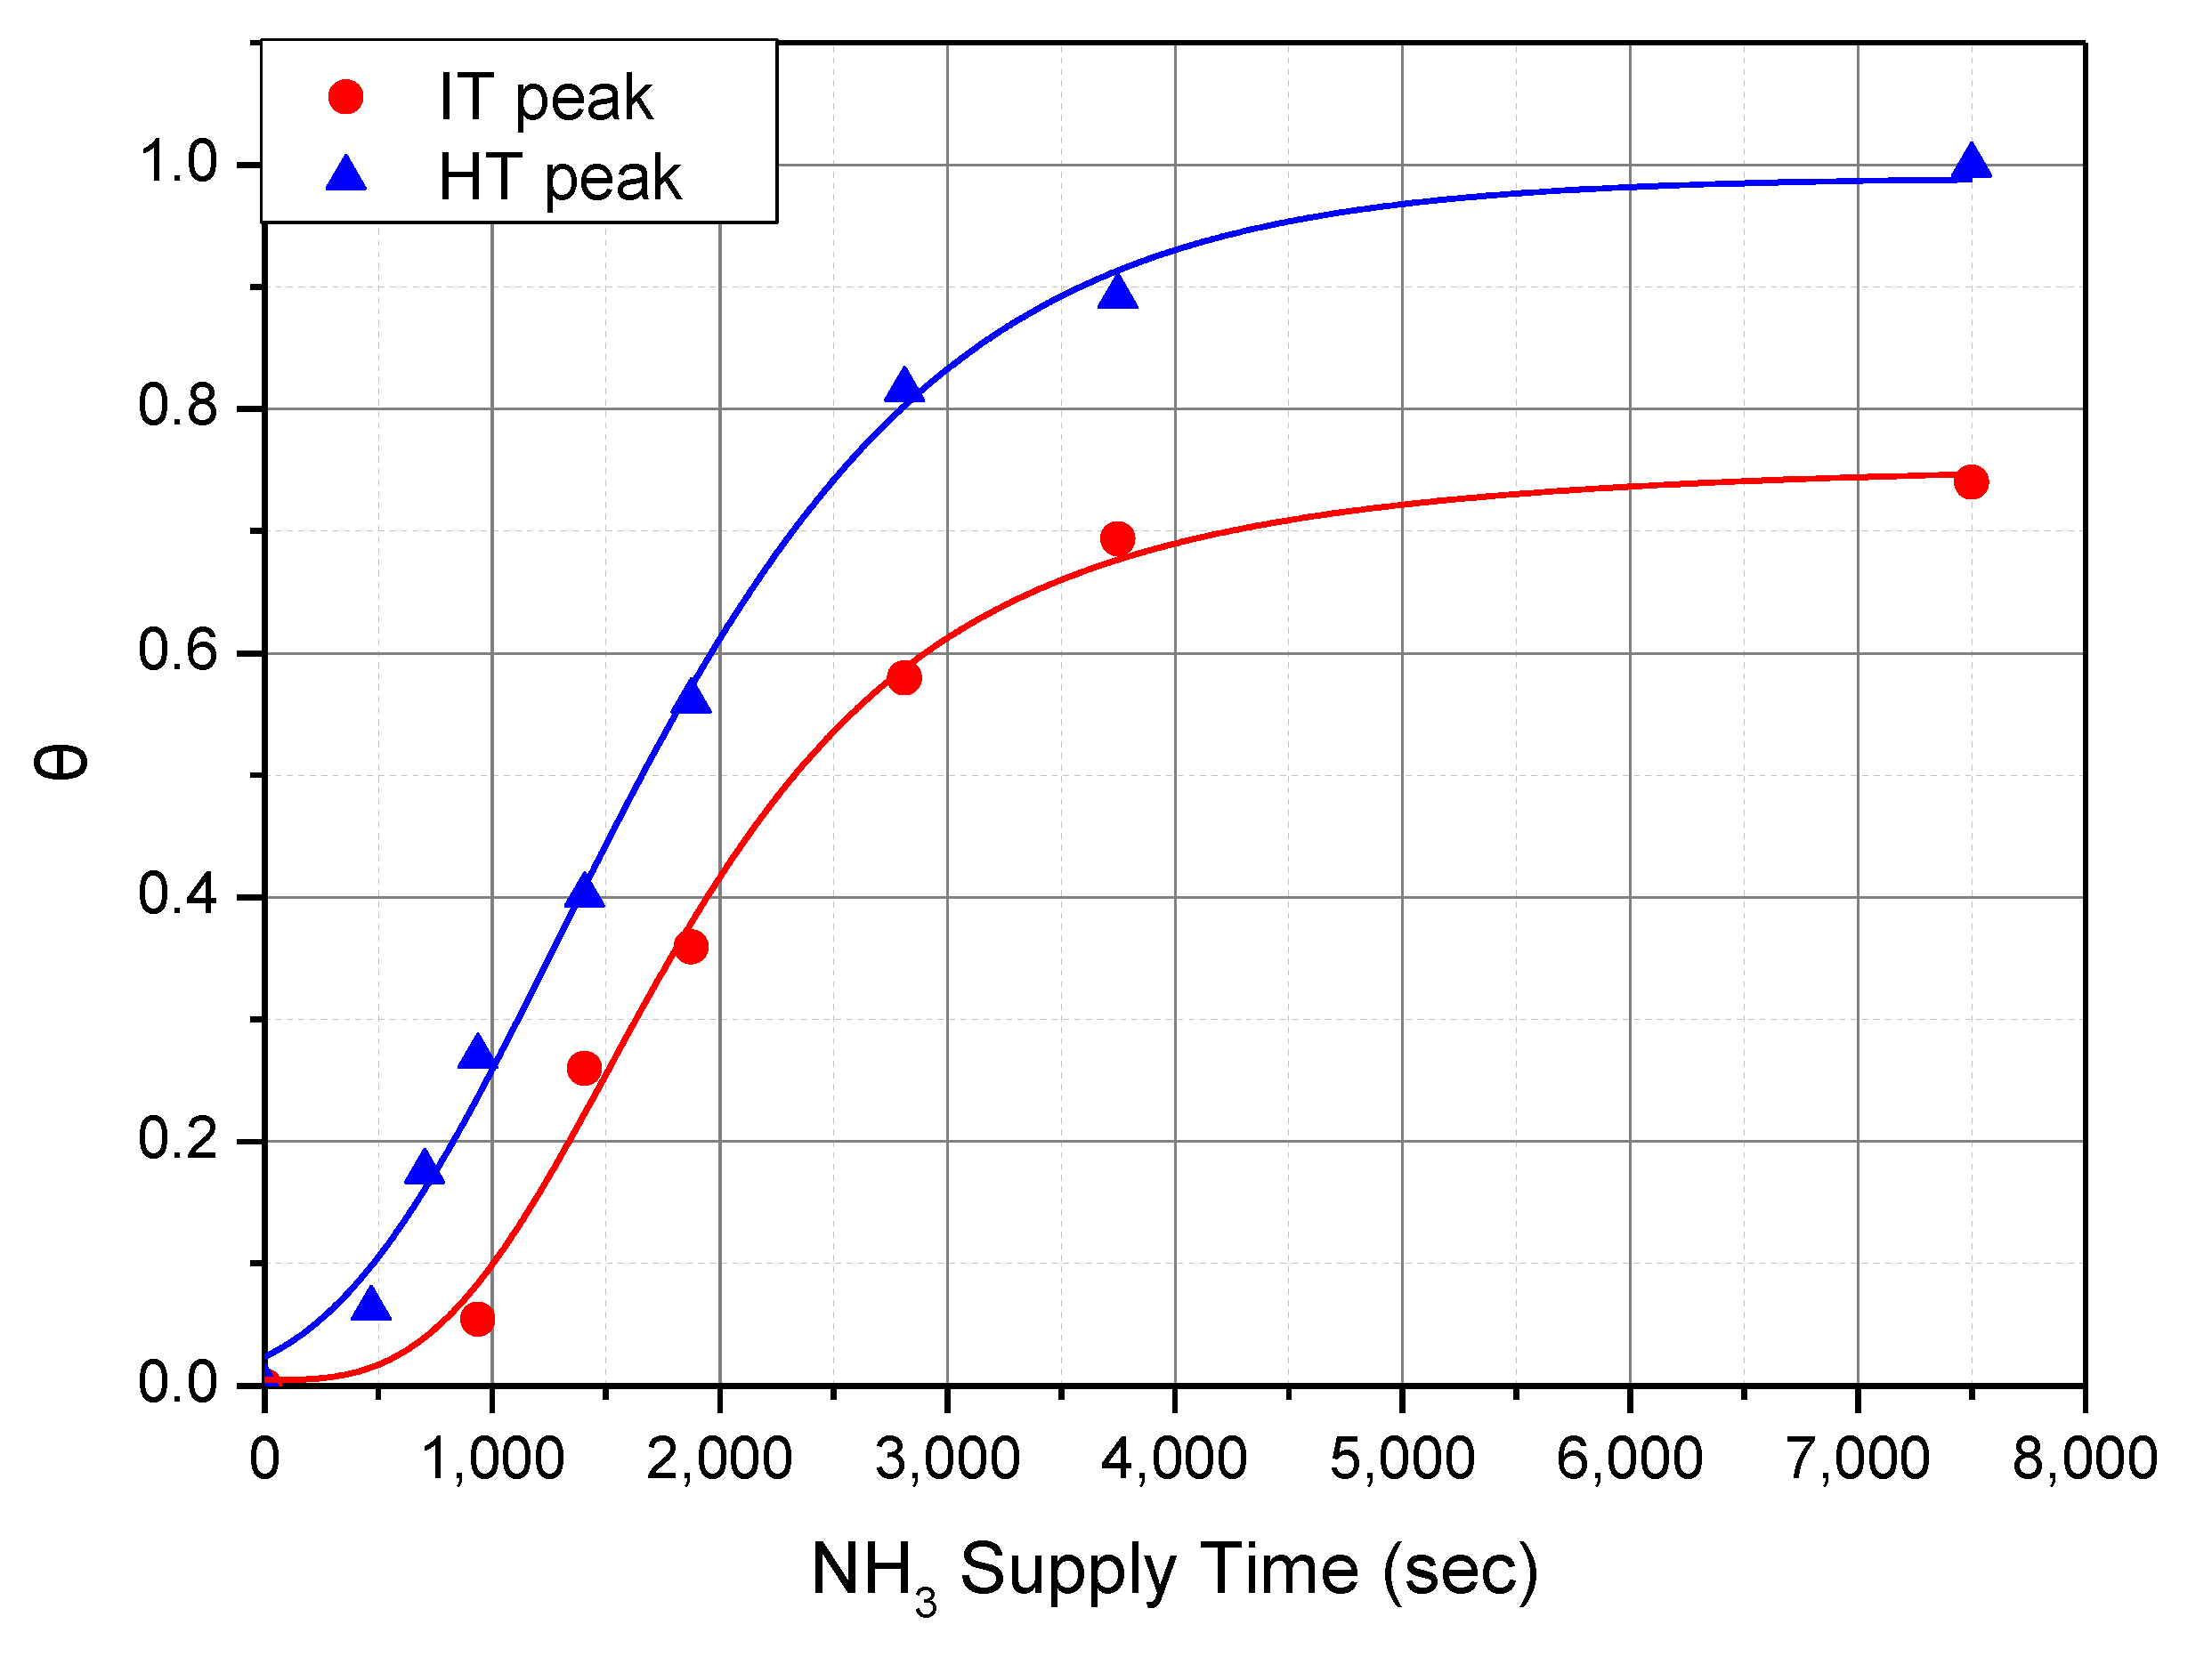
Figure 7 shows the re-plotted graph of
Figure 6 with the relationship between θ and the NH
3 supply time. For the calculation of θ, the values of Ω
*HT of 153 mol/m
3 and Ω
*IT of 99 mol/m
3 were used, respectively. These values were obtained from the integration of the saturated HT and IT peaks shown in
Figure 3 and
Figure 4, respectively. As already mentioned, the LT peak continued to grow and did not converge to a specific shape, so the NH
3 adsorption rate cannot be expressed as a function of θ, and it is not included in
Figure 7.
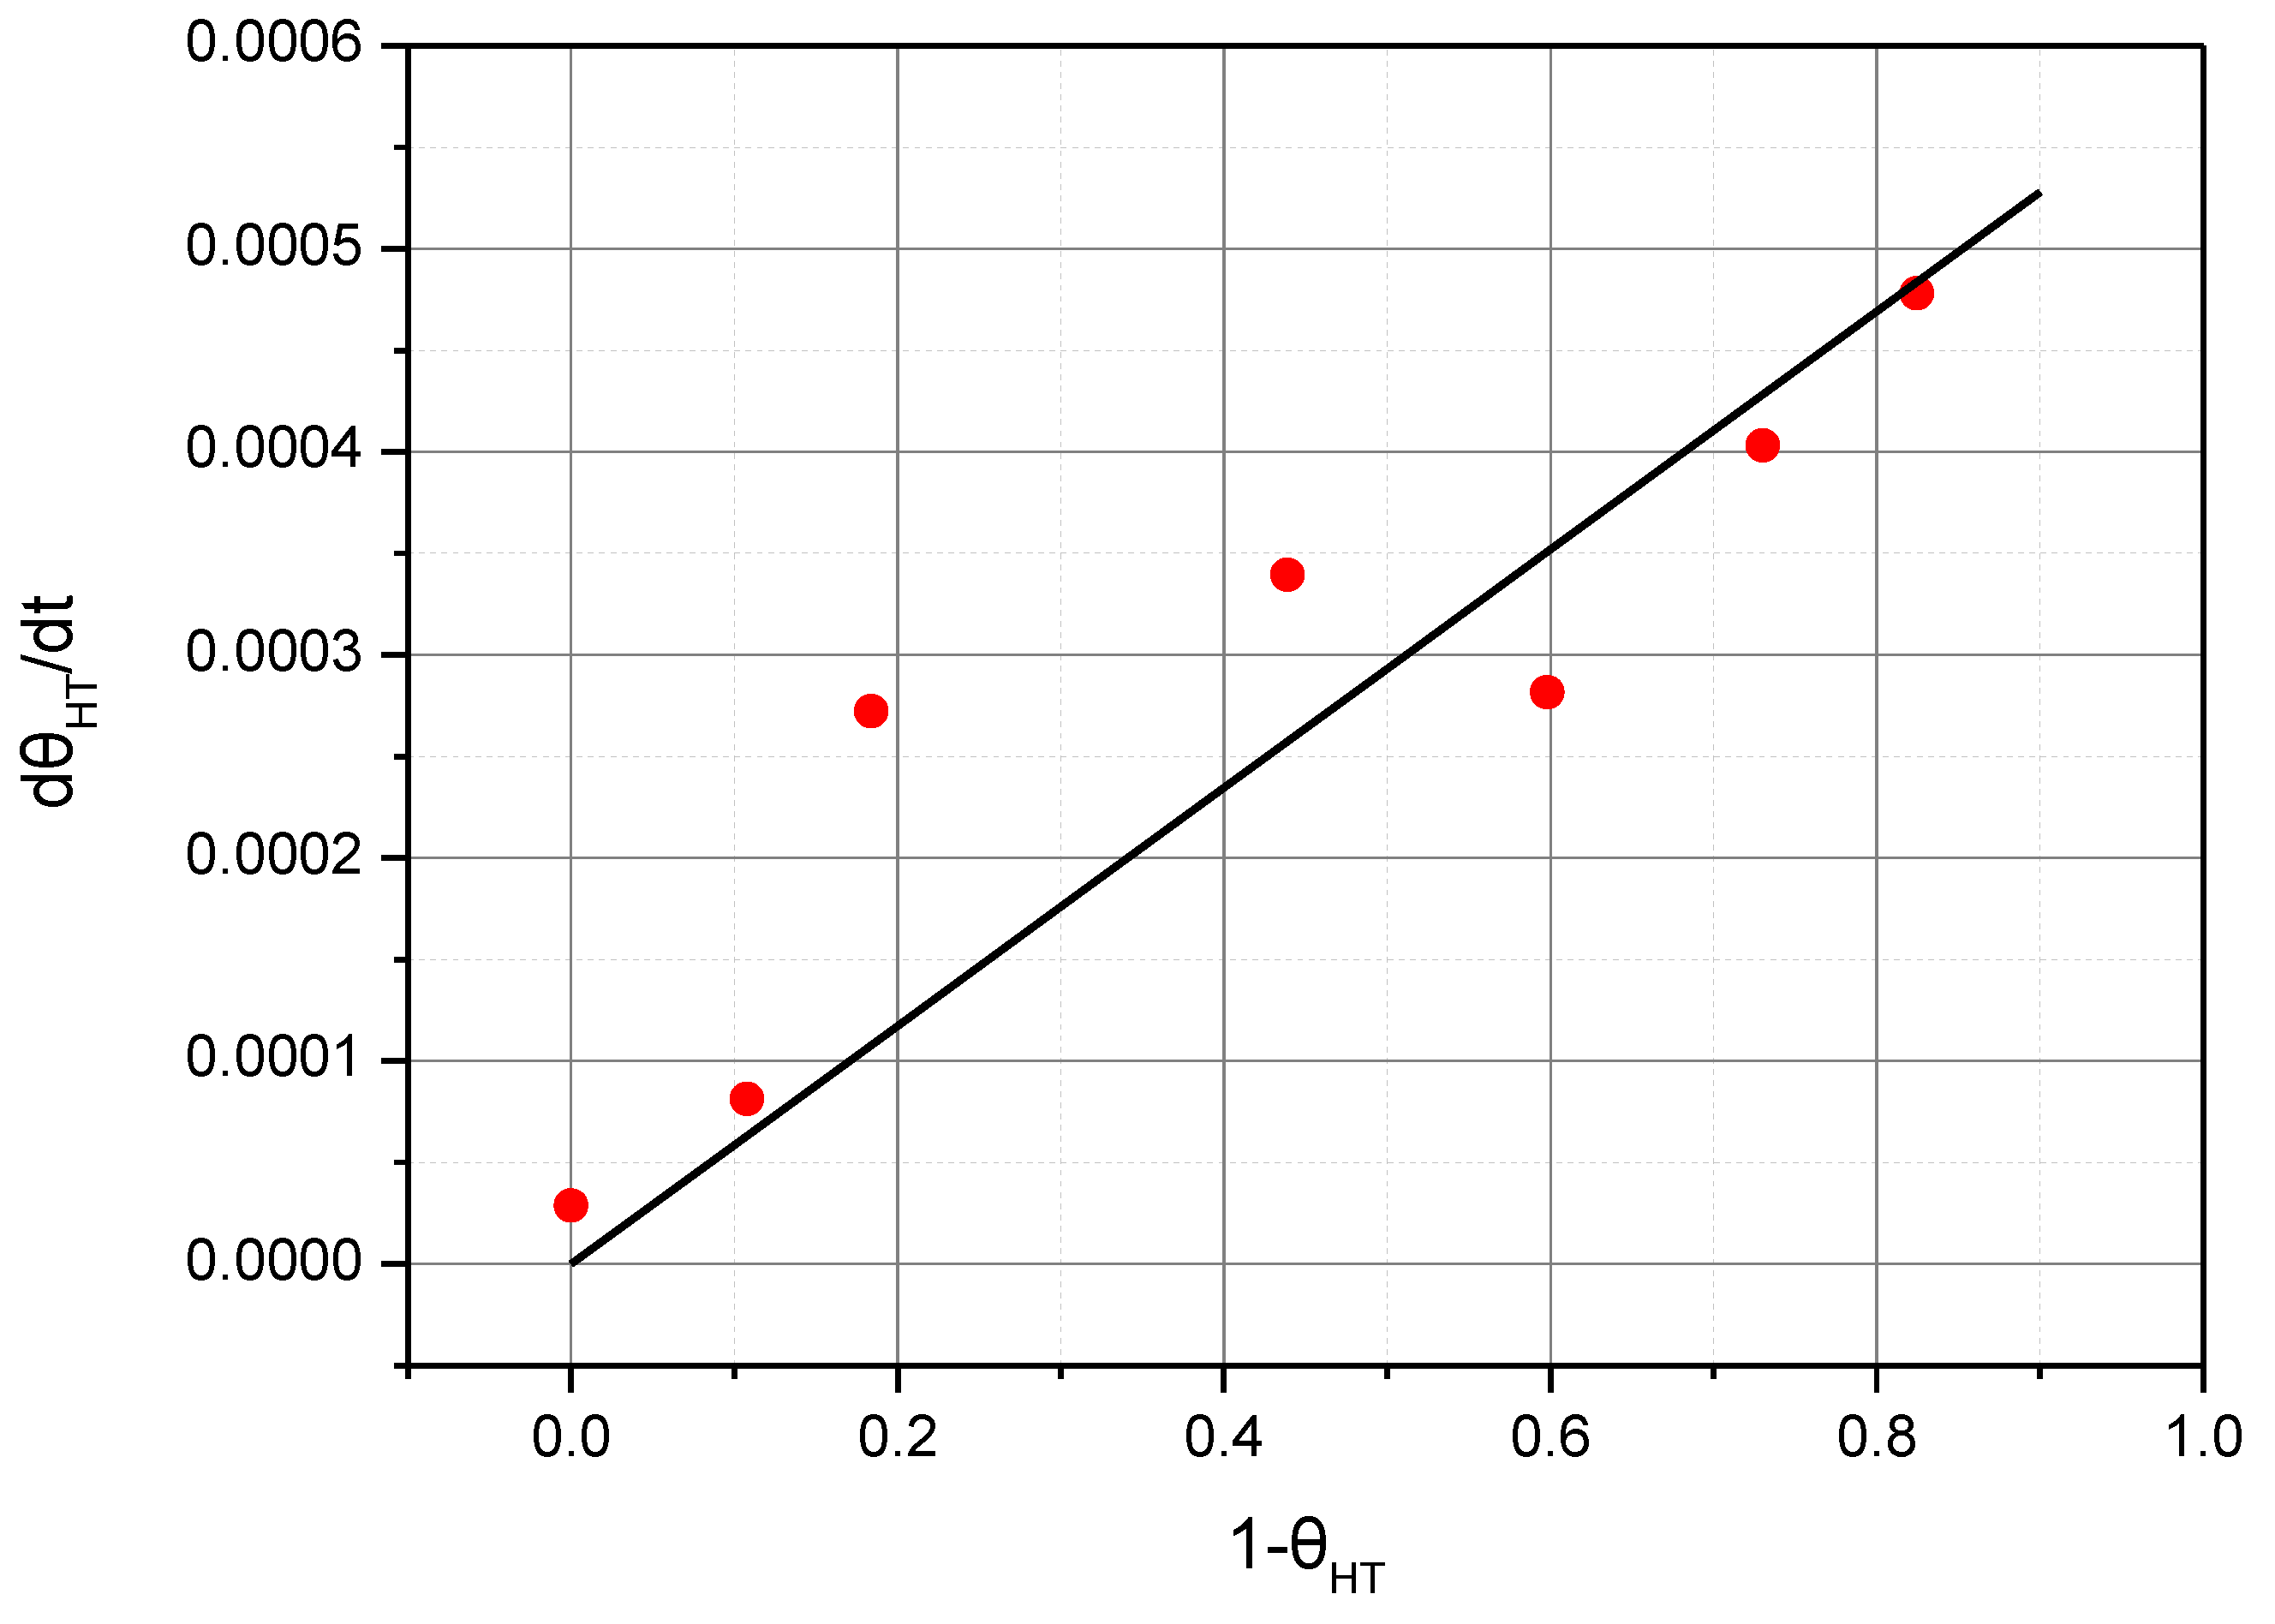
Figure 8 shows the correlation between dθ
HT/dt and (1−θ
HT) for NH
3 adsorption, which was replotted with the data of
Figure 7. It seems that dθ
HT/dt is proportional to (1−θ
HT). This means that the reaction rate of adsorption of NH
3 molecules on the acid sites constituting the HT peak can be expressed by the first-order equation for (1−θ
HT). The reason for some deviations from the linear relationship seem to be due to factors that were not managed precisely during the experiment, such as different external conditions (moisture and temperature) and changes in the catalyst state that occurred during the experiment.
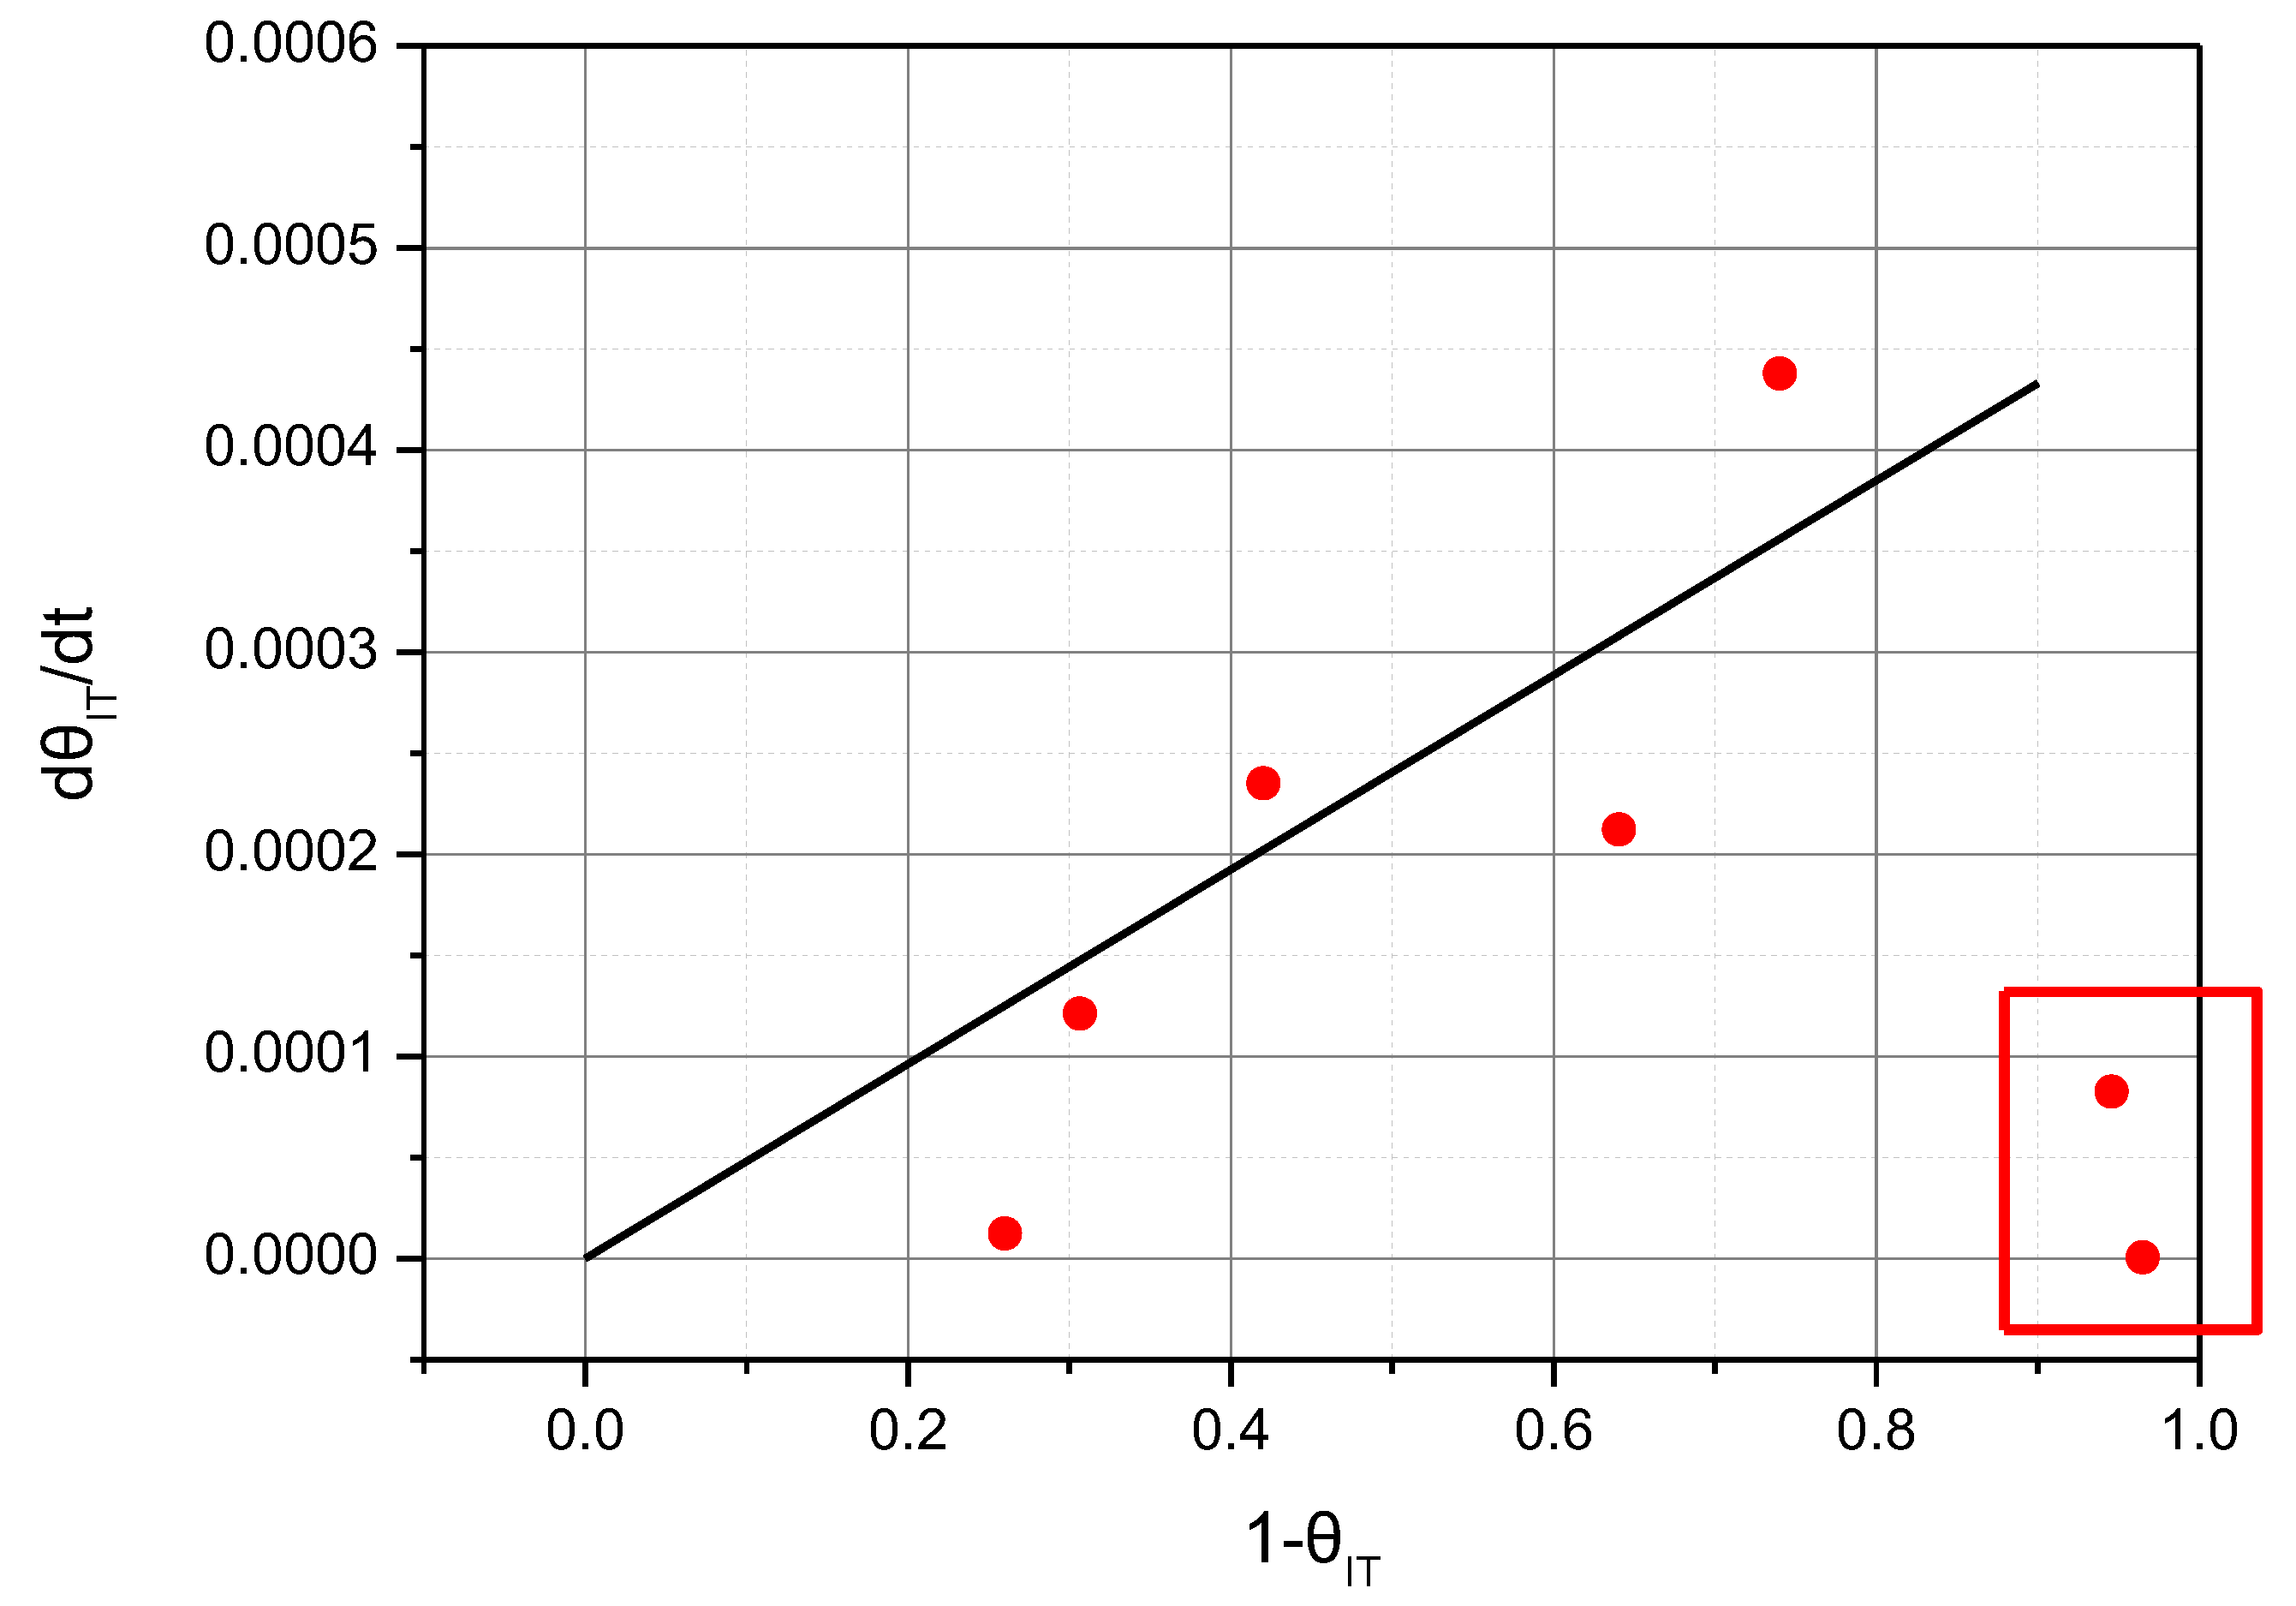
Figure 9 shows the correlation between dθ
IT/dt and (1−θ
IT) for NH
3 adsorption. Unlike the HT peak in
Figure 8, a very small value of dθ
IT/dt was observed at the initial stage of NH
3 adsorption. Subsequently, dθ
IT/dt had a maximum value at θ of ~0.2, and thereafter, it tended to decrease as θ
IT increased. The NH
3 molecules were first adsorbed to the strong acid sites of the HT peak, and then the acid sites of the IT peak were filled with NH
3 molecules. This led to a low NH
3 adsorption rate for the IT peak at the initial stage of NH
3 adsorption. However, in the absence of the influence of the acid sites of the HT peak, the rate of adsorption of ammonia to the acid sites of IT peak seems to be linearly proportional to (1−θ
IT). The deviations from the linear relationship in
Figure 9 mean that the rate of NH
3 adsorption to acid sites in the IT peak was not only affected by (1−θ
IT), but also other factors. Additionally, it can be said that these deviations were larger than in
Figure 8. This means that the rate of NH
3 adsorption to acid sites of the IT peak is affected by more factors than the HT peak. In addition to the external air temperature, humidity, and catalyst state described in
Figure 8, the influence of acid sites of the HT peak and LT peak are alsoincluded in these factors.
To date, many researchers have attempted to calculate the rate of NH3 adsorption and desorption of a zeolite catalyst as a single-site model. Although the single-site model has the advantage of being simple, it is limited in providing an effective description of the phenomena of NH3 adsorption and desorption.
This study suggests the modification of Equation (3) to describe the NH
3 adsorption rates as Equation (6) for the acid sites in the HT peak, and Equation (7) for the acid sites in the IT peak.
The values of
and
can be determined from the slopes of
Figure 8 and
Figure 9, respectively.
To effectively describe the desorption phenomenon of ammonia molecules on the Cu SSZ-13 zeolite catalyst, it is desirable to express the desorption rates of the IT peak and HT peak separately. The NH
3 desorption rate can be described as follows:
Figure 10 and
Figure 11 introduce the process to find
,
,
, and
in Equations (8) and (9).
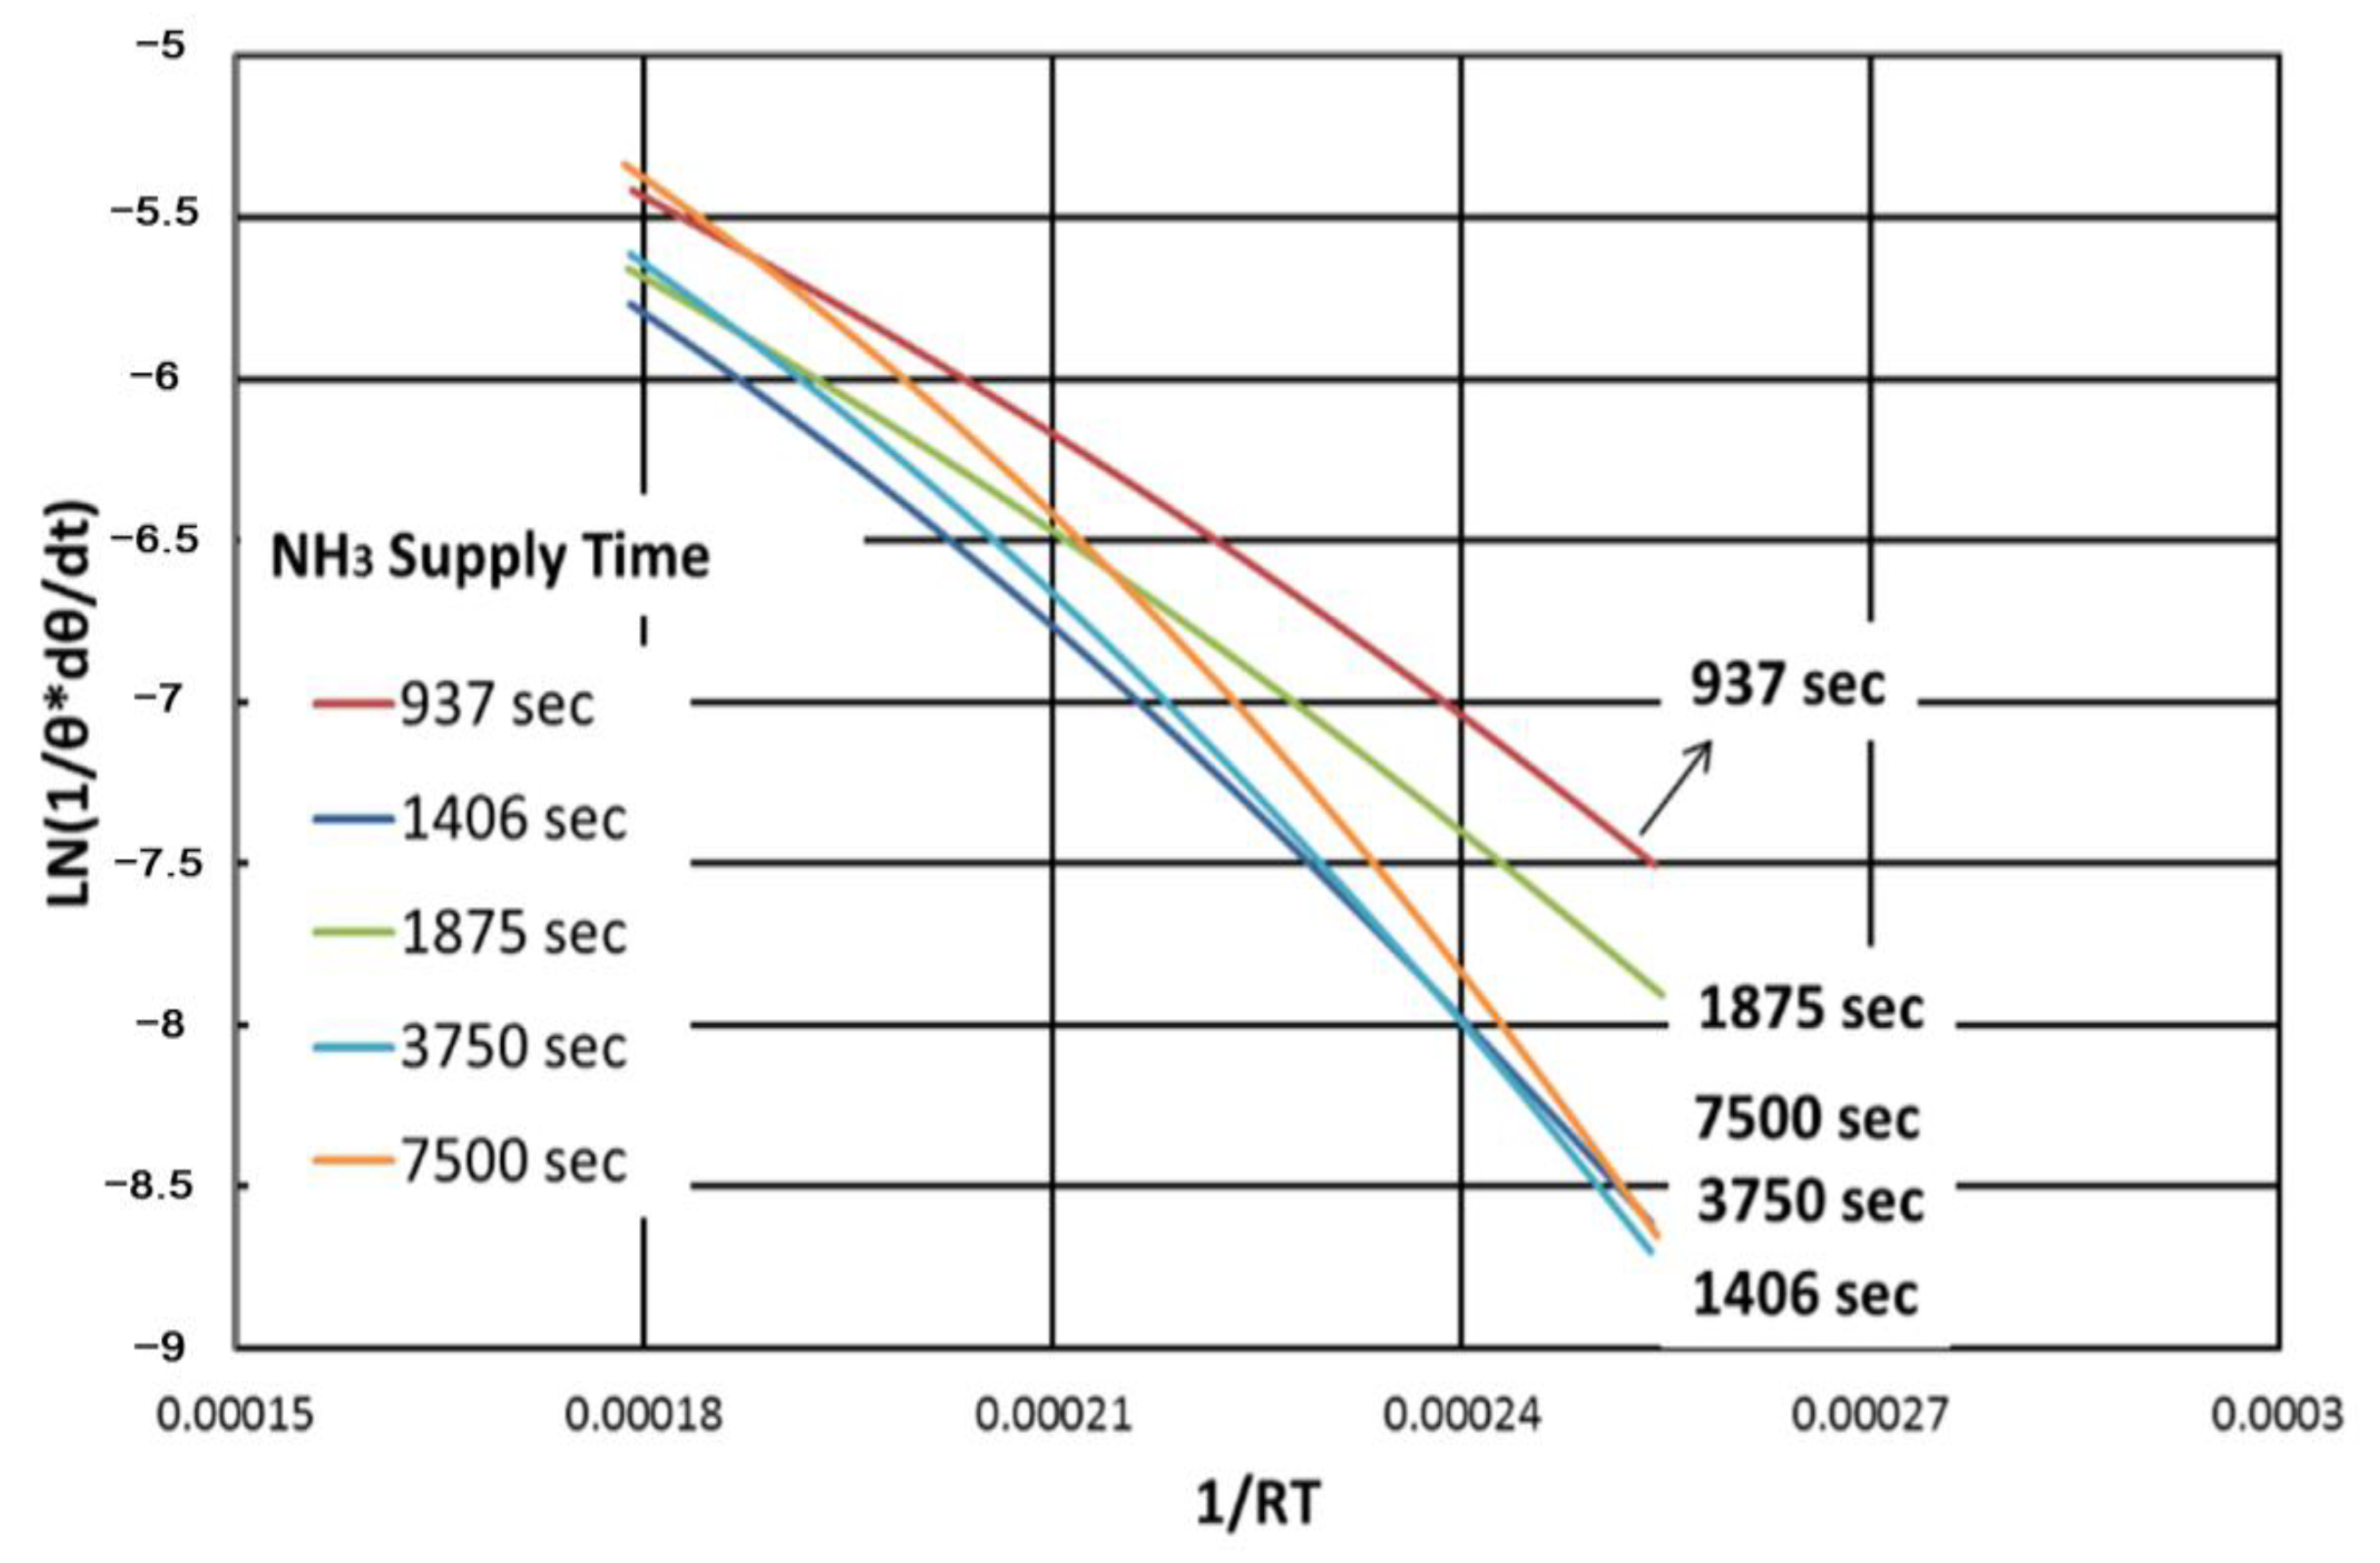
Figure 10 shows the relationship between ln(1/θ*dθ/dt) and 1/(RT) of the IT peak. In this graph, the slope represents the value of the activation energy of the reaction, and the log value of the
y-axis intercept indicates the Arrhenius reaction constant. A nearly linear relationship between ln(1/θ*dθ/dt) and 1/(RT) is shown at each curve. However, the slopes and the values of
y-axis intercept of each curve show some deviations, with no clear trend. The reason for this deviation is uncertain. The deviations may be caused by the experimental method, or by ambient conditions.
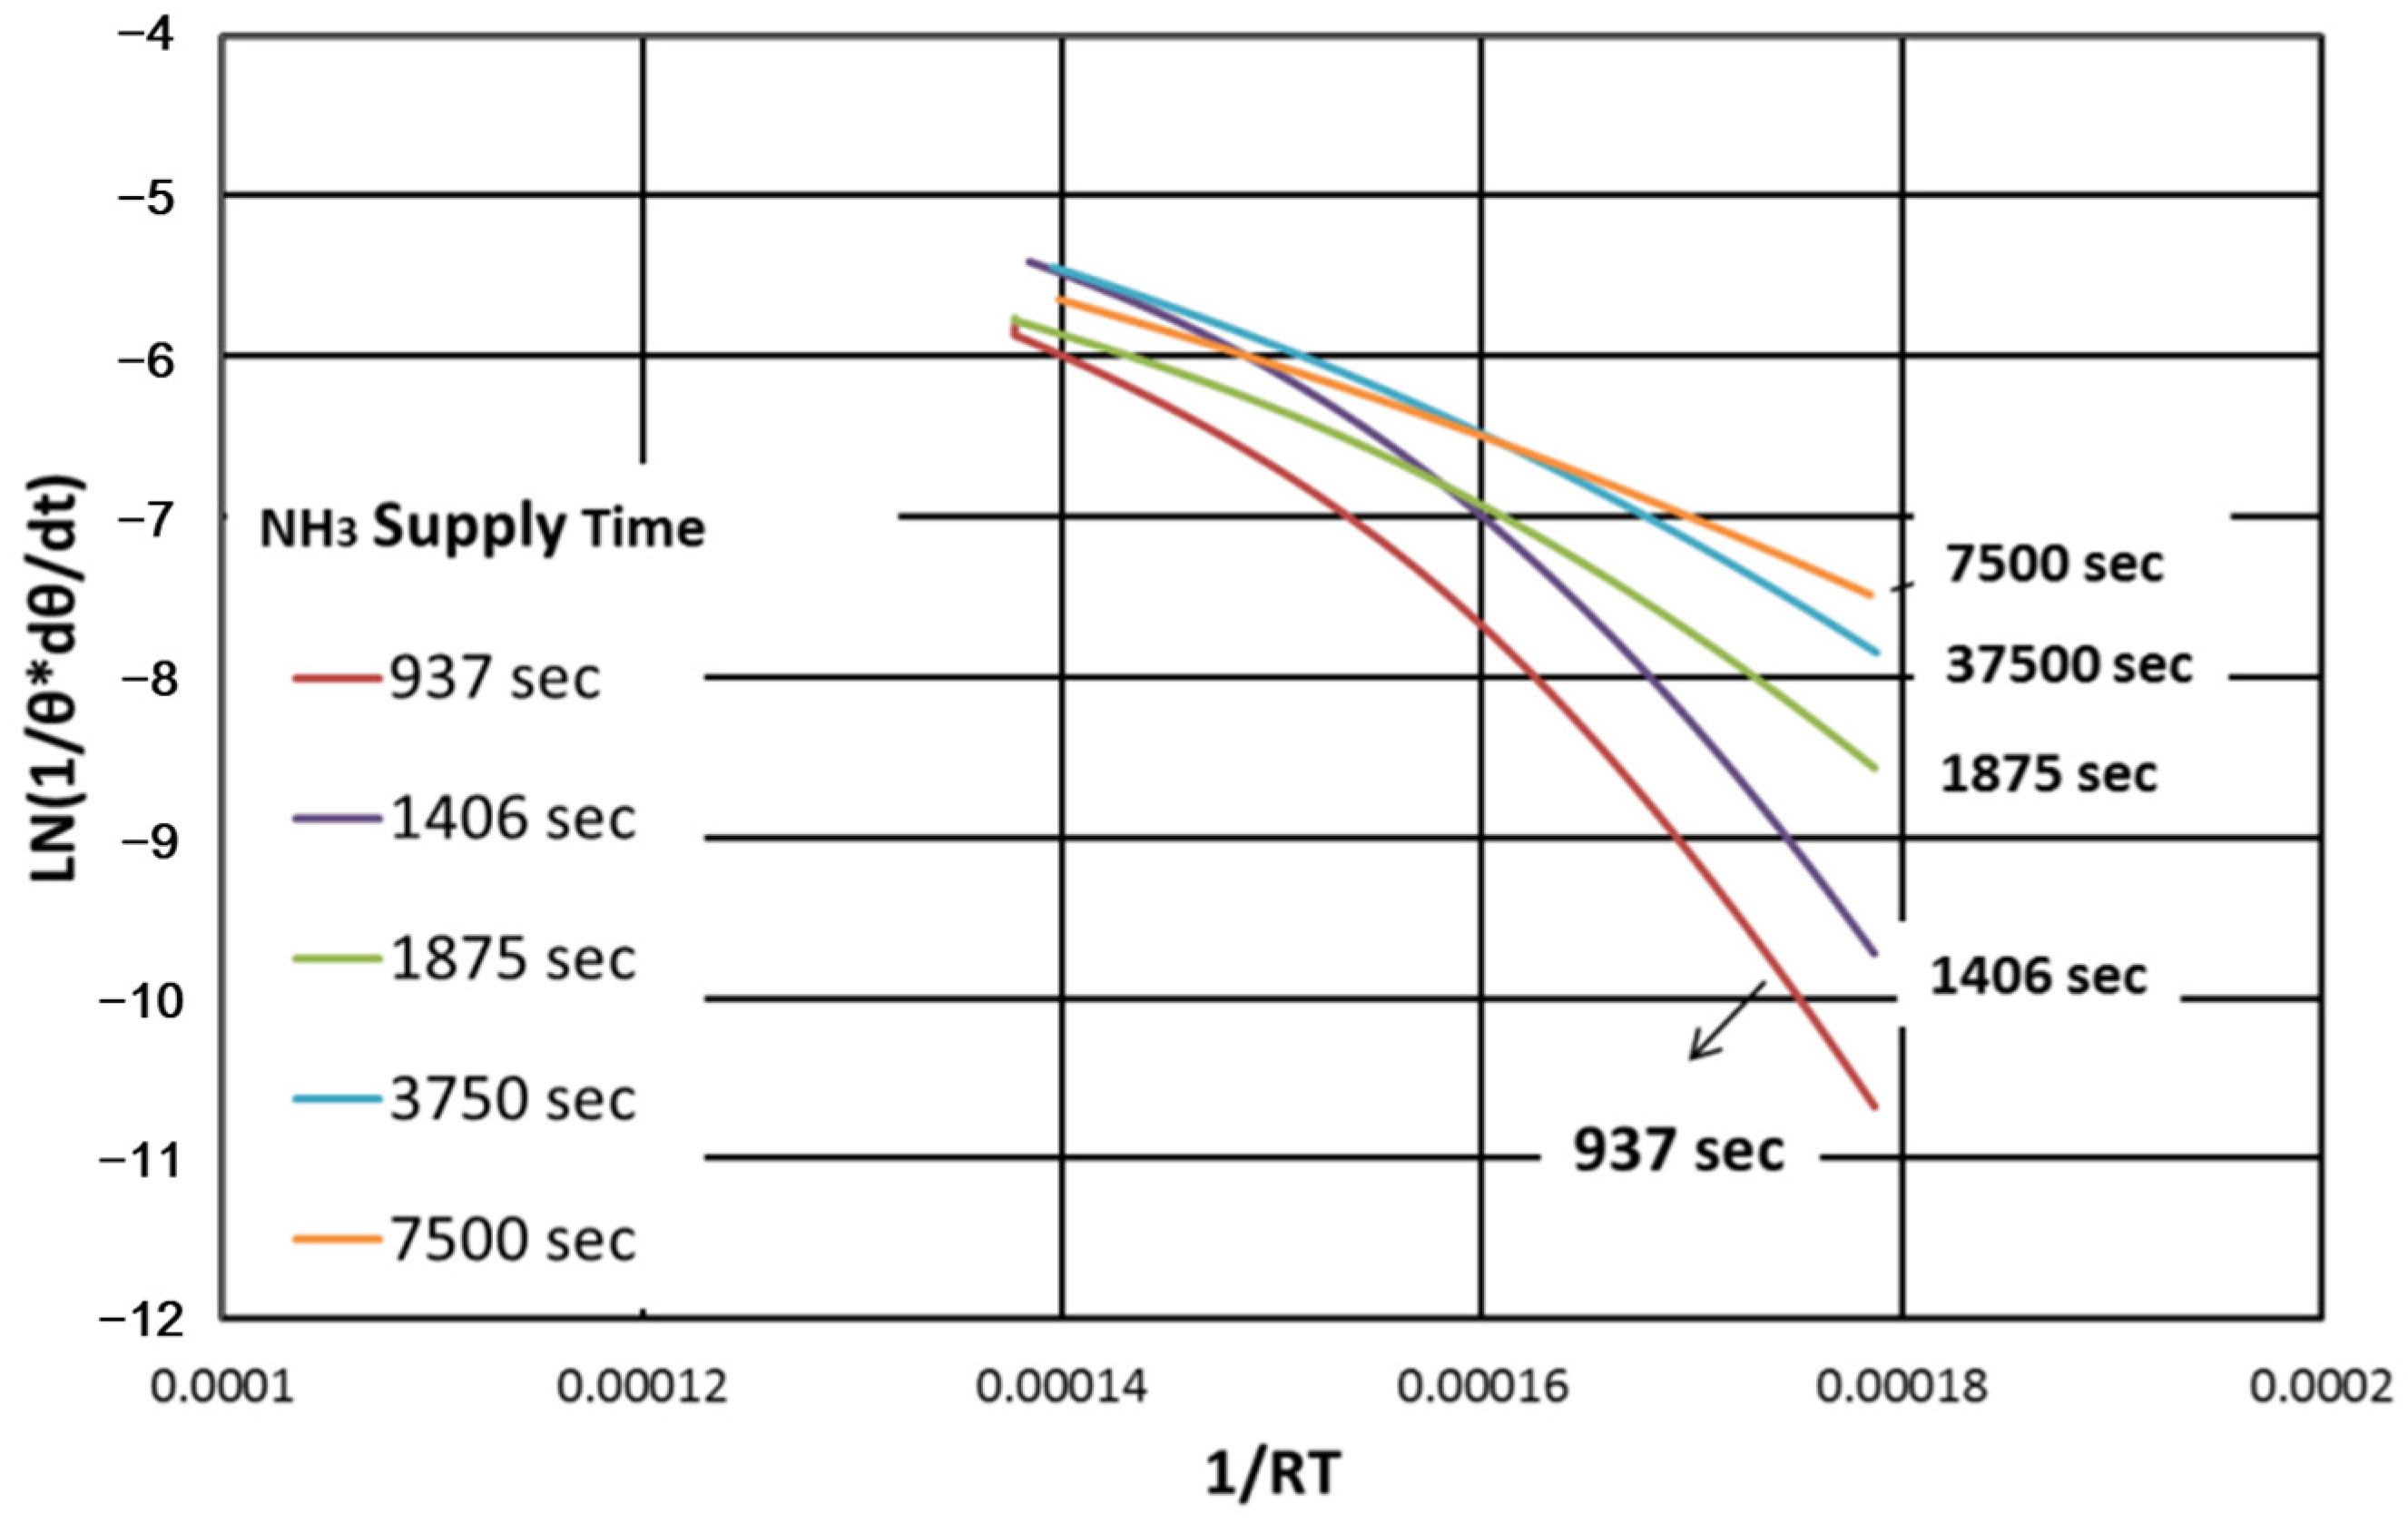
Figure 11 shows the NH
3 desorption rate of the HT peak as a function of ln(1/θ*dθ/dt) versus 1/(RT). The slope of the curve, which represents the activation energy, decreased when the NH
3 supply time was increased. This means that in the SSZ-13 catalyst, various acid sites with different degrees of acidity are widely distributed in the HT peak. These results show that NH
3 molecules adsorbed early in the reaction had stronger bonding and higher activation energy than NH
3 molecules adsorbed later.
From the above experimental results, we found that the activation energy and pre-exponential factor of the HT peak and LT peak gradually changed as the process of ammonia desorption proceeded. This study determined the averaged values of activation energy and the pre-exponential factor. It is necessary to find a more effective method to express the change of these values with time. However, the averaged kinetic parameters give the advantage of simple calculation.
Table 2 shows the values of the kinetic parameters for Equations (6)–(9), which were determined from the experimental results for NH
3 concentrations of 200 ppm. These values can be used effectively to describe the NH
3 adsorption and desorption of a zeolite catalyst.


