Article

Glycine Substitution of Residues with Unfavored Dihedral Angles Improves Protein Thermostability

1
School of Pharmaceutical Sciences (Shenzhen), Sun Yat-Sen University, Shenzhen 518107, China
2
School of Food Science and Engineering, South China University of Technology, Guangzhou 510640, China
3
Guangdong Youmei Institute of Inteligent Bio-Manufacturing Co., Ltd., Foshan 528200, China
4
Department of Computer Science, Shantou University, Shantou 515063, China
5
Guangdong Provincial Key Laboratory of Infectious Diseases and Molecular Immunopathology, Shantou 515063, China
*
Authors to whom correspondence should be addressed.
Catalysts 2022, 12(8), 898; https://doi.org/10.3390/catal12080898
Submission received: 11 July 2022 / Revised: 3 August 2022 / Accepted: 4 August 2022 / Published: 16 August 2022
(This article belongs to the Section Biocatalysis)

Abstract

:
Single mutations that can substantially enhance stability are highly desirable for protein engineering. However, it is generally rare for this kind of mutant to emerge from directed evolution experiments. This study used computational approaches to identify hotspots in a diacylglycerol-specific lipase for mutagenesis with functional hotspot and sequence consensus strategies, followed by ∆∆G calculations for all possible mutations using the Rosetta ddg_monomer protocol. Single mutants with significant ∆∆G changes (≤−2.5 kcal/mol) were selected for expression and characterization. Three out of seven tested mutants showed a significantly enhanced thermostability, with Q282W and A292G in the catalytic pocket and D245G located on the opposite surface of the protein. Remarkably, A292G increased the T5015 (the temperature at which 50% of the enzyme activity was lost after a 15 min of incubation) by ~7 °C, concomitant with a twofold increase in enzymatic activity at the optimal reaction temperature. Structural analysis showed that both A292 and D245 adopted unfavored dihedral angles in the wild-type (WT) enzyme. Substitution of them by glycine might release a steric strain to increase the stability. In sum, substitution by glycine might be a promising strategy to improve protein thermostability.

Graphical Abstract

1. Introduction

Enzymes are prominent biocatalysts in the food industry, the transformation of natural products, and biomass degradation. There is a continuous demand to make natural enzymes more active, selective, or stable. Since extensive protein structure studies have unraveled the structure–function relationship, it provides possibilities for the structure-guided rational design of enzymes.
Lipases (EC 3.1.1.3) are α/β hydrolases that catalyze the hydrolysis and synthesis of long-chain acylglycerols. They have wide usage in many industries, including food and beverage, laundry, leather, paper pulping, and pharmaceuticals [1]. While most lipases preferably hydrolyze triacylglycerols, some lipases of fungal origin are specific for mono- and diacylglycerol (DAG). One of these lipases, namely, SMG1 (UniprotKB A8PUY1), which is isolated from Malassezia globose [2], has received potential economic interest and was studied regarding pure DAG synthesis [3], food emulsifier [4], and deacidification of rice bran oil [5]. However, SMG1 or other DAG lipases are limited by harsh industrial conditions, such as high temperature and extreme pH. Directed evolution has identified thermostability-enhanced mutants for SMG1 [6]. By screening a mutant library generated by error-prone PCR, only 13 of 2316 clones showed increased thermostability, with two of the best showing T5015 increases above 3 °C. So far, several crystal structures have been solved for the SMG1 WT and mutants in the closed state [7,8], which can serve as the template for rational structure-based design.
Directed evolution is generally time-consuming and costly in protein engineering. An alternative method for protein engineering is site-directed mutagenesis based on rational structure-guided design. This approach requires a protein structure, the hotspot identification to mutate, and the accurate prediction of the thermostable mutation. Molecular modeling methods have been developed to facilitate this process, either by force-field or machine-learning-based approaches. Machine-learning-based methods have made significant progress in protein structure prediction, such as Alphafold [9] and RoseTTAFold [10]. It remains elusive whether Alphafold can predict the effect of mutations on protein stability. Machine-learning-based methods are also being developed to help predict thermostable mutations with some success [11,12,13]. In addition, force-field-based methods, such as FoldX and Rosetta ddg_monomer, are widely used to predict stabilized single mutations [14,15]. These methods rely on conformational sampling of the mutated proteins and the accurate estimation of the free energy change in the protein’s folded state.
Moreover, these energy-based methods are often combined with hotspot identification for in silico screens to select mutations for experimental tests. Hotspot residues include those that are (1) located in the substrate-binding pocket (termed functional hotspots), (2) flexible in the solved crystal structure, (3) varied in homologous proteins, and (4) correlated mutations in the protein [16]. These hotspot identification strategies have been integrated with the free energy calculations of mutations to build an automatic server for protein engineering [16,17,18].
A recent study evaluated nine algorithms on their ability to accurately predict the ∆∆G of protein mutations, and the results suggested that there is room for improvement [19]. In this study, we used the Hotspot Wizard 3.0 server (https://loschmidt.chemi.muni.cz/hotspotwizard/ accessed on 15 August, 2021) to explore whether a large predicted ∆∆G is efficient at enriching thermostable mutants [16]. First, hotspots for thermostability enhancement were predicted using two of the four provided strategies, namely, (1) functional hotspots and (2) sequence consensus. Second, in silico free-energy calculation of site-saturation mutations was conducted using the default Rosetta ddg_monomer algorithm with conformational optimization of only amino acids within 8 Å from the mutated site [14,16]. Only mutations with ≤−2.5 kcal/mol were selected for expression and further experiment. Out of the seven SMG1 mutations tested experimentally, three showed a significant improvement of up to 7 °C in their thermostability compared with the WT and a higher catalytic activity. The molecular mechanism was further analyzed, in which the result suggested release from an unfavored dihedral angle can be a promising way to enhance protein thermostability.

2. Results

2.1. Predicting of Thermostable Mutants

In the Hotspot Wizard 3.0 server, functional hotspots refer to highly mutable residues located in the active site pocket or access tunnels, and the consensus sequence refers to hotspots from back-to-consensus analysis of homologous proteins [16]. We selected nine functional hotspots (residues 282, 278, 102, 293, 292, 105, 172, 106, and 107) (Table S1) and twenty consensus sequence hotspots (residues 245, 77, 188, 180, 146, 124, 246, 149, 203, 125, 176, 260, 126, 184, 135, 210, 222, 145, 134, and 99) (Table S2) for further calculation. Further, the Hotspot Wizard 3.0 server used Rosetta ddg_monomer low-resolution protocol in which only residues within 8 Å of the mutated site were repacked to calculate the ∆∆G of mutants [14,16]. A previous study showed that Rosetta could achieve higher precision (the ratio between true stabilizing mutations versus mutations predicted as stabilizing) when the thresholds of predicted ∆∆G upon mutations were set higher [17]. Only mutants with a calculated ∆∆G ≤−2.5 kcal/mol were experimentally tested in this study. In total, seven mutations were chosen for the experimental validation, including Q282W, N102L, A292G, and S105M identified using the functional hotspot strategy, and D245G, S222H, and S222L using the sequence consensus strategy. D77E, with a calculated ∆∆G of −2.6 kcal/mol, was shown to improve the thermostability of SMG1 and will be reported elsewhere (unpublished data).
These selected mutations were located in six different residues. Only residue 222 was buried in the protein (Figure 1). Residues 102 and 105 were located at the lid domain, and A292 and Q282 were located at the C-terminus of SMG1. D245 was at the opposite face of the protein. We expressed SMG1 as a maltose-binding protein (MBP) fused protein in E. coli, and the crude lysates were used to quickly evaluate the thermostability of the mutants, using 4-nitrophenol caprylate as a substrate. Out of the seven selected mutants, three showed an increase in T5015, namely, D245G, A292G, and Q282W (Figure 2). These three mutants were further purified and studied.

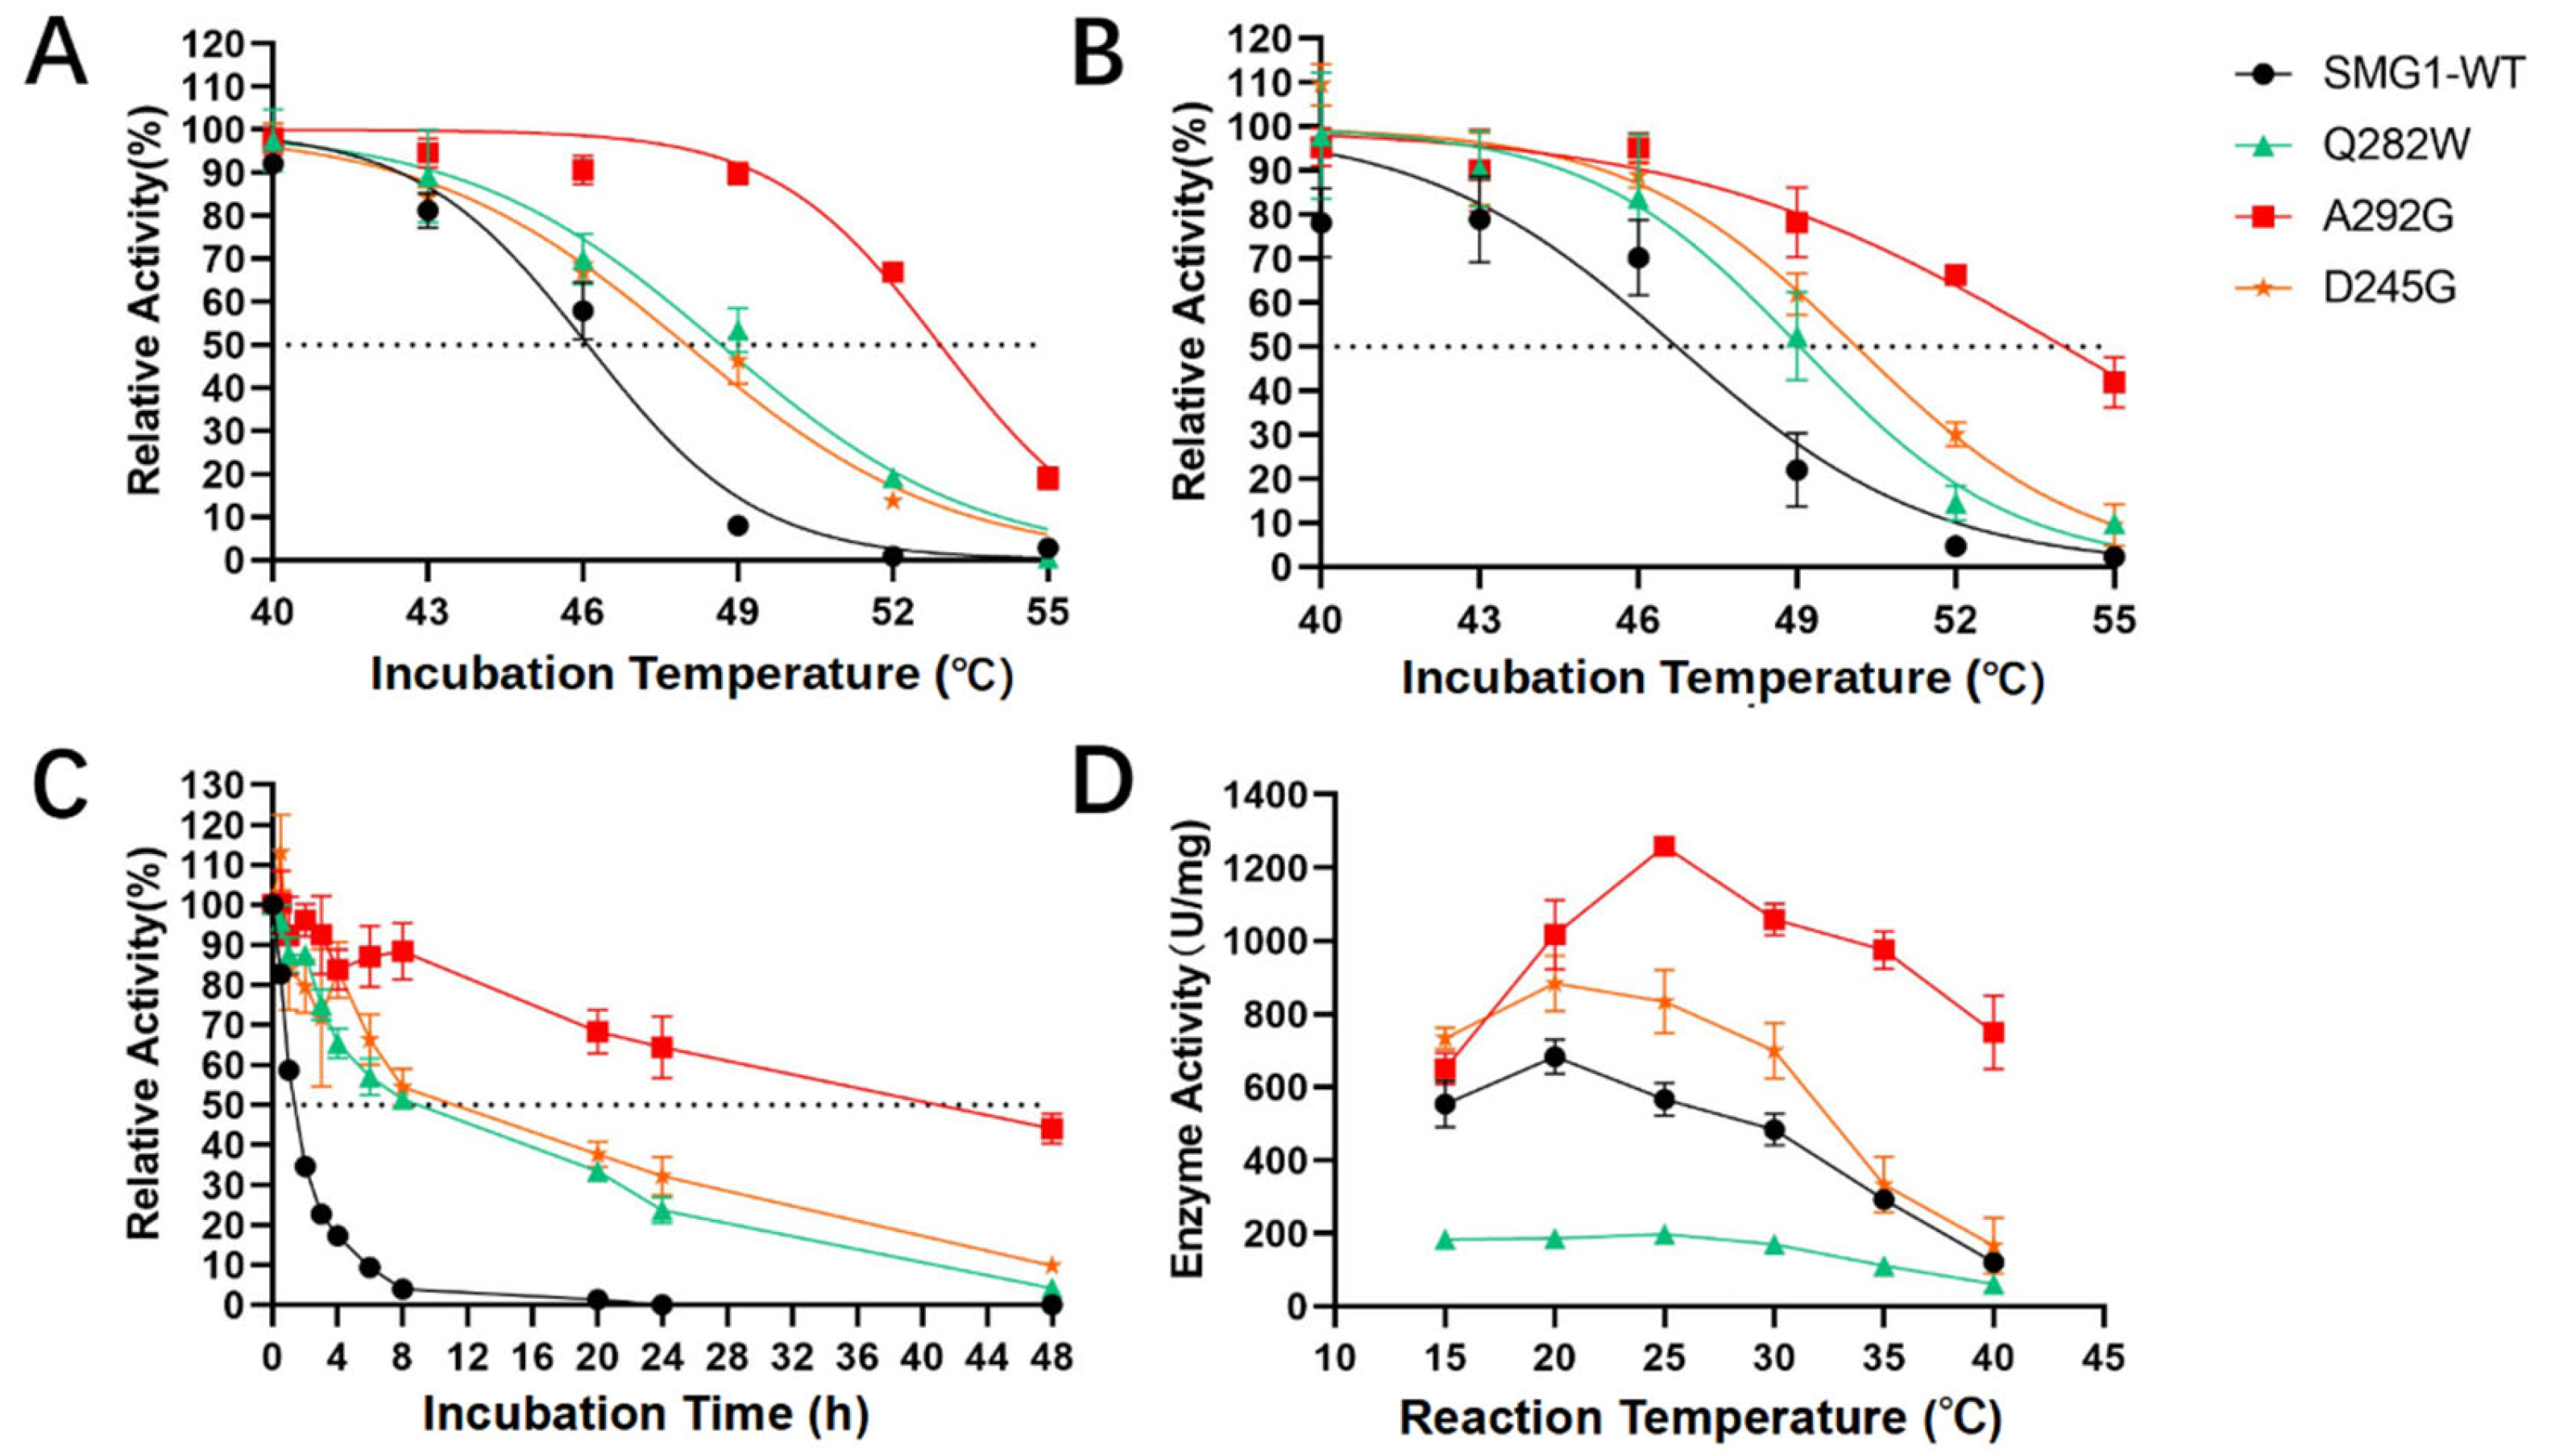
2.2. Characterization of Thermostability-Enhanced Mutants

A292G, Q282W, and D245G consistently improved the thermostability compared with the WT, using either 4-nitrophenol caprylate or DAG-rich oils as substrates (Figure 3A,B). Among them, A292G had the most significant increase in T5015 by ~7 °C (+6.7 °C using 4-nitrophenol caprylate and +7.7 °C using DAG as substrates). In parallel, the melting temperatures (Tm) of these proteins were determined using a thermal shift assay. The result showed that the Tm values of the tag-free SMG1 WT, D245G, and A292G were 51.34 °C, 60.05 °C, and 61.70 °C, respectively (Table 1, Figure S2). D245G and A292G had Tm values that were 8.71 °C and 10.36 °C higher than the WT. It is noteworthy that the melting temperatures of these proteins were several degrees Celsius higher than their corresponding T5015, which is a type of kinetic stability. Our results suggested that SMG1 becomes irreversibly denatured before being fully unfolded. In addition, A292G, Q282W, and D245G had longer half-lives than the WT at 45 °C in the thermal inactivation experiment (Figure 3C). The WT of SMG1 had a half-life of 1.7 h, whereas the half-lives of D245G, Q282W, and A292G were extended to 15.4, 12.5, and 39.9 h, respectively.
The optimal reaction temperature is another essential characteristic of thermostability that affects enzyme application in catalysis. Therefore, optimal reaction temperatures were determined in the hydrolysis of DAG for these mutants. The results showed that the WT and D245G were optimal at 20 °C, whereas A292G was optimal at 25 °C (Figure 3D, Table 1). Two mutants showed higher enzymatic activity than the WT, while Q282W only had ~30% compared with the WT. Residue 282 was located downstream of the catalytic base H281, with its side chain above the catalytic site. Modeling the addition of tryptophan to residue 282 showed a larger steric hindrance in the catalytic pocket, which interfered with substrate binding. D245G had a slight increase in activity by ~30%. Remarkably, A292G had an approximately twofold greater activity compared with the WT at their respective optimal reaction temperatures (WT: 683 U·mg−1 at 20 °C versus A292G: 1258 U·mg−1 at 25 °C. The activity unit U defines the amount of enzyme required to produce 1 μmol of fatty acids per minute.

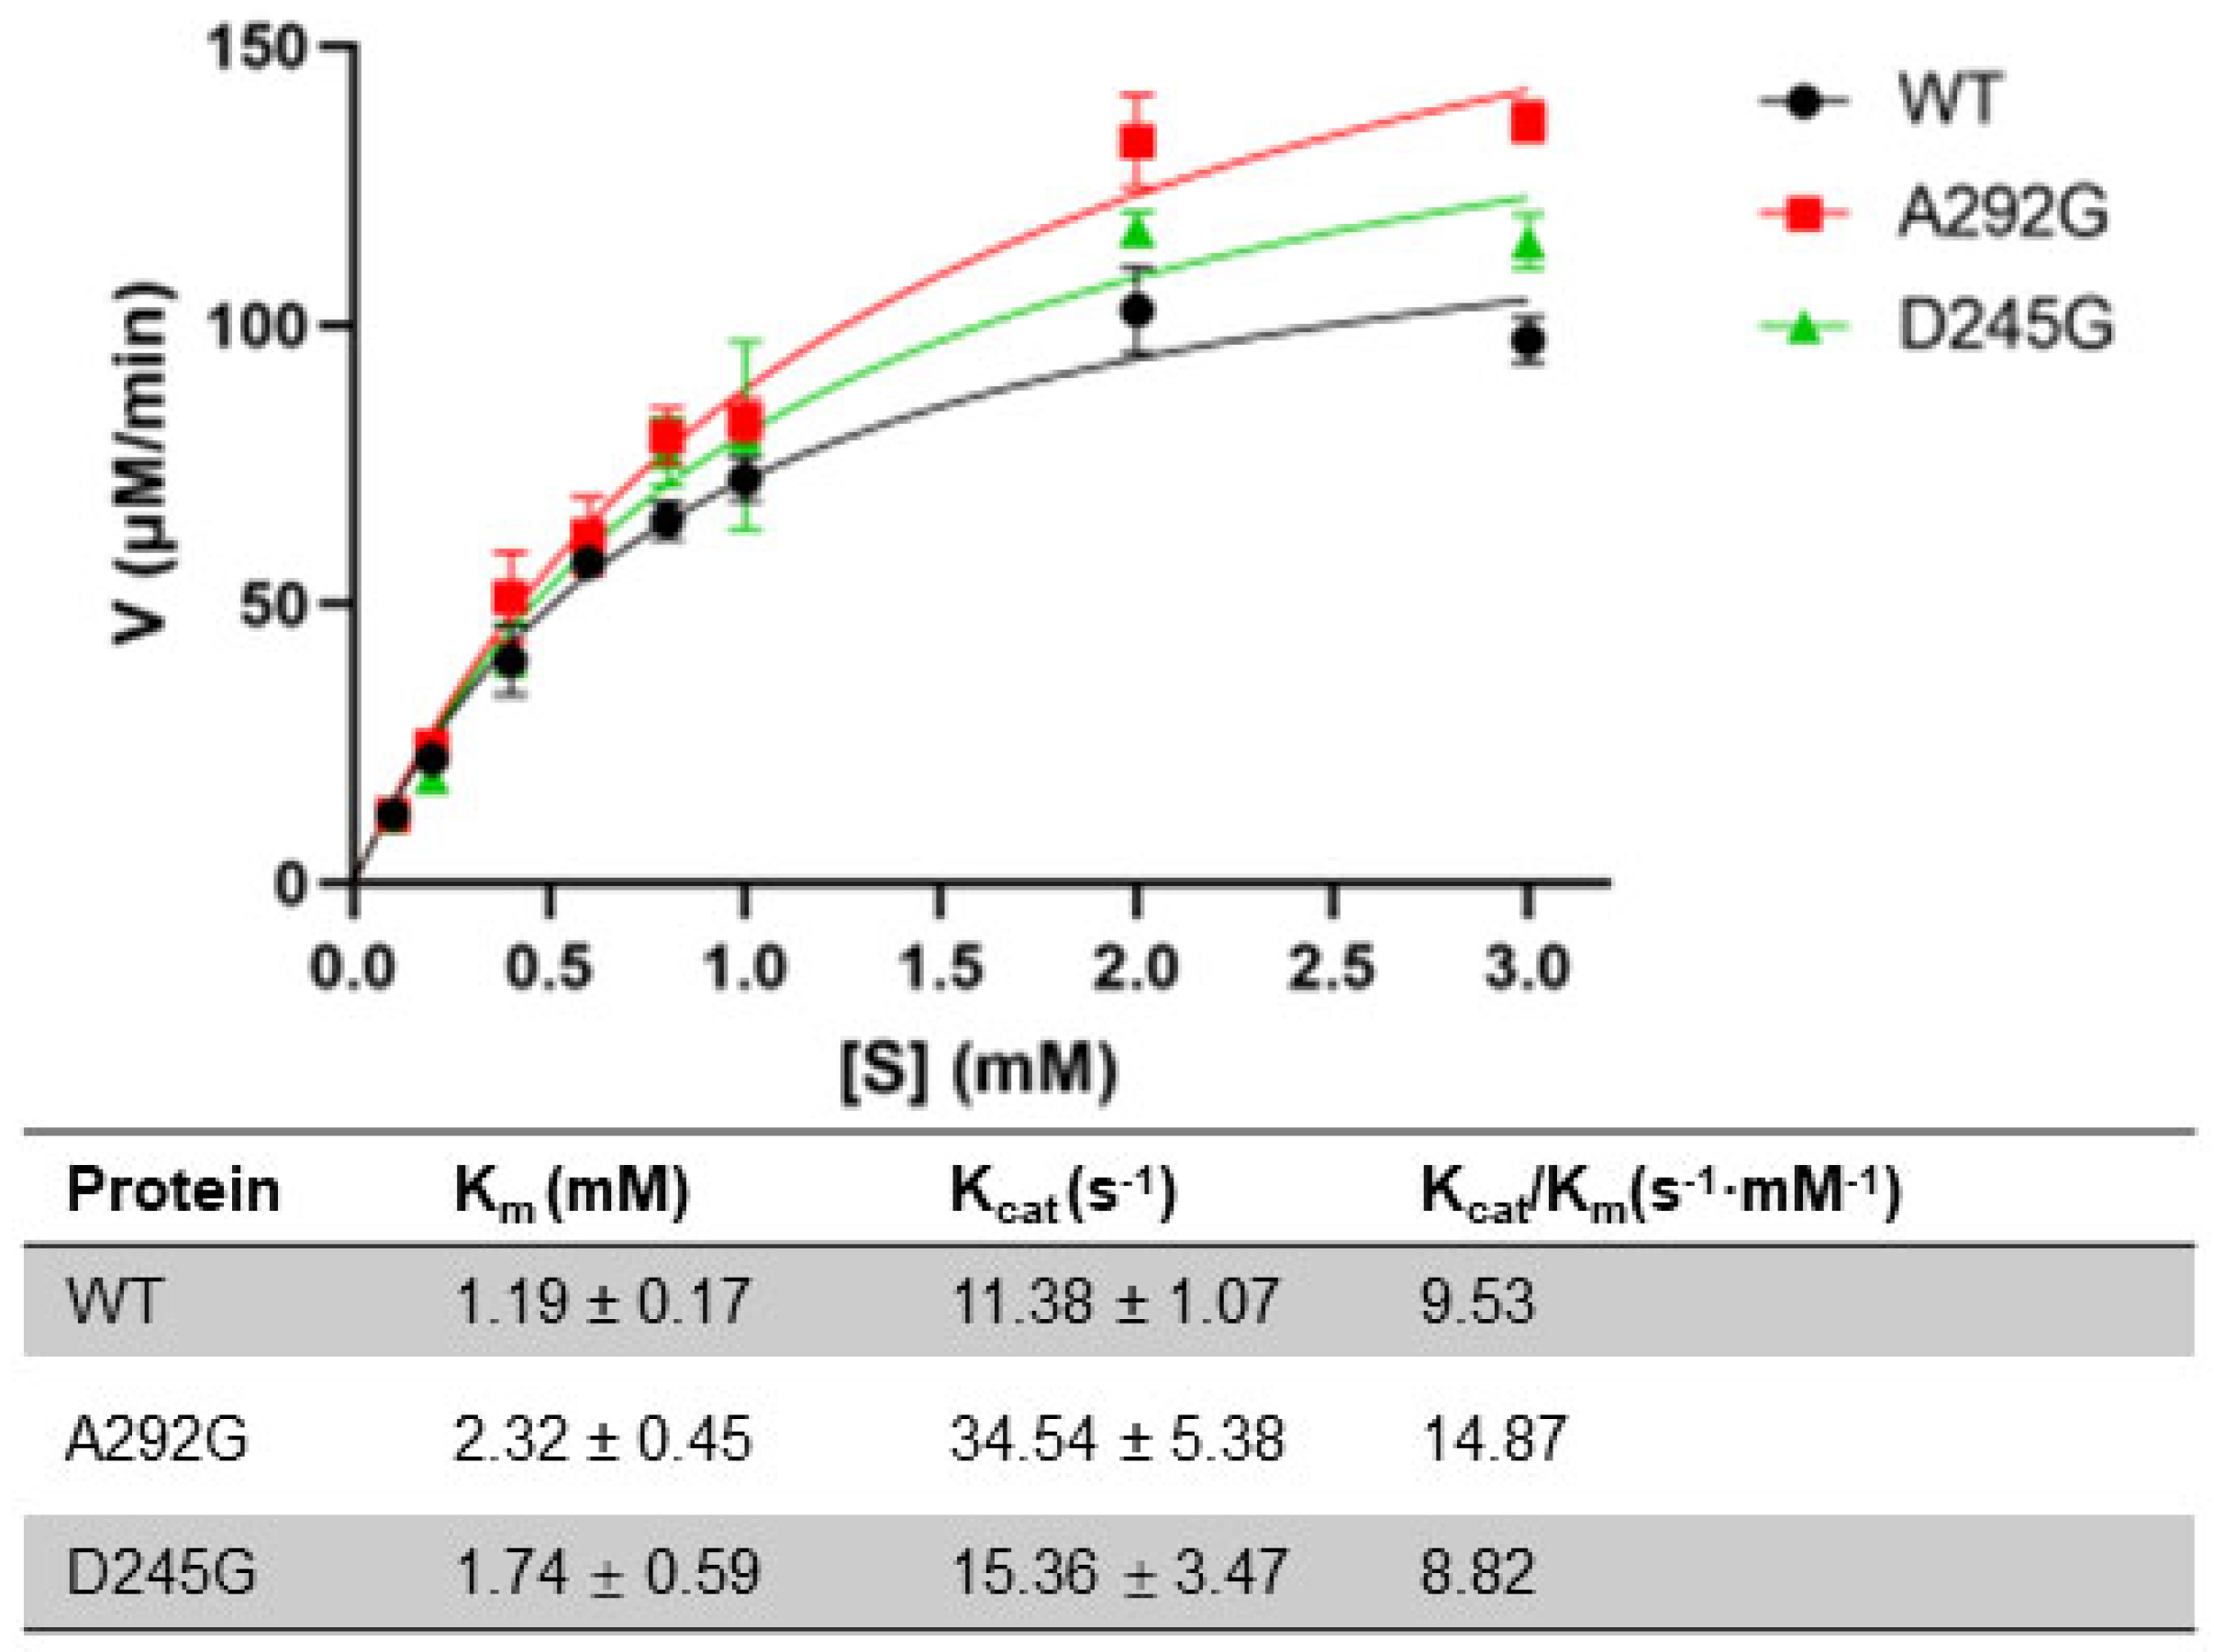
2.3. Enzyme Kinetics of the WT and Mutants

D245G had a slight increase in catalytic activity toward DAG. However, it showed a lower enzymatic activity using 4-nitrophenol caprylate as the substrate. In comparison, A292G showed improved enzymatic activity toward both substrates. The kinetic parameters of the SMG1 WT, D245G, and A292G were determined using 4-nitrophenol caprylate as the substrate. The Km values of D245G and A292G increased to 1.74 and 2.32 mM, respectively, suggesting lower affinities of both mutants against 4-nitrophenol caprylate compared with the WT (Km = 1.19 mM) (Figure 4). For A292G, since the side chain (methyl) of alanine is hydrophobic, it might interact with the acryl chain of the substrate. Substitution by glycine may abolish this stabilization effect, resulting in lower affinity to the substrate. The catalytic rate constants Kcat of A292G, D245G, and the WT were 34.54 s−1, 15.36 S−1 and 11.38 s−1, respectively, indicating that the catalytic rate of A292G was much faster compared with D245G and the WT. In combination, the specificity constant (Kcat/Km) of A292G was ~60% higher than the WT (14.87 s−1 mM−1 and 9.53 s−1 mM−1) with 4-nitrophenol caprylate as the substrate. The specificity constant of D245G was slightly lower compared with that of the WT (Figure 4).

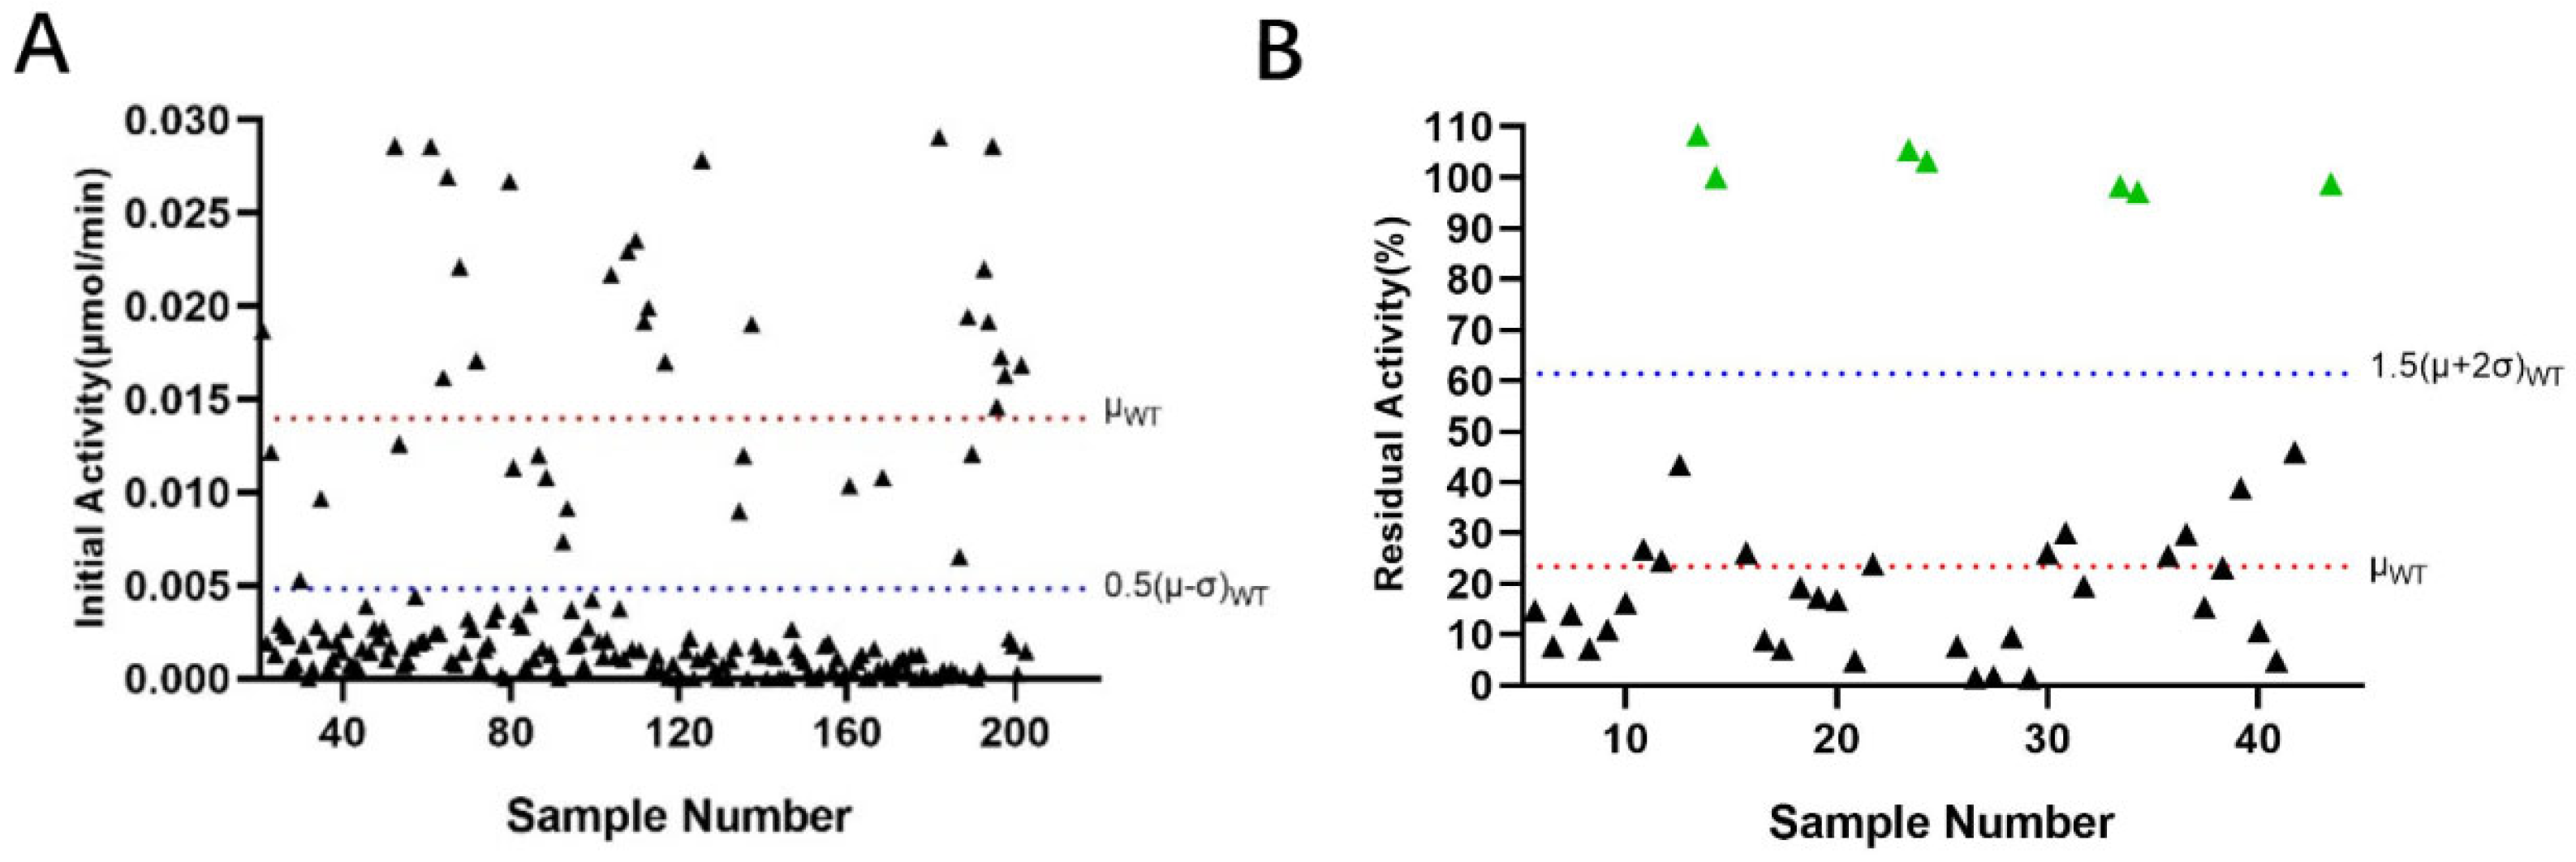
2.4. Site-Directed Saturation Library Analysis

A292G dramatically improved the thermostability of SMG1. A site-saturation mutagenesis library was generated and screened to test whether mutation of A292 resulted in other mutants with higher stability. Nearly 200 colonies were screened for thermostability-enhanced mutants to cover all theoretically possible variants. The screening process consisted of two steps: (1) initial enzymatic activity (Figure 5A) and (2) residual activity (Figure 5B), as described in the method section. The initial activity refers to the enzymatic activity without pre-exposure to heat treatment. Only mutants with an initial activity higher than 0.5(μ − σ)WT were selected for measurement of the residual activity after the heat treatment. The second step measured the residual activity after a 15 min incubation at 45 °C. The μWT and σWT refer to the average and standard error of the WT samples’ initial and residual activities in different experiments, respectively. In total, clones with residual activities above 1.5(μ + 2σ)WT in step two were sequenced, and all were shown to be A292G mutants. This result suggested that the thermostability of mutants at residue 292 was only improved when it was mutated to glycine.

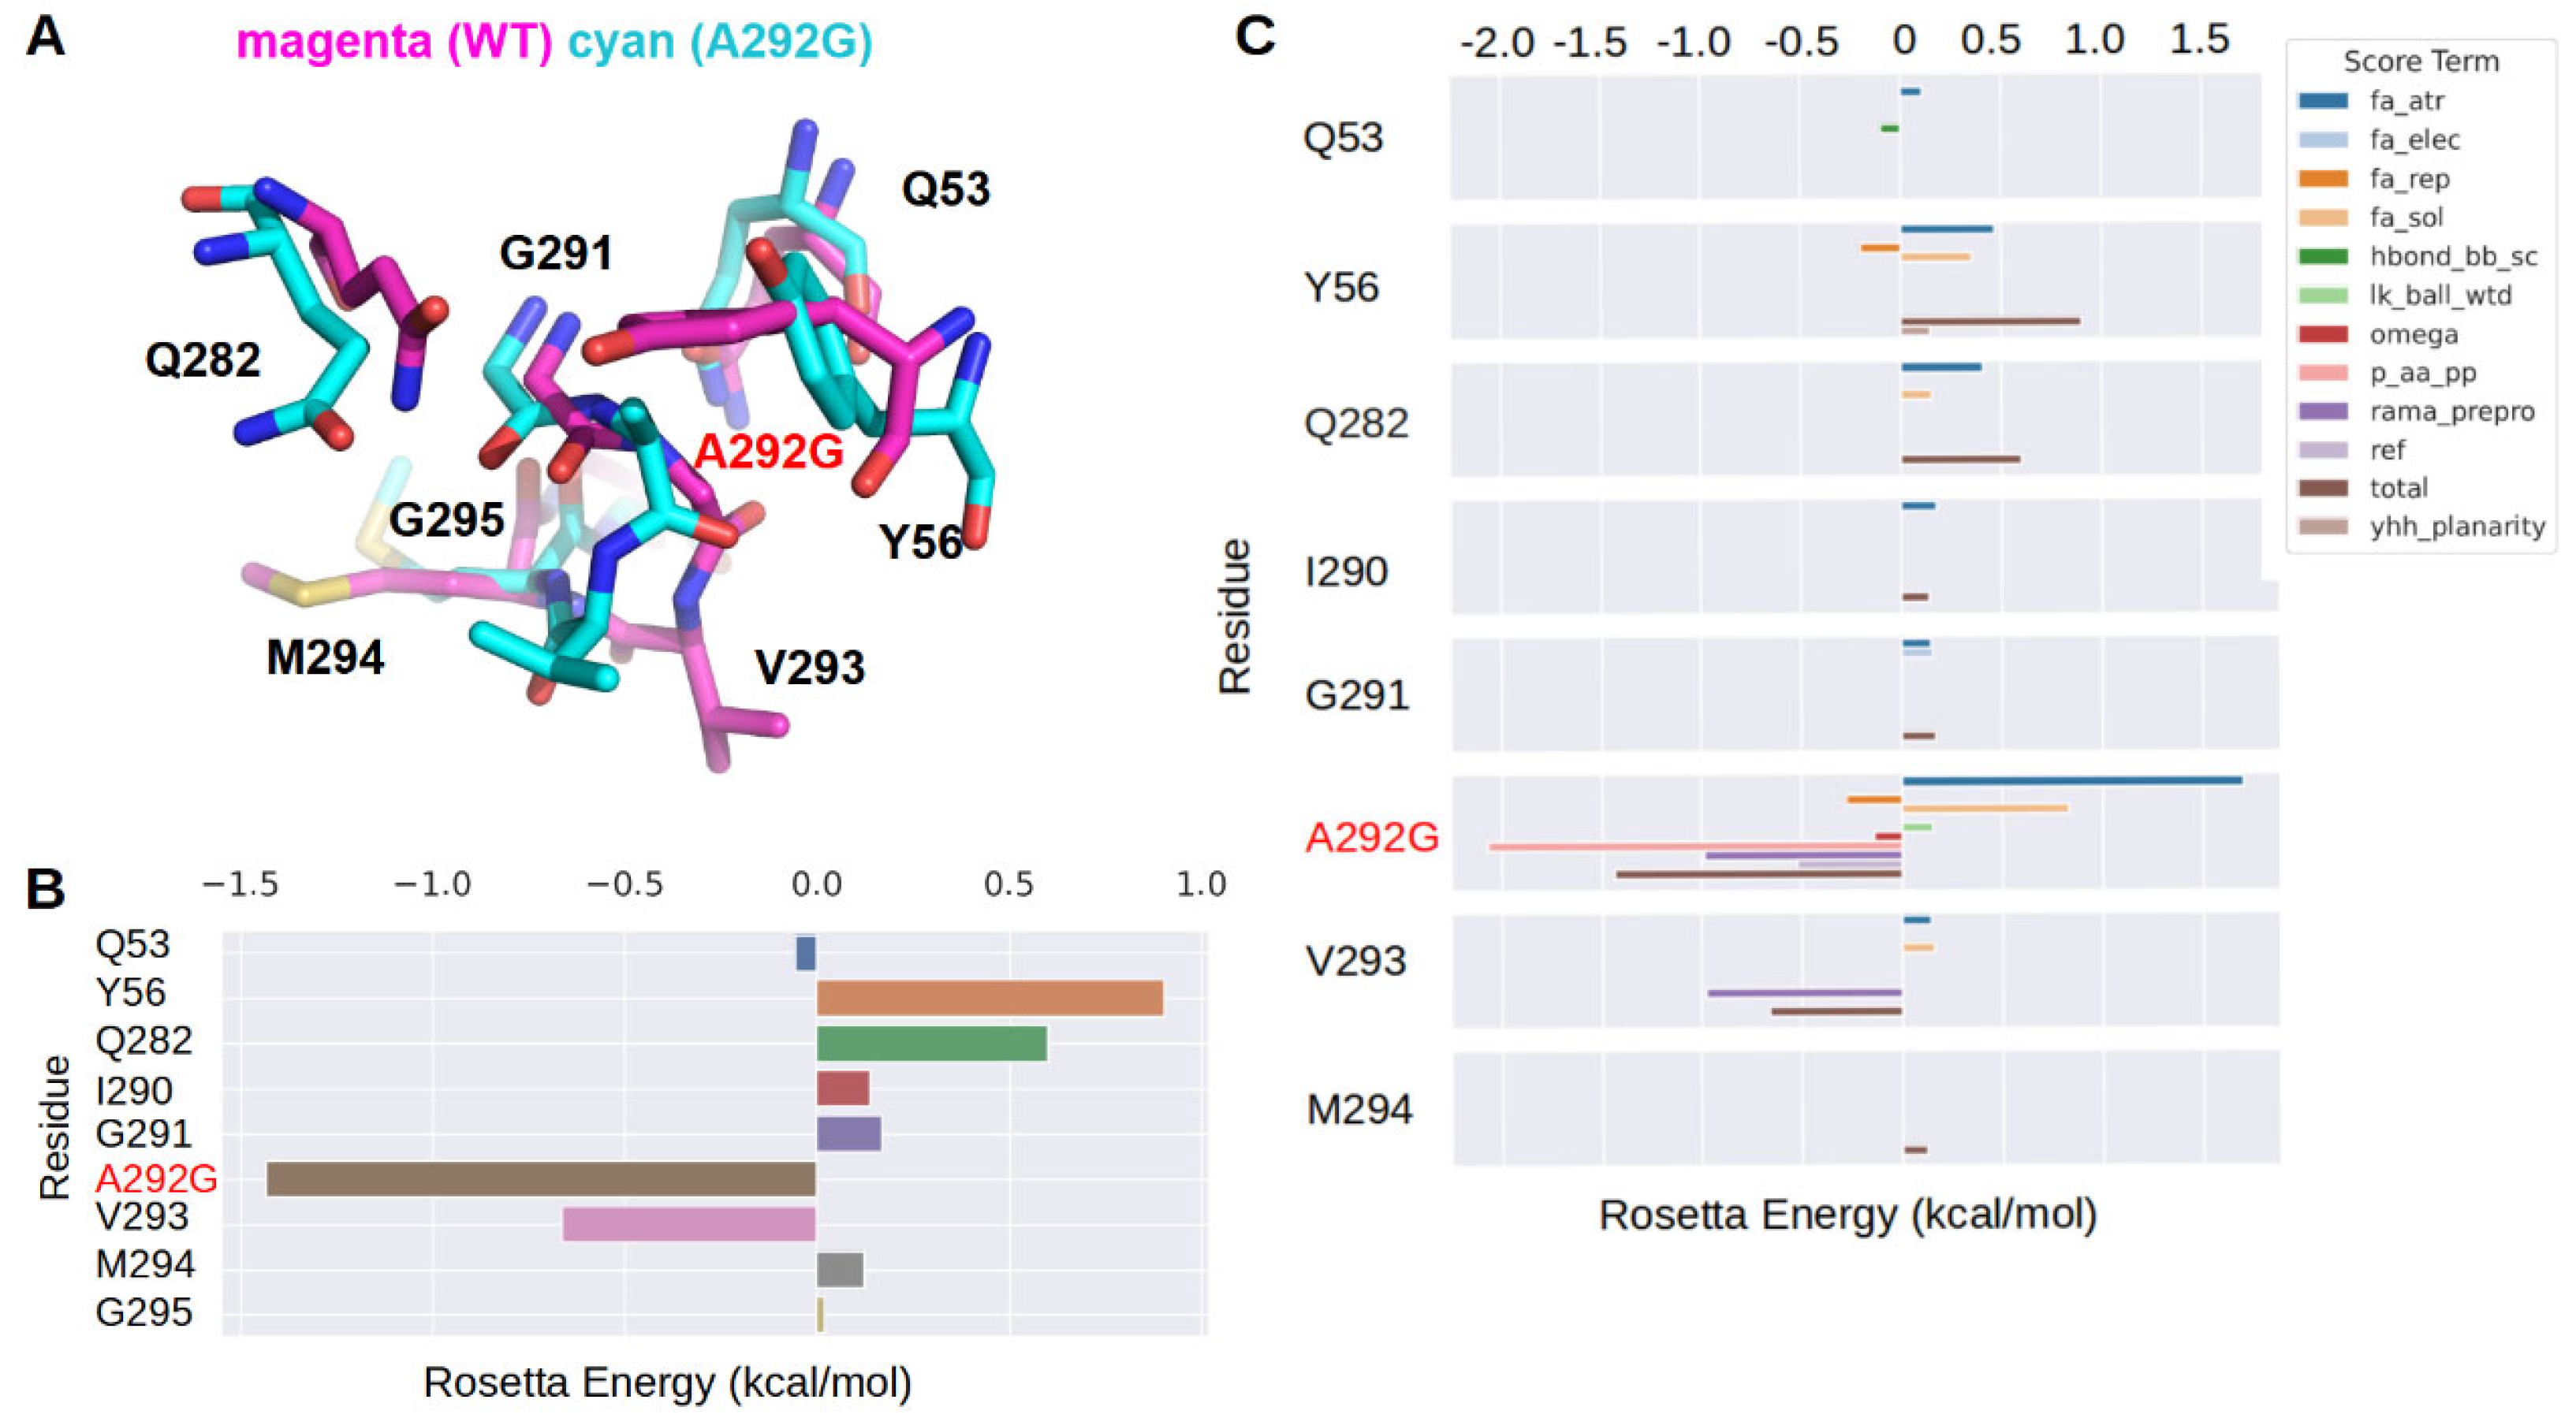
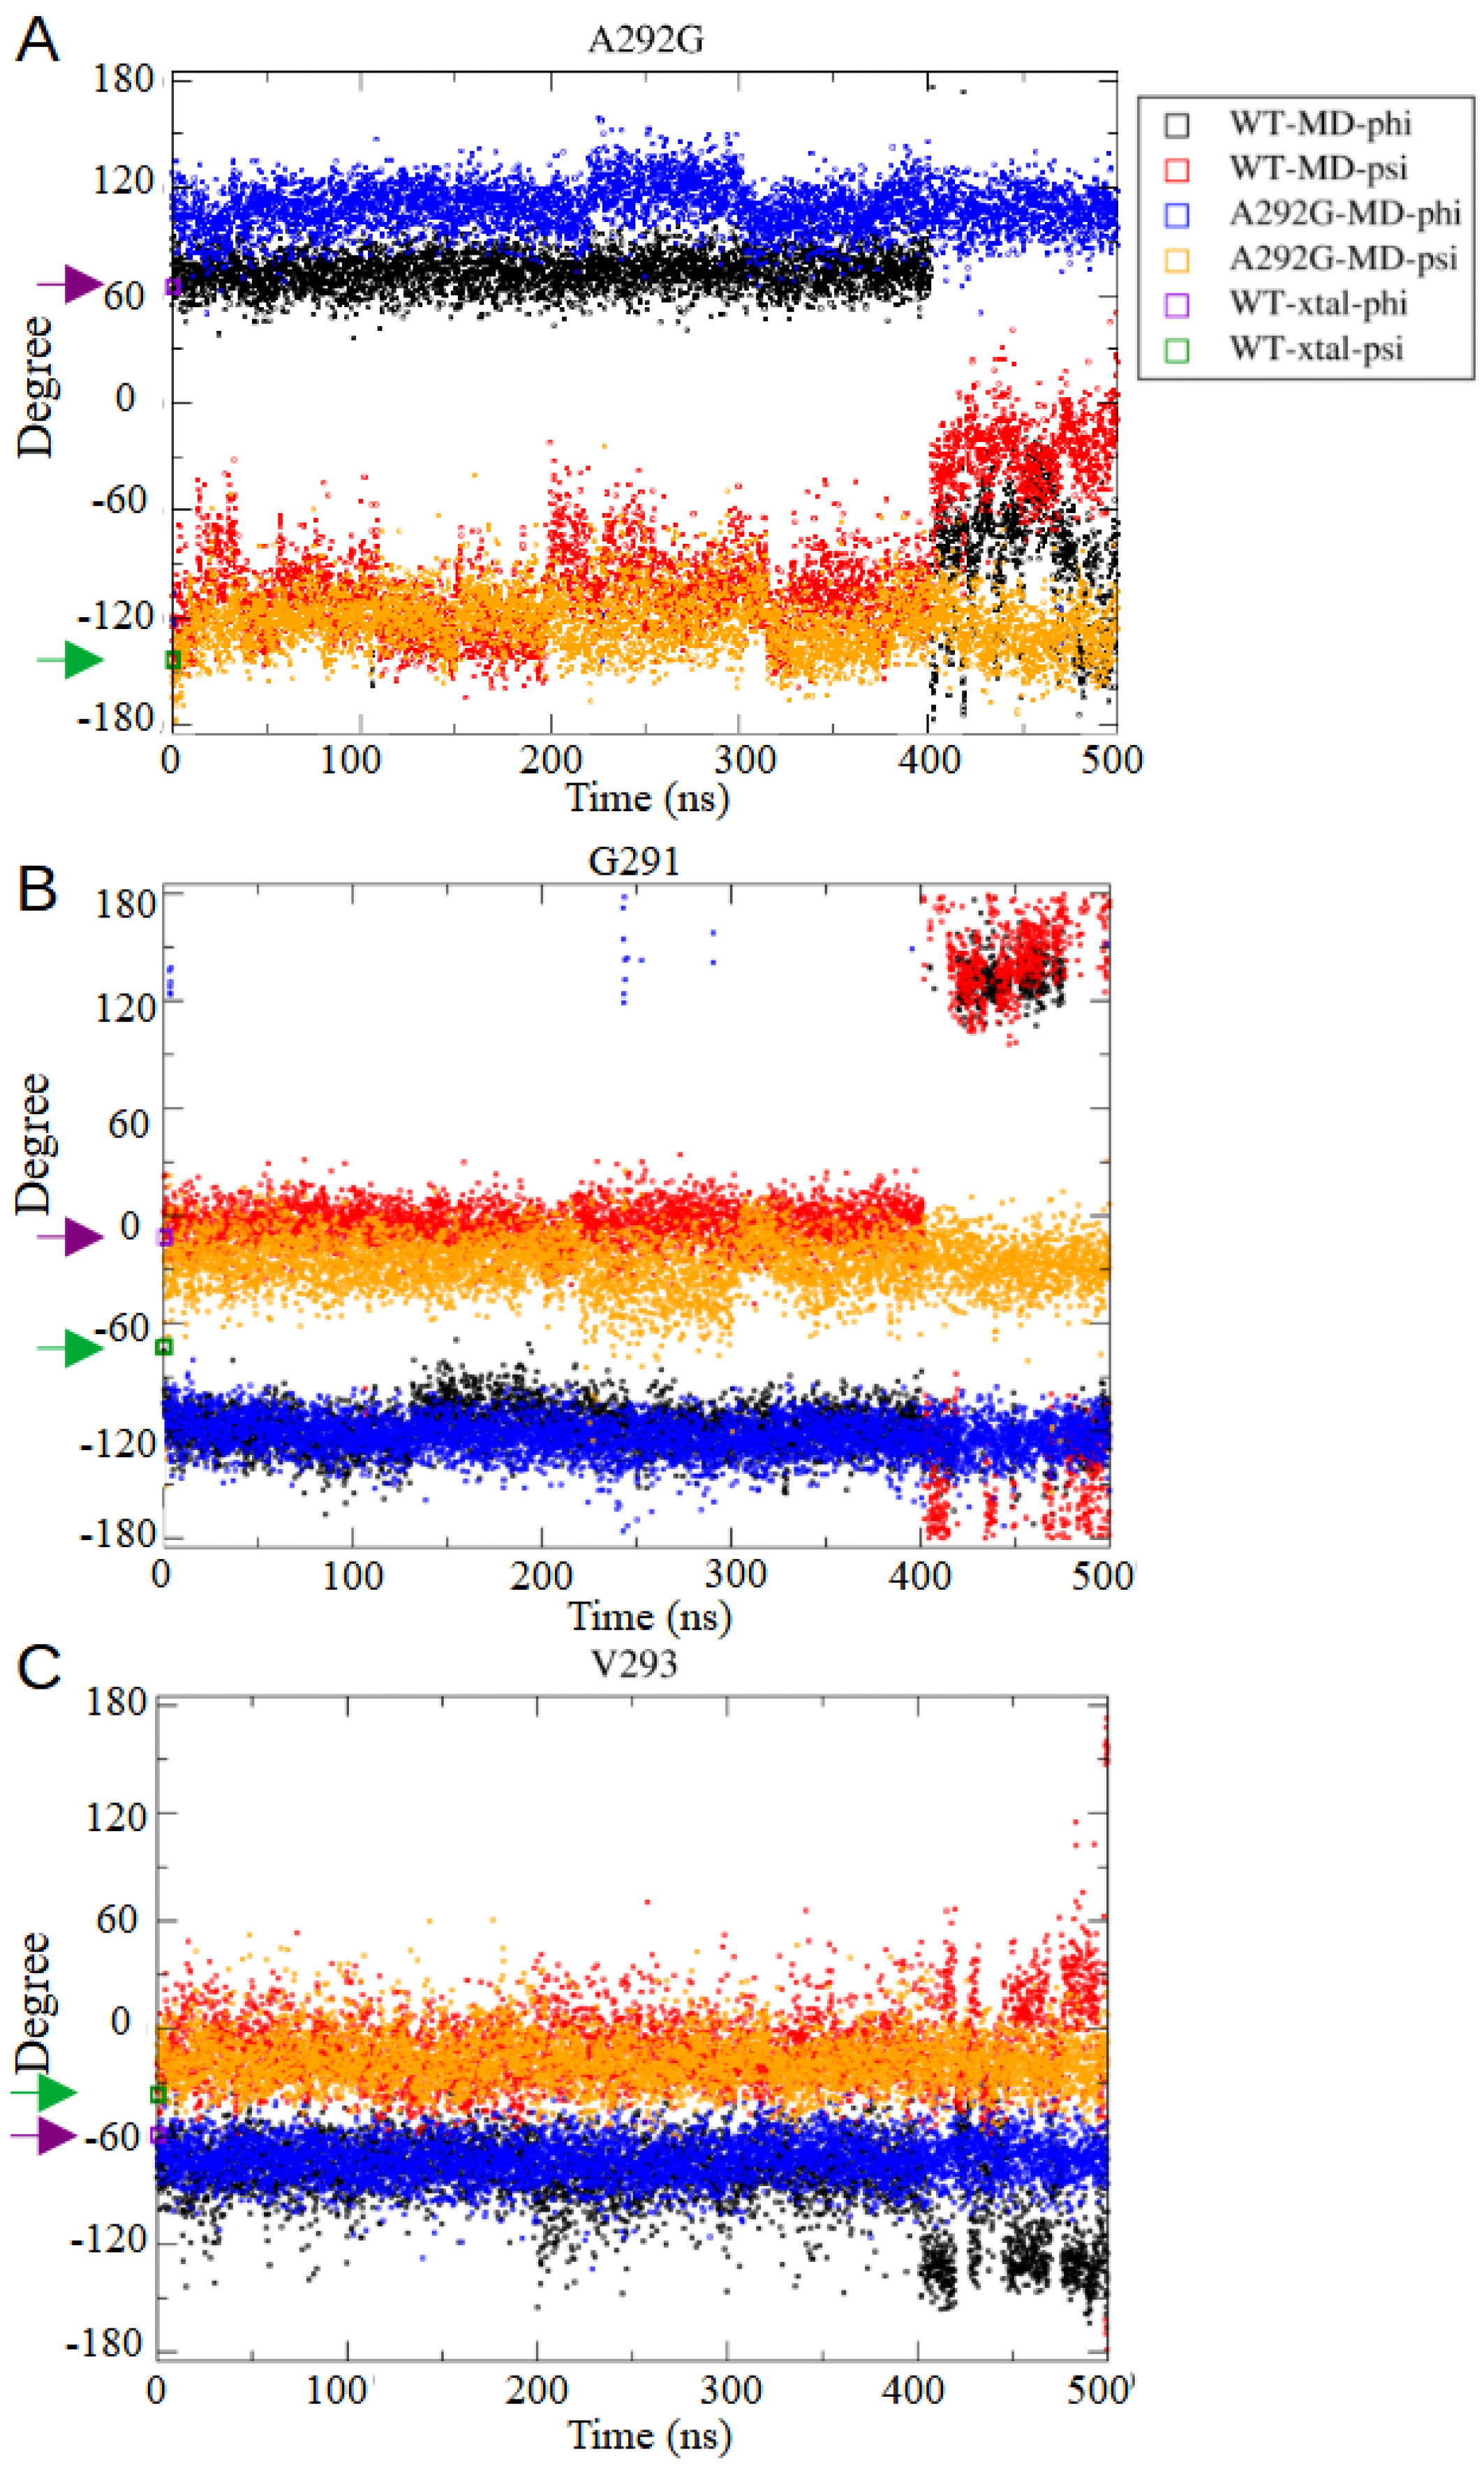
2.5. Molecular Mechanism for Thermostability Enhancement

In this study, both A292G and D245G simultaneously improved the thermostability and enzymatic activity, and these two mutants were mutated to glycine. Interestingly, A292 was located in a generously allowed region in the Ramachandran plot, whereas D245 was in a disallowed region (Figure 6). Since glycine is more flexible regarding adopting backbone torsion angles than other amino acids, glycine substitution may improve thermostability by releasing steric strains due to unfavored dihedral angles [20]. In Rosetta, two knowledge-based potentials were used to quantify the backbone torsion angle energy, including the rama_prepro and p_aa_pp. The rama_prepro is based on the probability of backbone angles ϕ/φ given the specific amino acid type, whereas p_aa_pp indicates the probability of amino acid identity given the backbone angles ϕ/φ [21].
As expected, for D245G, the energetic contribution decomposition of the Rosetta ∆∆G showed favorable changes in the rama_prepro score (−8.406 kcal/mol) and p_aa_pp score (−1.723 kcal/mol). In the WT, D245 directly interacted with F220, S244, Y246, Y260, P261, and G262. D245 potentially formed two hydrogen bonds with G262 (OD1 of D245 with N of G262, and N of D245 with O of G262) (Figure 7A). The energy change profiles of D245G were further analyzed for the above residues (Figure 7B,C). The result highlighted that G262 underwent unfavored energy changes, mainly due to the hydrogen bond loss with the side chain of residue 245. In contrast, the adjacent 244 and 246 had significant energy improvements, as suggested by Rosetta ddg_monomer, with Y246 in the D245G mutant having a remarkably improved rama_prepro term (Figure 7B,C). This result suggested that residue 246 might take a more common backbone angles ϕ/φ for tyrosine in the mutant.
To investigate the potential structural change in D245G, an MD simulation was conducted at 300 K for 500 ns. The trajectory became stable after 150 ns of simulation (Figure S3). No major structural change was observed between the WT and D245G. To probe the local conformational changes around residue 245, dihedral angles were monitored throughout the MD simulation and compared between the WT and the mutant (Figure 8). The result confirmed local conformational changes for residues 245 and 244, but limited changes for Y246 (Figure 7A and Figure 8). In the WT, phi–psi angles of D245 were similar to those in the crystal structure and remained stable during the simulation, whereas in D245G, those of G245 fluctuated and were mainly distributed in a different range (Figure 8A). Concomitantly, dihedral angles of S244 significantly changed (Figure 7A and Figure 8B). In summary, the D245G mutant released residue 245 from unfavored dihedral angles, as shown by the different dihedral angles for residue 245 between the WT and the mutant.
For the mutant A292G, decomposition of the Rosetta ∆∆G to individual energy terms also showed favorable changes in the rama_prepro score (−2.111 kcal/mol) and p_aa_pp score (−2.033 kcal/mol). Backbone atoms of A292 formed hydrogen bonds with Q53 and G295 (N of A292 with OE1 of Q53, O of A292 with N of G295 and/or NE2 of Q53) in the WT (Figure 9A). Based on the MD simulation, these interactions were preserved for G292 in the A292G mutant. In contrast, the side chain (Cβ) of A292 in the WT formed hydrophobic interactions with side chains of Y56 and Q282, and these interactions were lost in the A292G mutant (Figure 9A). In the WT, these interactions presumably forced A292 to adopt the unusual dihedral angles observed in the structure (PDB code 3UUE, 3UUF). To probe the impact of A292G on local environments, energy changes were analyzed for residues interacting with 292, including Q53, Y56, Q282, G295, I290, G291, V293, and M294 (Figure 9B,C). The results showed that residues 292 and 293 both had favorable energy changes. In contrast, residues 56 and 282 possessed unfavored changes, mainly due to the reduction in attraction forces that were initially maintained by the side chain of A292 in the WT. In the Rosetta ddg_monomer estimation, V293 had a beneficial energy change owing to an improved rama_prepro term, probably due to the flexibility introduced by G292 to release steric strain.
To investigate the potential structure change of A292G, an MD simulation was conducted at 300 K for 500 ns. The trajectory became stable after 100 ns (Figure S3). No major structural change was observed between the WT and A292G. To probe the local conformational changes, dihedral angles were monitored around residue 292 and compared between the WT and A292G. Indeed, residue 292 in A292G adopted significantly different dihedral angles (especially for phi) compared with the WT (Figure 10A). Residue 291 in the A292G mutant showed a slight difference in dihedral angles, especially for psi compared with the WT (Figure 10B). In contrast, dihedral angles of residue 293 were similar between the WT and A292G (Figure 10C). Interestingly, we also noticed that A292 and G291 in the WT had a conformational change at approximately 400 ns (Figure 10 and Figure S4). In the WT, this allowed for A292 to adopt a more favorable dihedral angle (Figure 10A). However, this conformation might be less energetically favored as it was not observed in either crystal structure (PDB code 3UUE, 3UUF). In summary, the absence of Cβ in residue 292 released it from unfavored dihedral angles (Figure 9A).

3. Discussion

Single mutations with significant ∆∆G changes are highly desirable in protein engineering. Recent developments in the field increased the awareness that limited mutations can yield a significant increase in stability. In general, an arbitrary cutoff of the calculated Rosetta ∆∆G (e.g., <−0.5 REU) was used to filter potential mutants for protein stability improvement. In this study, we intentionally biased the selection of mutations with a large favorable predicted ∆∆G for the experiment and found one mutation, namely, A292G, with a ~7 °C increase in T5015. Compared with directed evolution, the rational structure-guided design effectively reduced the workload. The major challenges of these methods are predicting mutation sites and optimal amino acid substitutions.
One limitation of this study was that we used the Hotspot Wizard 3.0 server to identify hotspots based on either functional hotspot or sequence consensus strategies [16,22]. In a further study, other methods can be explored to identify single mutations with significant stability changes. The Hotspot Wizard 3.0 server also provides other selection methods, such as correlated mutations and structural flexibility [22]. In addition, other methods such as constraint network analysis [23,24] can be used to identify weak spots for protein engineering. Optimal amino acid substitution relies on precise modeling of the influence of mutations in a protein. It must recapitulate both the structural change associated with a mutation and the free energy change of the folded protein. The current Hotspot Wizard 3.0 used Rosetta ddg_monomer (protocol 3) to predict the ∆∆G due to a mutation [14,16]. Rosetta ddg_monomer uses an energy function that considers both interaction energy terms (hydrogen bonds and electrostatic interactions) and knowledge-based statistical potentials (such as rama_prepro and side-chain torsion angle). In this study, three out of seven tested mutations showed an improvement in thermostability. These findings suggested that there was still much room for improvement to accurately predict ∆∆G due to mutations. The current Rosetta ddg_monomer protocol has a range of accuracy of 0.5–0.6 for the classification of mutations (destabilizing, neutral, or stabilizing), depending on which protocols are used [25]. A recent study also suggested a lack of significant correlation between the predicted energies by nine well-known algorithms [19]. Interestingly, data-driven approaches, such as machine-learning-based methods, showed significantly improved accuracy regarding ∆∆G prediction [26]. Further development of the server could integrate machine-learning methods into ∆∆G prediction.
The key finding in this study was that glycine substitution in residues with suboptimal or unfavored torsion angles can improve protein thermostability. It is typically expected that a mutation of glycine to alanine or other amino acids improves protein stability [27]. In contrast, similar to our findings, some studies also found that mutations to glycine improved protein thermostability [20,28,29]. One of these studies showed that the substitution of residues with unusual dihedral angles by glycine in staphylococcal nuclease could increase stability in some cases [20]. Another study showed that unfavored steric strains were alleviated by a mutation to glycine in the left-handed helices, contributing to enhanced stability [28]. One recent discovery showed that the removal of the side chain at the catalytic serine via glycine substitutions increased the stability of a wide range of serine β-lactamases by releasing steric strains [29]. It is worth noting that the nucleophilic ser171 of SMG1 was also found in a disallowed region in the Ramachandran plot, suggesting substitution of this residue by glycine might also increase the stability of SMG1 (Figure 6). The cases mentioned above and the results of this study together verify glycine substitution as a potential method to improve protein stability.
In this study, both A292G and D245G showed improved enzymatic activity in hydrolyzing DAG compared with WT SMG1. This observation is similar to the finding that a double mutation L270P-D245N of SMG1 has improved stability and catalytic activity. This again highlighted that enhancing thermostability does not necessarily come with a cost in enzymatic activity. Guo et al. showed that F278N and F278T variants of SMG1 led to an at least sixfold increase in the hydrolytic activity toward diacylglycerols via additional substrate stabilization [8]. A single mutation, V269D, in another DAG lipase Aspergillus oryzae lipase (AOL) was recently reported to improve hydrolytic activity without sacrificing thermostability [30]. Molecular dynamics simulations suggest potential stronger interactions of V269D with a DAG substrate with higher affinity. In contrast, the binding affinity of SMG1 A292G to 4-nitrophenol caprylate decreased, and the improved activity was due to a higher turnover rate. Therefore, the improved enzymatic activity of A292G might have been due to different mechanisms, such as a more favored conformation of the catalytic pocket to catalyze the enzymatic reaction [31].

4. Materials and Methods

4.1. In Silico Screening of Thermostable Mutations

The closed state of SMG1 lipase (PDB code 3UUF) was submitted to the Hotspot Wizard 3.0 server (https://loschmidt.chemi.muni.cz/hotspotwizard/, accessed 15 August 2021) server to find hotspots for thermostability enhancement and undertake calculations of ∆∆G. Two strategies, namely, functional hotspots and sequence consensus, were used to identify hotspots for protein engineering.

4.2. Protein Expression and Purification

The SMG1 lipase gene (residues 26-304, UniProtKB A8PUY1) was cloned into pCold-MBP vector as previously described [6]. Site-directed mutagenesis was performed using full-plasmid PCR with appropriate primers (Table S3). The amplified product mixture was pretreated using Dpn1 (NEB) to digest the template and further purified using the PCR product purification kit (OMEGA). The sequence was confirmed via sequencing of a single clone (GENEWIZ). A plasmid with the correct sequence was then transformed into Rosetta-gamiB-(DE3)-competent cells.
Protein expression was induced via the addition of IPTG to reach a final concentration of 1 mM and cultured at 16 °C for 20 h with constant shaking at 200 rpm. The culture was harvested via centrifugation (4 °C, 10,000 rpm, 10 min) and the pellet was resuspended with a 10 mL binding buffer (20 mM sodium phosphate, 0.5 M NaCl, pH 7.4) for 1 g of cells. The cells were lysed via sonication on ice, and supernatants containing the target protein were collected. The protein was then purified using a HisTrapTM FF crude column (Cytiva, Marlborough, MA, USA). SDS-PAGE was used to verify the purity of the target proteins. Purified proteins were concentrated and the buffer was changed to a 20 mM sodium phosphate buffer (pH 7.0) using Vivaspin (Cytiva, Marlborough, MA, USA). Protein concentration was determined using Nanodrop (Thermo Scientific, Waltham, MA, USA).
We used a tag-free SMG1 protein for the thermal shift assay. To prepare tag-free SMG1, the SMG1 gene (either the WT or mutants) was re-cloned by inserting a tobacco etch virus (TEV) protease cleavage site between MBP and SMG1. The protein was then purified as described above and the purified MBP-TEV-SMG1 was subjected to cleavage using TEV proteases (Beyotime, Shanghai, China). For one unit of enzyme, 3.4 μg of proteins were cleaved. The reaction mixture was assembled as follows: 100 μL of 10 × TEV buffer, 160 μg of protein, 50 units of TEV protease, and topped up to 1 mL with MilliQ water. The reaction mixture was incubated at 4 °C overnight and then purified. The digested protein was purified using high-affinity Ni-NTA resins (Genscript, Piscataway, NJ, USA) in a gravity column to remove the His-tag MBP and TEV protease. The purity of the tag-free SMG1 protein was validated using SDS-PAGE (Figure S1).

4.3. Crude Lysate Preparation

The WT and mutant plasmids of SMG1 lipase were transformed into Rosetta-gamiB-(DE3)-competent bacteria and cultured overnight at 37 °C. Single colonies of the WT or mutant were placed into 96-well plates that contained 100 μL LB medium with ampicillin and kanamycin. The plates were then shaken overnight at 200 rpm at 37 °C. The next day, 10 μL of the overnight culture were diluted into 600 μL fresh LB medium with ampicillin and kanamycin and cultured with constant shaking at 37 °C until the OD600 value reached 0.6–0.7. At this time, the 96 deep-well plates were cooled on ice for 20 min, and IPTG was added to a final concentration of 0.2 mM for protein expression at 15 °C and 200 rpm for 20 h. The culture was then spun at 4 °C and 4300 RCF for 30 min with the pellet collected. A total of 40 μL of B-per solution (Thermo Scientific, Waltham, MA, USA) supplemented with lysozyme (0.1 μg/μL), and DNAse I (0.01 U/μL) was added to each pellet, incubated at room temperature for 15 min, and then centrifuged at 4 °C for 30 min. The supernatant was the crude enzyme fraction.

4.4. Determination of T5015 Using 4-Nitrophenyl Caprylate

T5015 refers to the temperature at which the enzyme activity drops to 50% of its initial after an incubation time of 15 min. Enzymatic activity of the protein was quantified by measuring the residual activity of the enzyme after incubation at different temperatures for 15 min. Hydrolysis of 4-nitrophenyl caprylate using SMG1 lipase was monitored at 405 nm, as p-nitrophenol showed absorbance. Either crude lysate or purified protein was used for this experiment. Then, 10 μL of the enzyme (either crude or purified), which was diluted with 20 mM sodium phosphate (pH 7.0), was mixed with 10 μL of 50 mM substrate (Alfa Aesar, Haverhill, MA, USA) and 80 μL of reaction buffer (20 mM sodium phosphate at pH 7.0). The negative control contained 90 μL of reaction buffer and 10 μL of the substrate. The reaction mixture was incubated at 24 °C for 5 min before 100 μL isopropanol was added to terminate the reaction, and the OD405 value was determined. The measurement gave the initial activity of the WT or mutants. To quantify the thermostability, the enzyme was incubated at different temperatures for 15 min, and the enzymatic activity was quantified as before. The purified protein used in this experiment had a concentration of approximately 0.1–0.2 mg/mL. One enzymatic unit of the enzyme was defined as the amount of enzymes required to produce 1 μmol of p-nitrophenol per minute.
The enzymatic activity was also quantified by monitoring the production of fatty acids via a hydrolytic reaction using a titration experiment. Substrates were prepared by emulsifying oils containing diacylglycerol with 4% polyvinyl alcohol-124 at a volume ratio of 1:3. The lipase was diluted to 0.01–0.03 mg/mL with a reaction buffer (20 mM sodium phosphate, pH 6.0). The reaction mixture was assembled with 4 mL of the emulsified oils, 1 mL of the diluted enzyme, and 5 mL of the reaction buffer. The reaction was carried out for 10 min before 10 mL of ethanol was added to terminate the reaction. Then, 90 μL of 1% phenolphthalein was added to monitor the pH change. The mixture was then immediately titrated with 50 mM sodium hydroxide. The negative control left out the enzyme, and the volume was supplemented with extra buffer. The released fatty acids at the end of the reaction were measured by recording the consumption of sodium hydroxide once the solution turned reddish and the color was maintained without fading with active mixing. The enzymatic unit was defined as the amounts of enzymes required to produce 1 μmol of fatty acids per minute.

4.5. The Half-Life and Optimal Reaction Temperature of the SMG1 WT and Mutants

Oil containing diacylglycerol was used as the substrate to determine the half-life of SMG1 lipase at 45 °C. The enzyme was incubated at 45 °C, and samples were retrieved at specific time points and placed on ice. The reaction mixture was then assembled as described above, and the reaction was carried out at 24 °C for 10 min. The enzymatic activity was then measured via titration of sodium hydroxide to quantify the production of fatty acids. The residual activity was calculated using the enzymatic activity of either the SMG1 WT or mutants without the 45 °C exposure as 100% accordingly. The one-phase decay non-linear regression model was used to determine the half-life of the enzyme in GraphPad Prism v6.0 (GraphPad Software Inc., La Jolla, CA, USA).
To determine the optimal reaction temperature, 4 mL emulsified oils and 5 mL reaction buffer were mixed and preincubated to reach specific temperatures. Then, 1 mL of enzymes was added to the mixture and allowed to react for 10 min. The reaction was stopped via the addition of 10 mL ethanol. The amount of fatty acids produced was measured via the titration of sodium hydroxide. For each reaction, 90 μL 1% phenolphthalein was added to monitor the pH change of the mixture. The reaction temperature at which the enzyme showed the maximum enzyme activity was defined as the optimal reaction temperature. All the above experiments were done in triplicate.

4.6. Determination of Melting Temperature from the Thermal Shift Assay

Thermal shift assays were performed as described using the QuantStudio 5 Real-Time PCR System™ and QuantStudio™ software (Applied Biosystems, Waltham, MA, USA). The protein was diluted to 0.4 mg/mL using a 20 mM sodium phosphate buffer (pH 7.0). The SYPRO™ Orange Protein Gel Stain 5000 X (Thermo Scientific, Waltham, MA, USA) was diluted at 1:100 using pre-cooled 20 mM sodium phosphate buffer (pH 7.0). The protein and dye were mixed in a 1-to-4 volume ratio. A volume of 20 μL sample was added to the PCR tubes. A continuous temperature increase from 20.0 ℃ to 99.0 ℃ with an increment of 0.3 ℃ per second was implemented. The filter wavelengths were set as 470 ± 16 nm and 586 ± 10 nm for excitation and emission, respectively. The melting temperature (Tm) was identified by plotting the first derivative of the fluorescence emission as a function of temperature (−dF/dT). In these plots, Tm is represented by the lowest part of the curve. The experiment was repeated four times and the reported results are the averages of the four experiments.

4.7. Enzyme Kinetic Measurement

The kinetic constants were determined using the spectrophotometric method at 24 °C in a 20 mM sodium phosphate buffer with pH 7.0 as described before [30]. The substrate 4-nitrophenol caprylate was used with concentrations from 1–30 mM. Hydrolysis of the substrate was followed at 405 nm. The Km and maximum enzymatic reaction rate (Vmax) were obtained using the Lineweaver–Burk method. GraphPad Prism 6.0 (GraphPad Software Inc., La Jolla, CA, USA) was used to determine the best-fit values of Vmax and Km. kcat was obtained by dividing Vmax by the enzyme concentration.

4.8. Site-Directed Saturation Mutagenesis and Screening

The 292 site-saturation mutation library of SMG1 lipase was generated using whole plasmid PCR with primers containing degenerate codon NNK at residue 292. The mutant library was screened using a two-step screening approach as described previously [6].

4.9. Protein Preparation for Modeling

The Rosetta ddg_monomer algorithm was used to calculate the change in free energy for a single-point mutant. The crystal structure of SMG1 (PDB code 3UUE) was taken as the input and minimized with constraints generated with a standard protocol. The ∆∆G, which indicates the change in stability caused by a point mutation, was then calculated by the algorithm. For each sequence, 50 models were generated, and the ∆∆G was taken as the difference between the minimal ∆G of the WT structure and the minimal ∆G of the mutant. Negative ∆∆G values indicate increased stability. As the high-resolution protocol has slightly higher accuracy than the low-resolution protocol executed in Hotspot Wizard 3.0, we used it for this calculation. This protocol allows for more extensive backbone conformational optimization than the protocol used in Hotspot Wizard 3.0 server. The ∆∆G was naturally decomposed into individual energy terms in Rosetta. Further, we used the PerResidueEnergies.py python script from Rosetta v2020.03 (downloaded on 3 February 2020) to generate the per-residue Rosetta energy plots for residues that interact with the mutation site [21].

4.10. Molecular Dynamics Simulation

The SMG1 structure was extracted from PDB 3UUE [7] and mutants were prepared using Pymol [32], with rotamers selected based on minimal clashes. The topology and coordinates for complexes were generated using the pdb2gmx module in the GROMACS suite [33] using the OPLA-AA/L all-atom force field [34]. Proteins were placed in a dodecahedron box, with a periodic boundary condition for 1 nm in all dimensions. Systems were solvated with the TIP3P solvent model and also neutralized with an ionic strength of 150 mM. Systems were minimized using a steep descent algorithm to release clashes. The systems were equilibrated under an NVT ensemble at 300 K for 100 ps and a subsequent NPT ensemble at 300 K and 1 atm for 100 ps. Production runs were conducted for 500 ns with a 2 fs step. Bonds involving H were constrained with parallel LINCS methods. Long-range interactions were computed using the particle mesh Ewald summation method. Simulation trajectories were post-processed using the trjconv module. The RMSD and dihedral angles were calculated using the GMX rms and rama modules, respectively.

5. Conclusions

This study focused on a DAG-specific lipase and performed rational engineering based on its reported crystal structure. Using a publicly accessible server, hotspot identification followed by force-field-based in silico screening succeeded in finding thermostable mutants. Two mutations, namely, A292G and D245G, improved both the thermostability and catalytic activity. Structural and computational energy analysis revealed that when either of these residues was mutated to glycine, it could release steric strains caused by previously unfavored or disallowed backbone dihedral angles. Our work contributes to understanding the mechanisms of thermostability enhancement and suggests an innovative strategy for protein engineering.

Supplementary Materials

The following supporting information can be downloaded from https://www.mdpi.com/article/10.3390/catal12080898/s1. Table S1. Functional hotspots and calculated ∆∆G (kcal/mol) of mutations using the Hotspot Wizard server 3.0. Table S2. Hotspots identified via a sequence consensus strategy and the calculated ∆∆G (kcal/mol) values of mutations using the Hotspot Wizard server 3.0. Table S3. Primers for site-directed or site-saturation mutagenesis. Figure S1. MBP-tag-free SMG1 purification. Figure S2. Melt curve plot for the tag-free SMG1 WT and mutants. Figure S3. Backbone RMSD values of the WT and mutants in the 500 ns MD simulations compared with their respective averaged structures derived from the MD simulation. Figure S4. Conformational changes of residues 291-292 in the MD simulation of the WT.

Author Contributions

Conceptualization, Z.L. and J.W.; methodology, Z.L., Q.Z., J.L. and B.Z.; software, Z.L., J.L.; validation, Z.L., Y.-N.X., K.L. and K.C.; formal analysis, Z.L. and J.W.; investigation, Z.L. and J.W.; resources, J.W. and Y.W.; data curation, Z.L., Q.Z., J.L. and B.Z.; writing—original draft preparation, Z.L.; writing—review and editing, Z.L., T.Z., D.L., Y.W. and J.W.; visualization, Z.L. and J.W.; supervision, Y.W. and J.W.; project administration, J.W.; funding acquisition, T.Z., Y.W. and J.W. All authors have read and agreed to the published version of the manuscript.

Funding

This research was supported by the National Natural Science Foundation of China (no. 61902232, 81902059, 32071448); Major Projects of Guangdong Education Department for Foundation Research and Applied Research (no. 2020A1515011170); National Science Fund for Distinguished Young Scholars of China (no. 31725022); 2020 Li Ka Shing Foundation, Hong Kong Cross-Disciplinary Research Grant (no. 2020LKSFG05D); and the Open Fund of Guangdong Provincial Key Laboratory of Infectious Diseases and Molecular Immunopathology (GDKL202212).

Data Availability Statement

The data will be accessible upon request.

Acknowledgments

The authors thank Jianbo Wang and Junqing Wang for their helpful discussion of the manuscript.

Conflicts of Interest

The authors declare no conflict of interest.

References

  1. Chandra, P.; Singh, R.; Arora, P.K. Microbial lipases and their industrial applications: A comprehensive review. Microb. Cell Factories 2020, 19, 1–42. [Google Scholar] [CrossRef] [PubMed]
  2. DeAngelis, Y.M.; Saunders, C.W.; Johnstone, K.R.; Reeder, N.L.; Coleman, C.G.; Kaczvinsky, J.R., Jr.; Gale, C.; Walter, R.; Mekel, M.; Lacey, M.P.; et al. Isolation and expression of a Malassezia globosa lipase gene, LIP1. J. Investig. Dermatol. 2007, 127, 2138–2146. [Google Scholar] [CrossRef] [PubMed]
  3. Wang, W.F.; Li, T.; Ning, Z.X.; Wang, Y.H.; Yang, B.; Yang, X.Q. Production of extremely pure diacylglycerol from soybean oil by lipase-catalyzed glycerolysis. Enzym. Microb. Technol. 2011, 49, 192–196. [Google Scholar] [CrossRef] [PubMed]
  4. Huang, J.J.; Yang, Z.; Guan, F.F.; Zhang, S.S.; Cui, D.; Guan, G.H.; Li, Y. A novel mono- and diacylglycerol lipase highly expressed in Pichia pastoris and its application for food emulsifier preparation. Process Biochem. 2013, 48, 1899–1904. [Google Scholar] [CrossRef]
  5. Li, D.; Faiza, M.; Ali, S.; Wang, W.; Tan, C.P.; Yang, B.; Wang, Y. Highly Efficient Deacidification of High-Acid Rice Bran Oil Using Methanol as a Novel Acyl Acceptor. Appl. Biochem. Biotechnol. 2018, 184, 1061–1072. [Google Scholar] [CrossRef]
  6. Xing, Y.-N.; Tan, J.; Wang, Y.; Wang, J. Enhancing the thermostability of a mono-and diacylglycerol lipase from Malassizia globose by stabilizing a flexible loop in the catalytic pocket. Enzym. Microb. Technol. 2021, 149, 109849. [Google Scholar] [CrossRef]
  7. Xu, T.; Liu, L.; Hou, S.; Xu, J.; Yang, B.; Wang, Y.; Liu, J. Crystal structure of a mono- and diacylglycerol lipase from Malassezia globosa reveals a novel lid conformation and insights into the substrate specificity. J. Struct. Biol. 2012, 178, 363–369. [Google Scholar] [CrossRef]
  8. Guo, S.; Xu, J.; Pavlidis, I.V.; Lan, D.; Bornscheuer, U.T.; Liu, J.; Wang, Y. Structure of product-bound SMG1 lipase: Active site gating implications. FEBS J. 2015, 282, 4538–4547. [Google Scholar] [CrossRef]
  9. Jumper, J.; Evans, R.; Pritzel, A.; Green, T.; Figurnov, M.; Ronneberger, O.; Tunyasuvunakool, K.; Bates, R.; Žídek, A.; Potapenko, A. Highly accurate protein structure prediction with AlphaFold. Nature 2021, 596, 583–589. [Google Scholar] [CrossRef]
  10. Baek, M.; DiMaio, F.; Anishchenko, I.; Dauparas, J.; Ovchinnikov, S.; Lee, G.R.; Wang, J.; Cong, Q.; Kinch, L.N.; Schaeffer, R.D. Accurate prediction of protein structures and interactions using a three-track neural network. Science 2021, 373, 871–876. [Google Scholar] [CrossRef]
  11. Cao, H.; Wang, J.; He, L.; Qi, Y.; Zhang, J.Z. DeepDDG: Predicting the Stability Change of Protein Point Mutations Using Neural Networks. J. Chem. Inf. Modeling 2019, 59, 1508–1514. [Google Scholar] [CrossRef] [PubMed]
  12. Cheng, J.; Randall, A.; Baldi, P. Prediction of protein stability changes for single-site mutations using support vector machines. Proteins Struct. Funct. Bioinform. 2006, 62, 1125–1132. [Google Scholar] [CrossRef] [PubMed]
  13. Capriotti, E.; Fariselli, P.; Casadio, R. I-Mutant2.0: Predicting stability changes upon mutation from the protein sequence or structure. Nucleic Acids Res. 2005, 33 (Suppl. 2), W306–W310. [Google Scholar] [CrossRef] [PubMed]
  14. Kellogg, E.H.; Leaver-Fay, A.; Baker, D. Role of conformational sampling in computing mutation-induced changes in protein structure and stability. Proteins Struct. Funct. Bioinform. 2011, 79, 830–838. [Google Scholar] [CrossRef]
  15. Schymkowitz, J.; Borg, J.; Stricher, F.; Nys, R.; Rousseau, F.; Serrano, L. The FoldX web server: An online force field. Nucleic Acids Res. 2005, 33 (Suppl. 2), W382–W388. [Google Scholar] [CrossRef]
  16. Sumbalova, L.; Stourac, J.; Martinek, T.; Bednar, D.; Damborsky, J. HotSpot Wizard 3.0: Web server for automated design of mutations and smart libraries based on sequence input information. Nucleic Acids Res. 2018, 46, W356–W362. [Google Scholar] [CrossRef]
  17. Bednar, D.; Beerens, K.; Sebestova, E.; Bendl, J.; Khare, S.; Chaloupkova, R.; Prokop, Z.; Brezovsky, J.; Baker, D.; Damborsky, J. FireProt: Energy-and evolution-based computational design of thermostable multiple-point mutants. PLoS Comput. Biol. 2015, 11, e1004556. [Google Scholar] [CrossRef]
  18. Weinstein, J.J.; Goldenzweig, A.; Hoch, S.; Fleishman, S.J. PROSS 2: A new server for the design of stable and highly expressed protein variants. Bioinformatics 2021, 37, 123–125. [Google Scholar] [CrossRef]
  19. Huang, P.; Chu, S.K.S.; Frizzo, H.N.; Connolly, M.P.; Caster, R.W.; Siegel, J.B. Evaluating Protein Engineering Thermostability Prediction Tools Using an Independently Generated Dataset. ACS Omega 2020, 5, 6487–6493. [Google Scholar] [CrossRef]
  20. Stites, W.E.; Meeker, A.K.; Shortle, D. Evidence for strained interactions between side-chains and the polypeptide backbone. J. Mol. Biol. 1994, 235, 27–32. [Google Scholar] [CrossRef]
  21. Alford, R.F.; Leaver-Fay, A.; Jeliazkov, J.R.; O’Meara, M.J.; DiMaio, F.P.; Park, H.; Shapovalov, M.V.; Renfrew, P.D.; Mulligan, V.K.; Kappel, K. The Rosetta all-atom energy function for macromolecular modeling and design. J. Chem. Theory Comput. 2017, 13, 3031–3048. [Google Scholar] [CrossRef] [PubMed]
  22. Bendl, J.; Stourac, J.; Sebestova, E.; Vavra, O.; Musil, M.; Brezovsky, J.; Damborsky, J. HotSpot Wizard 2.0: Automated design of site-specific mutations and smart libraries in protein engineering. Nucleic Acids Res. 2016, 44, W479–W487. [Google Scholar] [CrossRef] [PubMed]
  23. Rathi, P.C.; Fulton, A.; Jaeger, K.E.; Gohlke, H. Application of Rigidity Theory to the Thermostabilization of Lipase A from Bacillus subtilis. PLoS Comput. Biol. 2016, 12, e1004754. [Google Scholar] [CrossRef] [PubMed]
  24. Contreras, F.; Nutschel, C.; Beust, L.; Davari, M.D.; Gohlke, H.; Schwaneberg, U. Can constraint network analysis guide the identification phase of KnowVolution? A case study on improved thermostability of an endo-β-glucanase. Comput. Struct. Biotechnol. J. 2021, 19, 743–751. [Google Scholar] [CrossRef]
  25. Frenz, B.; Lewis, S.M.; King, I.; DiMaio, F.; Park, H.; Song, Y. Prediction of protein mutational free energy: Benchmark and sampling improvements increase classification accuracy. Front. Bioeng. Biotechnol. 2020, 8, 1175. [Google Scholar] [CrossRef]
  26. Pancotti, C.; Benevenuta, S.; Birolo, G.; Alberini, V.; Repetto, V.; Sanavia, T.; Capriotti, E.; Fariselli, P. Predicting protein stability changes upon single-point mutation: A thorough comparison of the available tools on a new dataset. Brief. Bioinform. 2022, 23, bbab555. [Google Scholar] [CrossRef]
  27. Masumoto, K.; Ueda, T.; Motoshima, H.; Imoto, T. Relationship between local structure and stability in hen egg white lysozyme mutant with alanine substituted for glycine. Protein Eng. 2000, 13, 691–695. [Google Scholar] [CrossRef]
  28. Trevino, S.R.; Schaefer, S.; Scholtz, J.M.; Pace, C.N. Increasing protein conformational stability by optimizing β-turn sequence. J. Mol. Biol. 2007, 373, 211–218. [Google Scholar] [CrossRef]
  29. Stojanoski, V.; Adamski, C.J.; Hu, L.; Mehta, S.C.; Sankaran, B.; Zwart, P.; Prasad, B.V.; Palzkill, T. Removal of the side chain at the active-site serine by a glycine substitution increases the stability of a wide range of serine β-lactamases by relieving steric strain. Biochemistry 2016, 55, 2479–2490. [Google Scholar] [CrossRef]
  30. Lan, D.; Zhao, G.; Holzmann, N.; Yuan, S.; Wang, J.; Wang, Y. Structure-Guided Rational Design of a Mono- and Diacylglycerol Lipase from Aspergillus oryzae: A Single Residue Mutant Increases the Hydrolysis Ability. J. Agric. Food Chem. 2021, 69, 5344–5352. [Google Scholar] [CrossRef]
  31. Osuna, S.; Jimenez-Oses, G.; Noey, E.L.; Houk, K. Molecular dynamics explorations of active site structure in designed and evolved enzymes. Acc. Chem. Res. 2015, 48, 1080–1089. [Google Scholar] [CrossRef] [PubMed]
  32. DeLano, W.L. Pymol: An open-source molecular graphics tool. CCP4 Newsl. Protein Crystallogr. 2002, 40, 82–92. [Google Scholar]
  33. Abraham, M.J.; Murtola, T.; Schulz, R.; Páll, S.; Smith, J.C.; Hess, B.; Lindahl, E. GROMACS: High performance molecular simulations through multi-level parallelism from laptops to supercomputers. SoftwareX 2015, 1, 19–25. [Google Scholar] [CrossRef]
  34. Kaminski, G.A.; Friesner, R.A.; Tirado-Rives, J.; Jorgensen, W.L. Evaluation and Reparametrization of the OPLS-AA Force Field for Proteins via Comparison with Accurate Quantum Chemical Calculations on Peptides. J. Phys. Chem. B 2001, 105, 6474–6487. [Google Scholar] [CrossRef]
Figure 1. Selected hotspots in SMG1 for stability enhancement. Hotspot residues are shown as sticks in the SMG1 structure (PDB code 3UUE). The spheres represent the catalytic triad. The protein is in rainbow colors.
Catalysts 12 00898 g001
Figure 2. Thermostability test using crude lysates of the WT and selected mutants. Crude lysates of the SMG1 WT and mutants were incubated at various temperatures between 40–55 °C at pH 7.0 in a 20 mM sodium phosphate buffer for 15 min and assayed for their residual activity at 24 °C. The enzymatic activity of each construct without the heat treatment was treated as 100%. The sample was kept on ice and pre-equilibrated to the reaction temperature before the reaction was conducted at 24 °C. Each data point represents an averaged result of three independent experiments with triplicates. The error bar indicates the standard error of three independent experiments. The dashed line designates a residual activity of 50%.
Catalysts 12 00898 g002
Figure 3. Characterization of purified proteins. (A) T5015 was determined for the purified enzymes using 4-nitrophenyl caprylate. (B) T5015 was determined for the purified enzymes using diacylglycerols. In both (A,B), purified enzymes were incubated at specific temperatures between 40–55 °C in a 20 mM sodium phosphate buffer (pH 7.0) for 15 min and assayed for residual activities at 24 °C. The activity of each enzyme (WT or mutants) measured at 24°C without exposure to the heat treatment was considered as 100%. The T5015 value was determined using the inflection point of a sigmoidal fit of residual activities. (C) Kinetic thermostability of selected SMG1 mutants at 45 °C. Purified enzymes were incubated at 45 °C and pH 7.0 for up to 180 min. Residual activities were determined for samples withdrawn at specific time points. The activity of each enzyme without exposure to 45 °C was defined as 100%. (D) The optimal reaction temperature for the WT and selected mutants. Purified enzymes were added to DAG substrates preincubated at specific temperatures and allowed to catalyze. The enzymatic unit was defined as the amount of enzymes required to produce 1 μmol of fatty acids per minute. Each point represents the average of three independent experiments, with the error bar indicating their standard errors.
Catalysts 12 00898 g003
Figure 4. Enzymatic reaction kinetics. The kinetics of hydrolytic reactions were measured for the WT, D245G, and A292G using 4-nitrophenyl caprylate as the substrate. The table below indicates the kinetic parameters of the reactions. Each point represents the average of three independent experiments, with the error bar indicating the standard error of these three experiments.
Catalysts 12 00898 g004
Figure 5. Screening results of the site-saturation mutagenesis library. (A) The initial activity of all clones in the 292 site-saturation mutagenesis library. The red dashed line indicates μWT, and the blue dashed line indicates 0.5(μWT − σWT). μWT and σWT are the average and standard error of the WT’s initial activity, respectively, which were calculated from a panel of 288 clones. In the first screening step, mutants with an initial enzyme activity higher than 0.5(μWT − σWT) entered the second screening step. (B) In the second step, mutants with a residual activity above 1.5(μWT + 2σWT) were sequenced (labeled in green).
Catalysts 12 00898 g005
Figure 6. The Ramachandran plot of the SMG1 WT. Residues in generously allowed regions (A292, S171) and disallowed regions (D245) are labeled in red squares (PDB code 3UUE). The plot was downloaded from the Procheck server accessed on 5 November 2021 (https://www.ebi.ac.uk/thornton-srv/software/PROCHECK/). Areas in red, yellow, light yellow and white represented most favored regions, additional allowed regions, generously allowed regions, and disallowed regions, respectively. Black triangles, black squares and red squares indicate glycine, residues except glycine, and residues in generously allowed or disallowed regions. respectively.
Catalysts 12 00898 g006
Figure 7. Energy contribution to the favored Rosetta predicted ∆∆G for the D245G mutant. (A) Structural models of residue 245 and its interacting residues are shown based on representative snapshots at 200 ns of the MD simulation trajectories for the WT and D245G. The residues are shown as sticks. Nitrogen and oxygen atoms are colored in blue and red, respectively. Carbon atoms were colored in cyan for the WT and magenta for D245G. (B) The Rosetta ∆∆G energy (kcal/mol) is shown for D245G and its interacting residues. (C) Decomposition of the change in the Rosetta energy to individual energy score terms for residues. The energy score terms are color-coded. Below is the description for the score terms [21]. Fa_atr: attractive energy between two atoms on different residues separated by distance d; Fa_dun: probability that a chosen rotamer is native-like given the backbone angles ϕ and ψ; Fa_elec: energy of the interaction between two non-bonded charged atoms separated by distance d; Fa_intra_sol_xover4: Gaussian exclusion implicit solvation energy between protein atoms in the same residue; Fa_sep: repulsive energy between two atoms on different residues separated by distance d; Fa_sol: Gaussian exclusion implicit solvation energy between protein atoms in different residues; hbond_bb_sc: energy of backbone-side chain hydrogen bonds; hbond_sc: energy of side-chain-to-side-chain hydrogen bonds; lk_ball_wtd: orientation-dependent solvation of polar atoms assuming an ideal water geometry: omega: backbone-dependent penalty for cis ω dihedrals that deviate from 0° and trans ω dihedrals that deviate from 180°; p_aa_pp: probability of amino acid identity given the backbone angles ϕ and ψ: rama_prepro: probability of the backbone angles ϕ and ψ given the amino acid type; ref: reference energies for amino acid types; total: the change in the Rosetta energy.
Catalysts 12 00898 g007
Figure 8. Dihedral angles of residue 245 and neighboring residues in the MD simulation of the WT and the D245G mutant. Dihedral angles of residues (A) 245, (B) 244, and (C) 246 in the MD simulation are shown for the WT (phi, black; psi, red) and the D245G mutant (phi, blue; psi, orange). Phi–psi angles in the crystal structure (xtal) are denoted as purple (phi) and green (psi) squares at x = 0 and highlighted by arrows.
Catalysts 12 00898 g008
Figure 9. Energy contribution to the favored Rosetta-predicted ∆∆G for the A292G mutant. (A) Structural models of residue 292 and its interacting residues are shown based on representative snapshots at 200 ns in MD simulation trajectories for the WT and A292G. The residues are shown as sticks. Nitrogen, oxygen, and sulfur atoms are colored in blue, red, and yellow, respectively. Carbon atoms are colored in cyan for the WT and magenta for A292G. (B) Rosetta ∆∆G energy (kcal/mol) is shown for A292G and its interacting residues. (C) Decomposition of the change in Rosetta energy to individual energy score terms for respective residues. The energy score terms are color-coded and their meanings are described in Figure 7’s description.
Catalysts 12 00898 g009
Figure 10. Dihedral angles of residue 292 and neighboring residues in the MD simulation of the WT and the A292G mutant. Dihedral angles of residues (A) 292, (B) 291, and (C) 293 in the MD simulation are shown for the WT (phi, black; psi, red) and the A292G mutant (phi, blue; psi, orange). Phi–psi angles in the crystal structure (xtal) are denoted as purple (phi) and green (psi) squares at x = 0 and highlighted by arrows.
Catalysts 12 00898 g010
Table 1. Biochemical property of SMG1 and its mutants.
WT or MutantsHalf-Life (h)Optimal Reaction Temperature (°C)Enzymatic Activity toward DAG at Optimal Reaction Temperature (U/mg)T5015 (°C, Substrate 4-Nitrophenyl Caprylate)T5015 (°C, Substrate DAG)Tm
WT1.720683.346.2346.7351.34
D245G15.420883.348.01 (+1.8) *50.13 (+3.4)60.05
(+8.71)
Q282W12.525197.248.67 (+2.5)49.06 (+2.4)ND
A292G39.9251258.352.85 (+6.7)54.40 (+7.7)61.70
(+10.36)
ND: not done; *: the number in brackets indicates the change compared with the WT.
Publisher’s Note: MDPI stays neutral with regard to jurisdictional claims in published maps and institutional affiliations.

