
Effects of Sintering Parameters on the Low-Temperature Densification of GDC Electrolyte Based on an Orthogonal Experiment


Abstract
:1. Introduction
2. Experimental
- Preparation of binder: mix terpineol and ethyl cellulose in a mass ratio of 97:3. Then, place the solution in a beaker and stir evenly with a magnetic rotor for 8 h.
- Place 8 g of GDC electrolyte powder and 8 g of binder into the homogenizer (ZYE, ZYMC-200V), and run the homogenizer at 1500 r/min for 3 min; vacuum deformation is performed during this process.
- Transfer the slurry to the three-roll grinder for further homogenization.
- Set the vacuum dryer to 75 °C; then, place the slurry in the vacuum dryer for 24–48 h until completely dried.
- Add 1 g of the fabricated powder into the stainless cast of the manual tablet press machine and impose the specified pressure on the powder to form an electrolyte pellet.
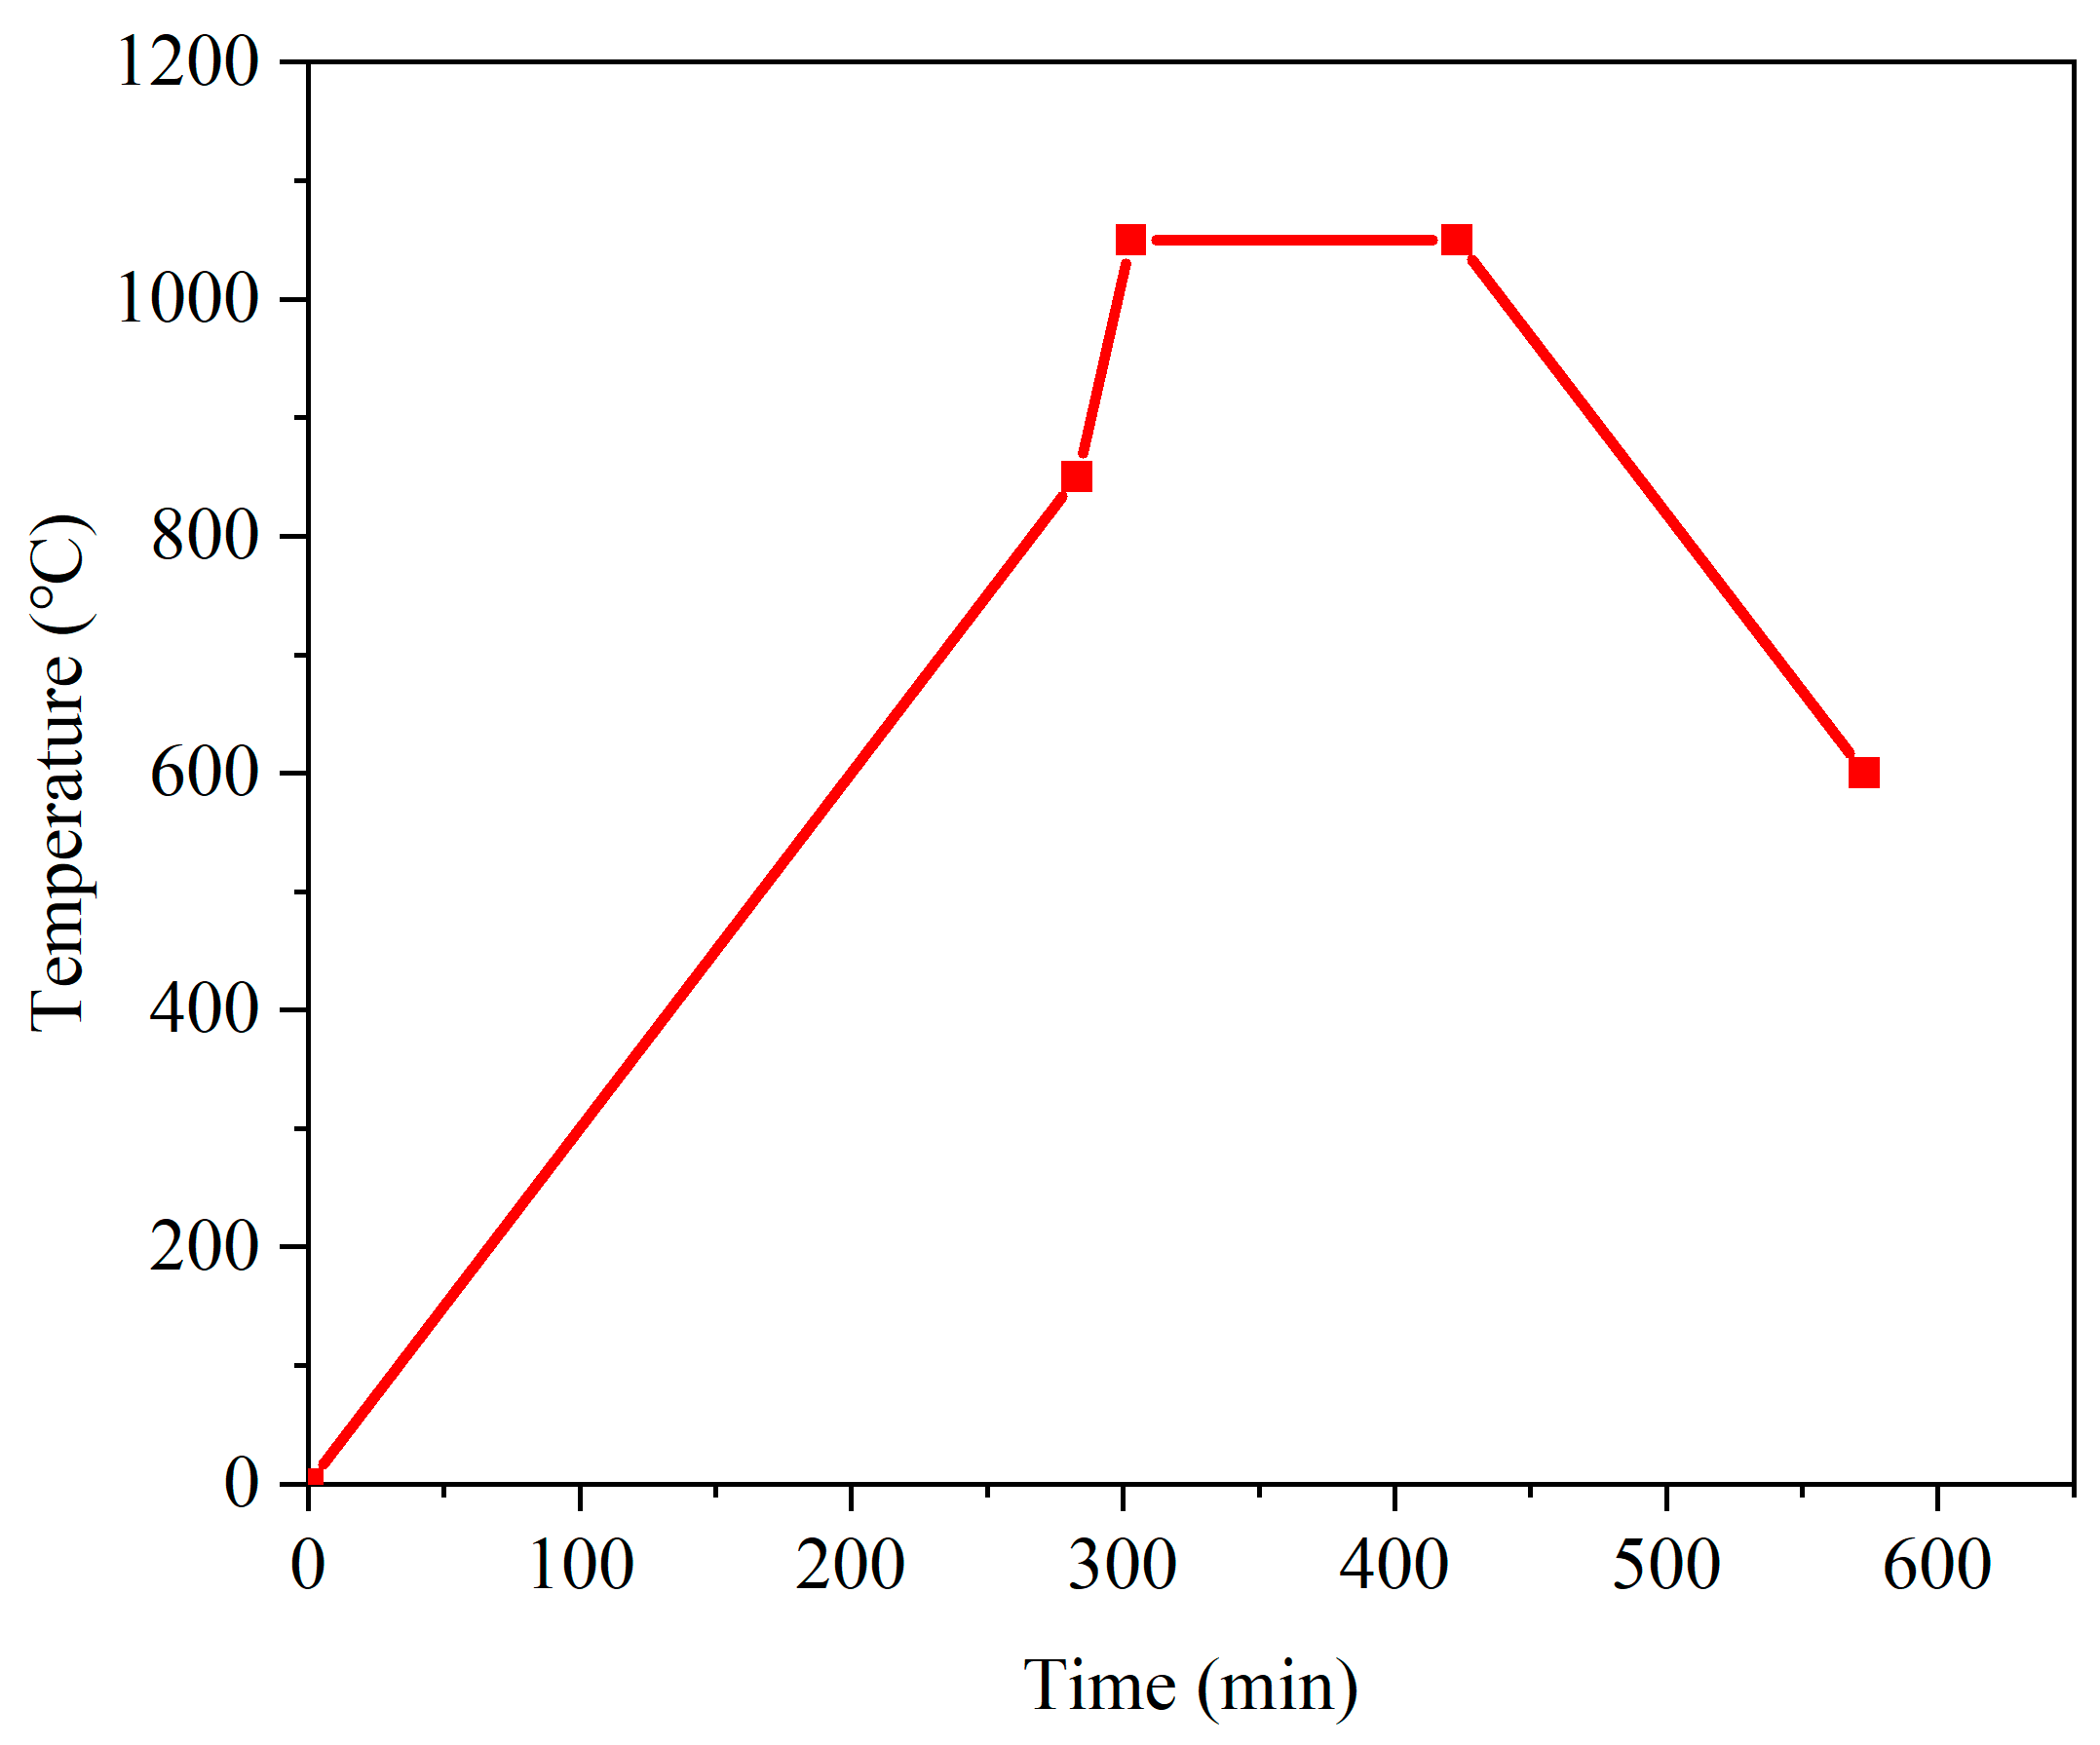
- Place the pellets on aluminum plates and transfer them to the sintering furnace. Increase the temperature of the furnace according to the prescribed temperature profile up to the maximum sintering temperature. Maintain at the maximum sintering temperature for 2 h.
- Decrease the temperature inside the furnace according to the temperature profile until the temperature is lower than 600 °C.
3. Experimental Design
4. Results and Discussion
4.1. Statistical Analysis
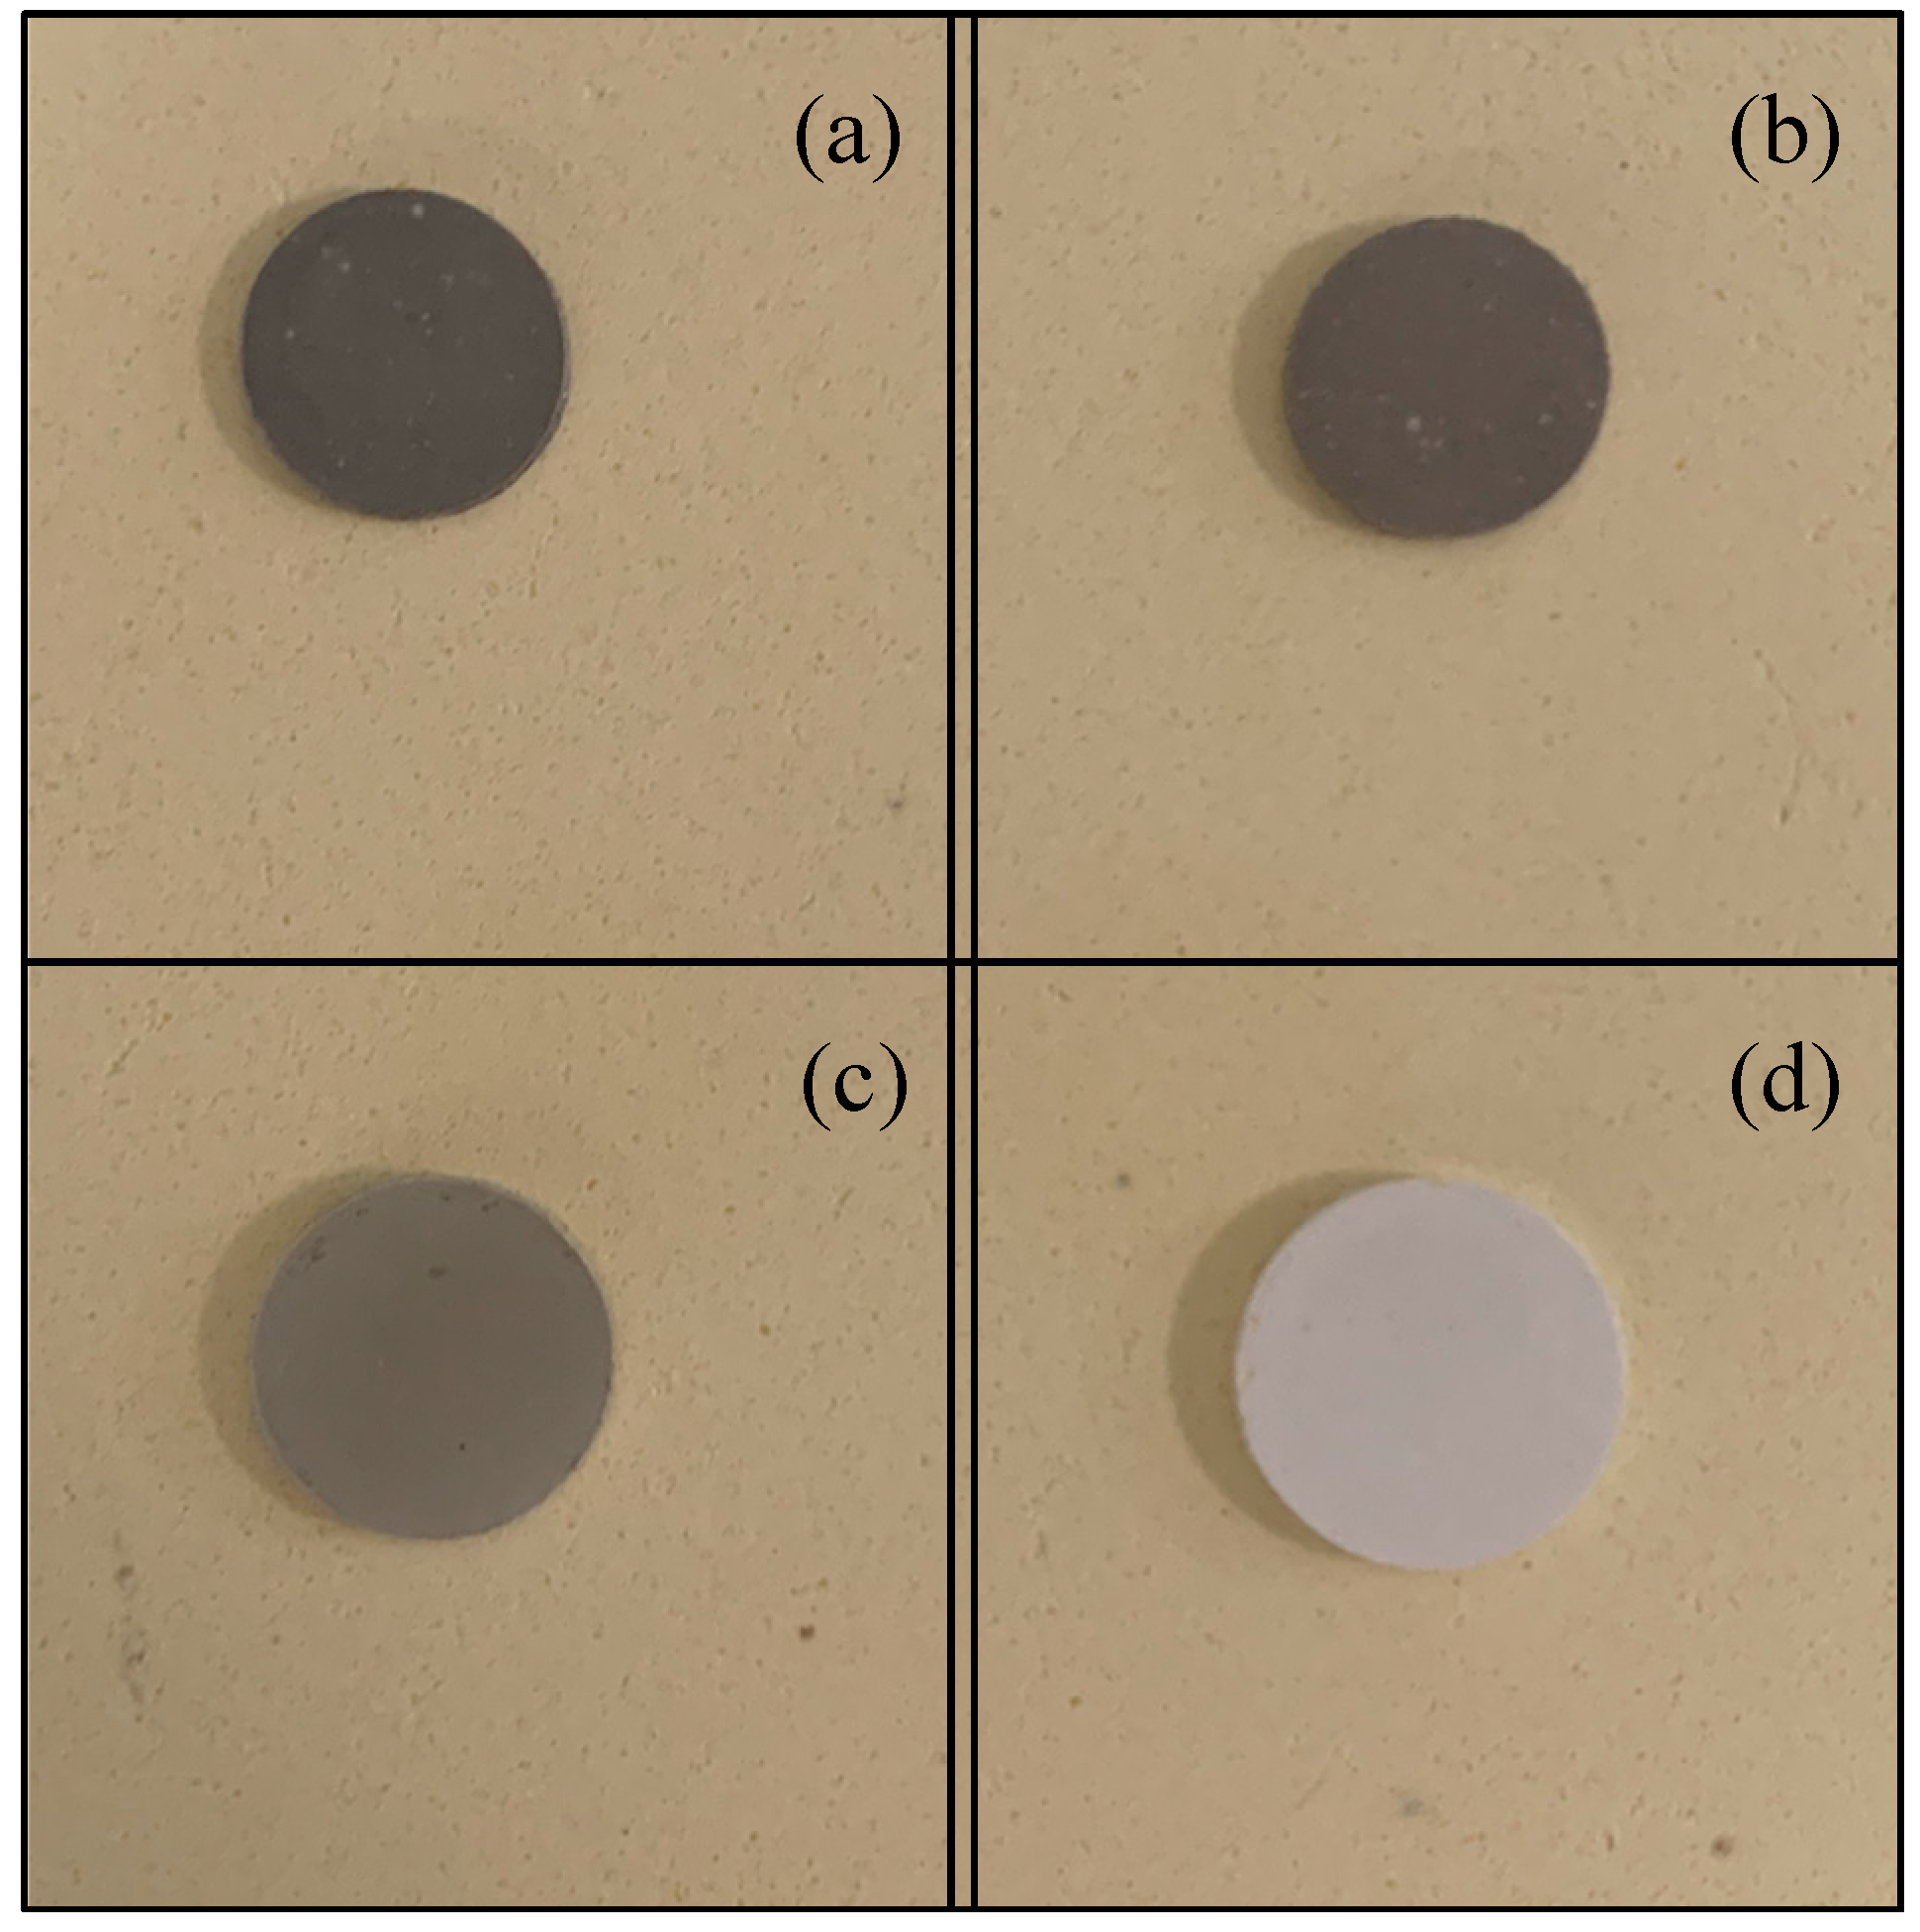
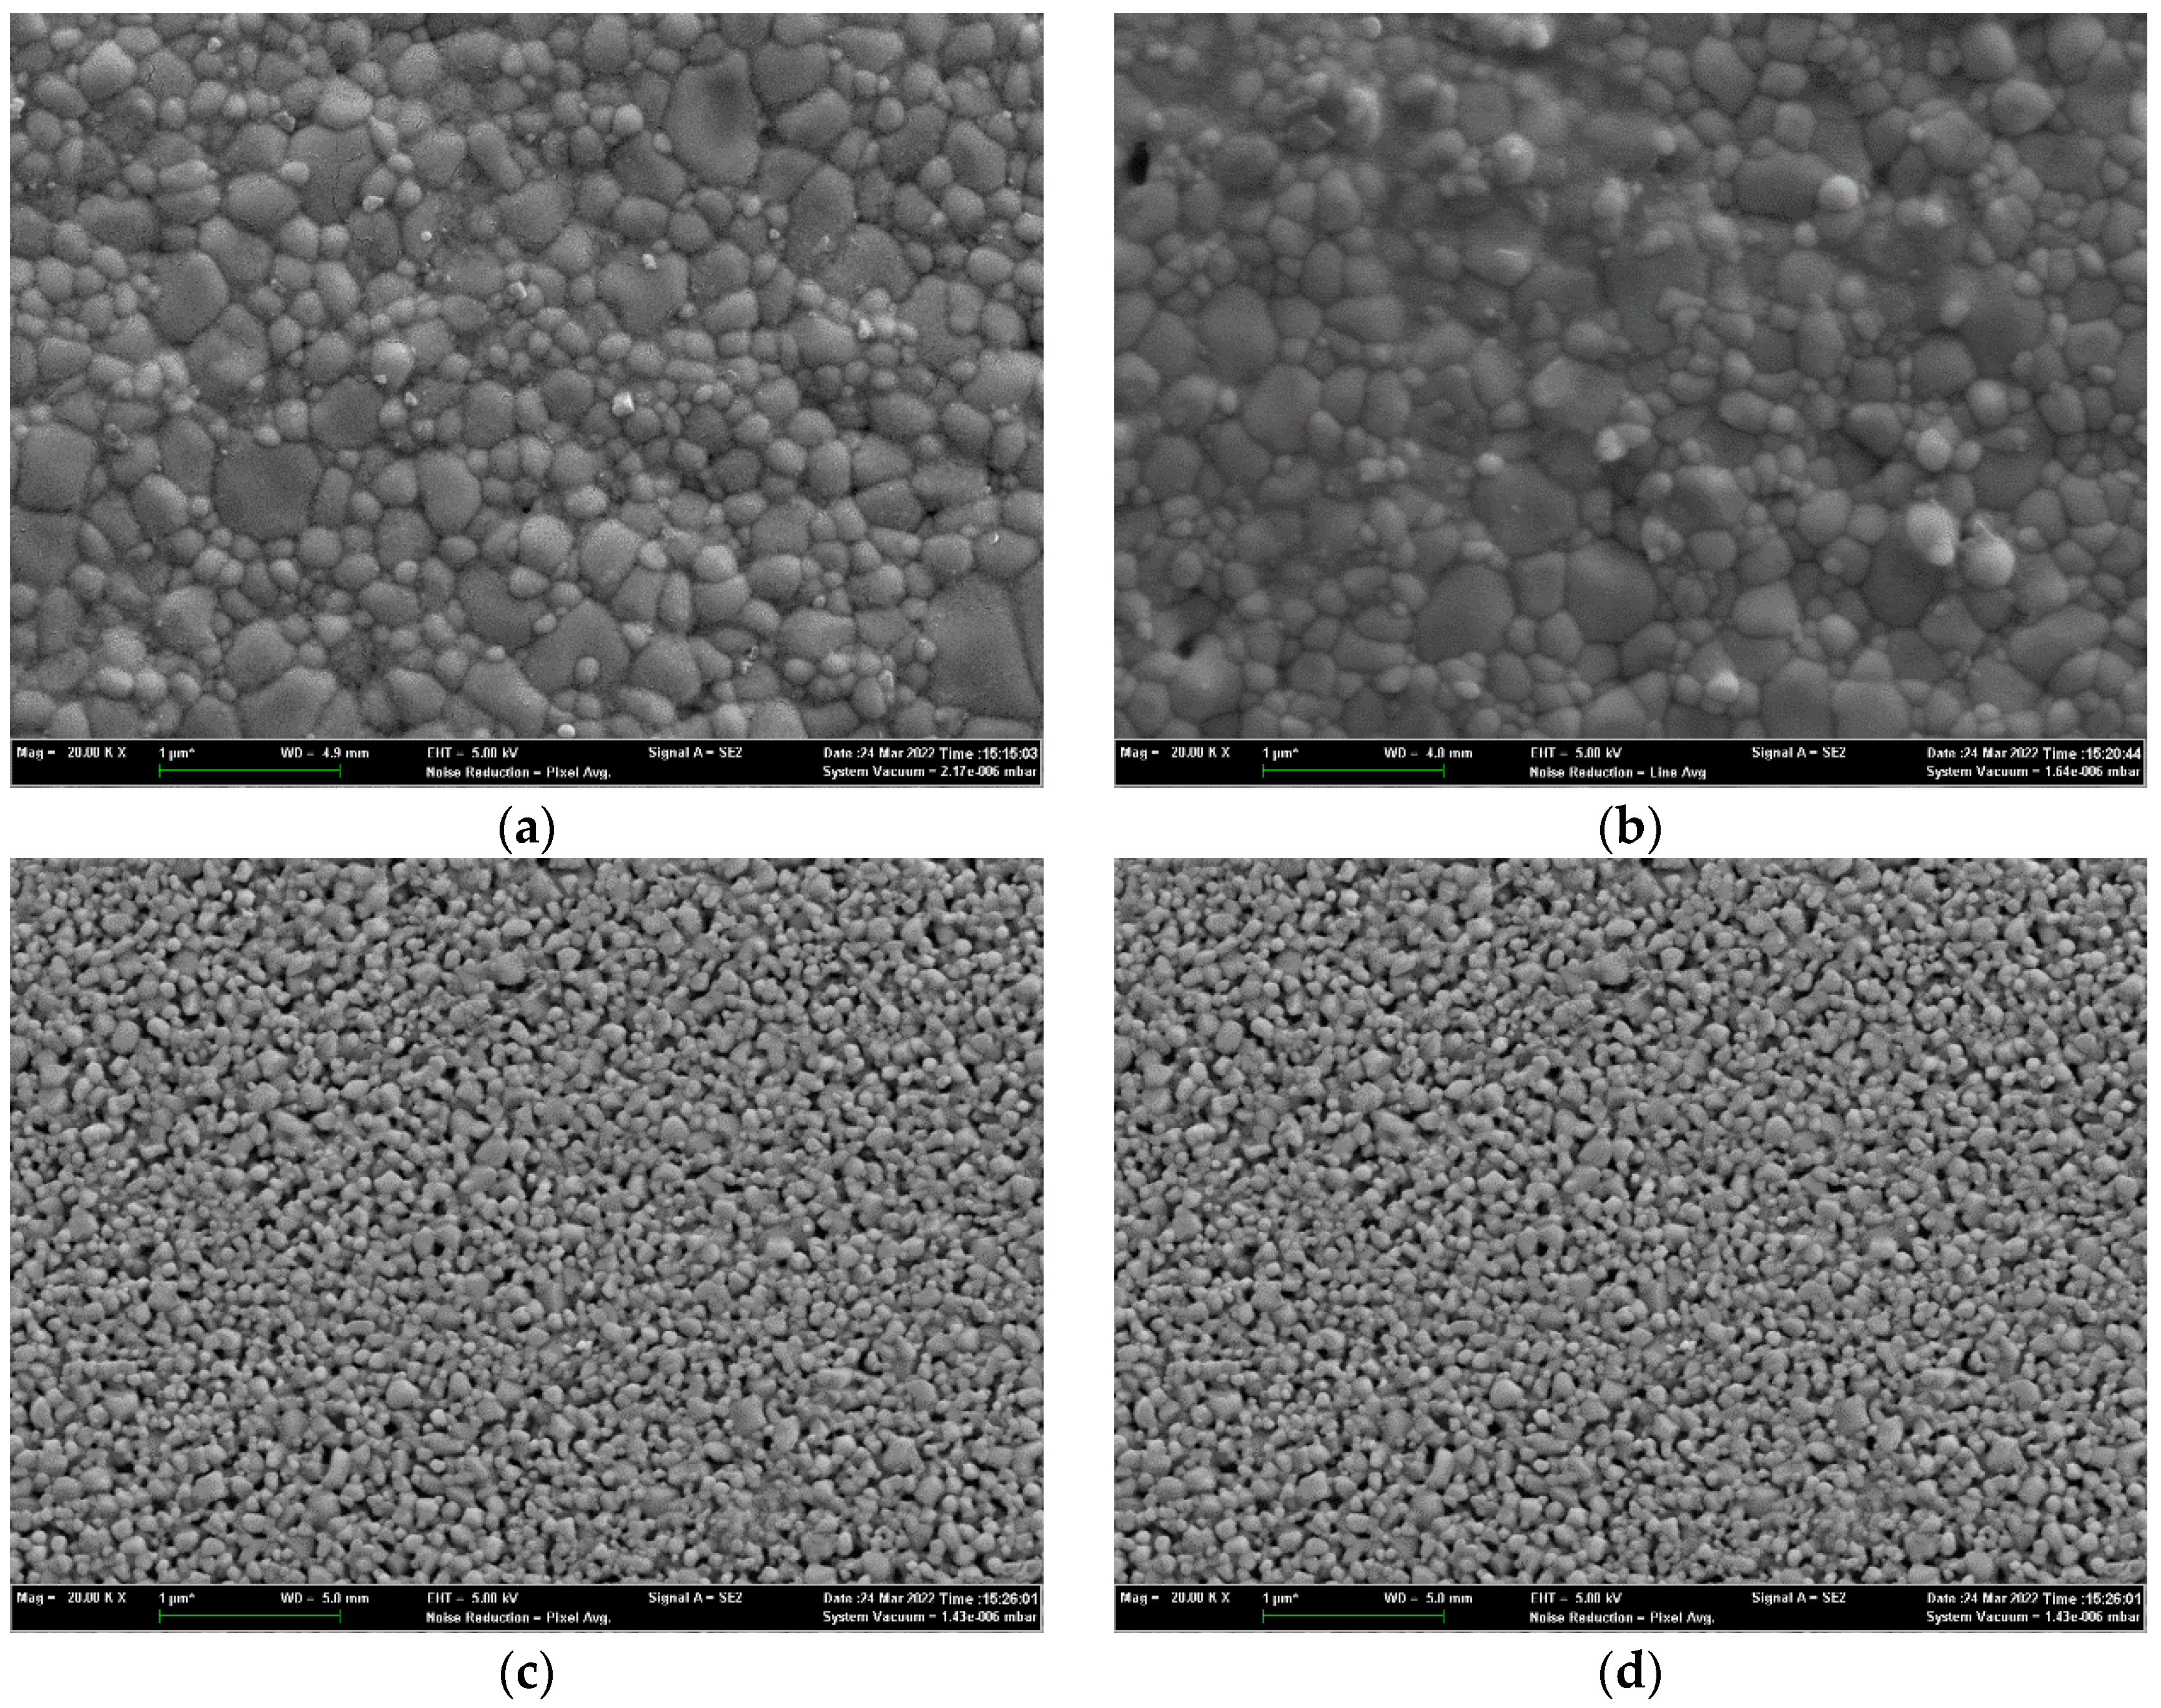
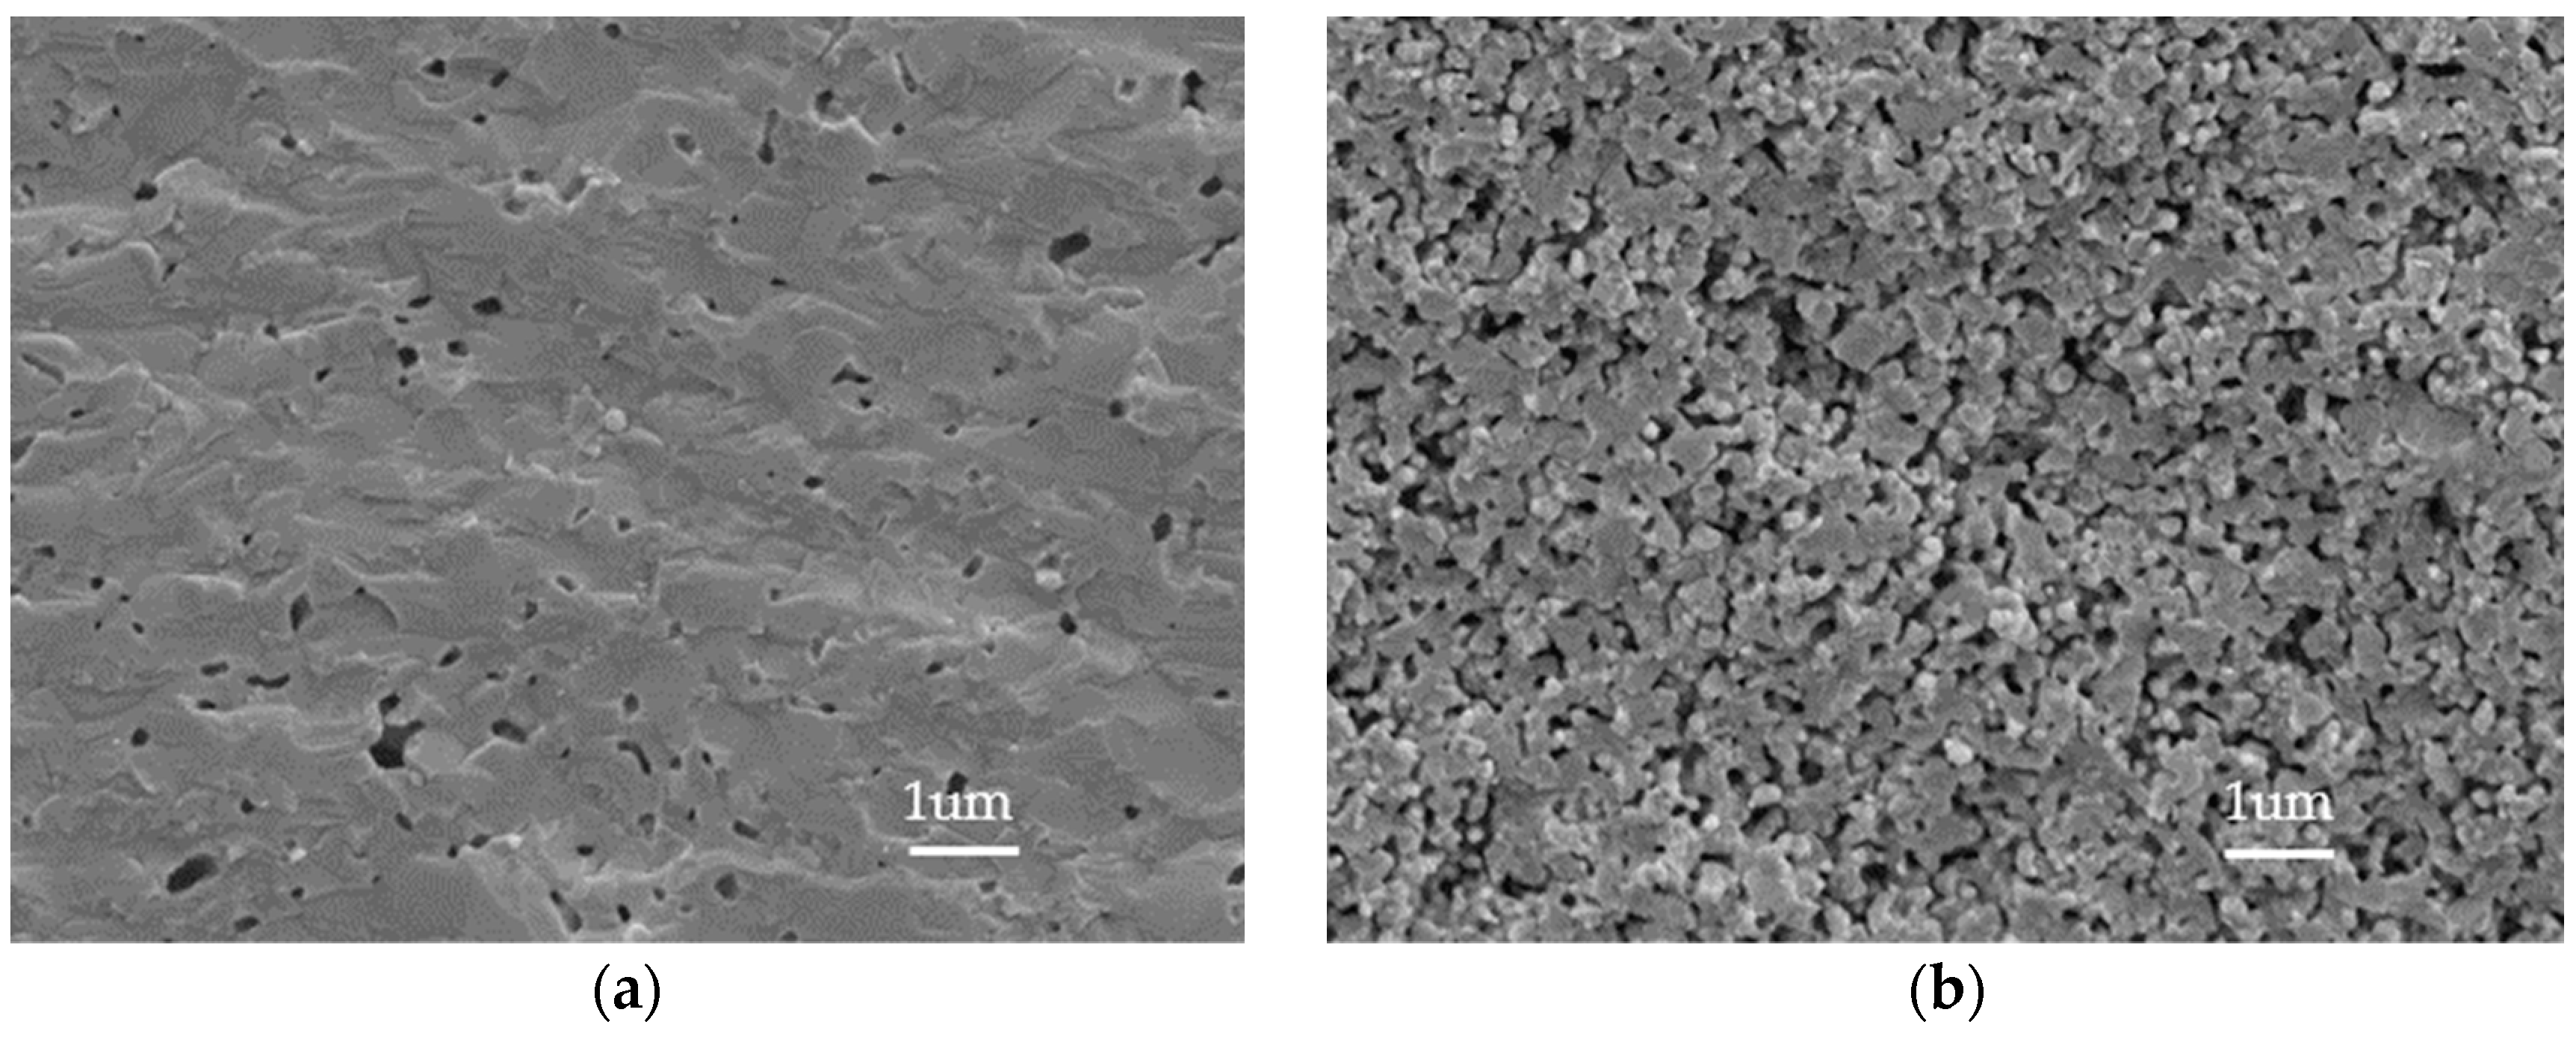
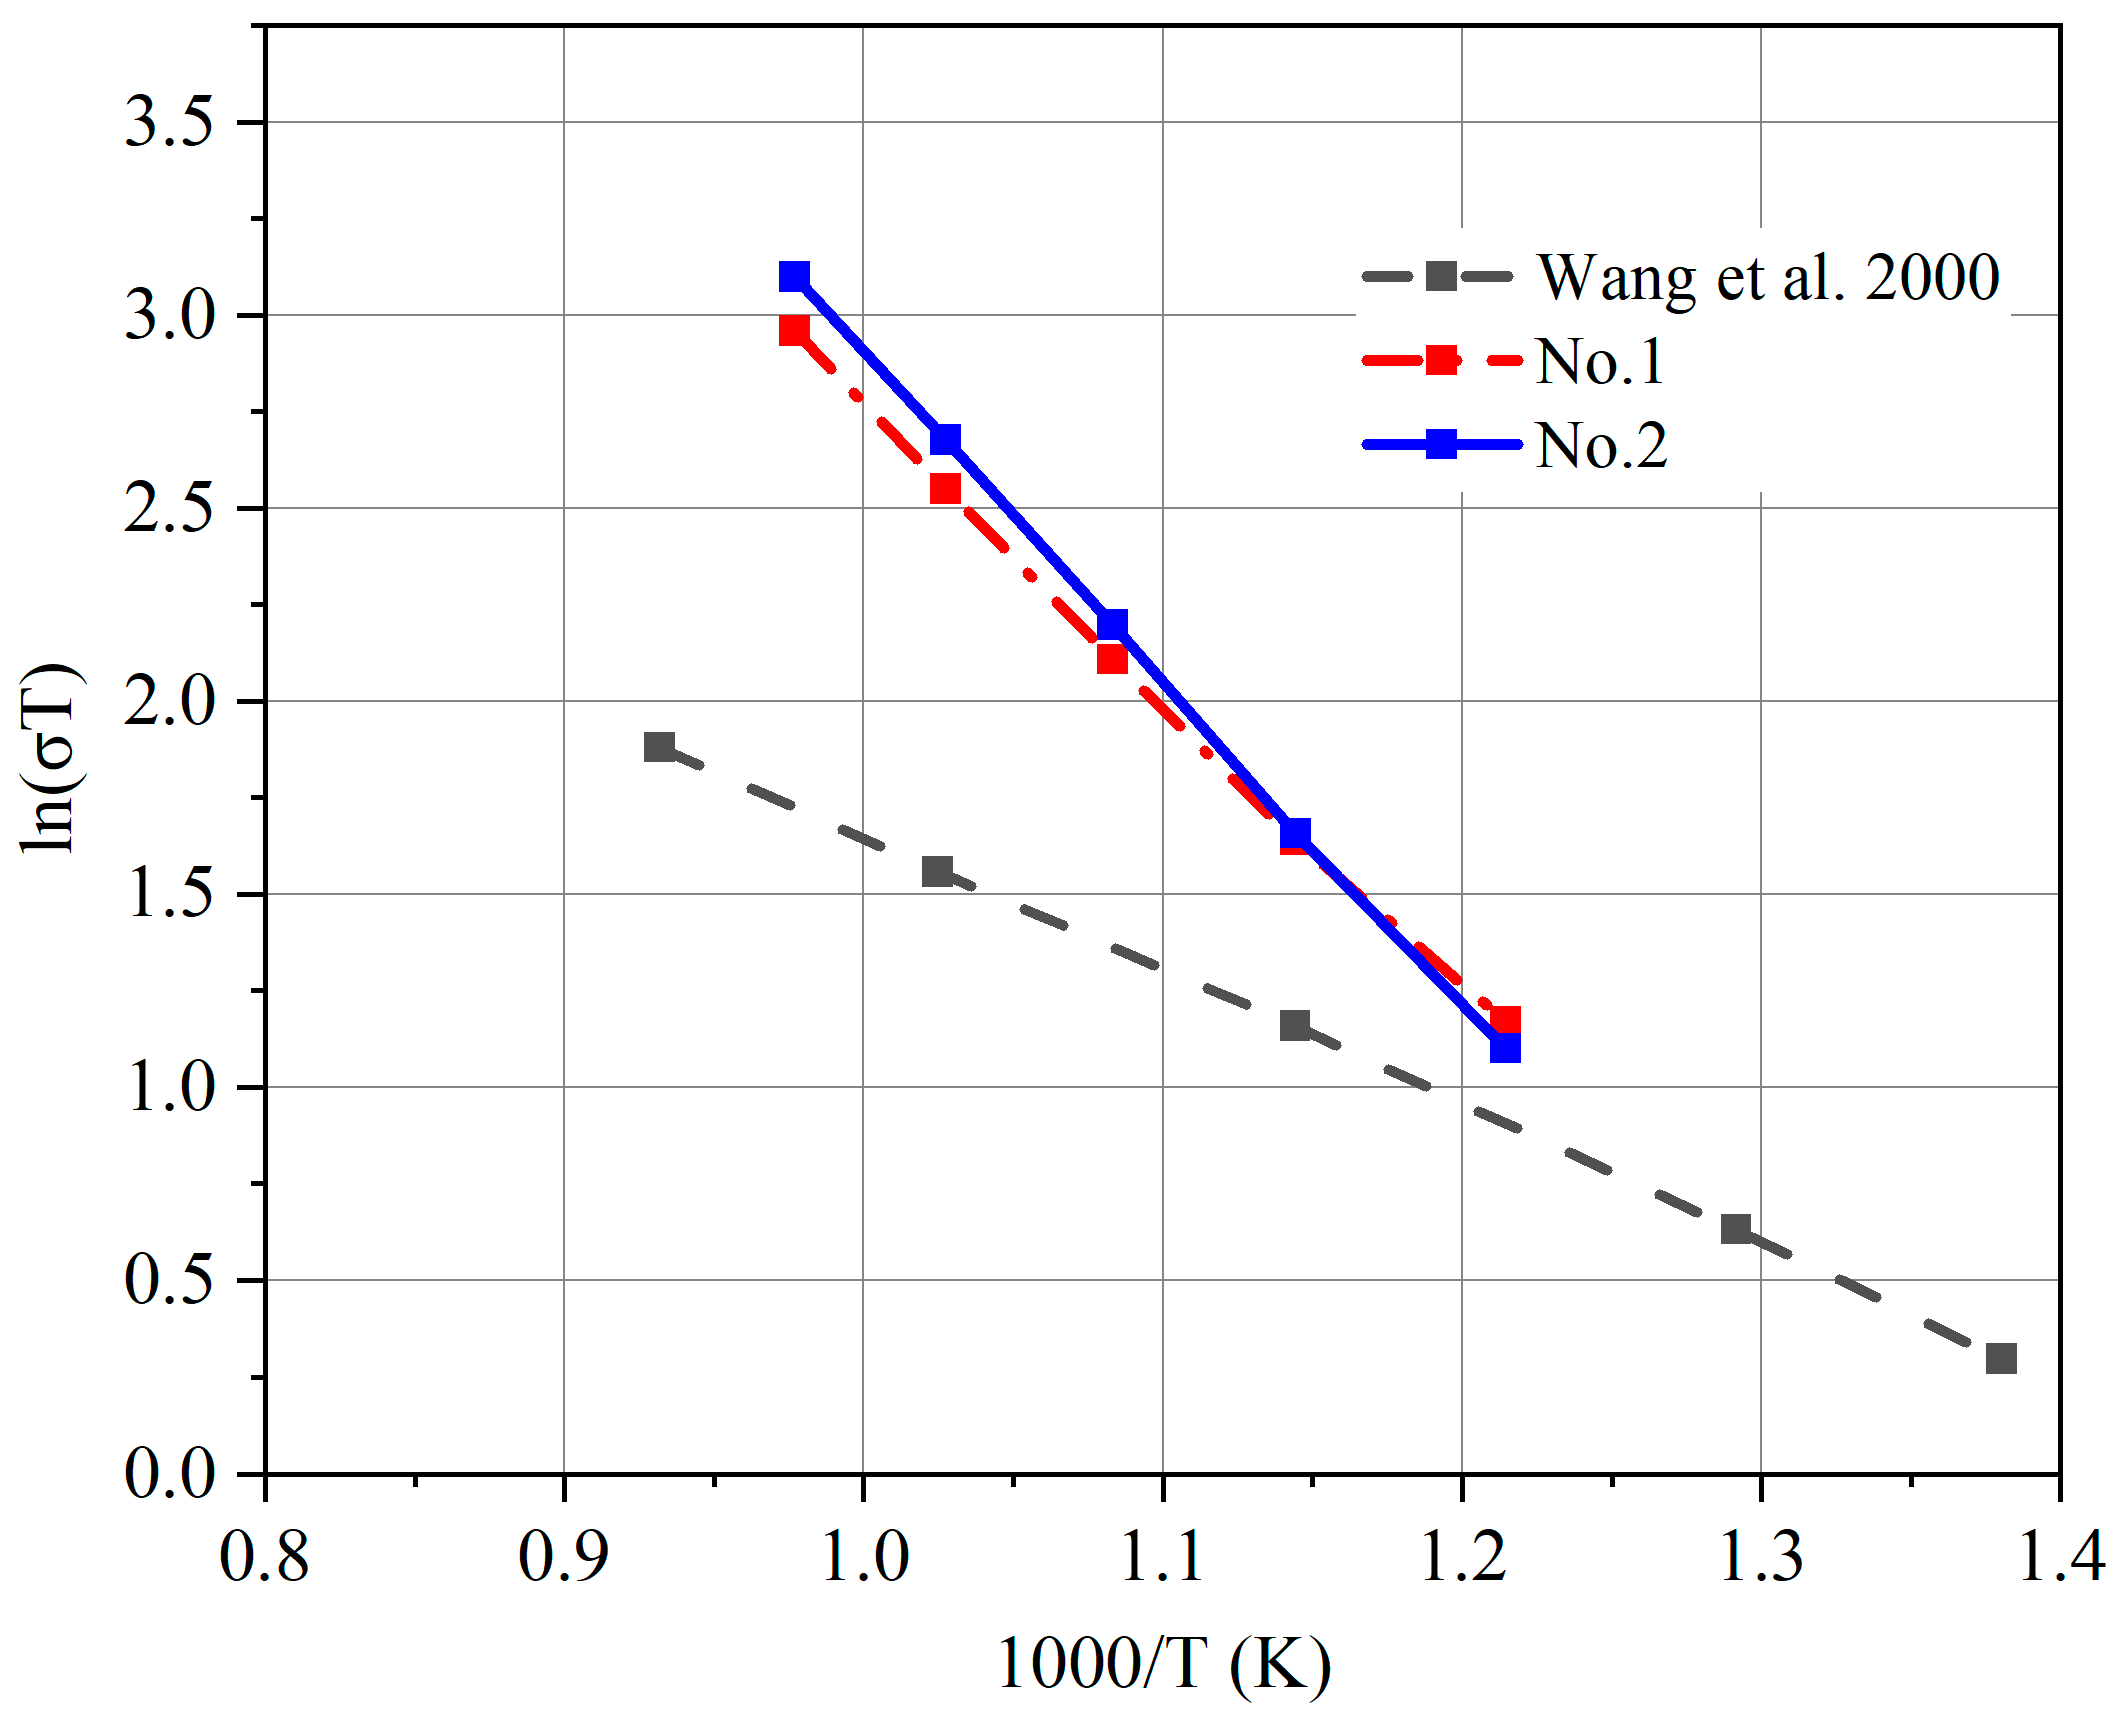
4.2. Characterization
5. Conclusions
Author Contributions
Funding
Data Availability Statement
Conflicts of Interest
References
- Vostakola, M.F.; Horri, B.A. Progress in Material Development for Low-Temperature Solid Oxide Fuel Cells: A Review. Energies 2021, 14, 1280. [Google Scholar] [CrossRef]
- Santhanam, S.; Ullmer, D.; Wuillemin, Z.; Varkaraki, E.; Beetschen, C.; Antonetti, Y.; Ansar, A. Experimental Analysis of a 25 kWe Solid Oxide Fuel Cell Module for Co-Generation of Hydrogen and Power. ECS Trans. 2019, 91, 159–166. [Google Scholar] [CrossRef]
- Wu, Z.; Zhu, P.; Yao, J.; Tan, P.; Xu, H.; Chen, B.; Ni, M. Dynamic modeling and operation strategy of natural gas fueled SOFC Engine hybrid power systemwith hydrogen addition by metal hydride for vehicle applications. eTransportation 2020, 5, 100074. [Google Scholar] [CrossRef]
- Ballard, A.; Domanski, T.; Rees, L.; Nobbs, C.; Lawrence, N.; Heffer, K.; Harman, J.; Evans, C.; Barnard, P.; Mukerjee, S.; et al. Development of the 5kWe SteelCell® Technology Platform for Stationary Power and Transport Applications. ECS Trans. 2019, 91, 117–122. [Google Scholar] [CrossRef]
- Noponen, M.; Torri, P.; Göös, J.; Puranen, J.; Kaar, H.; Pylypko, S.; Õunpuu, E. Elcogen—Next Generation Solid Oxide Cell and Stack Technology. ECS Trans. 2019, 91, 91–97. [Google Scholar] [CrossRef]
- Mai, A.; Grolig, J.G.; Dold, M.; Vandercruysse, F.; Denzler, R.; Schindler, B.; Schuler, A. Progress in HEXIS’ SOFC Development. ECS Trans. 2019, 91, 63–70. [Google Scholar] [CrossRef]
- Vora, S.D.; Jesionowski, G.; Williams, M.C. Overview of U.S. Department of Energy Office of Fossil Energy’s Solid Oxide Fuel Cell Program for FY2019. ECS Trans. 2019, 91, 27–39. [Google Scholar] [CrossRef]
- Hara, D. Toward a Hydrogen Society—Introduction of Representative Projects in Japan. ECS Trans. 2019, 91, 3–7. [Google Scholar] [CrossRef]
- Nakao, T.; Inoue, S.; Uenoyama, S.; Takuwa, Y.; Suzuki, M. Progress of SOFC Residential CHP System: Over 50,000 Units Market Experience of Osaka Gas. ECS Trans. 2019, 91, 43–49. [Google Scholar] [CrossRef]
- Al-Hamed, K.H.M.; Dincer, I. A new direct ammonia solid oxide fuel cell and gas turbine based integrated system for electric rail transportation. eTransportation 2019, 2, 100027. [Google Scholar] [CrossRef]
- Sumi, H.; Nakabayashi, S.; Kawada, T.; Uchiyama, Y.; Uchiyama, N.; Ichihara, K. Demonstration of SOFC Power Sources for Drones (UAVs; Unmanned Aerial Vehicles). ECS Trans. 2019, 91, 149–157. [Google Scholar] [CrossRef]
- Brandon, N.P.; Ruiz-Trejo, E.; Boldrin, P. Solid Oxide Fuel Cell Lifetime and Reliability; Elsevier: London, UK, 2017. [Google Scholar]
- Bianchi, F.R.; Bosio, B.; Baldinelli, A.; Barelli, L. Optimization of a Reference Kinetic Model for Solid Oxide Fuel Cells. Catalysts 2020, 10, 104. [Google Scholar] [CrossRef] [Green Version]
- Mozdzierz, M.; Berent, K.; Kimijima, S.; Szmyd, J.S.; Brus, G. A Multiscale Approach to the Numerical Simulation of the Solid Oxide Fuel Cell. Catalysts 2019, 9, 253. [Google Scholar] [CrossRef] [Green Version]
- Ivers-Tiffée, E.; Weber, A.; Herbstritt, D. Materials and technologies for SOFC-components. J. Eur. Ceram. Soc. 2001, 21, 1805–1811. [Google Scholar] [CrossRef]
- Mishima, Y. Solid oxide fuel cell with composite electrolyte consisting of samaria doped ceria and Yttria-stabilized zirconia. J. Electrochem. Soc. 1998, 145, 1004. [Google Scholar] [CrossRef]
- Horri, B.A.; Selomulya, C.; Wang, H. Electrochemical characteristics and performance of anode-supported SOFCs fabricated using carbon microspheres as a pore-former. Int. J. Hydrogen Energy 2012, 37, 19045–19054. [Google Scholar] [CrossRef]
- Kosacki, I.; Rouleau, C.M.; Becher, P.F.; Bentley, J.; Lowndes, D.H. Nanoscale effects on the ionic conductivity in highly textured YSZ thin films. Solid State Ion. 2005, 176, 1319–1326. [Google Scholar] [CrossRef]
- Tarancón, A. Strategies for Lowering Solid Oxide Fuel Cells Operating Temperature. Energies 2009, 2, 1130–1150. [Google Scholar] [CrossRef]
- Kleinlogel, C.; Gauckler, L.J. Sintering and properties of nanosized ceria solid solutions. Solid State Ion. 2000, 135, 567–573. [Google Scholar] [CrossRef]
- Piñol, S.; Morales, M.; Espiell, F. Low temperature anode-supported solid oxide fuel cells based on gadolinium doped ceria electrolytes. J. Power Source 2007, 169, 2–8. [Google Scholar] [CrossRef]
- Bianchi, F.R.; Spotorno, R.; Piccardo, P.; Bosio, B. Solid Oxide Fuel Cell Performance Analysis through Local Modelling. Catalysts 2020, 10, 519. [Google Scholar] [CrossRef]
- Tucker, M.C. Progress in metal-supported solid oxide fuel cells: A review. J. Power Source 2010, 195, 4570–4582. [Google Scholar] [CrossRef]
- Na, A.; Lue, Z.; Chen, K.; Huang, X.; Du, X.; Su, W. Effects of anode surface modification on the performance of low temperature SOFCs. J. Power Source 2007, 171, 489–494. [Google Scholar]
- Kim, S.-D.; Lee, J.-J.; Moon, H.; Hyun, S.-H.; Moon, J.; Kim, J.; Lee, H.-W. Effects of anode and electrolyte microstructures on performance of solid oxide fuel cells. J. Power Source 2007, 169, 265–270. [Google Scholar] [CrossRef]
- Singhal, S. Solid oxide fuel cells for stationary, mobile, and military applications. Solid State Ion. 2002, 152, 405–410. [Google Scholar] [CrossRef]
- Anwar, M.; Kumar, S.; Arshi, N.; Ahmed, F.; Seo, Y.; Lee, C.; Koo, B.H. Structural and optical study of samarium doped cerium oxide thin films prepared by electron beam evaporation. J. Alloys Compd. 2011, 509, 4525–4529. [Google Scholar] [CrossRef]
- Stambouli, A.; Traversa, E. Solid oxide fuel cells (SOFCs): A review of an environmentally clean and efficient source of energy. Renew. Sustain. Energy Rev. 2002, 6, 433–455. [Google Scholar] [CrossRef]
- Kulkarni, S.; Duttagupta, S.; Phatak, G. Taguchi design of experiments for optimization of ionic conductivity in nanocrystalline Gadolinium doped Ceria. Ceram. Int. 2015, 41, 8973–8980. [Google Scholar] [CrossRef]
- Burke, J.E. Role of Grain Boundaries in Sintering; Springer: Dordrecht, The Netherlands, 1990. [Google Scholar]
- Murutoglu, M.; Ucun, T.; Ulasan, O.; Buyukaksoy, A.; Tur, Y.K.; Yilmaz, H. Cold sintering-assisted densification of GDC electrolytes for SOFC applications. Int. J. Hydrogen Energy 2022, 47, 19772–19779. [Google Scholar] [CrossRef]
- Lv, Z.; Yao, P.; Guo, R.; Dai, F. Study on zirconia solid electrolytes doped by complex additives. Mater. Sci. Eng. A 2007, 458, 355–360. [Google Scholar] [CrossRef]
- Bjørk, R.; Tikare, V.; Frandsen, H.L.; Pryds, N. The Effect of Particle Size Distributions on the Microstructural Evolution During Sintering. J. Am. Ceram. Soc. 2012, 96, 103–110. [Google Scholar] [CrossRef] [Green Version]
- Chaim, R.; Chevallier, G.; Weibel, A.; Estournès, C. Grain growth during spark plasma and flash sintering of ceramic nanoparticles: A review. J. Mater. Sci. 2017, 53, 3087–3105. [Google Scholar] [CrossRef] [Green Version]
- Miyake, K.; Hirata, Y.; Shimonosono, T.; Sameshima, S. The Effect of Particle Shape on Sintering Behavior and Compressive Strength of Porous Alumina. Materials 2018, 11, 1137. [Google Scholar] [CrossRef] [PubMed] [Green Version]
- Rehman, S.U.; Shaur, A.; Kim, H.; Joh, D.W.; Song, R.; Lim, T.; Hong, J.; Park, S.; Lee, S. Effect of transition metal doping on the sintering and electrochemical properties of GDC buffer layer in SOFCs. Int. J. Appl. Ceram. Technol. 2020, 18, 511–524. [Google Scholar] [CrossRef]
- Accardo, G.; Bae, J.K.; Yoon, S.P. Evaluation of the Microstructure and the Electrochemical Properties of Ce0.8(1−x)Gd0.2(1−x)CuxO [1.9(1−x)+x] Electrolytes for IT-SOFCs. Appl. Sci. 2020, 10, 4573. [Google Scholar] [CrossRef]
- Grilo, J.P.D.F.; Macedo, D.A.; Nascimento, R.M.D.; Marques, F.M. Performance of GDC with alkali metal carbonates as sintering aids. Solid State Ion. 2020, 346, 115221. [Google Scholar] [CrossRef]
- Acccardo, G.; Frattini, D.; Ham, H.C.; Yoon, S.P. Direct addition of lithium and cobalt precursors to Ce0.8Gd0.2O1.95 electrolytes to improve microstructural and electrochemical properties in ITSOFC at lower sintering temperature. Ceram. Int. 2019, 45, 9348–9358. [Google Scholar] [CrossRef]
- Accardo, G.; Audasso, E.; Yoon, S.P. Unravelling the synergistic effect on ionic transport and sintering temperature of nanocrystalline CeO2 tri-doped with Li Bi and Gd as dense electrolyte for solid oxide fuel cells. J. Alloys Compd. 2022, 898, 162880. [Google Scholar] [CrossRef]
- Ishii, A.; Ishijima, H.; Kobayashi, K.; Oikawa, I.; Takamura, H. Insight into low-temperature sintering of samarium-doped ceria mixed with scavenging lithium. Acta Mater. 2021, 224, 117529. [Google Scholar] [CrossRef]
- Taguchi, G.; Cariapa, V. Taguchi on Robust Technology Development. J. Press. Vessel Technol. 1993, 115, 336–337. [Google Scholar] [CrossRef]
- Mori, T.; Tsai, S.C. Taguchi Methods: Benefits, Impacts, Mathematics, Statistics, and Applications; ASME Press: New York, NY, USA, 2011. [Google Scholar]
- Korkmaz, A.A. Optimization of Smokeless Fuel Production from Lignite by Taguchi Orthogonal Design. Solid Fuel Chem. 2021, 55, 444–449. [Google Scholar] [CrossRef]
- Ghaemi, N.; Slade, R.C.; Horri, B.A. A benzoate coprecipitation route for synthesizing nanocrystalline GDC powder with lowered sintering temperature. Ceram. Int. 2021, 47, 20009–20018. [Google Scholar] [CrossRef]
- Lyu, Q.; Zhu, T.; Qu, H.; Sun, Z.; Sun, K.; Zhong, Q.; Han, M. Lower down both ohmic and cathode polarization resistances of solid oxide fuel cell via hydrothermal modified gadolinia doped ceria barrier layer. J. Eur. Ceram. Soc. 2021, 41, 5931–5938. [Google Scholar] [CrossRef]
- Costilla-Aguilar, S.; Pech-Canul, M.; Escudero, M.; Cienfuegos-Pelaes, R.; Aguilar-Martínez, J. Gadolinium doped ceria nanostructured oxide for intermediate temperature solid oxide fuel cells. J. Alloys Compd. 2021, 878, 160444. [Google Scholar] [CrossRef]
- Mishra, T.P.; Lenser, C.; Raj, R.; Guillon, O.; Bram, M. Development of a processing map for safe flash sintering of gadolinium-doped ceria. J. Am. Ceram. Soc. 2021, 104, 4316–4328. [Google Scholar] [CrossRef]
- Zhao, P.; Ge, S.; Yoshikawa, K. An orthogonal experimental study on solid fuel production from sewage sludge by employing steam explosion. Appl. Energy 2013, 112, 1213–1221. [Google Scholar] [CrossRef]
- Zhou, X.; Zhou, F. Application of La0.3Sr0.7Fe0.7Ti0.3O3-δ/GDC electrolyte in LT-SOFC. Int. J. Hydrogen Energy 2021, 46, 9988–9995. [Google Scholar] [CrossRef]
- Wang, S.; Kobayashi, T.; Dokiya, M.; Hashimoto, T. Electrical and Ionic Conductivity of Gd-Doped Ceria. J. Electrochem. Soc. 2000, 147, 3606–3609. [Google Scholar] [CrossRef]
- Liu, Q.; Chan, S.; Fu, C.; Pasciak, G. Fabrication and characterization of large-size electrolyte/anode bilayer structures for low-temperature solid oxide fuel cell stack based on gadolinia-doped ceria electrolyte. Electrochem. Commun. 2009, 11, 871–874. [Google Scholar] [CrossRef]
- Gil, V.; Tartaj, J.; Moure, C.; Duran, P. Rapid Densification by Using Bi2O3 as an Aid for Sintering of Gadolinia-doped Ceria Ceramics. Ceram. Int. 2007, 33, 471–475. [Google Scholar] [CrossRef]
- Song, X.; Liao, D.; Lian, Z.; Chen, F.; Peng, K. Effects of monovalent alkali metals on grain boundary conductivity and electrochemical properties of gadolinia-doped ceria electrolyte. Ceram. Int. 2021, 47, 18773–18782. [Google Scholar] [CrossRef]
- Christoph, K. Process for the Production of Doped Cerium Oxide Ceramics. EP1000913, 13 November 1998. [Google Scholar]


| Equipment | Manufacturer | Type |
|---|---|---|
| Three-roll grinder | ZYE | ZYTR-50 |
| Homogenizer | ZYE | ZYMC-200V |
| Vacuum dryer | AISET | YLE-2000 |
| Manual infrared tablet press | Tianjin Optical Instruments | FW-4 24T |
| High-temperature sintering furnace | Hefei Kejing | KSL-1700X |
| Tube sintering furnace | Hefei Kejing | OTF-1200X |
| Electrochemical analyzer | Metrohm | AUT302N |
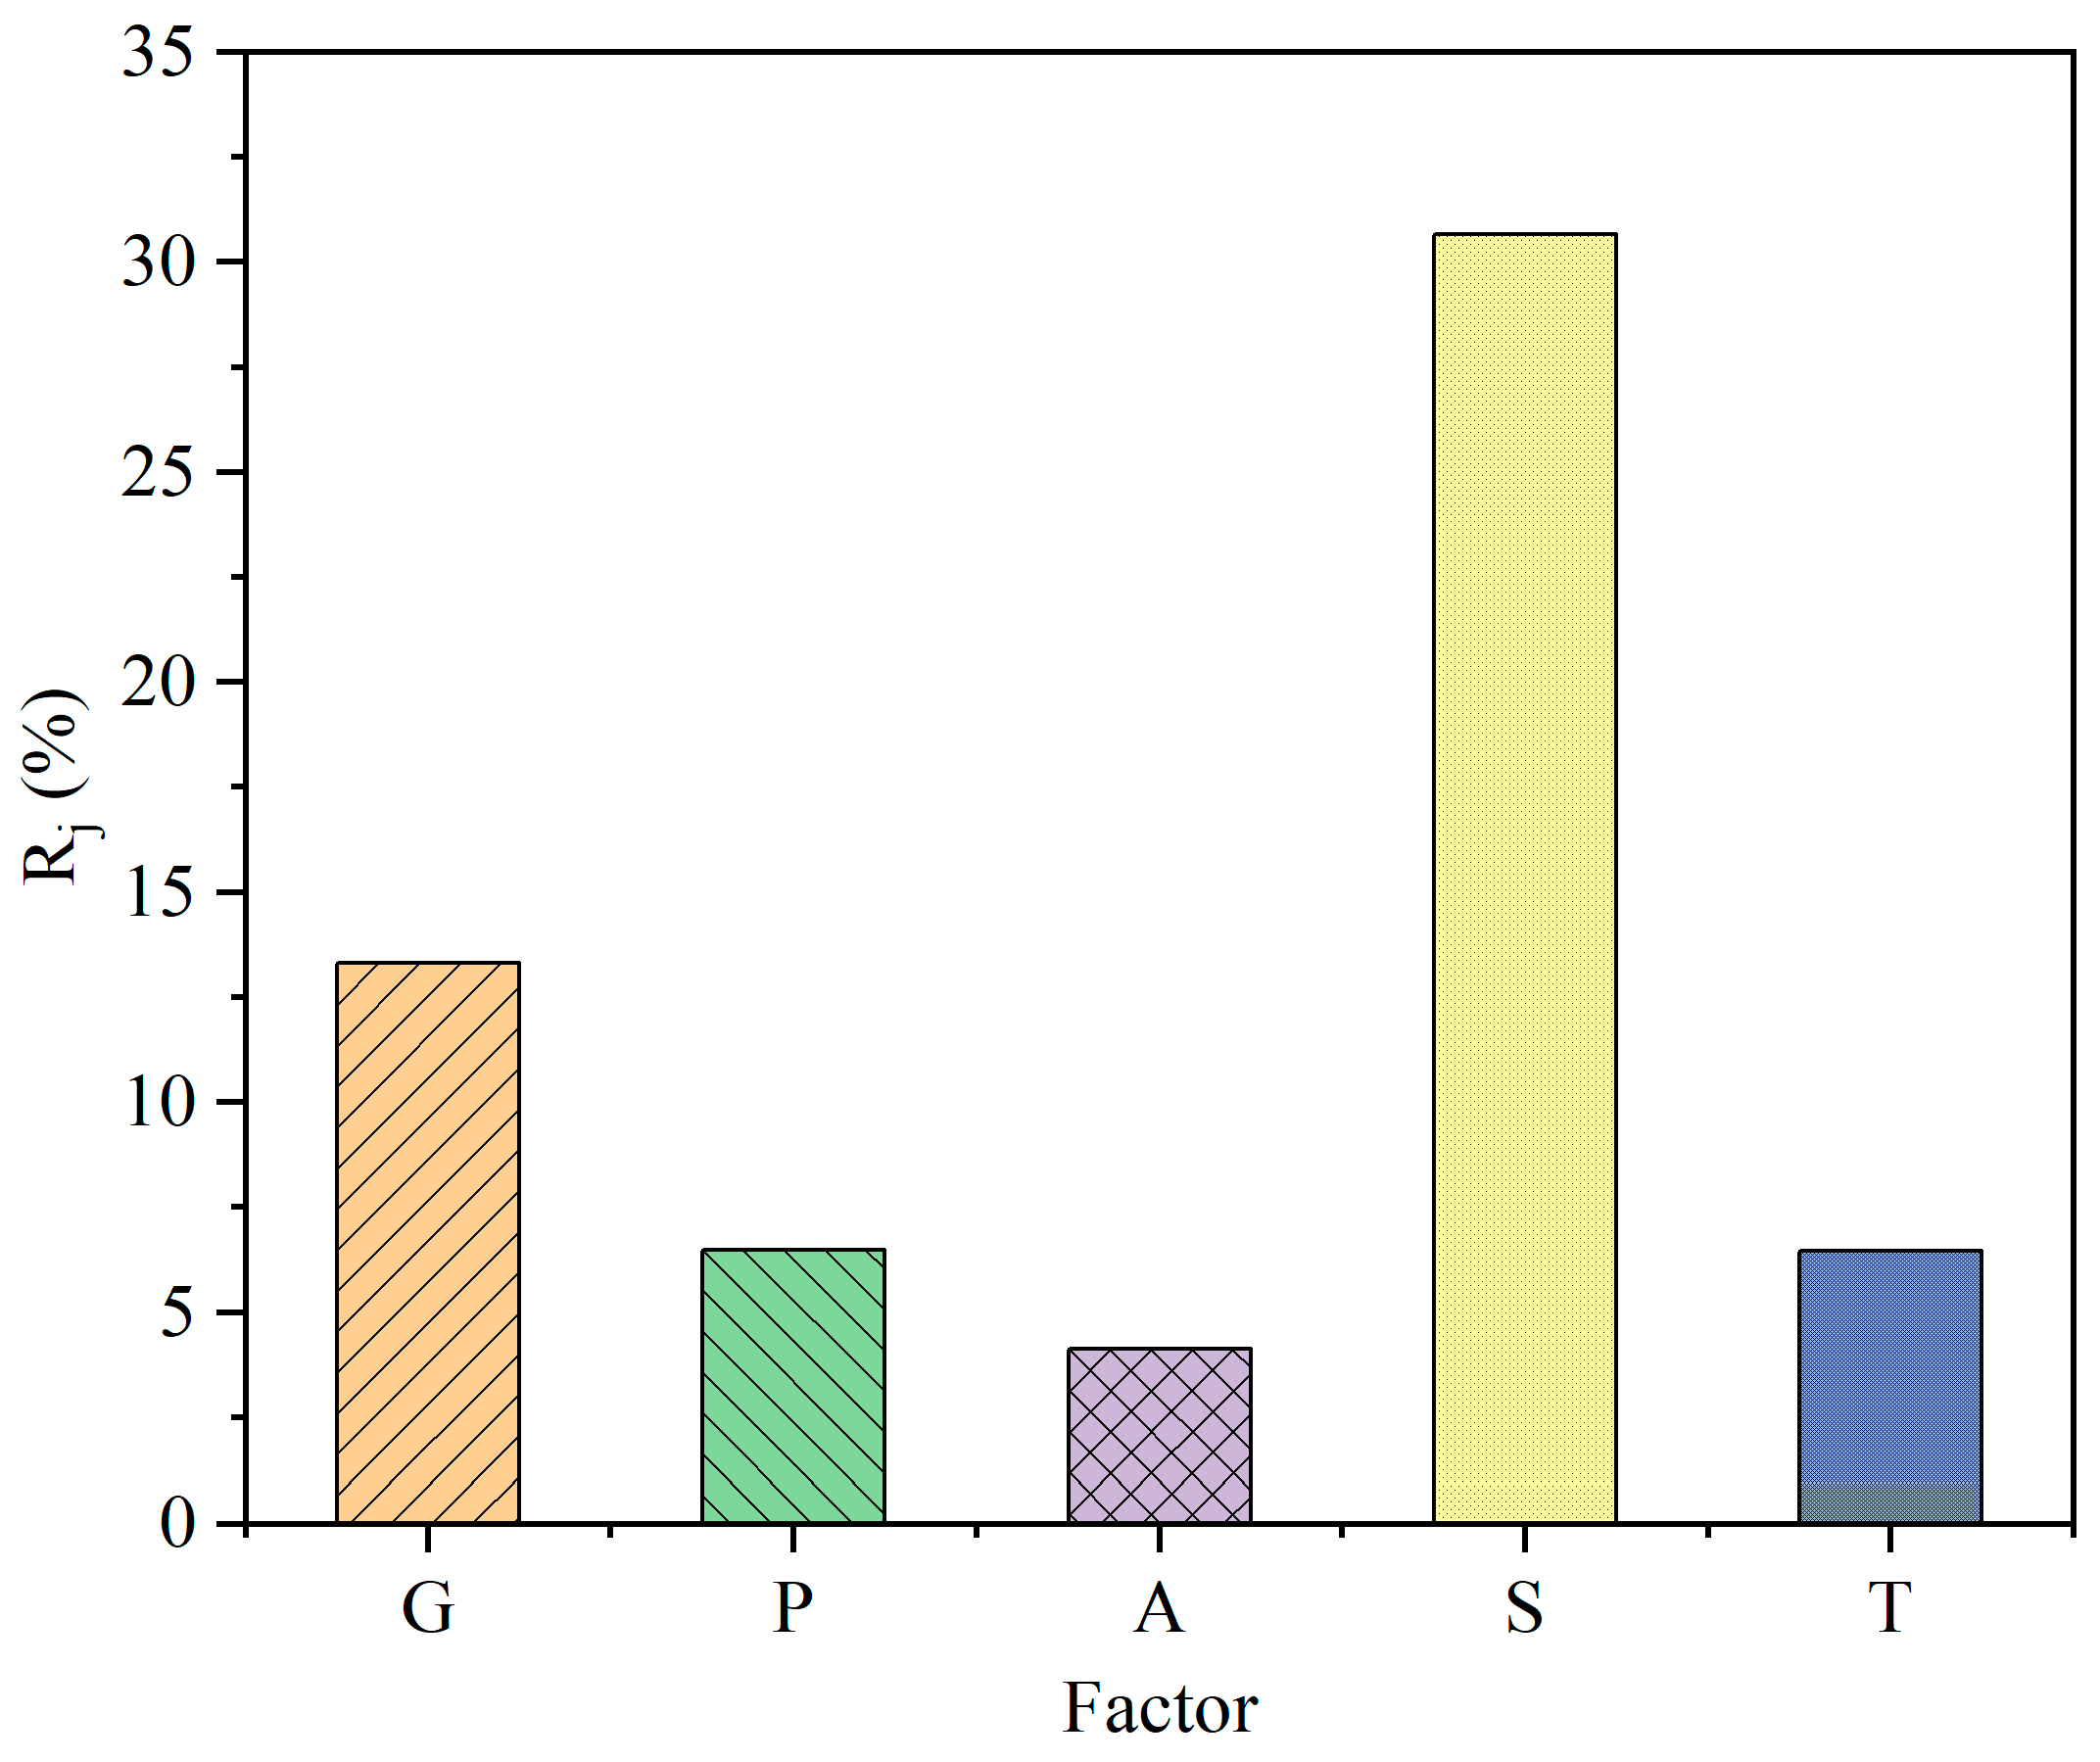
| Symbol | Factors | Level 1 | Level 2 | Level 3 | Level 4 |
|---|---|---|---|---|---|
| G | Particle size (nm) | 150 | 300 | 500 | 700 |
| P | Uniaxial pressure (MPa) | 20 | 10 | 30 | 15 |
| A | Binder mass (g) | 0.56 | 0.8 | 0.3 | 0.1 |
| S | Sintering aid mass (g) | 0.076 | 0.02 | 0.01 | 0 |
| T | Sintering temperature (°C) | 950 | 1050 | 1010 | 1000 |
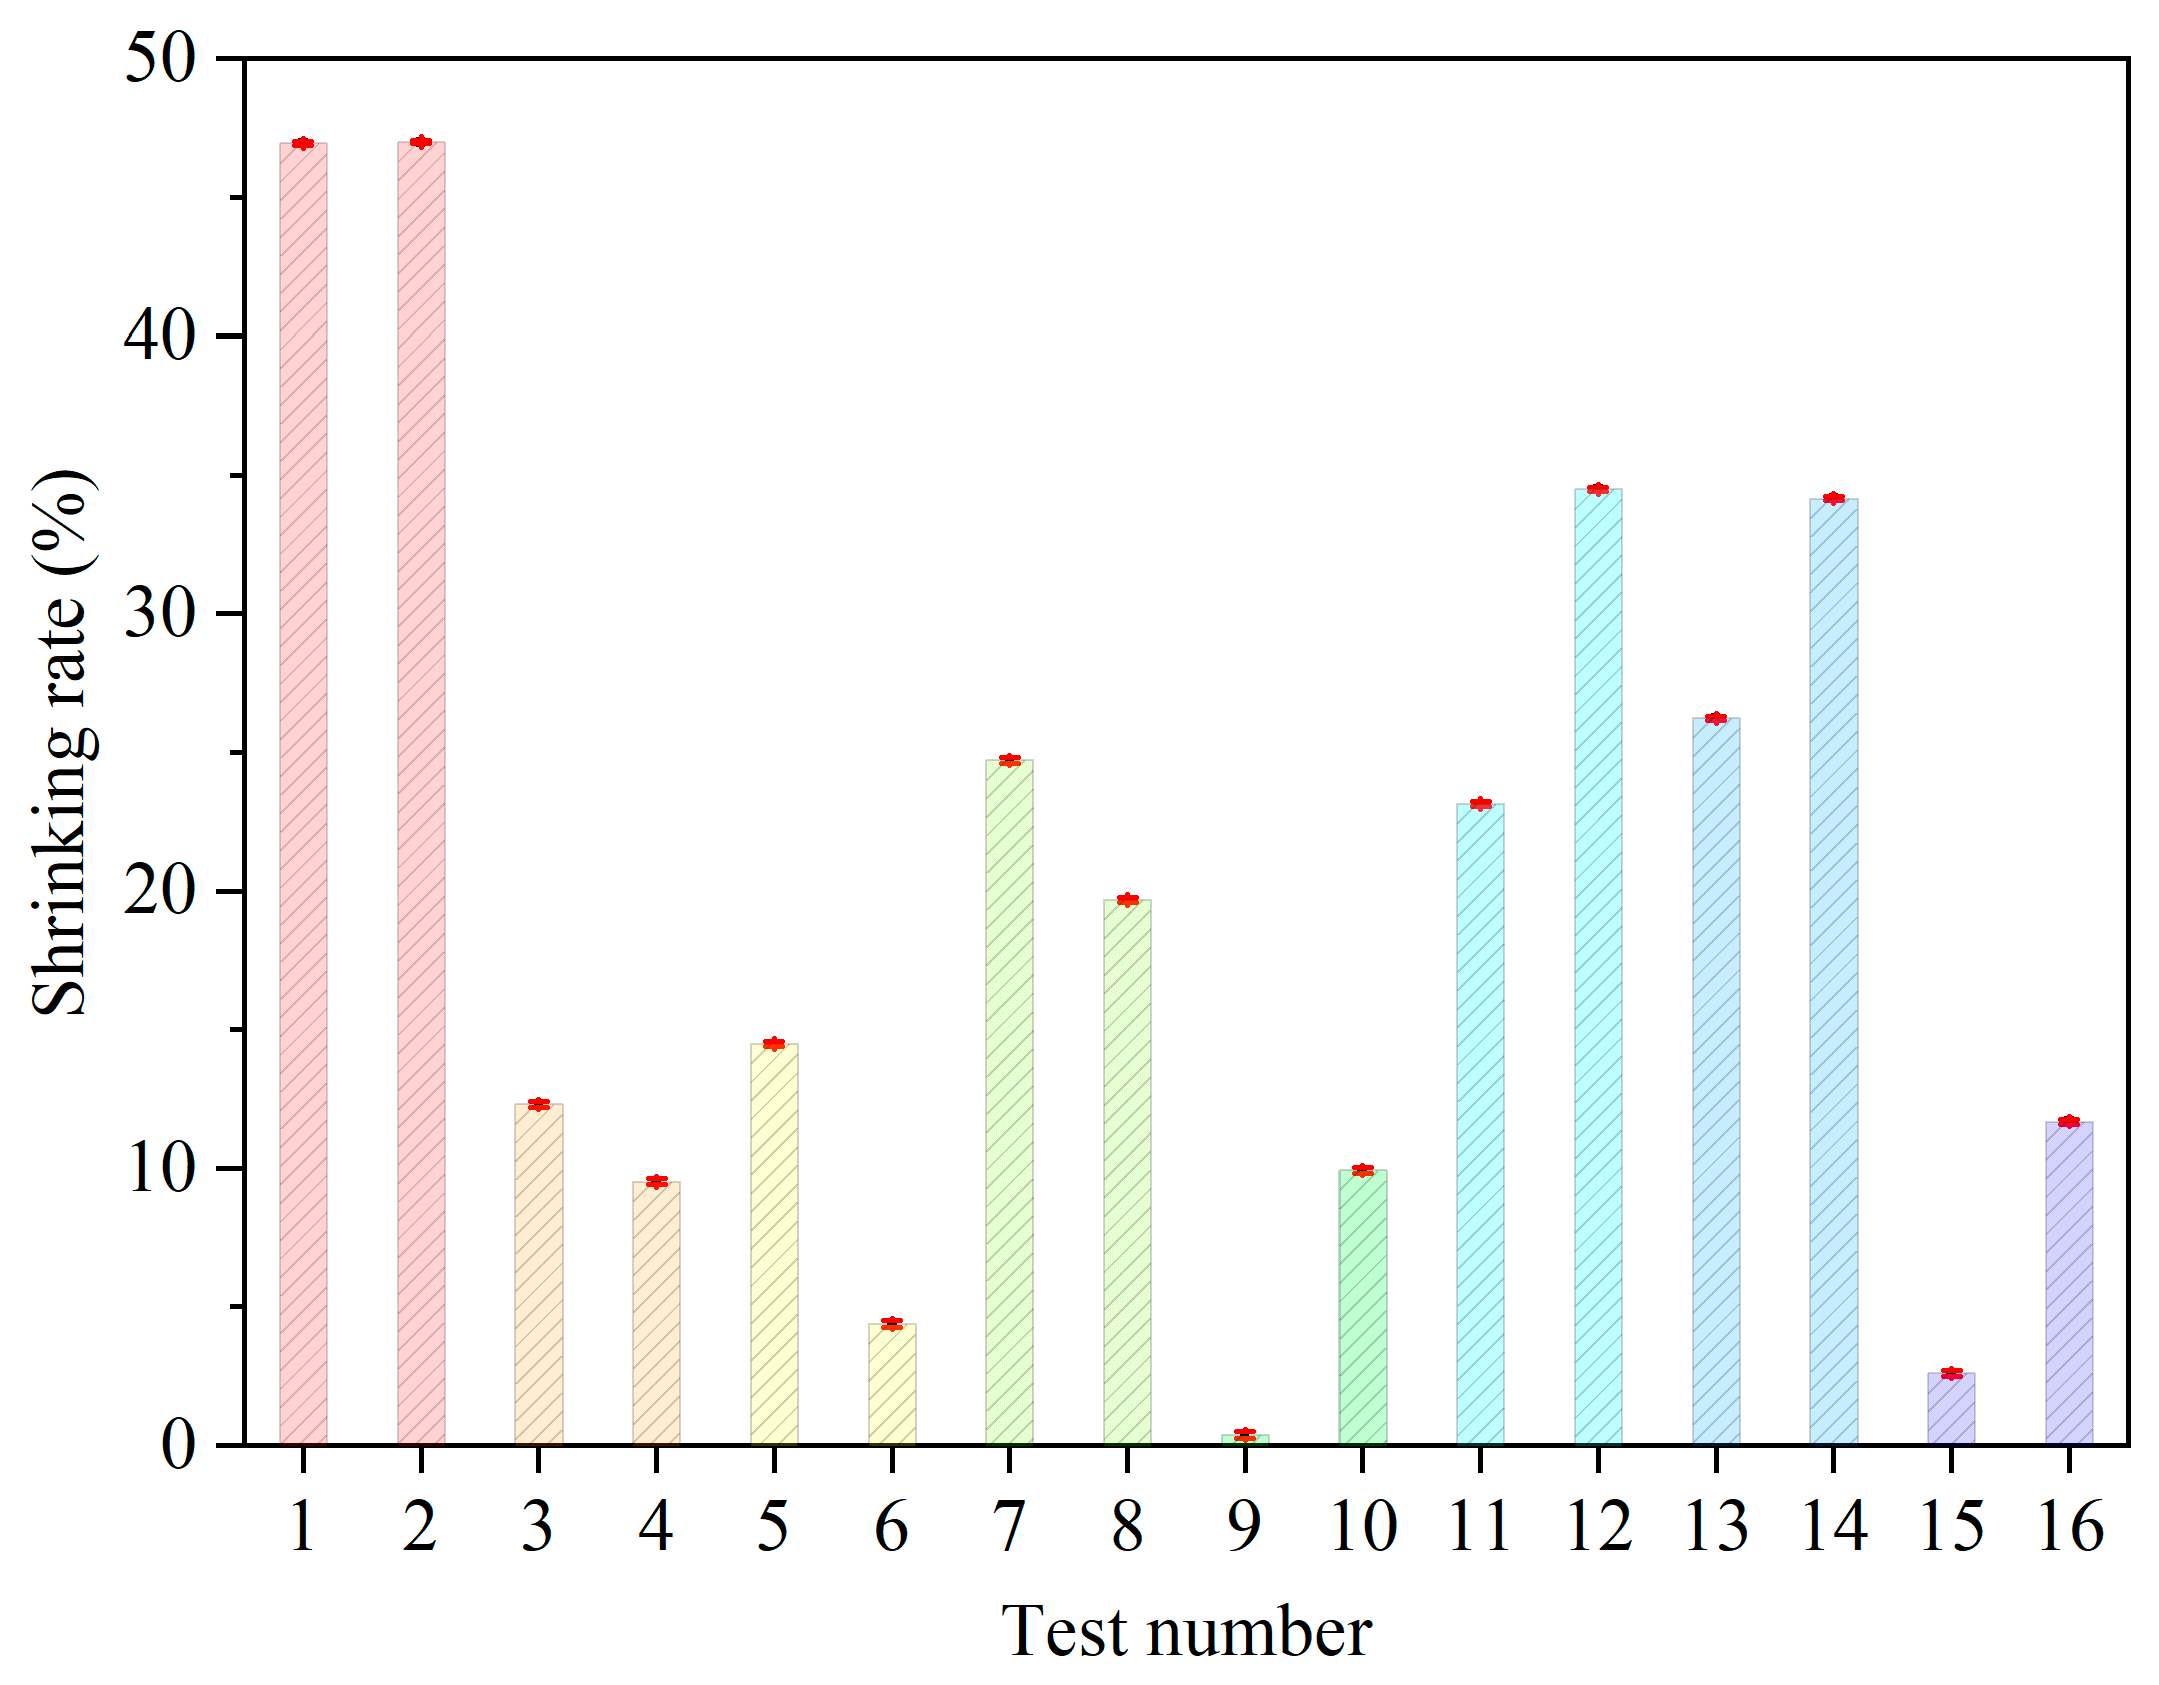
| Case No. | Factors | ||||
|---|---|---|---|---|---|
| G | P | A | S | T | |
| 1 | 1 | 1 | 1 | 1 | 1 |
| 2 | 1 | 2 | 2 | 2 | 2 |
| 3 | 1 | 3 | 3 | 3 | 3 |
| 4 | 1 | 4 | 4 | 4 | 4 |
| 5 | 2 | 1 | 2 | 3 | 4 |
| 6 | 2 | 2 | 1 | 4 | 3 |
| 7 | 2 | 3 | 4 | 1 | 2 |
| 8 | 2 | 4 | 3 | 2 | 1 |
| 9 | 3 | 1 | 3 | 4 | 2 |
| 10 | 3 | 2 | 4 | 3 | 1 |
| 11 | 3 | 3 | 1 | 2 | 4 |
| 12 | 3 | 4 | 2 | 1 | 3 |
| 13 | 4 | 1 | 4 | 2 | 3 |
| 14 | 4 | 2 | 3 | 1 | 4 |
| 15 | 4 | 3 | 2 | 4 | 1 |
| 16 | 4 | 4 | 1 | 3 | 2 |
| Value | G | P | A | S | T |
|---|---|---|---|---|---|
| 115.849 | 87.957 | 86.138 | 139.576 | 63.349 | |
| 62.552 | 95.662 | 98.733 | 116.215 | 107.302 | |
| 67.900 | 61.965 | 66.425 | 48.271 | 89.214 | |
| 74.625 | 75.341 | 69.629 | 16.863 | 61.060 | |
| 28.962 | 21.989 | 21.535 | 34.894 | 15.837 | |
| 15.638 | 23.915 | 24.683 | 29.054 | 26.826 | |
| 16.975 | 15.491 | 16.606 | 12.068 | 22.303 | |
| 18.656 | 18.835 | 17.407 | 4.216 | 15.265 | |
| 13.324 | 6.498 | 4.127 | 30.678 | 6.466 |
Publisher’s Note: MDPI stays neutral with regard to jurisdictional claims in published maps and institutional affiliations. |
© 2022 by the authors. Licensee MDPI, Basel, Switzerland. This article is an open access article distributed under the terms and conditions of the Creative Commons Attribution (CC BY) license (https://creativecommons.org/licenses/by/4.0/).
Share and Cite
Zhang, M.; An, L.; Wang, E.; Wang, H.; Ouyang, M.; Hu, H. Effects of Sintering Parameters on the Low-Temperature Densification of GDC Electrolyte Based on an Orthogonal Experiment. Catalysts 2022, 12, 831. https://doi.org/10.3390/catal12080831
Zhang M, An L, Wang E, Wang H, Ouyang M, Hu H. Effects of Sintering Parameters on the Low-Temperature Densification of GDC Electrolyte Based on an Orthogonal Experiment. Catalysts. 2022; 12(8):831. https://doi.org/10.3390/catal12080831
Chicago/Turabian StyleZhang, Mengru, Lisha An, Enhua Wang, Hewu Wang, Minggao Ouyang, and Haoran Hu. 2022. "Effects of Sintering Parameters on the Low-Temperature Densification of GDC Electrolyte Based on an Orthogonal Experiment" Catalysts 12, no. 8: 831. https://doi.org/10.3390/catal12080831
APA StyleZhang, M., An, L., Wang, E., Wang, H., Ouyang, M., & Hu, H. (2022). Effects of Sintering Parameters on the Low-Temperature Densification of GDC Electrolyte Based on an Orthogonal Experiment. Catalysts, 12(8), 831. https://doi.org/10.3390/catal12080831