Article

Elucidating Evidence for the In Situ Reduction of Graphene Oxide by Magnesium Hydride and the Consequence of Reduction on Hydrogen Storage

Nanoengineering Research Group, Centre for Mechanical Technology and Automation (TEMA), Department of Mechanical Engineering, University of Aveiro, 3810-193 Aveiro, Portugal
*
Author to whom correspondence should be addressed.
Catalysts 2022, 12(7), 735; https://doi.org/10.3390/catal12070735
Submission received: 5 June 2022 / Revised: 29 June 2022 / Accepted: 30 June 2022 / Published: 2 July 2022
(This article belongs to the Special Issue Advanced Materials for Application in Catalysis)

Abstract

:
The current study highlights important information regarding how graphene oxide (GO) additive interacts with magnesium hydride (MgH2) and transforms to reduced graphene oxide (rGO). A mild reduction occurs during mechanical milling itself, whereas a strong reduction of GO happens concurrently with the oxidation of Mg formed during the dehydrogenation of MgH2. Owing to the in situ transformation of GO to rGO, the dehydrogenation temperature of MgH2 reduces by about 60 °C, whereas the hydrogen ab/desorption reaction kinetics of MgH2 increases by two orders of magnitude and the dehydrogenation activation energy decreases by about 20 kJ/mol. We have thoroughly scrutinized the transformation of GO to rGO by differential scanning calorimetry (DSC), X-ray diffraction (XRD), Raman spectroscopy, Fourier transform infrared (FTIR) spectroscopy and atomic force microscopy (AFM) techniques. Interestingly, the GO to rGO transformation triggered by magnesium hydride in the current study further paves the way for the facile preparation of rGO- and MgO-decked rGO composites, which are important materials for energy storage applications.

1. Introduction

Hydrogen fuel cell vehicles require an onboard hydrogen supply unit which can deliver at least 5.5 wt.% H2 for 1500 cycles at temperatures, <85 °C and pressures, 5–12 bars [1]. To date, no report is available for any hydrogen storage materials with the ability to solve these requirements. On the other hand, the reversible binary hydride, MgH2, is a promising material under the US department of energy (USDOE) hydrogen storage target considerations, except that >350 °C is required for the liberation of hydrogen [2]. Researchers demonstrated that the hydrogen desorption temperature of MgH2 can be lowered substantially by incorporating suitable additives [3,4,5,6,7,8,9,10,11,12,13,14,15]. Additives from the categories of metal oxides [3], transition metals [4,5], rock salts [6,7], intermetallic alloys [8], nitrides [9], halides [10,11] and carbon nanostructures [12,13,14,15] were found to be impactful for MgH2. Specifically, carbon nanostructures were proposed by various researchers because of the higher contact surface area and the ability to provide catalytically active contact surfaces. In recent years graphene oxide (GO)/reduced graphene oxide (rGO) functionalized nanostructures have become increasingly popular for MgH2 and various interesting results can be observed in the literature [16,17,18,19,20,21,22].
Liu et al. [16] tested Fe-, Ni- and FeNi3-anchored rGO nanostructures as additives for MgH2 and found that FeNi3 containing rGO is the best-performing among these three additives. It was found that the bimetallic FeNi3 species from the FeNi3@rGO nanostructure interact with MgH2 and form Mg2NiH4 and Fe nanoparticles. Based upon this observation, the authors attributed the catalytic activity with a synergetic effect involving the possible existence of highly distributed catalytic centers. Liu et al. also tested the effect of NiCu-decorated rGO nanosheets as an additive for MgH2 [17] and found that NiCu@rGO performs better than NiCu alone as an additive for MgH2. In yet another study, Liu et al. prepared xTiO2@rGO (x = 30, 40, 50 and 70, by weight) [18] and found that 70TiO2@rGO is the most beneficial among these additives for MgH2. The titania existing in this structure is reduced in situ, and hence the catalytic activity was attributed to a charge transfer interaction between Mg2+, H and the additive. Wang et al. [19] showed that graphene oxide in porous form makes an excellent scaffold material for confining MgH2 nanoparticles. Zhang et al. [20] used CoMoO4 nanoparticles-decorated rGO as additive for MgH2 and found that a 10 wt.% CoMoO4-rGO-added MgH2 releases hydrogen at temperatures around 200 °C. Further sample testing proved that the sample contains Mo, Co7Mo6 and MgO, hence, a synergetic effect of these species was proposed to be the reason for the better system performance. In another study, Ji et al. [21] tested FeNi-decorated rGO as additive for MgH2 and found that the sample exhibits consistent performance up to 50 cycles. It was also found that the powder contains Mg2Ni/Mg2NiH4, Fe particles and, hence, the authors correlated the observed effect with synergy and the prevention of agglomeration of MgH2 particles. Yao et al. [22] prepared Nix@rGOy (x = 2–6 and y = 4–8) nanostructures and found that MgH2 loaded with 10 wt.% of this additive releases hydrogen at 190 °C. The Ni in this structure reacts with Mg/MgH2 and leads to the formation of Mg2Ni/Mg2NiH4 nanoparticles. Based upon this, the catalytic activity was attributed to the nano-scale size of the evolved species and its consequence on influencing Mg-H bonding.
The above studies provide interesting insights regarding the chemical interaction of secondary nanostructures which are supported on GO/rGO assemblies. Nonetheless, in most such studies the chemical interaction of GO/rGO alone with Mg/MgH2 is overlooked, possibly because GO is considered a stable oxide, and one could assume that it remains intact during all stages of H absorption/desorption measurements. However, to the best of our experience on various types of metal oxides, we cannot overlook the possibility of slow reduction of any oxide additive(s) over H charge/discharge cycles [23]. A thorough insight into how GO alone interacts with MgH2 needs to be explored because the mechanical stability of secondary nanostructures-anchored GO may depend on the continued intactness of GO supports over repeated cycles. Considering this, in the present study we initially investigated the effect of introducing a 5 wt.% of GO as an additive for MgH2. Our study provides crucial evidence that there indeed exists an in situ transformation of GO to rGO due to the interaction between GO and MgH2 under mechano-thermal conditions. Systematic sample testing was performed by calorimetry, X-ray diffraction, Raman spectroscopy, FT-IR spectroscopy, atomic force microscopy and volumetric measurement techniques. The details regarding the positive influence of GO to rGO transformation on the hydrogen storage behavior of MgH2 are further highlighted.
To understand the catalysis of any metal oxide additives-incorporated MgH2, it is essential to know how the additive chemically interacts with MgH2. In view of this, recently the current team has also investigated a few other metal oxides (e.g., Nb2O5, TiO2, ZrO2 and CeO2) and the reader is encouraged to follow these publications [6,7,24,25,26,27,28]. A thorough understanding of how each oxide compares or contrasts with the other oxide would help us to explore a generalized catalytic reaction mechanism for oxides-incorporated MgH2 for hydrogen storage. In this context we believe that the current study will provide us with very useful further insights for exploring the catalysis of catalytically modified MgH2.

2. Results

To find the influence of graphene oxide (A1) as additive for MgH2, we tested the dehydrogenation behavior of a 5 wt.% GO incorporated MgH2. We used a mild milling condition, 150 rpm for 2 h, to avoid potential mechanically induced structural disturbances for GO. The isothermal dehydrogenation kinetics of this as-prepared sample was tested at 315 °C and the observed profile is demonstrated in Figure 1 (profile “a”). After dehydrogenation, hydrogen was restored (6 bar/315 °C) and the dehydrogenation kinetics of the hydrogen-restored sample was again tested at the same temperature (315 °C). The observed kinetics profile for this sample can be identified as profile “b” in Figure 1. As one can see, the kinetics obtained for the hydrogen-restored sample was better than the starting sample. This signifies that the catalytic effect of the additive in the powder has improved after the initial hydrogen desorption of the sample. After this observation, our interest was to identify what made the catalytic improvement in this sample. Note that the isothermal measurements were performed under identical conditions for both cases, except that the recycled sample (profile “b”) underwent an additional hydrogenation treatment. It is therefore understandable that the possibility of chemical interaction between GO and MgH2 is higher in the recycled sample. Nonetheless, this logical assertion requires further experimental support, and in this context, our sample characterization results, provided in the following sections, aim to provide understanding of the interaction between GO and MgH2.
Initially, the samples used for isothermal dehydrogenation (i.e., 5 wt.% GO (A1) loaded starting sample and the hydrogen-restored sample) were examined by X-ray diffraction technique. The obtained XRD profiles were indexed as “a’’ and “b” in Figure 2 (profile “a’’ corresponds to the as-prepared starting sample and “b” corresponds to the hydrogen-restored sample). In the starting sample (profile “a”) we can identify the normally expected Mg and MgH2 peaks. On the other hand, in the hydrogen-restored sample (profile “b”) we can also see a new peak positioned at 42.6°, which corresponds to MgO. It may be an interesting clue that GO and MgH2 interact during the thermal treatment which results in the reduction of GO and oxidation of Mg. Nonetheless, further proof is needed as Mg/MgH2 surfaces can be prone to get oxidized by the existence of any accidentally intruded oxygen during the measurement. In light of this, we have made two modifications in the way we introduce the 5 wt.% additive to the main hydride MgH2. These are (i) the 5 wt.% additive was mechano-chemically reacted with an equal amount of MgH2 separately (i.e., 1:1 weight ratio) and then deployed as additive for MgH2 (additive code A2), (ii) the mechano-chemically reacted powder (i.e., A2) was heated at 315 °C under pure hydrogen atmosphere for 10 h and the obtained material was used as additive (additive code A3) for MgH2 (here we chose 10 h because the total isothermal dehydrogenation time that we assigned for our test samples is 10 h (see Figure 1). For more information regarding the sample preparation protocols for A1, A2 and A3, see Materials and Methods section. Incorporation of A2 and A3 as additives for MgH2 was made under identical experimental conditions as those made for A1-loaded MgH2.
After the preparation of these samples, to obtain a comparative picture of the catalytic activity of additives A1, A2 and A3 for MgH2, initially we recorded the differential scanning calorimetry (DSC) profiles for the A1-, A2- and A3-added MgH2 samples (Figure 3). As seen in Figure 3, the endothermic peak maxima obtained for A1-loaded MgH2 occurs at a higher temperature than that observed for A2- and A3-loaded MgH2 samples. The A2-loaded sample provides a desorption peak maximum at a 30 °C lower temperature, whereas the A3-loaded sample provides an endothermic peak maximum at ~330 °C which is ~60 °C lower compared to the peak maxima noted for the A1-loaded MgH2. Particularly, the onset temperature observed for the A3-loaded sample is ~285 °C, which is roughly ~70 °C lower than that observed for the A1-loaded MgH2 sample. This DSC test clearly shows that A2 and A3, especially the latter, possess superior catalytic activity as compared to A1. After exploring this information, our interest was to identify what chemical species exist in samples A2 and A3. In view of this, XRD was performed for samples A1, A2 and A3 and the observed profiles are provided in Figure 4. As can be seen, in the case of A1 one can identify the maximum intensity peak (001) positioned at 10.5°, typically representing the unique crystallographic identity of GO. In the case of A2, we can observe Mg and MgH2 peaks, which are expected because the precursors of A2 are GO and MgH2 in a 1:1 weight ratio. One notable observation in this pattern is that the (001) peak corresponding to GO has shifted from 10.5° to 12.5°. It suggests that during the mechanical milling itself a marginal reduction of GO occurs due to its interaction with MgH2. In the case of A3, the (001) peak of GO totally disappeared and we observed a new broad peak at 25.8°, which corresponds to rGO [29]. Interestingly, in addition to this information we have also observed dominant MgO peaks in this sample, clearly indicating that GO and MgH2 have chemically interacted and transformed to rGO and MgO. This is interesting because the GO reduction in the present case is a simple one-step process that may be competitive with some of the best GO reduction strategies discussed in the literature [30,31].
After this interesting observation regarding the chemical interaction between GO and MgH2, for further evidence we have tested the samples A1, A2 and A3 by Raman spectroscopy and Fourier Transform Infrared (FTIR) spectroscopy. The Raman spectra corresponding to samples A1, A2 and A3 are shown in Figure 5. In all these three spectra, the defect band (D) and the graphitic band (G) can be seen clearly. The G band occurs due to the in-plane vibrations of sp2 bonded carbon atoms, whereas the presence of the D band is due to the out-of-plane vibrations caused by common defects, functional attachments, and breakages in the structural network. In Figure 5, the defect band to graphitic band intensity ratio (ID/IG) is higher in the case of A3 as compared to A1 and A2, which is fine evidence for the transformation of GO to rGO. The rGO structure contains various defect sites due to broken bonds [32], and these sites can be highly effective for catalytic interactions. This is in good agreement with the trend observed in the DSC study (Figure 3).
Proceeding with this information, we have also recorded IR spectra for the samples A1, A2 and A3 (Figure 6). In a typical IR profile for GO, the broad peak at 3415 cm−1 is due to the OH groups. The peaks at 1731 cm−1, 1623 cm−1, and 1230 cm−1, respectively, correspond to the stretching of carboxylic acid functional groups, sp2 hybridized carbon in the graphene oxide network, and the epoxy symmetric ring deformation [33]. The tertiary C–OH group provides the peak signature at 1398 cm−1 and the C–OH stretching can be identified by the peak at 1050 cm−1 [34]. All the aforesaid peaks are invariably seen for the sample A1. Interestingly, the disappearance of the peak at 1731 cm−1, which is highlighted by the red dotted line, suggests the decomposition of the carboxyl group [35] in samples A2 and A3, especially in the latter. In samples A2 and A3, the existence of a minor peak at 1559 cm−1 reveals the restoration of sp2 carbon networks in these structures. In the sample A3, existence of a new peak at 440 cm−1 is due to the Mg–O-stretching interaction [36,37]. This information provides strong additional supports that MgH2 and GO indeed react during thermal treatment under hydrogen ambience. The interaction not only led to the reduction of GO, but also to the oxidation of magnesium.
After accomplishing the Raman and IR spectroscopy studies, we have also tested the samples A1, A2 and A3 by Atomic Force Microscopy (AFM). For each sample, the 2D, 3D AFM images and the thickness profiles are shown in Figure 7. Given sequence (left to right): images “a1”, “a2” and “a3” for sample A1; “b1”, “b2” and “b3” for sample A2; “c1”, “c2” and “c3” for sample A3. As shown in images “a1” and “a2”, in the case of sample A1 (i.e., GO) a large-size single GO sheet, part of which flipped and folded over the bottom layer can be identified. The thickness profile corresponding to this sheet is given by “a3” (the region subjected for thickness measurement is indicated by a horizontal line in the AFM inset given in “a3”). The thickness profile indicates that the GO sheet existing in sample A1 is roughly 1.2–1.5 nm thick, suggesting that this flake is likely to be 2 sheets thick (typical thickness for honeycomb carbon network is 0.34 nm [38] and the interlayer distance is 0.76 nm [39]). In the thickness profile “a3”, the high Z axis value for the range x = 0.5–1.2 μm is due to the folding of the GO sheet.
In the case of sample A2, the 2D and 3D images (“b1” and “b2”) reveal the existence of a big sheet together with highly distributed nanoparticles. Since sample A2 is a ball-milled mixture of MgH2 and GO in 1:1 weight ratio, any other object that exists other than the GO sheets in sample A2 could be Mg/MgH2/MgO. Apart from these, the presence of small sheets is also observed in some regions in sample A2. For clarity one such region imaged by us is provided as the inset in image “b1”. Therefore, in the thickness profile (“b3”) we have given two curves, one corresponding to the bulk sheet (red profile) and the other corresponding to a small sheet (green profile). The observed thickness is roughly 0.9 nm for the big sheet, this may be due to the decreased interlayer distance when GO partially transforms to rGO. On the other hand, the thickness observed for the small sheet is only ∼0.4–0.5 nm, which suggests that it may be a monolayer sheet.
The 2D and 3D images corresponding to sample A3 (Figure 7(c1,c2)) reveal the presence of tear-edged, highly dispersed sheets all across the imaged surface. The thickness as calculated from the Figure 7(c3) is within the range of 0.4–1.1 nm. The upper limit is likely to be an exaggerated value, because of the slight flipping at the tear edges of these sheets. Nonetheless it is quite clear that in samples A2 and A3, the existing sheets are thinner than those existing in sample A1. The decreased thickness may be due to the transformation of GO to rGO, and this observation is also supported by XRD, Raman and IR spectroscopy results.
It is interesting to note that the sample tests made for A1, A2 and A3 by DSC, XRD, Raman spectroscopy, FTIR spectroscopy and AFM techniques are in good agreement with each other. Proceeding with these supports, in order to understand the influence of GO to rGO transformation on the hydrogen storage behavior of MgH2, hydrogen desorption/absorption kinetics tests were conducted for the A1, A2 and A3 additives-loaded MgH2 samples at 315 °C. The observed kinetics profiles are provided in Figure 8 (Figure 8a for desorption kinetics and Figure 8b for absorption kinetics).
As seen in Figure 8a, the speed of dehydrogenation reaction exists in the series of A3-A2-A1, clearly indicating that GO to rGO transformation increases the catalytic activity. After the dehydrogenation, the samples were hydrogenated at the same temperature by exposing at 6-bar pure hydrogen atmosphere and the recorded absorption kinetics profiles are demonstrated in Figure 8b. As one can see, the A3-added sample exhibits better absorption kinetics than the A1- and A2-added MgH2 samples. It is also notable that the hydrogen absorption kinetics observed for A1- and A2-added MgH2 are closely identical to each other. This is understandable, because during the dehydrogenation of A1-loaded MgH2 a partial transformation of GO to rGO is expected and its immediate effect impacts on the subsequent hydrogen absorption reaction.
To further understand the extent of improvement in catalytic activity for A1-, A2- and A3-loaded MgH2, we have also conducted an activation energy (Ea) study. For this study, DSC measurements were conducted for A1-, A2- and A3-loaded MgH2 at different heating rates (2, 4, 8 and 12 °C/min) and Kissinger plots were evaluated through the relation mentioned in Equation (1) in the Materials and Methods section. The observed Kissinger plots for A1-, A2- and A3-loaded MgH2 are shown in Figure 9. For ease of understanding, the temperature in degree scale is provided in the top X-axis of this figure. One can easily understand that there exists a big difference in the range of temperatures at which these three systems work. The GO to rGO transformation resulted in a lowering of at least 60 °C under the experimental conditions at which we tested our samples. In Table 1 we have summarized the observed linear equation, calculated activation energy and the observed standard deviations of the Ea values. The activation energy obtained for the A1-loaded sample is 217.8 kJ/mol, which is lowered to 189.6 kJ/mol and 168.8 kJ/mol, respectively, by replacing A1 by A2 and A3 as additives for MgH2. This is yet another proof that transformation of GO to rGO through the interaction between GO and MgH2 results in the improved catalytic activity of the system.

3. Discussion

The results explored in the current study make it clear that graphene oxide chemically interacts with MgH2 and transforms to reduced graphene oxide. This reduction process also leads to the formation of MgO. When this rGO/MgO composite is used as additive for MgH2, the hydrogen ab/de-sorption performance of MgH2 improves significantly. For clarity, in Table 2, we have summarized the important features of A1-, A2- and A3-added MgH2 and compared these with the data reported [28] for additive-free MgH2. The extent of catalytic contribution from MgO alone for MgH2 was discussed by a few researchers in the literature [40,41]. It was suggested that MgO can act as a “process control agent” to prevent the agglomeration of strongly milled MgH2 nanoparticles [40]. Our previous studies also suggested that MgO can be catalytically active for MgH2 if MgO transforms to metal-substituted rock salt, typified by MgxMyOx+y (M is a metal atom, for example, Nb or Ti) [7,36]. Nonetheless, we need to consider that the mild milling operation performed in the current study does not make any considerable size impacts on MgH2 and also that the MgO observed in the current case is a pure undoped rock salt product. Therefore, it is understandable that the other product, rGO, is the responsible species for catalytically improving MgH2. The current team has recently investigated a few other oxides, such as Nb2O5, TiO2, ZrO2, and CeO2 as additives [6,7,24,25,26,27,28,36] for MgH2 and found that all these oxides reduce chemically by interacting with MgH2. It is interesting to note from the current study that GO also follows the same trend.
In a recent study, Liu et al. [16] tested a MgH2 + 5 wt.% Ni3Fe composite powder for hydrogen storage applications. In this study, when an equal amount of 5 wt.% pure Ni3Fe additive was replaced by rGO-supported Ni3Fe (the carbon-to-metal atom ratio in this study is 1:1), the dehydrogenation activation energy lowered by about 22 kJ/mol. In the current study, when A1 is replaced by A2 we observed that Ea decreases by 28 kJ/mol and when A2 is replaced by A3 a further lowering of 21 kJ/mol can be achieved. The observation in both of these studies are in good agreement with each other and it is clear that rGO possesses better catalytic activity than the pure GO additive for MgH2. Regarding the factors responsible for the improved catalytic activity, there are several advantages of rGO over GO. The notable advantages, which are relevant for solid-gas interaction, are the higher surface area of rGO and the existence of unsaturated broken bonds [42].
To the best of our opinion, since graphene derivatives are widely applicable materials [43,44,45,46,47], the observations presented in the current study could be useful beyond the area of hydrogen storage. This is because the chemical reduction of GO involves either expensive processes and/or the release of toxic by-products [30,48,49]. On the other hand, GO to rGO transformation explored in the current study is through a benign hydride MgH2 and the observed process temperature is comparatively low. Moreover, in the literature various research teams use nanoparticles/functional groups decorated on the GO substrate and use them as additives for MgH2 and other hydrogen storage systems. A wide belief in the literature is that the GO substrate is intact and, hence, the stability of the employed structure remains unchanged. Our current study indicates that this assumption is likely to be incorrect, and the reduction of GO may lead to the collapse of the anchored structures.

4. Materials and Methods

Graphene oxide and magnesium hydride were purchased from Alfa Aesar. GO was introduced as additive to MgH2 through three different ways, specified by additive codes A1, A2 and A3, as expressed below.
A1: As-received graphene oxide (GO).
A2: GO and MgH2 mixed in 1:1 weight ratio and ball-milled at the speed of 150 rotations per minute (rpm) for 2 h.
A3: The powder “A2” is heat-treated to 315 °C under a 1-bar hydrogen environment and then cooled to room temperature.
Incorporation of additives A1, A2 and A3 to MgH2 in the current study is through mechanical milling using the planetary type milling facility, model Retsch PM200. All ball-milling operations in the current study were performed using stainless steel milling jars and balls with a ball-to-powder weight ratio 75:1 for 2 h with a milling speed of 150 rpm. The GO additive concentration for MgH2, used through all samples A1, A2 and A3, was 5 wt.%. The structural features were analyzed by X-ray diffraction (XRD) technique using a Rigaku X-ray diffractometer having a CuKα radiation source with λ = 1.541 Å. Powder processing was always performed inside an Ar-filled MBraun glove box. To prevent air exposure during diffraction measurement, all the Mg-containing samples were sealed by Kapton polyimide films inside the glovebox. The differential scanning calorimetry (DSC) tests were conducted by using a Perkin Elmer thermal analyzer that uses nitrogen as carrier gas (flow rate: 20 cc/min). Hydrogen storage measurements were conducted by using a Sievert-type volumetric measurement facility developed in our laboratory. The activation energy (Ea) values were calculated by the Kissinger relationship [50] as given in Equation (1):
ln [ β T m 2 ] = E a R T m + ln [ Z R E a ]  
where R is the gas constant (8.314 J/mol K), Z is the Arrhenius pre-exponential factor, Tm is the temperature at which the reaction rate is maximum (in the DSC profiles of MgH2, this represents the temperature corresponding to the endothermic peak maxima), and β is the heating rate.
For extracting information regarding the effect of interaction between MgH2 and GO on the molecular level we used Raman and Infrared spectroscopy techniques. For recording Raman spectral profiles, we employed a Horiba Jobin Vyon micro-Raman spectrometer with a 633 nm excitation laser, an edge filter (for Rayleigh line rejection) and a CCD detector. The laser beam was focused to the sample using a 50× objective lens at a spot size of 2 μm. The FT-IR spectral measurements were performed using a Shimadzu spectrometer (FTIR 8400), operating with the excitation laser wavelength 314 nm. The data were acquired in transmittance mode, for which the laser beam was focused on dense KBr pellets containing finely dispersed particles of interest. The atomic force microscopy (AFM) measurements were performed by using the facility Nanoscope IV MMAFM-2. For AFM measurements the samples were initially dispersed in pure ethanol medium and then lodged on a clean mica base by dropping and drying the solution.

5. Conclusions

In this study, dehydrogenation kinetics of a 5 wt.% GO-incorporated MgH2 sample was tested at the isothermal dehydrogenation temperature of 315 °C. The sample was reversibly hydrogenated at the same temperature by exposing at 6-bar hydrogen pressure and the dehydrogenation kinetics was tested again. The kinetics is better in the latter case, and with further tests we reached the following conclusions.
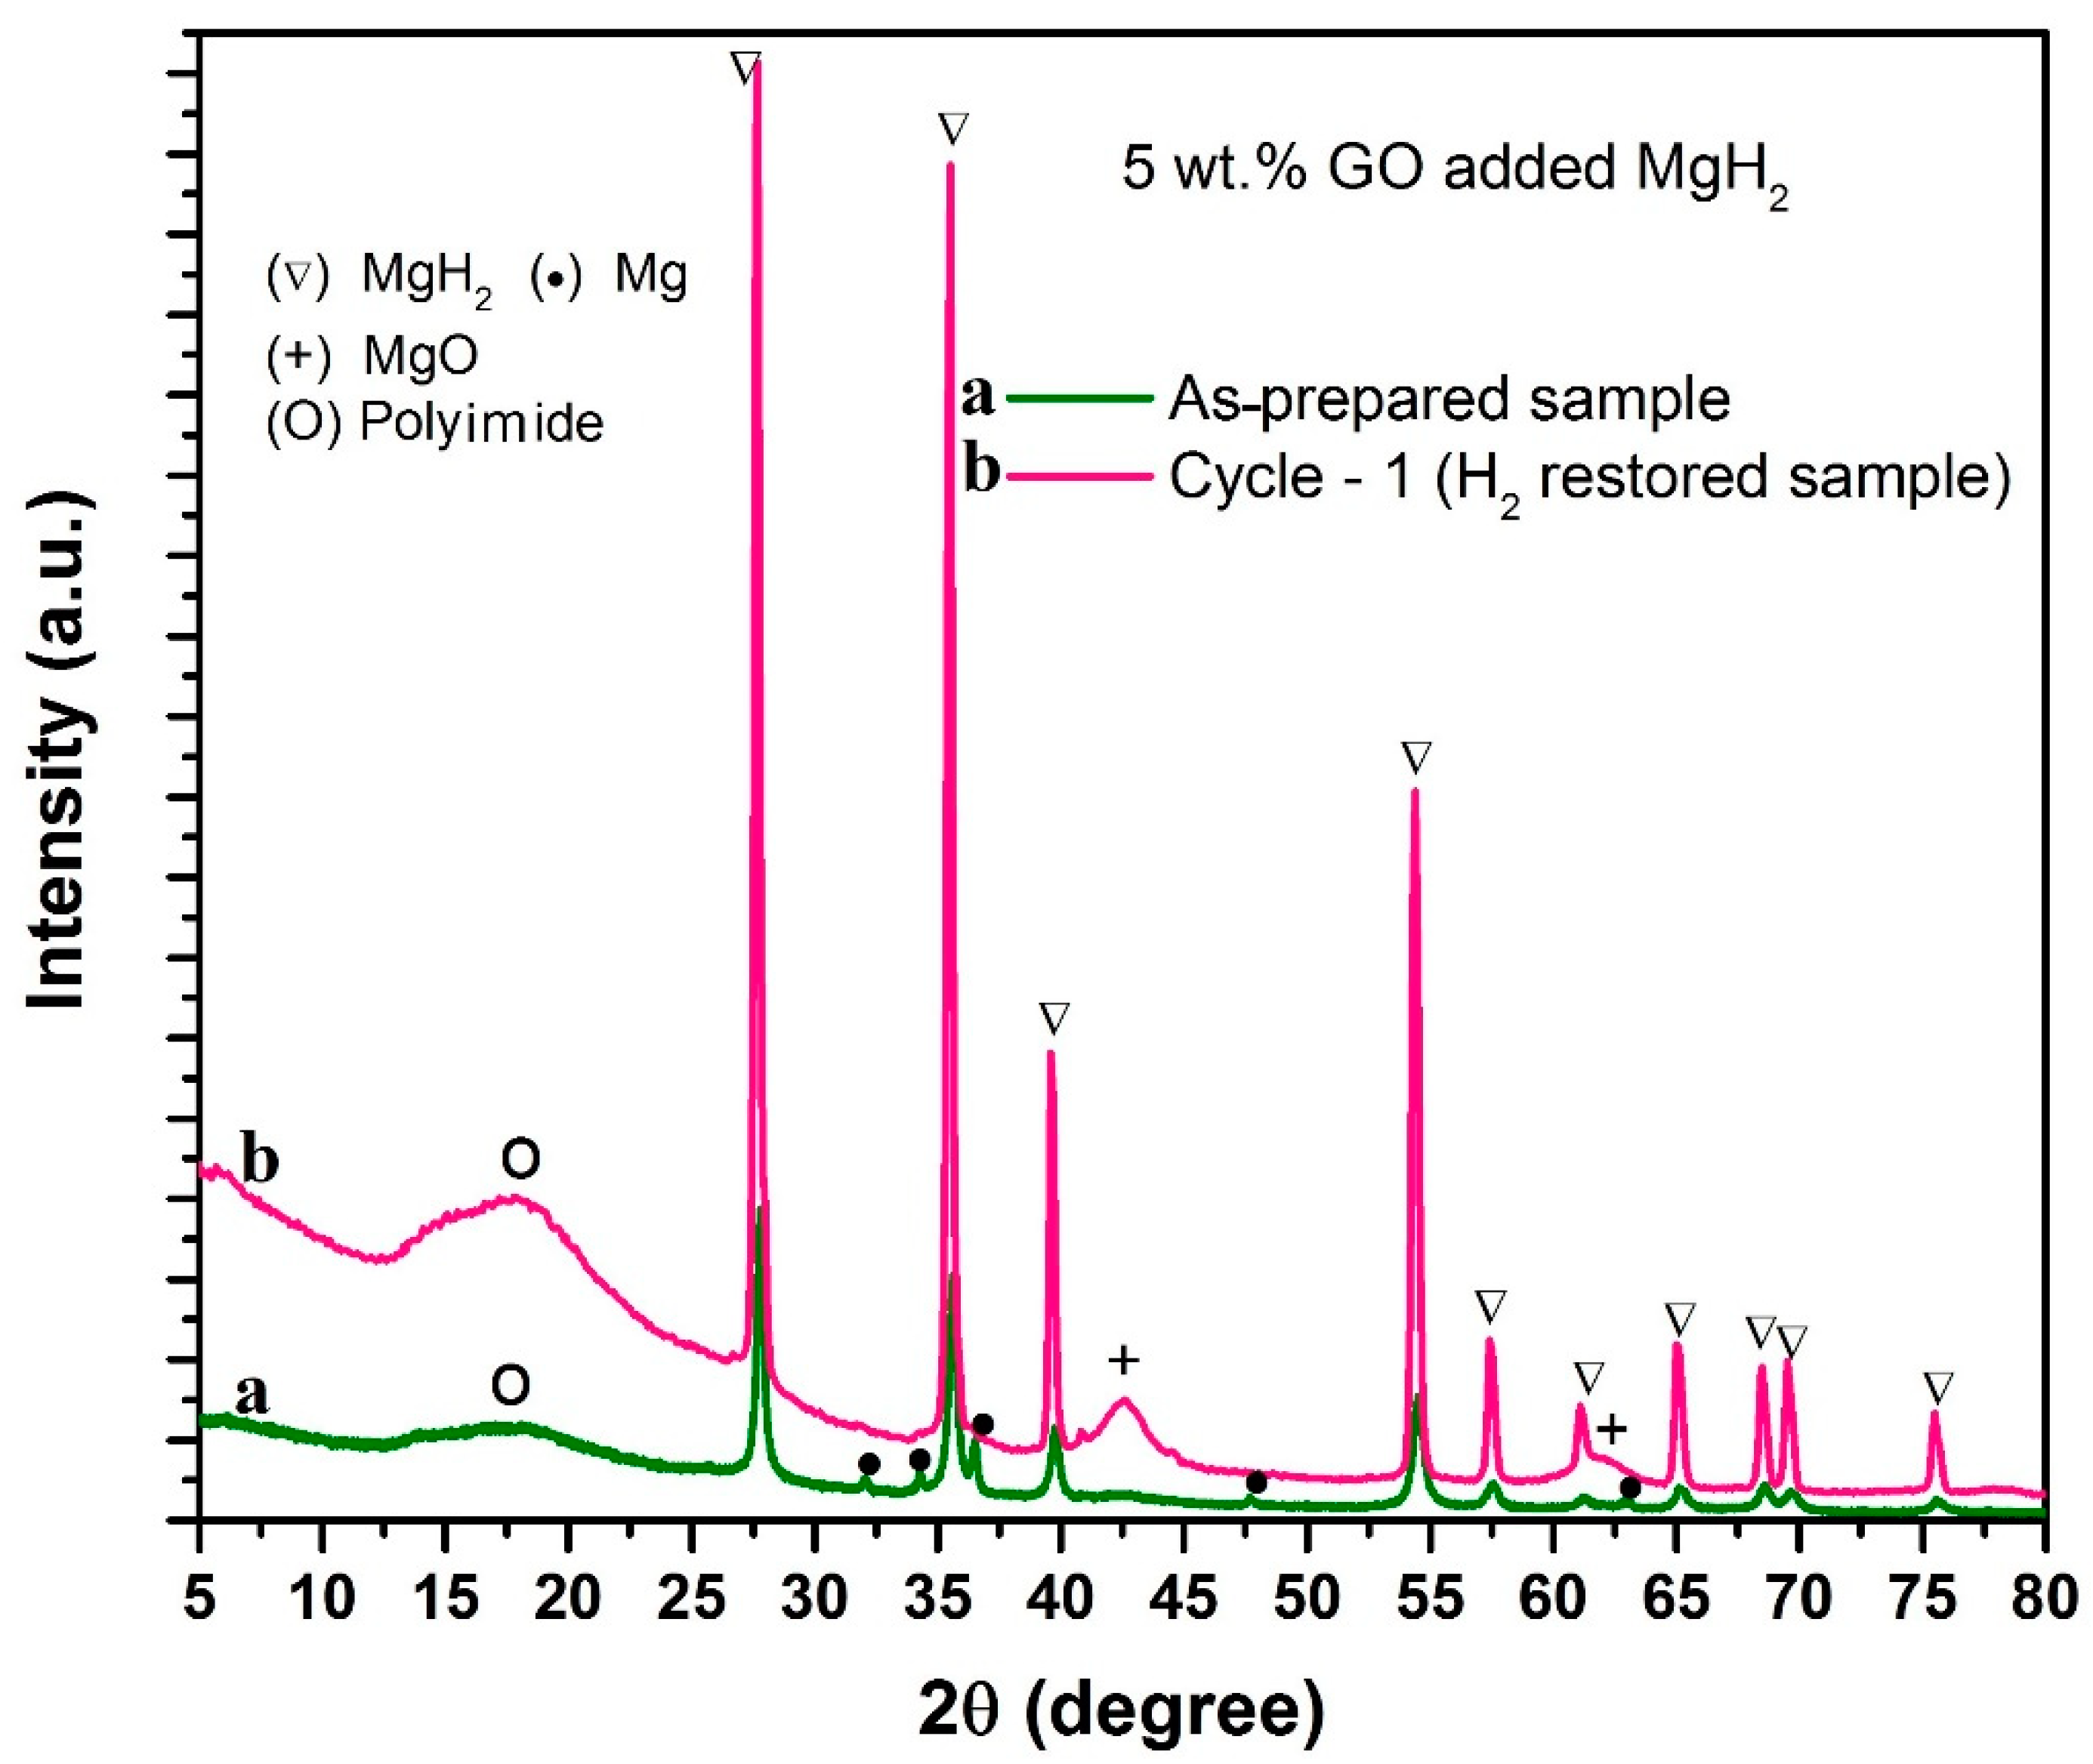
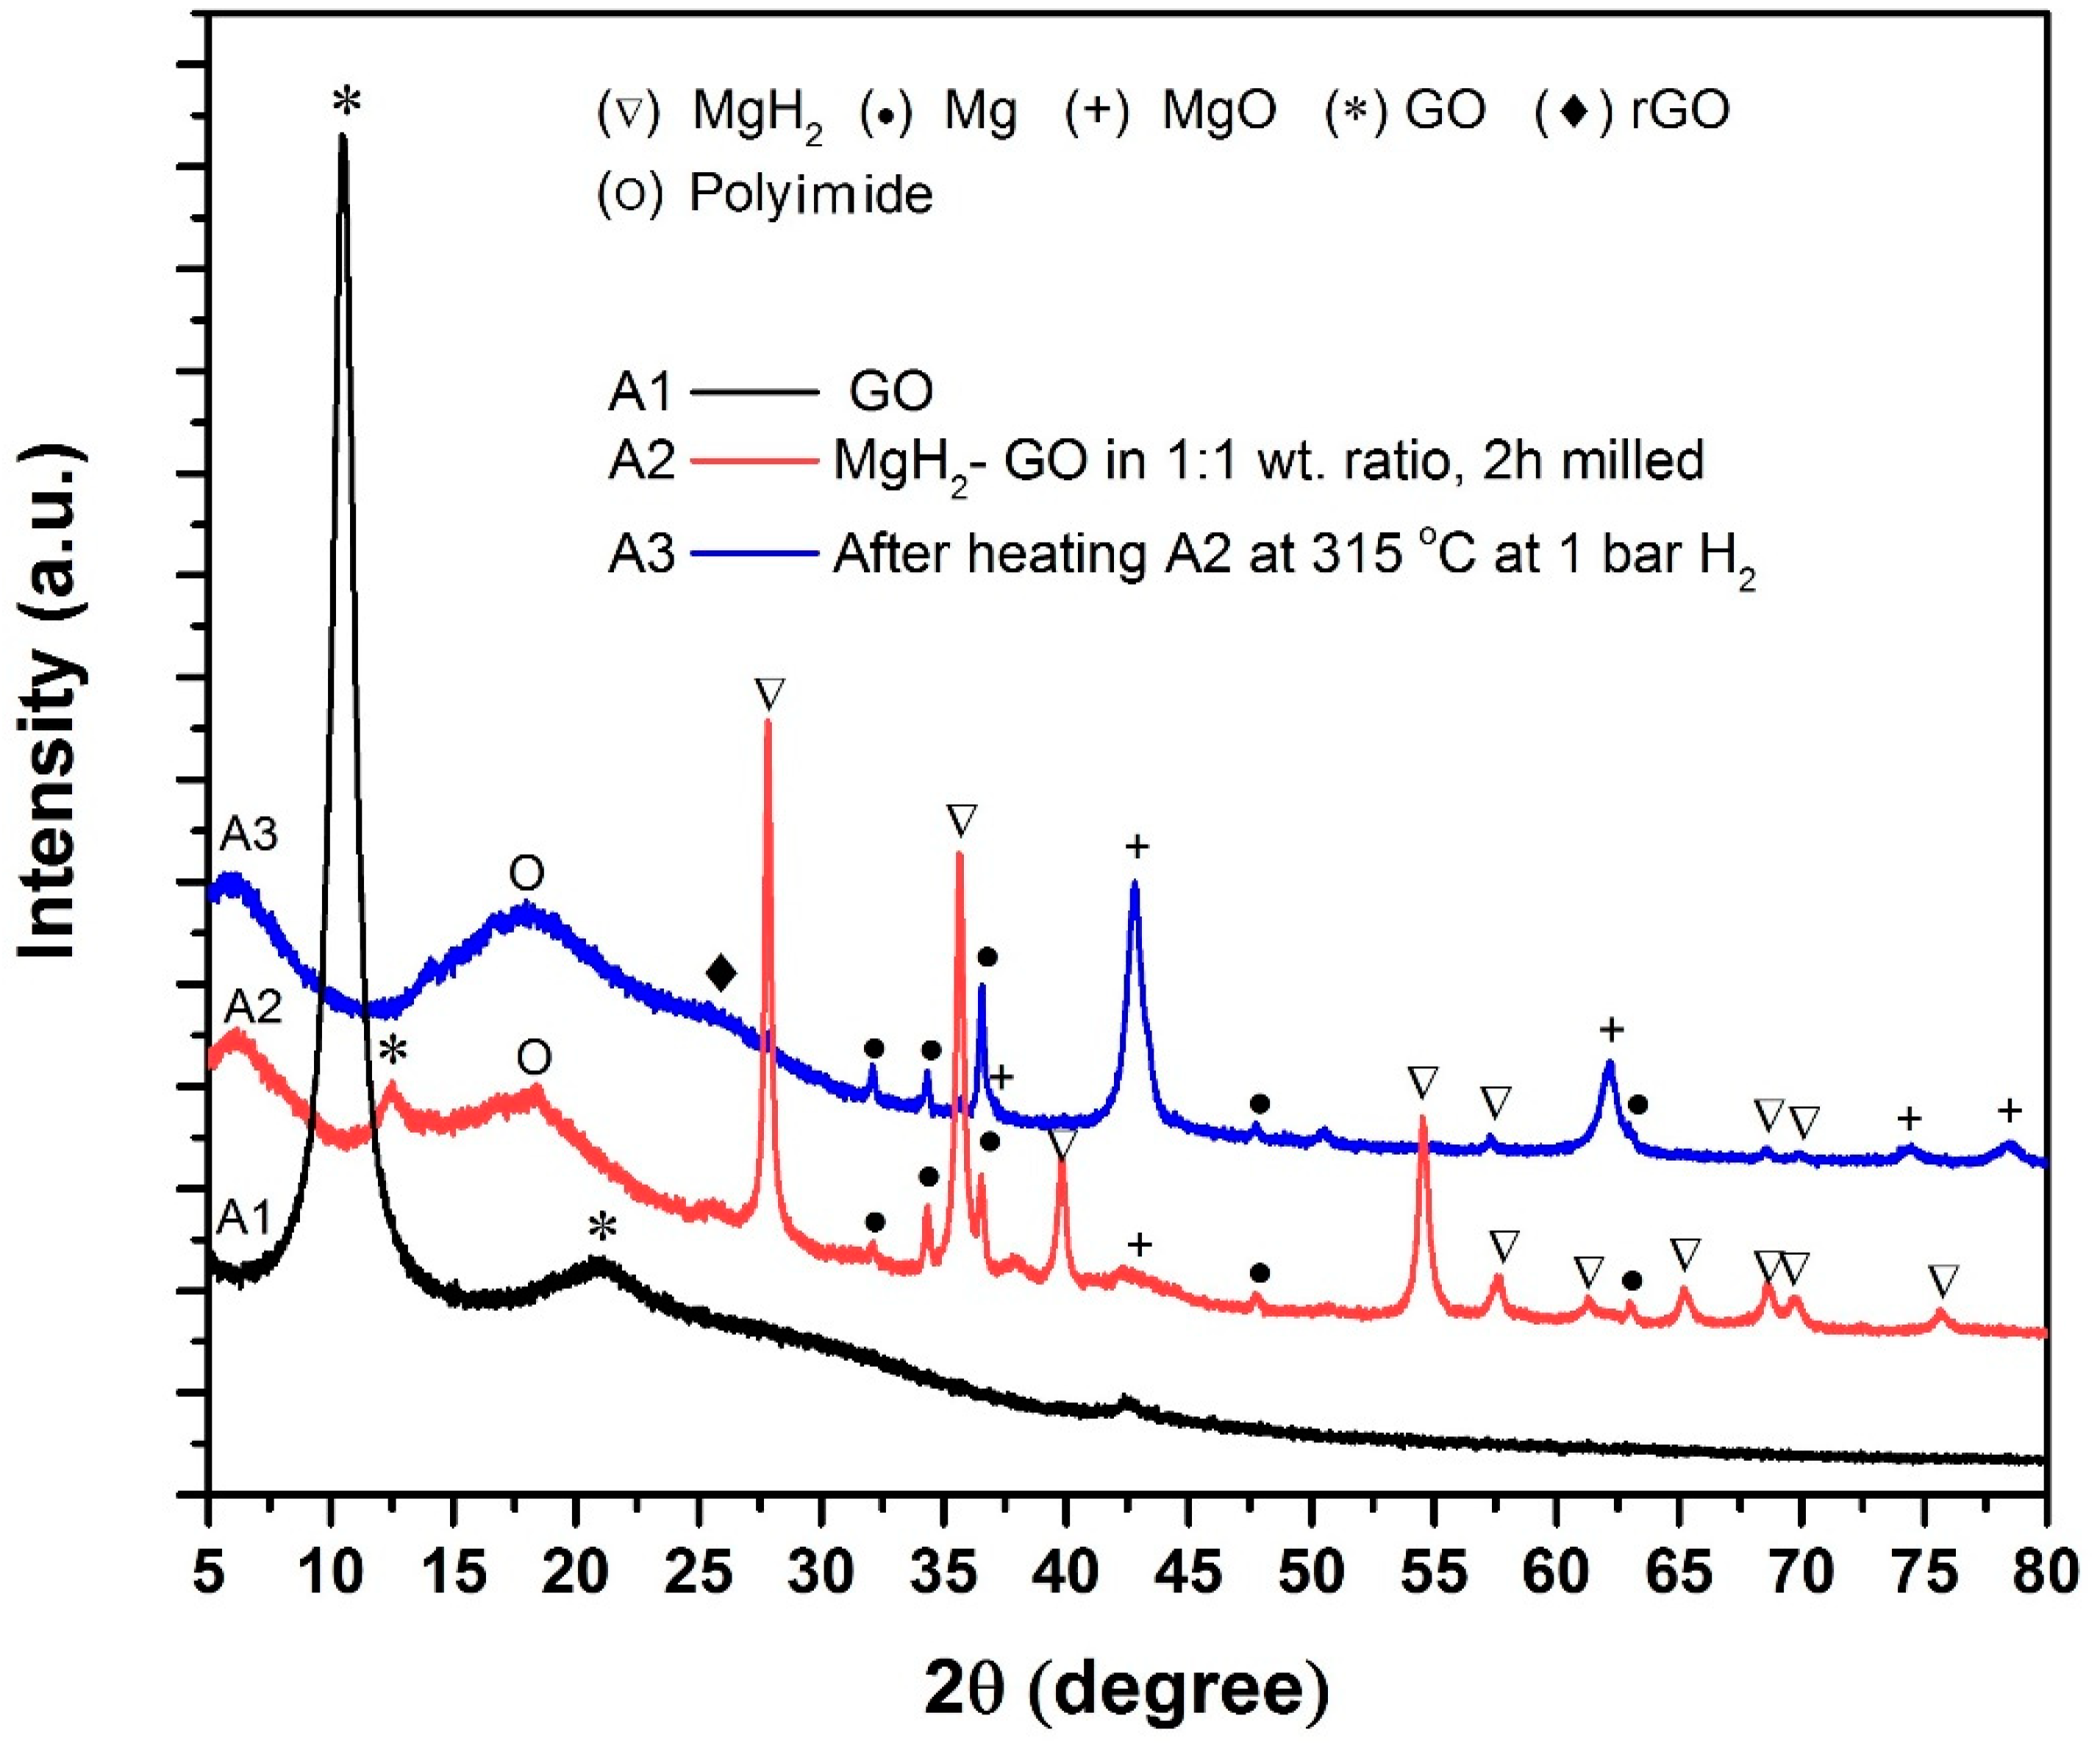
  • As per XRD observations, GO and MgH2 react during ball-milling itself (reaction time 2 h, milling speed 150 rpm). However, substantial transformation from MgH2/GO to MgO/rGO is witnessed after heating the sample at 315 °C.
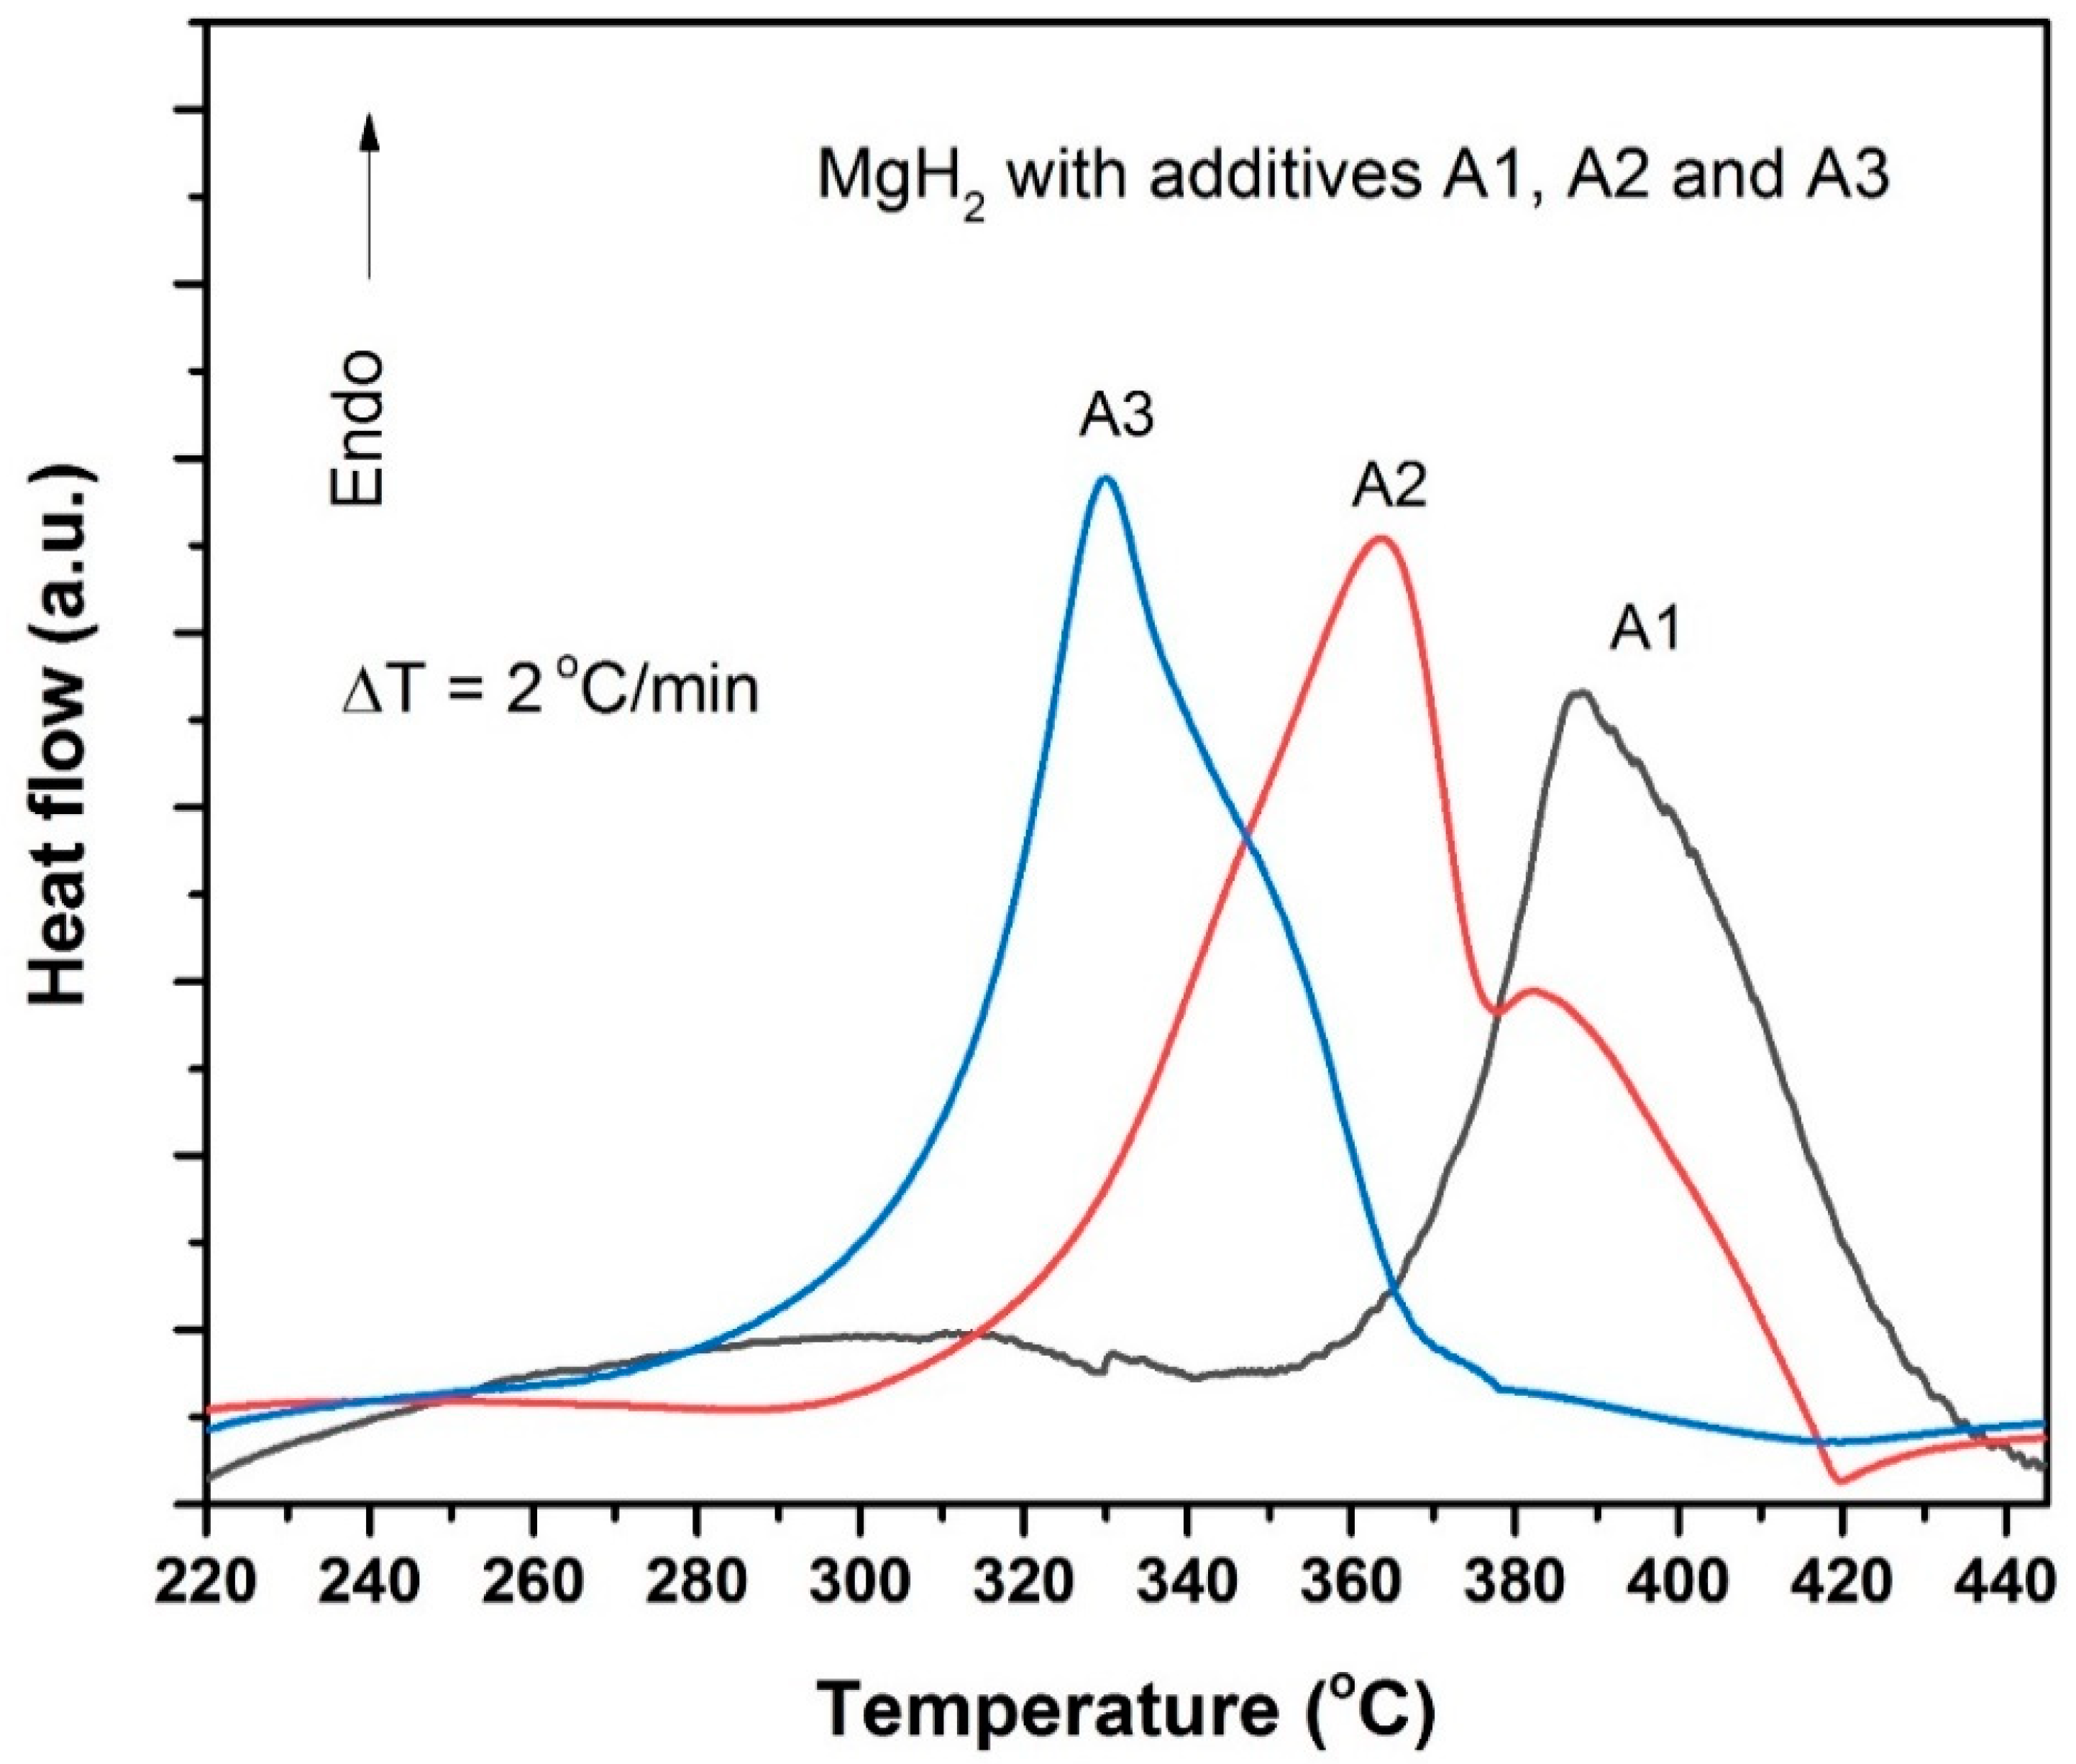
  • DSC study proves that peak dehydrogenation in the case of rGO containing MgH2 occurs by about 58 °C lower temperature as compared to that of GO-containing MgH2.
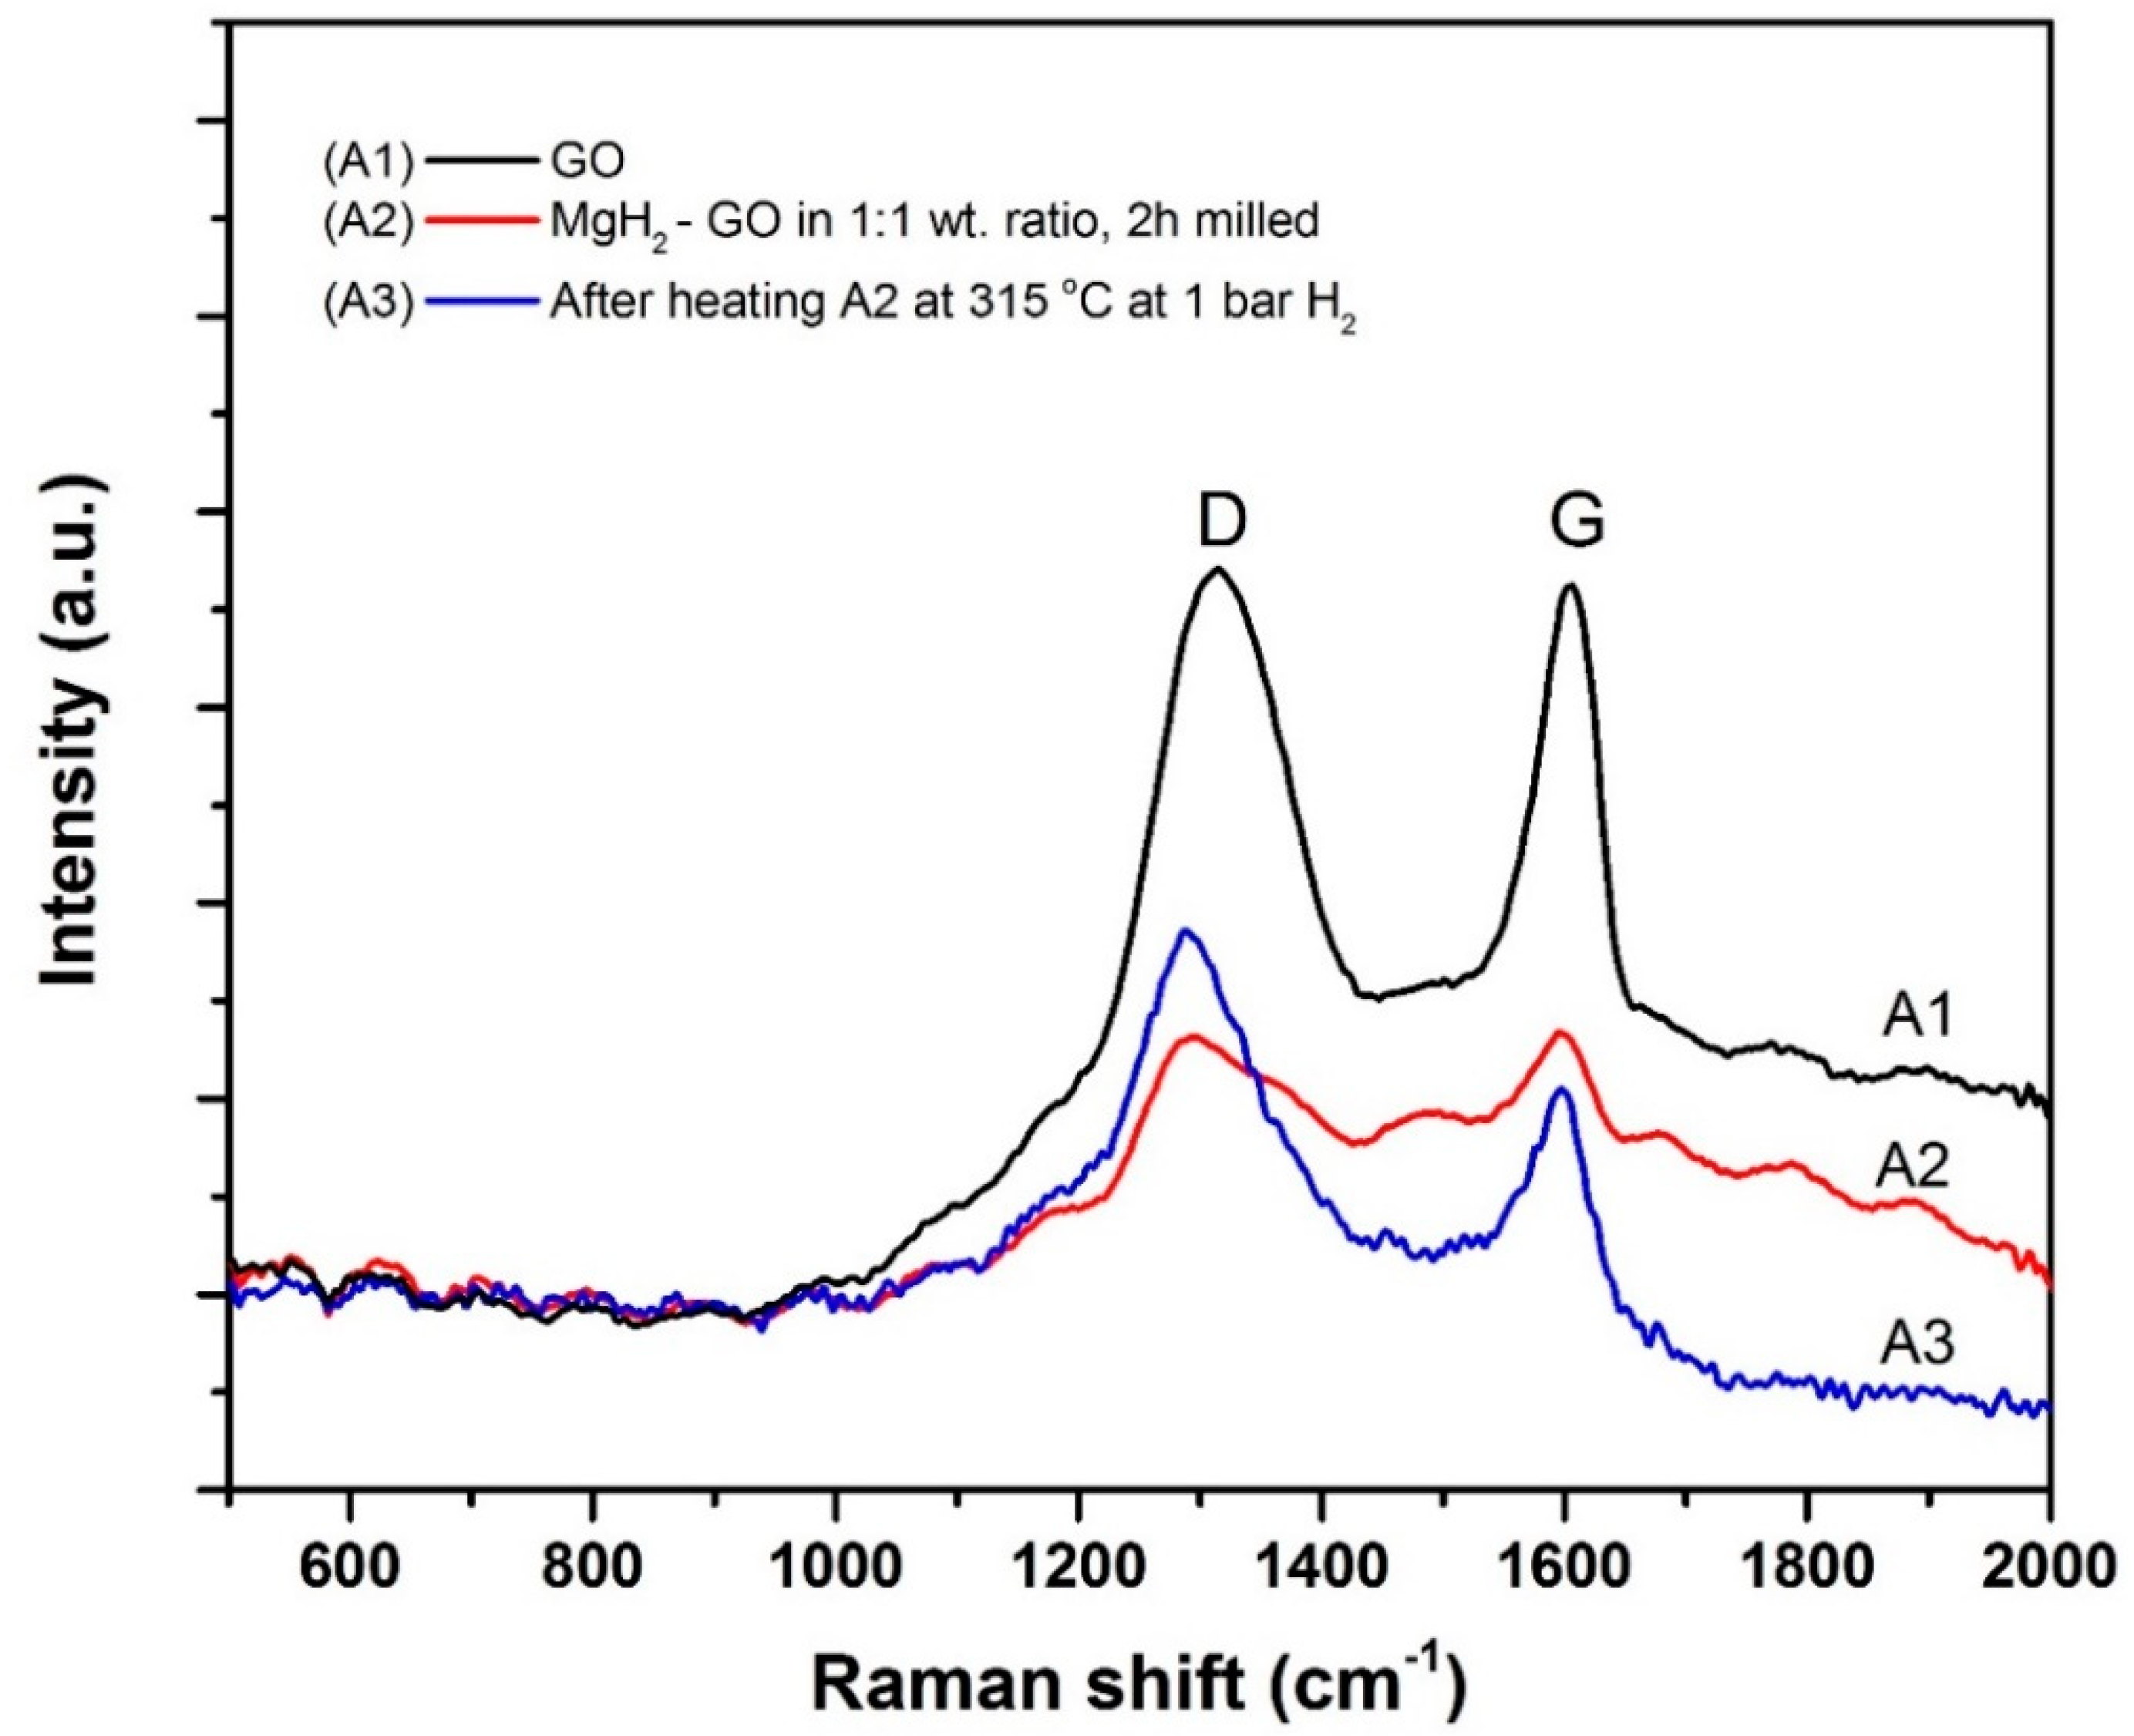
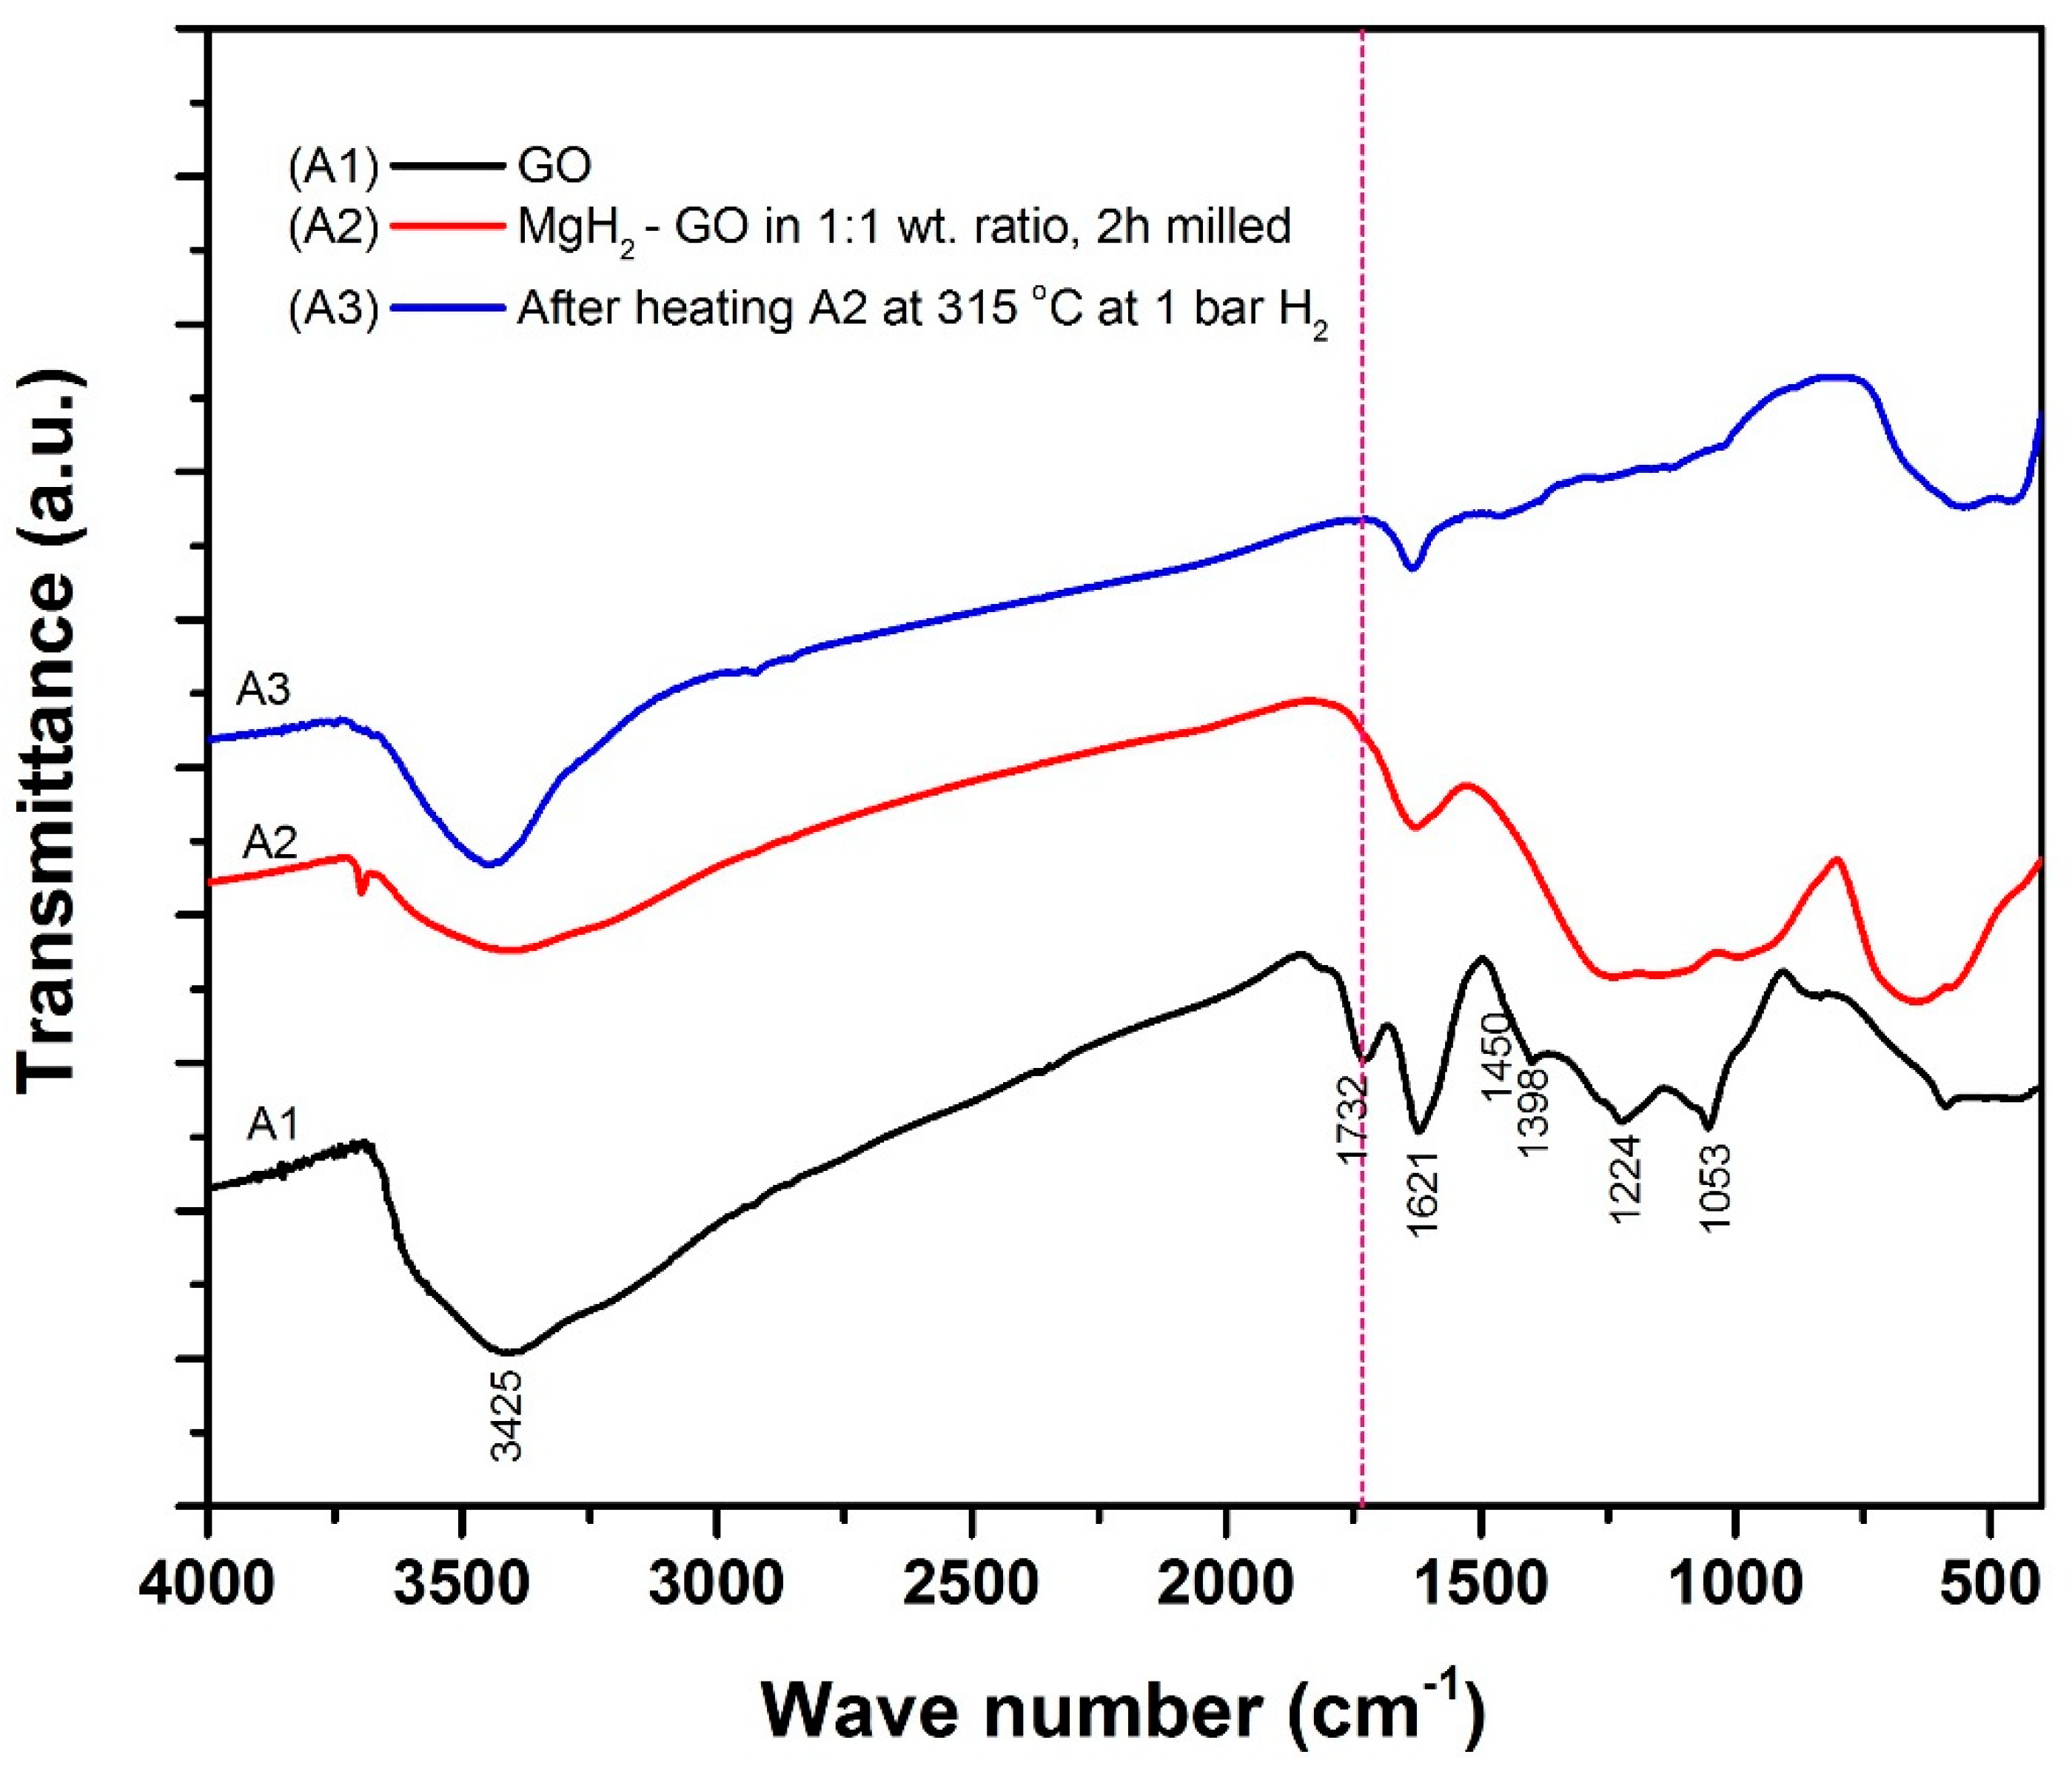
  • FTIR and Raman spectroscopy studies further prove that, with mild mechanical milling itself, there is GO to rGO transformation in the powder. On the other hand, significant transformation occurs after heating the powder at 315 °C.
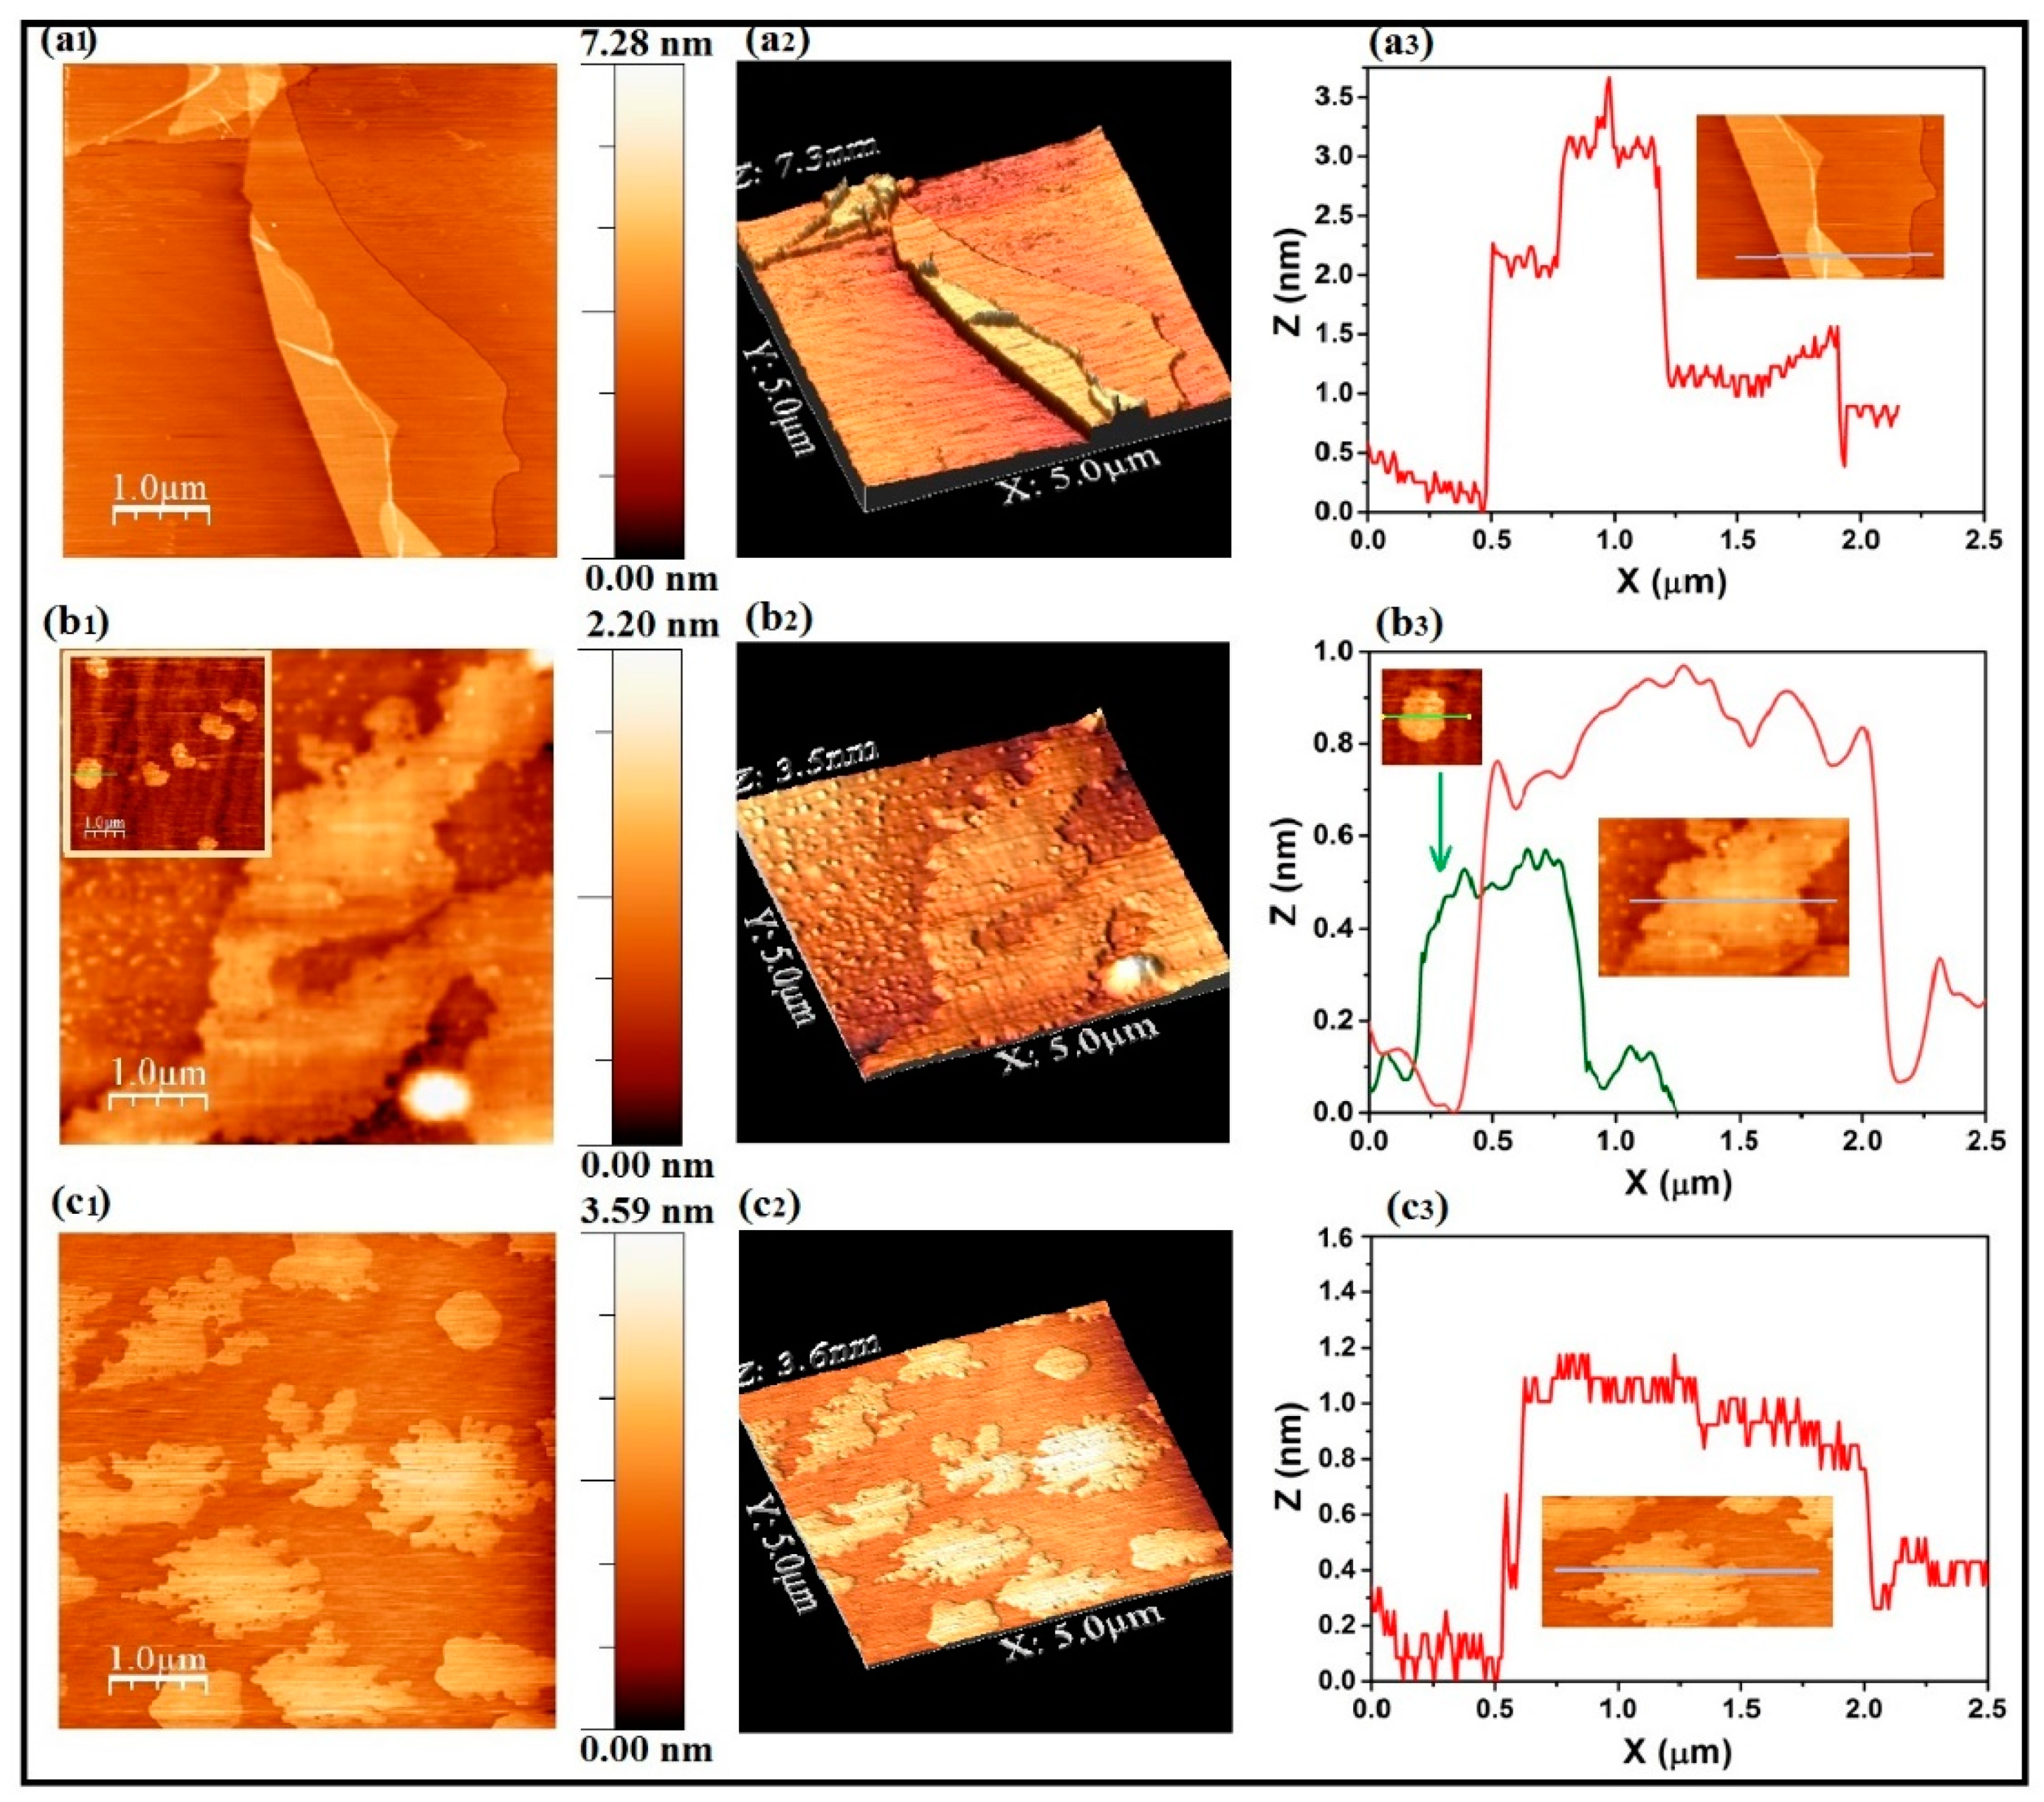
  • AFM studies prove that the length and thickness of rGO flakes is smaller than that of the starting GO sample. Evidence for monolayer rGO is observed in the case of heat-treated sample.
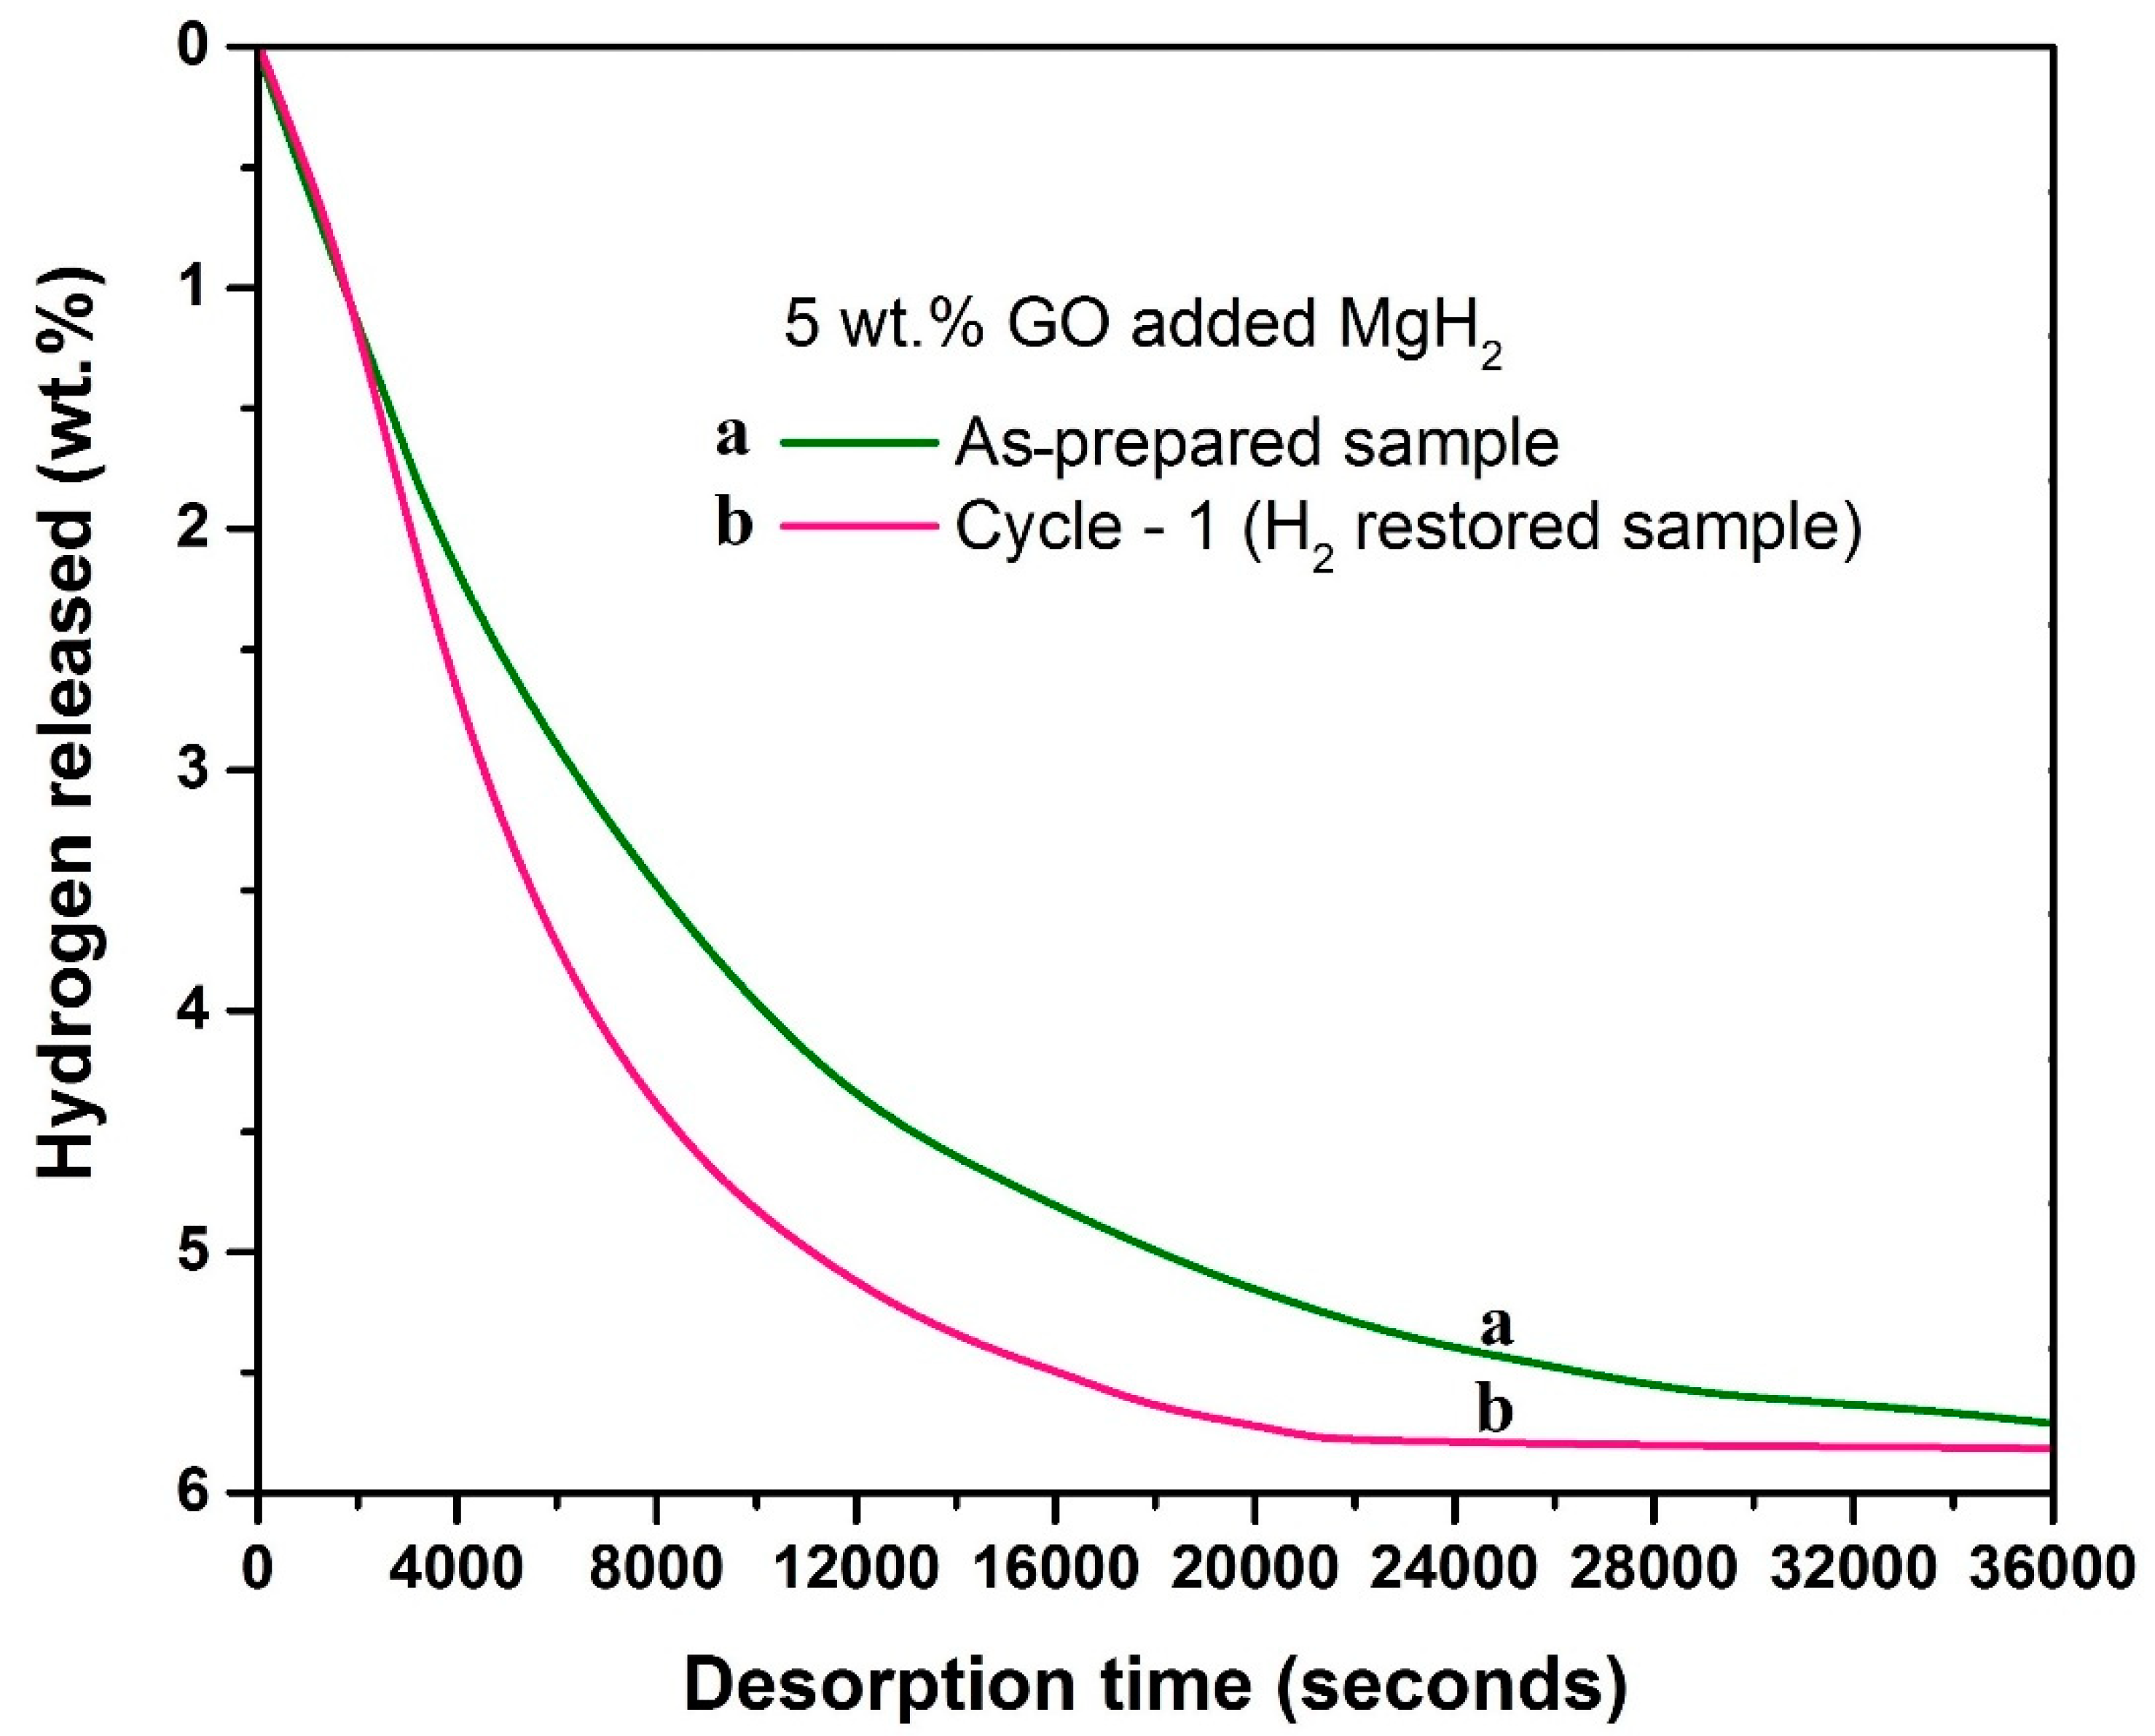
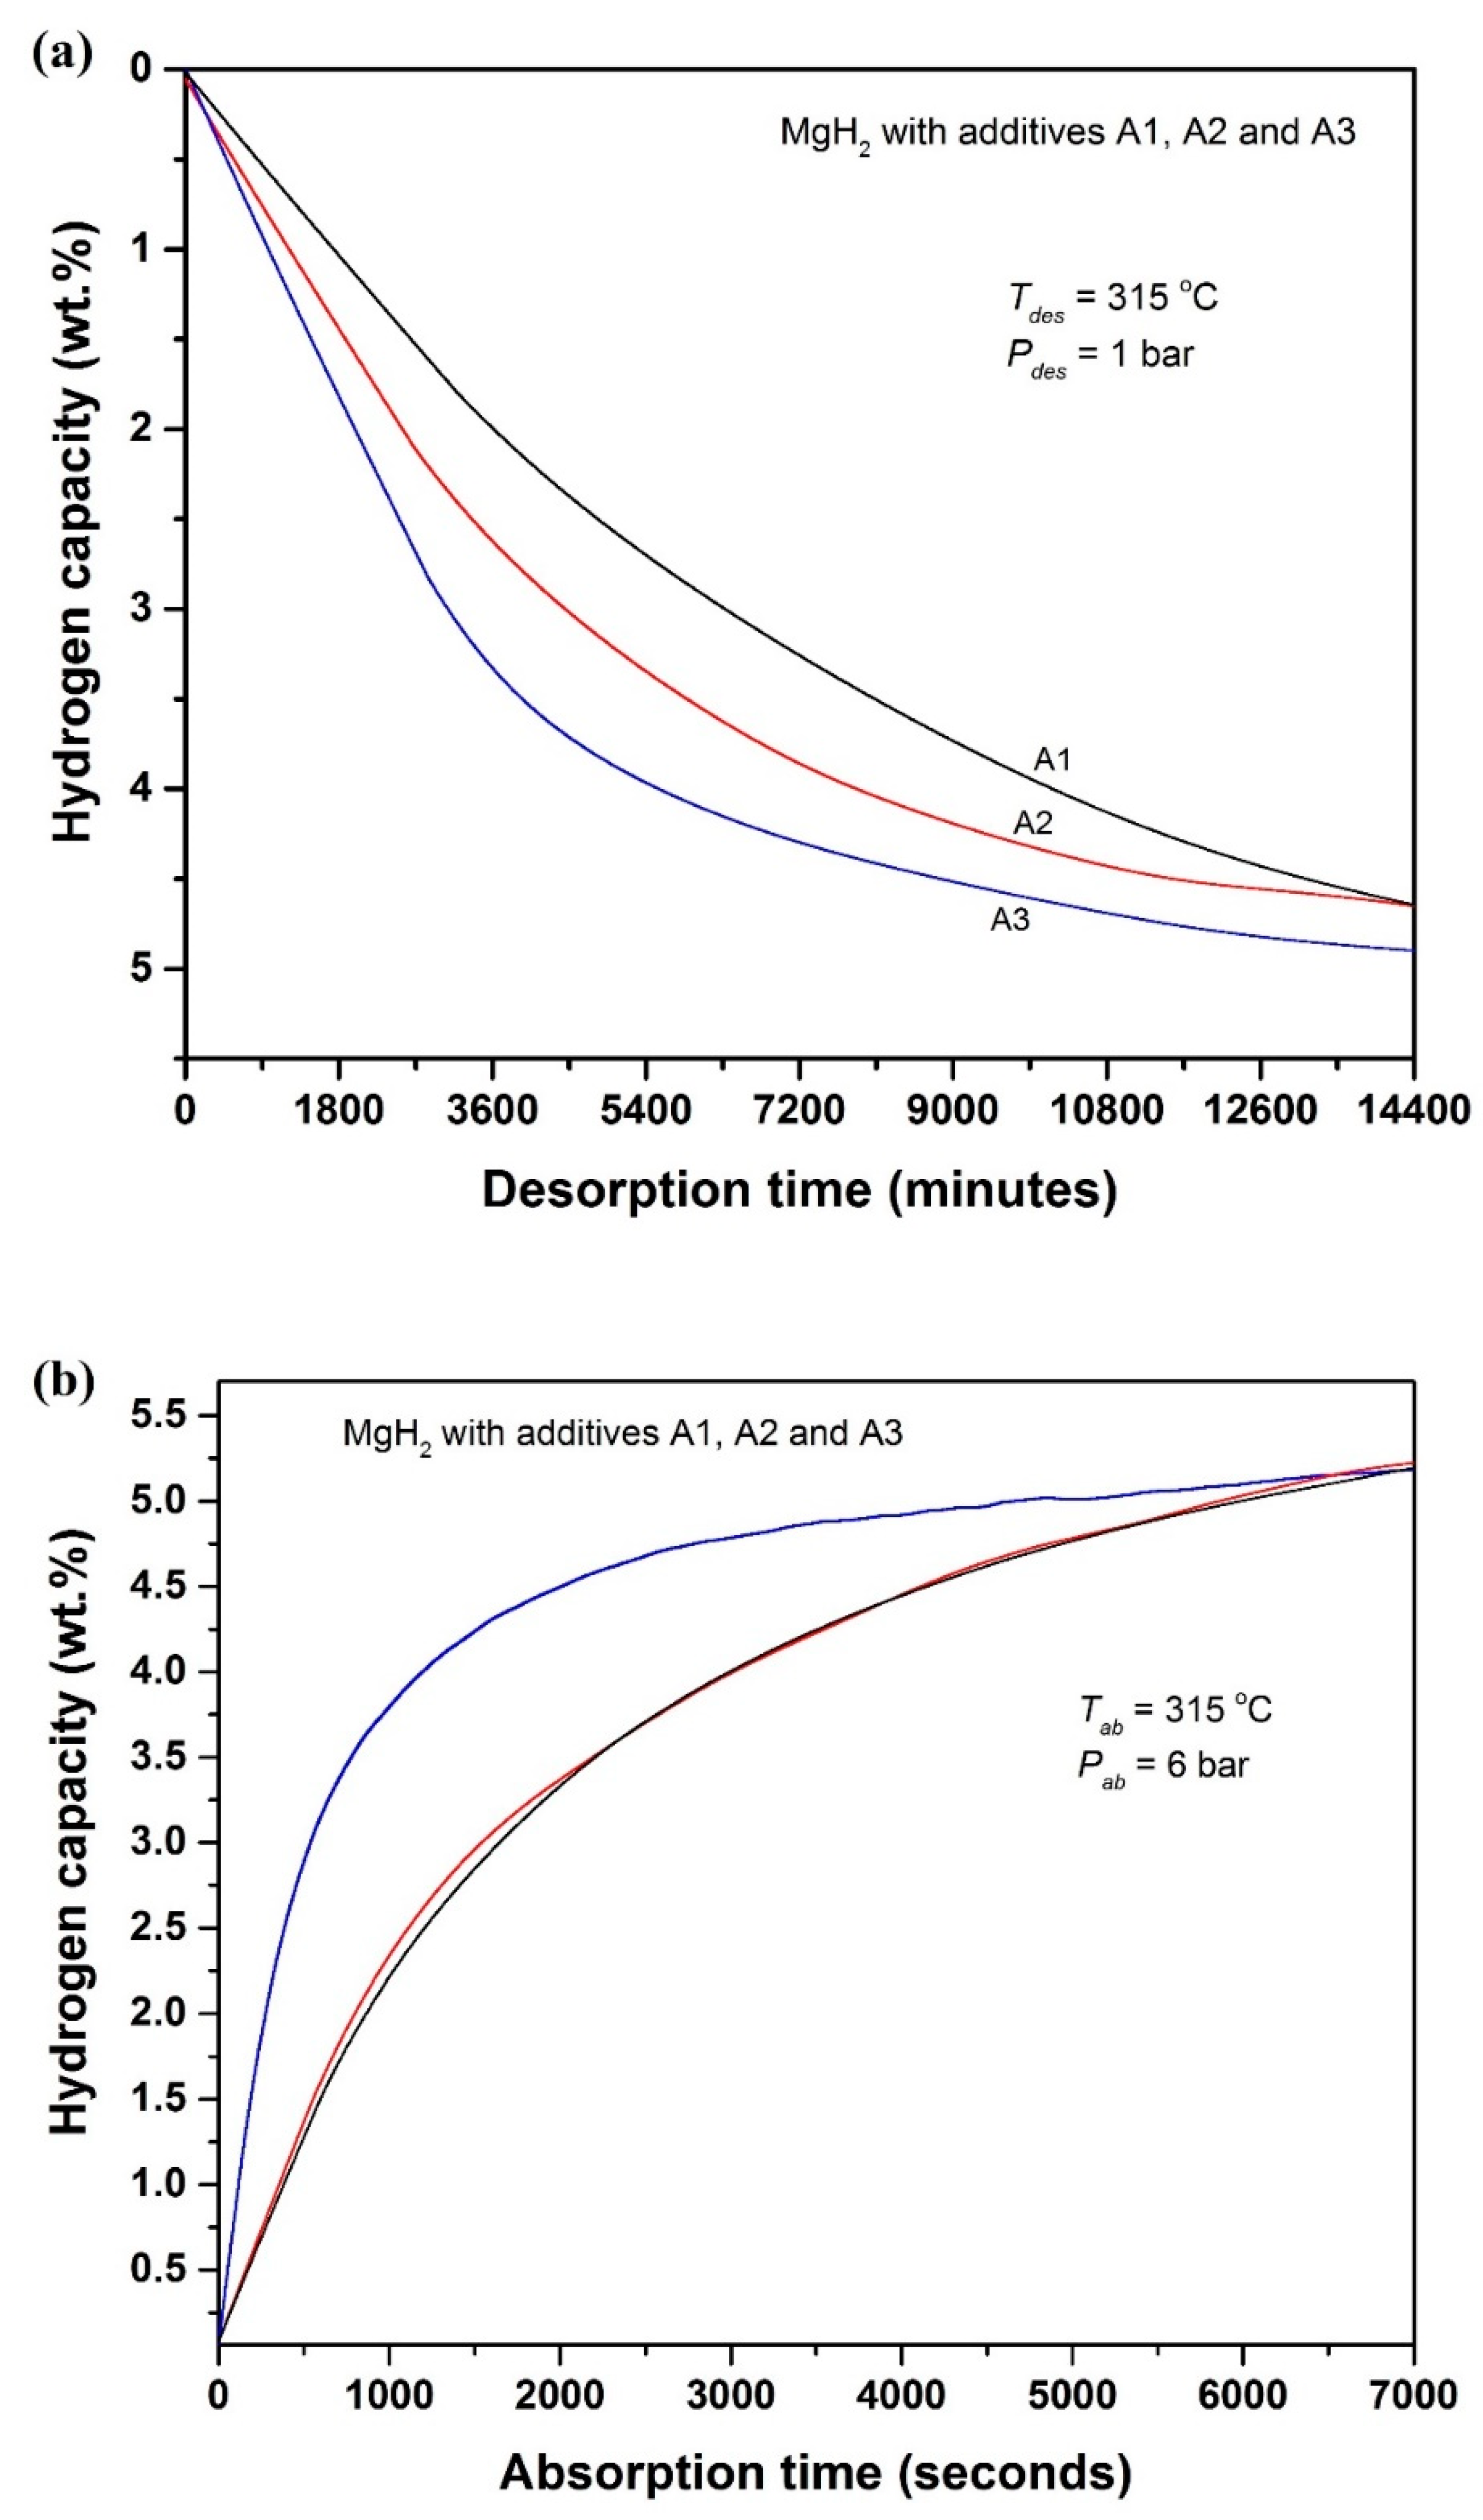
  • The in situ GO to rGO transformation also improves the dehydrogenation of MgH2. Nearly two times improved dehydrogenation kinetics is observed during the isothermal dehydrogenation at 315 °C. On the other hand, during H2 absorption (315 °C/6 bar H2) the kinetics improves about three times with respect to the starting sample.
Any form of GO, either clean GO or reduced GO, lowers the dehydrogenation activation energy of MgH2. Especially, rGO in place of GO as additive lowers the activation energy by at least 20 kJ/mol. This assertion is also supported by literature evidences.

Author Contributions

Conceptualization, D.P. and A.L.S.; methodology, D.P.; software, S.M.M.; validation, D.P., A.L.S., I.B. and D.P.F.; formal analysis, A.L.S. and I.B.; investigation, D.P.; resources, D.P.F.; data curation, S.M.M.; writing—original draft preparation, D.P.; writing—review and editing, A.L.S. and D.P.F.; visualization, S.M.M. and I.B.; supervision, D.P.F.; project administration, D.P.F.; funding acquisition, D.P.F. All authors have read and agreed to the published version of the manuscript.

Funding

This research was partially funded by FCT (Fundação para a Ciência e a Tecnologia), grant numbers PTDC/QUI-ELT/3681/2020, POCI-01-0247-FEDER-039926, POCI-01-0145-FEDER-032241, UIDB/00481/2020 and UIDP/00481/2020; and also by Centro Portugal Regional Operational Programme (Centro2020), under the PORTUGAL 2020 Partnership Agreement, through the European Regional Development Fund (ERDF), grant number CENTRO-01-0145-FEDER-022083. D Pukazhselvan acknowledge FCT for the financial support with the reference CEECIND/04158/2017 and A.L. Shaula acknowledge FCT for the financial support with the reference CEECIND/01117/2020.

Data Availability Statement

Not applicable.

Conflicts of Interest

The authors declare no conflict of interest.

References

  1. U.S. DRIVE Partnership. Target Explanation Document: Onboard Hydrogen Storage for Light-Duty Fuel Cell Vehicles. 2017; pp. 1–19. Available online: https://www.energy.gov/sites/prod/files/2017/05/f34/fcto_targets_onboard_hydro_storage_explanation.pdf (accessed on 5 June 2022).
  2. Pukazhselvan, D.; Kumar, D.; Singh, S.K. High capacity hydrogen storage: Basic aspects, new developments and milestones. Nano Energy 2012, 1, 566–589. [Google Scholar] [CrossRef]
  3. Oelerich, W.; Klassen, T.; Bormann, R. Metal oxides as catalysts for improved hydrogen sorption in nanocrystalline Mg-based materials. J. Alloys Compd. 2001, 315, 237–242. [Google Scholar] [CrossRef]
  4. Hanada, N.; Ichikawa, T.; Fujii, H. Catalytic effect of nanoparticle 3d-transition metals on hydrogen storage properties in magnesium hydride MgH2 prepared by mechanical milling. J. Phys. Chem. B 2005, 109, 7188–7194. [Google Scholar] [CrossRef] [PubMed]
  5. Pukazhselvan, D.; Sandhya, K.S.; Ramasamy, D.; Shaula, A.; Fagg, D.P. Transformation of metallic Ti to TiH2 phase in the Ti/MgH2 composite and its influence on the hydrogen storage behavior of MgH2. ChemPhysChem 2020, 21, 1195–1201. [Google Scholar] [CrossRef]
  6. Pukazhselvan, D.; Bdikin, I.; Perez, J.; Carbo-Argibay, E.; Antunes, I.; Stroppa, D.G.; Fagg, D.P. Formation of Mg-Nb-O rock salt structures in a series of mechanochemically activated MgH2 + nNb2O5 (n = 0.083–1.50) mixtures. Int. J. Hydrogen Energy 2016, 41, 2677–2688. [Google Scholar] [CrossRef]
  7. Pukazhselvan, D.; Nasani, N.; Correia, P.; Carbo-Argibay, E.; Otero-Irurueta, G.; Stroppa, D.G.; Fagg, D.P. Evolution of reduced Ti containing phase(s) in MgH2/TiO2 system and its effect on the hydrogen storage behavior of MgH2. J. Power Sources 2017, 362, 174–183. [Google Scholar] [CrossRef]
  8. Zhou, C.; Fang, Z.Z.; Ren, C.; Li, J.; Lu, J. Effect of Ti intermetallic catalysts on hydrogen storage properties of magnesium hydride. J. Phys. Chem. C 2013, 117, 12973–12980. [Google Scholar] [CrossRef]
  9. Zhang, Q.; Wang, Y.; Zang, L.; Chang, X.; Jiao, L.; Yuan, H.; Wang, Y. Core-Shell Ni3N@nitrogen-doped carbon: Synthesis and application in MgH2. J. Alloys Compd. 2017, 703, 381–388. [Google Scholar] [CrossRef]
  10. Ismail, M. Effect of LaCl3 addition on the hydrogen storage properties of MgH2. Energy 2015, 79, 177–182. [Google Scholar] [CrossRef]
  11. Lin, H.J.; Matsuda, J.; Li, H.W.; Zhu, M.; Akiba, E. Enhanced hydrogen desorption property of MgH2 with the addition of cerium fluorides. J. Alloys Compd. 2015, 645, S392–S396. [Google Scholar] [CrossRef]
  12. Lu, X.; Zhang, L.; Yu, H.; Lu, Z.; He, J.; Zheng, J.; Wu, F.; Chen, L. Achieving superior hydrogen storage properties of MgH2 by the effect of TiFe and carbon nanotubes. Chem. Eng. J. 2021, 422, 130101. [Google Scholar] [CrossRef]
  13. Zhang, J.; Yu, X.F.; Mao, C.; Long, C.G.; Chen, J.; Zhou, D.W. Influences and mechanisms of graphene-doping on dehydrogenation properties of MgH2: Experimental and first-principles studies. Energy 2015, 89, 957–964. [Google Scholar] [CrossRef]
  14. Lillo-Rodenas, M.A.; Guo, Z.X.; Aguey-Zinsou, K.F.; Cazorla-Amoros, D.; Linares-Solano, A. Effects of different carbon materials on MgH2 decomposition. Carbon 2008, 46, 126–137. [Google Scholar] [CrossRef]
  15. Wu, C.Z.; Wang, P.; Yao, X.; Liu, C.; Chen, D.M.; Lu, G.Q.; Cheng, H.M. Hydrogen storage properties of MgH2/SWNT composite prepared by ball milling. J. Alloys Compd. 2006, 420, 278–282. [Google Scholar] [CrossRef]
  16. Liu, J.; Ma, Z.; Liu, Z.; Tang, Q.; Zhu, Y.; Lin, H.; Zhang, Y.; Zhang, J.; Liu, Y.; Li, L. Synergistic effect of RGO supported Ni3Fe on hydrogen storage performance of MgH2. Int. J. Hydrogen Energy 2020, 45, 16622–16633. [Google Scholar] [CrossRef]
  17. Liu, J.; Liu, Y.; Liu, Z.; Ma, Z.; Ding, Y.; Zhu, Y.; Zhang, Y.; Zhang, J.; Li, L. Effect of RGO Supported NiCu derived from layered double hydroxide on hydrogen sorption kinetics of MgH2. J. Alloys Compd. 2019, 789, 768–776. [Google Scholar] [CrossRef]
  18. Liu, G.; Wang, L.; Hu, Y.; Sun, C.; Leng, H.; Li, Q.; Wu, C. Enhanced catalytic effect of TiO2@RGO synthesized by one-pot ethylene glycol-assisted solvothermal method for MgH2. J. Alloys Compd. 2021, 881, 160644. [Google Scholar] [CrossRef]
  19. Wang, K.; Wu, G.; Cao, H.; Li, H.; Zhao, X. Improved reversible dehydrogenation properties of MgH2 by the synergetic effects of graphene oxide-based porous carbon and TiCl3. Int. J. Hydrogen Energy 2018, 43, 7440–7446. [Google Scholar] [CrossRef]
  20. Zhang, J.; Hou, Q.; Guo, X.; Yang, X. Achieve high-efficiency hydrogen storage of MgH2 catalyzed by nanosheets CoMoO4 and RGO. J. Alloys Compd. 2022, 911, 165153. [Google Scholar] [CrossRef]
  21. Ji, L.; Zhang, L.; Yang, X.; Zhu, X.; Chen, L. The remarkably improved hydrogen storage performance of MgH2 by the synergetic effect of an FeNi/RGO nanocomposite. Dalton Trans. 2020, 49, 4146–4154. [Google Scholar] [CrossRef]
  22. Yao, P.; Jiang, Y.; Liu, Y.; Wu, C.; Chou, K.C.; Lyu, T.; Li, Q. Catalytic effect of Ni@RGO on the hydrogen storage properties of MgH2. J. Magnes. Alloy. 2020, 8, 461–471. [Google Scholar] [CrossRef]
  23. Pukazhselvan, D.; Narendar, N.; Singh, S.K.; Fagg, D.P. Metal oxide additives incorporated hydrogen storage systems: Formation of in situ catalysts and mechanistic understanding. In Emerging Nanostructured Materials for Energy and Environmental Science; Rajendran, S., Naushad, M., Raju, K., Boukherroub, R., Eds.; Springer International Publishing: Cham, Switzerland, 2019; pp. 215–245. [Google Scholar]
  24. Pukazhselvan, D.; Otero-Irurueta, G.; Pérez, J.; Singh, B.; Bdikin, I.; Singh, M.K.; Fagg, D.P. Crystal structure, phase stoichiometry and chemical environment of MgxNbyOx+y nanoparticles and their impact on hydrogen storage in MgH2. Int. J. Hydrogen Energy 2016, 41, 11709–11715. [Google Scholar] [CrossRef]
  25. Pukazhselvan, D.; Narendar, N.; Sandhya, K.S.; Singh, B.; Bdikin, I.; Koga, N.; Fagg, D.P. Role of chemical interaction between MgH2 and TiO2 additive on the hydrogen storage behavior of MgH2. Appl. Surf. Sci. 2017, 420, 740–745. [Google Scholar] [CrossRef]
  26. Pukazhselvan, D.; Sandhya, K.S.; Ramasamy, D.; Shaula, A.; Bdikin, I.; Fagg, D.P. Active catalytic species generated in situ in zirconia incorporated hydrogen storage material magnesium hydride. J. Magnes. Alloy. 2022, 10, 786–796. [Google Scholar] [CrossRef]
  27. Pukazhselvan, D.; Silva, D.A.R.; Sandhya, K.S.; Fateixa, S.; Shaula, A.; Nogueira, H.; Bdikin, I.; Fagg, D.P. Interaction of zirconia with magnesium hydride and its Influence on the hydrogen storage behavior of magnesium hydride. Int. J. Hydrogen Energy 2022, 47, 21760–21771. [Google Scholar] [CrossRef]
  28. Pukazhselvan, D.; Sandhya, K.S.; Narendar, N.; Fagg, D.P. Chemical transformation of additive phase in MgH2/CeO2 hydrogen storage system and its effect on catalytic performance. Appl. Surf. Sci. 2021, 561, 150062. [Google Scholar] [CrossRef]
  29. Park, S.; An, J.; Potts, J.R.; Velamakanni, A.; Murali, S.; Ruoff, R.S. Hydrazine-reduction of graphite and graphene oxide. Carbon 2011, 49, 3019–3023. [Google Scholar] [CrossRef]
  30. Lavin-Lopez, M.P.; Paton-Carrero, A.; Sanchez-Silva, L.; Valverde, J.L.; Romero, A. Influence of the reduction strategy in the synthesis of reduced graphene oxide. Adv. Powder Technol. 2017, 28, 3195–3203. [Google Scholar] [CrossRef] [Green Version]
  31. Lesiak, B.; Trykowski, G.; Toth, J.; Biniak, S.; Kover, L.; Rangam, L.; Stobinski, L.; Malolepszy, A. Chemical and structural properties of reduced graphene oxide—Dependence on the reducing agent. J. Mater. Sci. 2021, 56, 3738–3754. [Google Scholar] [CrossRef]
  32. Guex, L.G.; Sacchi, B.; Peuvot, K.F.; Andersson, R.L.; Pourrahimi, A.M.; Strom, V.; Farris, S.; Olsson, R.T. Experimental review: Chemical reduction of graphene oxide (GO) to reduced graphene oxide (RGO) by aqueous chemistry. Nanoscale 2017, 9, 9562–9571. [Google Scholar] [CrossRef] [Green Version]
  33. Johra, F.T.; Jung, W.G. Effect of pH on the synthesis and characteristics of RGO-CdS nanocomposites. Appl. Surf. Sci. 2014, 317, 1015–1021. [Google Scholar] [CrossRef]
  34. Szabo, T.; Berkesi, O.; Forgo, P.; Josepovits, K.; Sanakis, Y.; Petridis, D.; Dekany, I. Evolution of surface functional groups in a series of progressively oxidized graphite oxides. Chem. Mater. 2006, 18, 2740–2749. [Google Scholar] [CrossRef]
  35. Johra, F.T.; Jung, W.G. Hydrothermally reduced graphene oxide as a supercapacitor. Appl. Surf. Sci. 2015, 357, 1911–1914. [Google Scholar] [CrossRef]
  36. Pukazhselvan, D.; Perez, J.; Nasani, N.; Bdikin, I.; Kovalevsky, A.V.; Fagg, D.P. Formation of MgxNbyOx+y through the mechanochemical reaction of MgH2 and Nb2O5, and its effect on the hydrogen-storage behavior of MgH2. ChemPhysChem 2016, 17, 178–183. [Google Scholar] [CrossRef]
  37. Nyquist, R.A.; Kagel, R.O. Handbook of Infrared and Raman Spectra of Inorganic Compounds and Organic Salts: Infrared Spectra of Inorganic Compounds; Academic Press: Cambridge, MA, USA, 2012; Volume 4. [Google Scholar]
  38. Yanwu, Z.; Murali, S.; Cai, W.; Li, X.; Suk, J.W.; Potts, J.R.; Ruoff, R.S. Graphene and graphene oxide: Synthesis, properties, and applications. Adv. Mater. 2010, 22, 3906–3924. [Google Scholar]
  39. Alhadhrami, A.; Salgado, S.; Maheshwari, V. Thermal reduction to control the spacing in graphene oxide membranes: Effect on ion diffusion and electrical conduction. RSC Adv. 2016, 6, 70012–70017. [Google Scholar] [CrossRef]
  40. Aguey-Zinsou, K.F.; Ares-Fernandez, J.R.; Klassen, T.; Bormann, R. Using MgO to improve the (de)hydriding properties of magnesium. Mater. Res. Bull. 2006, 41, 1118–1126. [Google Scholar] [CrossRef]
  41. Ares-Fernández, J.R.; Kondo-Francois, A.Z. Superior MgH2 kinetics with MgO addition: A tribological effect. Catalysts 2012, 2, 330–343. [Google Scholar] [CrossRef] [Green Version]
  42. Tarcan, R.; Todor-Boer, O.; Petrovai, I.; Leordean, C.; Astilean, S.; Botiz, I. Reduced graphene oxide today. J. Mater. Chem. C 2020, 8, 1198–1224. [Google Scholar] [CrossRef]
  43. Peng, K.; Zhu, L.; Li, F.; Xu, G. Self-supporting electrode composed of SnSe nanosheets, thermally treated protein, and reduced graphene oxide with enhanced pseudocapacitance for advanced sodium-ion batteries. ChemElectroChem 2019, 6, 5642–5650. [Google Scholar]
  44. Li, J.; Jiang, J.; Zhao, D.; Xu, Z.; Liu, M.; Liu, X.; Tong, H.; Qian, D. Novel hierarchical sea urchin-like prussian blue@palladium core-shell heterostructures supported on nitrogen-doped reduced graphene oxide: Facile synthesis and excellent guanine sensing performance. Electrochim. Acta 2020, 330, 135196. [Google Scholar] [CrossRef]
  45. Chen, H.; Chen, Z.; Yang, H.; Wen, L.; Yi, Z.; Zhou, Z.; Dai, B.; Zhang, J.; Wu, X.; Wu, P. Multi-mode surface plasmon resonance absorber based on dart-type single-layer graphene. RSC Adv. 2022, 12, 7821–7829. [Google Scholar] [CrossRef]
  46. Li, J.; Jiang, J.; Xu, Z.; Liu, M.; Tang, S.; Yang, C.; Qian, D. Facile synthesis of Ag@Cu2O heterogeneous nanocrystals decorated N-doped reduced graphene oxide with enhanced electrocatalytic activity for ultrasensitive detection of H2O2. Sens. Actuators B Chem. 2018, 260, 529–540. [Google Scholar] [CrossRef]
  47. Cheng, Z.; Liao, J.; He, B.; Zhang, F.; Zhang, F.; Huang, X.; Zhou, L. One-step fabrication of graphene oxide enhanced magnetic composite gel for highly efficient dye adsorption and catalysis. ACS Sustain. Chem. Eng. 2015, 3, 1677–1685. [Google Scholar] [CrossRef]
  48. Smith, A.T.; LaChance, A.M.; Zeng, S.; Liu, B.; Sun, L. Synthesis, properties, and applications of graphene oxide/reduced graphene oxide and their nanocomposites. Nano Mater. Sci. 2019, 1, 31–47. [Google Scholar] [CrossRef]
  49. Feng, J.; Ye, Y.; Xiao, M.; Wu, G.; Ke, Y. Synthetic routes of the reduced graphene oxide. Chem. Pap. 2020, 74, 3767–3783. [Google Scholar] [CrossRef]
  50. Blaine, R.L.; Kissinger, H.E. Homer Kissinger and the Kissinger Equation. Thermochim. Acta 2012, 540, 1–6. [Google Scholar] [CrossRef]
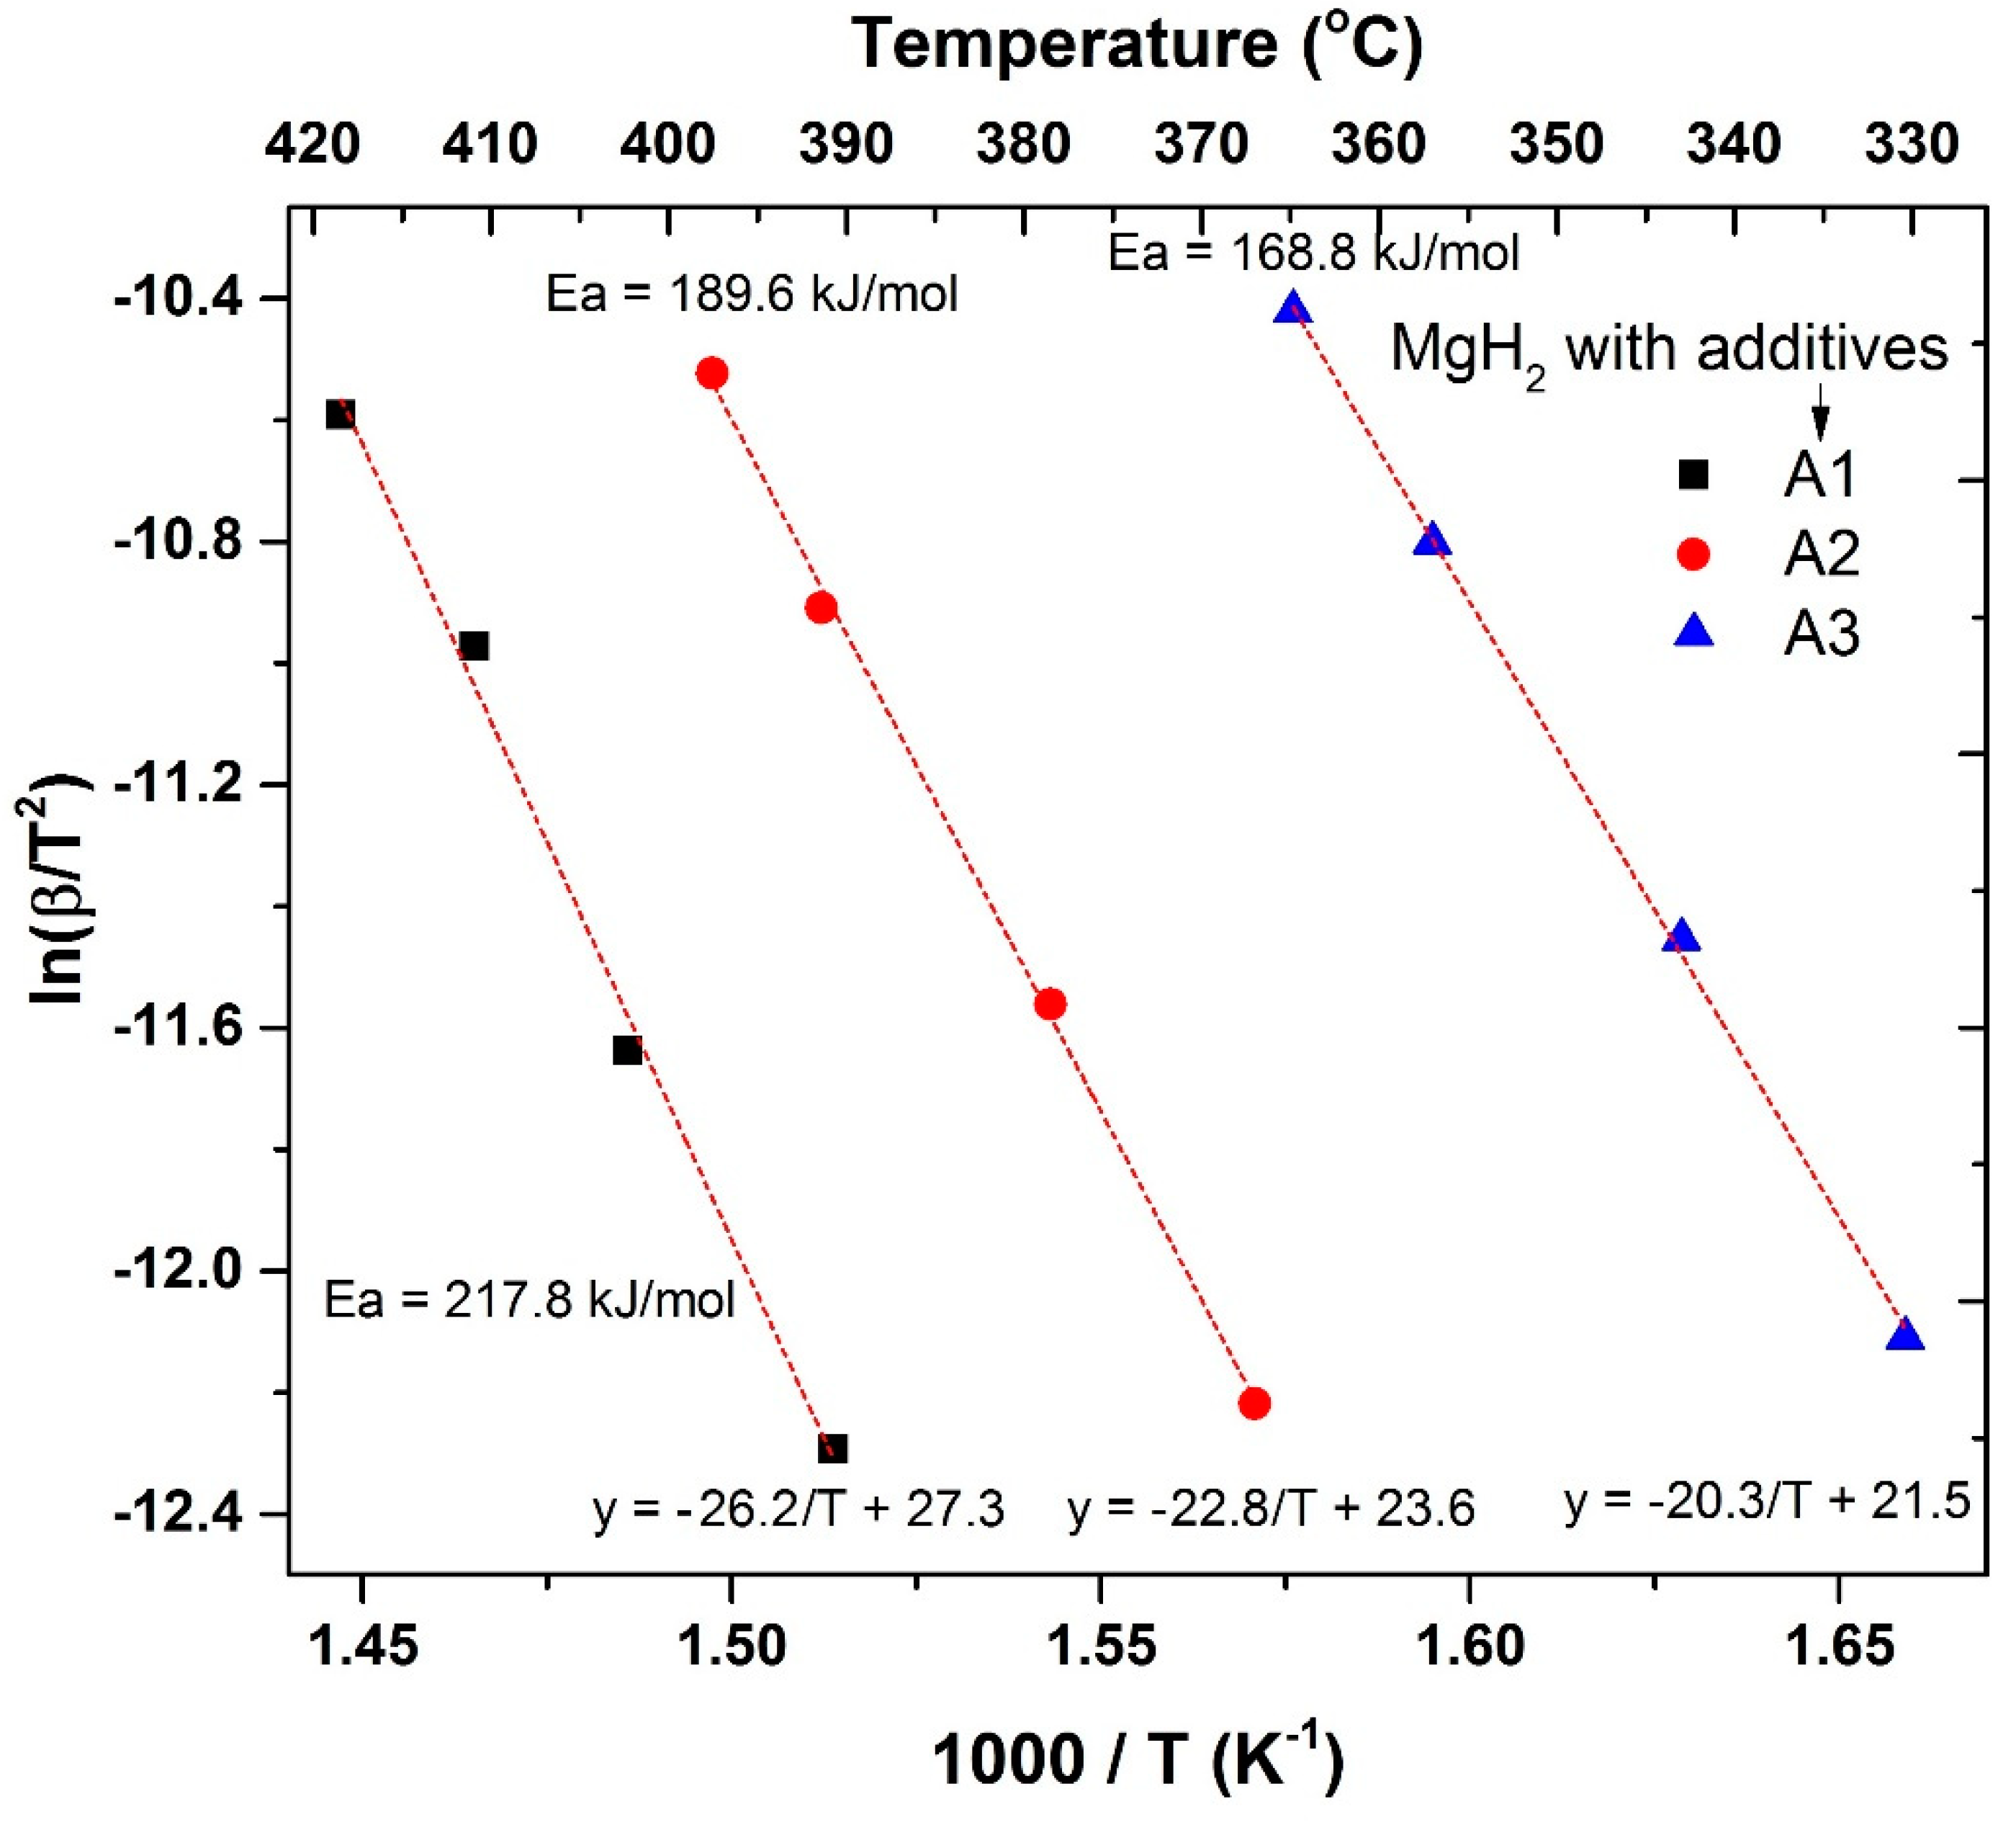
Figure 1. Dehydrogenation kinetics profiles obtained for 5 wt.% GO incorporated MgH2. Profile “a’’ corresponds to the as-prepared sample, and profile “b” corresponds to the hydrogen-restored sample. Dehydrogenation temperature/pressure: 315 °C/1 bar.
Catalysts 12 00735 g001
Figure 2. X-ray diffraction patterns correspond to 5 wt.% GO incorporated MgH2, (a) as-prepared sample, (b) re-hydrogenated sample after dehydrogenation.
Catalysts 12 00735 g002
Figure 3. Differential scanning calorimetry profiles for MgH2 with 5 wt.% GO. The additive GO was incorporated through three different approaches: (a) in the form of as-received GO (additive code A1), (b) 5 wt.% GO pre-milled with an equal quantity of MgH2 (additive code A2), and then added to the remaining MgH2, and (c) the powder A2 heat-treated to 315 °C (additive code A3) and then added to the remaining MgH2.
Catalysts 12 00735 g003
Figure 4. XRD patterns correspond to A1, A2 and A3 (A1 is as-received GO, A2 is the GO-MgH2 mixture in 1:1 weight ratio milled for 2 h, and A3 is the same powder after heating to 315 °C under H2 atmosphere.
Catalysts 12 00735 g004
Figure 5. Raman spectra corresponding to the samples A1, A2 and A3. “D” stands for defect band and “G” stands for graphitic band.
Catalysts 12 00735 g005
Figure 6. Fourier transform infrared spectra corresponding to the samples A1, A2 and A3.
Catalysts 12 00735 g006
Figure 7. Atomic force microscopy study for samples A1 (images (a1a3)), A2 (images (b1b3)) and A3 (images (c1c3)). Each row, left to right: 2D image, 3D image, and distance vs. height profile.
Catalysts 12 00735 g007
Figure 8. Dehydrogenation and rehydrogenation kinetics profiles obtained for GO-based additives A1, A2 and A3 incorporated MgH2: (a) dehydrogenation kinetics (315 °C/1 bar) and (b) hydrogenation kinetics (315 °C/6 bar).
Catalysts 12 00735 g008
Figure 9. Kissinger plots obtained for A1, A2 and A3 incorporated MgH2. The activation energy values are given in the figure.
Catalysts 12 00735 g009
Table 1. Summary of data obtained from Kissinger profiles for additives A1, A2, A3 incorporated MgH2.
Additive to MgH2Straight Line EquationR2 ValueActivation Energy (Ea), kJ/molStandard Deviation of Ea Value, kJ/mol
A1−26.2/T + 27.30.992217.816.2
A2−22.8/T + 23.60.998189.64.5
A3−20.3/T + 21.50.999168.83.0
Table 2. Summary of data proving the influence of GO to rGO in situ transformation on the hydrogen storage behavior of MgH2. The data corresponding to pure MgH2 was obtained from the literature [28].
Sample InfoDesorption Temperature (from DSC, ΔT = 2 °C/min)Max Kinetics (wt.%/Minute)
Hydride and additiveAdditive Composition (as per XRD)Onset temperatePeak temperaturedesorption at 315 °C/1 bar H2absorption at 315 °C/6 bar H2
MgH2 with A1Pure GO355 °C388 °C0.033 wt.%/min0.150 wt.%/min
MgH2 with A2Partially reduced GO, MgO300 °C363 °C0.047 wt.%/min0.161 wt.%/min
MgH2 with A3rGO and MgO285 °C330 °C0.060 wt.%/min0.439 wt.%/min
Pure MgH2-380 °C415 °C--
Publisher’s Note: MDPI stays neutral with regard to jurisdictional claims in published maps and institutional affiliations.

