Article

Aqueous-Phase Glycerol Conversion over Ni-Based Catalysts Synthesized by Nanocasting

by
Adriana Morales-Marín
1,
Unai Iriarte-Velasco
2,
Miguel Ángel Gutiérrez-Ortiz
1 and
Jose Luis Ayastuy
1,*
1
Department of Chemical Engineering, Faculty of Science and Technology, University of the Basque Country (UPV/EHU), 48940 Leioa, Spain
2
Department of Chemical Engineering, Faculty of Pharmacy, University of the Basque Country (UPV/EHU), 01006 Vitoria-Gasteiz, Spain
*
Author to whom correspondence should be addressed.
Catalysts 2022, 12(6), 668; https://doi.org/10.3390/catal12060668
Submission received: 27 May 2022 / Revised: 15 June 2022 / Accepted: 15 June 2022 / Published: 18 June 2022
(This article belongs to the Special Issue Catalytic Conversion of Glycerol)

Abstract

:
A morphological strategy consisting of nanocasting synthesis of nickel aluminate spinel precursor was addressed. Two nanocasted catalysts were synthesized involving different template-removal procedures (i.e., Teflon-assisted calcination vs. NaOH washing) for spinel recovery. As a reference, spinel NiAl2O4 supported by SBA-15 and bare nickel aluminate spinel were selected. The obtained solids were characterized in detail, examining their textural, acid–base, structural and compositional characteristics, either in the calcined or reduced forms. The as-obtained catalysts’ performance was evaluated in the aqueous-phase reforming of glycerol at 235 °C and 35 bar. Exhausted samples were also characterized to enlighten changes in catalyst properties during the aqueous-phase reaction. NiAl/SBA-15 and NiAl-NCF catalyst showed very poor catalytic performance for the glycerol transformation. NiAl-NCN catalyst presented improved activity with respect to NiAl, with a 20% higher hydrogen production rate but, as a drawback, higher methane formation for a whole range of glycerol conversions. Exhausted catalyst indicated nickel oxidized in liquid phase reaction.

1. Introduction

In the most recent decade, the climate system has undergone various changes in the atmosphere, biosphere, cryosphere, and oceans, which evidence the climate emergency [1]. In the 2011–2020 period, the global mean surface temperature has increased on average by 1.09 °C (0.95–1.20 °C). The amount of energy that Earth’s oceans have adsorbed increased by 1024 joule between 1971 and 2018, and in response, the global mean sea level rose by 0.20 m by 2018. Snow cover decreased, and the shrinking of glaciers has led to the lowest total glacier mass. The annual land area mean precipitation in the Northern Hemisphere temperate regions has increased, while it decreased in the sub-tropical dry regions. In addition, severe wildfires and the resulting deforestation have also increased [2]. The substantial increase in anthropogenic Green House Gas (GHG) emissions to 52 GtCO2-eq/yr has boosted global warming [3]. Being the energy sector the main source (around three-quarters), thus it holds the key to the goal of limiting global warming to less than 2 °C by 2050, as signed in the Paris Climate Agreement (2015) [4]. In this line, the future transformation of the energy sector could connect climate change mitigation challenges with social development and equity.
This work is driven to contribute to this matter, specifically to seek possible synergies between biofuels and renewable hydrogen production chains by producing H2-rich streams from bioglycerol. Currently, most fuels and chemicals are produced from fossil raw materials with the resulting environmental problems. The use of biomass is one alternative for sustainable development.
Glycerol, an abundant by-product of biodiesel, is considered one of the platform molecules derived from biomass that can be transformed into high-value-added products. A stable crude glycerol generation is expected in the near future [5], ensuring its availability as feedstock for conversion processes.
Glycerol can be converted into H2 or chemicals by means of energetically advantageous conversion in the aqueous phase [6]. The H2 production by the aqueous-phase reforming (APR) of glycerol allows the valorization of biorefinery waste streams without employing fossil sources. APR process, first reported in the early 2000s, consists of a one-step catalytic process, which operates at low temperatures (150–270 °C) and pressures high enough to keep the reactants in the liquid phase (usually 15–60 bar) [7]. Therefore, it avoids the energetically intensive steam generation step necessary in steam reforming (SR) [8]. Waste aqueous streams from lignocellulosic biomass treatments [9], food industry [10], petrochemicals [11], or biodiesel industry [12] can be processed by APR to convert oxygenated molecules into valuable products [13]. For glycerol, the complete reforming ideally yields seven moles of H2, and three moles of CO2, per mole of glycerol that reacts, as shown in Equation (1).
C 3 H 8 O 3 ( l ) + 3 H 2 O ( l )     3 CO 2 + 7 H 2
The reforming reaction mechanism consists of many reactions, but it can be described as the sum of two consecutive steps: decomposition of glycerol by C-C bond cleavage and subsequent WGS. However, undesired side reactions must be taken into account in the global process, including hydrogenation of CO and CO2, along with Fisher–Tropsch and dehydration, among others [6].
The low temperature of the APR enhances the Water–Gas Shift (WGS) reaction (chemical equilibrium) and enables low-CO streams. These streams can be directly fed to the fuel cell to produce power, heat, or gas fuel [14]. At the same time, the high pressure employed makes the produced gaseous stream more suitable for in situ CO2 capture and sequestration by Pressure Swing Adsorption or membrane technologies [15].
A proper catalyst formulation for APR should ideally provide high reaction rates under optimal operating conditions, high selectivity to H2, and resistance against deactivation, and should avoid the use of noble metals for economic purposes. Moreover, the catalyst must be effective in breaking the C-C, O-H, and C-H bonds. In addition, the catalyst should promote the WGS reaction of adsorbed CO since it prevents catalyst poisoning and avoids hydrogenation reactions of CO and/or CO2 to form alkanes via methanation and FT reactions [15]. The choice of the active metal, the possible promoters, and the type of the support are critical for the APR performance since they can strongly affect the active phase dispersion, environment, acidity, etc. [16,17].
Platinum is the most studied metal for APR since it combines high activity and moderate selectivity [15]. Provided its much lower cost and comparability to noble metal catalytic performance, Ni is a promising metal for APR applications, either as a monometallic [18] or bimetallic catalytic system [19]. In previous work, we reported a nickel catalyst derived from nickel aluminate spinel precursor as very active for H2 production [18]. Other requirements for the catalyst are related to a high specific surface area, smaller crystals (high dispersion), and hydrothermal and chemical stability [16].
This paper addresses the synthesis of a nickel aluminate by nanocasting for the glycerol AP conversion, using SBA-15 as a hard template. This strategy could lead to a nanostructured nickel aluminate with improved accessibility and stability properties, which are particularly desirable for processes that take place at the solid-liquid interphase [20]. Indeed, nanocasted catalysts can enhance the transport and diffusion of the reactants and products, providing a shorter diffusion pathway and a higher surface/volume ratio [21].
The catalytic performance, in terms of H2 production, can be improved by using nanocasted catalysts. However, structured Ni catalysts have been mostly tested in gas-phase reactions. For instance, nanostructured Ni-based spinel showed high activity and stability in the dry methane reforming for hydrogen production [22,23]. Steam-reforming (SR)-supported Ni/SBA-15 catalysts achieved high CH4 conversion for the combined steam methane reforming (SMR) and Water–Gas Shift (WGS) reaction [24]. Furthermore, bimetallic Ni-(Cu, Co, Cr)/SBA-15, with small Ni crystallites, showed a good performance in the glycerol SR [25]. The number of works focused on the aqueous-phase reaction by supported ordered mesoporous catalysts is scarce [26]. Moreover, to the best of our knowledge, the nanocasting of mixed oxides for the aqueous-phase conversion of glycerol has not been reported yet.
Here, a nickel aluminate spinel supported over SBA-15 is prepared. The removal of the SBA-15 template is by two methods, i.e., by leaching with NaOH and by Teflon-assisted calcination. The later procedure avoids using toxic HF since the silica framework can be removed through the formation of SiF4 [21]. As a reference, bare nickel aluminate spinel has also been synthesized. The prepared catalysts have been investigated in the liquid-phase glycerol conversion, and the catalytic results are correlated with the intrinsic characteristics of the catalysts.

2. Results

2.1. Catalysts Characterization

2.1.1. Surface Characteristics

The bulk chemical composition of the solids is reported in Table 1. The Ni/Al molar ratio of NiAl/SBA-15 was 0.6, which is higher than the stoichiometric value (0.5), suggesting that nickel salt was better diffused into the silica pores. Indeed, the synthesis of bimetallic oxides supported on the SBA-15 template is challenging, especially the control over the resultant chemical composition and phases [27,28]. Ni/Al ratio notably changed after template removal. On the one hand, the Ni/Al ratio in NaOH-etched NiAl-NCN catalyst increased by 17% (up to 0.74), associated with the leaching of aluminum. It is known that aluminum can form water-soluble sodium aluminate in basic media, which would promote Al leaching [29]. On the other hand, the bulk Ni/Al ratio of NiAl-NCF (0.48) remained close to the stoichiometric value. In general, ICP results revealed a massive removal of Si from the hard template in both NiAl-NCN and NiAl-NCF replicates, even though some residual silica (<3%) remained. NaOH etching was more efficient than calcination with Teflon for silica removal. It seemed that SBA-15 could hinder the formation of the NiAl2O4 phase during the calcination. As previously noted, the loss of active metals during the template removal, caused the imbalance of Ni/Al stoichiometric proportion.
The N2 adsorption-desorption isotherms and the pore size distribution of the calcined and reduced forms of the solids are shown in Figure 1. All the solids exhibited type IV isotherms (IUPAC classification) with an H1 hysteresis loop (condensation and evaporation steps characteristic of periodic mesoporous materials). There are no substantial differences among the isotherms for calcined and reduced forms of the solids, which indicated that porous structure was maintained upon reduction. The narrow range of P/P0 of the hysteresis from SBA-15 was consistent with the presence of tubular pores of uniform size [30]. The bimodal pore size distribution in the NiAl/SBA-15 composite could be ascribed to the partial blockage of template pores by the newly formed oxide. BET surface area (SBET) of the calcined and reduced forms (reduced at 700 °C, 1 h) of the solids are shown in Table 1. SBA-15 material prepared by hydrothermal synthesis and calcination at 850 °C showed an SBET of 459 m2/g, an average pore diameter of 5.5 nm, and a pore volume of 0.76 cm3/g. Both SBET and Vpore of NiAl/SBA-15 assay decreased by around 60%, indicating pore filling by the oxides. The template removal method was affected differently on the SBET. NiAl-NCF showed a severe pore collapse (SBET decreased by 62% with respect to NiAl/SBA-15), with a notable increase in the average pore diameter (22.1 nm), likely due to the collapse of small pores. On the contrary, NaOH-etched NiAl-NCN assay increased its SBET by 46% with respect to parent NiAl/SBA-15 (210 vs. 306 m2/g). These assays showed similar pore volume and average pore width, suggesting the formation of a wormhole-like rod structure after removal of the siliceous template. According to [26], the incomplete filling of the pores during the impregnation step could form such a pore structure. It is noticeable that NiAl/NCN assay had 3-fold higher SBET than the reference NiAl (306 vs. 98 m2/g).
After reduction, SBET decreased for all solids (i.e., 15–53%). The reference NiAl solid showed the highest textural stability to reduction treatment (i.e., 15% decrease). Nonetheless, NiAl/SBA-15 and NiAl-NCN still showed a higher SBET than that of NiAl. Again, NiAl-NCF showed a less porous surface.
Aqueous-phase reforming of glycerol involves, among others, dehydration reactions [31], which are very sensitive to the catalyst’s surface acid–base properties [32]. Indeed, Pt- catalysts are more affected by acidity and the Pt domain size [33]. Basic surfaces are known to enhance H2 selectivity via WGS promotion (a key step in APR, where CO is converted with additional production of H2) [34]. Acid surfaces, on the contrary, promote dehydration, giving rise to hydrogen-consuming liquid intermediates [33], thus promoting the production of alkanes and HDO products. The acid and basic site density were calculated from NH3-TPD and CO2-TPD, respectively. Table 1 shows the acid/base site ratio of the reduced forms of solids. Reference NiAl assay showed amphoteric characteristics since the acid/base ratio was 1.7. When NiAl was supported onto the siliceous template, the ratio increased by 4 (up to 7.2). Interestingly, among the nanocasted solids, NiAl-NCN decreased the acid/basic sites ratio with respect to its parent solid (2.7 vs. 7.2) while NiAl-NCF solid increased by two-fold (15.7). The amphoteric nature of the alumina affected the acidity of the solids more significantly than SiO2 did.

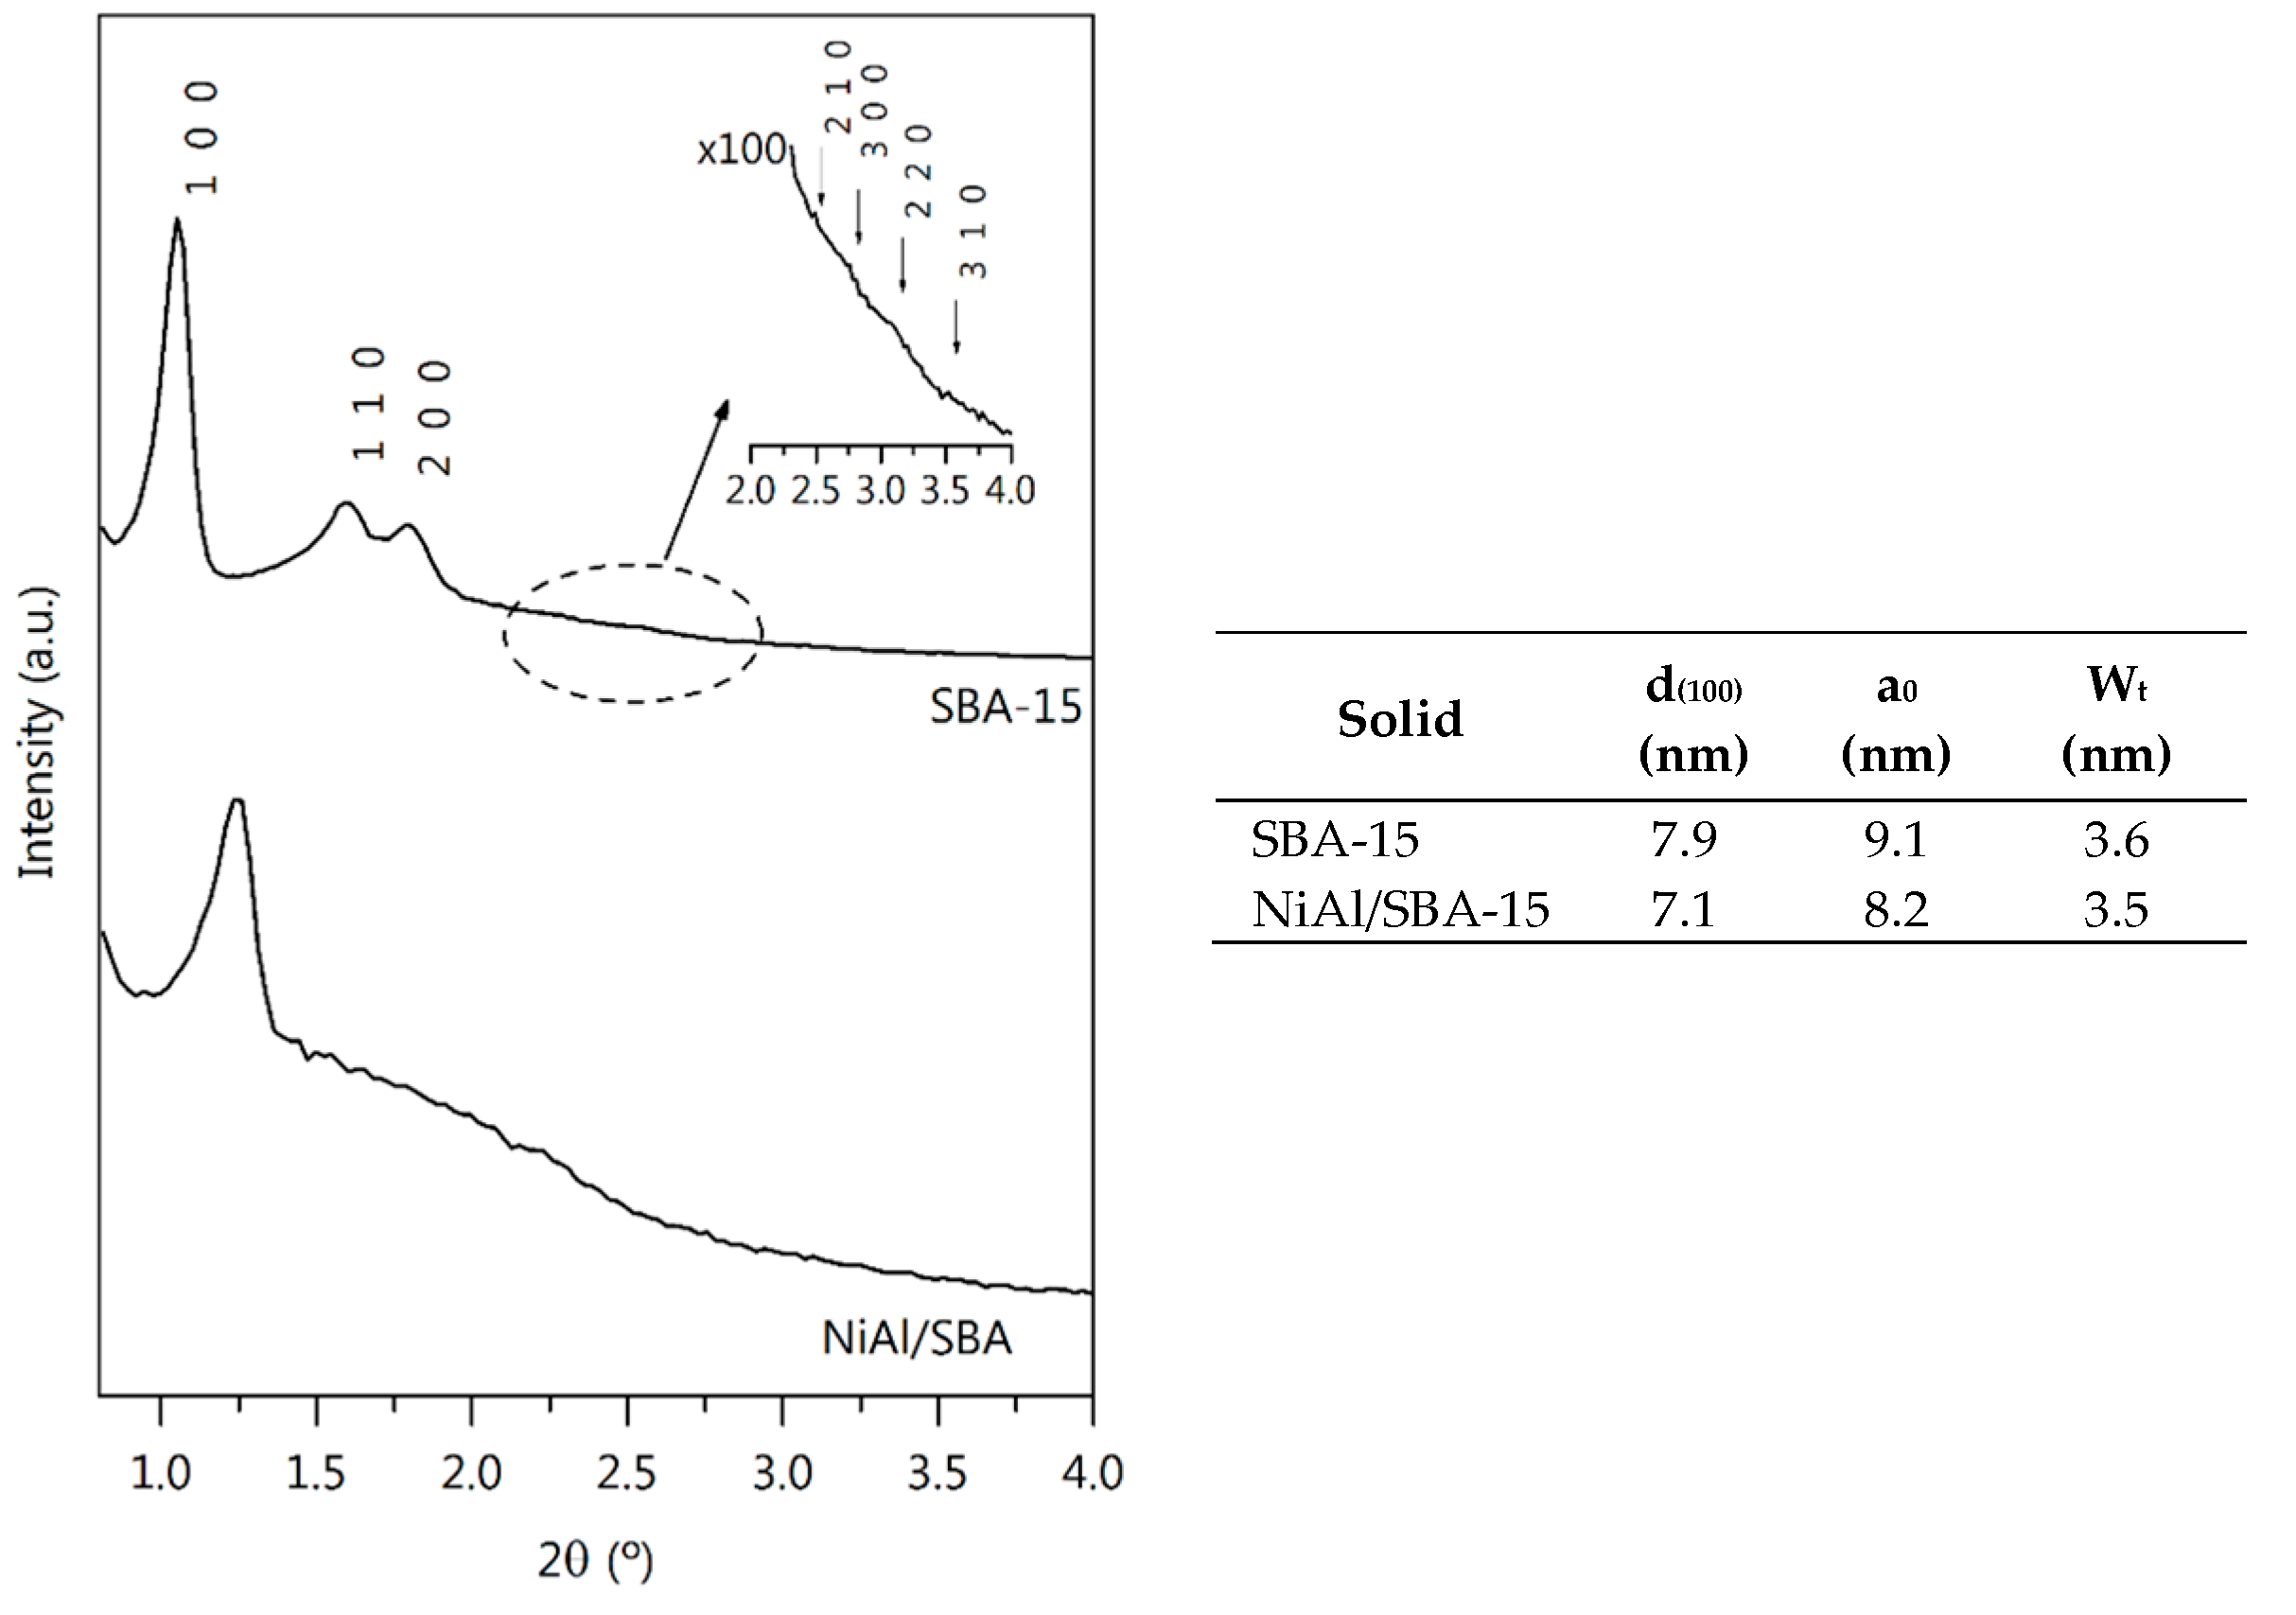
2.1.2. Morphological and Structural Characteristics

The template SBA-15 calcined at 850 °C showed characteristic Si-O transmittance bands and O-H stretching bands in its FTIR spectrum (Figure S1, Supplementary Materials). A wide, intense peak at 3600–3000 cm−1 and a peak at around 1620 cm−1 was associated with the O-H bending of the silanol group and stretching vibration mode of the water in the interlayer spaces, respectively [35]. The strong band in the 1200–920 cm−1 region was due to the asymmetric stretching mode of Si-O-Si.
Low angle XRD diffractograms of the SBA-15 template and NiAl/SBA-15 composite are shown in Figure 2. The 2-D hexagonal (p6mm) mesoporous structure of the SBA-15 was confirmed by the diffraction peaks at 1.1°, 1.8°, and 2.1° (2θ) [36].
The intense (1 0 0) peak and the corresponding unit cell spacing obtained indicated a large unit-cell parameter of the template (9.1 nm). The pore wall thickness of 3.6 nm was estimated by subtracting the average pore diameter from the unit cell spacing. It is worth noting that, despite being calcined at a temperature as high as 850 °C, the obtained SBA-15 presented high structural stability, as evidenced by the presence of the peak (1 0 0) peak. The (1 0 0) plane of NiAl/SBA-15 composite upshifted by around 2 = 1.25°, which reflected a smaller unit cell spacing (8.2 nm). The very low intensity of (1 1 0) and (2 0 0) X-ray diffraction peaks for this solid suggested a less-organized pore structure, which could be due to the presence of nickel and aluminum-containing species in the porous system. The wall thickness for NiAl/SBA-15 was almost the same as the SBA-15 template (3.5 nm). The low-angle XRD patterns for both nanocasted samples, much weaker, are also included in the inset of Figure 3A. On the one hand, NiAl-NCN presented a peak at small angles corresponding with the 2-D structure (1 0 0), suggesting a wormhole-like rod structure replica of the SBA-15 template after NaOH etching. The broadness and not well resolved p6mm reflections indicated hollow framework interference with the diffraction lines [26]. On the other hand, the low-angle diffractogram of NiAl-NCF seemed smooth, which could be due to a structural deterioration owing to the Teflon-assisted calcination.
Wide-angle XRD diffractograms for all calcined solids are shown in Figure 3A. A large bump indicating the presence of amorphous silica was noticed for all solids except NiAl. Moreover, XRD of all solids showed features of cubic NiAl2O4 spinel phase (JCPDS 78-1601). In the case of the NiAl/SBA-15 solid, characteristic diffraction peaks of NiO were also observed (JCPDS 01-78-0643). Due to the larger than stoichiometric Ni/Al ratio in this sample, the excess of Ni was segregated as NiO, resulting in an XRD signal [37]. Among nanocasted solids, only NiAl-NCN contained NiO phase, in accordance with its higher than stoichiometric Ni/Al ratio. Concomitantly, the lower than stoichiometric ratio of NiAl-NCF solid would explain the absence of NiO peaks in its diffractogram. In the later solid, the spinel characteristic features were slightly upshifted, suggesting the spinel was enriched in alumina (nickel-defective spinel phase). In addition, peaks from the mullite phase (Al6Si2O13) were detected (JCPDS 015-0776). Other diffraction signals (at 8.72, 34.7, 42, 44.3, 64.1° 2θ), probably due to new species formed during the calcination with Teflon, could not be identified.
Upon reduction, diffraction peaks related to metallic nickel were visible for all samples at 45, 52, and 77° 2θ positions (JCPDS 01-078-0712). Furthermore, for all the solids, peaks from the spinel phase remained, which suggested that the employed reduction temperature (700 °C) was not high enough to exudate all the Ni0 from the spinel framework.
The values of the average metallic nickel domain size (dNi0-XRD), calculated from the X-ray broadening, are summarized in Table 1. Notably, metallic nickel crystallites in NiAl/SBA-15 solid were larger than the unit-cell parameter of the template (24.3 vs. 9.1 nm), suggesting that part of nickel was deposited in the external surface of the template. Among the nanocasted solids, NiAl-NCN presented the smallest average size of Ni0 crystals (6.7 nm). On the contrary, very big metallic nickel domains were observed for the NiAl-NCF solid.
To further investigate the catalyst morphology and particle size, TEM analysis was carried out (Figure 4). In its calcined form, the synthesized SBA-15 template evidenced an ordered mesoporous network with long-parallel channels of pores. The image analysis (ImageJ software) allowed us to measure the channel pore size (4.5 nm), which was close to that estimated from the N2 physisorption (dpore = 5.5 nm). Moreover, the distance between the channel walls was 9.2 nm, in good agreement with the unit cell spacing estimated from XRD. In NiAl/SBA-15 composite, NiAl particles were observed either in the inner part of the channels or outside of them.
After template removal, TEM micrographs of NiAl-NCF and NiAl-NCN calcined samples displayed particles of homogeneous morphology and similar sizes that were closer to each other. A wormhole-like rod structure was evidenced for both solids, as also detected by nitrogen isotherms and low-angle XRD. The most notable difference between nanocasted solids and reference NiAl was less uniform morphology, lower particle density, and less ordering of the latter.
For fresh reduced NiAl/SBA-15 assay, near-spherical particles were found of very different sizes, ranging from 5 to above 50 nm (average 25.8 nm), which agreed with the NiAl distribution in the channels and outside of the template. The nanocasted solids showed nearly spherical-shaped metallic Ni particles that could be observed for NiAl-NCN solid, with a homogeneous and ordered appearance. Contrarily, NiAl-NCF catalyst contained agglomerates of Ni0 particles of different shapes. For example, cubic agglomerated Ni0 particles could be observed for this solid. For NiAl-NCN solid, the Ni0 particles had unimodal size distribution, with a maximum at about 9 nm, which was smaller than that of reference NiAl (12 nm). Calcination with Teflon led to a wide particle size distribution (particles in the 11 to 50 nm range) with an average particle size of 31.7 nm, much larger than that of reference NiAl. The formation of hot spots in the calcination with Teflon could promote the coalescence of nickel particles.
Among the nanocasted solids, NiAl-NCN solid presented the highest Ni0 surface area (Table 1), even higher than that of reference NiAl (17.9 vs 14.1 m2Ni0/g); therefore, it had the highest nickel dispersion (12%). On the contrary, NiAl-NCF showed a very low metallic area, in agreement with its larger Ni0 particle size, which limited metal dispersion (4-fold lower than that of NiAl-NCN). Their precursor NiAl/SBA-15 showed low dispersion and metallic area, suggesting that most of the NiAl particles were deposited on the template surface. Based on the TEM micrographs, it could be concluded that the nanocasted solid’s morphology was highly influenced by the template removal procedure. It could be seen that NaOH etching enhanced the nickel dispersion, while the Teflon-assisted removal approach yielded a catalyst with a less accessible Ni0 surface. The existence of other nickel-containing phases not detected by XRD cannot be discarded.

2.1.3. Reducibility and Speciation Analysis

The reducibility of the solids was analyzed by H2-TPR. The reduction profiles, up to 950 °C (TPR950), of the calcined solids are shown in Figure 5. The obtained profiles, with a long left tail, indicated nickel species of different reducibility. Similar to parent NiAl, all calcined solids presented peaks in three temperature zones, namely α, β and γ, which are related to the H2 consumption at low, medium, and high temperatures, respectively. The peak assignment was as follows [18,38]: peak-α (free NiO particles at the surface), peak-β (nickel in sub-stoichiometric spinel Ni1-XAl2O4-X), and peak-γ (nickel in stoichiometric spinel NiAl2O4). Peak-β was split into two contributions: β1 (at a lower temperature) and β2 (at a higher temperature), referred to as Ni-rich and Ni-lean Ni1-XAl2O4-X solid, respectively [18].
For the reference NiAl catalyst, the peak-α was centered at around 450 °C, peak-β at around 600 and 685 °C, and peak-γ at around 790 °C. The H2 consumption in the 550–740 °C range could also involve the contribution of Ni2+ species interacting with silica [24], as suggested by the XRD data.
The hydrogen consumption in TPR950 is reported in Table 2. It is remarkable the similarity to theoretical hydrogen uptake (within the experimental error) for NiAl and NiAl/SBA-15 solids. It was related to a complete reduction of Ni species in those calcined solids. However, for both nanocasted solids, about 20% lower than theoretical hydrogen consumption was measured. The existence of hardly reducible Ni2+ species (for instance, mullite, as observed by XRD) could explain such a difference. For reference, NiAl solid, free NiO (α-peak), accounted for 1.5% of the total Ni loaded, while β-type nickel accounted for 53.8%. A similar distribution of α and γ Ni2+ species remained for the composite solid, with a little trade-off between β1 and β2 contributions. For the nanocasted NiAl-NCF solid, the contribution of α-type nickel was similar to its parent solid (1.6%); however, γ-peak contribution fell by half, with the concomitant increase in β-type contribution (77.7% vs. 47.8%). The nanocasted NiAl-NCN solid showed an increased amount of α-type nickel species whereas γ-peak slightly decreased as compared to its parent solid. Indeed, this solid had the largest contribution of α-type nickel among all (6.2%). Both nanocasted solids presented a higher proportion of β-type nickel species than their parent solid NiAl/SBA-15. It is known that free NiO offers poor nickel anchoring, leading to bigger Ni0 particles upon reduction [39]. Therefore, it was expected that NiAl-NCN, the one with the highest contribution of α-type nickel species, had the biggest Ni0 entities. However, it had the smallest ones (around 30 nm, Table 1), suggesting that the growth of the crystal was controlled by the SBA-15 framework.
Prior to the catalytic runs, the catalysts were reduced at 700 °C for 1 h. In order to measure the reduction degree of Ni (DRNi) and the amount of metallic Ni exuded from the spinel lattice, the so-called TPR700–950 procedure was used, which consisted of a TPR analysis for a solid reduced at 700 °C for 1 h. The obtained TPR700–950 profiles are shown in Figure 5. The obtained profiles consisted of weak reduction peaks at temperatures above 700 °C, which indicated that after the reduction treatment, a fraction of nickel remained in the stoichiometric spinel phase, i.e., as γ-type nickel. The degree of reduction of nickel (DRNi), calculated as the percentage of hydrogen uptake in TPR700 with respect to that in TPR950, decreased as follows: NiAl-NCF > NiAl-NCN > NiAl/SBA > NiAl (see Table 2). It was evidenced that nickel reducibility was promoted in the composite and nanocasted catalysts.

2.2. Catalytic Performance Tests

A priori, advantageous physicochemical characteristics were found for catalysts synthesized by nanocasting methodology, especially for NiAl-NCN. Superior BET area, some mesostructured order, and high reducibility were, in general, the improved physicochemical characteristics of this sample. Moreover, controlled growth of Ni0 crystallites was found in the solids that presented structural ordering. The effect of those characteristics on the glycerol APR is discussed in this section.
The catalytic performance of the catalysts in the aqueous-phase transformation of glycerol was evaluated in a tubular reactor. Reaction indices shown were obtained at TOS = 3 h. It must be noted that reaction indices remained constant during the 3 h run (Figure S2, Supplementary Materials). In order to ensure that experiments were performed in a kinetic regime, i.e., in the absence of mass transfer limitations, the Weisz–Prater (ΦWP) and Mears criteria (MR) were applied for the internal and external mass transfer limitations, respectively. The fastest reaction rate and the larger catalyst particle size were taken as the most critical condition [40], and the obtained data (Table S1, Supplementary Materials) indicated the absence of internal and external mass transfer limitations.
Figure 6A shows the global glycerol conversion (XGly) and conversion to gas (XGas), as well as hydrogen yield (YH2). The activity of NiAl/SBA-15 and NiAl-NCF was much lesser than the reference NiAl catalyst (XGly of 6% and 19%, respectively, vs 64% by NiAl). Accordingly, the former achieved a very low hydrogen yield, below 2%. Catalyst NiAl-NCN showed higher activity (XGly = 80%; XGas = 40%) than the reference catalyst NiAl (XGly: 64%; XGas: 27%). Moreover, NiAl-NCN achieved the highest hydrogen yield (9.4%).
The superior performance of NiAl-NCN could be associated with its improved metallic Ni accessibility (Table 1) and its two-fold higher SBET, with wormhole-like rods, which could facilitate the diffusion throughout the solid. The large Ni0 domains and the low metallic nickel surface area could explain the poor performance of the NiAl-NCF catalyst. In the case of NiAl/SBA-15 catalyst, its limited activity could be associated with the encapsulation of Ni0 inside the SBA-15 channels, hindering its availability for reactants. Moreover, NiAl/SBA-15 contained 50% larger Ni0 crystallites than NiAl.
Table S2 (Supplementary Materials) shows a comparison between our NiAl and NiAl-NCN assays and other Ni catalysts reported in the literature).

2.2.1. Gas-Phase Products

Figure 6B depicts the selectivity of H2 and CH4. SH2 increased in the following order: NiAl/SBA-15 < NiAl-NCF < NiAl-NCN < NiAl. Regarding the SCH4, it was maximum for NiAl-NCN (i.e., 45.7% vs. 32.8% of NiAl). The less active catalysts presented SCH4 values below 15.2%. These results evidenced H2 consumption by side reactions, promoted by the high Ni0 accessibility in NiAl-NCN catalyst, which contained the smallest metallic entities. NiAl-NCN achieved a 20% larger H2 production rate than NiAl (0.28 vs. 0.23 mmolH2/gcat·min). As a drawback, it had the highest SCH4 (45.7%). An increase in the H2 partial pressure inhibits the reforming reaction; hence, the H2 was consumed in a side methanation reaction [41,42].
Characteristic properties of the gaseous stream are shown in Table 3. It can be observed that the selectivity to gas varied as follows: NiAl-NCN> NiAl> NiAl-NCF> NiAl/SBA-15, being ~50% lower for NiAl/SBA-15 and NiAl-NCF than for NiAl. NiAl-NCN catalyst enhanced the production of gaseous products (FGas) (i.e., 1.4 times that of reference NiAl). Finally, NiAl-NCF presented poor FGas and SGas, in line with its poor glycerol conversion.
H2 was the most abundant gas product by all catalysts, followed by CO2 and CH4, which account for more than 97 vol.% of the reaction products. Other compounds such as CO and C2+ were found in much lesser concentrations. In contrast to the steam reforming of glycerol at atmospheric pressure, where CO and H2 are the main products (CO/H2 = 0.5) [41,43], in the aqueous-phase conversion, only trace amounts of CO (CO/H2 < 0.04) were generated. This behavior could be associated with the lower temperature, which is beneficial for the WGS equilibrium [44]. NiAl produced a gaseous stream with a higher concentration in H2 and lower in CH4 as compared to NiAl-NCN, indicating that the improvement in H2 yield for NiAl-NCN catalyst also favored methanation reaction, where the produced hydrogen is consumed. The gaseous stream from the less active catalysts was largely composed of H2 (NiAl/SBA-15: 77.5%; NiAl-NCF: 65%). The H2 production rate of both catalysts was 5-36 times lower than NiAl-NCN. Regarding the low concentration of CO in the gas stream for all the catalysts tested (<4.2%), it should be attributed to the effectiveness of nickel aluminate in catalyzing WGS reaction at the temperature and pressure conditions used in the APR [45,46].
The H2/CO2 ratio for NiAl/SBA-15 and NiAl-NCF catalysts (3.6−12.9 range) were notably higher than the stoichiometric reforming ratio (7/3); despite the low conversion attained by these catalysts, the obtained main product was still H2. Contrarily, catalyst NiAl-NCN showed an H2/CO2 ratio lower than that of NiAl (1.4 vs. 1.8). Indeed, the CO2/CH4 for those samples suggested that H2 was consumed in side reactions, such as CO hydrogenation (methanation).

2.2.2. Liquid-Phase Products

The fact that values of Xgas were lower than XGly for all the catalysts suggests that a significant fraction of the reacted carbon atoms were retained within the liquid phase products (Table 3: 50% for NiAl-NCN, 42% for NiAl). In view of the very poor performance of NiAl/SBA-15 and NiAl-NCF catalysts, the analysis of the liquid products was focused on the comparison of the two most active catalysts, i.e., reference NiAl and nanocasted NiAl-NCN. The composition (in glycerol-free base) of the liquid phase is shown in Figure 7.
A molar flow of liquid products of 0.52 mmolC/gcat·min was measured for catalyst NiAl-NCN (i.e., 12% higher than reference NiAl). The main liquid compound was 1,2-propyleneglycol (1,2-PG), followed by ethyleneglycol (EG) and ethanol (EtOH), accounting for over 80% of the liquid products. Methanol (MeOH), hydroxyacetone (HA), and acetaldehyde (MeCHO) were detected to a much lesser extent. There were no significant differences in the liquid product distribution between both catalysts.
In our previous work, considering the gas and liquid product distribution, we suggested a two-path reaction scheme for glycerol APR [18]. As depicted in Scheme 1, both the metallic and the acid function of the catalyst were involved. In a simple way, the acid function can be deemed essential for the dehydration reaction, while the metal function catalyzed both dehydrogenation/hydrogenation reactions [44]. Dehydrogenation of glycerol on metallic sites was the preferred pathway (Route A) for H2 production by the APR of oxygenated compounds. Among the detected liquids, MeCHO, MeOH, EtOH, and EG corresponded to Route A path, while 1,2-PG and HA to Route B path.
Among the identified liquid products, those from Route A prevailed for both catalysts. The ratio Route A/Route B, as provided by the FCliq, was slightly higher for NiAl-NCN (0.79 vs. 0.68), despite its higher acid/base ratio (Table 1: 2.7 vs. 1.7). Indeed, the smaller metallic nickel entities of the nanocasted catalyst could promote the hydrogenation of the intermediate liquid compounds, such as hydroxyacetone (to propylene glycol) and acetaldehyde (to ethanol).

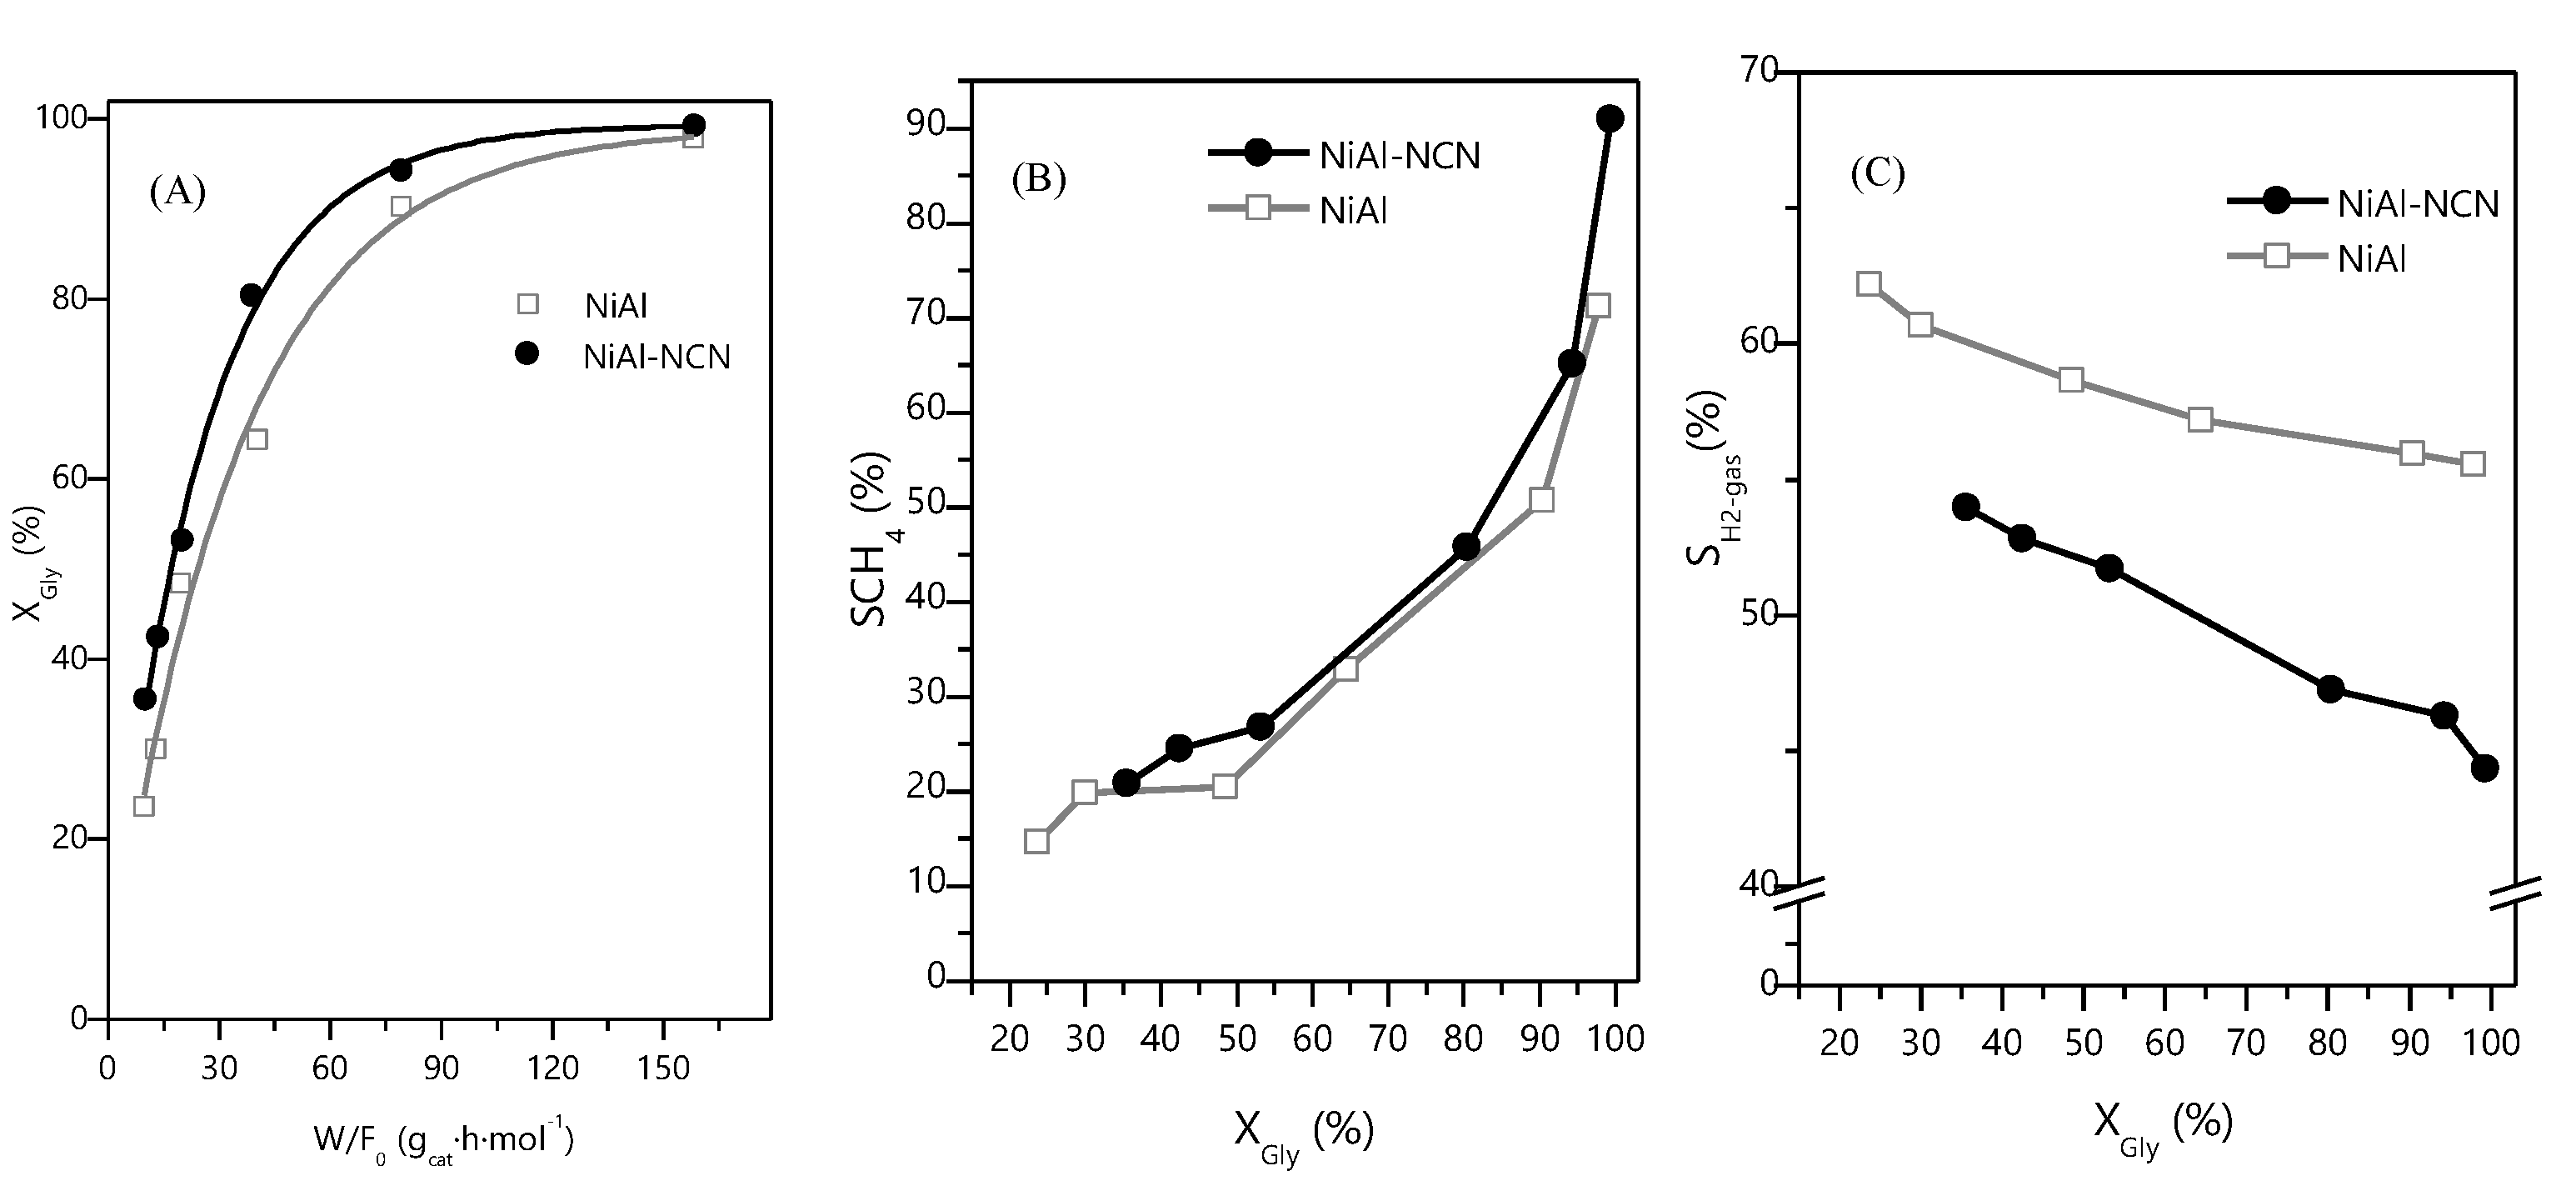
2.2.3. Effect of Residence Time

The catalytic performance of NiAl-NCN and NiAl catalysts was evaluated for a wide range of residence time values (WHSV, on the basis of total flowrate, ranged 98-6 h−1). Experiments were run at 235 °C/35 bar, with a feed of 10 wt.% glycerol–water solutions. The results obtained are shown in Figure 8.
The residence time of reactants showed a huge impact on the aqueous-phase transformation of glycerol for both catalysts. As could be expected, a longer residence time resulted in a higher glycerol conversion (Figure 8A). A similar outcome was reported by others [47,48]. Throughout all the investigated residence time ranges, NiAl-NCN catalyst was more active than NiAl (i.e., higher XGly). For instance, at 10 gcat⋅h/molgly, NiAl-NCN achieved XGly = 35.5% (vs. 23.6% by NiAl). At the highest residence time of 158 gcat⋅h/molgly, both catalysts converted a similar percentage of glycerol (99–98%). The glycerol conversion to gas also increased with residence time (not shown). This indicated that at higher residence time, the reforming of intermediate products was promoted; thus, more reforming end-products (CO2 and H2) were obtained [49]. NiAl-NCN showed a higher yield of hydrogen at those contact times.
Although in the whole residence time range used catalyst NiAl-NCN presented higher XGly, the trend in YH2 was the opposite: YH2 of catalyst NiAl was higher than that of the nanocasted catalyst in the whole range (not shown). This behaviour could be associated with the high selectivity to CH4 shown by NiAl-NCN in the whole conversion range. (Figure 8B). The activity improvement led to the high availability of H2, which simultaneously could favor the methanation reaction or others, such as hydrogenation, to produce liquid products (ethanol and 1,2-PG) [14].
In order to rationalize the results obtained for the selectivity to hydrogen, SH2-gas was calculated, considering the moles of H2 produced with respect to hydrogen consumed in alkanes production (Figure 8C). Notably, NiAl-NCN showed lower values of SH2-gas in the whole reaction range, which agreed with its higher SCH4. SH2-gas followed a decreasing trend with XGly, indicating more hydrogen was consumed in alkane formation as conversion increased. A similar trend was reported by others, suggesting that CO hydrogenation was lowered at short contact times [50].

2.3. Spent Catalysts Characterization

The main physico-chemical characteristics of exhausted catalysts are shown in Table 4. Interestingly, nanocasted catalysts suffered less nickel leaching than parent NiAl. Aluminum leaching was negligible for all catalysts, except for NiAl-NCF, which accounted for 1%. Results revealed that silica was also leached. In the case of NiAl/SBA-15 assay, it accounted for 5.5%. For the nanocasted catalysts, Si leaching increased to 31% and 94% for NiAl-NCF and NiAl-NCN, respectively, exaggerated by their low Si content.
SBET significantly decreased for the spent NiAl/SBA-15 (by 42%), indicative of the low textural stability of SBA-15 under hydrothermal conditions [51]. The incorporation of Ni-Al oxide and the high calcination temperature used did not seem to stabilize enough the siliceous material since structural collapse occurred under reaction conditions. The blockage of the access of reactants to the active sites due to the collapse of the pores could explain the poor catalytic performance of this catalyst. On the contrary, SBET of both nanocasted catalysts increased after reaction, as reference NiAl did, probably due to the re-deposition of leached aluminum as boehmite [52]. This fact also could explain the low leaching of aluminum.
The XRD patterns (Figure 9) of all the spent catalysts showed peaks from NiAl2O4, suggesting that the spinel phase was preserved. Moreover, intense XRD features of metallic Ni were still found for all the used catalysts, denoting that bulk metallic Ni nanoparticles were also preserved. Some new XRD peaks appeared, likely due to phase transformations under the hydrothermal conditions employed.
NiAl/SBA-15 showed peaks at 12.2°, 24.8°, and 34.4° 2θ, which could be assigned to the pecoraite phase (Ni3Si2O5(OH)4) (JCPDS 049-1859). This phase could be formed by hydroxylation reactions enhanced by the acidic aqueous medium. According to the mechanisms proposed by Park et al. [53], under hydrothermal conditions, Ni0 can be oxidized to nickel hydroxide, which can diffuse into silica layers and react with surface hydroxyls, resulting in nickel phyllosilicate polymerization. This could explain the low nickel leaching by this solid. The loss of nickel in other phases is detrimental to the APR performance.
The diffraction pattern of the spent NiAl-NCF almost replicated that from the fresh reduced form, with the absence of new phases. XRD from spent NiAl-NCN showed new reflections at 12.2°, 35°, and 62.2° 2θ, corresponding to the formation of nickel hydroxide hydrate (Ni(OH)2·0.75H2O) (JCPDS 038-0715). The nickel hydroxylation reaction was highly probable after the oxidation of Ni0 at acid pH [54]. The absence of peaks from pecoraite in this assay could be due to the low amount of silica in this solid. It is noteworthy that diffraction peaks from boehmite were not detected by XRD, suggesting it was amorphous or existed as a small domain (XRD detection limit: 2 nm) [55]. The absence of carbon XRD signal indicated no coke formation. Operating at low temperature, as the aqueous-phase reforming does, would prevent the formation of carbonaceous deposits [28].
The crystallite size of Ni0 (Table 4) varied differently after the reaction. Certain coalescence of Ni0 occurred on NiAl/SBA-15 and NiAl-NCF exhausted catalyst (increase by 18–30%), while Ni0 crystallites slightly shrugged for NiAl-NCN and NiAl catalysts (by 6–9%). The structural ordering accomplished in the NiAl-NCN catalyst could prevent Ni sintering [26]. According to them, the large surface area and the additional mesopores of the wormhole-like rod structure (obtained by partial filling of the SBA-15 pores) can prevent the growth and aggregation of metal nanoparticles.
The spent catalysts were subjected to H2-TPR analysis, and the obtained reduction profiles are presented in Figure S3 (Supplementary Materials). All the spent catalysts showed additional H2 consumption compared to the TPR700–950 profiles from the fresh reduced assays (Figure 5). They can be grouped into low-intermediate (110–700 °C) or high (>700 °C) temperature ranges. The high-temperature peak was related to the reduction of the Ni2+ in the spinel structure, and its position coincided with that of corresponding fresh reduced samples. The low-temperature peaks could be associated with the reduction of Ni2+ species and/or deposited organic liquid compounds.
In order to discern among different hydrogen uptake events at low-intermediate temperature, additional H2-TPR coupled to MS experiments were carried out for catalysts NiAl-NCN and NiAl (Figure S4 Supplementary Materials). Release of CH4 commenced at low-intermediate temperature (200–400 °C), which confirmed that the high-temperature peak corresponded to the reduction of Ni2+ in spinel. CH4 was formed by the reduction of organic matter (unreacted glycerol and intermediate liquid products with low boiling point) adsorbed into the catalyst pores [56]. The H2O peak in the 400–700 °C interval corresponded to the reduction of NiO. Assuming an uptake of two moles of H2 per mol of CH4 released, the percentage of nickel oxidized was estimated (Table 4). It was evidenced that Ni0 could be readily oxidized during the aqueous-phase reaction. Indeed, it was recognized as one of the fundamental reasons for catalyst deactivation in aqueous-phase reactions [56]. Transition metals are thermodynamically prone to oxidation (which is the preliminary stage of leaching), and avoiding it is a challenge for the liquid phase reactions [57]. Since Ni0 was detected by XRD in the exhausted catalysts, it could be deduced that oxidation of nickel was limited to the outermost layers of nickel particles. However, this event strongly diminishes the available metallic surface.
Among the nanocasted catalysts, NiAl-NCF was the one that better preserved nickel in its metallic form, with 44% of the nickel being oxidized. Interestingly, this catalyst had the lowest nickel metallic surface area, about five times lower than that of NiAl-NCN and NiAl. Contrarily, NiAl/SBA-15 catalyst suffered the most intense nickel oxidation (67% of Ni). The percentage of oxidized nickel in NiAl-NCN and the reference NiAl catalyst was similar, although the crystallite size was reduced by half in the former. It could be associated with the inhibition of oxidation due to a more favorable structural configuration, that is, nickel nanoparticles hidden in the wormhole-like rod structure.
To sum up, catalyst stability issues could be assigned to the effect of two facts, namely the oxidation of Ni0 and transformations and the creation of new phases. The first fact has also been recognized by other authors as one of the main deactivation factors [58]. The effect of the deposition of carbonaceous materials seemed to be non-significant for these catalysts.

3. Materials and Methods

3.1. Catalysts Synthesis

The siliceous hard template SBA-15 was synthesized by hydrothermal polymerization of silica (at 110 °C and 4 bar for 24 h in a batch autoclave reactor) using an amphiphilic block copolymer (Pluronic, P123) as a structure directing agent, and tetraethyl orthosilicate (TEOS) as silica source. Both P123 and TEOS were purchased from Sigma-Aldrich The obtained suspension was filtered and rinsed with deionized water. Finally, the solid was dried at 110 °C for 18 h and then calcined at 850 °C for 6 h (heating rate 1 °C/min). The obtained solid was labeled as SBA-15.
Then, ethanolic solutions of nickel(II) nitrate tetrahydrate (Sigma-Aldrich) and aluminum(III) nitrate nonahydrate (Fluka) in a molar ratio 1:2 were used as metal precursors, being incorporated into the SBA-15 template by wetness co-impregnation method. The obtained solid was dried overnight at 70 °C and finally calcined at 850 °C for 4 h (heating rate 1 °C/min). This composite was labeled NiAl/SBA-15 and was the precursor for the nanocasted solids.
Two methods were used for template removal. NiAl-NCN was obtained after treating the precursor with 2 M NaOH aqueous solution at 60 °C under constant stirring for 1 h, followed by drying at 110 °C for 24 h. NiAl-NCF was obtained by calcination at 650 °C for 4 h (heating rate 5 °C/min) of a solid mixture of precursor and Teflon with a sample:Teflon mass ratio of 2:9. The Teflon-assisted silica removal method avoids the use of toxic HF [21].
Bulk nickel aluminate spinel (NiAl) was selected as reference material. NiAl catalytic precursor was synthesized by basic coprecipitation (at pH 8) with Ni/Al = 0.5 mole ratio and calcined at 850 °C for 4 h (heating rate 10 °C/min). NiAl synthesis details could be found elsewhere [18].

3.2. Catalysts Characterization

The bulk chemical composition of the samples was analyzed by ICP-MS. The number of leached metals in the overall post-reaction liquid samples was measured by ICP-AES. Both analyses were carried out in the Advanced Research Facilities (SGIker) from the UPV/EHU. The textural properties of the catalysts were evaluated from N2 adsorption-desorption isotherms at 77 K in a Micromeritics TriStar II 3020 equipment. Before the experiment, the solid was degassed at 300 °C for 10 h. The specific surface area and pore size distribution were determined by BET and BJH methods, respectively.
The crystalline properties of the samples were determined by means of a PANalytical Xpert PRO diffractometer with Cu kα radiation (λ = 1.542 Å) suitable to analyze polycrystalline solids. X-ray diffracted radiation was recorded each 2.5 s rotating the detector from 10° to 80° 2θ at 0.026° steps. The identification of the crystalline phases was carried out based on the ICDD database, and the crystallite sizes were estimated by Scherrer equation from the full width at half maximum (FWHM) value of the most intense peak.
Reducibility of the solids was evaluated by temperature-programmed reduction with hydrogen (H2-TPR) performed in a Micromeritics AutoChem 2920 apparatus. The sample (about 70 mg) was flushed under 50 mL/min flow of He at 550 °C for 1 h prior to the test. Then, analysis was carried out by flowing 50 mL/min of 5% H2/Ar stream through the sample and raising the temperature from room temperature to 950 °C at 10 °C/min, monitoring the signal by thermal conductivity detector (TCD). The water formed during the reduction was trapped using a cold trap. The total H2-uptake was calculated from the integration of the H2-TPR profile and defined as TPR950.
Additional H2-TPR runs were carried out with the aim of determining the fraction of reduced nickel and the Ni speciation. First, the sample was reduced at 700 °C for 1 h, simulating the reduction step conducted prior to the catalytic tests. Then, the sample was cooled down to room temperature in He flow, and afterward, the temperature was increased up to 950 °C. The H2 consumption in this second step was defined as TPR700–950. The degree of reduction (DRNi) was calculated as the fraction of the amount of H2 consumed during the previous reduction step (TPR700) with respect to the total amount of H2 consumed during the full reduction (TPR950). The TPR profiles were subjected to Gaussian deconvolution to estimate the content of the different nickel species as well. In order to estimate the percentage of oxidized nickel, TPR-MS experiments were performed with the same protocol as TPR950 but removing the water trap and analyzing the exhaust gases by Mass Spectrometer (Pffeifer Vacuum OmniStar) following the evolution of H2, CH4 and H2O signals.
The morphology and particle size of the catalysts were measured by Transmission Electron Microscopy, with a TECNAI G2 20 TWIN microscope with LaB6 filament at 200 kV. Additionally, this apparatus was equipped with an EDAX-EDS microanalysis system, allowing spot elemental analysis or chemical characterization. The mean diameter of the metallic Ni particle was estimated from the volume to surface ratio as shown in Equation (1), and by measuring the diameter (d) of a large number of particles (>200 particles).
d Ni 0 , TEM = i n i d i 3 i n i d i 2
The nickel dispersion (DNi°) was estimated applying d-FE model [59], as follows:
D Ni 0 ( % ) = 5.01 d at j n j d j 2 + 2.64 d at 0.81 k n k d k 2.19 i n i d i 3
where di, dj and dk are the particles of “i”, “j” and “k” diameter; ni is the number of particles with diameter di, nj is the number of particles with diameter dj (dj > 24dat), nk is the number of particles with diameter dk (dk ≤ 24dat), and dat is the atomic diameter of metallic nickel (0.248 nm).
The metallic nickel surface area (SNi°) was calculated as follows:
S Ni 0 ( m 2 / g ) = A at × C Ni × D Ni 0 × N A MW Ni
where, Aat is the atomic area of Ni, NA is the Avogadro number, MWNi is the molecular weight of Ni, and CNi is the exuded nickel content.
The density of acid and basic sites was determined by NH3, and CO2 temperature programmed desorption, respectively, in a Micromeritics AutoChem 2920 equipment. Prior to the analysis, the sample (60 mg) was degassed with He at 550 °C for 1 h to remove adsorbed CO2 and H2O and cooled down to room temperature. Subsequently, the catalyst was reduced with 5% H2/Ar (50 mL/min) at 700 °C for 1 h, and again cooled down to room temperature under He flow. For acidity evaluation, a series of 10% NH3/He pulses (loop volume 0.5 mL) were injected at 90 °C until saturation of the sample, flushing with He flow in between each ammonia pulse. After that, the sample was heated under He up to 850 °C at 10 °C/min rate. Desorbed NH3 was measured by TCD detector. For basicity analysis, the sample was exposed to 50 mL/min 5% CO2/He at 50 °C for 1 h (enough for saturation) and subsequently flushed out with He flow for additional 1 h with the aim of removing physisorbed CO2. Finally, the temperature was raised to 850 °C at 10 °C/min, and the desorbed CO2 was measured by MS spectrometer (Pffeifer Vacuum OmniStar).
FTIR was recorded on a Cary 600 Series FTIR apparatus with the catalyst powder diluted in a KBr pellet in the 500–4000 cm−1 region with a resolution of 4 cm−1.

3.3. Catalytic Performance Evaluation

Glycerol reforming was carried out for an aqueous solution of 10 wt.% glycerol. The reactions were carried out in a fixed bed reactor operating at WHSV = 24.5 h−1 (determined as the ratio between total feed mass-flowrate and mass of fresh catalyst). Catalysts were in situ reduced at 700 °C for 1 h, heating at 5 °C/min, in 20%H2/Ar flow. The reaction was carried out at 235 °C and 35 bar. Reaction products were passed through a liquid/gas separator placed at the reactor outlet. The gaseous products were analyzed by an Agilent 490 Micro GC, and the liquid products by either GC and HPLC chromatography FID (Agilent 6890 N) and HPLC-RI (Waters, Hi-Plex H column). Total Organic Carbon (TOC) was measured for liquid samples on a Shimadzu TOC-L apparatus. The carbon balance accounted for about 93–104%. Standard deviation in XGly values measured in duplicate experiments was below 5%.
The criteria for mass transfer limitations were estimated through the Weisz–Prater criterion ΦWP and the Mears criterion MR. ΦWP and MR results confirmed the absence of internal and external mass diffusion effects, which can affect the activity results (Table S2, Supplementary Materials).
Glycerol conversion (XGly) was evaluated from the inlet and outlet molar flow of glycerol:
X Gly ( % ) = 100 × F Gly 0     F Gly F Gly 0
Conversion to gas (XGas) was evaluated from the carbon moles in the feedstream and the liquid products.
X Gas ( % ) = 100 × F 0   F C liquid F C 0
H2 yield (YH2) was defined as follows:
Y H 2 ( % ) = 100 × FH 2 F Gly 0 × 1 7
where FH2 is the molar flow of H2. Selectivity to gas (SGas) was calculated as:
S Gas ( % ) = 100 × n F Gas n × C at , n F Gly 0   F Gly × 1 3
where FGas-n is the molar flow of the n compound (mmolC/min); and Cat,n are the number of carbons in the n compound. Selectivity to hydrogen (SH2) and Selectivity to hydrogen in the gas phase (SH2-gas) were calculated as follows:
S H 2 ( % ) = 100   ×   FH 2 F Gly 0   F Gly × 3 7
S H 2 gas ( % ) = 100   ×   FH 2 F H 2 + ( n + 1 ) · F C n H 2 n + 2
Selectivity to CH4 (SCH4) was defined as follows:
S CH 4 ( % ) = 100   ×   FCH 4 F Gly 0   F Gly
All the reaction indices above were obtained at TOS = 3 h.

4. Conclusions

The physicochemical and the catalytic properties of the nickel aluminate spinels synthesized by the nanocasting technique were highly influenced by the template removal method. NiAl/SBA-15 solid, which preserved the siliceous template, had a higher Ni/Al ratio than the nominal and very high surface area. However, its reducibility deteriorated, and the acid/basic site ratio increased with respect to NiAl. NaOH-etched NiAl-NCN solid showed improved textural characteristics, with smaller metallic nickel particles and improved Ni0 dispersion, with a similar acid/basic site density ratio to NiAl. The ordering accomplished by nanocasting synthesis provided a wormhole-like rod structure that could facilitate the diffusion of reagents throughout the catalyst pores. Teflon-assisted template removal led to a solid with deteriorated textural and metallic nickel dispersion characteristics, which increased the acid/basic sites ratio.
Both NiAl/SBA-15 and NiAl-NCF catalysts showed very poor catalytic performance for the glycerol transformation, with less than 20% glycerol converted. NiAl-NCN catalyst presented improved activity with respect to NiAl, with a 20% higher hydrogen production rate but, as a drawback, higher methane formation. Such a performance was attributed to its smaller and better dispersed Ni0 particles. There were no relevant differences in the chemical route followed by NiAl and NiAl-NCN catalysts in the glycerol aqueous-phase conversion since the composition of the liquid phase remained similar. Route A/Route B liquid products were slightly favored by the nanocasted NiAl-NCN catalyst.
The analysis of the glycerol conversion at various spatial times indicated that the nanocasting synthesis could improve the conversion of glycerol and conversion to gas. Those are accompanied by increased hydrogenation of carbon oxides (methanation), to the detriment of the yield and selectivity to H2.
Moreover, obtained results demonstrated that the nanocasted catalyst etched by NaOH showed promising stability, though changes in the oxidation state of nickel are still a challenge to be addressed. It efficiently stabilized the active phase and prevented sintering. In turn, other deactivation causes extensively reported for APR, such as leaching or phase transitions related to alumina, could contribute to lesser stability.

Supplementary Materials

The following supporting information can be downloaded at: https://www.mdpi.com/article/10.3390/catal12060668/s1, Figure S1. FTIR of SBA-15 calcined at 850 °C; Figure S2. Variation of reaction indices with TOS; Figure S3. Reduction profiles of used catalysts in aqueous-phase reaction for 3 h; Figure S4. TPR-MS of used catalysts in aqueous-phase reaction for 3 h; Table S1. Parameters of mass transfer limitations for supported (NiAl/SBA-15) and nanocasted catalysts; Table S2. Comparison with other works in the literature [60,61,62,63,64,65,66].

Author Contributions

Investigation and writing—original draft preparation, A.M.-M.; Methodology and writing—review and editing, U.I.-V.; Resources, funding acquisition and supervision, M.Á.G.-O.; Conceptualization, writing—review and editing, funding acquisition, J.L.A. All authors have read and agreed to the published version of the manuscript.

Funding

This research was supported by grant PID2019-106692EB-I00 funded by MCIN/AEI/10.13039/501100011033.

Acknowledgments

The authors are thankful for technical support provided by SGIker of UPV/EHU and European funding (ERDF and ESF).

Conflicts of Interest

The authors declare no conflict of interest.

References

  1. Chen, D.; Rojas, M.; Samset, B.H.; Cobb, K.; Diongue Niang, A.; Edwards, P.; Emori, S.; Faria, S.H.; Hawkins, E.; Hope, P.; et al. Framing, Context, and Methods. In Climate Change 2021: The Physical Science Basis; Contribution of Working Group I to the Sixth Assessment Report of the Intergovernmental Panel on Climate Change; Cambridge University Press: Cambridge, UK; New York, NY, USA, 2021; pp. 147–286. [Google Scholar]
  2. Touma, D.; Stevenson, S.; Lehner, F.; Coats, S. Human-driven greenhouse gas and aerosol emissions cause distinct regional impacts on extreme fire weather. Nat. Commun. 2021, 12, 212. [Google Scholar] [CrossRef] [PubMed]
  3. Pachauri, R.K.; Allen, M.R.; Barros, V.R.; Broome, J.; Cramer, W.; Christ, R.; Church, J.A.; Clarke, L.; Dahe, Q.; Dasgupta, P.; et al. Climate Change 2014: Synthesis Report; Contribution of Working Groups I, II and III to the Fifth Assessment Report of the Intergovernmental Panel on Climate Change; IPCC: Geneva, Switzerland, 2014; 151p. [Google Scholar]
  4. IEA Net Zero by 2050. IEA 2021. Available online: https://www.iea.org/reports/net-zero-by-2050 (accessed on 26 May 2022).
  5. Checa, M.; Nogales-Delgado, S.; Montes, V.; Encinar, J.M. Recent advances in glycerol catalytic valorization: A review. Catalysts 2020, 10, 1279. [Google Scholar] [CrossRef]
  6. Cortright, R.D.; Davda, R.R.; Dumesic, J.A. Hydrogen from catalytic reforming of biomass-derived hydrocarbons in liquid water. Nature 2002, 418, 964–967. [Google Scholar] [CrossRef]
  7. Chheda, J.N.; Huber, G.W.; Dumesic, J.A. Liquid-phase catalytic processing of biomass-derived oxygenated hydrocarbons to fuels and chemicals. Angew. Chem. Int. Ed. 2007, 46, 7164–7183. [Google Scholar] [CrossRef]
  8. Coronado, I.; Stekrova, M.; Reinikainen, M.; Simell, P.; Lefferts, L.; Lehtonen, J. A review of catalytic aqueous-phase reforming of oxygenated hydrocarbons derived from biorefinery water fractions. Int. J. Hydrogen Energy 2016, 41, 11003–11032. [Google Scholar] [CrossRef]
  9. Meryemoglu, B.; Kaya, B.; Irmak, S.; Hesenov, A.; Erbatur, O. Comparison of batch aqueous-phase reforming of glycerol and lignocellulosic biomass hydrolysate. Fuel 2012, 97, 241–244. [Google Scholar] [CrossRef]
  10. Remón, J.; Ruiz, J.; Oliva, M.; García, L.; Arauzo, J. Cheese whey valorisation: Production of valuable gaseous and liquid chemicals from lactose by aqueous phase reforming. Energy Convers. Manag. 2016, 124, 453–469. [Google Scholar] [CrossRef] [Green Version]
  11. Coronado, I.; Arandia, A.; Reinikainen, M.; Karinen, R.; Puurunen, R.L.; Lehtonen, J. Kinetic Modelling of the Aqueous-Phase Reforming of Fischer-Tropsch Water over Ceria-Zirconia Supported Nickel-Copper Catalyst. Catalysts 2019, 9, 936. [Google Scholar] [CrossRef] [Green Version]
  12. Pendem, C.; Sarkar, B.; Siddiqui, N.; Sivakumar Konathala, N.L.; Baskar, C.; Bal, R. K-Promoted Pt-Hydrotalcite Catalyst for Production of H2 by Aqueous Phase Reforming of Glycerol. ACS Sustain. Chem. Eng. 2018, 6, 2122–2131. [Google Scholar] [CrossRef]
  13. Zoppi, G.; Pipitone, G.; Pirone, R.; Bensaid, S. Aqueous phase reforming process for the valorization of wastewater streams: Application to different industrial scenarios. Catal. Today 2022, 387, 224–236. [Google Scholar] [CrossRef]
  14. El Doukkali, M.; Iriondo, A.; Gandarias, I. Enhanced catalytic upgrading of glycerol into high value-added H2 and propanediols: Recent developments and future perspectives. Mol. Catal. 2020, 490, 110928. [Google Scholar] [CrossRef]
  15. Davda, R.R.; Shabaker, J.W.; Huber, G.W.; Cortright, R.D.; Dumesic, J.A. A review of catalytic issues and process conditions for renewable hydrogen and alkanes by aqueous-phase reforming of oxygenated hydrocarbons over supported metal catalysts. Appl. Catal. B Environ. 2005, 56, 171–186. [Google Scholar] [CrossRef]
  16. Pipitone, G.; Zoppi, G.; Pirone, R.; Bensaid, S. A critical review on catalyst design for aqueous phase reforming. Int. J. Hydrogen Energy 2022, 47, 151–180. [Google Scholar] [CrossRef]
  17. Fasolini, A.; Cespi, D.; Tabanelli, T.; Cucciniello, R.; Cavani, F. Hydrogen from Renewables: A Case Study of Glycerol Reforming. Catalysts 2019, 9, 722. [Google Scholar] [CrossRef] [Green Version]
  18. Morales-Marín, A.; Ayastuy, J.L.; Iriarte-Velasco, U.; Gutiérrez-Ortiz, M.A. Nickel aluminate spinel-derived catalysts for the aqueous phase reforming of glycerol: Effect of reduction temperature. Appl. Catal. B Environ. 2019, 244, 931–945. [Google Scholar] [CrossRef]
  19. Huber, G.W.; Shabaker, J.W.; Dumseic, J.A. Raney Ni-Sn Catalyst for H2 Production from Biomass-Derived Hydrocarbons. Science 2003, 300, 2075–2077. [Google Scholar] [CrossRef] [Green Version]
  20. Zhu, J.; Gao, Q. Mesoporous MCo2O4 (M = Cu, Mn and Ni) spinels: Structural replication, characterization and catalytic application in CO oxidation. Microporous Mesoporous Mater. 2009, 124, 144–152. [Google Scholar] [CrossRef]
  21. Singh, D.K.; Krishna, K.S.; Harish, S.; Sampath, S.; Eswaramoorthy, M. No More HF: Teflon-assisted ultrafast removal of silica to generate high-surface-area mesostructured carbon for enhanced CO2 capture and supercapacitor performance. Angew. Chem. Int. Ed. 2016, 55, 2032–2036. [Google Scholar] [CrossRef]
  22. De Sousa, F.F.; de Sousa Helvio, S.A.; Oliveira, A.C.; Junior, M.C.C.; Ayala, A.P.; Barros, E.B.; Viana, B.C.; Filho, J.M.; Oliveira, A.C. Nanostructured Ni-containing spinel oxides for the dry reforming of methane: Effect of the presence of cobalt and nickel on the deactivation behaviour of catalysts. Int. J. Hydrogen Energy 2012, 37, 3201–3212. [Google Scholar] [CrossRef]
  23. Karam, L.; Reboul, J.; El Hassan, N.; Nelayah, J.; Massiani, P. Nanostructured nickel aluminate as a key intermediate for the production of highly dispersed and stable nickel nanoparticles supported within mesoporous alumina for dry reforming of methane. Molecules 2019, 24, 4107. [Google Scholar] [CrossRef] [Green Version]
  24. Gil, A.G.; Wu, Z.; Chadwick, D.; Li, K. Ni/SBA-15 Catalysts for combined steam methane reforming and water gas shift—Prepared for use in catalytic membrane reactors. Appl. Catal. A Gen. 2015, 506, 188–196. [Google Scholar]
  25. Carrero, A.; Calles, J.A.; García-Moreno, L.; Vizcaíno, A.J. Production of renewable hydrogen from glycerol steam reforming over bimetallic Ni-(Cu,Co,Cr) catalysts supported on SBA-15 silica. Catalysts 2017, 7, 55. [Google Scholar] [CrossRef] [Green Version]
  26. Kim, H.; Kim, T.; Park, H.J.; Jeong, K.; Chae, H.; Jeong, S.; Lee, C.; Kim, C. Hydrogen production via the aqueous phase reforming of ethylene glycol over platinum-supported ordered mesoporous carbon catalysts: Effect of structure and framework-configuration. Int. J. Hydrogen Energy 2012, 37, 12187–12197. [Google Scholar] [CrossRef]
  27. Al-Salihi, S.; Abrokwah, R.; Dade, W.; Deshmane, V.; Hossain, T.; Kuila, D. Renewable hydrogen from glycerol steam reforming using Co–Ni–MgO based SBA-15 nanocatalysts. Int. J. Hydrogen Energy 2020, 45, 14183–14198. [Google Scholar] [CrossRef]
  28. Calles, J.A.; Carrero, A.; Vizcaíno, A.J.; García-Moreno, L. Hydrogen production by glycerol steam reforming over SBA-15-supported nickel catalysts: Effect of alkaline earth promoters on activity and stability. Catal. Today 2014, 227, 198–206. [Google Scholar] [CrossRef]
  29. Azof, F.I.; Yang, Y.; Panias, D.; Kolbeinsen, L.; Safarian, J. Leaching characteristics and mechanism of the synthetic calcium-aluminate slags for alumina recovery. Hydrometallurgy 2019, 185, 273–290. [Google Scholar] [CrossRef]
  30. Galarneau, A.; Desplantier, D.; Dutartre, R.; Di Renzo, F. Micelle-templated silicates as a test bed for methods of mesopore size evaluation. Microporous Mesoporous Mater. 1999, 27, 297–308. [Google Scholar] [CrossRef]
  31. Remón, J.; Giménez, J.R.; Valiente, A.; García, L.; Arauzo, J. Production of gaseous and liquid chemicals by aqueous phase reforming of crude glycerol: Influence of operating conditions on the process. Energy Convers. Manag. 2016, 110, 90–112. [Google Scholar] [CrossRef] [Green Version]
  32. Estevez, R.; Lopez-Pedrajas, S.; Blanco-Bonilla, F.; Luna, D.; Bautista, F.M. Production of acrolein from glycerol in liquid phase on heterogeneous catalysts. Chem. Eng. J. 2015, 282, 179–186. [Google Scholar] [CrossRef]
  33. Jeon, S.; Roh, H.; Ju Moon, D.; Wook Bae, J. Aqueous phase reforming and hydrodeoxygenation of ethylene glycol on Pt/SiO2-Al2O3: Effects of surface acidity on product distribution. RSC Adv. 2016, 6, 68433–68444. [Google Scholar] [CrossRef]
  34. Guo, G.; Usman, M.; Liu, X.; Wang, Y.; Lu, G. Effect of support’s basic properties on hydrogen production in aqueous-phase reforming of glycerol and correlation between WGS and APR. Appl. Energy 2012, 92, 218–223. [Google Scholar] [CrossRef]
  35. Ghosh, B.K.; Hazra, S.; Naik, B.; Ghosh, N.N. Preparation of Cu nanoparticle loaded SBA-15 and their excellent catalytic activity in reduction of variety of dyes. Powder Technol. 2015, 269, 371–378. [Google Scholar] [CrossRef]
  36. Zhao, D.; Feng, J.; Huo, Q.; Melosh, N.; Fredrickson, G.H.; Chmelka, B.F.; Stucky, G.D. Triblock copolymer syntheses of mesoporous silica with periodic 50 to 300 angstrom pores. Science 1998, 279, 548–552. [Google Scholar] [CrossRef] [PubMed] [Green Version]
  37. Song, K.H.; Jeong, S.K.; Jeong, B.H.; Lee, K.-Y.; Kim, H.J. Effect of the Ni/Al Ratio on the Performance of NiAl2O4 Spinel-Based Catalysts for Supercritical Methylcyclohexane Catalytic Cracking. Catalysts 2021, 11, 323. [Google Scholar] [CrossRef]
  38. Zhou, L.; Li, L.; Wei, N.; Li, J.; Basset, J.-M. Effect of NiAl2O4 Formation on Ni/Al2O3 Stability during Dry Reforming of Methane. ChemCatChem 2015, 7, 2508–2516. [Google Scholar] [CrossRef] [Green Version]
  39. Li, G.; Hu, L.; Hill, J.M. Comparison of reducibility and stability of alumina-supported Ni catalysts prepared by impregnation and co-precipitation. Appl. Catal. A Gen. 2006, 301, 16–24. [Google Scholar] [CrossRef]
  40. Godina, L.I.; Kirilin, A.V.; Tokarev, A.V.; Simakova, I.L.; Murzin, D.Y. Sibunit-Supported Mono- and Bimetallic Catalysts Used in Aqueous-Phase Reforming of Xylitol. Ind. Eng. Chem. Res. 2018, 57, 2050–2067. [Google Scholar] [CrossRef]
  41. Dietrich, P.J.; Lobo-Lapidus, R.J.; Wu, T.; Sumer, A.; Akatay, M.C.; Fingland, B.R.; Guo, N.; Dumesic, J.A.; Marshall, C.L.; Stach, E.; et al. Aqueous phase glycerol reforming by PtMo bimetallic nano-particle catalyst: Product selectivity and structural characterization. Top. Catal. 2012, 55, 53–69. [Google Scholar] [CrossRef]
  42. Seretis, A.; Tsiakaras, P. Aqueous phase reforming (APR) of glycerol over platinum supported on Al2O3 catalyst. Renew. Energy 2016, 85, 1116–1126. [Google Scholar] [CrossRef]
  43. Iriondo, A.; Cambra, J.F.; Güemez, M.B.; Barrio, V.L.; Requies, J.; Sánchez-Sánchez, M.C.; Navarro, R.M. Effect of ZrO2 addition on Ni/Al2O3 catalyst to produce H2 from glycerol. Int. J. Hydrogen Energy 2012, 37, 7084–7093. [Google Scholar] [CrossRef]
  44. Vaidya, P.D.; Lopez-Sanchez, J.A. Review of Hydrogen Production by Catalytic Aqueous-Phase Reforming. ChemistrySelect 2017, 2, 6563–6576. [Google Scholar] [CrossRef]
  45. Morales-Marín, A.; Ayastuy, J.L.; Iriarte-Velasco, U.; Gutiérrez-Ortiz, M.A. Biohydrogen production by glycerol Aqueous-Phase Reforming: Effect of promoters (Ce or Mg) in the NiAl2O4 spinel-derived catalysts. J. Environ. Chem. Eng. 2021, 9, 106433. [Google Scholar] [CrossRef]
  46. Li, D.; Li, Y.; Liu, X.; Guo, Y.; Pao, C.-W.; Chen, J.-L.; Hu, Y.; Wang, Y. NiAl2O4 Spinel Supported Pt Catalyst: High Performance and Origin in Aqueous-Phase Reforming of Methanol. ACS Catal. 2019, 9, 9671–9682. [Google Scholar] [CrossRef]
  47. García, L.; Valiente, A.; Oliva, M.; Ruiz, J.; Arauzo, J. Influence of operating variables on the aqueous-phase reforming of glycerol over a Ni/Al coprecipitated catalyst. Int. J. Hydrogen Energy 2018, 43, 20392–20407. [Google Scholar] [CrossRef]
  48. Kirilin, A.V.; Tokarev, A.V.; Murzina, E.V.; Kustov, L.M.; Mikkola, J.-P.; Murzin, D.Y. Reaction products and transformations of intermediates in the aqueous-phase reforming of sorbitol. ChemSusChem 2010, 3, 708–718. [Google Scholar] [CrossRef] [PubMed]
  49. Kim, H.; Park, H.J.; Kim, T.; Jeong, K.; Chae, H.; Jeong, S.; Lee, C.; Kim, C. The effect of support and reaction conditions on aqueous phase reforming of polyol over supported Pt–Re bimetallic catalysts. Catal. Today 2012, 185, 73–80. [Google Scholar] [CrossRef]
  50. He, Z.; Wang, X.; Gao, S.; Xiao, T. Effect of reaction variables on CO methanation process over NiO–La2O3–MgO/Al2O3 catalyst for coal to synthetic natural gas. Appl. Petrochem. Res. 2015, 5, 413–417. [Google Scholar] [CrossRef] [Green Version]
  51. Nichele, V.; Signoretto, M.; Menegazzo, F.; Gallo, A.; Dal Santo, V.; Cruciani, G.; Cerrato, G. Glycerol steam reforming for hydrogen production: Design of Ni supported catalysts. Appl. Catal. B Environ. 2012, 111–112, 225–232. [Google Scholar] [CrossRef]
  52. De Vlieger, D.J.M.; Mojet, B.L.; Lefferts, L.; Seshan, K. Aqueous Phase Reforming of ethylene glycol—Role of intermediates in catalyst performance. J. Catal. 2012, 292, 239–245. [Google Scholar] [CrossRef]
  53. Park, J.C.; Lee, H.J.; Bang, J.U.; Park, K.H.; Song, H. Chemical transformation and morphology change of nickel-silica hybrid nanostructures via nickel phyllosilicates. Chem. Commun. 2009, 47, 7345–7347. [Google Scholar] [CrossRef]
  54. Van Haasterecht, T.; Ludding, C.C.I.; de Jong, K.P.; Bitter, J.H. Toward stable nickel catalysts for aqueous phase reforming of biomass-derived feedstock under reducing and alkaline conditions. J. Catal. 2014, 319, 27–35. [Google Scholar] [CrossRef]
  55. Melero, J.A.; Calleja, G.; Martínez, F.; Molina, R. Nanocomposite of crystalline Fe2O3 and CuO particles and mesostructured SBA-15 silica as an active catalyst for wet peroxide oxidation processes. Catal. Commun. 2006, 7, 478–483. [Google Scholar] [CrossRef]
  56. El Doukkali, M.; Iriondo, A.; Cambra, J.F.; Gandarias, I.; Jalowiecki-Duhamel, L.; Dumeignil, F.; Arias, P.L. Deactivation study of the Pt and/or Ni-based γ-Al2O3 catalysts used in the aqueous phase reforming of glycerol for H2 production. Appl. Catal. A Gen. 2014, 472, 80–91. [Google Scholar] [CrossRef]
  57. Sievers, C.; Scott, S.L.; Noda, Y.; Qi, L.; Albuquerque, E.M.; Rioux, R.M. Phenomena affecting catalytic reactions at solid−Liquid interfaces. ACS Catal. 2016, 6, 8286–8307. [Google Scholar] [CrossRef]
  58. Van Haasterecht, T.; Swart, M.; De Jong, K.P.; Bitter, J.H. Effect of initial nickel particle size on stability of nickel catalysts for aqueous phase reforming. J. Energy Chem. 2016, 25, 289–296. [Google Scholar] [CrossRef]
  59. Borodziński, A.; Bonarowska, M. Relation between crystallite size and dispersion on supported metal catalysts. Langmuir 1997, 13, 5613–5620. [Google Scholar] [CrossRef]
  60. Bastan, F.; Kazemeini, M.; Larimi, A.; Maleki, H. Production of renewable hydrogen through aqueous-phase reforming of glycerol over Ni/Al2O3–MgO nano-catalyst. Int J. Hydrogen Energy 2018, 43, 614–621. [Google Scholar] [CrossRef]
  61. El Doukkali, M.; Iriondo, A.; Arias, P.L.; Requies, J.; Gandarías, I.; Jalowiecki-Duhamel, L.; Dumeignil, F. A comparison of sol-gel and impregnated Pt or/and Ni based γ-alumina catalysts for bioglycerol aqueous phase reforming. Appl. Catal. B Environ. 2012, 125, 516–529. [Google Scholar] [CrossRef]
  62. Park, Y.H.; Kim, J.Y.; Moon, D.J.; Park, N.C.; Kim, Y.C. Effect of LaAlO3-supported modified Ni-based catalysts on aqueous phase reforming of glycerol. Res. Chem. Intermed 2015, 41, 9603–9614. [Google Scholar] [CrossRef]
  63. Rahman, M.M.; Church, T.L.; Variava, M.F.; Harris, A.T.; Minett, A.I. Bimetallic Pt-Ni composites on ceria-doped alumina supports as catalysts in the aqueous-phase reforming of glycerol. RSC Adv. 2014, 4, 18951–18960. [Google Scholar] [CrossRef]
  64. Manfro, R.L.; Pires, T.P.M.D.; Ribeiro, N.F.P.; Souza, M.M.V.M. Aqueous-phase reforming of glycerol using Ni-Cu catalysts prepared from hydrotalcite-like precursors. Catal. Sci. Technolog. 2013, 3, 1278–1287. [Google Scholar] [CrossRef]
  65. Rahman, M.M. Aqueous-Phase Reforming of Glycerol over Carbon-Nanotube-Supported Catalysts. Catal Lett. 2020, 150, 2674–2687. [Google Scholar] [CrossRef]
  66. Bastan, F.; Kazemeini, M.; Larimi, A.S. Aqueous-phase reforming of glycerol for production of alkanes over Ni/CexZr1-xO2 nano-catalyst: Effects of the support's composition. Renew. Energy 2017, 108, 417–424. [Google Scholar] [CrossRef]
Figure 1. N2 adsorption−desorption isotherms and pore size distributions in the calcined and reduced forms of catalysts.
Catalysts 12 00668 g001
Figure 2. Low-angle XRD diffractogram for calcined forms of SBA-15 and NiAl/SBA-15. In the table, d-spacing, lattice parameter and wall thickness.
Catalysts 12 00668 g002
Figure 3. XRD diffractograms for the (A) calcined and (B) reduced forms of the solids. Insets include small-angle RXD patterns.
Catalysts 12 00668 g003
Figure 4. TEM images for (A) calcined and (B) fresh reduced forms of the solids. (C) Ni0 particle size distributions.
Catalysts 12 00668 g004
Figure 5. H2-TPR profiles of NiAl/SBA-15 and nanocasted solids. TPR950: reduction profile of calcined solids; TPR700–950: reduction profile of fresh reduced catalyst.
Catalysts 12 00668 g005
Figure 6. (A) Glycerol conversion, conversion to gas and hydrogen yield; (B) Selectivity to H2 and CH4, and H2 production rate. Reaction conditions: 235 °C/35 bar, WHSV = 24.5 h−1. Reaction time: 3 h TOS.
Catalysts 12 00668 g006
Scheme 1. Reaction path for the glycerol hydrodeoxygenation with in situ produced hydrogen.
Catalysts 12 00668 sch001
Figure 7. Molar composition of the main liquid products and total produced liquid flow. In circles: Route A/Route B product ratio. Reaction conditions: 235 °C/35 bar, WHSV = 24.5 h−1. Reaction time: 3 h TOS.
Catalysts 12 00668 g007
Figure 8. (A) Effect of the residence time on XGly; (B) SCH4 vs XGly; (C) SH2-Gas vs. XGly.
Catalysts 12 00668 g008
Figure 9. XRD of spent catalysts.
Catalysts 12 00668 g009
Table 1. Bulk chemical composition, textural and acid/base properties and crystallite sizes of Ni0 and exposed metallic surface.
SolidNi/Al
(at./at.)
Si a
(%)
SBET
(m2/g)
Vpore
(m3/g)
dpore
(nm)
Acid/Base Ratio b
(molNH3/molCO2)
dNi0 -XRD
(nm)
dNi0 -TEM
(nm)
DNi0 c
(%)
ANi0 d
(m2Ni /g)
NiAl0.49n.a.98 (83)0.27 (0.29)8.4 (10.8)1.716.012.010.014.1
NiAl/SBA-150.6055.8210 (158)0.30 (0.26)4.7 (5.5)7.224.325.83.67.3
NiAl-NCN0.741.2306 (155)0.33 (0.15)3.9 (5.4)2.76.79.012.017.9
NiAl-NCF0.482.981 (38)0.46 (0.22)22.1 (20.9)15.727.731.73.23.8
Values in parenthesis: reduced solids; a: wt.%; b in reduced form; c dispersion; d surface area.
Table 2. Results of H2-TPR for NiAl/SBA-15 and nanocasted solids.
CatalystCalcinedFresh Reduced
TPR950
H2-Uptake
(mmol H2/g)
Nickel Speciation (%)TPR700–950
H2-Uptake (mmol H2/g)
DRNi (1)
(%)
Ni0 Content
(mmol H2/g)
αβ1β2γ
NiAl5.6 (5.6)1.521.323.453.80.56794.4
NiAl/SBA-152.0 (2.1)1.714.233.650.60.22881.8
NiAl-NCN5.2 (6.7)6.231.423.339.10.16975.0
NiAl-NCF4.0 (5.0)1.629.148.620.60.10983.9
In parenthesis, the theoretical uptake; (1) Degree of Reduction.
Table 3. Gas-phase product analysis.
CatalystFGas
(mmol/gcat·min)
SGas
(%)
Composition (vol.%)H2/CO2CO2/CH4
H2CO2COCH4
NiAl0.484250.826.40.820.01.81.5
NiAl/SBA-150.012177.56.63.38.812.90.6
NiAl-NCN0.665042.131.10.524.01.41.3
NiAl-NCF0.092465.018.12.012.03.61.2
Table 4. Physico-chemical properties of glycerol APR exhausted catalysts.
Leaching (%)
CatalystNiAlSiΔSBETa
(%)
New Phases
(XRD)
ΔdNi°a
(%)
Ni oxidized (%)
NiAl0.70.05n.a.+37AlO(OH)−960
NiAl/SBA-150.30.045.5−42Ni3Si2O5(OH)4+1867
NiAl-NCN0.10.0694+33Ni(OH)2·0.75H2O−660
NiAl-NCF0.41.0231+137n.d.+3044
a variation with respect to their fresh reduced form.
Publisher’s Note: MDPI stays neutral with regard to jurisdictional claims in published maps and institutional affiliations.

