Article

Kinetics of the Direct DME Synthesis: State of the Art and Comprehensive Comparison of Semi-Mechanistic, Data-Based and Hybrid Modeling Approaches

Institute of Catalysis Research and Technology (IKFT), Karlsruhe Institute of Technology (KIT), Hermann-von-Helmholtz-Platz 1, 76344 Eggenstein-Leopoldshafen, Germany
*
Author to whom correspondence should be addressed.
Catalysts 2022, 12(3), 347; https://doi.org/10.3390/catal12030347
Submission received: 7 February 2022 / Revised: 10 March 2022 / Accepted: 12 March 2022 / Published: 18 March 2022

Abstract

:
Hybrid kinetic models represent a promising alternative to describe and evaluate the effect of multiple variables in the performance of complex chemical processes, since they combine system knowledge and extrapolability of the (semi-)mechanistic models in a wide range of reaction conditions with the adaptability and fast convergence of data-based approaches (e.g., artificial neural networks—ANNs). For the first time, a hybrid kinetic model for the direct DME synthesis was developed consisting of a reactor model, i.e., balance equations, and an ANN for the reaction kinetics. The accuracy, computational time, interpolation and extrapolation ability of the new hybrid model were compared to those of a lumped and a data-based model with the same validity range, using both simulations and experiments. The convergence of parameter estimation and simulations with the hybrid model is much faster than with the lumped model, and the predictions show a greater degree of accuracy within the models’ validity range. A satisfactory dimension and range extrapolation was reached when the extrapolated variable was included in the knowledge module of the model. This feature is particularly dependent on the network architecture and phenomena covered by the underlying model, and less on the experimental conditions evaluated during model development.

Graphical Abstract

1. Introduction

Dimethyl ether (DME) is an important chemical that can be used as an intermediate for the production of CO2-neutral base products, as coolant or propellant, and as a diesel substitute or fuel additive [1,2,3]. A promising alternative to the state-of-the-art two-step DME production is the direct or one-step synthesis in a single reactor over dual catalyst systems [4,5,6]. This process has been demonstrated at pilot scale and it is currently under further development [1,7,8], for which reliable predictive models are essential. However, the detailed reaction mechanism of the direct DME synthesis has not yet been fully understood [9] and its modeling is challenging. Reasons for this are, for example, variable structural changes of the metallic catalyst depending on the reaction conditions [10], the variation of the dominant pathway of the methanol synthesis [11], as well as the deactivation of the dehydration catalyst, e.g., by acidity loss due to H + /Cu 2 + ion exchange, especially in the case of zeolite-based systems, and the sintering of the metallic catalyst in the presence of high water concentrations [12,13,14].
Several semi-mechanistic or lumped models that enable the modeling of the system in a specific operational range have been developed [15,16,17,18,19,20,21,22,23,24,25,26]. However, due to the mentioned difficulties, semi-mechanistic models for the direct DME synthesis are difficult to fit in a wide range of conditions. This is where the potential of machine learning approaches to extract and predict input–output relationships in large data sets comes into play. These methods, especially artificial neural networks (ANNs), have been used successfully in various areas of the chemical industry, mostly as predictive tools [27,28,29,30]. One of the general drawbacks of ANNs is that their predictions are only reliable in the range in which the training data were measured and extrapolation is only possible in a slightly extended range [31]. However, unlike semi-mechanistic models, ANNs can be easily adapted to large amounts of multidimensional data in broad operational windows [30,31].
Models that combine the features of both (semi-)mechanistic and data-based approaches represent a promising alternative for modeling the behavior of chemical reactors [32]. However, recent studies have highlighted that the adoption of machine learning approaches is still limited for chemical processes [27,33,34]. An extensive literature search on models for direct DME synthesis revealed that most models are semi-mechanistic, while only a few are data-based, and none of the models are hybrid in nature (Section 2). Therefore, in addition to providing a timely overview of the available models for direct DME synthesis, a main objective of this work is to establish an initial hybrid model for this system and to comprehensively compare the different types of models (Section 3). Simulation results obtained with the hybrid model are compared to those obtained with a semi-mechanistic and a data-based model that have the same range of validity, which enables an evaluation of the structural differences between the model types. Based on similar works [35,36,37], it is expected that the hybrid model provides a higher accuracy than the lumped model, while exhibiting an increased extrapolation capability compared with the data-based one. These hypotheses are evaluated in a quantitative manner in Section 4. In this section, critical model features such as accuracy, computational burden, interpolation and extrapolation ability are tested, using both simulations and experiments.

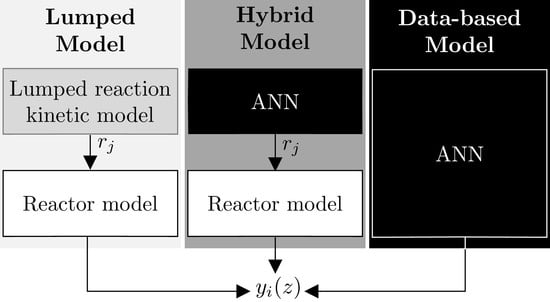
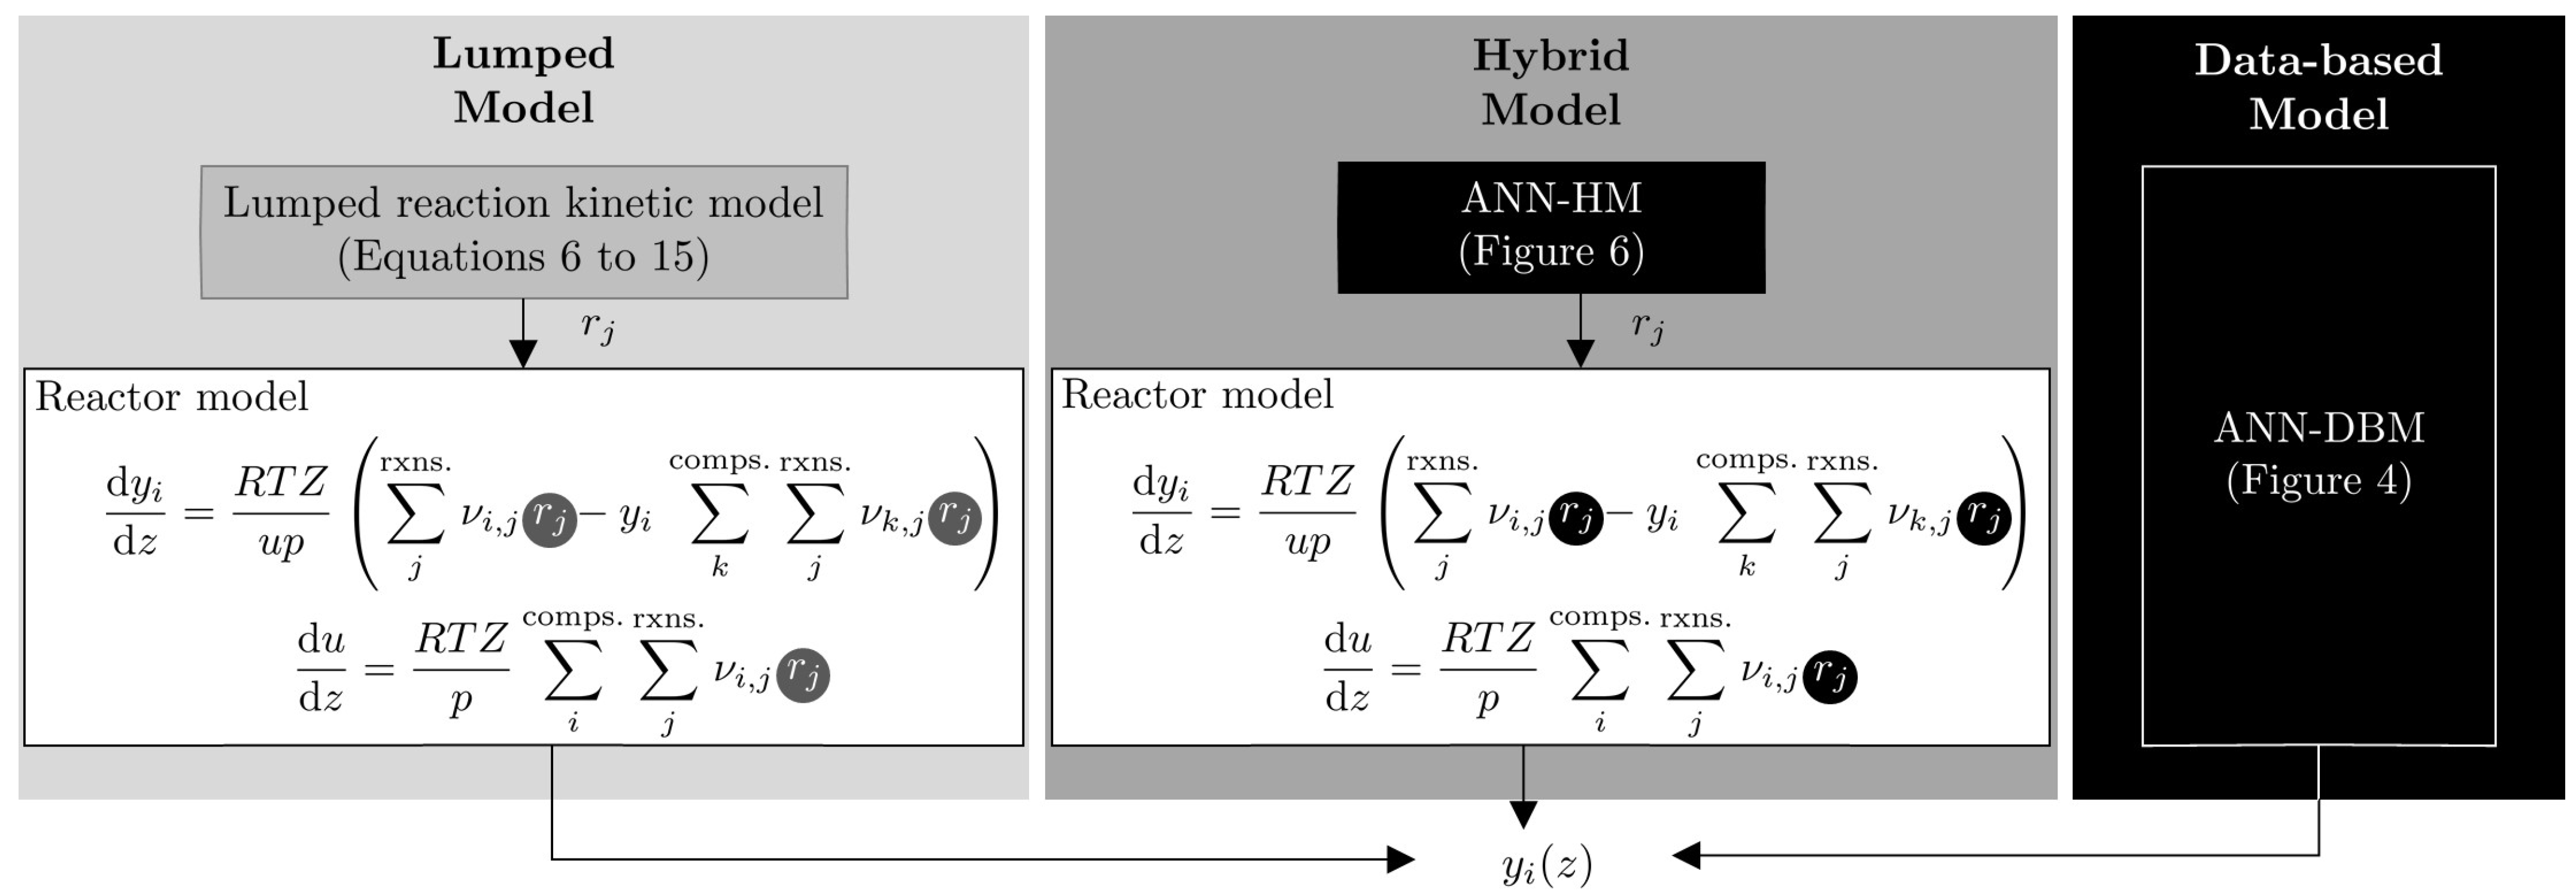
2. Available Models for the Direct Synthesis of DME—An Overview

In this section, an overview of kinetic models for the direct synthesis of DME over the commercial catalyst system with CuO/ZnO/Al2O3 (CZA) and γ -Al2O3 is presented.

2.1. Semi-Mechanistic (Lumped) Models

In the semi-mechanistic modeling approach, assumptions about the reaction mechanism are made and experimental data are used to determine the reaction kinetic parameters. Therefore, the influence of relevant operating conditions on the DME direct synthesis is the focus of numerous current research projects. Overviews are given, for example, by Z. Azizi et al. [4] and U. Mondal and G. D. Yadav [38].
The ranges evaluated in available modeling studies [15,16,17,18,19,20,21,22,23,24,25,26] are presented in Figure 1 for process variables that are particularly relevant for reaction kinetics, i.e, the temperature, pressure, the CZA-to- γ -Al2O3 weight ratio ( μ , Equation (1)), the carbon oxide ratio (COR, Equation (2)) and the stoichiometric number (SN, Equation (3)).
μ = m CZA m γ - Al 2 O 3
COR = 100 % y CO 2 , in y CO 2 , in + y CO , in
SN = y H 2 , in y CO 2 , in y CO , in + y CO 2 , in
The overlapping of the ranges is obvious and explained by the constraints inherent to the system under consideration. For example, the maximal temperature is defined based on the thermal stability of the catalysts, so as to avoid sintering of CZA except, of course, for studies where deactivation phenomena are investigated [18,20]. The lowest temperature, on the other hand, is typically chosen under consideration of the other process variables so as to have measurements in a range where the catalyst is active, and the signal-to-noise ratio is high. In the summarized studies, temperatures from 473 to 623 K have been evaluated (Figure 1a).
Since the process exhibits volume contraction, an increase in pressure has a positive effect on the process performance according to LeChatelier’s law [39]. However, the maximal pressure is limited due to high investment costs and necessary safety measures. At lab scale, the pressure range is often constrained by the experimental rig. As shown in Figure 1b, some studies [15,17,21,26] are conducted at 50 bar, which is the typical industrial operational pressure for methanol synthesis, while others evaluate a pressure range instead of a constant pressure level [18,19,20,22,24,25]. Overall, the summarized publications cover a pressure range from 9 to 72 bar.
As depicted in Figure 1c, the CZA-to- γ -Al2O3 weight ratio ( μ ) was chosen to be equal to or higher than the one in most studies, since it has been demonstrated that an increased fraction of methanol catalyst is beneficial for the overall process [15,16,40]. The optimal catalyst bed composition has been shown to be a function of the operating conditions [15,16] and the composition of syngas, especially regarding the CO2 amount in the feed [17].
In terms of the feed gas composition, instead of a simple listing of this heterogeneous information reported by different authors, an unambiguous characterization was conducted using the COR and SN in order to enable the comparison of the models.
The relevance of the COR lies in the high influence of the CO2 content in the syngas on the process performance: High CO2 levels in the feed have been shown to promote water formation and to reduce the attainable product yield [14,41,42]. However, kinetic models valid in a wide COR range are useful for process design and optimization, as interest in CO2 utilization grows in the industry [43]. The wide pattern in Figure 1d illustrates that the influence of CO2 has become increasingly important in recent years and is essential in current kinetic studies.
The SN is relevant in terms of the different hydrogen requirements for methanol production via CO or CO2 hydrogenation. This is because, due to the different syngas production technologies, the H2 content in the syngas is known to vary over a wide range [44], and adjustment of the H2 content in the feed gas is not always economically feasible due to the lack of sustainable H2 sources [45,46]. As shown in Figure 1e, a large range of SN is covered by the presented kinetic studies. However, a closer look in each publication reveals that in most cases, the effect of this variable was not evaluated systematically. Clearly, operating conditions for kinetic studies are chosen with consideration of the concurrent effects on the other process variables. For example, if the system is operated at low pressure, higher temperatures and low dilutions are required to achieve product concentrations that can be measured accurately. As a consequence, optimal conditions found in these studies are often local optima within the validity range of each model or experimental range. For example, Pelaez et al. [16] observed an increasing yield of DME with an increasing CZA fraction up to 92.5 wt.%, at a pressure of 30 bar and no CO2 in the feed. In contrast, in our previous investigations [17] conducted at 50 bar and high CO2 contents in the feed, an optimal catalyst bed composition was observed at approximately 66 wt.%. Hence, aiming towards the global optimization of the direct DME synthesis, a further systematic evaluation of process variables and their simultaneous effects is still necessary. However, in addition to the aforementioned process variables, many other factors play a significant role, such as the dynamic behavior of the catalysts, the reactor and its configuration, the composition of the CZA catalyst, the heat removal concept, etc. Therefore, in terms of time and resources, a comprehensive exploration of the state space is probably only feasible using models that have enough flexibility to evaluate larger operational ranges and number of process variables.

2.2. Data-Based Models

Artificial neural networks (ANNs) are one of the most powerful machine learning approaches for modeling [29,47,48], and as universal approximators, these can approximate nearly any continuous function in a bounded domain [49,50]. An essential step of this modeling approach is answering the design questions for ANNs, e.g., which activation functions are appropriate for the problem at hand, and how many layers and neurons are required to achieve sufficient model complexity [31]. The performance of the networks is typically evaluated based on the prediction accuracy and the convergence time, which have been shown to be remarkable, and superior in comparison to that of traditional (semi-)mechanistic models [32,51,52,53]. Further advantages of this modeling approach, is that no prior knowledge of the chemistry and physics of the system to be described is required and the high adaptability of ANNs to different structures and sizes of data sets [32,47,54]. Unlike semi-mechanistic models, ANNs (and, in general, machine learning approaches) have not been widely used for the modeling of the direct DME synthesis. Studies conducted for this process or for the single steps are summarized in the following.
In a previous work [51], we applied ANNs for the modeling of the direct synthesis of DME over the commercial catalyst system CZA/ γ -Al2O3 using data that had previously been used for the parametrization of a lumped model. ANNs could be trained successfully even with the limited amount of data. The trained ANN exhibited a fast convergence, and a high adaptability to the experimental data. Moradi et al. [52] analyzed the use of ANNs for modeling the single-step DME synthesis over a bifunctional CZA-H-ZSM-5 catalyst. The authors successfully trained an ANN to predict the CO conversion, as well as the DME selectivity and yield. Between 2003 and 2009, Omata et al. also conducted simulations of single-step DME synthesis using ANNs. Unlike Delgado Otalvaro et al. and Moradi et al., they used ANNs aiming at the maximization of the CO conversion by optimizing the temperature profile in the reactor [55,56] and by identifying effective additives for the CZA/ γ -Al2O3 catalyst based on the physicochemical properties of the elements [57].
Additionally, studies using ANNs have been conducted for the single steps of the direct synthesis [53,58,59,60,61]. For example, Svitnic et al. [58] used ANNs for the prediction of by-product formation in the methanol synthesis from syngas, based on data from a pilot plant. Moreover, since the methanol dehydration to DME proceeds without any relevant side reactions, its rate is directly proportional to the rate of depletion and/or formation and it can be measured directly. This advantage of the methanol dehydration to DME was used by Valeh-E-Sheyda et al. [59] and Alamolhada et al. [53] who used kinetic data and ANNs for the data-based modeling of the kinetics of this reaction.

2.3. Hybrid Models

To the best of our knowledge, hybrid models have not been yet applied to the direct DME synthesis. However, some hybrid models have been derived for the individual steps of this process. Zahedi et al. [62] used a hybrid model for the modeling of the CO2 hydrogenation to methanol. In their work, the authors applied a mechanistic, a data-based and a hybrid modeling approach and demonstrated the superior performance of the hybrid model regarding accuracy and computational effort. Potočnik et al. [63] used a kinetic model from the literature to predict the methanol production rate as a function of the pressure, temperature and the partial pressure of the main species in the system. ANNs were used in combination with this model as an error-corrector, enhancing the prediction accuracy in the range where experimental data were available. Alavi et al. [64] derived a mechanistic and a hybrid model for the methanol dehydration to DME. Here, an ANN was trained using data from a white-box model to predict the global reaction rate and it was integrated in the balance equations. The hybrid model was simpler and 20 times faster than the mechanistic model.
These studies show the potential of hybrid modeling for related systems. The second part of this contribution is devoted to the derivation of the first hybrid model for the direct DME synthesis.

3. Models’ Structures, Modeling and Experimental Methodology

For the comparative study aimed in this work, the observed discrepancies between model predictions must be only attributable to the models’ structural differences. Hence, these must be valid in the same range of conditions. In this section, the models’ structures are presented in order to identify crucial differences. The lumped and the data-based models are described first in Section 3.1 and Section 3.2, since elements from these types are necessary for the development of the hybrid model. The mathematical structure of the latter is subsequently introduced in Section 3.3. The results obtained with the hybrid model and the comparative analysis between the different model types is given in Section 4.
The structure of the models relevant in this work, i.e., the lumped, hybrid and data-based models, is shown schematically in Figure 2. The lumped and the hybrid model both consist of a reaction kinetic model for the calculation of the reaction rates and a reactor model based on the balance equations for the laboratory reactor. The mole fraction profiles y i ( z ) of the different species in the system are calculated by integration of the differential equations. With the data-based model, on the other hand, the mole fractions are predicted directly using ANNs.
The color spectrum in Figure 2 represents the level of information required for the different types of modeling; the darker the color, the less system knowledge is necessary. The ANNs, for example, are predictors based on training data, i.e., black box models. The reactor model for the tube reactor is characterized as white box since it is derived based on the species and the total mass balance. In contrast, the lumped and the hybrid model are both characterized as gray box. The lumped model is the model with the greatest knowledge content among the three, because the balance equations are generally valid and the rate expressions are based on mechanistic assumptions and thermodynamic considerations. It is considered a gray box model since the parameters of the Arrhenius and Van’t Hoff equations are estimated to fit experimental data. Comparably, the hybrid model is also considered a gray box model, since it involves knowledge and data-based elements in its structure.
In this contribution, a hybrid model for the direct DME synthesis is derived and presented. Since this is the first model of this type for the DME synthesis, its assessment has been made based on validation experiments and comparison with a semi-mechanistic model [15] and a data-based model [51].

3.1. Lumped Model

The lumped model was developed and validated in detail in a previous work [15]. It consists of balance equations and a lumped reaction kinetic model parametrized to fit intrinsic kinetic data. Equation (4) describes the change of the molar fraction of species i ( y i ) along the axial coordinate (z). Equation (5) accounts for the drop of the gas velocity u due to the reaction-induced volume contraction.
d y i d z = R T Z u p j Nr ν i , j r j y i k Nc j Nr ν k , j r j v
d u d z = R T Z p i Nc j Nr ν i , j r j v
In Equations (4) and (5), y i is the molar fraction of component i, R is the universal gas constant in J mol 1 K 1 , T is the temperature in K, Z is the mixture’s compressibility factor calculated with the Peng–Robinson equation of state (PR-EoS) [65], u is the gas velocity in m s 1 , p is the pressure in Pa, ν i , j is the stoichiometric coefficient of species i in reaction j. The abbreviations “Nr” and “Nc” refer to the number of reactions and components, respectively. Finally, r j v is the volume-specific rate of reaction j in mol m 3 s 1 which is defined by the reaction kinetic model described in the following.
The reaction kinetic model is based on the mechanistic study of Lu et al. [66] considering the CO2 hydrogenation to methanol, the methanol dehydration to DME and the water gas shift reaction (WGSR) (Equations (6)–(8)). Other possible reactions such as CO2 methanation were not included because no other products were detected at significant concentrations during the kinetic experiments.
Reaction   1 :     CO 2 + 3 H 2 CH 3 OH + H 2 O
Reaction   2 :     2 CH 3 OH CH 3 O CH 3 + H 2 O
Reaction   3 :     CO + H 2 O CO 2 + H 2
The respective reaction rates in mol kg 1 s 1 are calculated with Equations (9)–(11).
r 1 = k 1 ( f C O 2 f H 2 3 f H 2 O f C H 3 O H K f , 1 ) ( 1 + K C O 2 f C O 2 + K C O f C O + K H 2 f H 2 ) 3
r 2 = k 2 ( f C H 3 O H 2 f DME f H 2 O K f , 2 )
r 3 = k 3 ( f H 2 O f C O 2 f H 2 K f , 3 f C O ) 1 + K C O 2 f C O 2 + K C O f C O + K H 2 f H 2
Finally, r j v is given by
r j v = r j ( 1 ϵ ) ρ CZA ξ CZA , j = 1 j = 3 r j ( 1 ϵ ) ρ γ - Al 2 O 3 ξ γ - Al 2 O 3 , j = 2 .
In Equations (9)–(12), f i is the fugacity of component i in bar, calculated using the fugacity coefficients obtained from the PR-EoS, ϵ is the catalyst bed void fraction, ρ CZA and ρ γ - Al 2 O 3 are the CZA and γ -Al2O3 densities, and ξ CZA and ξ γ - Al 2 O 3 are the respective volume fractions in the catalyst bed. The equilibrium constants ( K f , j ) are calculated with Equation (13), whereas the reaction rate and adsorption constants ( k j and K i ) are defined by the reparametrized Arrhenius and Van ’t Hoff equations (Equations (14) and (15)) for a reference temperature T R of 503 K.
K f , j = 10 A j T B j
k j = k j , T R exp E A , j , n T R T 1 , with E A , j , n = E A , j T R R
K i = K i , T R exp Δ H i , n T R T 1 , with Δ H i , n = Δ H i T R R .
The model-specific parameters for Equations (13)–(15) ( A j , B j , k j , T R , E A j , n , K i , T R and Δ H i , n ) are provided in Table 1.
These parameters were determined based on intrinsic kinetic data acquired in a fixed bed reactor at a pressure of 50 bar under variation of the temperature, the feed composition ( y C O , in , y CO 2 , in , y H 2 , in ) and the total gas flow, as summarized in Table 2. The catalyst bed consisted of mechanically mixed CZA and γ - Al 2 O 3 catalysts in a 1:1 mass ratio for a total catalyst mass of 2 g.

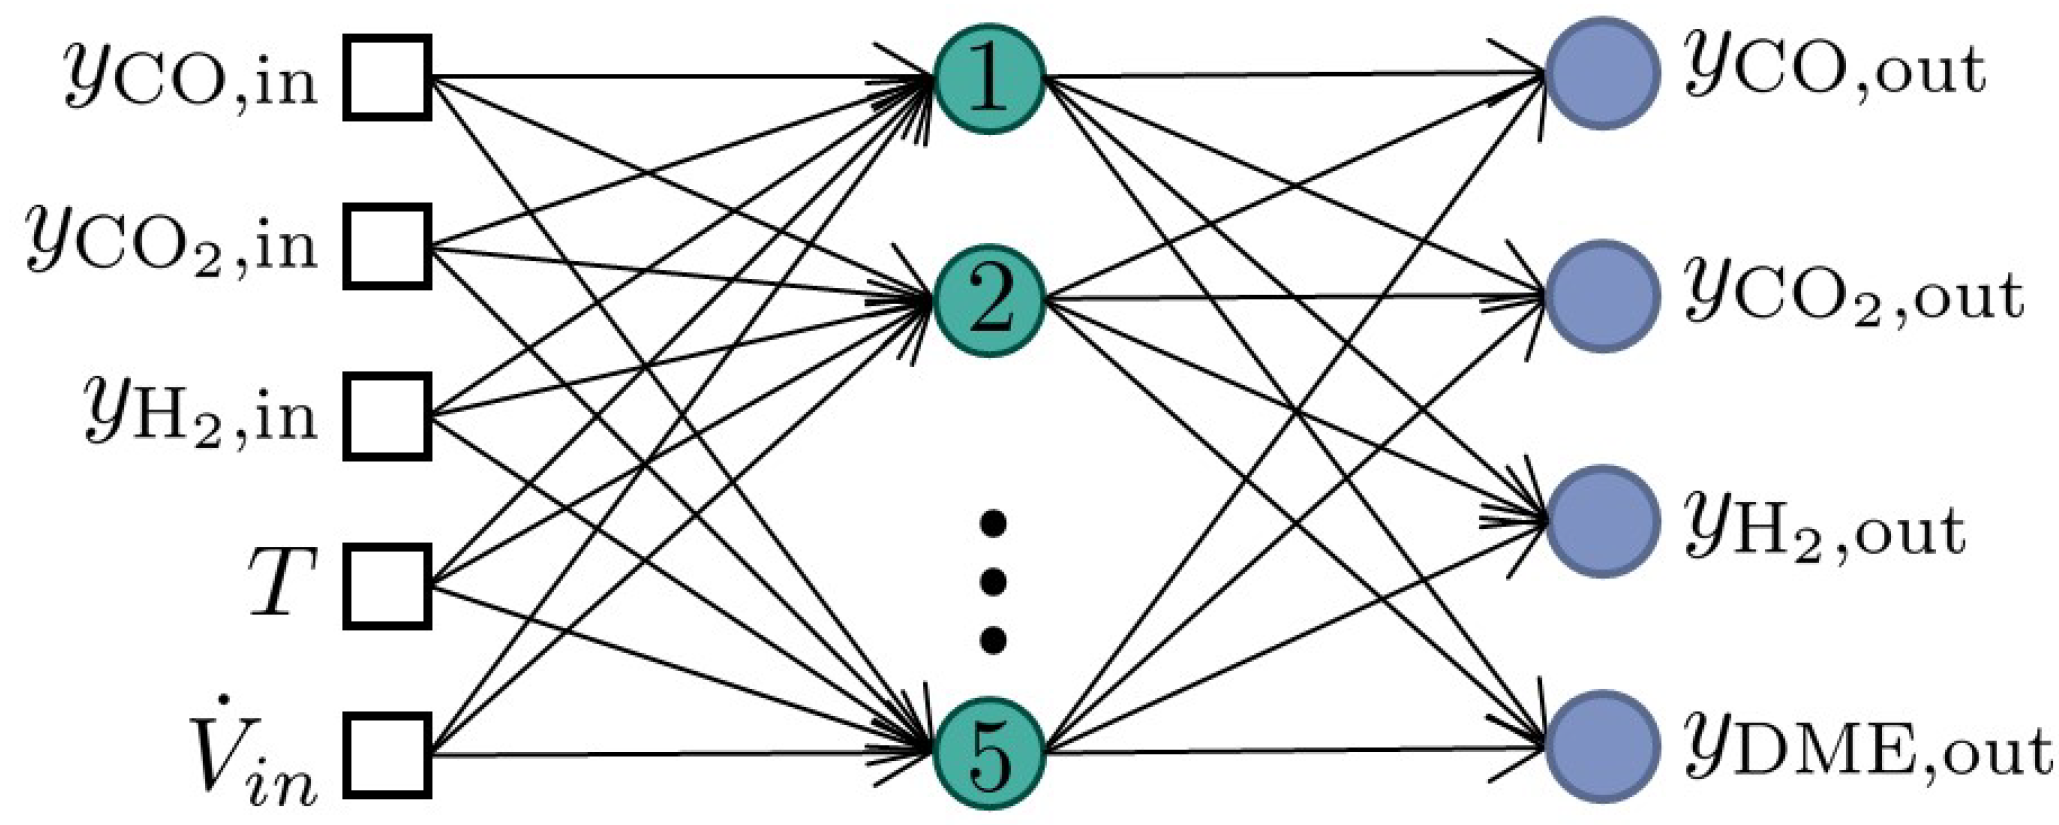
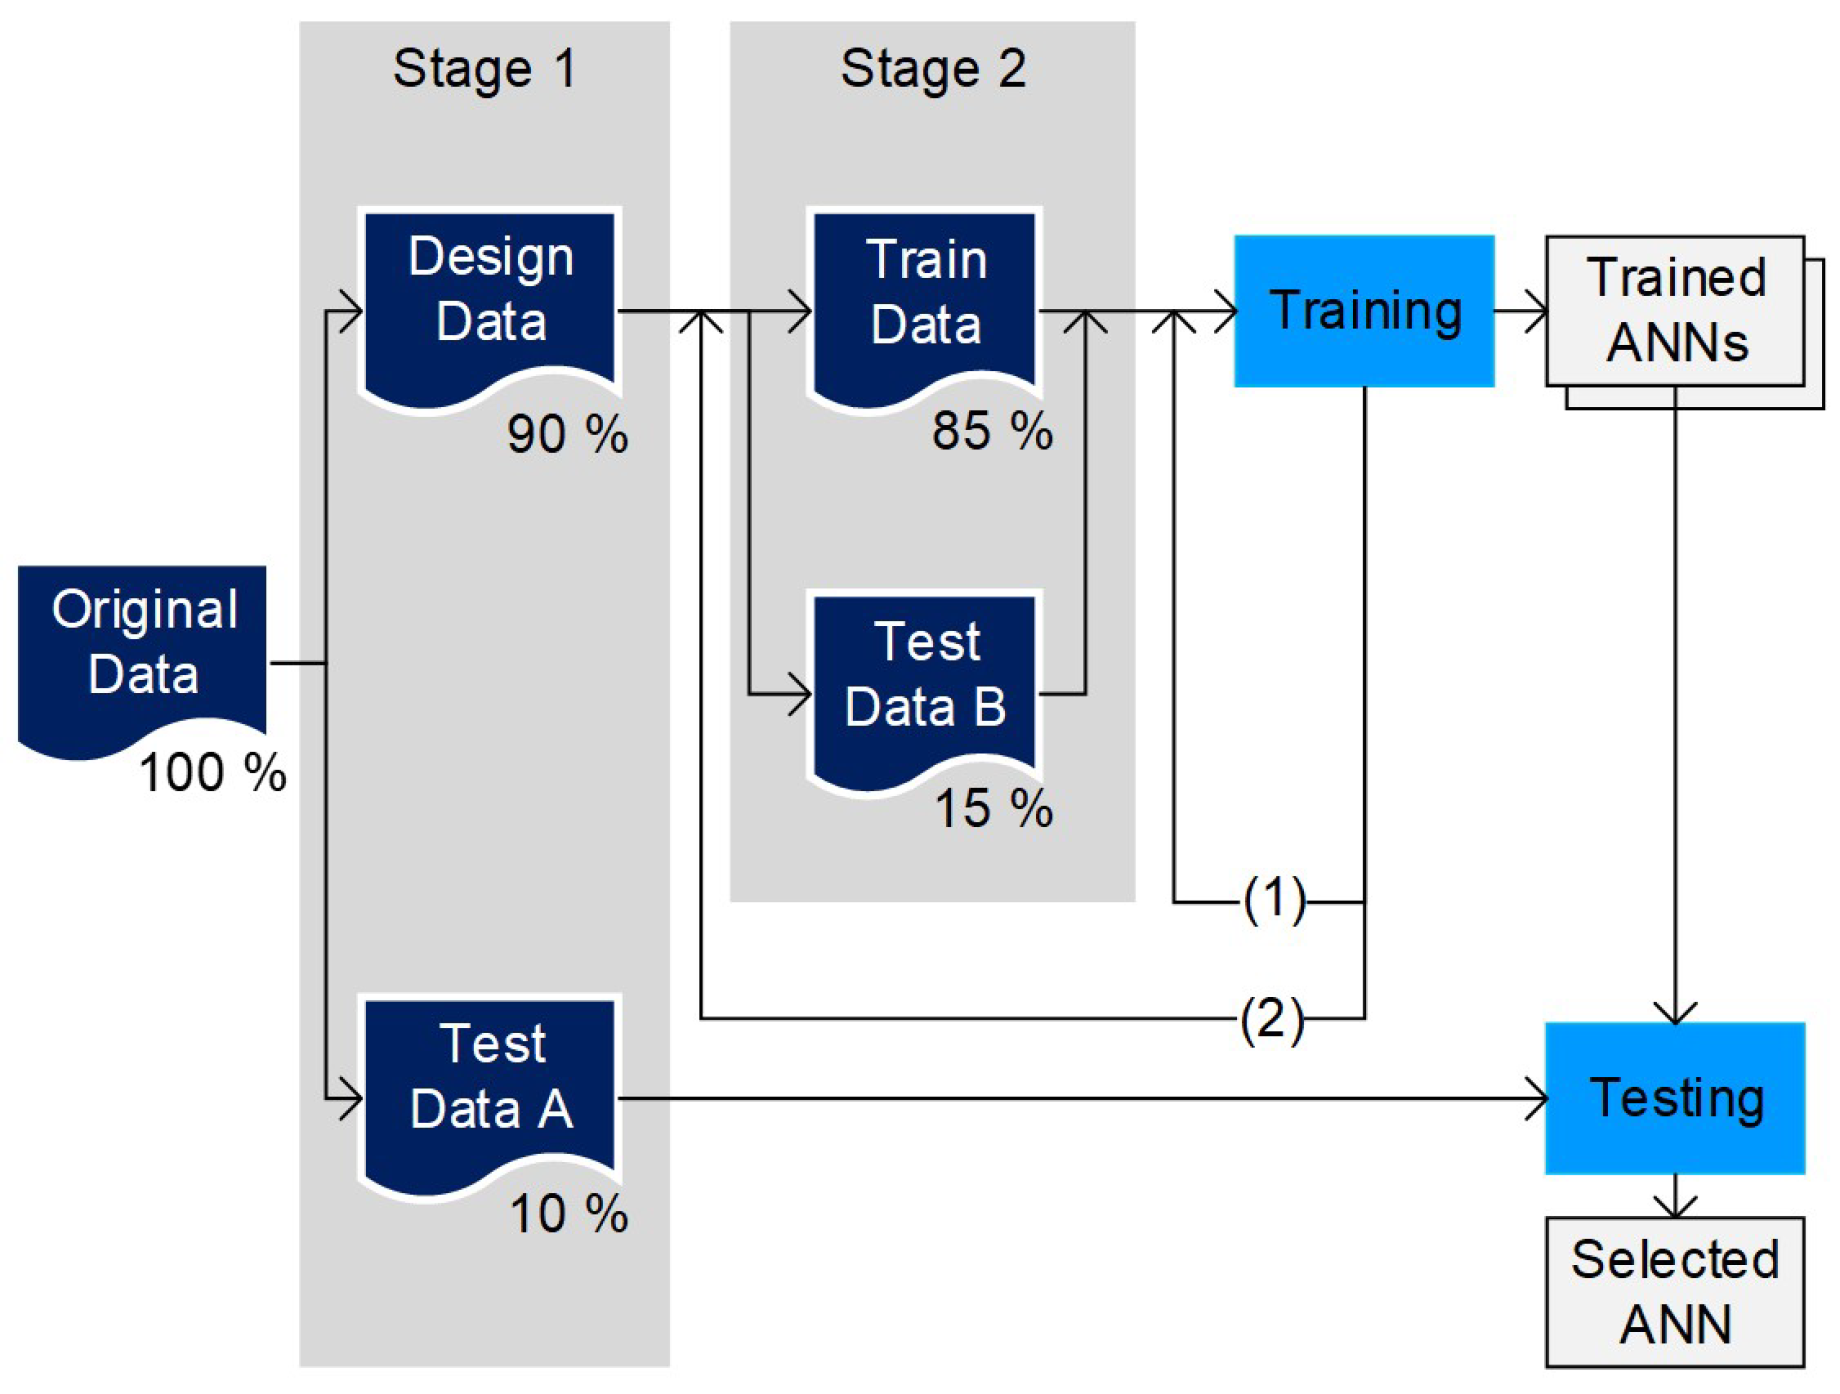
3.2. Data-Based Model and ANN Training Strategy

The data-based model derived and evaluated in a previous work [51] consists of an ANN trained to predict the concentration of CO, CO2, H2 and DME in the product gas based on the composition of the feed gas ( y CO , in , y CO 2 , in and y H 2 , in ), the total gas flow V ˙ in and the temperature (Figure 3). In this configuration, the ANN replaces both the reactor and the reaction kinetic model. The model was trained using the same data used for the parameter estimation of the lumped kinetic model (Table 2) and, hence, it has the same validity range.
The data division and training strategy used for the data-based model is also relevant to this work [51]. The ANN of the data-based model (ANN-DBM) and the one of the hybrid model (ANN-HM) are predictors of different quantities and are trained using different data structures (Section 3.3). However, the data division and training methodology presented in our previous work [51] is automatic and adaptable to multidimensional data sets of different sizes and structures, and thus used in this work for the design of the ANN-HM. As depicted in Figure 4, the data division is conducted in two stages. In Stage 1, the data samples are divided into two subsets, one for the design and training of the networks (Design Data), and one for the posterior network selection based on separate data (Test Data A). In Stage 2, the design data are again divided into two subsets, the Train Data subset used in the backpropagation framework [67] to determine the network’s parameters (weights and biases), and the Test Data B subset used in the framework of Bayesian regularization [68] to test the trained networks without a validation subset. The training is conducted iteratively under variation of the start parameter values (label (1)) to avoid local optimality, and of the data division of the design data (label (2)). The Test Data B subset is not used directly to determine the network’s parameters, however, since the data in this subset are used for model selection, it introduces a certain bias in the model. To guarantee that the network with the best generalization, i.e., with the best performance on independent data samples, is chosen, Test Data A are used for the final network selection.

3.3. Hybrid Model

As depicted in Figure 2, the hybrid model consists of two parts: a reactor model and an ANN. The reactor model is the same that is used in the lumped model (Equations (4) and (5)). These are generally valid and constitute the “knowledge module” of the hybrid model. The ANN embedded within the framework of the ordinary differential equations, is used for the calculation of the reaction rates ( r j ), and replaces the reaction kinetic model. Clearly, the ANN of the data-based model is not suitable for the calculation of the rates, since this ANN is trained to predict the product gas composition. In the following sections, the design of the ANN as a predictor of the rates for the hybrid model (ANN-HM) is described.

3.3.1. Architecture

Comparable to the architecture of the ANN-DBM, the ANN-HM is also shallow (one single hidden layer with a finite number of hidden neurons) and feedforward (unidirectional information flow from input to output), as depicted in Figure 5. The new ANN-HM is trained to replace the reaction kinetic model, i.e., to predict the reaction rates along the axial coordinate z. Hence, the target vector y contains three elements, one representing the rate of each reaction (Equations (6)–(8)), as follows,
y = r 1 , r 2 , r 3 | z .
The rates are calculated as a function of the temperature and the mole fractions of each species in the system. The input vector is thus defined by
x = y C O , y CO 2 , y H 2 , y H 2 O , y MeOH , y DME , y Ar , y N 2 , T | z .
The elements in Equations (16) and (17) correspond to the values at different positions of the axial coordinate z. Since all experiments were conducted under isothermal conditions, the temperature is constant along the reactor length L bed and Equation (18) applies.
T | z = T , z 0 , L bed .
Other process variables that are considered to be constant in the axial domain and over all data points, such as the catalyst distribution and pressure, are not included explicitly in the model. Furthermore, the proposed structure is one of innumerable possibilities for the design of the ANN-HM, and additional input variables can be included in the network to consider further phenomena if the respective data is available. For example, including the time on stream (ToS) in the input vector and data samples measured at different ToS during the ANN training would enable to consider the effect of activity loss on the reactions rates.
While the number of input and output neurons is constrained by the input and output variables (Equations (16) and (17)), the number of neurons in the hidden layer has to be determined empirically. For the selection of an appropriate number of hidden neurons (HN), architectures with up to 30 HN were tested. The best ANN was selected based on the prediction accuracy on “unseen” data, using a mean relative error of 5% over all samples in Test Data A (Figure 4).
The remaining network’s characteristics are chosen to be the same as in the data-based model in order to ensure comparability of the models. Hence, the logarithmic sigmoid and the positive linear functions were used as the activation function in the hidden and output neurons, respectively. The sigmoid function serves to map the known nonlinearities in the system. Bayesian regularization was chosen as the training algorithm. This method proposed by McKay [68] aims to avoid overfitting by training only the number of parameters necessary to minimize the objective function, instead of all parameters available. Thus, the model sensibility to the network architecture is reduced and overfitting can be avoided.

3.3.2. Training Data

For a comparative study of the models, possible biases must be excluded to ensure that the prediction discrepancies are caused only by the structural differences between the model types. For the comparison of the lumped and the data-based model, this was achieved by training/parametrizing both models with the same experimental data. In the case of the hybrid model, the ANNs act as a predictor for the reaction rates, which are not metrologically accessible from integral experiments where the measurable variable is the composition of the product gas ( y i , out ). Therefore, to generate training data for the ANN-HM, simulations are performed with the lumped model under the conditions of the experiments to which the lumped and data-based models were fitted (Table 2). The axial domain is discretized as shown in Figure 6, using different mesh refinements with 5, 10, 15, 50 and 100 uniformly distributed elements, and the reaction rates at the nodal points are used for training.

3.4. Experimental Equipment and Procedures

New experiments were conducted with the same laboratory setup used for the measurement of the kinetic data for model development. These experiments were performed to validate the simulation results obtained during extrapolation analysis in Section 4.3. The reactor used for the experiments is a plug flow tube reactor made of stainless steel. It has a length of 460 mm and an internal diameter of 12 mm. For heating purposes, the reactor outer wall is enclosed by four brass jaws with heating cartridges (Horst GmbH, Lorsch, Germany). The pressure of the reactor is regulated manually with a mechanical pressure regulator (Emerson Automation Solutions, Langenfeld, Germany) and mass flow controller (Bronkhorst High-Tech B.V., AK Ruurlo, The Netherlands) are used to regulate the gas flow into the reactor. A Fourier-transform infrared spectrometer (FTIR, Gasmet Technologies GmbH, Germany) and a gas chromatograph (GC, Agilent Technologies Deutschland GmbH, Waldbronn, Germany) were used to quantitatively analyze the feed and product gases. Further details on the reactor setup and analytics are described in previous works [15,17].
The syngas used for the experiments consisted of the feed gases hydrogen (H2, 99.9999%), carbon monoxide (CO, 99.97%), a mixture of carbon dioxide and nitrogen (CO2/N2, 20:80 ± 1.0%), as well as nitrogen (N2, 99.9999%). The gases were purchased by Air Liquide Deutschland GmbH., Ludwigshafen, Germany A 1:1 mechanical mixture of the commercial catalysts CuO/ZnO/Al2O3 (CZA) and γ -Al2O3 (Alfa Aesar, Kandel, Germany) was used. The size distribution of the catalyst particles lay between 250 µm and 500 µm. Silicone carbide (SiC, Hausen Mineraliengroßhandel GmbH, Germany) with the same particle size distribution was mechanically mixed with the commercial catalysts in order to avoid the formation of hot spots in the catalytic bed.
Before starting the experimental measurements, the catalyst was reduced using 5% H2 in N2 at atmospheric pressure and temperatures between 363 K and 513 K. After that, the catalysts were conditioned and the measured species concentrations were monitored based on a reference experimental point to check for any loss of activity. After a stable catalytic activity was achieved, any deactivation of the catalysts could be ruled out. Additional information on the catalyst conditioning and deactivation can be found in the ESI.

4. Hybrid Model Results

In this chapter, the results of the ANN-HM training are presented first, followed by the evaluation of the models performance and interpolation ability. Subsequently, a comparative analysis of the predictions of the three different model types is conducted and complemented with the experimental validation of simulation results.

4.1. ANN-HM Training Results

In the absence of an established systematic approach, determining the appropriate number of hidden neurons (HNs) is one of the major challenges in modeling with ANNs. If the number of HN is too low, the forecasting ability of the model is limited, and the input-output relationships in the data might not be represented accurately. If the number of HN is too high, overfitting might occur. In this case, the model can learn the data noise or “memorize” the training data, and the error on the test data, which is not used during training, typically begins to rise [31,47]. In Figure 7, two error measures, namely, the mean squared error (Figure 7a) and the mean relative error (Figure 7b) are shown as a function of the number of HNs. It is observed that as the number of HNs increases, the prediction accuracy also increases, which can be attributed to the increasing number of parameters and model complexity. Additionally, in the evaluated range with up to 30 HNs, the error on the test data set also decreased with increasing complexity (Figure 7b), which indicates that overfitting was suppressed effectively. Another observation from this figure is that the error on the training and test data sets is of the same order of magnitude, which is also an indication of the successful avoidance of overfitting. We attribute this to the training algorithm based on Bayesian regularization, which has proven to be effective for this purpose [51,68,69,70].
Approaches for network selection include empirical correlations [71,72,73] or graphical methods. One approach is the elbow method, where a loss function, e.g., the mean squared error (MSE) between targets and model outputs is plotted against the number of hidden neurons, and the optimal network is determined based on the inflection point (elbow) of the curve [74]. According to this theory, the optimal number of HN is approx. 4 or 5 (see Figure 7a). On the other hand, the mean relative error of prediction (depicted in Figure 7b) shows that 5 HNs do not provide enough model complexity to achieve the targeted prediction accuracy. A mRE ≤ 5% is achieved with networks with more than 25 HNs. Based on this and, most importantly, on the model performance regarding extrapolation (further discussion in Section 4.3) the ANN with 26 HN was chosen for the further analysis. A schematic representation of the resulting network as well as the model-specific parameters are provided in the Supplementary Material.
The time required to train 10,000 ANNs (with 100 schemes for the division of design data and 100 set of start parameter values as described in Section 3.2) is also plotted in Figure 7a. Overall, the training time increases with the number of parameters. However, even at the highest number of parameters tested (with HN = 30), the training time remained bellow 7 min. Considering that the training of the data-based model and the parameter estimation for the lumped kinetic model required approximately 7.9 min and 3.5 h, respectively [51], the computational burden can be assessed as remarkably low, as expected from related studies [32,62,64].

4.2. Hybrid Model Performance and Interpolation Ability

After integration of the selected ANN-HM into the differential equation framework, the predictions of the hybrid model can be evaluated in comparison with the experimental values and the predictions of the other models. First, the successful implementation of the hybrid model is validated by comparison with experimental data. The mean relative error between the experiments and the predictions of the lumped and the hybrid model are shown in Table 3. The high similarity between the deviations of both models from experimental data is explained by the fact the ANN-HM was trained with reaction rates calculated with the lumped model, and shows the high level of accuracy obtained with the hybrid approach. Similarly to the computational burden, the accuracy of hybrid models has been previously investigated in related studies [62,64,75] which show, in agreement with our results, the remarkable performance of this model type.
The interpolation ability of the hybrid model was also evaluated, and no difficulties were observed. This is shown for an exemplary feed gas composition in Figure 8 (further examples are given in the Supplementary Material). In this figure, the mole fractions of H2, CO, CO2 and DME predicted with the hybrid model within the temperature and total gas flow ranges are shown. At increasing temperatures, the reaction rates also increase, leading to higher product concentration (DME and CO2) and lower concentration of the educts CO and H2 at the reactor outlet. Similarly, a decreasing total gas flow leads to longer residence times, which affects the outlet concentrations in the same way as increasing temperatures. These expected trends and also smooth gradients are observed over the response surfaces for all species. A further illustration of the interpolation ability of the hybrid model can be observed in Figures 11 and 12 between the dashed lines that represent the models’ range of validity. In this range, the predictions of the hybrid and the lumped models are almost identical and the predictions of the data-based model are comparable to those of the other two models, but show a slightly better agreement with the experiments.
Another relevant feature between the different model types is the convergence time. To provide a quantitative comparison, simulations were conducted with the three models for all the operating points in the data base (on Windows 10 Pro (64-bit) operating system with i5 processor and 8GB RAM). The time required by each model to simulate the 180 operating points was:
  • Data-Based: 0.0798 s;
  • Hybrid: 4.2432 s;
  • Lumped: 16.4095 s.
The superiority of the data-based model regarding the convergence time is obvious, and although the hybrid model is slower than the data-based one, the former is still approximately four times faster than the lumped model.
The convergence time is of special interest when the models are used for optimization purposes and large number of simulations have to be conducted to screen the state space. A further characteristic relevant for optimization is the extrapolation ability of the models, which is evaluated in the following section.

4.3. Models’ Extrapolation Ability

The following sections are dedicated to the evaluation of the models’ predictive ability outside the range of validity, i.e., the extrapolation ability. For this purpose, two types of extrapolation are evaluated—dimension and range extrapolation. Dimension extrapolation refers to the extrapolation of a variable that was kept constant during the experiments for model development. Range extrapolation, on the other hand, refers to the evaluation of a variable outside the range screened during these experiments [76]. The pressure and the catalyst bed composition are used here as exemplary variables to evaluate the dimension extrapolation (Section 4.3.1). Range extrapolation is analyzed based on the temperature in Section 4.3.2. Experimental values used for validation of the simulations at extrapolated conditions are reported in the Supplementary Material.

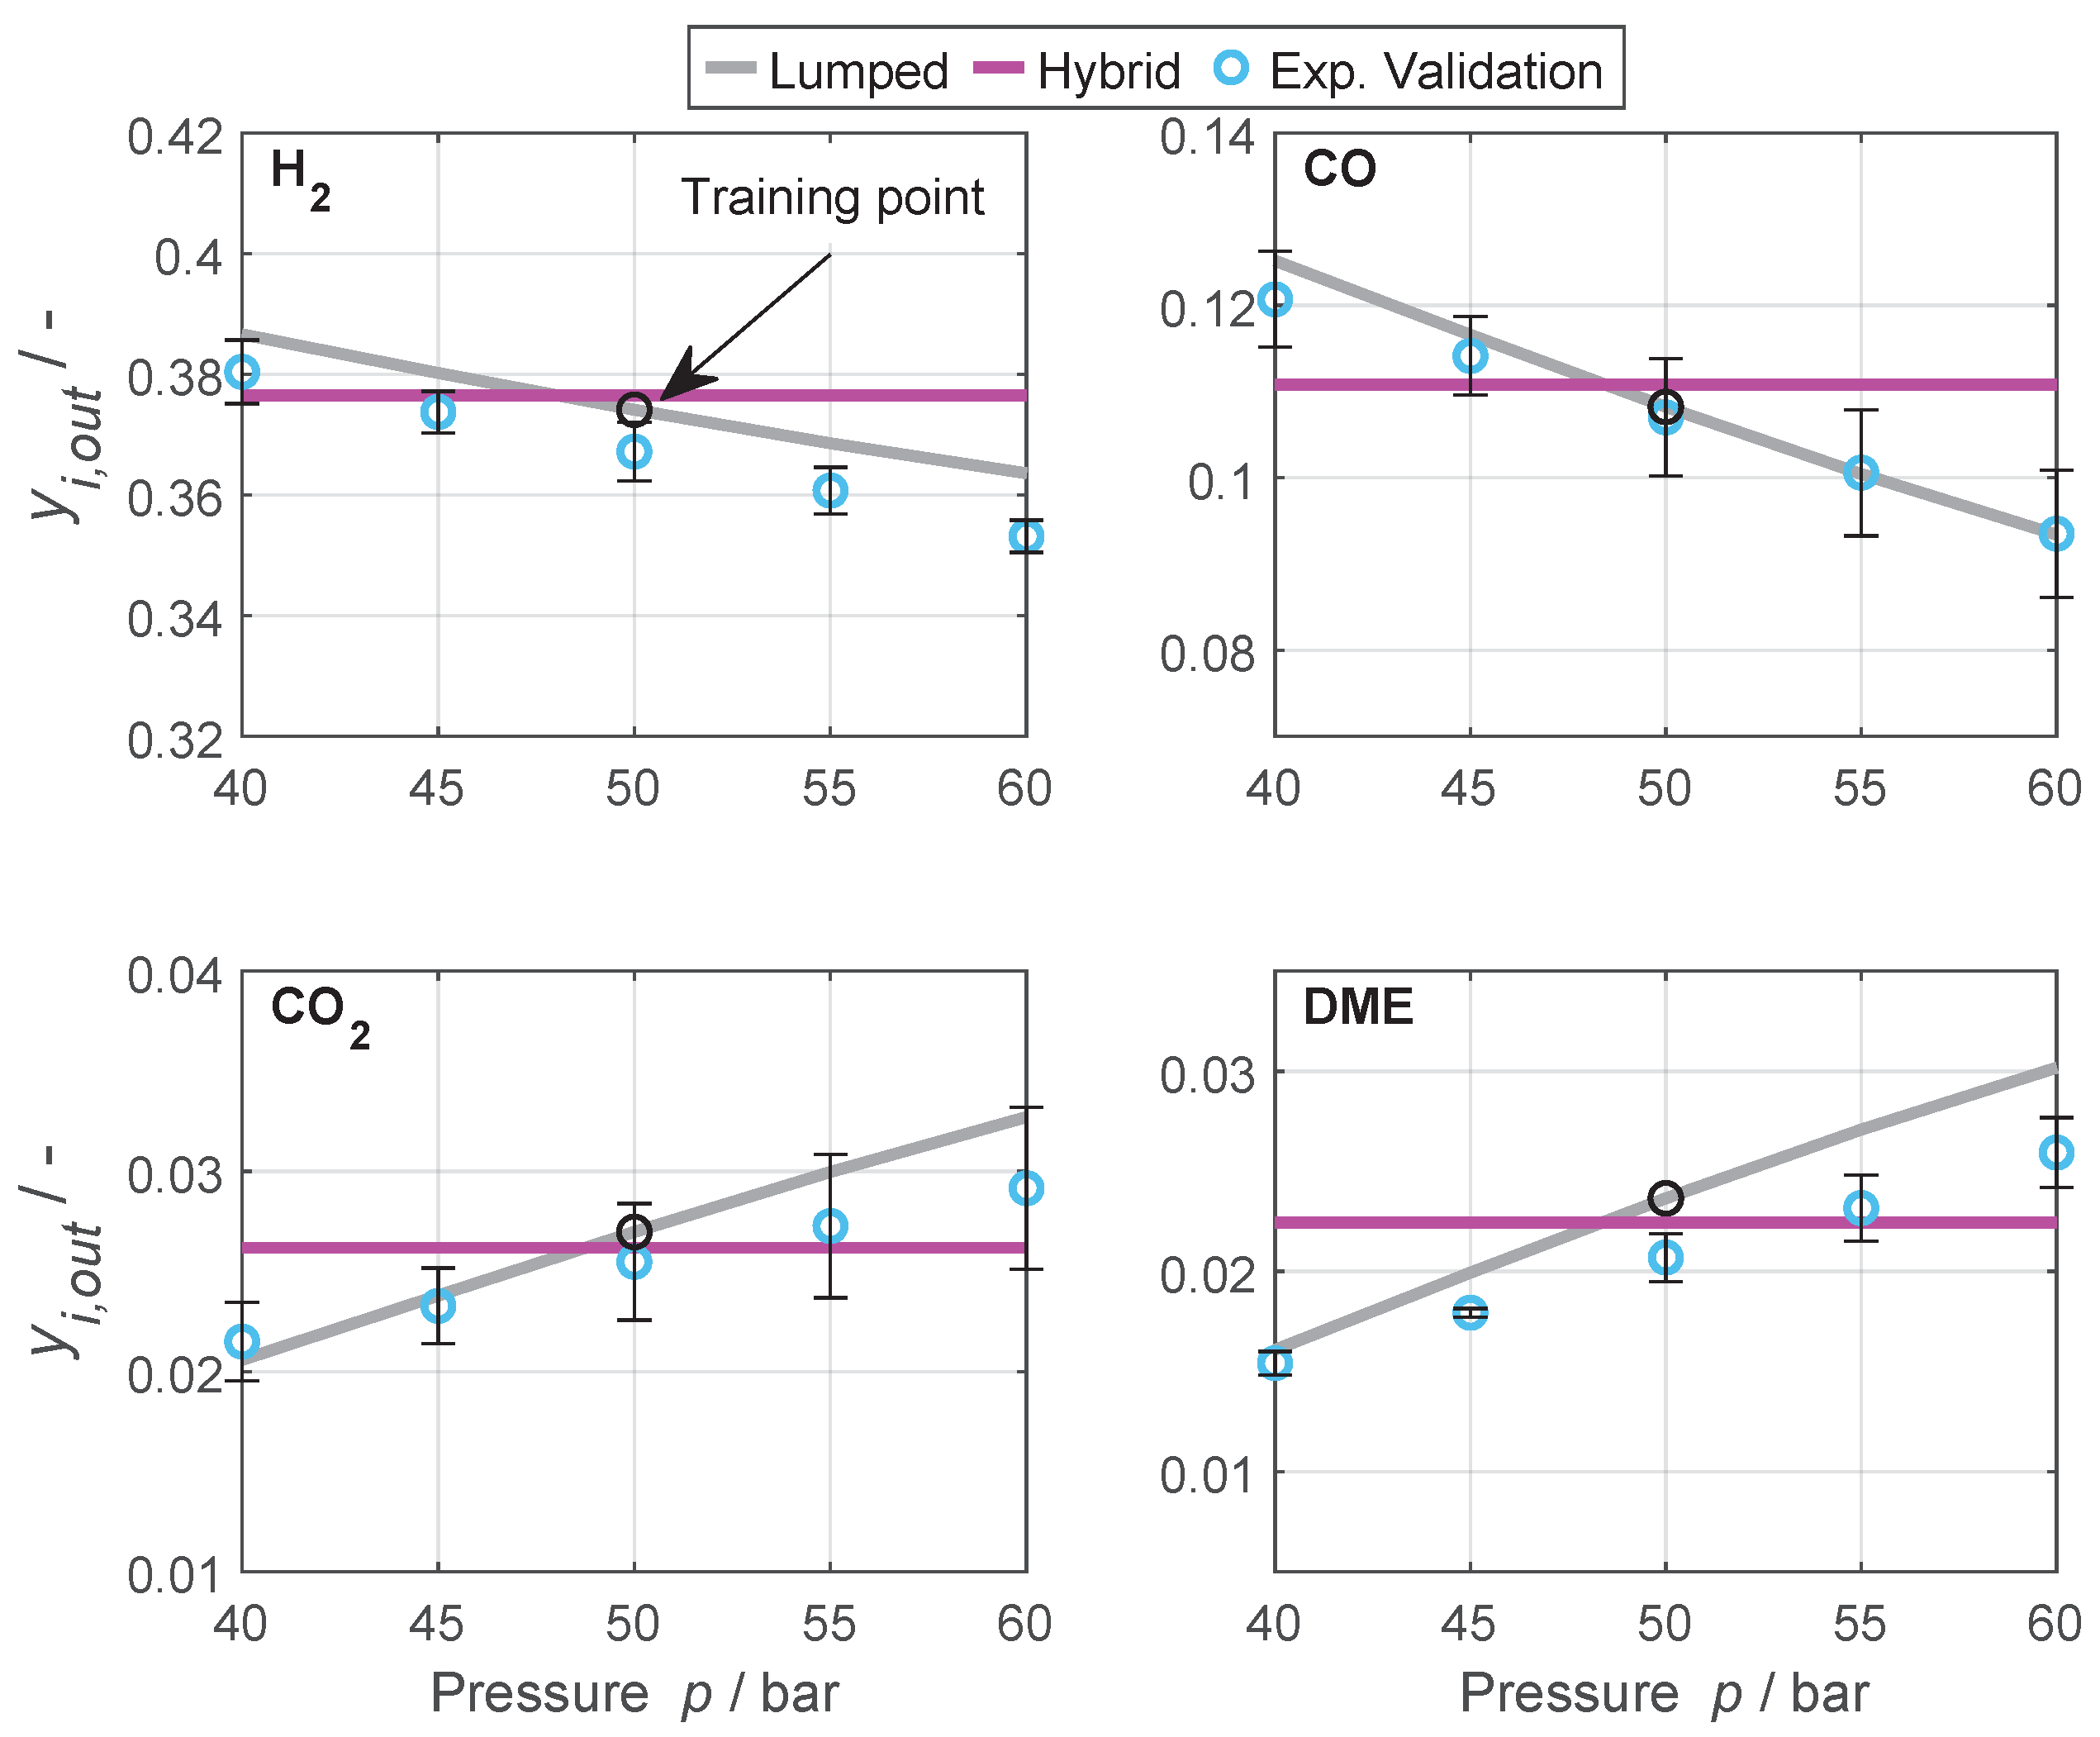
4.3.1. Dimension Extrapolation

Since all the experimental data used for the parametrization of the hybrid model were acquired at constant pressure and catalyst bed composition (p = 50 bar and CZA-to- γ -Al2O3 mass ratio μ = 1), these variables are suitable for the evaluation of the hybrid model regarding dimension extrapolation.
The pressure was evaluated in a range between 40 and 60 bar by means of experiments and simulations. The data-based model was not used for this analysis since the structure of the ANN-DBM, which only takes the concentration of the syngas, the temperature and the total gas flow into account, does not allow simulations at other pressure levels (refer to ANN structure, Figure 3).
At 50 bar, the deviation between the experiments for model development and for validation show a very good agreement, with a maximal deviation of 4.5%. Furthermore, the validation experiments show the expected behavior, i.e., with increasing pressure, the product gas concentration of the educts decreases and that of the products increases (Figure 9). Due to the volume contraction of the methanol synthesis from CO2 (Equation (6)), the rate of this reaction is favored by high pressures. Hence, from the thermodynamic perspective, the pressure has always a positive effect on the overall process performance. This effect is reflected by the lumped model for all species in the entirety of the evaluated pressure range. The average deviations between the experiments and the predictions of the lumped model lie by 2.1% for H2, 1.5% for CO, 6.9% for CO2 and 12.6% for DME within the prediction accuracy of the model, confirming the high fidelity of the semi-mechanistic model approach. The concentration profiles obtained with the hybrid model, on the other hand, are nearly constant over all evaluated pressures at the value predicted for 50 bar. Similar to the ANN-DBM, the structure of the ANN-HM does not allow the variation of the pressure (Figure 5) since all the training data was measured at only one pressure level. Thus, the pressure dependency of the reaction rates is not considered by the hybrid model and dimension extrapolation regarding this variable is not possible.
The catalyst bed composition μ is also suitable for testing the dimension extrapolation of the hybrid model, since all the experiments for model development were measured with μ = 1. Unlike the pressure, μ does not have a direct influence on the reaction rates, and hence extrapolating this variable does not imply the extrapolation of the ANN-HM. Therefore, better extrapolation results are expected. For this analysis, μ was varied from 0 to 5 and simulations with the lumped and hybrid model were conducted. Representative results are shown in Figure 10.
With the lumped model, an increasing conversion of CO x and yield of DME with increasing μ is predicted, and the values at the highest μ display a high proximity to the values at equilibrium. This behavior is attributed to the synergy of the direct synthesis, where the equilibrium of the methanol synthesis is shifted towards the products by methanol consumption through the dehydration to DME. With an increasing μ , methanol is produced faster, which boosts the methanol dehydration reaction and overcompensates for the decreased amount of dehydration catalyst [15].
The conversion and yield predicted by the selected hybrid model (ANN-HM with 26 HN) show a remarkably good agreement with the predictions of the lumped kinetic model over the entirety of the extrapolated range. The predictions of the lumped and the hybrid model overlap from μ up to 1, and proceed with a very similar trend. Although the deviation between the models’ predictions increases as the distance from the training point μ = 1 becomes larger, the predictions are thermodynamic consistent, and very similar over the whole evaluated range (e.g., at μ = 5, X CO x = 58.7 and 55% with the lumped and the hybrid model, respectively).
The predictions of hybrid models with ANN-HM with 5 and 28 HNs are shown in Figure 10a,c to illustrate the importance of considering the model’s extrapolation ability during the network selection. Both models displayed a relatively good performance on the training data in Section 4.1. This is also evident in Figure 10a,c, where the conversion and yield profiles predicted by all hybrid models overlap near the training point. However, the hybrid models with 5 and 28 HN clearly lack the ability to extrapolate. The predictions of these models do not follow the expected trend, nor do they respect the laws of thermodynamics. This illustrates one of the major drawbacks of data-based and/or hybrid approaches. Both models delivered a good performance on the training data and exhibited a good interpolation ability. However, it is not possible to predict the quality of the forecasts beyond the range where these models were trained, since the predictions at extrapolated conditions (especially regarding dimension extrapolation) are only dependent on the mathematical structure of the network, without an explainable phenomenological reason.
As mentioned in Section 3.3.2, different mesh refinements of the axial domain were tested during the generation of training data. Figure 10b,d show the CO x conversion and DME yield at mesh refinements with 5, 10 and 15 axially distributed elements. Evidently, the mesh refinement with five elements does not provide enough data for training, leading to poor extrapolation capability of the hybrid model. With 15 elements, on the other hand, no relevant improvement of the network generalization is achieved and the predictions almost entirely overlap with those obtained with 10 axial elements. Similarly, no improvement was achieved with mesh refinements with 50 and 100 elements, however, the training time increased noticeably with the large number of data samples.
In this section, it was shown that the data-based models (ANN-DBM and ANN-HM) lack in extrapolation ability, while the hybrid model could be extrapolated successfully in a large range when the extrapolation variable was not in the data-based module of the hybrid structure and the extrapolation ability was taken into account during model development. This requires knowledge of the system and/or of the expected trends, and is only relevant if extrapolation is relevant for the aimed application of the hybrid model.

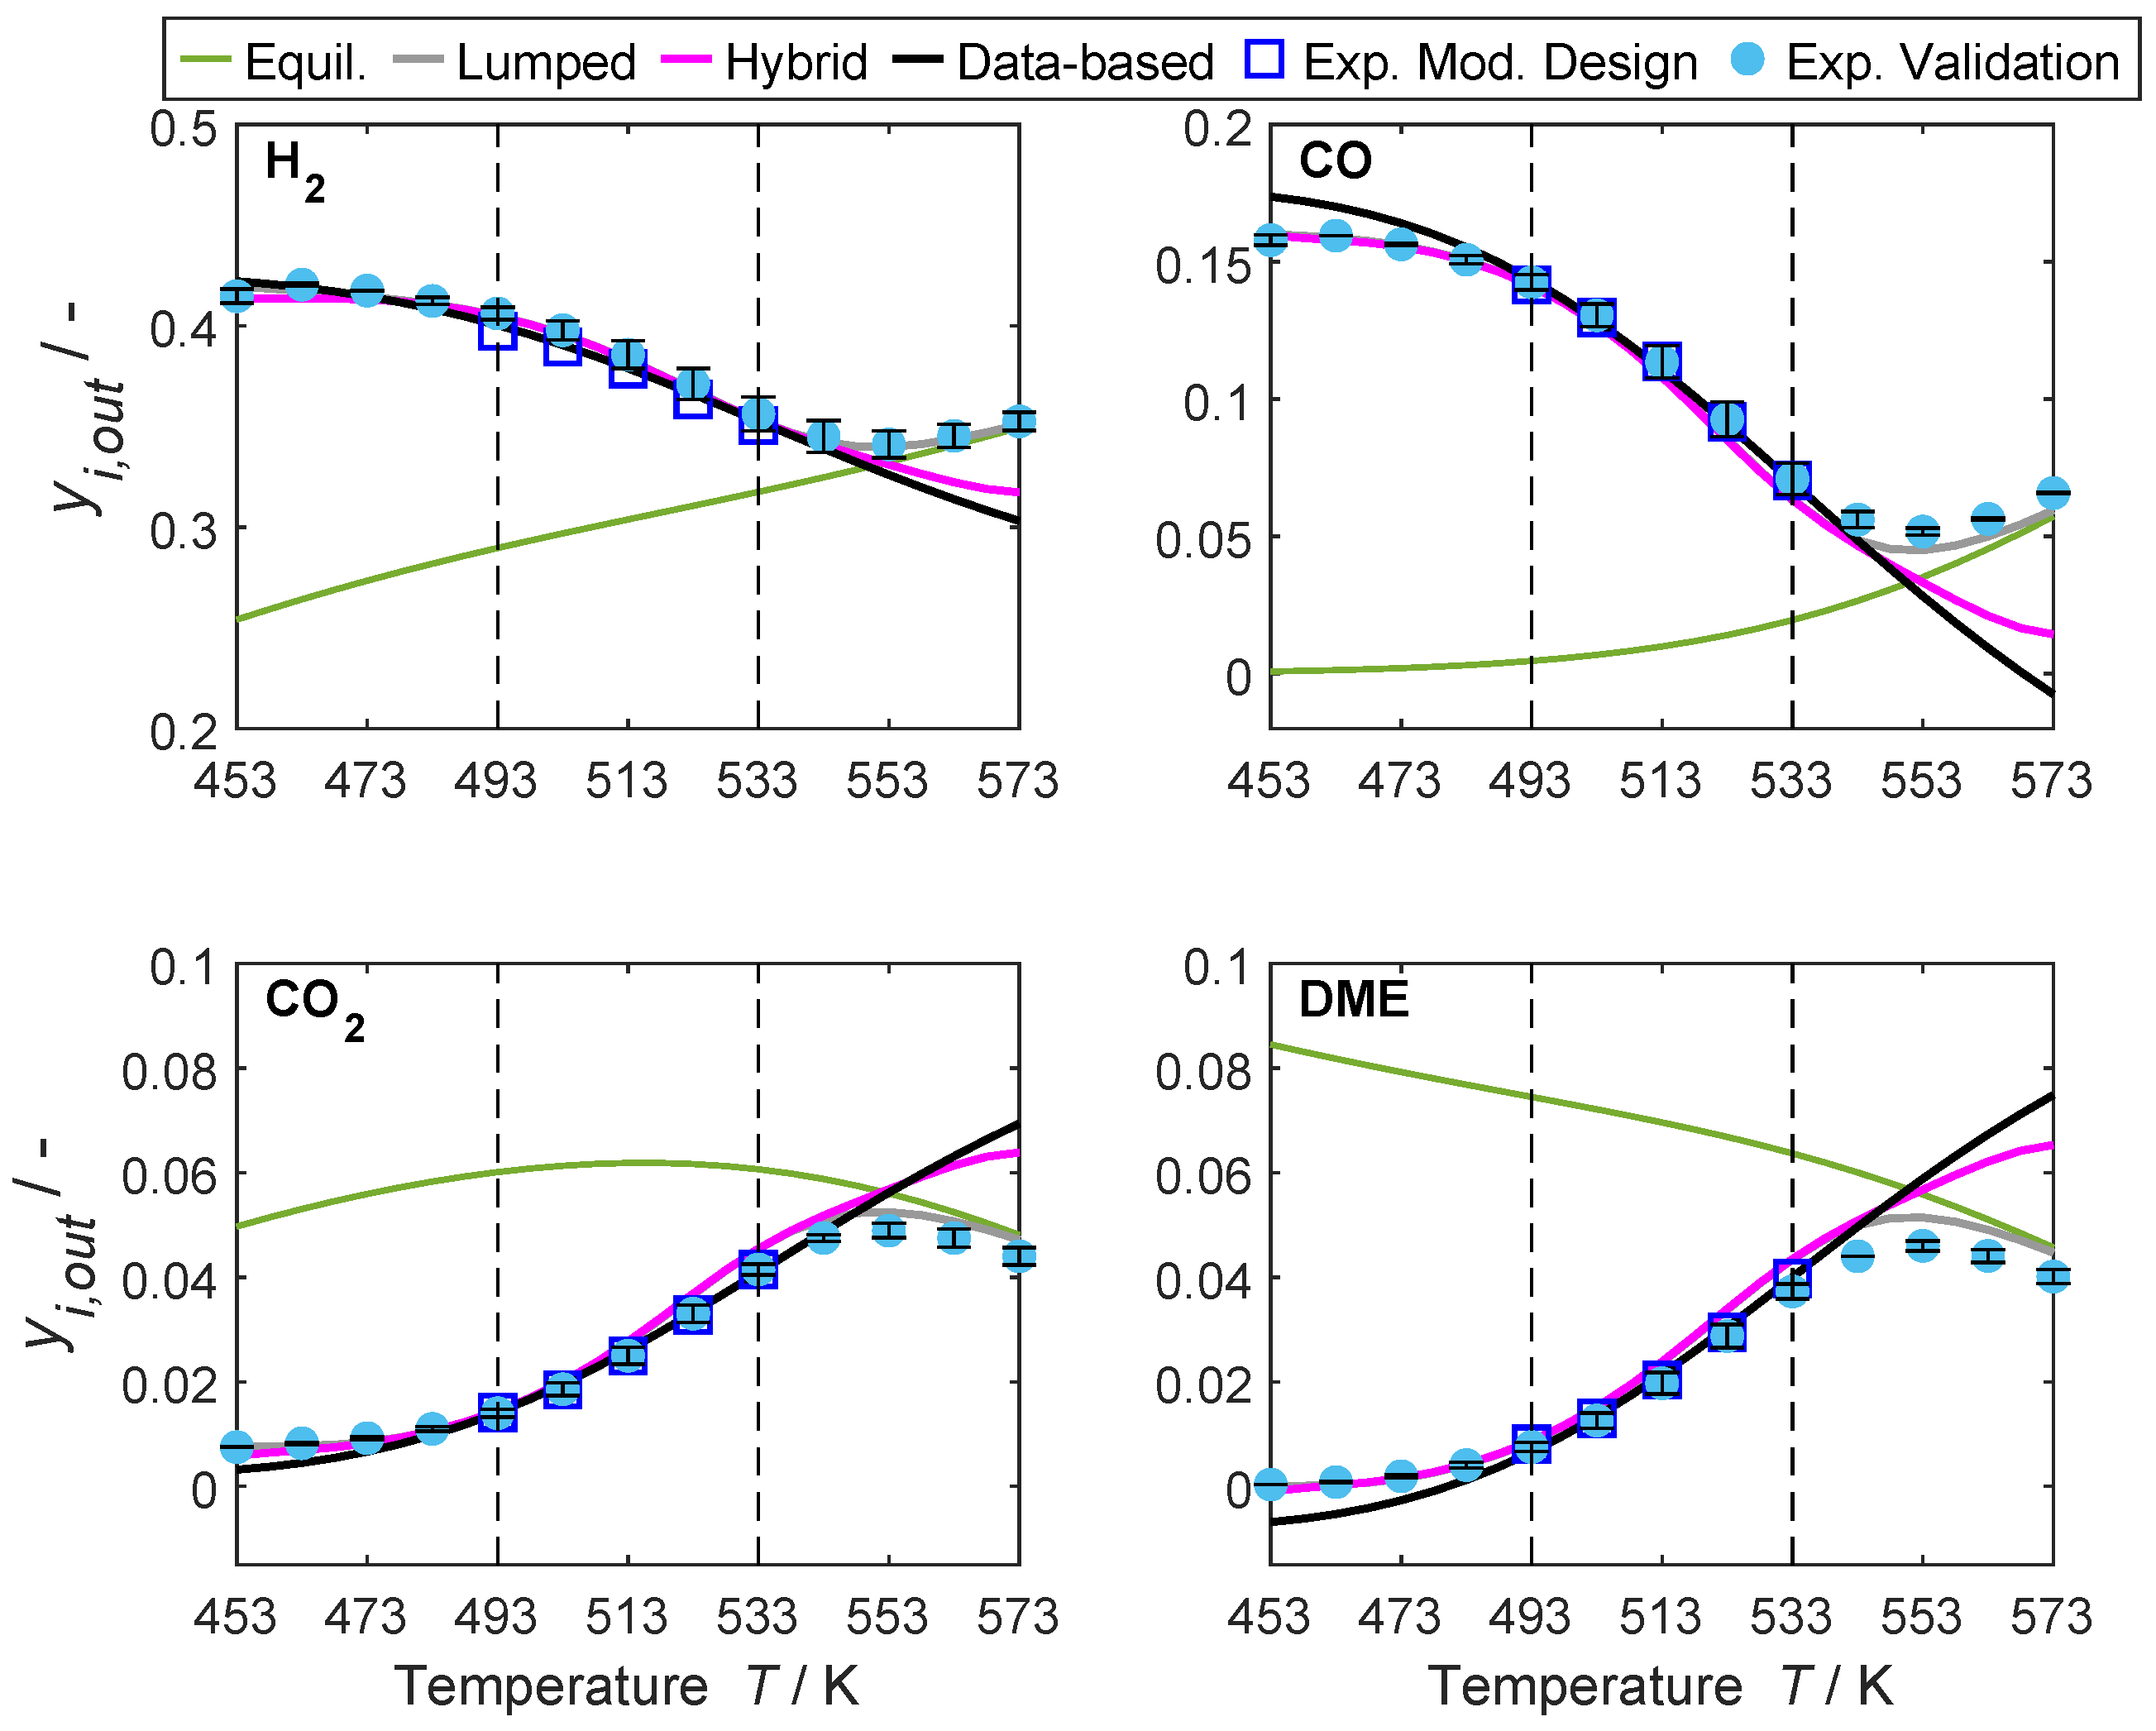
4.3.2. Range Extrapolation

Range extrapolation refers to the evaluation of a variable that was varied during model development, outside the range in which that variation occurred [76]. For the evaluation of this extrapolation case, experiments and simulations with the three models were conducted at temperatures between 453 and 573 K at two different total gas flow rates. Initially, the results at a total gas flow of 0.2 slpm are shown and discussed, followed by results at 0.6 slpm. The hybrid model with ANN-HM with 26 HNs was used here, as it was the only model that delivered good extrapolation ability for the catalyst bed composition. Equivalent results with other architectures of the ANN-HM are given in the Supplementary Material.
Figure 11 shows the predictions of the three models as well as the experiments used for model development (conducted in a previous work [15]) and validation for a total gas flow of 0.2 slpm. Additionally, the molar fractions at equilibrium calculated with the RGbibbs reactor in Aspen Plus are displayed, along with the models’ validity range which is enclosed by the dashed lines.
The experiments for experimental validation were conducted in the same reactor in which the kinetic measurements for model development were performed. Additionally, the same catalyst reduction and conditioning procedure were followed. As a result, the experiments from our previous work [15] could be verified, and the experiments in the temperature range between 493 and 533 K overlap with a low relative deviation of maximal 6.6% (max. mRE between experiments for model development and experiments for validation).
Bellow 493 K, the predictions of the hybrid and the lumped models are virtually identical. The predictions of the data-based model slightly differ, however, the correct and expected tendency is observable. At low temperatures, the rate of the reactions is low and almost no conversion takes place. Hence, the concentration of each species should be equal to the concentration in the feed gas, i.e., 42.3% H2, 16.1% CO, 0.82% CO2 and 0% DME. The hybrid model predicts this behavior correctly and the predictions do not deviate from those of the lumped model, although the model was not explicitly trained in this range. This can be explained by the fact that the phenomena that play a significant role in this temperature range are the same as in the range where the model was trained. The influence of the thermodynamic equilibrium is low compared to that of the reaction kinetics as it can be inferred from the distance to the values in equilibrium. Similarly, a priori criteria confirmed that no mass or heat transport limitations take place (refer to ESI). Hence, it can be concluded that, although the rate of reactions is low, the reaction kinetics control the process performance also in this temperature range and the performance can be described correctly by the hybrid model which was trained to predict this phenomenon. In addition, the hybrid model yields physically reasonable results and the predicted concentrations remain above 0 for all conditions, unlike the predictions of the data-based model, which also assume negative values.
Above 533 K, the predictions of the three models diverge. At increasing temperature levels, the influence of the thermodynamic equilibrium also increases, as the concentrations become closer to those at equilibrium. The rates of reversible exothermic reactions increase initially due to the positive influence of the temperature, but decrease at the proximity of the thermodynamic equilibrium when the back-reaction is favored. At the temperature at which thermodynamics prevails over reaction kinetics, an inflection point occurs, as can be clearly observed in the predictions of the lumped model (gray lines). The concentration of the educts, in this case CO and H2, then rises and that of the products DME and CO2 decreases as the reaction rates decrease. This can be predicted by the lumped model successfully due to the Hougen–Watson formulation of the rate expressions (Equations (9)–(11)), which accounts for the effect of the proximity to the thermodynamic equilibrium on the rates by the means of the equilibrium constants ( K f , j ). The predictions of the data-based model do not show any inflection point and the concentration profiles follow the same trend as in the range of validity. This indicates that the data-based model only reflects the effect of the temperature on the reaction rate, but not the effect of the proximity to the thermodynamic equilibrium. In this temperature range, the hybrid model predictions lie between the predictions of the data-based and the lumped model in all cases. The molar fraction profiles flatten with increasing temperature, but a clear inflection point is not evident in the evaluated range. Unlike the lumped model, the hybrid approach attains knowledge about phenomena affecting the reaction rates only from data. Hence, since most operational points in the training data set were measured at conditions at which reaction kinetics prevail and thermodynamic equilibrium has a negligible effect, the hybrid model does not have enough information about the effects the equilibrium can have on the rates and on the process performance. The measured values at temperatures above 533 K showed that the lumped model exhibits the highest accuracy, especially in terms of the shape of the curve with a clearly visible inflection point.
Equivalent results measured or simulated are shown in Figure 12 for a total gas flow of 0.6 slpm. The residence time for this gas low rate is shorter than at 0.2 slpm, and lower conversions are attained. Therefore, the distance to thermodynamic equilibrium is larger which, according to the discussion above, leads to the observed higher prediction accuracy. At this gas flow rate, the simulations of the three models are very similar in the whole temperature range. A slight difference is noticed at temperatures above 553 K, where the predictions of the data-based model diverge. However, the predictions of the lumped and the hybrid model remain superimposed with a maximal relative deviation of 3% (computed for CO2 at 573 K). This confirms that the reason for the model discrepancy is the influence of the thermodynamic equilibrium which becomes more relevant at higher temperatures, and indicates that the extrapolation limits of data-based and hybrid models do not strictly depend on the evaluated range of conditions, but more on the effects considered by the underlying models.

5. Summary and Conclusions

The first part of this work provides a timely overview of the models available for the direct DME synthesis. It has been shown that most of the available models for the direct DME synthesis are semi-mechanistic, i.e., based on mechanistic assumptions. Since these models are only valid in a limited operational range, special attention was paid to the validity of each of the semi-mechanistic models, which were compared graphically to enable a fast overview of the investigated ranges in each work. Additionally, works where data-based models were used for the direct DME synthesis have been summarized. No hybrid model could be found in the open literature for this system.
The second part of this paper deals with the implementation and evaluation of a hybrid model for the direct DME synthesis, aiming to identify and evaluate specific advantages and disadvantages of hybrid modeling approaches for this system. The developed hybrid model displayed a high level of accuracy and good interpolation ability over the entirety of the validity range. Additionally, it exhibited a low computational burden, e.g., the training of this model was approximately 30 times faster than the parametrization of a lumped model, and simulations compiled almost 4 times faster on the same CPU. These results are broadly consistent with studies in the open literature and confirmed expected outcomes regarding accuracy and computational effort.
As one of the main concerns about hybrid models, the extrapolation ability has been put to test and the predictions of a semi-mechanistic and a data-based model, as well as experiments, have been used for the evaluation of the hybrid model performance. Based on exemplary variables (pressure, catalyst bed composition and temperature), it has been shown that dimension extrapolation, i.e., extrapolation of a variable that was kept constant during model development, was not possible when this variable directly affects the data-based module of the hybrid model. For example, simulations and experiments show that the effect of the pressure on the reaction rates could not be considered by the ANN, which was trained at one pressure level only. In contrast, a good extrapolation ability in a broad range was achieved when the extrapolated variable was in the knowledge-module of the hybrid model. As an example, it is shown that the extrapolation of the CZA-to- γ -Al2O3 weight ratio was possible and delivered qualitatively accurate results in the broad range between ratios of zero to five, although all experiments used for model development were conducted with a ratio of one. A suitable ANN architecture proved to be essential for the accuracy of predictions at extrapolated conditions. Range extrapolation, i.e., the evaluation of a variable outside the range where it was screened during model development, was possible, although in a limited range. It could be concluded that the limit for extrapolation is defined by the phenomena the underlying models can map, which depends strongly on the network architecture, instead of the range defined by conditions evaluated experimentally during model development.
Since there is currently no theoretical framework for network selection, and broadly used rules of thumbs failed to deliver a suitable network in our study, the best network was chosen manually based on simulations results. Clearly, this represents a major drawback when a large number of network architectures must be tested, which limits the transferability of the presented results. Based on the gained insights, we conclude that the hybrid modeling approach could be best applied when large data sets in wide operational windows are available, and the input–output relationships between the data are not yet fully understood. This way, the advantages of the hybrid model (i.e., high accuracy and low computation effort) could be exploited to fill knowledge gaps, while avoiding extrapolation. Specifically for direct DME synthesis, one application with high potential for immediate use is to expand the model scope using the numerous lumped kinetic models available in the literature. These are valid in different operating windows and can be used to generate reaction kinetics data, analogous to the procedure followed in this work. After the training of ANNs with these data and integration of these ANNs in the hybrid model structure, the expected outcome is a model that enables cross-evaluation of multiple process variables such as different catalysts, reactor types and reaction conditions throughout nearly the entire relevant operating window.

Supplementary Materials

The following are available online at https://www.mdpi.com/article/10.3390/catal12030347/s1, Figure S1: Schematic representation of the ANN-HM. Figure S2: Surface response for the hybrid model predictions of the mole fractions of H 2 , CO, CO 2 and DME within the validity range of the temperature and total gas flow. Feed composition: 48.0% H 2 , 16.11% CO, 2.88% CO 2 . Pressure 50 bar. CZA-to- γ -Al 2 O 2 -ratio μ = 1. ANN-HM with 26 HNs. Figure S3: Surface response for the hybrid model predictions of the mole fractions of H 2 , CO, CO 2 and DME within the validity range of the temperature and total gas flow. Feed composition: 13.05% H 2 , 4.10% CO, 0.86% CO 2 . Pressure 50 bar. CZA-to- γ -Al 2 O 2 -ratio μ = 1. ANN-HM with 26 HNs. Figure S4: Range extrapolation of the temperature. Nominal feed composition: 42.3% H 2 , 16.1% CO, 0.82% CO 2 . Total gas flow 0.2 slpm. Pressure 50 bar. CZA-to- γ -Al 2 O 3 -ratio μ = 1. ANN-HM with 5 HNs. Figure S5: Range extrapolation of the temperature. Nominal feed composition: 42.3% H 2 , 16.1% CO, 0.82% CO 2 . Total gas flow 0.6 slpm. Pressure 50 bar. CZA-to- γ -Al 2 O 3 -ratio μ = 1. ANN-HM with 5 HNs. Figure S6: Range extrapolation of the temperature. Nominal feed composition: 42.3% H 2 , 16.1% CO, 0.82% CO 2 . Total gas flow 0.2 slpm. Pressure 50 bar. CZA-to- γ -Al 2 O 3 -ratio μ = 1. ANN-HM with 28 HNs. Figure S7: Range extrapolation of the temperature. Nominal feed composition: 42.3% H 2 , 16.1% CO, 0.82% CO 2 . Total gas flow 0.6 slpm. Pressure 50 bar. CZA-to- γ -Al 2 O 3 -ratio μ = 1. ANN-HM with 28 HNs. Figure S8: COx-conversion ( X CO x ) as a function of the Time-On-Stream (ToS) for a reference operating point measured at 513 K, 50 bar and 7599.5 h 1 and a feed of 38.2% H 2 , 15.2% CO, 1.0% CO 2 , 45.7% N2. Table S1: Model specific parameters of the ANN-HM with 5 HNs. Connection weights of the input and hidden layer, biases of the hidden layer. Table S2: Model specific parameters of the ANN-HM with 5 HNs. Connection weights of the hidden and output layer, biases of the output layer. Table S3: Model specific parameters of the chosen ANN-HM with 26 HNs. Connection weights of the input and hidden layer, biases of the hidden layer. Table S4: Model specific parameters of the chosen ANN-HM with 26 HNs. Connection weights of the hidden and output layer, biases of the output layer. Table S5: Model specific parameters of the ANN-HM with 28 HNs. Connection weights of the input and hidden layer, biases of the hidden layer. Table S6: Model specific parameters of the ANN-HM with 28 HNs. Connection weights of the hidden and output layer, biases of the output layer. Table S7: Calculated a priori criteria for determination of transport limitations (Reference [77] are cited in Table S7). Table S8: Experimental values measured for validation of simulation results at extrapolated conditions. The catalyst bed consisted of 1.007 g CZA, 0.9996 g γ -Al 2 O 3 , 9.98 g SiC, and it was 7.8 cm long.

Author Contributions

Conceptualization, N.D.O., K.H.D. and J.S.; methodology, N.D.O.; software, N.D.O.; validation, N.D.O., P.G.B. and K.H.D.; formal analysis, N.D.O. and P.G.B.; investigation, N.D.O. and P.G.B.; resources, K.H.D., S.P. and J.S.; data curation, N.D.O. and P.G.B.; writing—original draft preparation, N.D.O.; writing—review and editing, N.D.O., P.G.B., K.H.D., S.P. and J.S.; visualization, N.D.O. and P.G.B.; supervision, K.H.D., S.P. and J.S.; project administration, K.H.D., S.P. and J.S.; funding acquisition, K.H.D., S.P. and J.S. All authors have read and agreed to the published version of the manuscript.

Funding

This research was funded by Helmholtz Association (Research Program “Storage and Cross-linked Infrastructures”, Topic “Synthetic Hydrocarbons”).

Institutional Review Board Statement

Not applicable.

Informed Consent Statement

Not applicable.

Data Availability Statement

Not applicable.

Acknowledgments

The authors would like to thank Siegbert Johnsen for the technical support, Linus Janning for valuable discussions and support, and Katharina Stoll for proofreading the manuscript.

Conflicts of Interest

The authors declare no conflict of interest. The funders had no role in the design of the study; in the collection, analyses, or interpretation of data; in the writing of the manuscript, or in the decision to publish the results.

References

  1. Dahmen, N.; Arnold, U.; Djordjevic, N.; Henrich, T.; Kolb, T.; Leibold, H.; Sauer, J. High pressure in synthetic fuels production. J. Supercrit. Fluids 2015, 96, 124–132. [Google Scholar] [CrossRef]
  2. Niethammer, B.; Wodarz, S.; Betz, M.; Haltenort, P.; Oestreich, D.; Hackbarth, K.; Arnold, U.; Otto, T.; Sauer, J. Alternative Liquid Fuels from Renewable Resources. Chem. Ing. Tech. 2018, 90, 99–112. [Google Scholar] [CrossRef] [Green Version]
  3. Semelsberger, T.A.; Borup, R.L.; Greene, H.L. Dimethyl ether (DME) as an alternative fuel. J. Power Sources 2006, 156, 497–511. [Google Scholar] [CrossRef]
  4. Azizi, Z.; Rezaeimanesh, M.; Tohidian, T.; Rahimpour, M.R. Dimethyl ether: A review of technologies and production challenges. Chem. Eng. Process. Process Intensif. 2014, 82, 150–172. [Google Scholar] [CrossRef]
  5. Zhu, Y.; Wang, S.; Ge, X.; Liu, Q.; Luo, Z.; Cen, K. Experimental study of improved two step synthesis for DME production. Fuel Process. Technol. 2010, 91, 424–429. [Google Scholar] [CrossRef]
  6. Polierer, S.; Guse, D.; Wild, S.; Herrera Delgado, K.; Otto, T.N.; Zevaco, T.A.; Kind, M.; Sauer, J.; Studt, F.; Pitter, S. Enhanced Direct Dimethyl Ether Synthesis from CO2-Rich Syngas with Cu/ZnO/ZrO2 Catalysts Prepared by Continuous Co-Precipitation. Catalysts 2020, 10, 816. [Google Scholar] [CrossRef]
  7. Joint News Release: BASF and Lutianhua Plan to Pilot a New Production Process that Significantly Reduces CO2 Emissions. 2019. Available online: https://www.basf.com/global/en/media/news-releases/2019/06/p-19-249.html (accessed on 1 April 2021).
  8. Wang, Z.; He, T.; Li, J.; Wu, J.; Qin, J.; Liu, G.; Han, D.; Zi, Z.; Li, Z.; Wu, J. Design and operation of a pilot plant for biomass to liquid fuels by integrating gasification, DME synthesis and DME to gasoline. Fuel 2016, 186, 587–596. [Google Scholar] [CrossRef]
  9. Park, J.; Kim, H.S.; Lee, W.B.; Park, M.J. Trends and Outlook of Computational Chemistry and Microkinetic Modeling for Catalytic Synthesis of Methanol and DME. Catalysts 2020, 10, 655. [Google Scholar] [CrossRef]
  10. Grunwaldt, J.D.; Molenbroek, A.M.; Topsøe, N.Y.; Topsøe, H.; Clausen, B.S. In situ investigations of structural changes in Cu/ZnO catalysts. J. Catal. 2000, 194, 452–460. [Google Scholar] [CrossRef]
  11. Gaikwad, R.; Reymond, H.; Phongprueksathat, N.; Rudolf von Rohr, P.; Urakawa, A. From CO or CO2?: Space-resolved insights into high-pressure CO2 hydrogenation to methanol over Cu/ZnO/Al2O3. Catal. Sci. Technol. 2020, 10, 2763–2768. [Google Scholar] [CrossRef] [Green Version]
  12. Martin, O.; Mondelli, C.; Cervellino, A.; Ferri, D.; Curulla-Ferré, D.; Pérez-Ramírez, J. Operando Synchrotron X-ray Powder Diffraction and Modulated-Excitation Infrared Spectroscopy Elucidate the CO2 Promotion on a Commercial Methanol Synthesis Catalyst. Angew. Chem. Int. Ed. 2016, 55, 11031–11036. [Google Scholar] [CrossRef] [PubMed]
  13. Miletto, I.; Catizzone, E.; Bonura, G.; Ivaldi, C.; Migliori, M.; Gianotti, E.; Marchese, L.; Frusteri, F.; Giordano, G. In situ FT-IR characterization of CuZnZr/ferrierite hybrid catalysts for one-pot CO2-to-DME conversion. Materials 2018, 11, 2275. [Google Scholar] [CrossRef] [PubMed] [Green Version]
  14. Chen, W.H.; Hsu, C.L.; Wang, X.D. Thermodynamic approach and comparison of two-step and single step DME (dimethyl ether) syntheses with carbon dioxide utilization. Energy 2016, 109, 326–340. [Google Scholar] [CrossRef]
  15. Delgado Otalvaro, N.; Kaiser, M.; Herrera Delgado, K.; Wild, S.; Sauer, J.; Freund, H. Optimization of the direct synthesis of dimethyl ether from CO2 rich synthesis gas: Closing the loop between experimental investigations and model-based reactor design. React. Chem. Eng. 2020, 5, 949–960. [Google Scholar] [CrossRef] [Green Version]
  16. Peláez, R.; Marín, P.; Ordóñez, S. Direct synthesis of dimethyl ether from syngas over mechanical mixtures of CuO/ZnO/Al2O3 and Γ-Al2O3: Process optimization and kinetic modelling. Fuel Process. Technol. 2017, 168, 40–49. [Google Scholar] [CrossRef] [Green Version]
  17. Delgado Otalvaro, N.; Sogne, G.; Herrera Delgado, K.; Wild, S.; Pitter, S.; Sauer, J. Kinetics of the direct DME synthesis from CO2 rich syngas under variation of the CZA-to-γ-Al2O3 ratio of a mixed catalyst bed. RSC Adv. 2021, 11, 24556–24569. [Google Scholar] [CrossRef]
  18. Ereña, J.; Sierra, I.; Aguayo, A.T.; Ateka, A.; Olazar, M.; Bilbao, J. Kinetic modelling of dimethyl ether synthesis from (H2+CO2) by considering catalyst deactivation. Chem. Eng. J. 2011, 174, 660–667. [Google Scholar] [CrossRef]
  19. Cheng, C.; Zhang, H.; Ying, W.; Fang, D. Intrinsic kinetics of one-step dimethyl ether synthesis from hydrogen-rich synthesis gas over bi-functional catalyst. Korean J. Chem. Eng. 2011, 28, 1511–1517. [Google Scholar] [CrossRef]
  20. Sierra, I.; Ereña, J.; Aguayo, A.T.; Olazar, M.; Bilbao, J. Deactivation kinetics for direct dimethyl ether synthesis on a CuO-ZnO-Al2O3/γ-Al2O3 Catalyst. Ind. Eng. Chem. Res. 2010, 49, 481–489. [Google Scholar] [CrossRef]
  21. Pyatnitskii, Y.I.; Strizhak, P.E.; Lunev, N.K. Kinetic modeling for the conversion of synthesis gas to dimethyl ether on a mixed Cu-ZnO-Al2O3 catalyst with γ-Al2O3. Theor. Exp. Chem. 2009, 45, 325–330. [Google Scholar] [CrossRef]
  22. Renk, C.P. Die Einstufige Dimethylether-Synthese aus Synthesegas: Experimentelle und Theoretische Betrachtungen zur Einstufigen DME-Synthese mit Synthesegas aus der Flugstrom-Druckvergasung von Biomasse. Ph.D. Thesis. 2009. Available online: https://publikationen.bibliothek.kit.edu/1000012461/3815570 (accessed on 31 October 2009).
  23. Hadipour, A.; Sohrabi, M. Synthesis of some bifunctional catalysts and determination of kinetic parameters for direct conversion of syngas to dimethyl ether. Chem. Eng. J. 2008, 137, 294–301. [Google Scholar] [CrossRef]
  24. Aguayo, A.T.; Ereña, J.; Mier, D.; Arandes, J.M.; Olazar, M.; Bilbao, J. Kinetic Modeling of Dimethyl Ether Synthesis in a Single Step on a CuO/ZnO/Al2O3/Γ-Al2O3 Catalyst. Ind. Eng. Chem. Res. 2007, 46, 5522–5530. [Google Scholar] [CrossRef]
  25. Nie, Z.; Liu, H.; Liu, D.; Ying, W.; Fang, D. Intrinsic kinetics of dimethyl ether synthesis from syngas. J. Nat. Gas Chem. 2005, 14, 22–28. [Google Scholar] [CrossRef]
  26. Ng, K.L.; Chadwick, D.; Toseland, B.A. Kinetics and modelling of dimethyl ether synthesis from synthesis gas. Chem. Eng. Sci. 1999, 54, 3587–3592. [Google Scholar] [CrossRef]
  27. Strieth-Kalthoff, F.; Sandfort, F.; Segler, M.H.S.; Glorius, F. Machine learning the ropes: Principles, applications and directions in synthetic chemistry. Chem. Soc. Rev. 2020, 49, 6154–6168. [Google Scholar] [CrossRef]
  28. Jha, S.K.; Bilalovic, J.; Jha, A.; Patel, N.; Zhang, H. Renewable energy: Present research and future scope of Artificial Intelligence. Renew. Sustain. Energy Rev. 2017, 77, 297–317. [Google Scholar] [CrossRef]
  29. Li, H.; Zhang, Z.; Liu, Z. Application of Artificial Neural Networks for Catalysis: A Review. Catalysts 2017, 7, 306. [Google Scholar] [CrossRef]
  30. Goncalves, V.; Maria, K.; da Silv, A.B.F. Applications of Artificial Neural Networks in Chemical Problems. In Artificial Neural Networks—Architectures and Applications; Suzuki, K., Ed.; InTech: London, UK, 2013; Chapter 10; pp. 203–223. [Google Scholar] [CrossRef] [Green Version]
  31. Basheer, I.; Hajmeer, M. Artificial neural networks: Fundamentals, computing, design, and application. J. Microbiol. Methods 2000, 43, 3–31. [Google Scholar] [CrossRef]
  32. Zendehboudi, S.; Rezaei, N.; Lohi, A. Applications of hybrid models in chemical, petroleum, and energy systems: A systematic review. Appl. Energy 2018, 228, 2539–2566. [Google Scholar] [CrossRef]
  33. Sansana, J.; Joswiak, M.N.; Castillo, I.; Wang, Z.; Rendall, R.; Chiang, L.H.; Reis, M.S. Recent trends on hybrid modeling for Industry 4.0. Comput. Chem. Eng. 2021, 151, 107365. [Google Scholar] [CrossRef]
  34. Hein, J.E. Machine learning made easy for optimizing chemical reactions. Nature 2021, 590, 40–41. [Google Scholar] [CrossRef] [PubMed]
  35. von Stosch, M.; Oliveira, R.; Peres, J.; Feyo de Azevedo, S. Hybrid semi-parametric modeling in process systems engineering: Past, present and future. Comput. Chem. Eng. 2014, 60, 86–101. [Google Scholar] [CrossRef] [Green Version]
  36. McBride, K.; Sundmacher, K. Overview of Surrogate Modeling in Chemical Process Engineering. Chem. Ing. Tech. 2019, 91, 228–239. [Google Scholar] [CrossRef] [Green Version]
  37. Chen, L.; Hontoir, Y.; Huang, D.; Zhang, J.; Morris, A. Combining first principles with black-box techniques for reaction systems. Control Eng. Pract. 2004, 12, 819–826. [Google Scholar] [CrossRef]
  38. Mondal, U.; Yadav, G.D. Perspective of dimethyl ether as fuel: Part I. Catalysis. J. CO2 Util. 2019, 32, 299–320. [Google Scholar] [CrossRef]
  39. Behr, A.; Agar, D.W.; Jörissen, J.; Vorholt, A.J. Einführung in Die Technische Chemie, 2nd ed.; Springer: Berlin, Germany, 2016. [Google Scholar]
  40. Aguayo, A.T.; Ereña, J.; Sierra, I.; Olazar, M.; Bilbao, J. Deactivation and regeneration of hybrid catalysts in the single-step synthesis of dimethyl ether from syngas and CO2. Catal. Today 2005, 106, 265–270. [Google Scholar] [CrossRef]
  41. Ateka, A.; Pérez-Uriarte, P.; Gamero, M.; Ereña, J.; Aguayo, A.T.; Bilbao, J. A comparative thermodynamic study on the CO2 conversion in the synthesis of methanol and of DME. Energy 2017, 120, 796–804. [Google Scholar] [CrossRef]
  42. Luu, M.T.; Milani, D.; Wake, M.; Abbas, A. Analysis of di-methyl ether production routes: Process performance evaluations at various syngas compositions. Chem. Eng. Sci. 2016, 149, 143–155. [Google Scholar] [CrossRef]
  43. Catizzone, E.; Bonura, G.; Migliori, M.; Frusteri, F.; Giordano, G. CO2 Recycling to Dimethyl Ether: State-of-the-Art and Perspectives. Molecules 2017, 23, 31. [Google Scholar] [CrossRef] [Green Version]
  44. Nestler, F.; Krüger, M.; Full, J.; Hadrich, M.J.; White, R.J.; Schaadt, A. Methanol Synthesis—Industrial Challenges within a Changing Raw Material Landscape. Chem. Ing. Tech. 2018, 90, 1409–1418. [Google Scholar] [CrossRef]
  45. Centi, G.; Perathoner, S. Opportunities and prospects in the chemical recycling of carbon dioxide to fuels. Catal. Today 2009, 148, 191–205. [Google Scholar] [CrossRef]
  46. Dalena, F.; Senatore, A.; Marino, A.; Gordano, A.; Basile, M.; Basile, A. Methanol Production and Applications: An Overview. In Methanol; Elsevier: Amsterdam, The Netherlands, 2018; pp. 3–28. [Google Scholar] [CrossRef]
  47. Mohd Ali, J.; Hussain, M.A.; Tade, M.O.; Zhang, J. Artificial Intelligence techniques applied as estimator in chemical process systems—A literature survey. Expert Syst. Appl. 2015, 42, 5915–5931. [Google Scholar] [CrossRef]
  48. Panerati, J.; Schnellmann, M.A.; Patience, C.; Beltrame, G.; Patience, G.S. Experimental methods in chemical engineering: Artificial neural networks—ANNs. Can. J. Chem. Eng. 2019, 97, 2372–2382. [Google Scholar] [CrossRef]
  49. Cybenko, G. Mathematics of Control, Signals, and Systems Approximation by Superpositions of a Sigmoidal Function. Math. Control Signals Syst. 1989, 2, 303–314. [Google Scholar] [CrossRef]
  50. Hornik, K.; Stinchconbe, M.; White, H. Multilayer Feedforward Networks are Universal Approximators. Neural Netw. 1989, 2, 359–366. [Google Scholar] [CrossRef]
  51. Delgado Otalvaro, N.; Bilir, P.G.; Herrera Delgado, K.; Pitter, S.; Sauer, J. Modeling the Direct Synthesis of Dimethyl Ether using Artificial Neural Networks. Chem. Ing. Tech. 2021, 93, 754–761. [Google Scholar] [CrossRef]
  52. Moradi, G.R.; Parvizian, F. An expert model for estimation of the performance of direct dimethyl ether synthesis from synthesis gas. Can. J. Chem. Eng. 2011, 89, 1266–1273. [Google Scholar] [CrossRef]
  53. Alamolhoda, S.; Kazemeini, M.; Zaherian, A.; Zakerinasab, M.R. Reaction kinetics determination and neural networks modeling of methanol dehydration over nano γ-Al2O3 catalyst. J. Ind. Eng. Chem. 2012, 18, 2059–2068. [Google Scholar] [CrossRef]
  54. Blanco, M.; Coello, J.; Iturriaga, H.; Maspoch, S.; Redón, M. Artificial Neural Networks for Multicomponent Kinetic Determinations. Anal. Chem. 1995, 67, 4477–4483. [Google Scholar] [CrossRef]
  55. Omata, K.; Ozaki, T.; Umegaki, T.; Watanabe, Y.; Nukui, N.; Yamada, M. Optimization of the temperature profile of a temperature gradient reactor for DME synthesis using a simple genetic algorithm assisted by a neural network. Energy Fuels 2003, 17, 836–841. [Google Scholar] [CrossRef]
  56. Omata, K.; Hashimoto, M.; Sutarto; Yamada, M. Artificial neural network and grid search aided optimization of temperature profile of temperature gradient reactor for dimethyl ether synthesis from syngas. Ind. Eng. Chem. Res. 2009, 48, 844–849. [Google Scholar] [CrossRef]
  57. Omata, K.; Sutarto; Hashimoto, M.; Ishiguro, G.; Watanabe, Y.; Umegaki, T.; Yamada, M. Design and development of Cu-Zn oxide catalyst for direct dimethyl ether synthesis using an artificial neural network and physicochemical properties of elements. Ind. Eng. Chem. Res. 2006, 45, 4905–4910. [Google Scholar] [CrossRef]
  58. Svitnic, T.; Do, N.T.Q.; Schuhmann, T.; Renner, T.; Haag, S.; Örs, E. Data-driven approach for predicitive modeling of by-product formation in methanol synthesis. In Proceedings of the 30th European Symposium on Computer Aided Process Engineering, Milan, Italy, 24–27 May 2020; pp. 505–510. [Google Scholar] [CrossRef]
  59. Valeh-E-Sheyda, P.; Yaripour, F.; Moradi, G.; Saber, M. Application of artificial neural networks for estimation of the reaction rate in methanol dehydration. Ind. Eng. Chem. Res. 2010, 49, 4620–4626. [Google Scholar] [CrossRef]
  60. Ye, J. Artificial neural network modeling of methanol production from syngas. Pet. Sci. Technol. 2019, 37, 629–632. [Google Scholar] [CrossRef]
  61. Din, I.U.; Shaharun, M.S.; Naeem, A.; Alotaibi, M.A.; Alharthi, A.I.; Nasir, Q. CO2 Conversion to Methanol over Novel Carbon Nanofiber-Based Cu/ZrO2 Catalysts—A Kinetics Study. Catalysts 2020, 10, 567. [Google Scholar] [CrossRef]
  62. Zahedi, G.; Elkamel, A.; Lohi, A.; Jahanmiri, A.; Rahimpor, M.R. Hybrid artificial neural network—First principle model formulation for the unsteady state simulation and analysis of a packed bed reactor for CO2 hydrogenation to methanol. Chem. Eng. J. 2005, 115, 113–120. [Google Scholar] [CrossRef]
  63. Potočnik, P.; Grabec, I.; Šetinc, M.; Levec, J. Neural net based hybrid modeling of the methanol synthesis process. Neural Process. Lett. 2000, 11, 219–228. [Google Scholar] [CrossRef]
  64. Alavi, M.; Jazayeri-Rad, H.; Behbahani, R.M. Optimizing the Feed Conditions in a Dimethyl Ether Production Process To Maximize Methanol Conversion Using a Hybrid First Principle Neural Network Approach. Chem. Eng. Commun. 2014, 201, 650–673. [Google Scholar] [CrossRef]
  65. Peng, D.Y.; Robinson, D.B. A new two-constant equation of state. Ind. Eng. Chem. Fundam. 1976, 15, 59–64. [Google Scholar] [CrossRef]
  66. Lu, W.Z.; Teng, L.H.; Xiao, W.D. Simulation and experiment study of dimethyl ether synthesis from syngas in a fluidized-bed reactor. Chem. Eng. Sci. 2004, 59, 5455–5464. [Google Scholar] [CrossRef]
  67. Hameed, A.A.; Karlik, B.; Salman, M.S. Back-propagation algorithm with variable adaptive momentum. Knowl.-Based Syst. 2016, 114, 79–87. [Google Scholar] [CrossRef]
  68. MacKay, D.J.C. Bayesian Interpolation. Neural Comput. 1992, 4, 415–447. [Google Scholar] [CrossRef]
  69. Okut, H. Bayesian Regularized Neural Networks for Small n Big p Data. In Artificial Neural Networks—Models and Applications; InTech: London, UK, 2016; Chapter 2. [Google Scholar] [CrossRef] [Green Version]
  70. Burden, F.; Winkler, D. Bayesian Regularization of Neural Networks. Methods Mol. Biol. 2009, 458, 23–42. [Google Scholar] [CrossRef]
  71. Kalogirou, S.A.; Bojic, M. Artificial neural networks for the prediction of the energy consumption of a passive solar building. Energy 2000, 25, 479–491. [Google Scholar] [CrossRef]
  72. Lachtermacher, G.; Fuller, J.D. Back propagation in time-series forecasting. J. Forecast. 1995, 14, 381–393. [Google Scholar] [CrossRef]
  73. Jadid, M.N.; Fairbairn, D.R. Neural-network applications in predicting moment-curvature parameters from experimental data. Eng. Appl. Artif. Intell. 1996, 9, 309–319. [Google Scholar] [CrossRef]
  74. Amato, F.; González-Hernández, J.L.; Havel, J. Artificial neural networks combined with experimental design: A “soft” approach for chemical kinetics. Talanta 2012, 93, 72–78. [Google Scholar] [CrossRef]
  75. Zahedi, G.; Lohi, A.; Mahdi, K. Hybrid modeling of ethylene to ethylene oxide heterogeneous reactor. Fuel Process. Technol. 2011, 92, 1725–1732. [Google Scholar] [CrossRef]
  76. Van Can, H.J.L.; Te Braake, H.A.B.; Dubbelman, S.; Hellinga, C.; Luyben, K.C.A.M.; Heijnen, J.J. Understanding and applying the extrapolation properties of serial gray-box models. AIChE J. 1998, 44, 1071–1089. [Google Scholar] [CrossRef]
  77. Pérez-Ramírez, J.; Berger, R.J.; Mul, G.; Kapteijn, F.; Moulijn, J.A. Six-flow reactor technology a review on fast catalyst screening and kinetic studies. Catal. Today 2000, 60, 93–109. [Google Scholar] [CrossRef]
Figure 1. Overview of lumped models’ validity ranges regarding (a) temperature (b) pressure (c) CZA-to- γ -Al2O3 weight ratio μ (d) carbon oxide ratio COR and (e) stoichiometric number SN. Models [15,16,17,18,19,20,21,22,23,24,25,26] named after first author and year of publication.
Catalysts 12 00347 g001
Figure 2. Schematic representation of the lumped, hybrid and data-based models relevant for this work.
Catalysts 12 00347 g002
Figure 3. Representation of the data-based model. Adapted from N. Delgado Otalvaro et al. [51].
Catalysts 12 00347 g003
Figure 4. Data division scheme and training strategy. Taken from N. Delgado Otalvaro et al. [51].
Catalysts 12 00347 g004
Figure 5. Schematic representation of ANN’s architecture for the hybrid model (ANN-HM).
Catalysts 12 00347 g005
Figure 6. Schematic representation of the axial domain discretization, exemplary for 10 uniformly distributed elements.
Catalysts 12 00347 g006
Figure 7. Training results for different architectures of the ANN-HM. (a) Mean squared error (MSE) and training time (b) mean relative error (mRE) on training and testing data sets.
Catalysts 12 00347 g007
Figure 8. Surface response for the hybrid model predictions of the mole fractions of H2, CO, CO2, and DME within the validity range of the temperature and total gas flow. The black points represent the conditions at which the data for model development were measured. Feed composition: 42.33% H2, 16.14% CO, 0.82% CO2. Pressure 50 bar. CZA-to- γ -Al2O3-ratio μ = 1. ANN-HM with 26 HNs.
Catalysts 12 00347 g008
Figure 9. Experimental validation of dimensional extrapolation of the pressure. Feed composition: 42.3% H2, 16.1% CO, 0.82% CO2. Total gas flow 0.4 slpm. Temperature 533 K. CZA-to- γ -Al2O3-ratio μ = 1. ANN-HM with 26 HNs.
Catalysts 12 00347 g009
Figure 10. Dimension extrapolation of the catalyst bed composition.The plots show (a) the CO x conversion calculated with the lumped model and with the hybrid models consisting of various HN, (b) the CO x conversion at various mesh refinements, (c) the DME yield calculated with the lumped model and hybrid models consisting of various HN as well as (d) the DME yield at different mesh refinements. The results are plotted against μ , ranging from 0 to 5. Feed composition: 48.42% H2, 16.07% CO, 2.81% CO2. Total gas flow 0.2 slpm. Temperature 533 K. Pressure 50 bar.
Catalysts 12 00347 g010
Figure 11. Evaluation of range extrapolation by comparison of models’ predictions and experimental results beyond the models’ validity range for temperature. Feed composition: 42.3% H2, 16.1% CO, 0.82% CO2. Total gas flow 0.2 slpm. Pressure 50 bar. CZA-to- γ -Al2O3-ratio μ = 1. ANN-HM with 26 HNs.
Catalysts 12 00347 g011
Figure 12. Evaluation of range extrapolation by comparison of models’ predictions and experimental results beyond the models’ validity range for temperature. Feed composition: 42.3% H2, 16.1% CO, 0.82% CO2. Total gas flow 0.6 slpm. Pressure 50 bar. CZA-to- γ -Al2O3-ratio μ = 1. ANN-HM with 26 HNs. Predictions of the lumped and hybrid model overlap over the entire temperature range.
Catalysts 12 00347 g012
Table 1. Model-specific parameters for the lumped model [15].
ReactionEquation (13)Equation (14)AdsorbateEquation (15)
ABln( k T R ) E A , n ln( K T R ) Δ H ads , n
13014.402910.3857−6.9421.81CO−15.32−14.03
21143.94940.9925−2.0742.77CO2−0.570
32076.21312.0101−2.7510.82H2−19.51−14.68
Table 2. Conditions for kinetic measurements [15].
Param.ValueUnit
T220, 230, 240, 250, 260°C
V ˙ in 0.2, 0.3, 0.4, 0.5, 0.6, 0.7slpm *
y CO 2 in 0, 1, 3%
y CO , in 4, 8, 15%
y H 2 in y H 2 , in = 2.3   ( y C O in + y CO 2 in ) + y CO 2 in %
* Standard liters per minute, T = 0  C and p = 1.01325 bar.
Table 3. Mean relative errors (mRE) between the experiments and the predictions of the lumped and hybrid model.
ModelmRE y H 2 , out mRE y CO , out mRE y CO 2 , out mRE y DME , out
Lumped1.49%5.49%6.02%28.89%
Hybrid1.49%5.45%6.08%28.36%
Publisher’s Note: MDPI stays neutral with regard to jurisdictional claims in published maps and institutional affiliations.

