Article

Visible-Light Driven Photocatalytic Degradation of 4-Chlorophenol Using Graphitic Carbon Nitride-Based Nanocomposites

1
Department of Civil Engineering, University of Calgary, ENF 262, 2500 University Drive NW, Calgary, AB T2N 1N4, Canada
2
Department of Chemical and Petroleum Engineering, University of Calgary, ENB 202, 2500 University Drive NW, Calgary, AB T2N 1N4, Canada
*
Author to whom correspondence should be addressed.
Catalysts 2022, 12(3), 281; https://doi.org/10.3390/catal12030281
Submission received: 19 January 2022 / Revised: 23 February 2022 / Accepted: 28 February 2022 / Published: 2 March 2022
(This article belongs to the Section Environmental Catalysis)

Abstract

:
4-chlorophenol (4-CP), a hydroxylated aromatic compound (HAC), is a recalcitrant and toxic organic pollutant found in industrial wastewater and various environmental media. In this paper, visible-light-activated photocatalysis using graphitic carbon nitride (GCN) was used to treat 4-CP in an aqueous media. Graphitic carbon nitride from different precursors (dicyanamide, urea, and melamine), as well as GCN/silver nanocomposites (AgBr, Ag3PO4, Ag2CrO4, and Ag), were successfully synthesized and characterized by BET, XRD, SEM, EDS, and UV-Vis DRS. The band gaps of the photocatalysts were estimated using the UV-Vis DRS characterization results and Tauc plots. The evaluation of the efficacy of the GCN-based catalysts in degrading 4-CP was conducted with different photoreactors such as a royal blue light-emitting diode (LED), a UV-A LED, LUZCHEM cool white lamps, and a solar simulator. The results showed that GCNs with royal blue LED can effectively degrade 4-CP from aqueous media. Among the different precursors, urea-derived GCN showed the best performance in degrading 4-CP due to its large surface area. GCN/0.3Ag2CrO4 nanocomposite showed a synergistic effect for the enhanced photocatalytic degradation of 4-CP. The degradation of 4-CP with a rate constant of 2.64 × 10⁻² min−1 was achieved with a GCN/0.3Ag2CrO4 nanocomposite under royal blue LED irradiation.

1. Introduction

4-chlorophenol (4-CP), a hydroxylated aromatic compound (HAC), is a recalcitrant and toxic organic pollutant found in industrial wastewater and various environmental media. It is extensively used as an intermediate in the synthesis of pharmaceuticals, dye, wood preservatives, and agricultural products such as pesticides and herbicides [1,2]. The release of wastewater from the industrial processes using 4-CP as an ingredient has been a major source of water pollution. Not only are chlorophenols found in industrial wastewater, but they can also be formed during the disinfection of municipal water upon chlorination of humic matter or natural carboxylic acid [3]. Physical adsorption and biological degradation have been reported to remove 4-CP in water [4]. However, physical adsorption only transfers 4-CP from the solution to the surface of the adsorbent. Adsorbents can be quickly exhausted when they are used to treat a high concentration of 4-CP. The high cost associated with the disposal and regeneration of exhausted adsorbent limits its use on a large scale [5,6]. The biodegradation of 4-CP usually requires a longer hydraulic retention time and produces a high microbial mass [4]. In addition, biodegradation performance is highly impacted by carbon source, oxygen level, nutrients, and temperature. Photocatalysis can address these limitations due to its high efficiency in the degradation and mineralization of organic pollutants to CO2 and H2O, and it is more eco-friendly as it will not release secondary pollutants into treated water and requires a lesser amount of chemical input [7,8]. Photocatalysis is a process in which a photocatalyst, such as TiO2, is irradiated by photons with a higher energy than its bandgap, leading to the generation of holes and electrons on its surface. Those photogenerated holes and electrons can react with electron donors and acceptors to form reactive oxidative species such as oxygen and hydroxyl radicals, which can degrade the organic contaminants to less harmful by-products [8]. Photocatalysis has been widely used in the degradation of organic pollutants (dyes, phenolic compounds, and hydrocarbons), removal of heavy metals (mercury, arsenic, and cadmium), removal of pharmaceuticals (antibiotics), and inactivation of microorganisms [9]. Conventional photocatalysis has been focused on using titanium dioxide (TiO2), which requires UV irradiation due to its large bandgap (3.2 eV). The high energy cost associated with UV irradiation puts a limitation on its practical application [10].
Over the last decade, visible-light-sensitive graphitic carbon nitride (GCN or g-C3N4), a metal-free photocatalyst, has gained a lot of attention in removing organic contaminants due to its narrow optical band gap (2.7 eV). It is readily synthesized from available precursors (dicyandiamide, urea, and melamine) and has a low cost of production [11,12,13]. GCN derived from different precursors has been successfully reported to remove nitrogen oxide, 4-nitrophenol, methyl orange, and rhodamine B under visible light [14,15,16,17]. The photocatalytic activity of GCNs can be further enhanced by doping with different organic and inorganic compounds to reduce the bandgap, increase visible-light utilization, decrease the recombination rate of e–h pairs, and improve the rate of charge transfer [18,19]. Silver-based inorganics are among the most promising compounds used to improve the properties of GCN because of their photosensitivity and photocatalytic activity. Ren et al. [20] observed that 4-CP degradation by GCN/Ag3PO4 with a xenon lamp was 28 times faster than the method using pristine GCN. Deng et al. [21] enhanced visible-light-driven photocatalytic E. coli disinfection by using GCN/AgBr. A negligible inactivation of E. coli was obtained for pure GCN within one hour, while 6.5 log reduction was achieved with GCN/AgBr. Faisal et al. [22] fabricated GCN/Ag nanoparticles to degrade methylene blue in water under a xenon lamp and found that the degradation rate with GCN/Ag is 1.9 times higher than pure GCN.
This research focuses on the synthesis and characterization of GCN and GCN/silver-based composites and their photocatalytic performance in degrading 4-CP under royal blue LED and other light sources. GCNs were prepared from different precursors, including dicyandiamide (D-GCN), urea (U-GCN), and melamine (M-GCN) through the direct pyrolysis method, while GCN/silver-based composites (U-GCN/Ag, U-GCN/Ag3PO4, U-GCN/AgBr, and U-GCN/Ag2CrO4) were fabricated by a dark-induced/in-situ deposition method. Different characterization techniques including BET, XRD, SEM, EDS, and UV-Vis DRS were used to study the composites’ crystal structure, morphology, and optical and bandgap properties. The impact of GCN precursors, silver compounds, GCN/silver ratio, and light sources on the photocatalytic degradation of 4-CP has been fully investigated. A mechanism of the photocatalytic degradation of 4-CP by GCN/silver-based composites has been proposed.

2. Results and Discussions

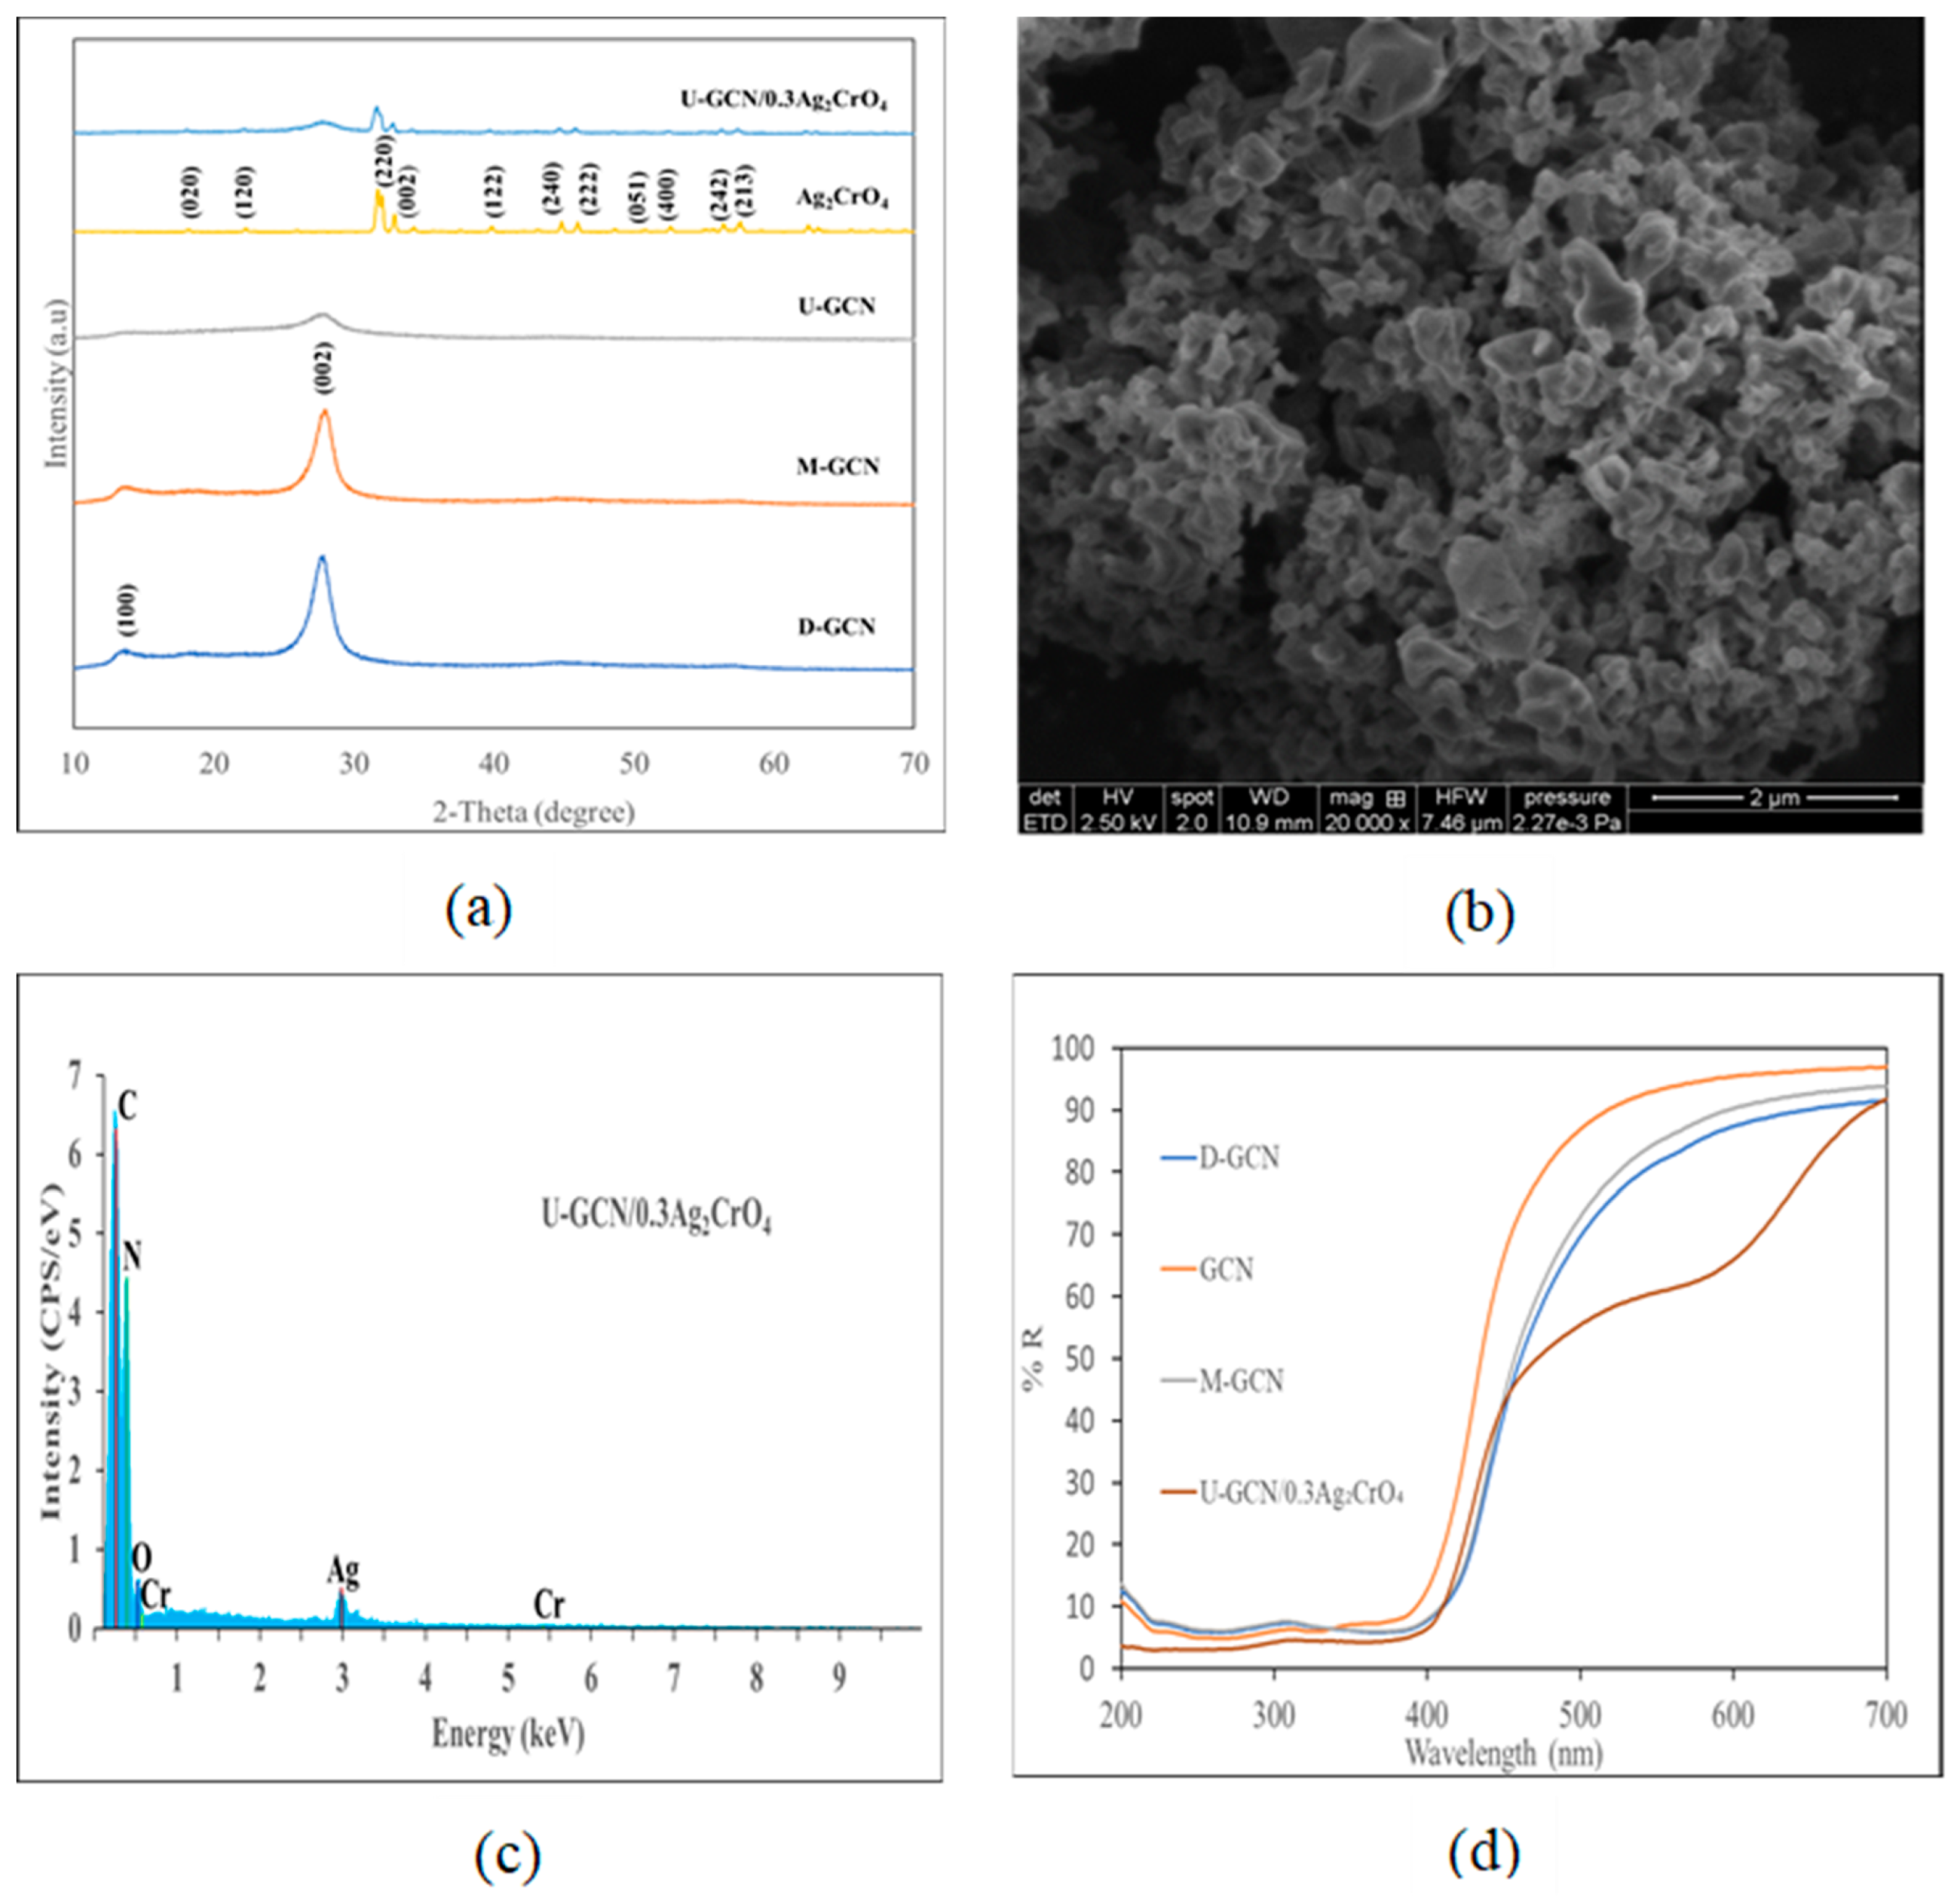
2.1. Physical and Chemical Properties of GCN and GCN Composites

The N2 adsorption–desorption Brunauer–Emmett–Teller (BET) isotherms for the synthesized photocatalysts and their corresponding Barret–Joyner–Halenda (BJH) average pore size distribution curves are presented in Figures S1 and S2. The N2 adsorption–desorption for D-GCN, U-GCN, M-GCN, U-GCN/0.3Ag2CrO4, U-GCN/0.1Ag2CrO4, U-GCN/0.5Ag2CrO4, U-GCN/0.3Ag, U-GCN/0.3AgBr, and U-GCN/0.3Ag3PO4 can be classified as a type IV isotherm with an H3-type hysteresis loop. This is an indication that those photocatalysts have mesoporous structures [23]. The N2 adsorption–desorption for Ag2CrO4 follows the type III isotherm. This is due to the non-identifiable monolayer formation, weak adsorbent–adsorbate interactions, and the presence of macroporous structures that are typical of a type III isotherm [23]. The specific surface area, pore volume, and average pore size for GCN and GCN/silver-based composites are summarized in Table 1. The specific surface area and pore volume of urea-derived GCN (57.68 m2/g, 0.30 cm3/g) are significantly larger than D-GCN (8.79 m2/g, 0.05 cm3/g) and M-GCN (2.95 m2/g, 0.02 cm3/g), which agrees with the published studies [14,15,24]. This can be attributed to the presence of heteroatoms of oxygen in the urea structure playing an important role in the increased surface area and enlarged pore volume during the process of condensation polymerization [15]. Oxygen is reported to be more efficient in increasing surface area and pore volume enlargement due to the increased formation of CO2 and water vapor during polymerization [14,15,25]. U-GCN/silver-based composites have specific surface areas varying from 41.85 m2/g to 67.38 m2/g and pore volumes between 0.23 cm3/g and 0.39 cm3/g. All the U-GCN based photocatalysts have a relatively large BET surface area (41.85 m2/g to 67.38 m2/g) and pore volume (0.23 cm3/g to 0.39 cm3/g) compared to M-GCN and D-GCN. This can be attributed to the heteroatoms of oxygen in the urea structure, which contributed to the large surface area and pore volume.
The XRD patterns of GCN are presented in Figure 1a. D-GCN, U-GCN, and M-GCN have dominant diffraction peaks at 27.72°, 27.9°, and 27.78°, respectively. According to Bragg’s equation, the interplanar distance for D-GCN, U-GCN, and M-GCN was calculated to be 0.322 nm, 0.320 nm, and 0.321 nm, respectively. The dominant peaks at these degrees are indexed to the 002 plane. This is attributed to the strong interplanar packing of the aromatic conjugated structure of the GCN [14]. A weak peak at around 13.3° was also observed on the XRD spectrum of D-GCN, U-GCN, and M-GCN, which can be indexed to the 100 plane. This indicates the characteristics of the in-plane structural packing motif [26,27]. Both the 100 and 002 planes are associated with the hexagonal aromatic structure of GCN (JCPDS card number 87-1526) [28]. U-GCN has a broader and weaker diffraction peak than D-GCN and M-GCN, indicating its smaller crystallinity caused by the strong electronegative oxygen atom and strong C–O bond leading to low polymerization [14]. The Ag2CrO4, as seen in Figure 1a and Figure S9, showed several characteristic diffraction peaks, with the dominant peak at 31.68°, indexed at the 220 plane (JCPDS card number 26-0952) [29]. The shape of the peaks indicates that the prepared Ag2CrO4 was well crystallized and has the characteristic orthorhombic structure. Figure 1a and Figure S3 show the peaks of the as-synthesized U-GCN/silver-based nanocomposites. The main peak of Ag2CrO4 was not observed in the U-GCN/0.1Ag2CrO4 nanocomposite due to the low ratio of Ag2CrO4 in the nanocomposite. However, with increasing ratio of Ag2CrO4, its main peak and other weak peaks were observed in U-GCN/0.3Ag2CrO4 and U-GCN/0.5Ag2CrO4 composites with increasing intensity. This indicates the presence of the GCN hexagonal and the Ag2CrO4 orthorhombic structures. Moreover, the increasing intensity of Ag2CrO4 was accompanied by a corresponding decrease in the intensity of GCN as the ratio of Ag2CrO4 increased in the nanocomposites. The AgBr dominant peak at 31.10° was indexed to the 200 diffraction plane (JCPDS card number 79-0148) and the decreased GCN peak was observed in the U-GCN/0.3AgBr nanocomposite, indicating that the U-GCN acted as a support to the binding AgBr particles, while the Ag3PO4 peak was not observed in the U-GCN/0.3Ag3PO4 structure. The non-observable peak of Ag3PO4 could be due to the low ratio of Ag3PO4 in the nanocomposite. Though the dominant peak of Ag nanoparticles was not observed in the U-GCN/0.3Ag structure, other weak peaks were observed. This could be attributed to the low ratio of Ag particles in the nanocomposite.
The SEM images of U-GCN/0.3Ag2CrO4 and other as-synthesized photocatalysts are shown in Figure 1b, Figures S4 and S10. In Figure S4a,c, the D-GCN and the M-GCN show the characteristic stacked sheet-like morphologies [14,27,30], while in Figure S4b, the U-GCN shows the typical aggregated flake-like morphology [31]. In Figure S4d, the Ag2CrO4 displays a spherical-like morphology which is typical of Ag2CrO4 [32,33,34]. In Figure 1b, Figures S4e–i and S10, the U-GCN-based composites show a similar structure to U-GCN, though with more aggregated flake-like morphologies, indicating the presence of Ag2CrO4, Ag, AgBr, and Ag3PO4. The aggregated morphology exhibited by U-GCN and U-GCN-based composites is typical of GCN synthesized by the direct pyrolysis of urea [35]. The EDS in Figure S5 confirmed the formation of graphitic carbon nitride (GCN) with the presence of carbon and nitrogen peaks. For the nanocomposites, as seen in Figure 1c and Figure S5, the presence of the silver compounds comprising the elements Ag, Cr, P, Br, and O were observed in the composite structures. The intensity of the energy peak for Ag increased with the increasing ratio of Ag2CrO4 in the U-GCN/silver chromate composite and was more pronounced with 0.5 wt% Ag2CrO4.
The UV-Vis diffuse reflectance spectroscopy (UV-Vis DRS) of the synthesized graphitic carbon nitrides (GCNs) and U-GCN/0.3Ag2CrO4 are shown in Figure 1d, and other nanocomposites are shown in Figure S6. The pristine GCNs show that the absorption edges shift to longer wavelengths from U-GCN to M-GCN and then to D-GCN. This indicates increasing light absorption in the visible light region and suggests that the GCNs can absorb photons with wavelengths lower than their absorption edges [15,22]. The difference in band gaps for D-GCN, U-GCN, and M-GCN is caused by the different degrees of condensation during GCN synthesis using different precursors [15]. The observed decrease in the reflectance (% R) of the composites means an increased absorbance of light, indicating the synergistic effect of coupling silver-based compounds (AgBr, Ag, Ag3PO4, and Ag2CrO4) on the property of the light absorption characteristics of graphitic carbon nitride (GCN). This can be attributed to the silver compounds functioning as electron traps in the GCN bandgap [36]. The band gaps of those photocatalysts were estimated using a Tauc plot (Figure S7) derived from UV-Vis DRS and summarized in Table 2. Two band gaps appeared for U-GCN/0.3Ag2CrO4 and U-GCN/0.5Ag2CrO4. The first bandgaps (near 2.74 eV and 2.73 eV) are associated with GCN, while the second bandgaps (near 1.78 eV and 1.75 eV) are associated with Ag2CrO4. This indicates that the nanocomposites can be activated by photons with energy larger than second bandgaps (1.78 eV and 1.75 eV). With these two band gaps, enhanced photocatalytic activity and performance of U-GCN/0.3Ag2CrO4 and U-GCN/0.5Ag2CrO4 can be expected with the utilization of solar energy. The solar energy spectrum reaching the earth is between 100 nm and 1,000,000 nm, corresponding to the photon energy between 12.4 eV and 1.24 eV. This indicates that the as-synthesized photocatalysts with two band gaps can utilize a huge amount of energy from the sunlight up to the extreme ultraviolet region (12.4 eV) of the solar radiation spectrum.

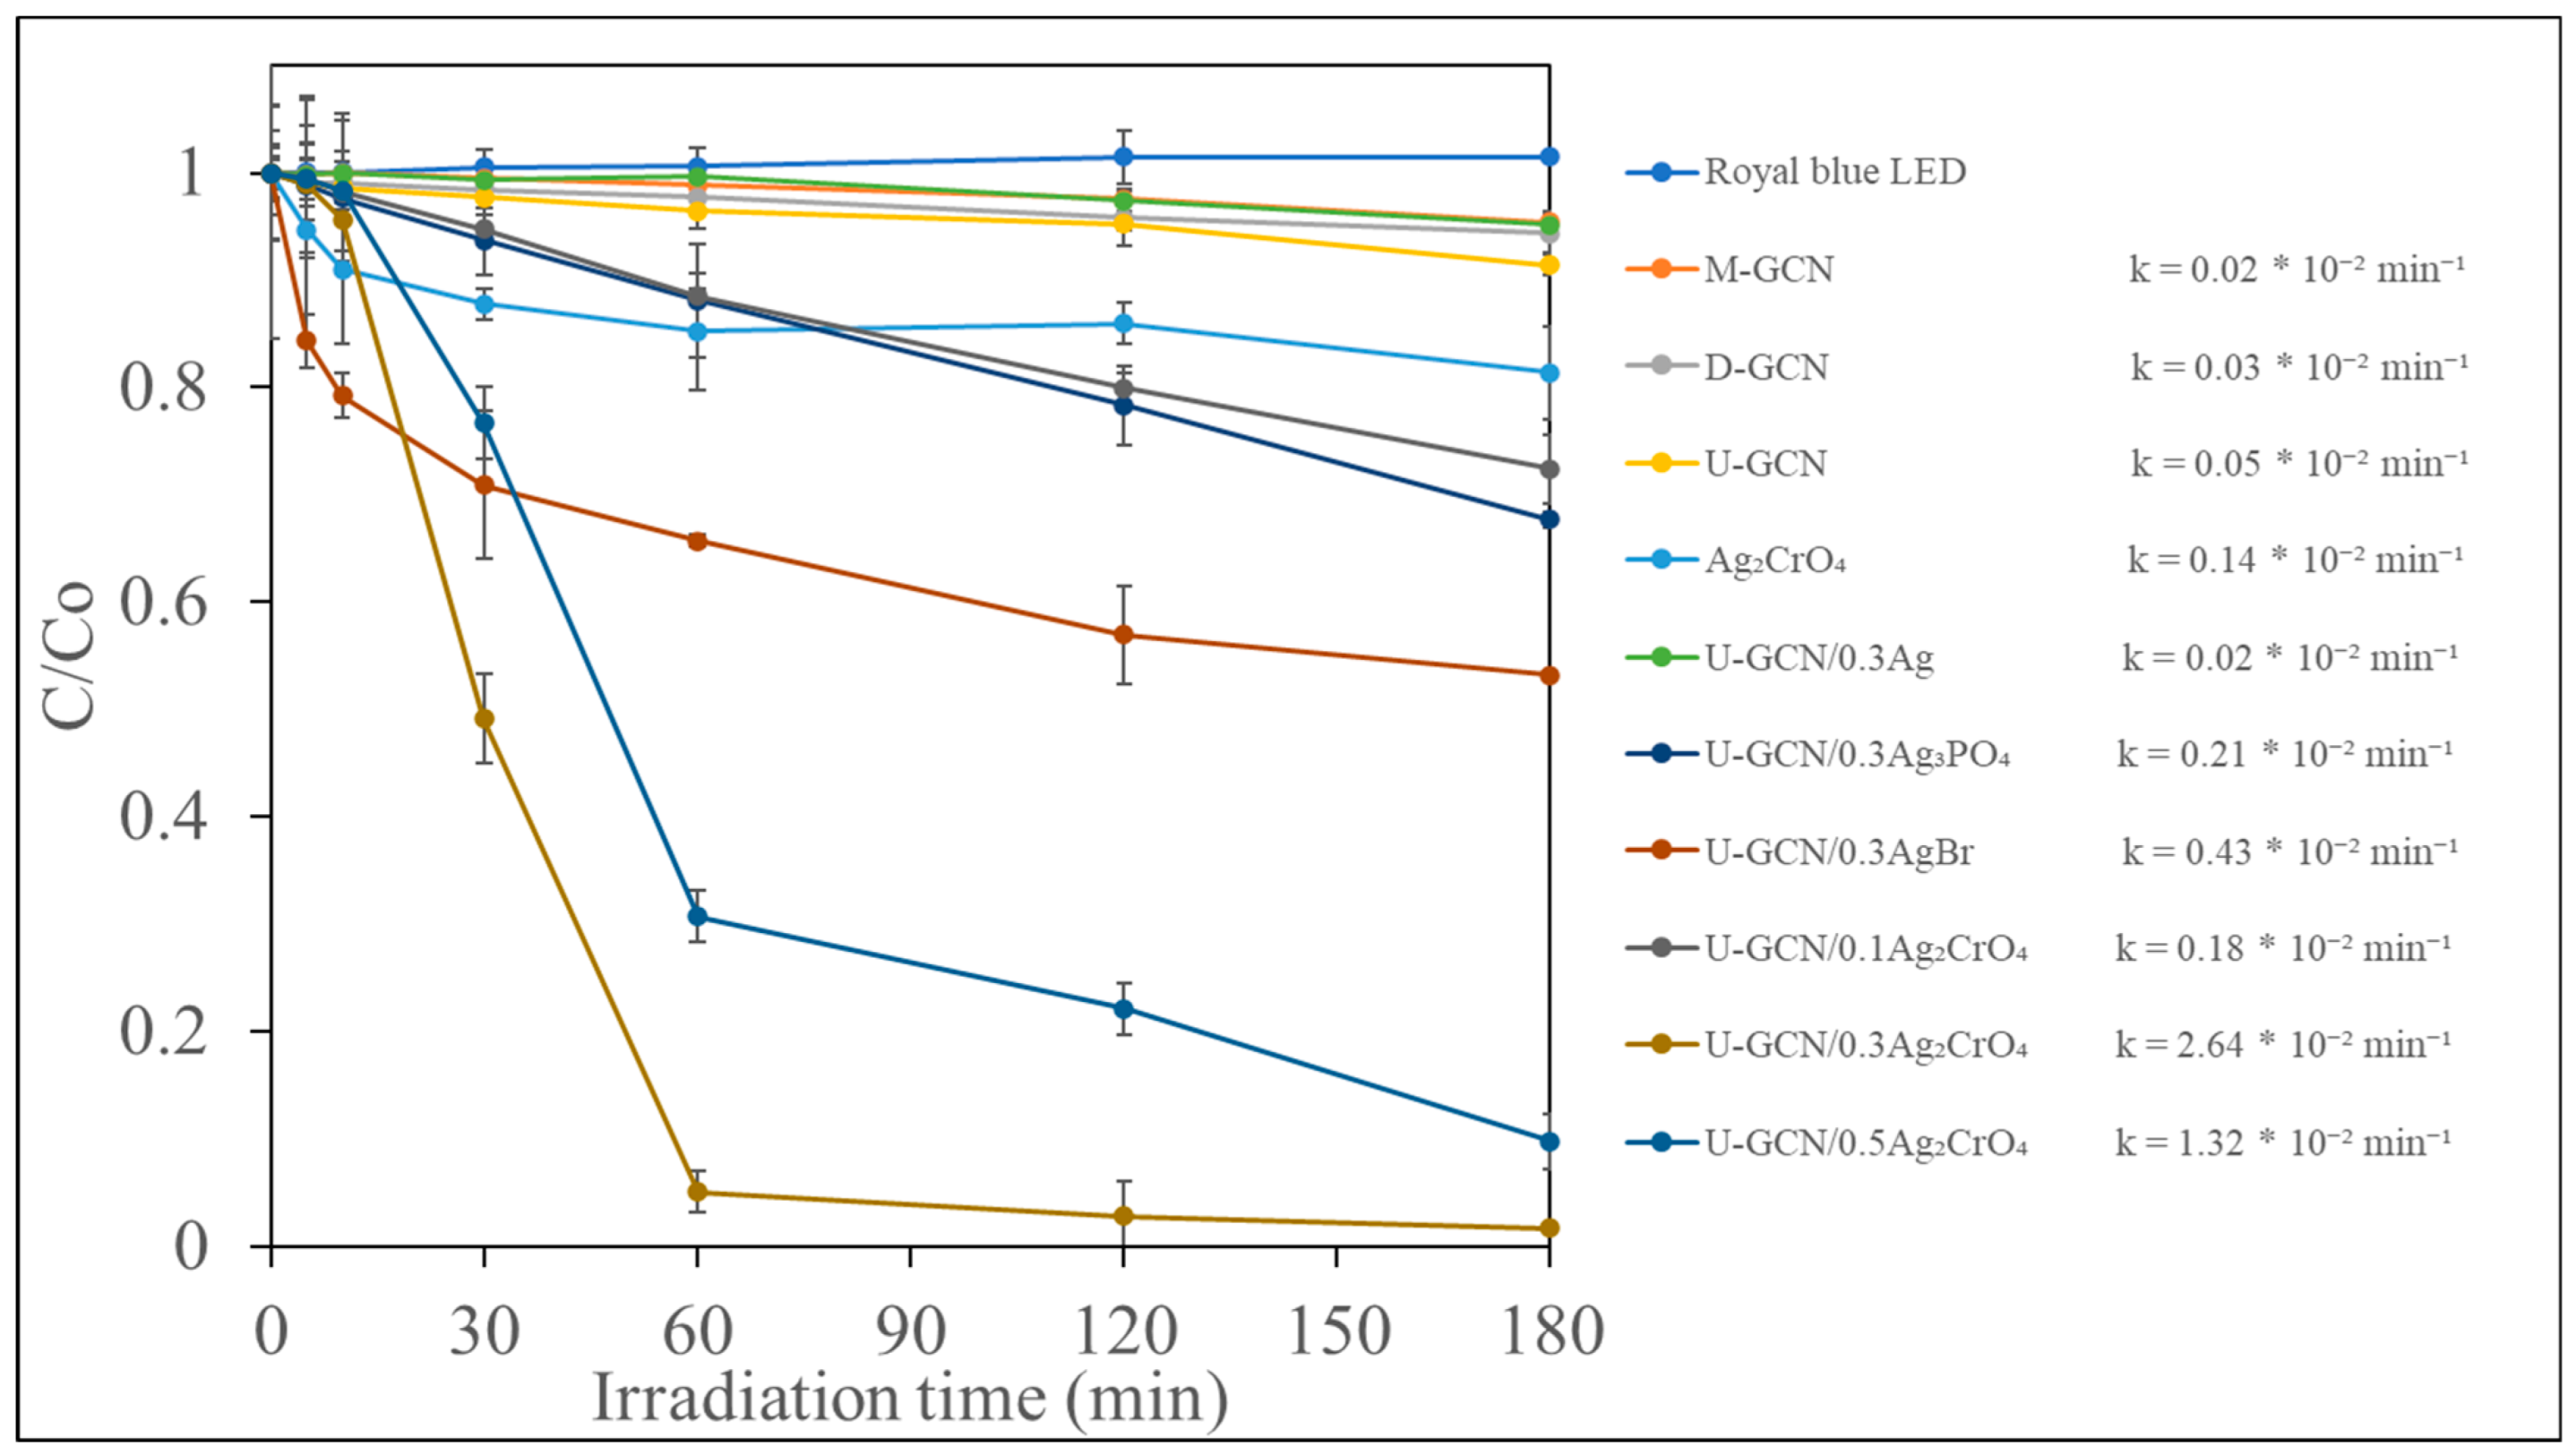
2.2. Photocatalytic Degradation of 4-CP Using GCNs and GCN-Based Nanocomposites

The photocatalytic degradation of 4-CP using GCNs and GCN-based nanocomposites with royal blue LED irradiation is summarized in Figure 2. The concentration of 4-CP decreased along with irradiation time in the presence of GCNs or GCN-based nanocomposites. Royal blue LED irradiation only did not cause the direct photolysis of 4-CP, as 4-CP does not have significant light absorption in these wavelengths. The 60-minute adsorption experiments showed that 4-CP did not adsorb on the surface of GCN or GCN-based nanocomposites (Figure S8). Therefore, the decrease of 4-CP concentration in this study is due to the photocatalytic reaction initiated by the GCN or GCN composites activated by royal blue LED irradiation. The bandgap energy for the three pristine GCNs (U-GCN, D-GCN, and M-GCN) varied from 2.68–2.75 eV, which corresponds to 462–450 nm. The royal blue LED has its maximum emission at 450 nm, with a full width at half maximum equal to 20 nm. Most photons emitted from the investigated royal blue LED have higher energy than the bandgap of the GCNs, which can be absorbed by the GCNs, leading to the photocatalytic degradation of 4-CP. Among the pristine GCNs, the highest 4-CP degradation rate (0.05 × 10⁻² min−1) was observed with U-GCN. U-GCN has been reported to have better performance than D-GCN and M-GCN in hydrogen production from water, nitrogen oxide (NO) removal in the gas phase, and dye removal in an aqueous medium due to its high surface area, large pore volume, and large pore size [14,15,24].
Higher 4-CP degradation rates were observed with all GCN nanocomposites, except GCN/0.3Ag. A negative impact of Ag nanoparticles inclusion in the GCN structure was observed with the k value of 0.02 × 10⁻² min−1, which is 2.5 times lower than U-GCN. U-GCN/0.3Ag2CrO4 has the highest k value of 2.64 × 10⁻² min−1, which was 52.8 times more than U-GCN. Further, U-GCN/0.3AgBr and U-GCN/0.3Ag3PO4 were 8.6 times and 4.2 times more than U-GCN, respectively. The enhanced photocatalytic performance of U-GCN/0.3Ag2CrO4, U-GCN/0.3Ag3PO4, and U-GCN/0.3AgBr over GCN can be attributed to the introduction of Ag2CrO4, Ag3PO4, and AgBr in the GCN structure. The bandgaps of Ag2CrO4 (1.78 eV), Ag3PO4 (2.45 eV) [37], and AgBr (2.65 eV) [38] are smaller than GCN (2.75 eV), and therefore are expected to enhance the photocatalytic activity of U-GCN. A synergistic effect was even observed for U-GCN/silver chromate nanocomposites. The degradation rates for U-GCN/silver chromate nanocomposites (2.64 × 10⁻² min−1) was larger than the sum of U-GCN alone (0.05 × 10⁻² min−1) and Ag2CrO4 alone (0.14 × 10⁻² min−1). This optimal performance by U-GCN/silver chromate nanocomposite is due to the synergistic effect of coupling Ag2CrO4 with GCN. This resulted in reduced reflectance and, hence, increased absorption of light, reduced bandgap, and high photocatalytic activity, with the Ag2CrO4 serving as an electron trap by promoting charge carrier separation. Therefore, coupling GCN with silver-based photocatalysts can create a synergistic effect by inhibiting the e–h pair recombination and improving the charge separation, thereby increasing the photocatalytic degradation of organic pollutants [20,22,36].
An optimal mass ratio between Ag2CrO4 and U-GCN was observed to be 0.3:1. The 4-CP degradation rate increased when the mass ratio was increased from 0.1:1 to 0.3:1. However, a further increase from 0.3:1 to 0.5:1 did not enhance the photocatalytic degradation of 4-CP. The excess Ag2CrO4 present in the nanocomposite could block the active sites on GCN, increase electron–hole (e–h) recombination, and inhibit the rate of transfer of photo-induced charges [39]. Table 3 shows the photocatalytic efficiency of U-GCN/0.3Ag2CrO4 towards 4-CP degradation as compared with the results of other published articles. Up until now, the published articles on the photocatalytic degradation of organic pollutants, including 4-CP, involved the use of an Xe lamp as the light source for the solar simulator. The novelty of royal blue LED as a light source is a potential application for indoor use in photocatalytic systems.

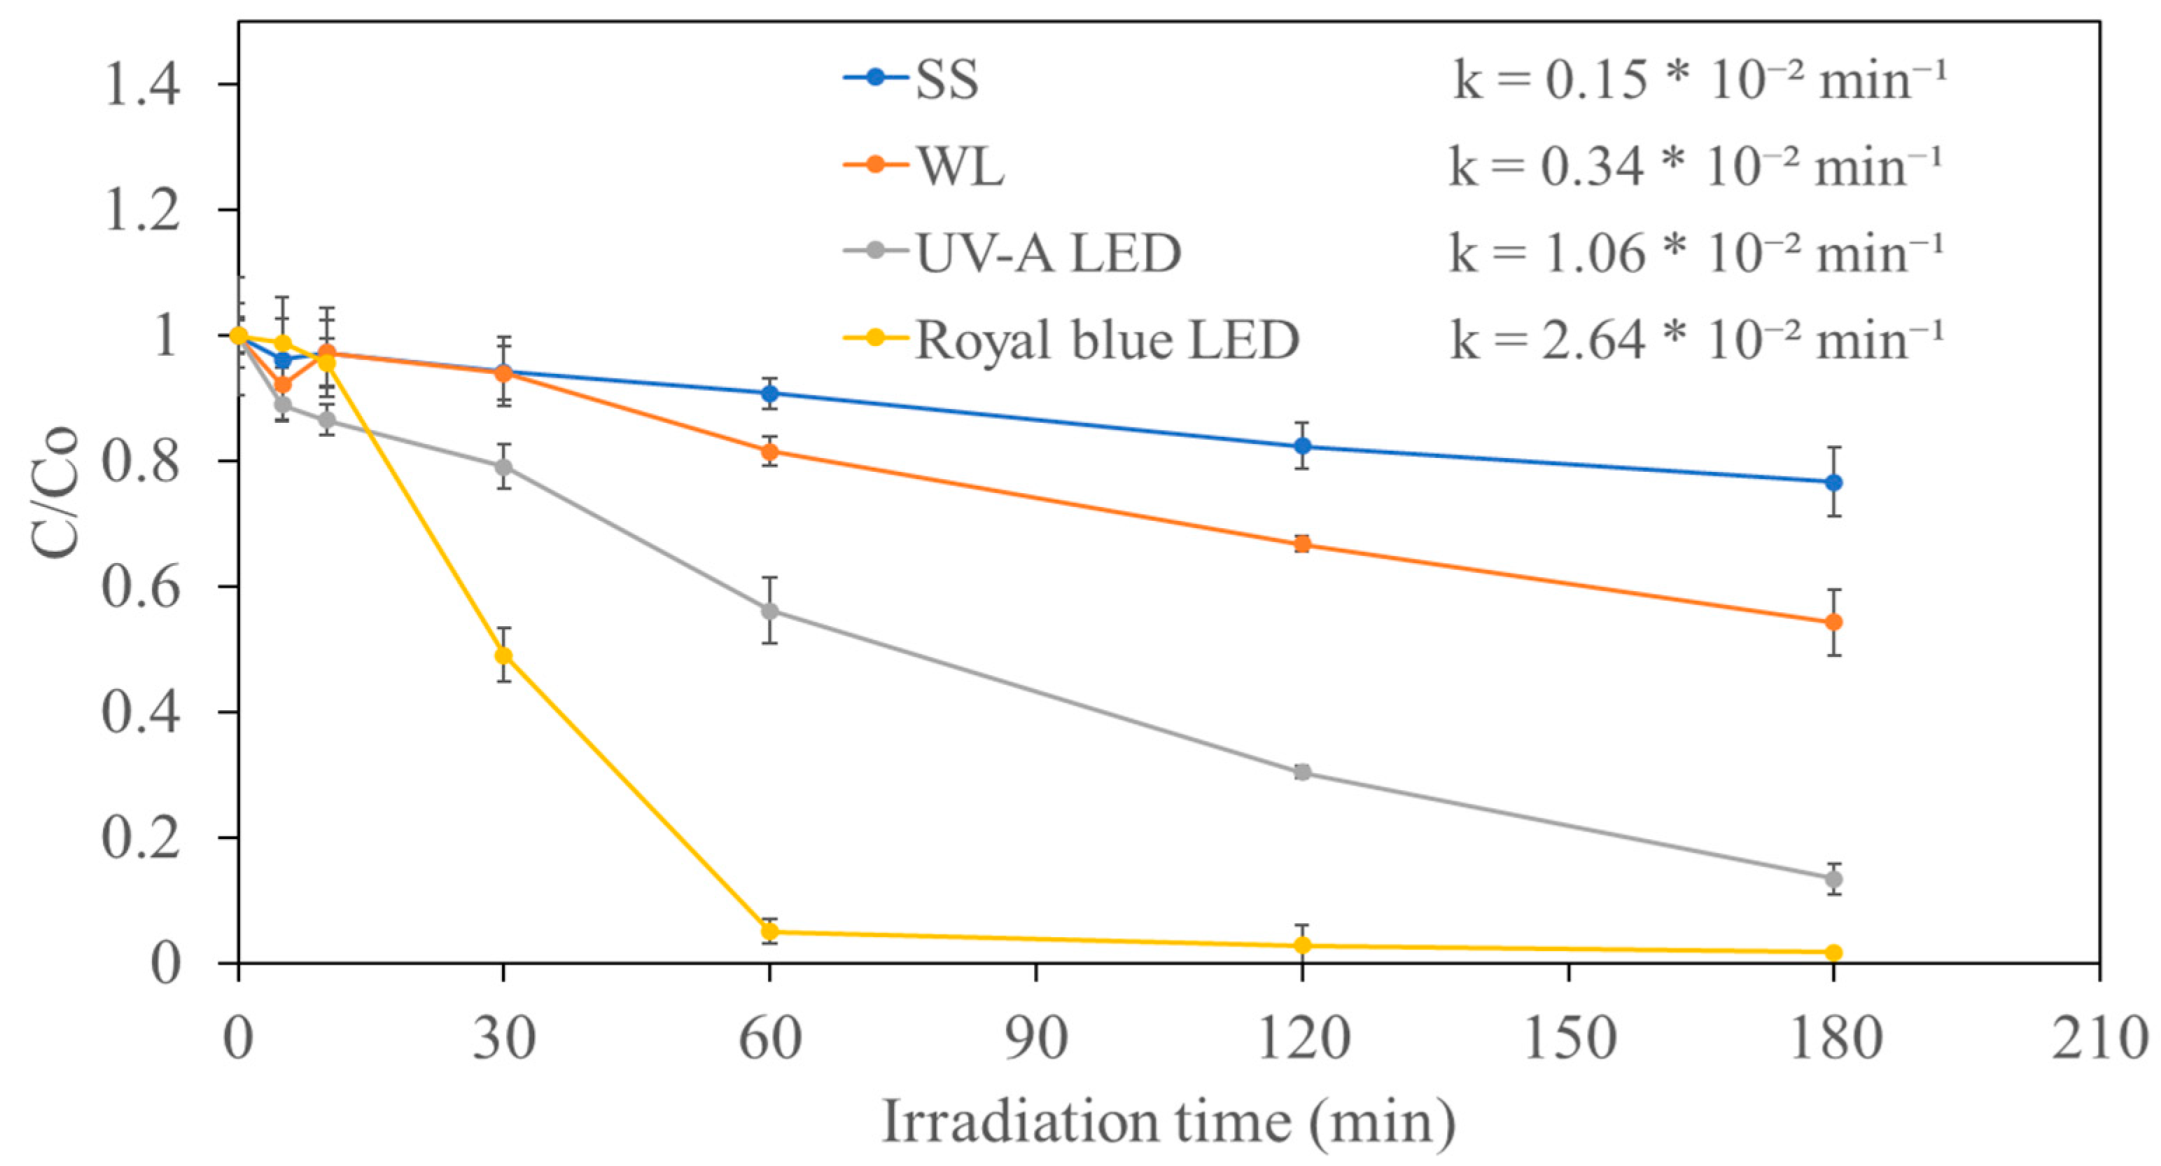
2.3. Photocatalytic Degradation of 4-CP by U-GCN/0.3Ag2CrO4 in Different Photoreactors

In addition to the royal blue LED reactor, the performance of the U-GCN/0.3Ag2CrO4 nanocomposite in the photocatalytic degradation of 4-CP was evaluated with three other photoreactors, including a UV-A LED (365 nm), a cool white lamp (400–700 nm), and a solar simulator (350–1800 nm, HAL-320W). The normalized concentration vs. irradiation time is presented in Figure 3. The light intensities measured through ferrioxalate actinometry experiments for the solar simulator, cool white lamp, UV-A LED, and royal blue LED were 0.99 × 10¹⁷ photons/s, 0.61 × 10¹⁷ photons/s, 0.71 × 10¹⁷ photons/s, and 5.90 × 10¹⁷ photons/s, respectively. In order to compare the energy consumption for the different photoreactors, the photon energy (Ephoton) required to achieve one log 4-CP reduction was estimated based on Equation (1) and is summarized in Table 4.
E p h o t o n = ln ( 0.1 ) k I e
where k is the first-order degradation rate constant and Ie is light intensity in the form of J/s, which was estimated based on light intensity (photons per second) measured through ferrioxalate actinometry and the light emission spectrum for each reactor.
The results indicate that U-GCN/0.3Ag2CrO4, as a visible photocatalyst, can degrade organic contaminants under various lighting conditions. All evaluated photoreactors can emit photons with an energy larger than the bandgap of U-GCN, Ag2CrO4, and U-GCN/0.3Ag2CrO4 nanocomposite, and, therefore, can activate the photocatalyst to cause a series of photocatalytic reactions. The rate constants estimated for the solar simulator, cool white lamp, UV-A LED, and royal blue LED are 0.15 × 10⁻² min−1, 0.34 × 10⁻² min−1, 1.06 × 10⁻² min−1, and 2.64 × 10⁻² min−1, respectively. The royal blue LED had the highest k value of 2.64 × 10⁻² min−1, which is 2.5 times that of UV-A LED, 7.8 times that of the cool white lamp, and 17.6 times that of the solar simulator. This high k value from royal blue LED is due to its very high light intensity.
As shown in Table 4, the photon energy required to degrade 90% of 4-CP was 8960 J, 1366 J, 514 J, and 1364 J for the solar simulator, cool white light, UV-A LED, and royal blue LED, respectively. The lowest photon energy consumption was observed with the UV-A LED, as most of the photons emitted from the UV-A LED reactor can contribute to the photocatalytic reaction, while only a fraction of photons emitted from the royal blue LED reactor, solar simulator, and cool white lamps possess energy larger than the bandgap of U-GCN/0.3Ag2CrO4. The solar simulator emitted 10.8% of photons with a wavelength of <452 nm (equivalent to the bandgap of U-GCN), and 35.3% of photons with a wavelength of <689 nm (equivalent to the bandgap of Ag2CrO4). The percentage of photons (<452 nm) in the emission spectrum of the cool white lamp and royal blue LED were 16.5% and 52.3%, while the percentage of photons (<689 nm) emitted by the cool white lamp and royal blue LED was estimated to be 78.4%, and 61.6%, respectively. The photon energy consumptions are similar for royal blue LED and the cool white lamps, although the fraction of photons less than 452 nm for royal blue LED is larger. This is because the cool white lamps emitted a large number of photons between 452 nm and 698 nm, which can also activate Ag2CrO4. UV-A LED is efficient in terms of photon energy consumption, but its electricity to photon conversion efficiency is usually lower than visible LEDs and fluorescent lamps [42,43]. Although the solar simulator is not as effective in photocatalytically degrading the contaminant, the results indicate its huge potential for applying natural sunlight, a free and clean energy in abundance, in photocatalytic treatment using GCN/Ag2CrO4 as a catalyst.

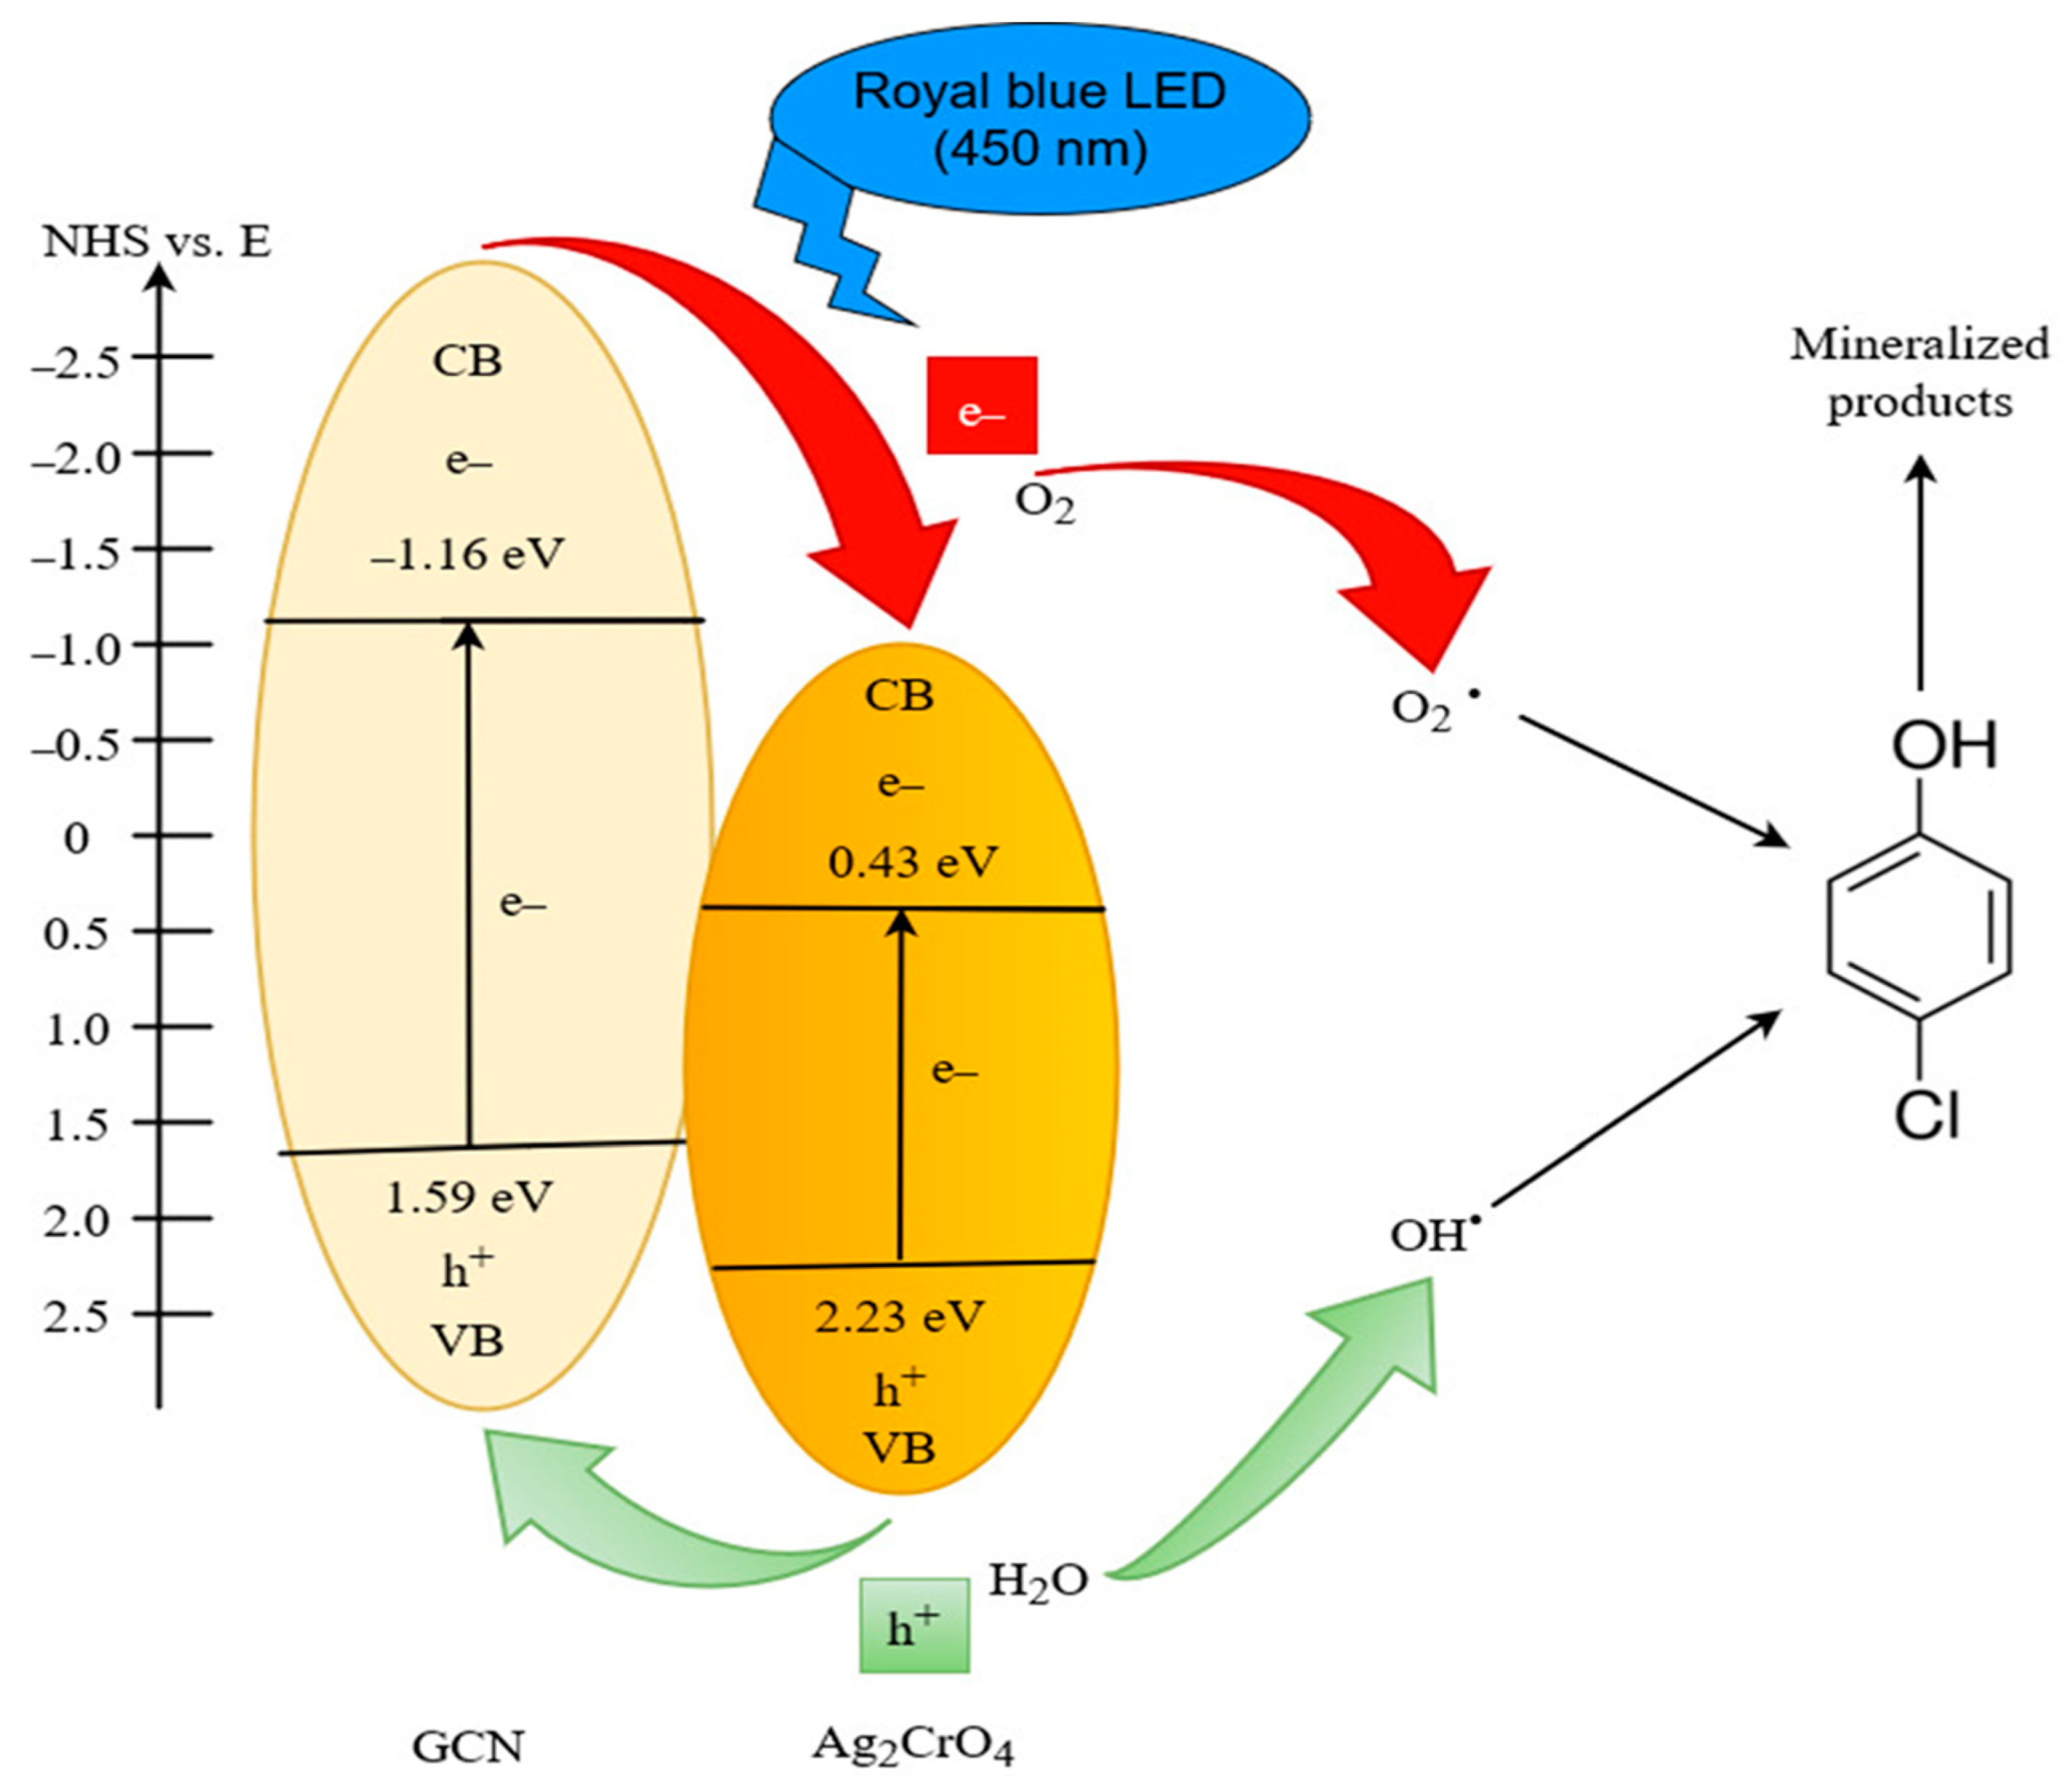
2.4. Proposed Photocatalytic Mechanism

It was reported that GCN and modified GCN can produce reactive oxidative species (ROS) that can degrade organic pollutants under visible-light irradiation [20,26,27,36]. The results of the trapping experiments show that the active species, e, h+, O2, and OH. were involved in the degradation of 4-CP and other chlorophenol compounds to the mineralized products CO2, H2O, and HCl. Several by-products have been identified to have been formed in the course of the photocatalytic degradation of 4-CP to mineralized products, including hydroquinone, benzoquinone, phenol, and 4-chlorocatecol [44,45,46,47]. These by-products, which are hydroxylated intermediates, are formed during the oxidation of 4-CP.
Based on this, a possible photocatalytic degradation mechanism of 4-CP by U-GCN/Ag2CrO4 is presented in Figure 4. The conduction band (CB) and the valence band (VB) potentials of GCN and Ag2CrO4 were calculated based on Equations (2) and (3) [32,48,49]:
                    E C B = X E e 0.5 E g
E V B = E C B + E g
where ECB and EVB are conduction and valence band potentials, Ee is free electron energy on the hydrogen scale ( ~ 4.50   eV ) , Eg is the bandgap energy (Table 2), and X is the absolute electronegativity of the semiconductor, which is based on the geometric mean of the constituent atoms, which for GCN and Ag2CrO4 is 4.72 eV and 5.83 eV, respectively [50]. Therefore, for GCN (based on the U-GCN estimated bandgap in Table 2) the ECB and EVB are −1.16 eV and 1.59 eV, while for Ag2CrO4, the ECB and EVB are 0.43 eV and 2.23 eV, with the Eg of Ag2CrO4 as 1.80 eV.
In Figure 4, there is an excitation of electrons on the U-GCN and Ag2CrO4 upon irradiation from a visible-light source and the electrons move from their respective VB to CB. Due to potential differences, electrons migrate from the CB of GCN, and it is accepted on the CB of Ag2CrO4, where the Ag+ is reduced to Ag0, while holes in the VB of GCN move to the VB of Ag2CrO4 [20,51,52], leading to efficient charge separation. Subsequently, the accepted electrons by Ag2CrO4 react with the dissolved oxygen in the aqueous medium to produce superoxide radicals, while the holes on the surface of the GCN react with water molecules to produce hydroxyl radicals. The trapping of electrons and holes by the dissolved oxygen and water molecules will serve to limit the recombination, causing the formation of reactive oxidative species (O2 and OH) that will lead to the complete mineralization of 4-CP, producing CO2, H2O, and HCl.

3. Materials and Methods

3.1. Chemicals

4-chlorophenol-ClC6H4OH (99%), urea-CH4N2O (≥99.5%), silver nitrate-AgNO3 (≥99%), potassium chromate-K2CrO4 (≥99%), potassium bromide-KBr (≥99%), ethanol-C2H5OH (≥95%), 1-10 phenanthroline-C12H8N2, iron III chloride-FeCl3, ammonium iron II sulfate hexahydrate (Mohr’s salt, ≥98%) -(NH4)2Fe(O4)2(H2O)6, and high-pressure liquid chromatograph (HPLC) grade water were purchased from Sigma-Aldrich Co. (St. Louis, MO, USA). Melamine, C3H6N6 (≥99%), was purchased from Aldrich (St. Louis, MO, USA). Dicyandiamide-C2H4N4 (≥99%) and potassium trioxalatoferrate III trihydrate-K3Fe(C2O4)3·3H2O were purchased from Alfar Aesar (Ottawa, ON, Canada). Nanosilver particles were purchased from Aldrich (Oakville, ON, Canada). HPLC grade acetonitrile, CH3CN, was purchased from EMD (Gibbstown, NJ, USA). Sodium acetate-C2H3NaO2 was purchased from Brady Canada. Aqueous solutions were prepared with deionized (DI) water. The disodium hydrogen phosphate, Na2HPO4 (≥99%) was purchased from BDH (Toronto, ON, Canada). Phosphoric acid, H3PO4 (75%), was purchased from Chemco (Port Louis, Mauritius). All chemicals were used as received.

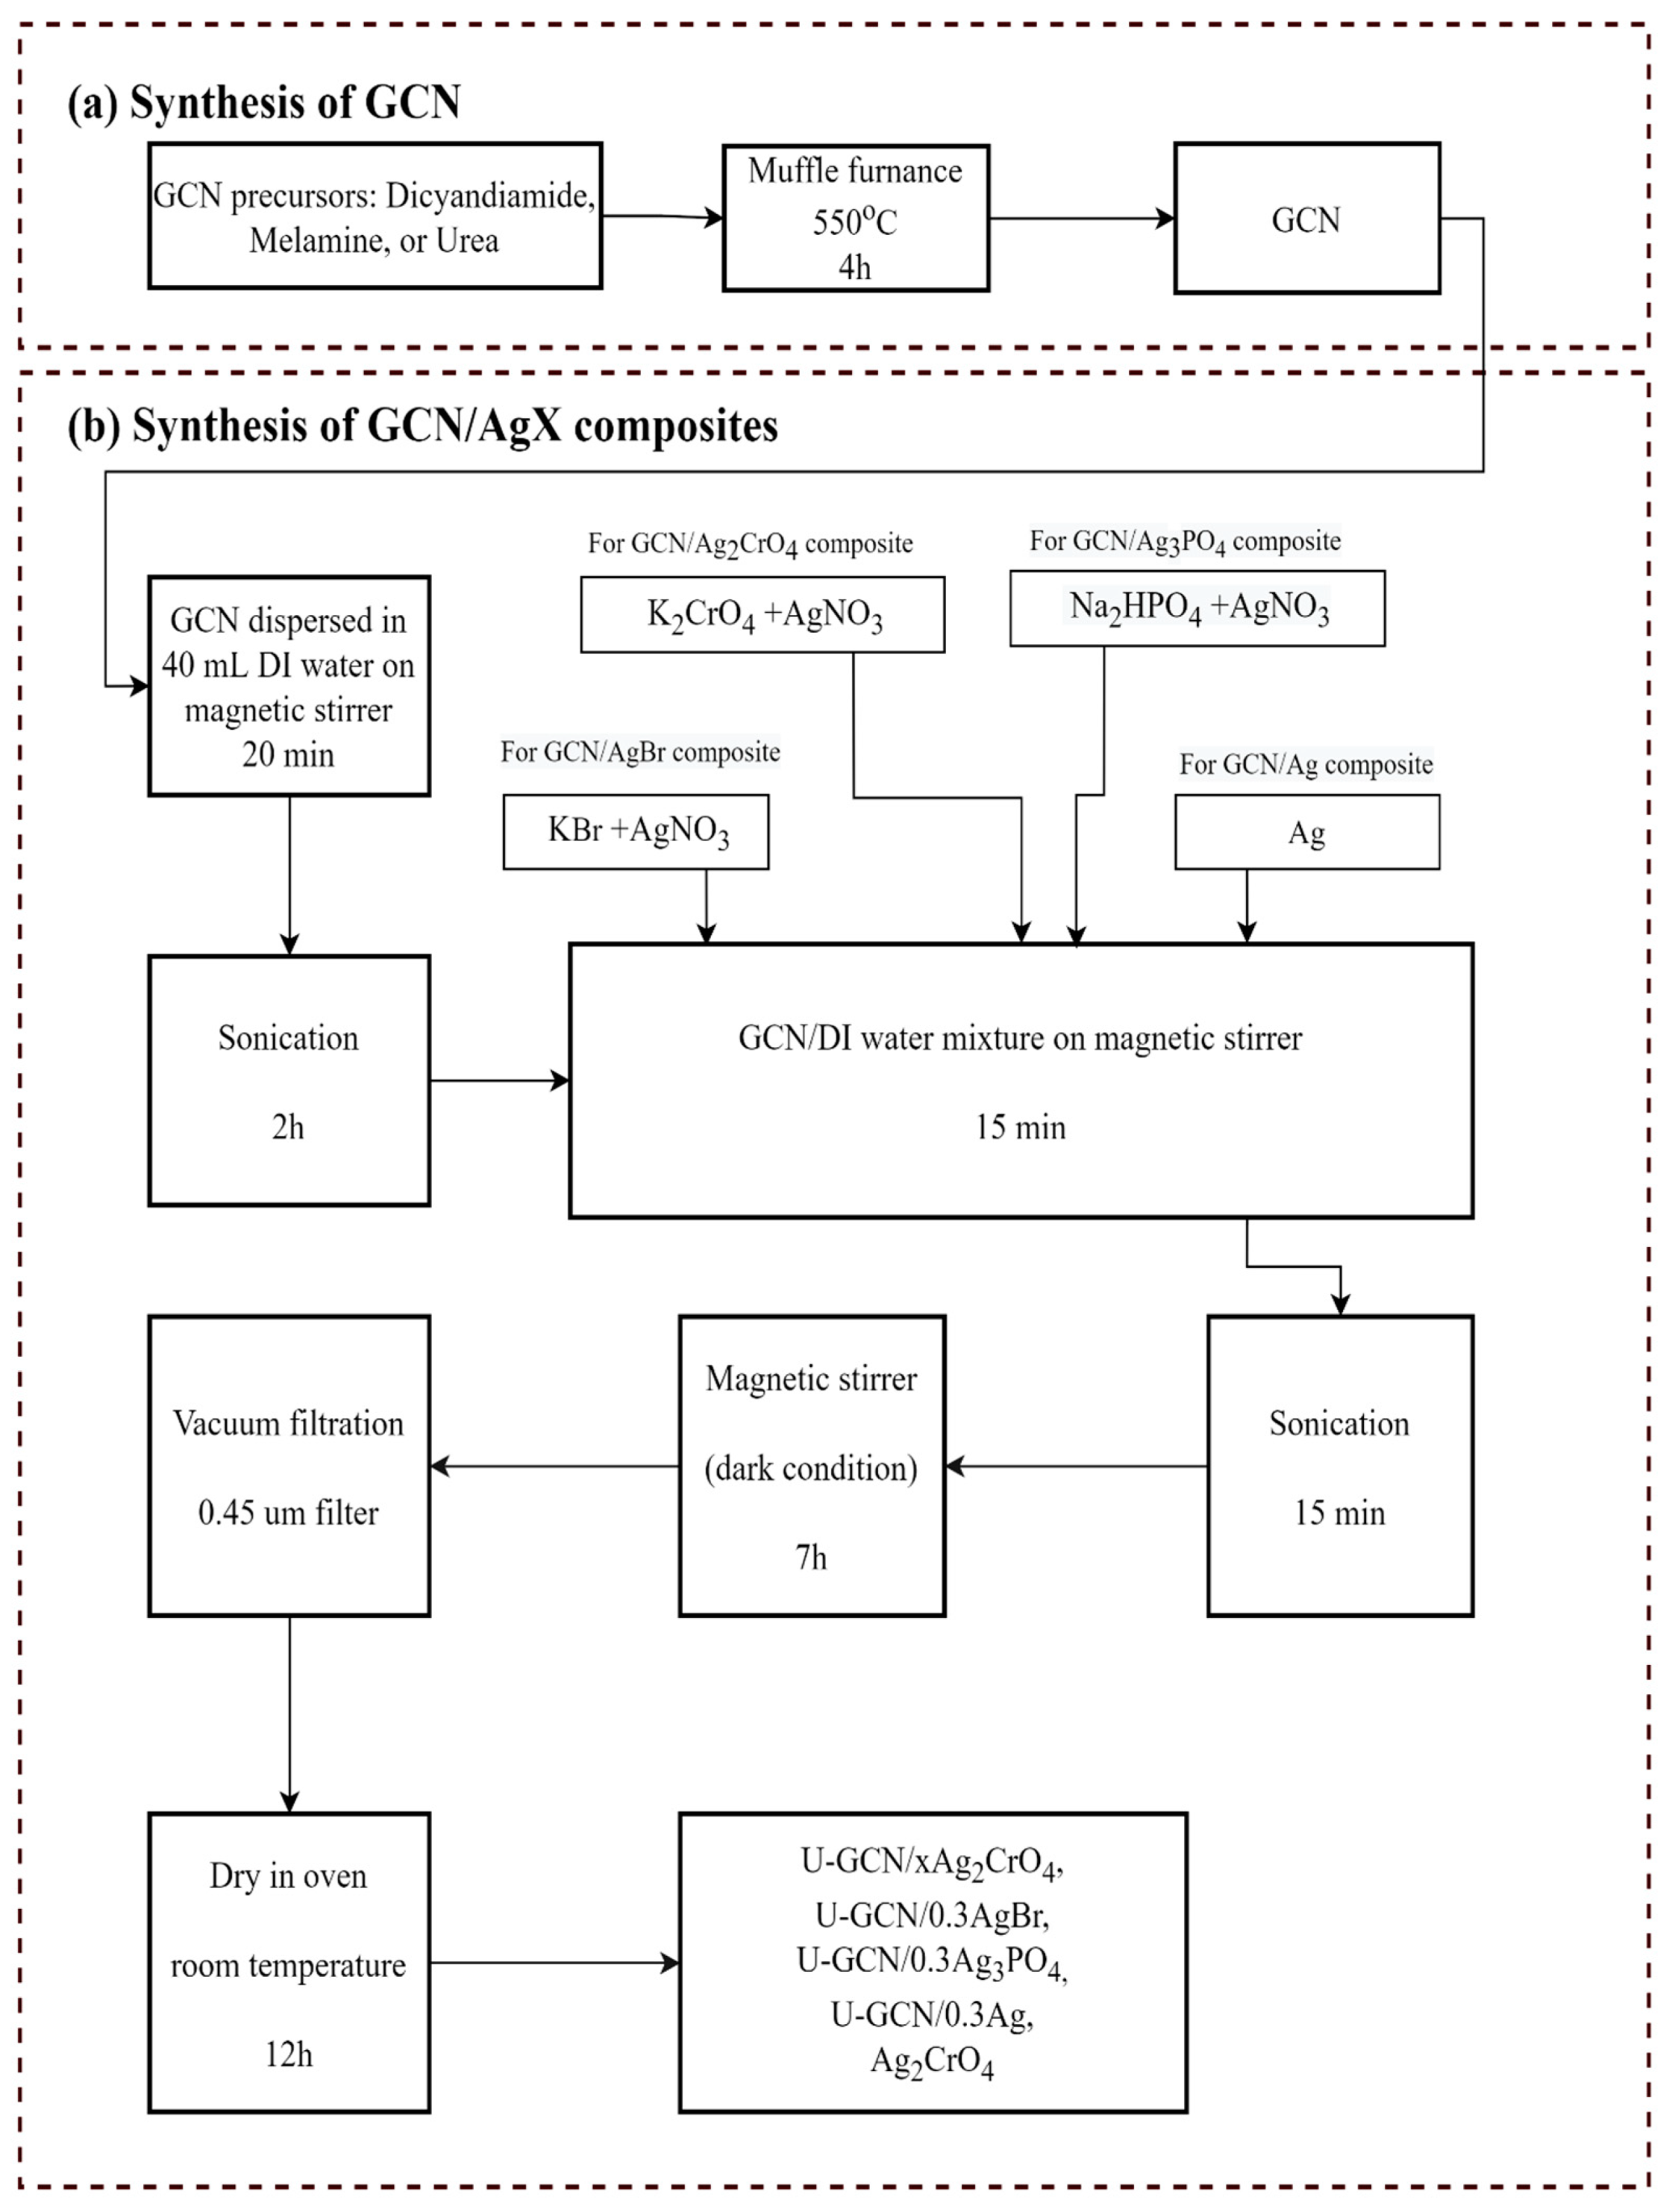
3.2. Synthesis of Graphitic Carbon Nitride (GCNs) and GCN Composites

In this study, GCNs were synthesized by direct pyrolysis from the different precursors dicyandiamide, urea, and melamine [14,15,20,53], as shown in Figure 5a. Typically, 30 g of dicyandiamide, urea, or melamine was put in a partially closed alumina crucible and then placed in a muffle furnace (550-58, Fisher Scientific, Waltham, MA, USA), set at 550 °C, for 4 h. After 4 h, the muffle furnace was turned off and the GCNs derived from these precursors were left to cool down to room temperature. The GCNs from dicyandiamide, urea, and melamine were ground to powder and labeled D-GCN, U-GCN, and M-GCN, respectively.
GCN/silver-based compound composites were synthesized by a dark-induced, in-situ deposition method (see Figure 5b) [20,54]. A total of 1 g U-GCN was dispersed in 40 mL of deionized water, stirred on a magnetic stirrer for 20 min, and then placed in an ultrasonicator for 2 h. After that, the solution was placed on the magnetic stirrer and different amounts of K2CrO4, KBr, Na2HPO4, Ag, and AgNO3 were added as follows: for U-GCN/0.3Ag2CrO4 composites, 0.2774 g AgNO3 and 40 mL K2CrO4 solution (4.83 g/L) were added; for U-GCN/0.3AgBr, 0.277 g AgNO3 and 40 mL KBr solution (4.85 g/L) were added; and for U-GCN/0.3Ag3PO4, 0.1386 g of AgNO3 and 40 mL Na2HPO4 (2.42 g/L) were added, while for U-GCN/0.3Ag, 0.3 g of Ag nanoparticle was added. The mixture of GCN/silver compounds was placed on the magnetic stirrer for 15 min and then transferred to the ultrasonicator for another 15 min. The solution was then placed on the magnetic stirrer in the dark for 7 h. The product was vacuum filtered using a 0.45 μm (nitrocellulose, Merck Millipore Ltd., Cork, Ireland), then washed with both DI water and ethanol at least five times. Finally, U-GCN/silver-based compound composites were obtained after drying in the oven (637 G, Fisher Scientific, Waltham, MA, USA) at room temperature for 12 h. Nanocomposites of U-GCN/Ag2CrO4 with different mass ratios of Ag2CrO4 denoted as U-GCN-xAg2CrO4, where x = 0.1, 0.3, and 0.5, were synthesized using the same procedure above with different masses of AgNO3 and K2CrO4. Ag2CrO4 was synthesized following a similar procedure in Figure 5b above, but without U-GCN. Described briefly, 0.2774 g AgNO3 was added to 0.1934 g of K2CrO4 40 mL solution, stirred for 20 min, sonicated for 2 h, stirred and sonicated for 15 min, and then stirred for 7 h in the dark. The product was vacuum filtered and washed with ethanol and water, then dried in the oven at room temperature for 12 h to obtain the Ag2CrO4 product.

3.3. Characterization

The crystal structure of the samples was studied using X-ray diffraction (XRD; Rigaku multiflex X-ray diffractometer, Rigaku Corporation, Tokyo, Japan) with Cu Kα X-ray radiation, λ = 1.5406 A°. The morphology of the samples was examined by scanning electron microscope (SEM; Quanta FEG 250 FESEM, Hillsboro, OR, USA). The elemental analysis of the samples was conducted using energy-dispersive X-ray spectroscopy (EDS; Bruker Quantum 5030 SDD X-ray spectrometer, Bruker GmbH, Bremen, Germany) with SVE III pulse processing electronics. The surface areas and pore volumes were obtained from the N2 sorption isotherm at 77 K using automatic adsorption equipment (Tristar II; Micrometrics, Norcross, GA, USA). The UV-Visible (UV-VIS) diffuse reflectance spectroscopy (DRS) of the dry-pressed disk samples was measured using a spectrophotometer (UV-VIS DRS; UV-2600 Shimadzu spectrophotometer, Shimadzu Corporation, Kyoto, Japan) with BaSO4 as the reference sample. The UV-VIS DRS of the samples were used in estimating the Kubelka–Munk function (F(R)E)2 using Equation (4), and then the band gap values of the samples were estimated from the Tauc plot of (F(R)hv)1/ϒ vs. hv, eV [22,55] as follows:
[ F ( R ) h v ] 1 ϒ = ( ( 1 R ) 2 2 R h v ) 1 ϒ K = ( 1 R ) 2 ; S = 2 R ; ϒ = 1 2   or   2 ; h v eV
where K is the molar absorption coefficient, S is the scattering factor, h is the Planck constant, v is the photon’s frequency, and ϒ is a factor dependent on the nature of the electron transition, which is either ½ or 2 for the direct and indirect band gaps, respectively.

3.4. Photocatalytic Experiments

The photocatalytic performance of GCNs derived from different precursors (D-GCN, U-GCN, and M-GCN) was first evaluated by degradation of the 4-CP using a royal blue LED photoreactor (peak emission wavelength = 450 nm). In each experiment, 40 mg of the GCN was dispersed in a 40 mL solution containing 20 mg/L 4-CP in a 100 mL quartz beaker. Before LED irradiation, the water/catalyst mixture was stirred magnetically in the dark for 30 min to attain adsorption–desorption equilibrium. 3 mL of samples were collected at different irradiation intervals and filtered using a 0.45 μm syringe filter (PTFE, Chromatographic Specialities Inc., Brockville, ON, Canada) to remove the photocatalyst particles.
The GCN showing the best performance in degrading 4-CP was selected in synthesizing GCN/silver-based nanocomposites (Ag, AgBr, Ag3PO4, and Ag2CrO4), all at a fixed mass ratio of 1:0.3. The performance of the most promising photocatalyst, U-GCN/silver chromate composite, was further investigated using three different mass ratios (x = 0.1, 0.3, and 0.5). Furthermore, the performances of the UV-A LED (365 nm), Luzchem cool white light reactor (400–700 nm), and the solar simulator (350–1800 nm) using the optimal U-GCN/silver chromate composite were evaluated and then compared with royal blue LED photoreactor.

3.5. Analysis

The concentration of 4-CP was determined using a high-performance liquid chromatograph (HPLC; LC-2040C 3D Shimadzu Corporation, Kyoto, Japan) with UV absorbance detection at λ = 280 nm.
The mobile phases were 0.1% phosphoric acid in HPLC grade water and 0.1% phosphoric acid in acetonitrile at a 50:50 mixture with a flow rate of 1 mL/min. The measurements were conducted in duplicate and the detection limit was around 0.1 mg/L.

3.6. Actinometry

The radiation entering the reaction vessel was determined using ferrioxalate actinometry, which is based on the principle of the photoreduction of Fe3+ to Fe2+ [56,57,58]. This experiment was carried out for the royal blue LED, UV-A LED, cool white lights (LUZCHEM reactor), and solar simulator (HAL–320W). The analysis of the Fe2+ complex photoreduction was carried out using a spectrophotometer (UV-2600 Shimadzu Corp., Kyoto, Japan).

4. Conclusions

In this study, GCNs derived from different precursors (dicyandiamide, melamine, and urea) were successfully synthesized through direct pyrolysis and GCN/silver-based nanocomposites were prepared through a dark-induced/in-situ deposition method. The prepared GCN and GCN/silver-based nanocomposites were characterized using UV-vis diffuse spectroscopy, XRD, SEM, and BET and evaluated for their photocatalytic degradation of 4-CP under royal blue LED irradiation. Among the different precursors, urea-derived GCN showed the best photocatalytic performance due to its large surface area and pore volume. The introduction of silver-based compounds such as AgBr, Ag3PO4, and Ag2CrO4 into urea-derived GCN enhanced its photocatalytic performance, as they increased visible light absorption, improved charge separation, enhanced charge transfer, and reduced the electron–hole pair recombination rate. The 4-CP degradation rate observed with U-GCN/Ag2CrO4 is 52 times higher than GCN alone and 18 times higher than Ag2CrO4 alone. The optimal mass ratio between U-GCN and silver chromate composites was determined to be 1:0.3. In addition to royal blue LED irradiation, U-GCN/Ag2CrO4 was found to be effective in degrading 4-CP under UVA-LED irradiation, cool white lamp irradiation, and solar irradiation. Though U-GCN/0.1Ag2CrO4 and U-GCN/0.3Ag2CrO4 have higher surface areas, pore volumes, and porosity, the possession of dual band gaps and adsorption ability influenced and enhanced the photocatalytic performances of U-GCN/0.3Ag2CrO4 and U-GCN/0.5Ag2CrO4. The degradation rate of 4-CP for the optimal photocatalyst, U-GCN/0.3Ag2CrO4, was 15 times higher than for U-GCN/0.1Ag2CrO4 and 13 times higher than for U-GCN/0.3Ag3PO4. Therefore, for the GCN/silver -based composites, it was the band gap that determined the photocatalytic activity and not the surface area, especially for the composites with two band gaps.

Supplementary Materials

The following supporting information can be downloaded at: https://www.mdpi.com/article/10.3390/catal12030281/s1, Figure S1: N2 adsorption–desorption isotherms and their corresponding pore size distribution curves for the photocatalysts D-GCN, U-GCN, M-GCN, Ag2CrO4, and U-GCN/0.3Ag2CrO4, Figure S2: N2 adsorption–desorption isotherms and their corresponding pore size distribution curves for the photocatalysts U-GCN/0.1Ag2CrO4, U-GCN/0.5Ag2CrO4, U-GCN/0.3Ag, U-GCN/0.3AgBr, and U-GCN/0.3Ag3PO4, Figure S3: XRD patterns for the photocatalysts U-GCN/silver-based composites and U-GCN/silver chromate composites, Figure S4: SEM images for the photocatalysts (a) D-GCN, (b) U-GCN, (c) M-GCN, (d) Ag2CrO4, (e) U-GCN/0.1Ag2CrO4, (f) U-GCN/0.5Ag2CrO4, (g) U-GCN/0.3Ag, (h) U-GCN/0.3AgBr, and (i) U-GCN/0.3Ag3PO4, Figure S5: EDS images for the photocatalysts (a) D-GCN, (b) U-GCN, (c) M-GCN, (d) Ag2CrO4, (e) U-GCN/0.1Ag2CrO4, (f) U-GCN/0.5Ag2CrO4, (g) U-GCN/0.3Ag, (h) U-GCN/0.3AgBr, and (i) U-GCN/0.3Ag3PO4, Figure S6: UV-Vis DRS for the photocatalysts U-GCN/silver-based composites and U-GCN/silver chromate composites, Figure S7: Band gap energies of the photocatalysts (a) GCNs derived from different precursors of dicyandiamide (D), urea (U), and melamine (M); (b) U-GCN/silver-based compounds, all in same ratio of 1:0.3; and (c) U-GCN/xAg2CrO4 where x = 0.1, 0.3, and 0.5, Figure S8: Adsorption performance of the synthesized photocatalysts on 4-CP in dark conditions, Figure S9: XRD pattern of Ag2CrO4, Figure S10: High-resolution SEM image of U-GCN/Ag2CrO4.

Author Contributions

Conceptualization, O.O.A., L.Y. and G.A.; methodology, O.O.A.; experimental design, O.O.A. and L.Y.; formal analysis, O.O.A. and L.Y.; investigation, O.O.A.; resources, G.A.; writing—original draft presentation, O.O.A.; writing—review and editing, L.Y., J.H., M.G.K. and G.A.; supervision, G.A.; project administration, L.Y.; funding acquisition, G.A. All authors have read and agreed to the published version of the manuscript.

Funding

This work was carried out with the support and funding of the Natural Sciences and Engineering Research Council of Canada (NSERC), account number 10029431, and Alberta Innovates under the CASBE program, account number 10035007.

Data Availability Statement

The data presented in this study are available on request from the corresponding author.

Acknowledgments

The authors gratefully acknowledge the funding support provided by the Natural Sciences and Engineering Research Council of Canada (NSERC) and Alberta Innovates under the CASBE program.

Conflicts of Interest

The authors declare no conflict of interest.

References

  1. Jin, M.; Chen, X.; Pan, B. Simultaneous Determination of 19 Chlorophenols in Water by Liquid Chromatography-Mass Spectrometry with Solid-phase Extraction. J. Liq. Chromatogr. Relat. Technol. 2006, 29, 1369–1380. [Google Scholar] [CrossRef]
  2. Khetan, S.K.; Collins, T.J. Human Pharmaceuticals in the Aquatic Environment: A Challenge to Green Chemistry. Chem. Rev. 2007, 107, 2319–2364. [Google Scholar] [CrossRef] [PubMed]
  3. Canada, H. Chlorophenols. Available online: https://www.canada.ca/en/health-canada/services/publications/healthy-living/chlorophenols.html (accessed on 18 June 2021).
  4. Gómez, M.; Murcia, M.D.; Dams, R.; Christofi, N.; Gómez, E.; Gómez, J.L. Removal Efficiency and Toxicity Reduction of 4-Chlorophenol with Physical, Chemical and Biochemical Methods. Environ. Technol. 2012, 33, 1055–1064. [Google Scholar] [CrossRef]
  5. Kuśmierek, K.; Świątkowski, A. Removal of Chlorophenols from Aqueous Solutions by Sorption onto Walnut, Pistachio and Hazelnut Shells. Pol. J. Chem. Technol. 2015, 17, 23–31. [Google Scholar] [CrossRef] [Green Version]
  6. Goodwin, L.; Carra, I.; Campo, P.; Soares, A. Treatment Options for Reclaiming Wastewater Produced by the Pesticide Industry. Int. J. Water Wastewater Treat. 2018, 4, 1–15. [Google Scholar] [CrossRef]
  7. Villegas, L.G.C.; Mashhadi, N.; Chen, M.; Mukherjee, D.; Taylor, K.E.; Biswas, N. A Short Review of Techniques for Phenol Removal from Wastewater. Curr. Pollut. Rep. 2016, 2, 157–167. [Google Scholar] [CrossRef] [Green Version]
  8. Yang, Y.; Li, X.; Zhou, C.; Xiong, W.; Zeng, G.; Huang, D.; Zhang, C.; Wang, W.; Song, B.; Tang, X.; et al. Recent Advances in Application of Graphitic Carbon Nitride-Based Catalysts for Degrading Organic Contaminants in Water through Advanced Oxidation Processes beyond Photocatalysis: A Critical Review. Water Res. 2020, 184, 116200. [Google Scholar] [CrossRef]
  9. Ren, G.; Han, H.; Wang, Y.; Liu, S.; Zhao, J.; Meng, X.; Li, Z. Recent Advances of Photocatalytic Application in Water Treatment: A Review. Nanomaterials 2021, 11, 1804. [Google Scholar] [CrossRef]
  10. Suriyachai, N.; Chuangchote, S.; Laosiripojana, N.; Champreda, V.; Sagawa, T. Synergistic Effects of Co-Doping on Photocatalytic Activity of Titanium Dioxide on Glucose Conversion to Value-Added Chemicals. ACS Omega 2020, 5, 20373–20381. [Google Scholar] [CrossRef]
  11. Nashim, A.; Martha, S.; Parida, K.M. Gd2/Ti2O7/In2O3: Efficient Visible-Light-Driven Heterojunction-Based Composite Photocatalysts for Hydrogen Production. ChemCatChem 2013, 5, 2352–2359. [Google Scholar] [CrossRef]
  12. Zhou, C.; Zeng, Z.; Zeng, G.; Huang, D.; Xiao, R.; Cheng, M.; Zhang, C.; Xiong, W.; Lai, C.; Yang, Y.; et al. Visible-Light-Driven Photocatalytic Degradation of Sulfamethazine by Surface Engineering of Carbon Nitride: Properties, Degradation Pathway and Mechanisms. J. Hazard. Mater. 2019, 380, 120815. [Google Scholar] [CrossRef] [PubMed]
  13. Wang, Y.; Wang, X.; Antonietti, M. Polymeric Graphitic Carbon Nitride as a Heterogeneous Organocatalyst: From Photochemistry to Multipurpose Catalysis to Sustainable Chemistry. Angew. Chem. Int. Ed. 2012, 51, 68–89. [Google Scholar] [CrossRef] [PubMed]
  14. Zheng, Y.; Zhang, Z.; Li, C. A Comparison of Graphitic Carbon Nitrides Synthesized from Different Precursors through Pyrolysis. J. Photochem. Photobiol. Chem. 2017, 332, 32–44. [Google Scholar] [CrossRef]
  15. Zhang, W.; Zhang, Q.; Dong, F.; Zhao, Z. The Multiple Effects of Precursors on the Properties of Polymeric Carbon Nitride. Int. J. Photoenergy 2013, 2013, 685038 . [Google Scholar] [CrossRef] [Green Version]
  16. Yan, S.C.; Li, Z.S.; Zou, Z.G. Photodegradation Performance of G-C3N4 Fabricated by Directly Heating Melamine. Langmuir 2009, 25, 10397–10401. [Google Scholar] [CrossRef]
  17. Wu, S.-Z.; Chen, C.-H.; Zhang, W.-D. Etching Graphitic Carbon Nitride by Acid for Enhanced Photocatalytic Activity toward Degradation of 4-Nitrophenol. Chin. Chem. Lett. 2014, 25, 1247–1251. [Google Scholar] [CrossRef]
  18. Li, Y.; Zhang, H.; Liu, P.; Wang, D.; Li, Y.; Zhao, H. Cross-Linked g-C3N4 /RGO Nanocomposites with Tunable Band Structure and Enhanced Visible Light Photocatalytic Activity. Small 2013, 9, 3336–3344. [Google Scholar] [CrossRef] [Green Version]
  19. Zhang, Z.; Huang, J.; Zhang, M.; Yuan, Q.; Dong, B. Ultrathin Hexagonal SnS2 Nanosheets Coupled with G-C3N4 Nanosheets as 2D/2D Heterojunction Photocatalysts toward High Photocatalytic Activity. Appl. Catal. B Environ. 2015, 163, 298–305. [Google Scholar] [CrossRef]
  20. Ren, Y.; Zhao, Q.; Li, X.; Xiong, W.; Tade, M.; Liu, L. 2D Porous Graphitic C3N4 Nanosheets/Ag3PO4 Nanocomposites for Enhanced Visible-Light Photocatalytic Degradation of 4-Chlorophenol. J. Nanopart Res. 2014, 16, 2532. [Google Scholar] [CrossRef]
  21. Deng, J.; Liang, J.; Li, M.; Tong, M. Enhanced Visible-Light-Driven Photocatalytic Bacteria Disinfection by g-C3N4-AgBr. Colloids Surf. B Biointerfaces 2017, 152, 49–57. [Google Scholar] [CrossRef]
  22. Faisal, M.; Ismail, A.A.; Harraz, F.A.; Al-Sayari, S.A.; El-Toni, A.M.; Al-Assiri, M.S. Synthesis of Highly Dispersed Silver Doped G-C3N4 Nanocomposites with Enhanced Visible-Light Photocatalytic Activity. Mater. Des. 2016, 98, 223–230. [Google Scholar] [CrossRef]
  23. Thommes, M.; Kaneko, K.; Neimark, A.V.; Olivier, J.P.; Rodriguez-Reinoso, F.; Rouquerol, J.; Sing, K.S.W. Physisorption of Gases, with Special Reference to the Evaluation of Surface Area and Pore Size Distribution (IUPAC Technical Report). Pure Appl. Chem. 2015, 87, 1051–1069. [Google Scholar] [CrossRef] [Green Version]
  24. Zhang, Y.; Liu, J.; Wu, G.; Chen, W. Porous Graphitic Carbon Nitride Synthesized via Direct Polymerization of Urea for Efficient Sunlight-Driven Photocatalytic Hydrogen Production. Nanoscale 2012, 4, 5300. [Google Scholar] [CrossRef]
  25. Zhang, G.; Zhang, J.; Zhang, M.; Wang, X. Polycondensation of Thiourea into Carbon Nitride Semiconductors as Visible Light Photocatalysts. J. Mater. Chem. 2012, 22, 8083. [Google Scholar] [CrossRef]
  26. Cui, Y.; Huang, J.; Fu, X.; Wang, X. Metal-Free Photocatalytic Degradation of 4-Chlorophenol in Water by Mesoporous Carbon Nitride Semiconductors. Catal. Sci. Technol. 2012, 2, 1396. [Google Scholar] [CrossRef]
  27. Ji, H.; Chang, F.; Hu, X.; Qin, W.; Shen, J. Photocatalytic Degradation of 2,4,6-Trichlorophenol over g-C3N4 under Visible Light Irradiation. Chem. Eng. J. 2013, 218, 183–190. [Google Scholar] [CrossRef]
  28. Shi, L.; Liang, L.; Wang, F.; Liu, M.; Sun, J. Ag2CrO4 Nanoparticles Loaded on Two-Dimensional Large Surface Area Graphite-like Carbon Nitride Sheets: Simple Synthesis and Excellent Photocatalytic Performance. Dalton Trans. 2016, 45, 5815–5824. [Google Scholar] [CrossRef]
  29. Shen, J.; Lu, Y.; Liu, J.-K.; Yang, X.-H. Photocatalytic Activity of Silver Chromate Materials by Various Synthesis Methods. J. Exp. Nanosci. 2016, 11, 650–659. [Google Scholar] [CrossRef] [Green Version]
  30. Zhao, Z.; Ma, Y.; Fan, J.; Xue, Y.; Chang, H.; Masubuchi, Y.; Yin, S. Synthesis of Graphitic Carbon Nitride from Different Precursors by Fractional Thermal Polymerization Method and Their Visible Light Induced Photocatalytic Activities. J. Alloys Compd. 2018, 735, 1297–1305. [Google Scholar] [CrossRef]
  31. De Sousa, J.G.M.; da Silva, T.V.C.; de Moraes, N.P.; Caetano Pinto da Silva, M.L.; da Silva Rocha, R.; Landers, R.; Rodrigues, L.A. Visible Light-Driven ZnO/g-C3N4/Carbon Xerogel Ternary Photocatalyst with Enhanced Activity for 4-Chlorophenol Degradation. Mater. Chem. Phys. 2020, 256, 123651. [Google Scholar] [CrossRef]
  32. Xu, D.; Cao, S.; Zhang, J.; Cheng, B.; Yu, J. Effects of the Preparation Method on the Structure and the Visible-Light Photocatalytic Activity of Ag2CrO 4. Beilstein J. Nanotechnol. 2014, 5, 658–666. [Google Scholar] [CrossRef] [PubMed] [Green Version]
  33. Soofivand, F.; Mohandes, F.; Salavati-Niasari, M. Silver Chromate and Silver Dichromate Nanostructures: Sonochemical Synthesis, Characterization, and Photocatalytic Properties. Mater. Res. Bull. 2013, 48, 2084–2094. [Google Scholar] [CrossRef]
  34. Shen, Y.; Dos santos-Garcia, A.J.; Martín de Vidales, M.J. Graphitic Carbon Nitride-Based Composite in Advanced Oxidation Processes for Aqueous Organic Pollutants Removal: A Review. Processes 2020, 9, 66. [Google Scholar] [CrossRef]
  35. Yang, P.; Wang, J.; Yue, G.; Yang, R.; Zhao, P.; Yang, L.; Zhao, X.; Astruc, D. Constructing Mesoporous G-C3N4/ZnO Nanosheets Catalyst for Enhanced Visible-Light Driven Photocatalytic Activity. J. Photochem. Photobiol. Chem. 2020, 388, 112169. [Google Scholar] [CrossRef]
  36. Liu, Z.; Jiang, Y.; Liu, X.; Zeng, G.; Shao, B.; Liu, Y.; Liu, Y.; Zhang, W.; Zhang, W.; Yan, M.; et al. Silver Chromate Modified Sulfur Doped Graphitic Carbon Nitride Microrod Composites with Enhanced Visible-Light Photoactivity towards Organic Pollutants Degradation. Compos. Part B Eng. 2019, 173, 106918. [Google Scholar] [CrossRef]
  37. Padmanabhan, S.K.; Pal, S.; Licciulli, A. Diatomite/Silver Phosphate Composite for Efficient Degradation of Organic Dyes under Solar Radiation. Bull. Mater. Sci. 2020, 43, 295. [Google Scholar] [CrossRef]
  38. Ghattavi, S.; Nezamzadeh-Ejhieh, A. GC-MASS Detection of Methyl Orange Degradation Intermediates by AgBr/g-C3N4: Experimental Design, Bandgap Study, and Characterization of the Catalyst. Int. J. Hydrog. Energy 2020, 45, 24636–24656. [Google Scholar] [CrossRef]
  39. Paul, D.R.; Sharma, R.; Panchal, P.; Nehra, S.P.; Gupta, A.P.; Sharma, A. Synthesis, Characterization and Application of Silver Doped Graphitic Carbon Nitride as Photocatalyst towards Visible Light Photocatalytic Hydrogen Evolution. Int. J. Hydrog. Energy 2020, 45, 23937–23946. [Google Scholar] [CrossRef]
  40. Zarei, M. Ultrasonic-Assisted Preparation of ZrO2/g-C3N4 Nanocomposites with High Visible-Light Photocatalytic Activity for Degradation of 4-Chlorophenol in Water. Water-Energy Nexus 2020, 3, 135–142. [Google Scholar] [CrossRef]
  41. Huang, Z.; Chen, Z.; Qayum, A.; Zhao, X.; Xia, H.; Lu, F.; Hu, L. Enhanced Photocatalytic Degradation of 4-Chlorophenol under Visible Light over Carbon Nitride Nanosheets with Carbon Vacancies. Nanotechnology 2021, 32, 415704. [Google Scholar] [CrossRef]
  42. UV LEDs Ramp up the Quiet Side of the LED Market (MAGAZINE). Available online: https://www.ledsmagazine.com/manufacturing-services-testing/research-development/article/16695464/uv-leds-ramp-up-the-quiet-side-of-the-led-market-magazine (accessed on 2 September 2021).
  43. Muramoto, Y.; Kimura, M.; Nouda, S. Development and Future of Ultraviolet Light-Emitting Diodes: UV-LED Will Replace the UV Lamp. Semicond Sci. Technol. 2014, 29, 084004. [Google Scholar] [CrossRef] [Green Version]
  44. Elghniji, K.; Hentati, O.; Mlaik, N.; Mahfoudh, A.; Ksibi, M. Photocatalytic Degradation of 4-Chlorophenol under P-Modified TiO2/UV System: Kinetics, Intermediates, Phytotoxicity and Acute Toxicity. J. Environ. Sci. 2012, 24, 479–487. [Google Scholar] [CrossRef]
  45. Li, X.; Cubbage, J.W.; Tetzlaff, T.A.; Jenks, W.S. Photocatalytic Degradation of 4-Chlorophenol. 1. The Hydroquinone Pathway. J. Org. Chem. 1999, 64, 8509–8524. [Google Scholar] [CrossRef]
  46. Li, X.; Cubbage, J.W.; Jenks, W.S. Photocatalytic Degradation of 4-Chlorophenol. 2. The 4-Chlorocatechol Pathway. J. Org. Chem. 1999, 64, 8525–8536. [Google Scholar] [CrossRef]
  47. Abeish, A.M.; Ang, H.M.; Znad, H. Solar Photocatalytic Degradation of 4-Chlorophenol: Mechanism and Kinetic Modelling. Desalination Water Treat. 2015, 53, 2915–2923. [Google Scholar] [CrossRef]
  48. Shi, L.; Liang, L.; Wang, F.; Liu, M.; Sun, J. Facile Synthesis of a G-C3N4 Isotype Composite with Enhanced Visible-Light Photocatalytic Activity. RSC Adv. 2015, 5, 101843–101849. [Google Scholar] [CrossRef]
  49. Zhang, W.; Sun, Y.; Dong, F.; Zhang, W.; Duan, S.; Zhang, Q. Facile Synthesis of Organic–Inorganic Layered Nanojunctions of g-C3N4 /(BiO)2CO3 as Efficient Visible Light Photocatalyst. Dalton Trans. 2014, 43, 12026–12036. [Google Scholar] [CrossRef]
  50. Che, Y.; Lu, B.; Qi, Q.; Chang, H.; Zhai, J.; Wang, K.; Liu, Z. Bio-Inspired Z-Scheme g-C3N4/Ag2CrO4 for Efficient Visible-Light Photocatalytic Hydrogen Generation. Sci. Rep. 2018, 8, 16504. [Google Scholar] [CrossRef]
  51. Dong, P.; Wang, Y.; Cao, B.; Xin, S.; Guo, L.; Zhang, J.; Li, F. Ag3PO4/Reduced Graphite Oxide Sheets Nanocomposites with Highly Enhanced Visible Light Photocatalytic Activity and Stability. Appl. Catal. B Environ. 2013, 132–133, 45–53. [Google Scholar] [CrossRef]
  52. Obregón, S. Improved H2 Production of Pt-TiO2/g-C3N4-MnOx Composites by an Efficient Handling of Photogenerated Charge Pairs. Appl. Catal. B Environ. 2014, 144, 775–782. [Google Scholar] [CrossRef]
  53. Xu, J.; Li, Y.; Peng, S.; Lu, G.; Li, S. Eosin Y-Sensitized Graphitic Carbon Nitride Fabricated by Heating Urea for Visible Light Photocatalytic Hydrogen Evolution: The Effect of the Pyrolysis Temperature of Urea. Phys. Chem. Chem. Phys. 2013, 15, 7657. [Google Scholar] [CrossRef] [PubMed]
  54. Kumar, N.; Chauhan, N.S.; Mittal, A.; Sharma, S. TiO2 and Its Composites as Promising Biomaterials: A Review. BioMetals 2018, 31, 147–159. [Google Scholar] [CrossRef] [PubMed]
  55. Makuła, P.; Pacia, M.; Macyk, W. How to Correctly Determine the Band Gap Energy of Modified Semiconductor Photocatalysts Based on UV–Vis Spectra. J. Phys. Chem. Lett. 2018, 9, 6814–6817. [Google Scholar] [CrossRef] [Green Version]
  56. Hatchard, C.G.; Parker, C.A. A New Sensitive Chemical Actinometer—II. Potassium Ferrioxalate as a Standard Chemical Actinometer. Proc. R. Soc. Lond. Ser. Math. Phys. Sci. 1956, 235, 518–536. [Google Scholar] [CrossRef]
  57. Watanabe, K.; Matsuda, S.; Cuevas, C.A.; Saiz-Lopez, A.; Yabushita, A.; Nakano, Y. Experimental Determination of the Photooxidation Of Aqueous I as a Source of Atmospheric I2. ACS Earth Space Chem. 2019, 3, 669–679. [Google Scholar] [CrossRef]
  58. Yu, L.; Achari, G.; Langford, C.H. LED-Based Photocatalytic Treatment of Pesticides and Chlorophenols. J. Environ. Eng. 2013, 139, 1146–1151. [Google Scholar] [CrossRef]
Figure 1. Characterization of GCN and GCN-based nanocomposites: (a) XRD, (b) SEM for U-GCN/0.3Ag2CrO4, (c) EDS, and (d) DRS.
Catalysts 12 00281 g001
Figure 2. Photocatalytic degradation of 4-CP using GCNs derived from different precursors and GCN/silver compounds-based nanocomposites under royal blue LED (450 nm) irradiation.
Catalysts 12 00281 g002
Figure 3. Photocatalytic degradation of 4-CP using different photoreactors (Co = 20 mg/L, CU-GCN/0.3Ag2CrO4 = 1000 mg/L).
Catalysts 12 00281 g003
Figure 4. Schematic representation for the proposed mechanism for 4-CP photocatalytic degradation using U-GCN/Ag2CrO4 nanocomposite under royal blue LED irradiation.
Catalysts 12 00281 g004
Figure 5. Synthesis procedures of GCN and GCN-based composites.
Catalysts 12 00281 g005
Table 1. BET surface area, BJH pore volume, and BJH average pore size.
PhotocatalystBET Surface Area (m2/g)BJH Pore Volume (cm3/g)BJH Average Pore Size (nm)
M-GCN2.950.0225.92
D-GCN8.790.0520.76
U-GCN57.680.3023.78
Ag2CrO41.320.0197.96
U-GCN/0.1Ag2CrO460.380.3527.15
U-GCN/0.3Ag2CrO442.680.2326.78
U-GCN/0.5Ag2CrO444.670.2524.52
U-GCN/0.3Ag41.850.2123.87
U-GCN/0.3AgBr48.020.2423.70
U-GCN/0.3Ag3PO467.380.3930.29
Table 2. Band gaps and the corresponding wavelengths of the synthesized photocatalysts.
PhotocatalystBandgap Energy
(eV)
Wavelength
(nm)
M-GCN2.68462
D-GCN2.67464
U-GCN2.75450
Ag2CrO41.80689
U-GCN/0.1Ag2CrO42.75450
U-GCN/0.3Ag2CrO42.74, 1.78452, 698
U-GCN/0.5Ag2CrO42.73, 1.75454, 708
U-GCN/0.3Ag2.73454
U-GCN/0.3AgBr2.74452
U-GCN/0.3Ag3PO42.72455
Table 3. Comparison of 4-CP photocatalytic degradation with the results of previously published articles.
S/NPhotocatalystSynthesis MethodLight SourceCatalyst Amount (mg)Conc. of 4-CP in Solution (mg/L)Degradation Time (min)Degradation Efficiency (%)Rate
Constant (min−1)
Ref.
1mpg-CNTemplate300 W Xe lamp4015.460~1005.26 × 10−2[26]
2CN/APOPrecipitation500 W Xe lamp502018096.51.80 × 10−2[20]
3ZrO2/g-C3N4Ultrasonication 300 W Xe lamp6030120~901.73 × 10⁻²[40]
4ZnO/g-C3N4/carbon xerogelPrecipitationSolar simulator: 300 W lamp
Visible light: 400 W lamp
1001030092
72
1.20 × 10⁻²
0.51 × 10⁻²
[31]
5Vc-GCNCalcination300 W Xe lamp501012060.80.79 × 10−2[41]
6U-GCN/0.3Ag2CrO4Precipitation460 nm Royal blue LED402018098.262.64 × 10−2Current study
Table 4. The photo energy (Ephoton) required to achieve a log reduction of 4-CP.
PhotoreactorEphoton (J)
Solar simulator8960
Cool white light1366
UV-A LED 514
Royal blue LED1364
Publisher’s Note: MDPI stays neutral with regard to jurisdictional claims in published maps and institutional affiliations.

