
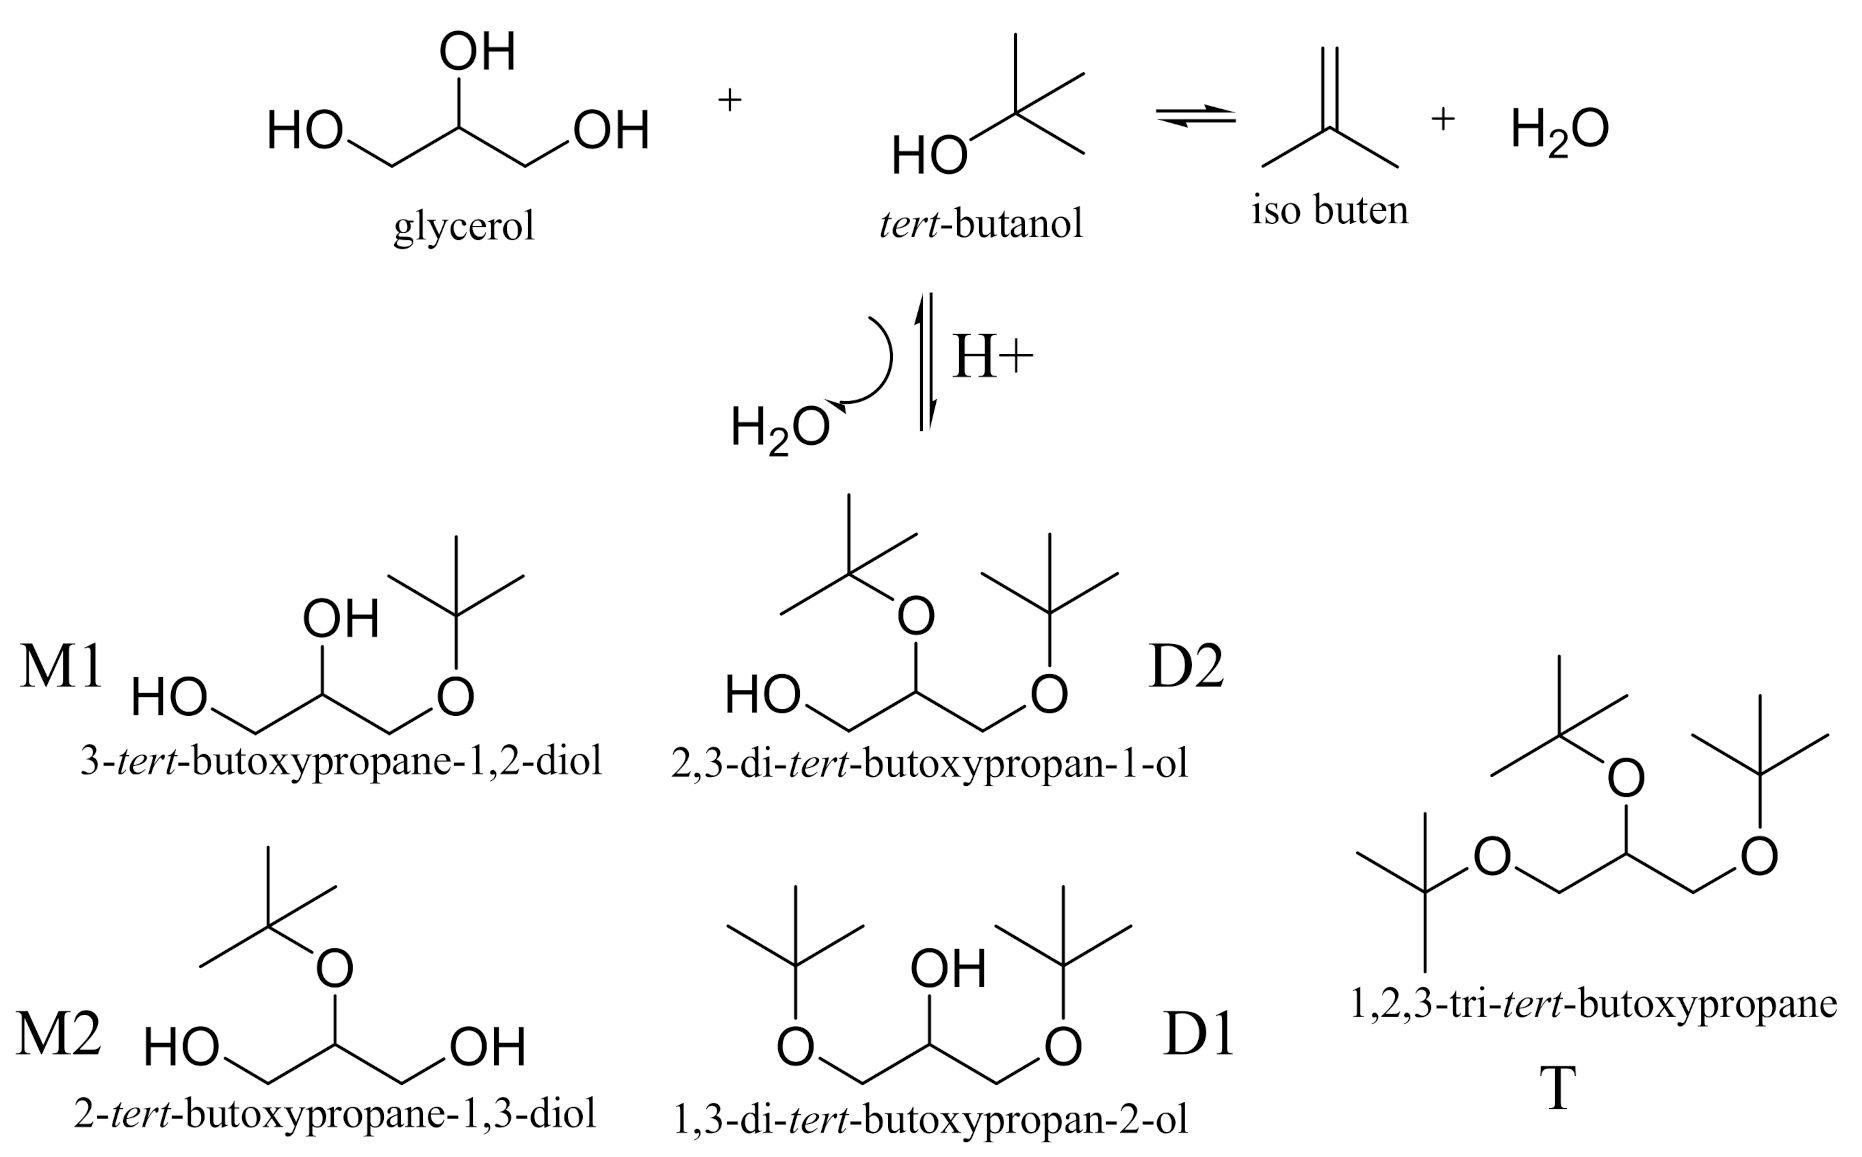
Acidity and Stability of Brønsted Acid Sites in Green Clinoptilolite Catalysts and Catalytic Performance in the Etherification of Glycerol

 , , ,
, , ,
Abstract
:1. Introduction
2. Results and Discussion
2.1. Materials
2.2. Preparation
2.2.1. Preparation of NH4CLIN
2.2.2. Preparation of the Acid H-form HCLIN
2.3. Methods
2.4. Catalysis
2.5. Analysis
2.6. Characterisation
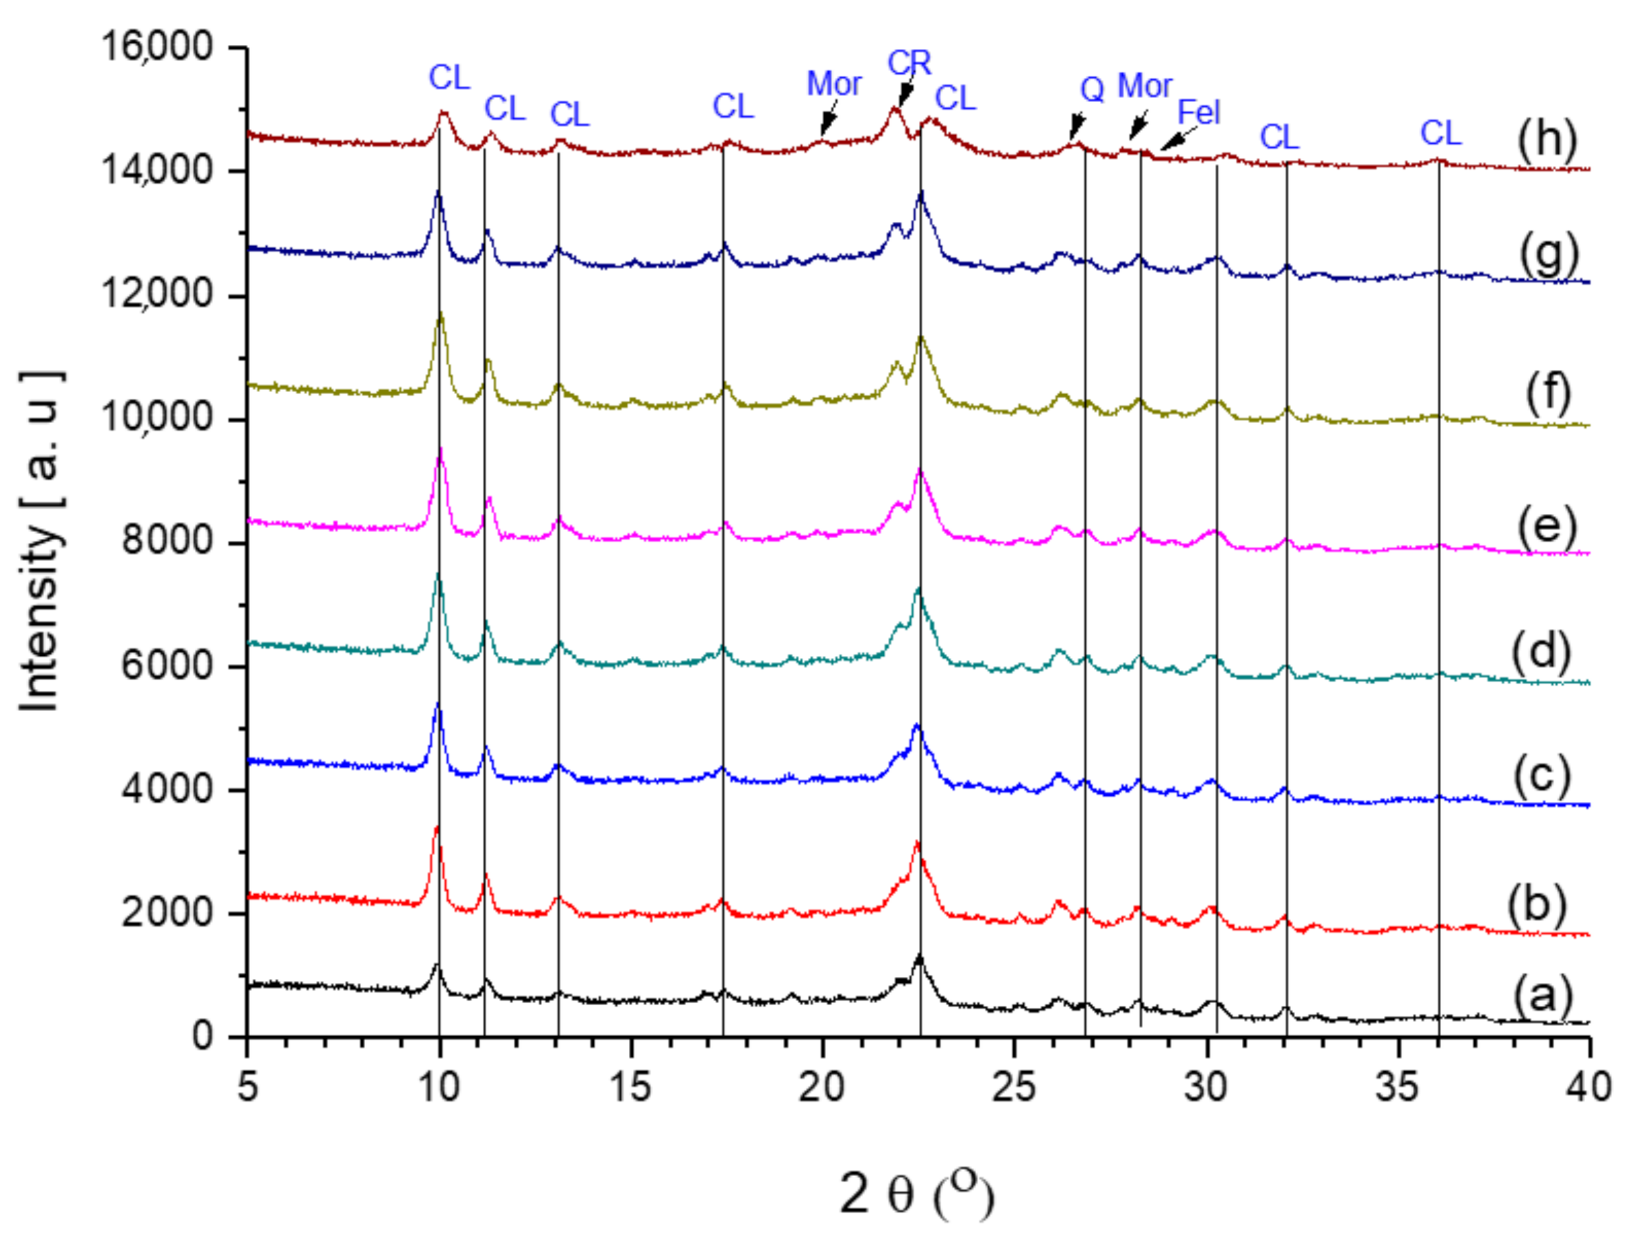
2.6.1. XRD
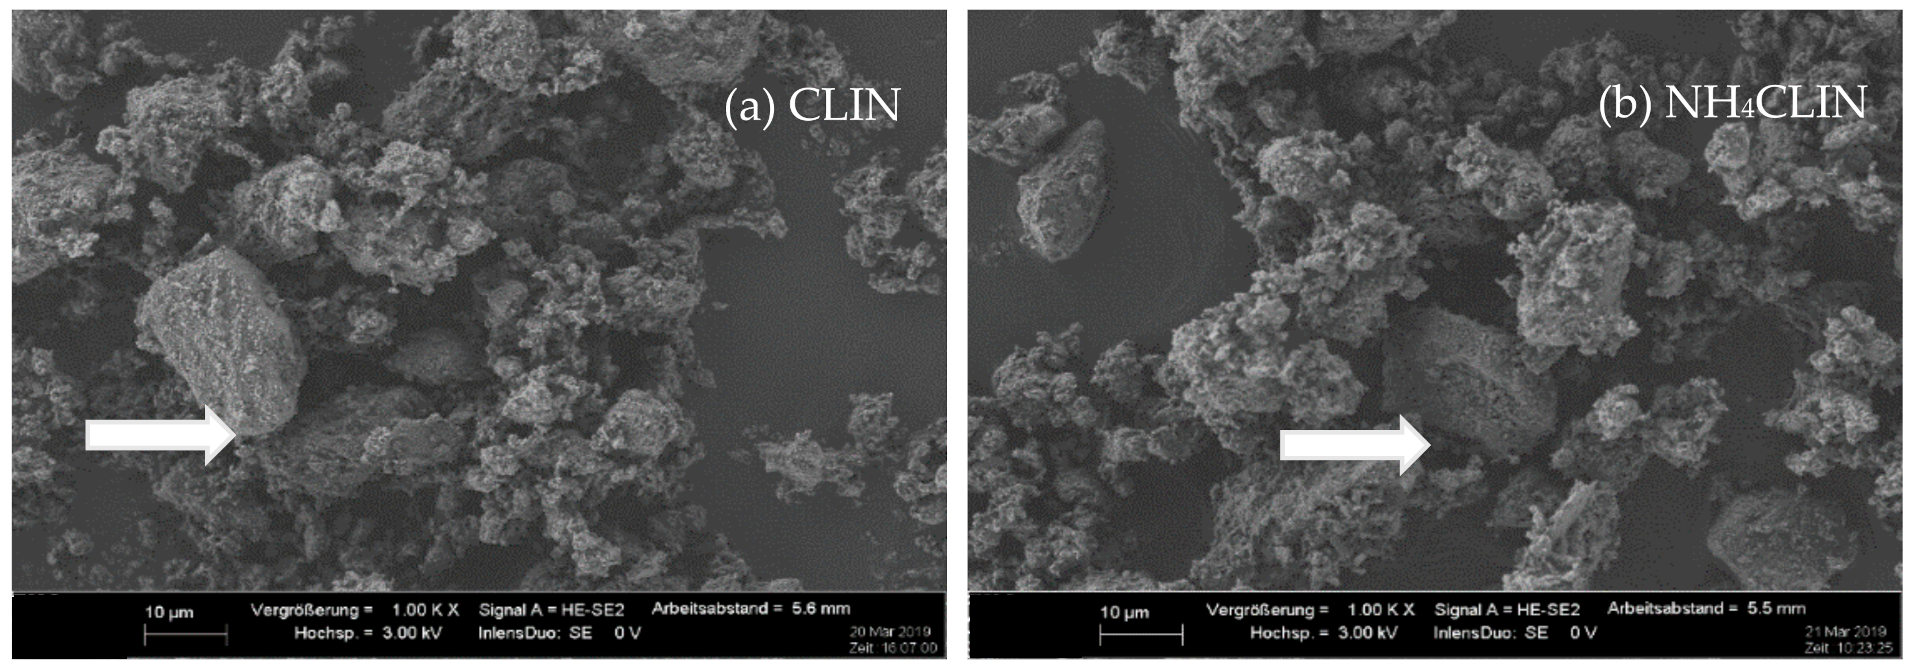
2.6.2. Scanning Electron Microscopy (SEM)
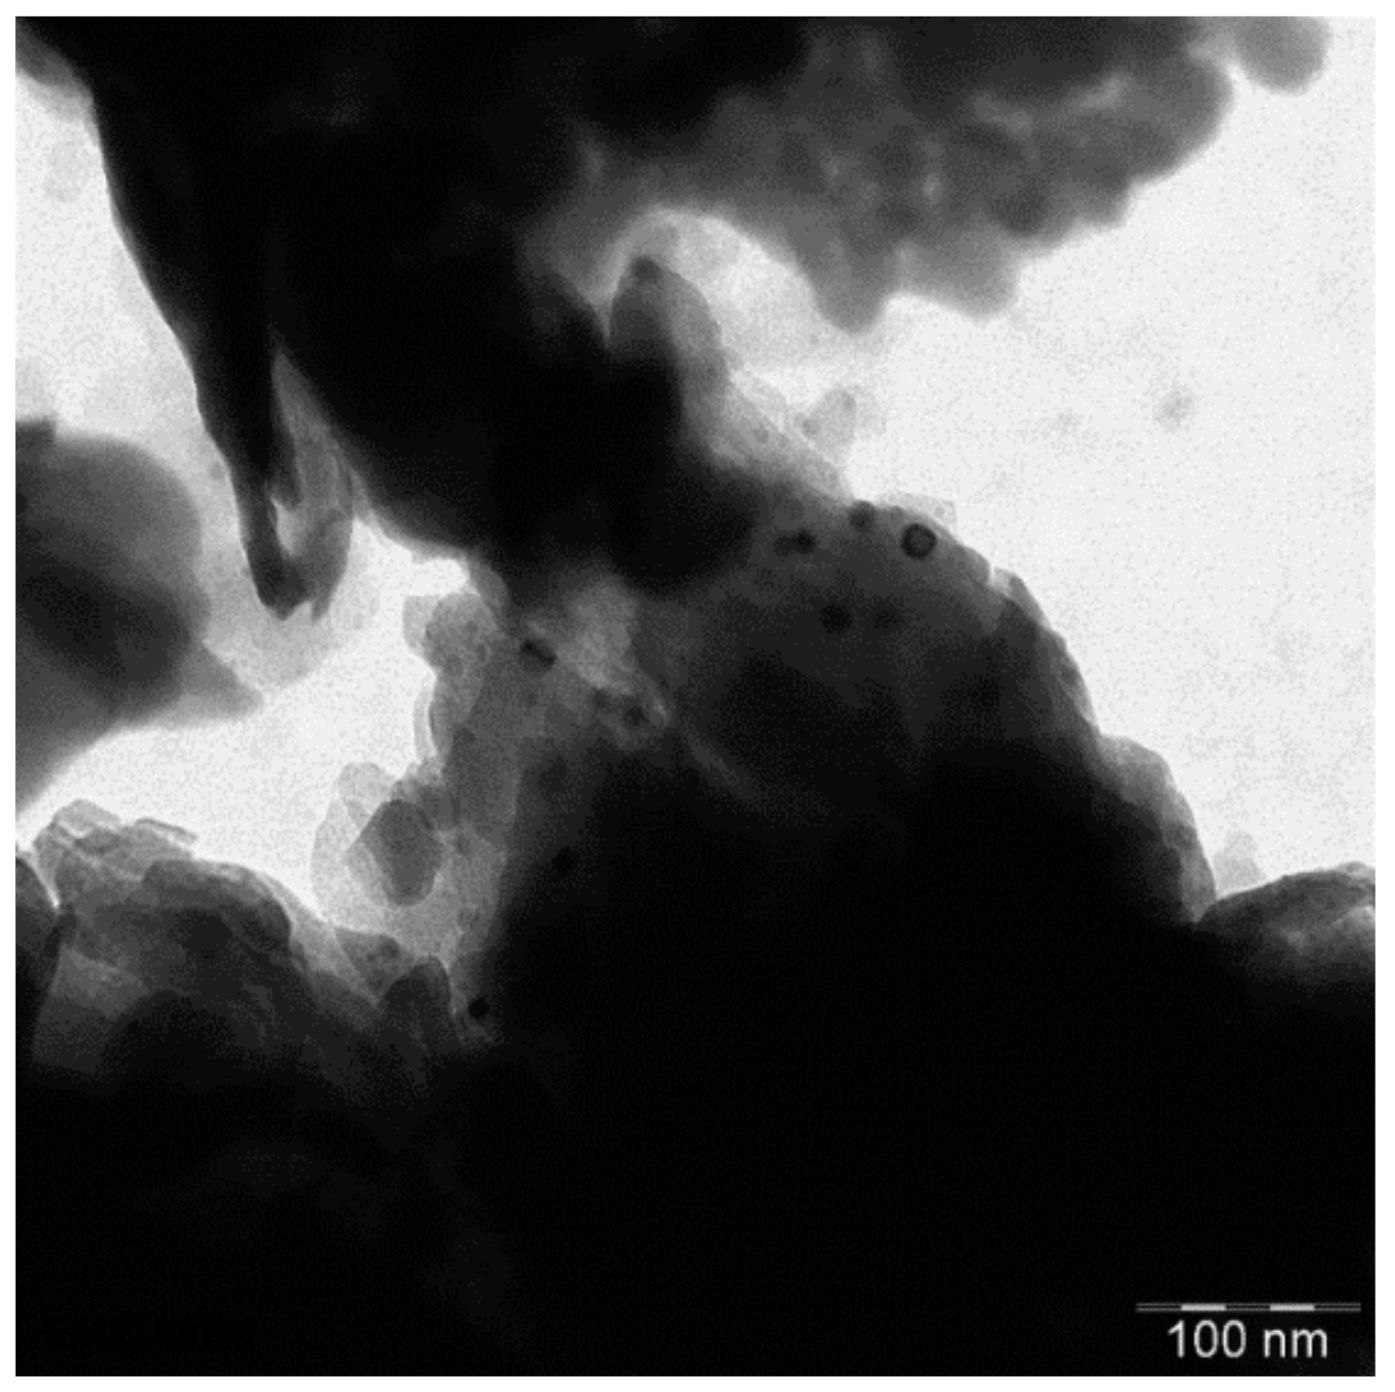
2.6.3. TEM
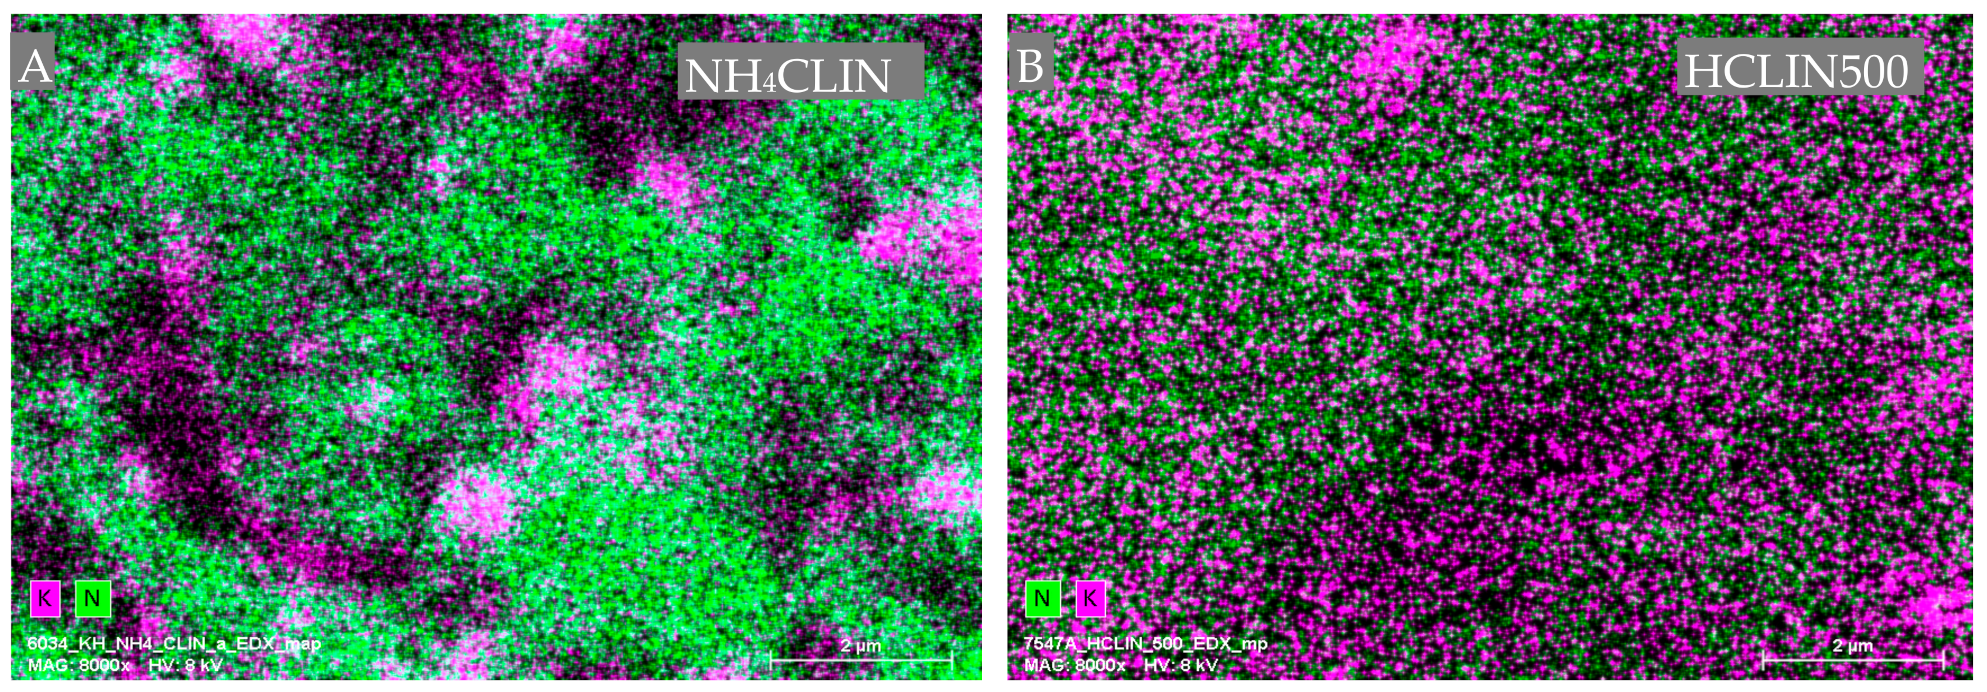
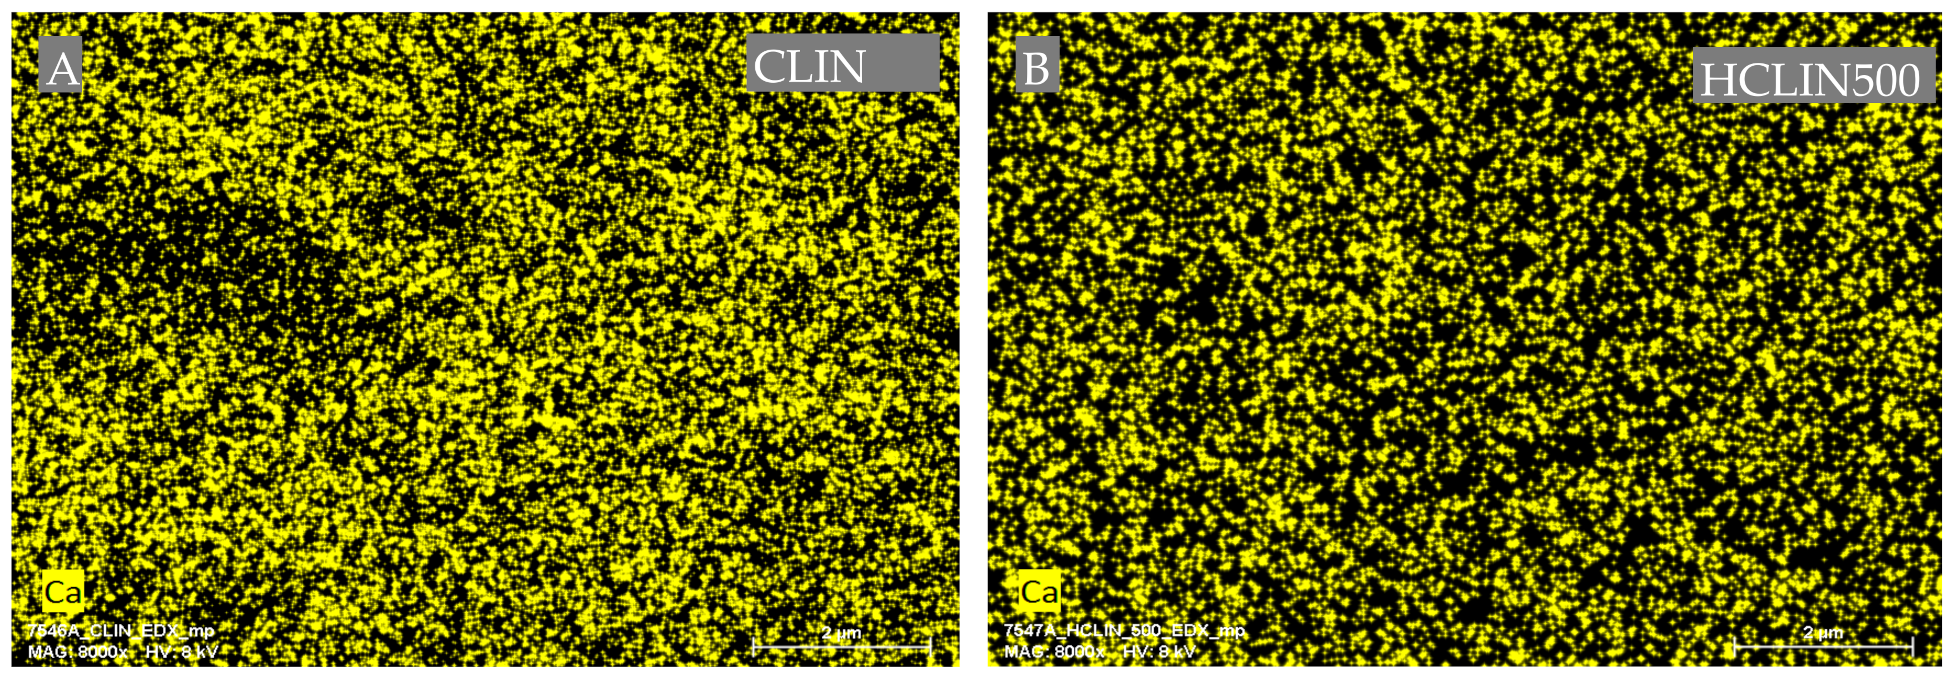
2.6.4. EDX
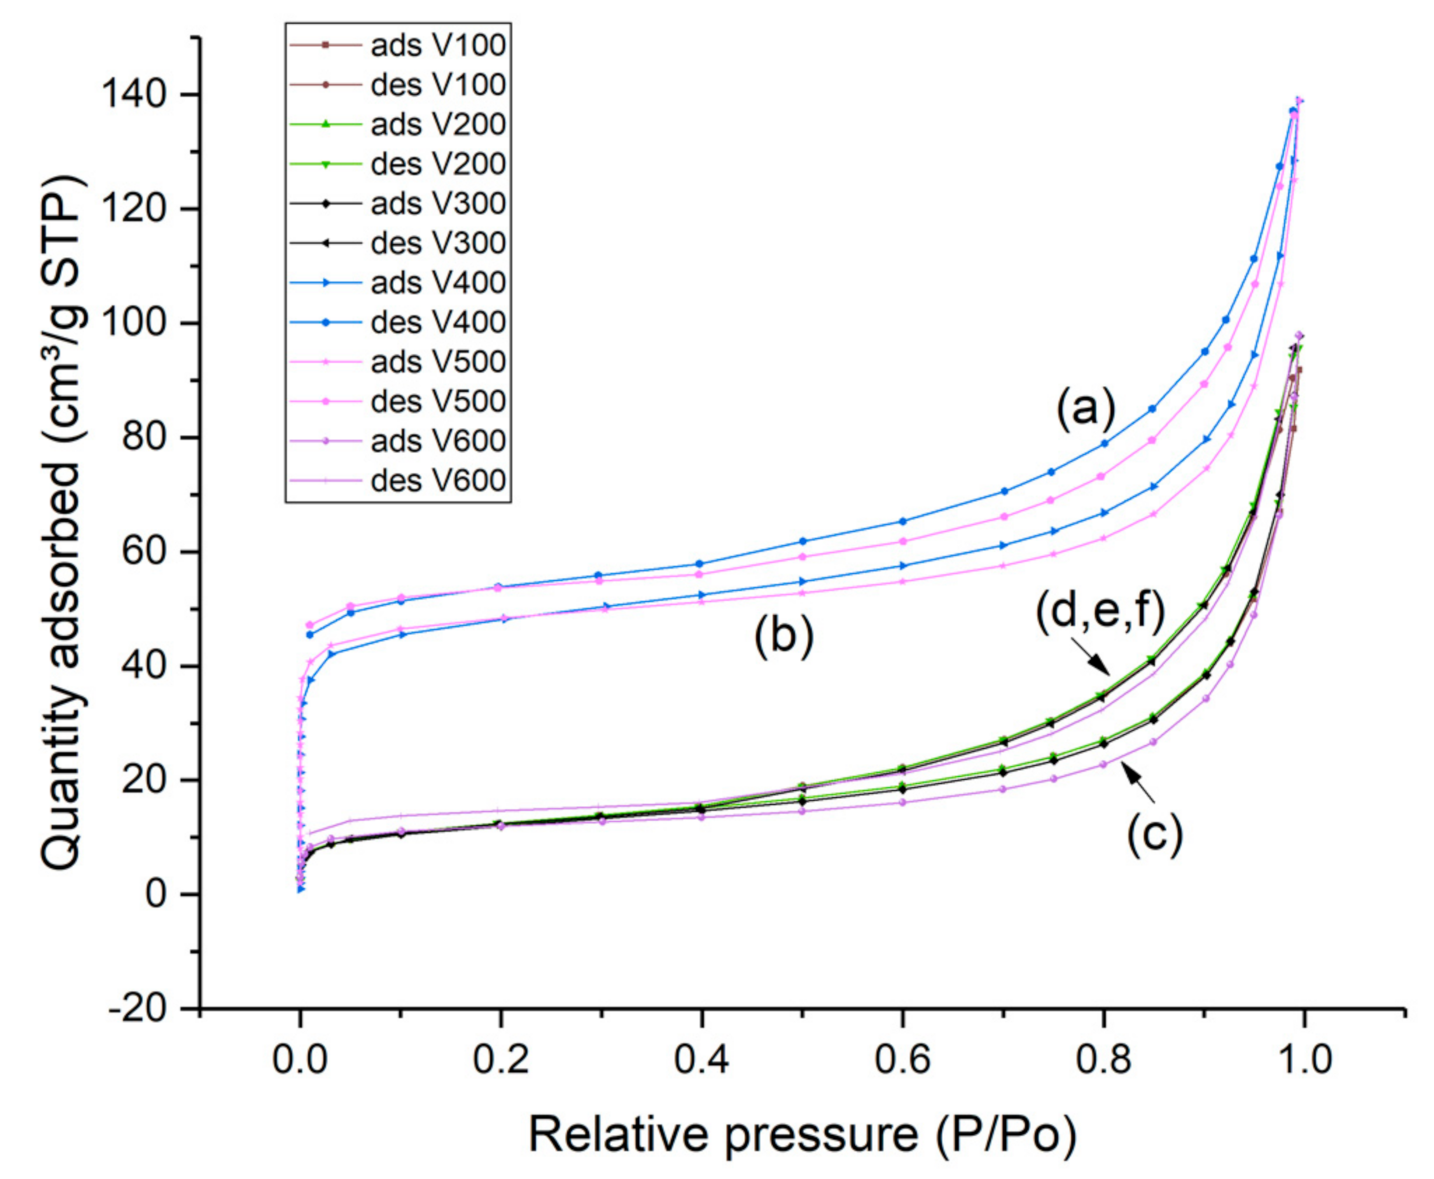
2.6.5. Nitrogen Adsorption and Desorption Measurements
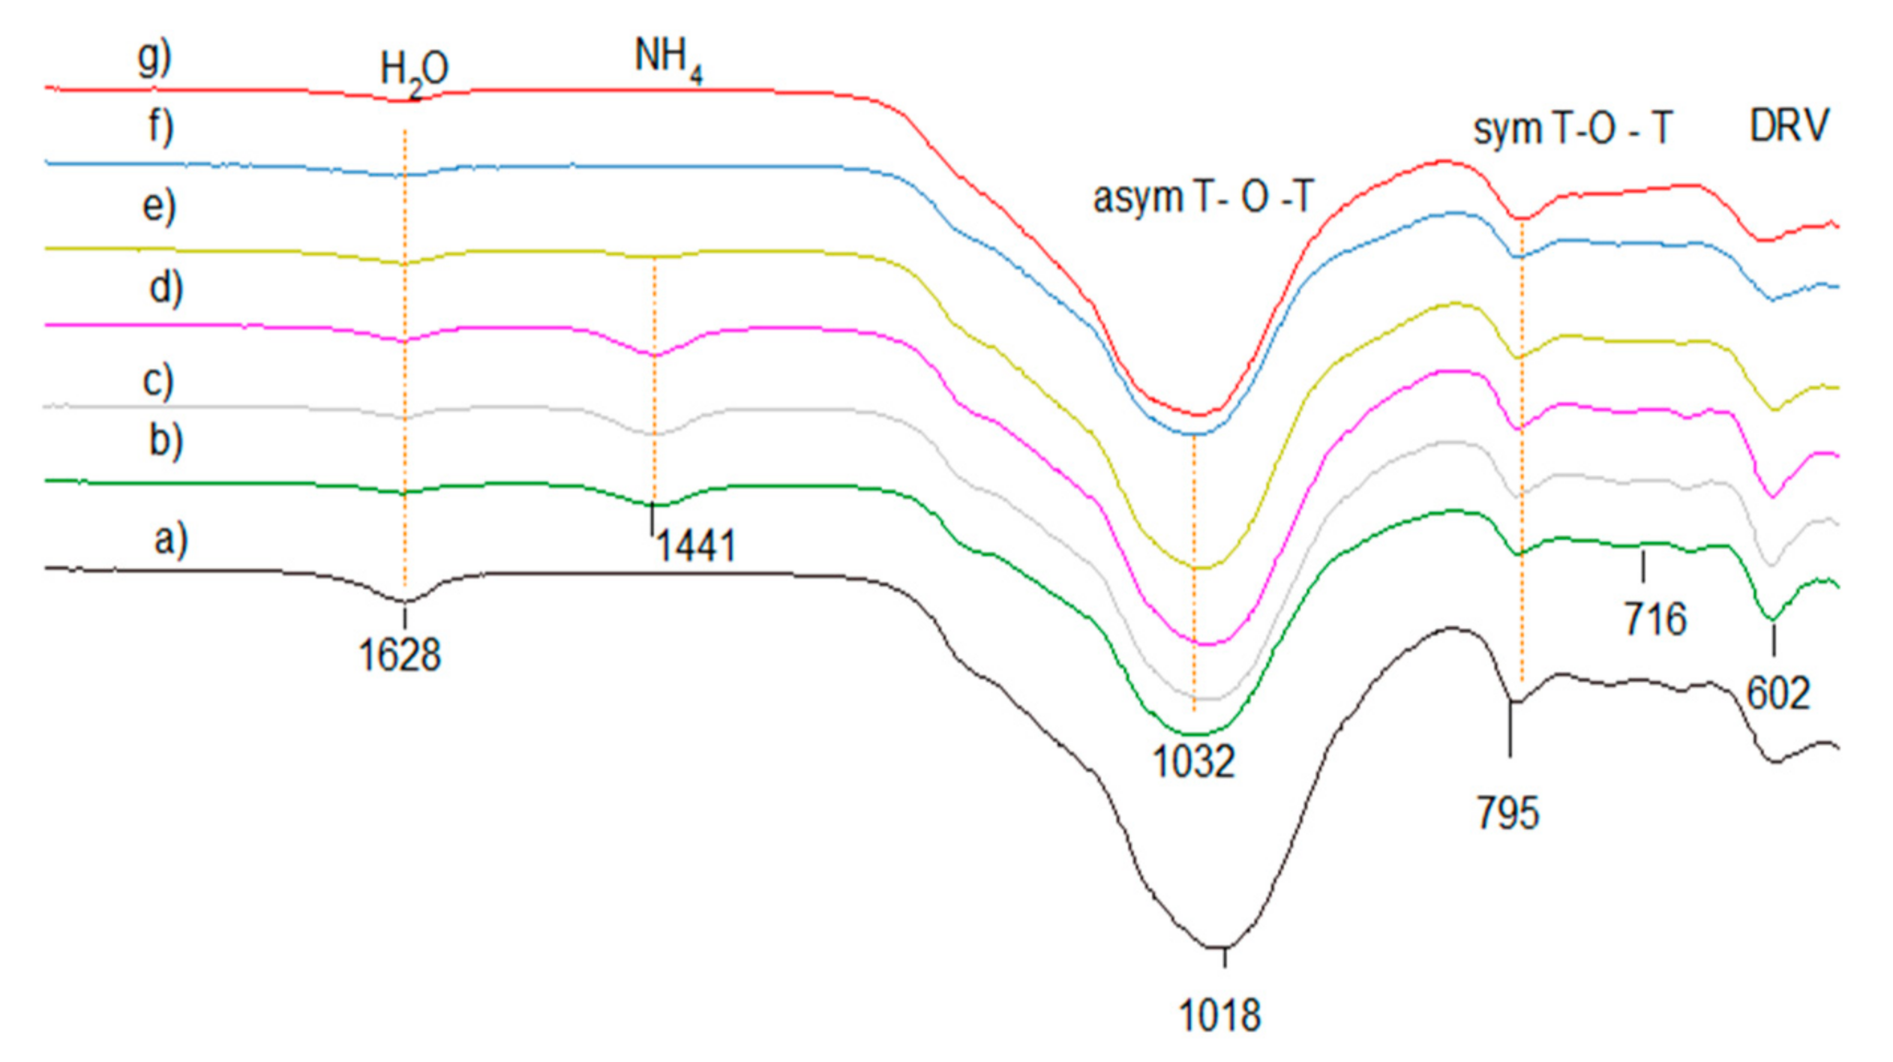
2.6.6. FTIR
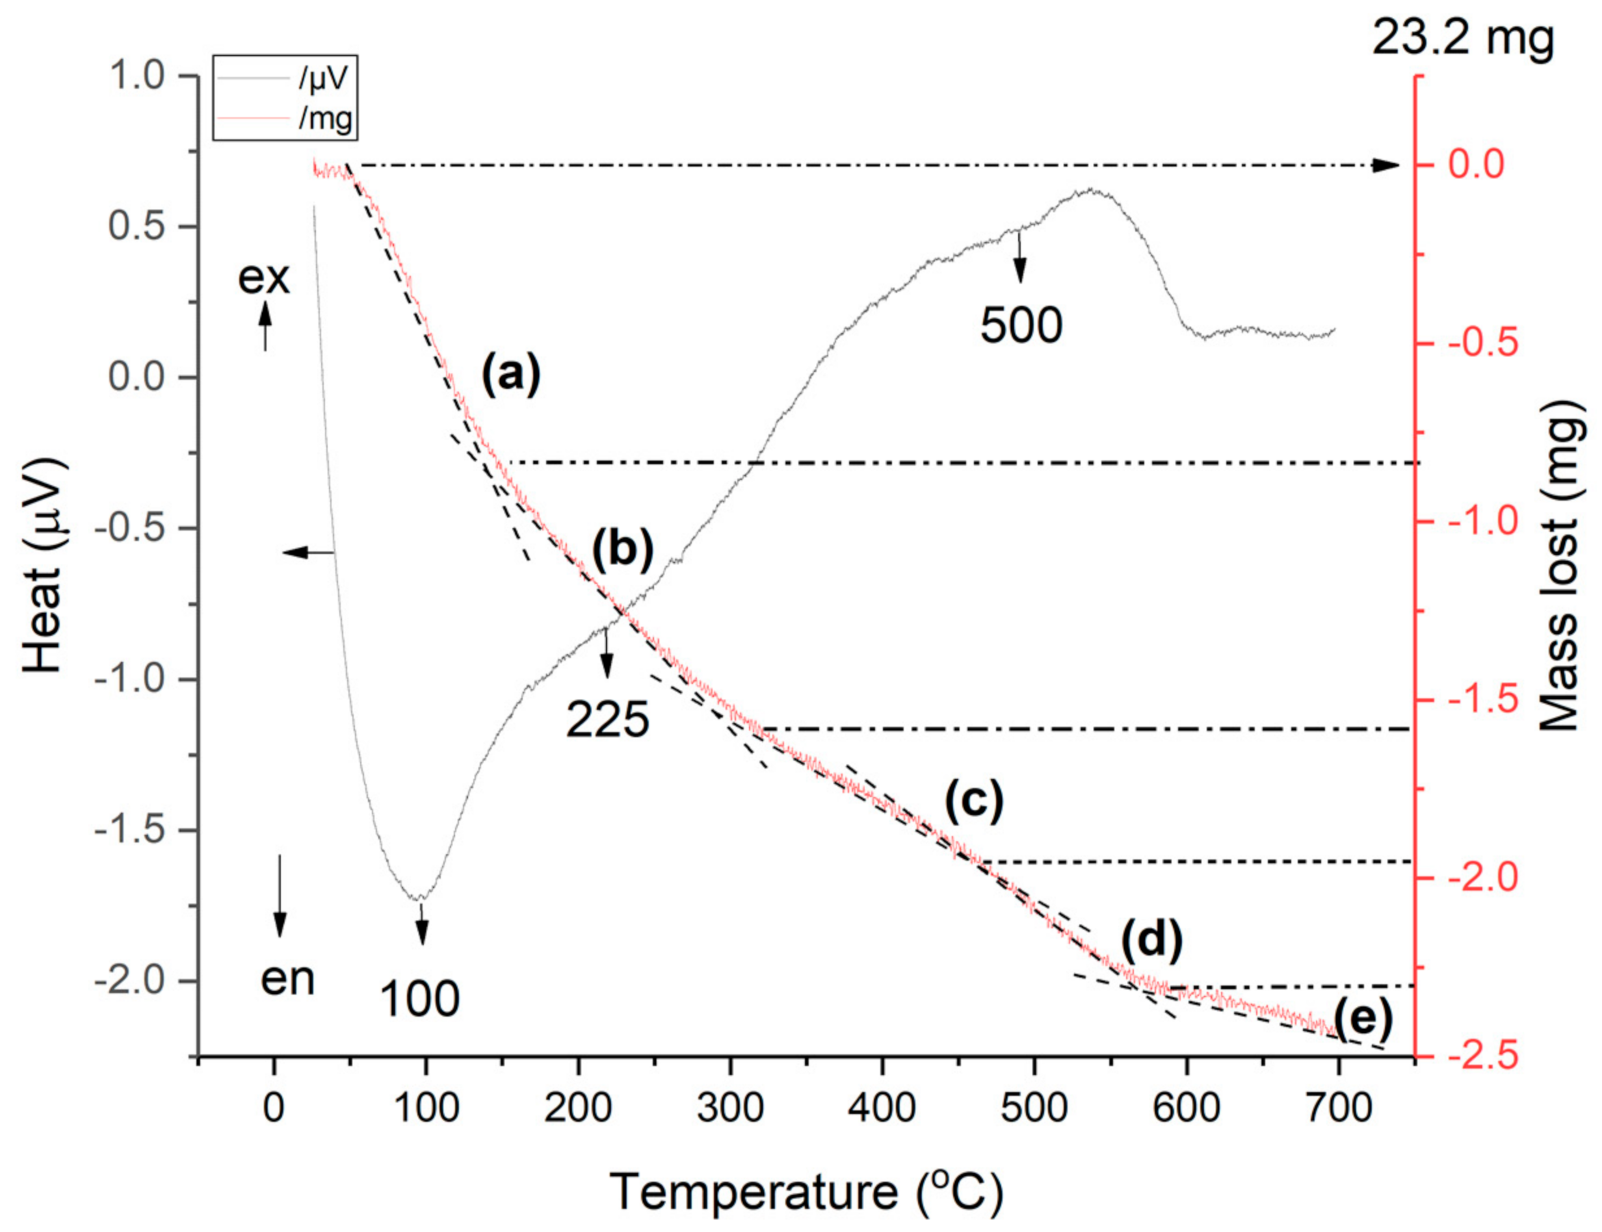
2.6.7. TG-DSC
2.6.8. TPD of Ammonia
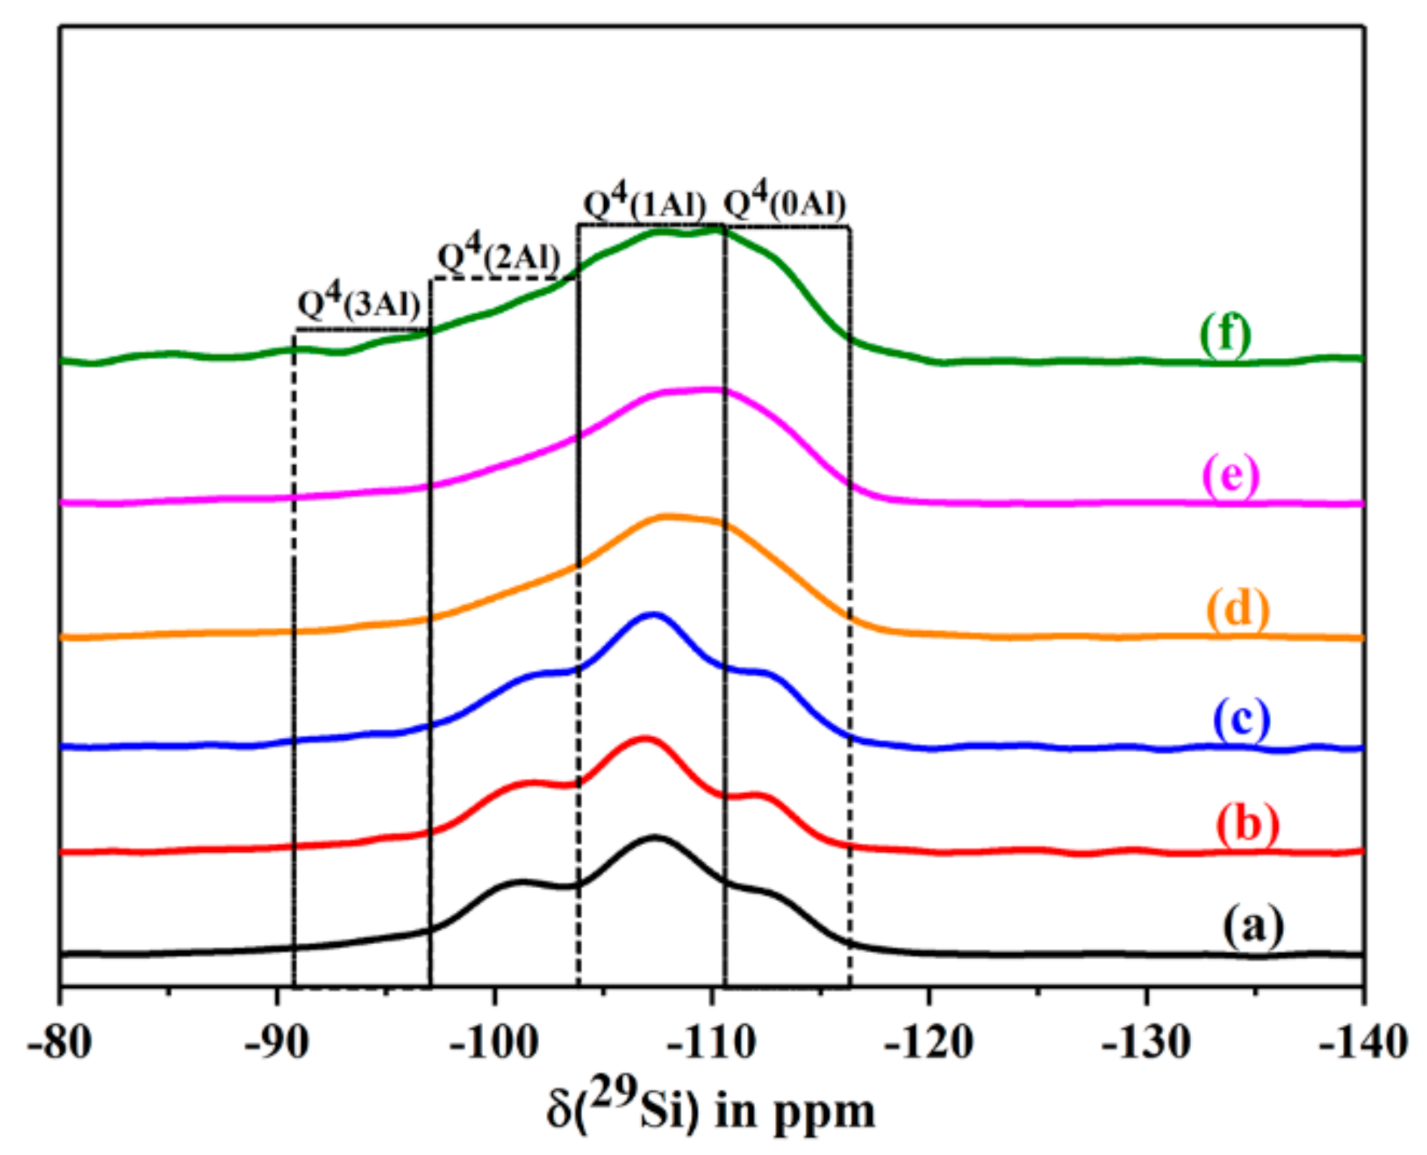
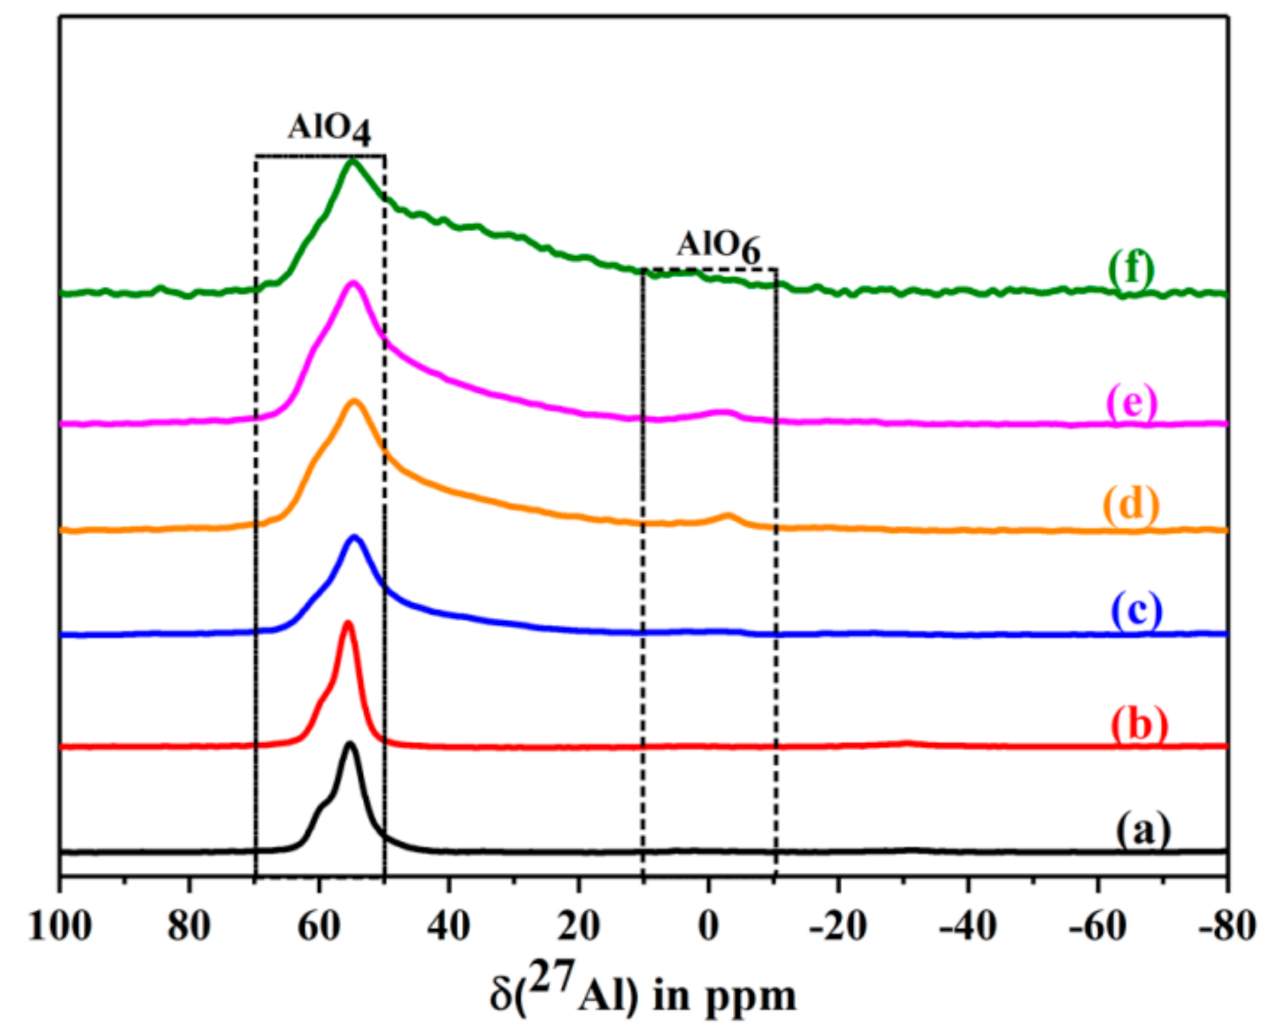
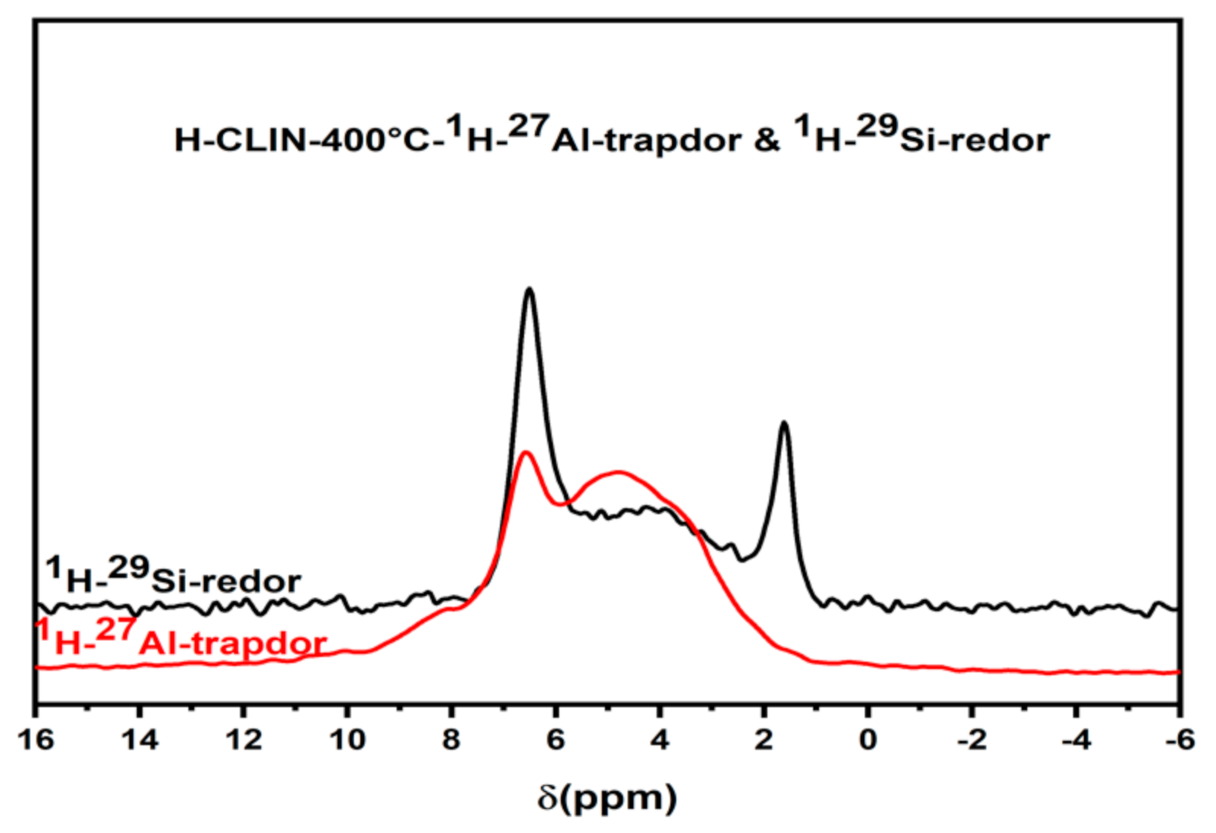
2.6.9. Solid State NMR Studies
2.7. Catalysis
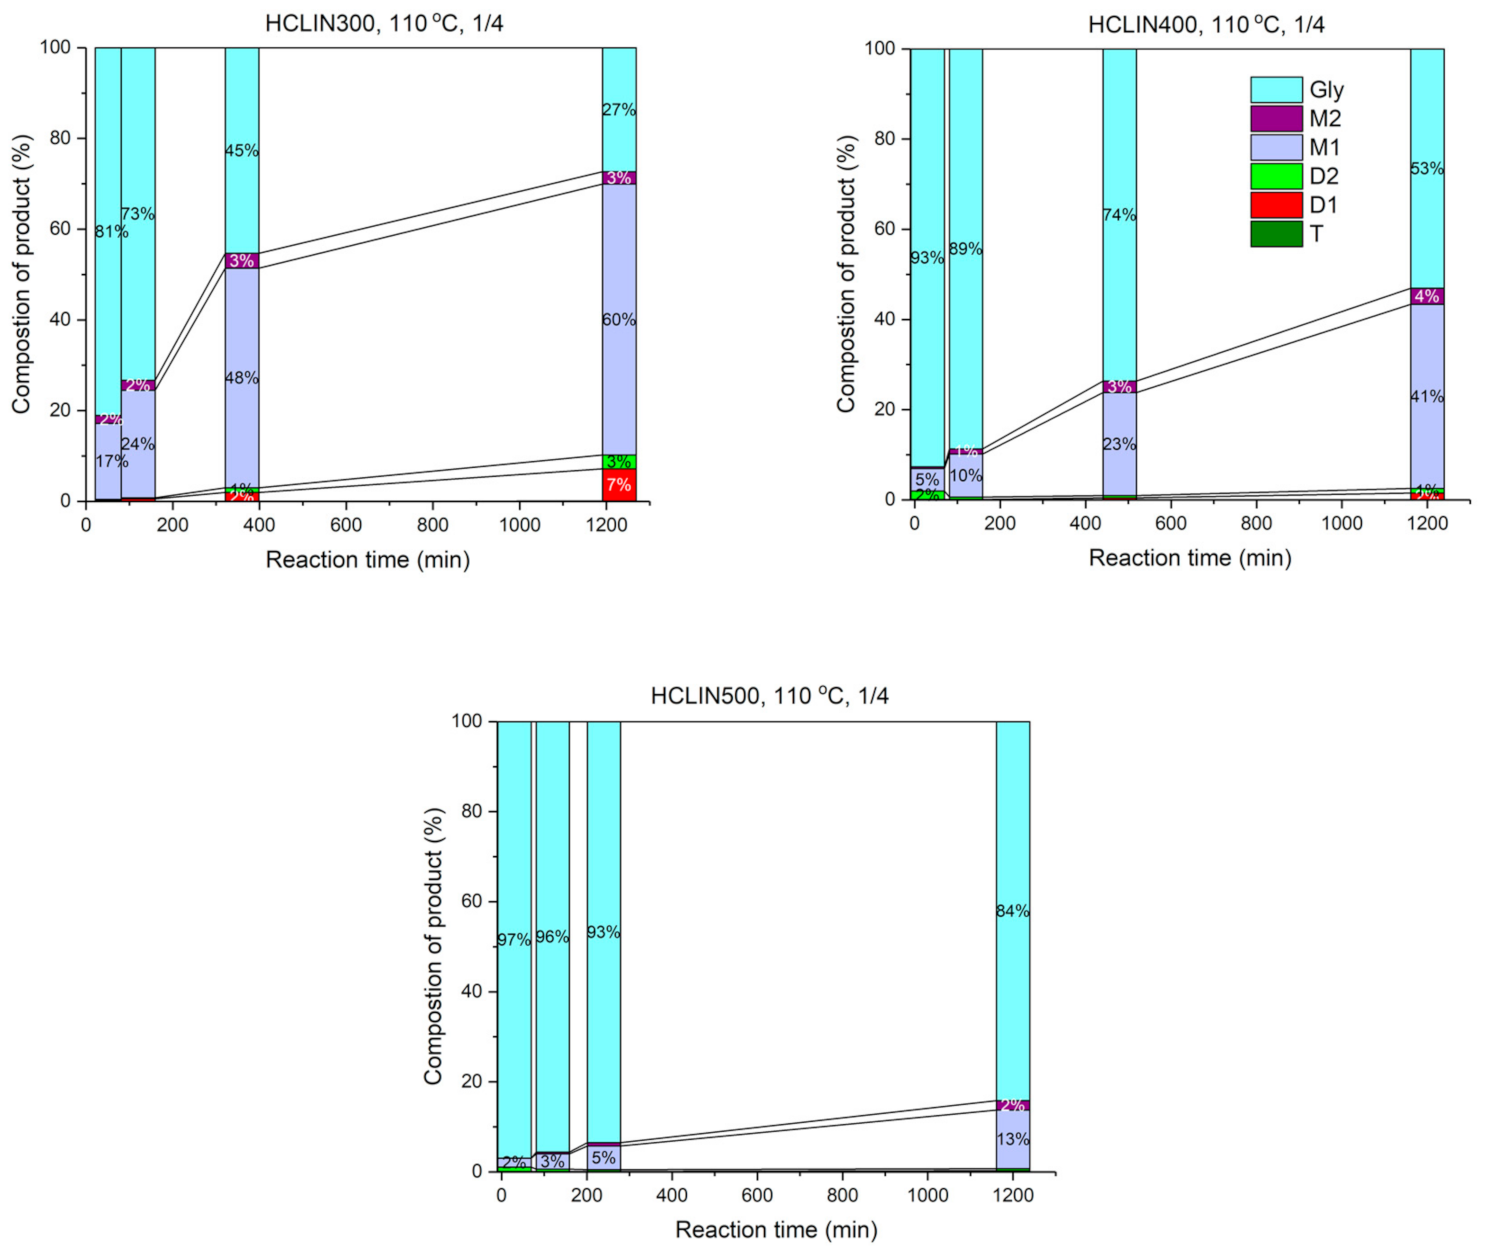
2.7.1. Influence of the Catalyst Activation
Catalyst Activation Temperature
Catalyst Activation Time
2.7.2. Influence of the Reaction Conditions
Influence of the Reaction Time
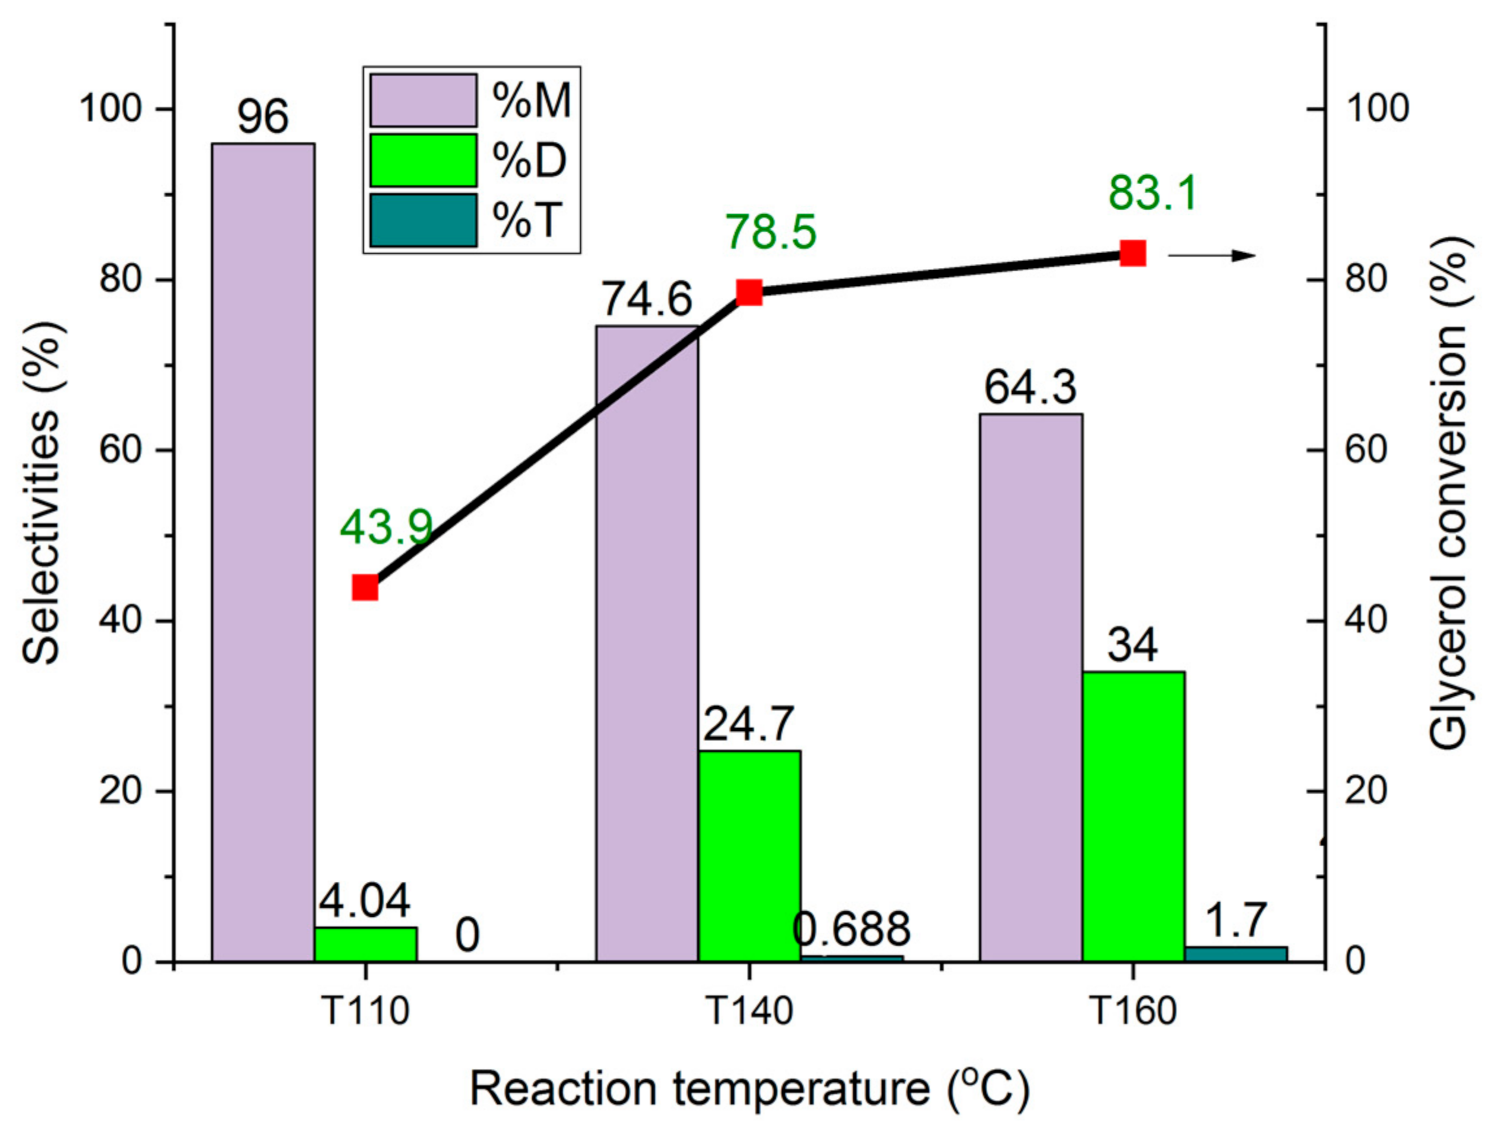
The Influence of the Reaction Temperature
Influence of the Gly/TBA Ratio
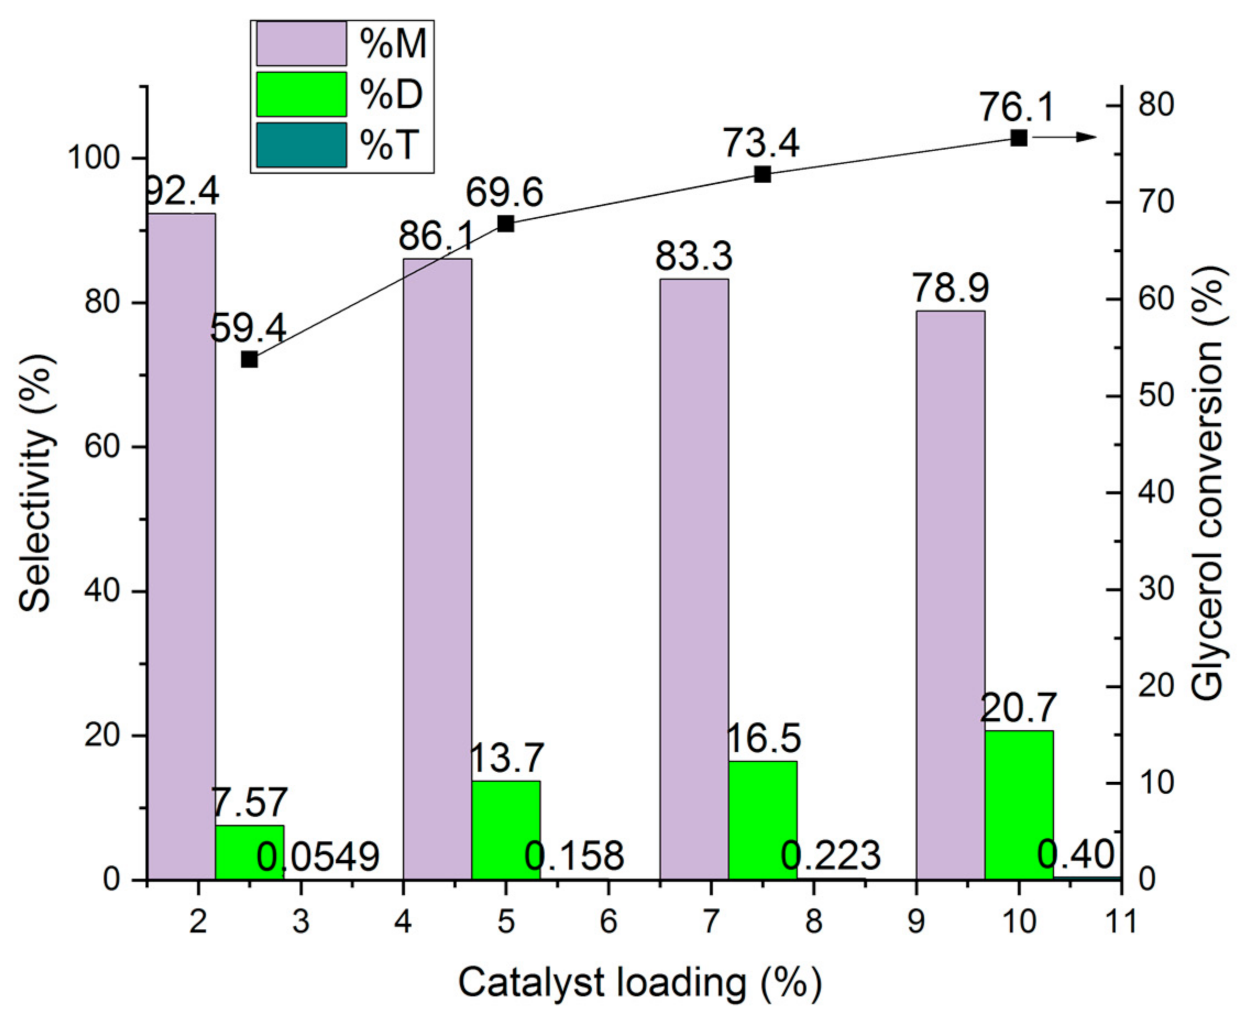
Influence of the Catalyst Loading
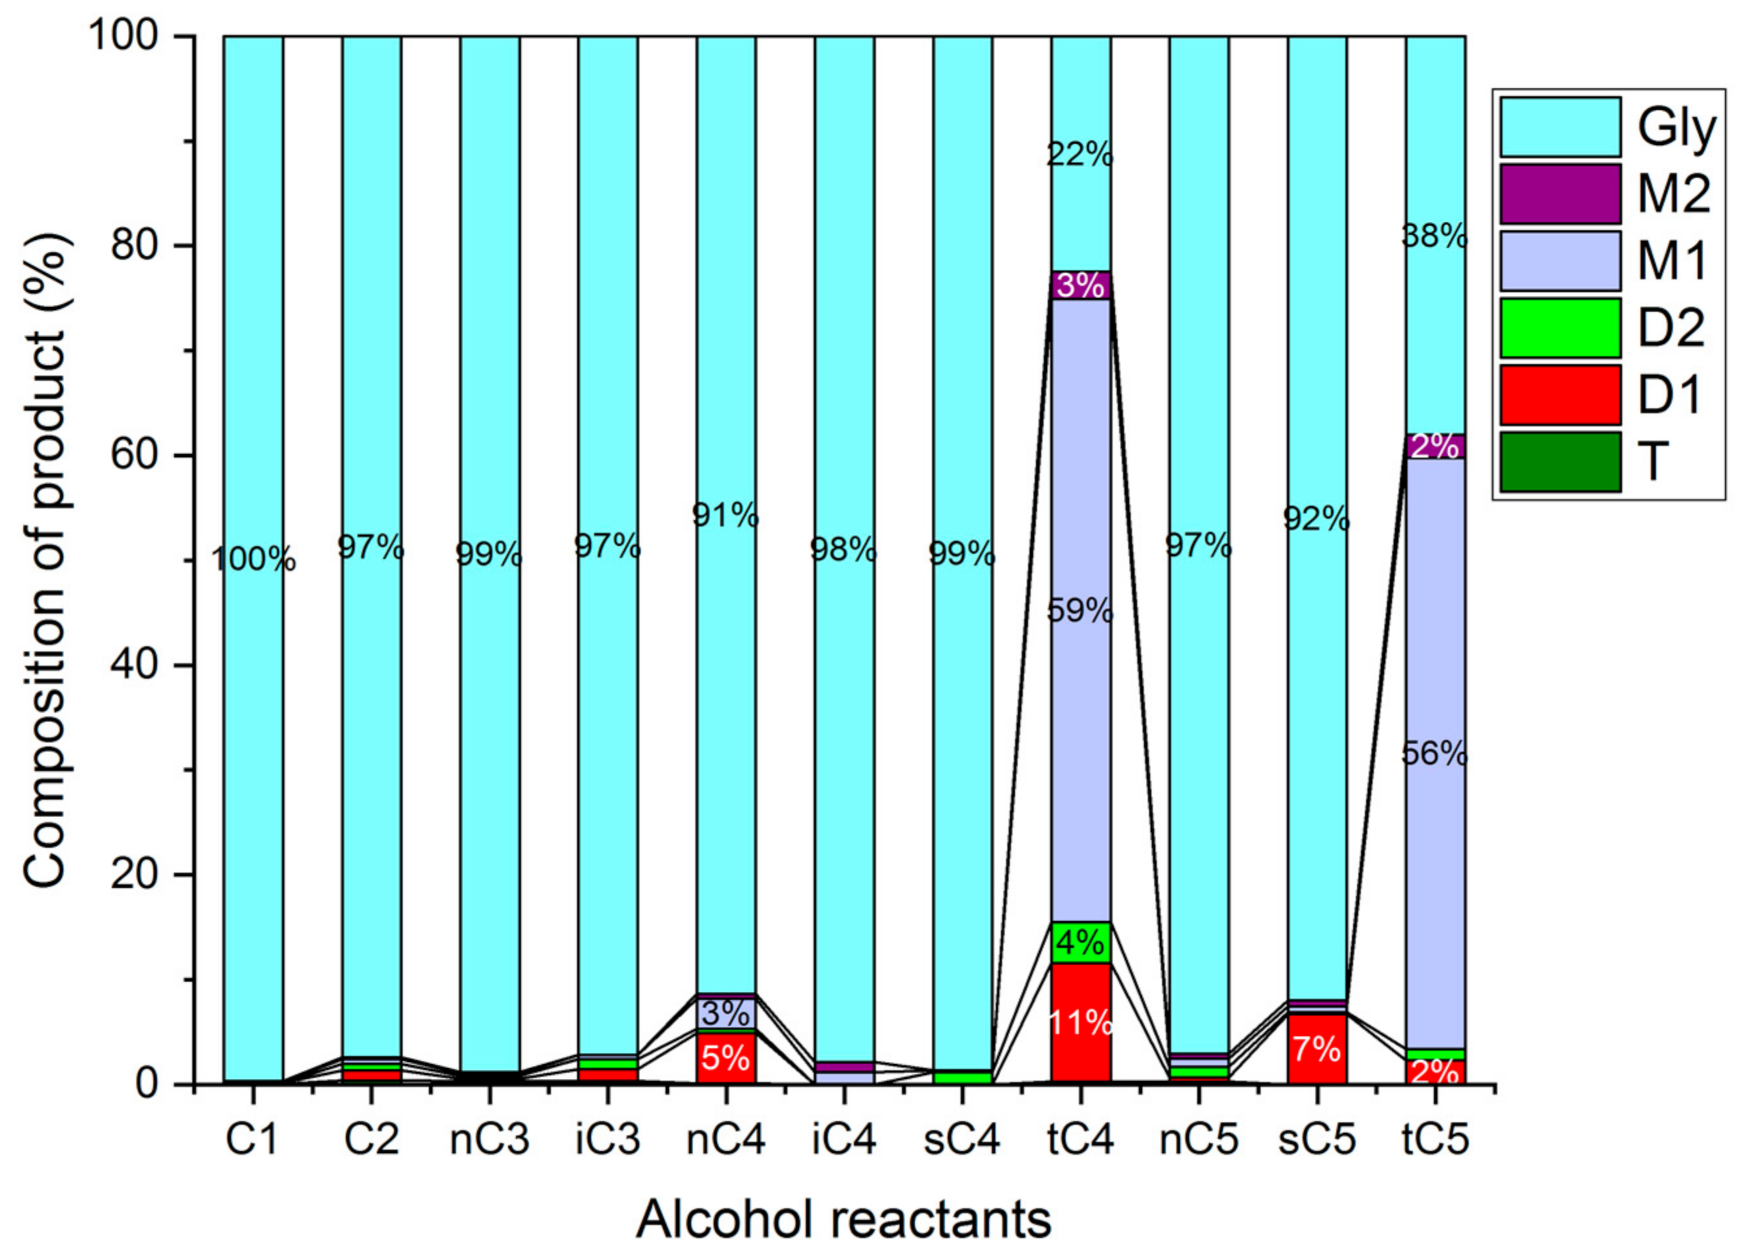
Comparison with Different Alcohols
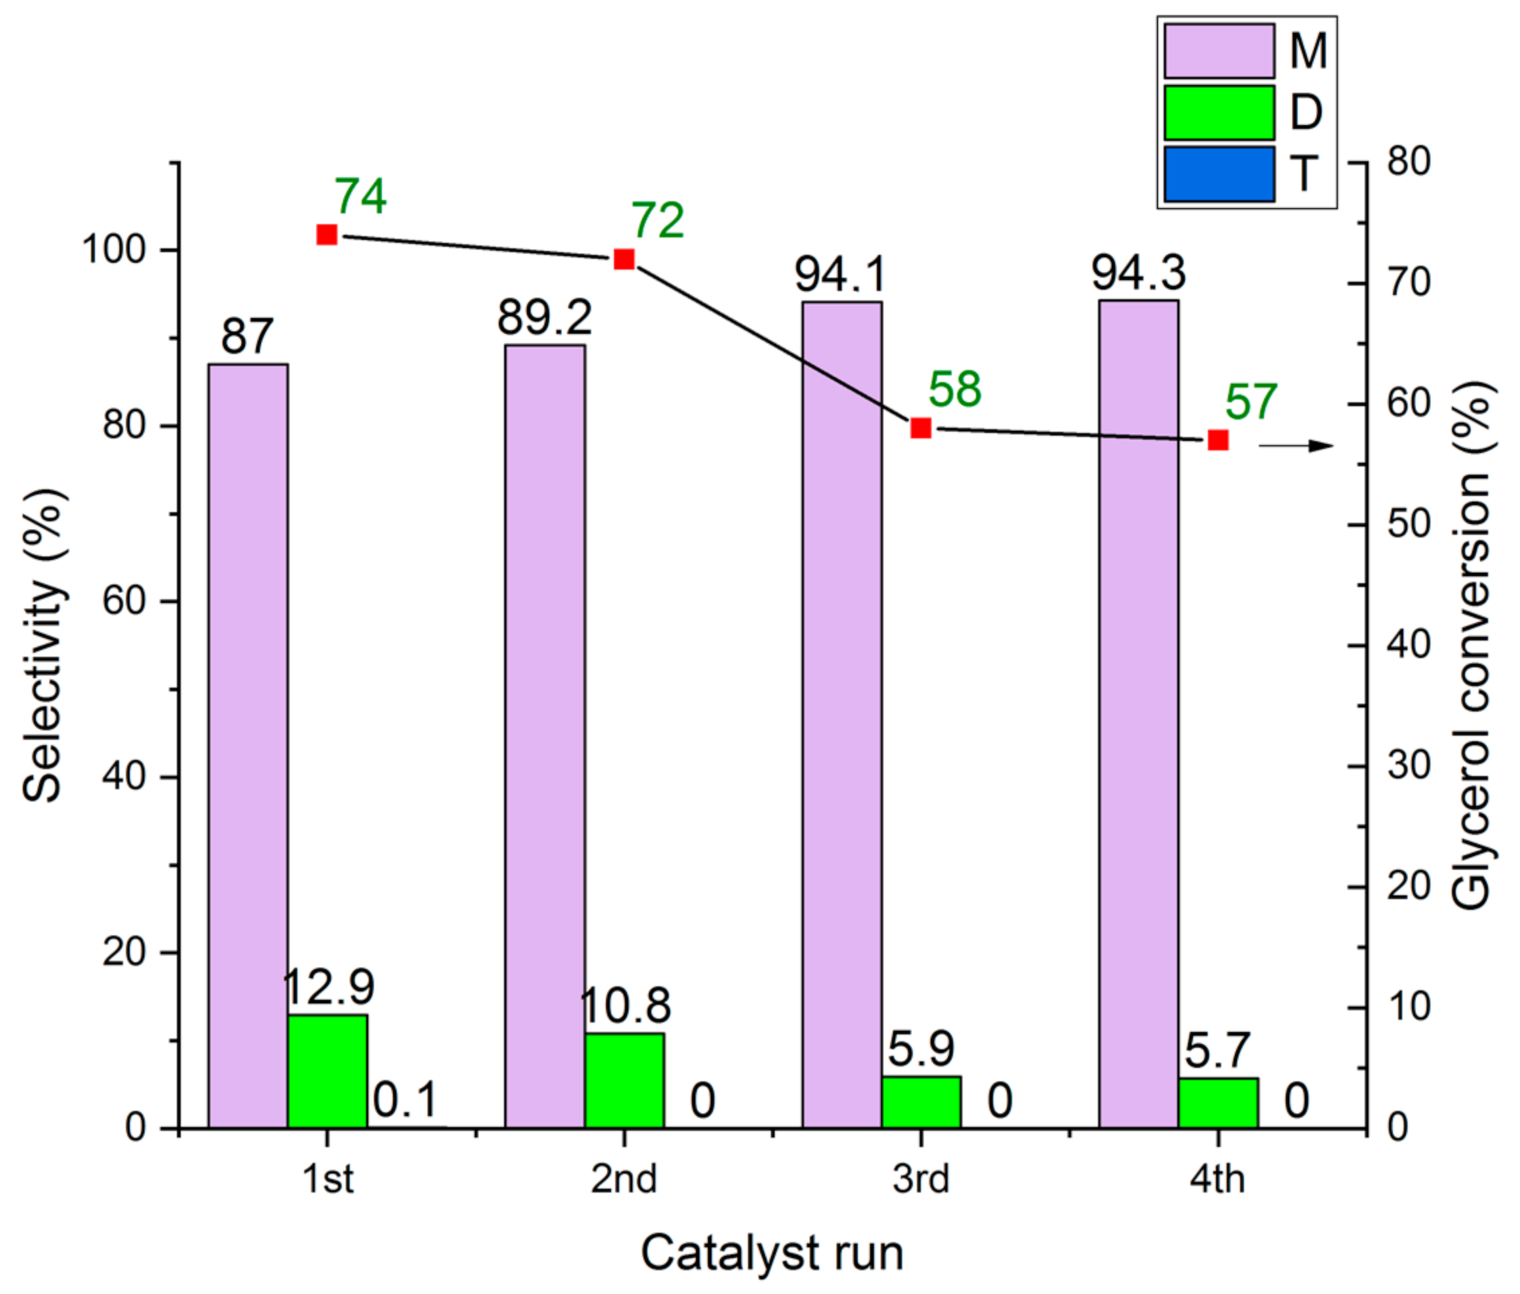
2.7.3. Catalyst Re-Use
3. Conclusions
Author Contributions
Funding
Acknowledgments
Conflicts of Interest
References
- Pfeiffer, J. Fossil Resources and Climate Change—The Green Paradox and Resource Market Power; Ifo Beträge zur Wirtschaftsforschung; Ifo Institute: Munich, Germany, 2017. [Google Scholar]
- Graves, C.; Ebbesen, S.D.; Mogensen, M.; Lackner, K.S. Sustainable hydrocarbon fuels by recycling CO2 and H2O with renewable or nuclear energy. Renew. Sustain. Energy Rev 2011, 15, 1–23. [Google Scholar] [CrossRef]
- Melis, A. Photosynthesis-to-fuels: From sunlight to hydrogen, isoprene, and botryococcene production. Energy Environ. Sci. 2012, 5, 5531–5539. [Google Scholar] [CrossRef]
- Lotero, E.; Liu, Y.; Lopez, D.E.; Suwannakarn, K.; Bruce, D.A.; Goodwin, J.G. Synthesis of biodiesel via acid catalysis. Ind. Eng. Chem. Res. 2005, 44, 5353–5363. [Google Scholar] [CrossRef]
- Leung, D.Y.C.; Wu, X.; Leung, M.K.H. A review on biodiesel production using catalyzed transesterification. Appl. Energy 2010, 87, 1083–1095. [Google Scholar] [CrossRef]
- Hoekman, S.K.; Broch, A.; Robbins, C.; Ceniceros, E.; Natarajan, M. Review of biodiesel composition, properties, and specifications. Renew. Sustain. Energy Rev. 2012, 16, 143–169. [Google Scholar] [CrossRef]
- Frusteri, F.; Arena, F.; Bonura, G.; Cannilla, C.; Spadaro, L.; Di Blasi, O. Catalytic etherification of glycerol by tert-butyl alcohol to produce oxygenated additives for diesel fuel. Appl. Catal. A Gen. 2009, 367, 77–83. [Google Scholar] [CrossRef]
- Cannilla, C.; Bonura, G.; Frusteri, L.; Frusteri, F. Batch reactor coupled with water permselective membrane: Study of glycerol etherification reaction with butanol. Chem. Eng. J. 2015, 282, 187–193. [Google Scholar] [CrossRef]
- Magar, S.; Kamble, S.; Mohanraj, G.T.; Jana, S.K.; Rode, C. Solid-Acid-Catalyzed Etherification of Glycerol to Potential Fuel Additives. Energy Fuels 2017, 31, 12272–12277. [Google Scholar] [CrossRef]
- Estevez, R.; Aguado-Deblas, L.; Luna, D.; Bautista, F.M. An overview of the production of oxygenated fuel additives by glycerol etherification, either with isobutene or tert-butyl alcohol over heterogeneous catalysts. Energies 2019, 12, 2364. [Google Scholar] [CrossRef] [Green Version]
- Aguado-Deblas, L.; Estevez, R.; Russo, M.; La Parola, V.; Bautista, F.M.; Testa, M.L. Microwave-assisted glycerol etherification over sulfonic acid catalysts. Materials 2020, 13, 1584. [Google Scholar] [CrossRef] [Green Version]
- Mansouri, N.; Rikhtegar, N.; Panahi, A.H.; Atabi, F.; Shahraki, B.K. Porosity, characterization and structural properties of natural zeolite–Clinoptilolite—As a sorbent. Environ. Prot. Eng. 2013, 39, 139–152. [Google Scholar]
- Polat, E.; Karaca, M.; Demir, H.; Onus, A.N. Use of natural zeolite (clinoptilolite) in agriculture. J. Fruit Ornam. Plant Res. 2004, 12, 183–189. [Google Scholar]
- Çulfaz, M.; Yağız, M. Ion exchange properties of natural clinoptilolite: Lead–sodium and cadmium–sodium equilibria. Sep. Purif. Technol. 2004, 37, 93–105. [Google Scholar] [CrossRef]
- Rivera, A.; Farias, T. Clinoptilolite–surfactant composites as drug support: A new potential application. Microporous Mesoporous Mater. 2005, 80, 337–346. [Google Scholar] [CrossRef]
- Favvas, E.P.; Tsanaktsidis, C.G.; Sapalidis, A.A.; Tzilantonis, G.T.; Papageorgiou, S.K.; Mitropoulos, A.C. Clinoptilolite, a natural zeolite material: Structural characterization and performance evaluation on its dehydration properties of hydrocarbon-based fuels. Microporous Mesoporous Mater. 2016, 225, 385–391. [Google Scholar] [CrossRef]
- Rabo, J.A. Zeolite Chemistry and Catalysis (ACS Monograpgh, 171); American Chemical Society: Washington, DC, USA, 1976. [Google Scholar]
- Breck, D.W. Zeolite Molecular Sieves: Structure, Chemistry and Use; John Wiley & Sons Inc.: Hoboken, NJ, USA, 1974. [Google Scholar]
- Dziedzicka, A.; Sulikowski, B.; Ruggiero-Mikołajczyk, M. Catalytic and physicochemical properties of modified natural clinoptilolite. Catal. Today 2016, 259, 50–58. [Google Scholar] [CrossRef]
- Saramok, M.; Szymaszek, A.; Inger, M.; Jurak, K.A.; Samojeden, B.; Motak, M. Modified Zeolite Catalyst for a NOx Selective Catalytic Reduction Process in Nitric Acid Plants. Catalysts 2021, 11, 450–469. [Google Scholar] [CrossRef]
- Alvarez-Aguiñaga, E.A.; Elizalde-González, M.P.; Sabinas-Hernández, S.A. Unpredicted photocatalytic activity of clinoptilolite–mordenite natural zeolite. RSC Adv. 2020, 10, 39251–39260. [Google Scholar] [CrossRef]
- Sobuś, N.; Czekaj, I. Comparison of Synthetic and Natural Zeolite Catalysts‘ Behavior in the Production of Lactic Acid and Ethyl Lactate from Biomass-Derived Dihydroxyacetone. Catalysts 2021, 11, 1006–1023. [Google Scholar] [CrossRef]
- Miądlicki, P.; Wróblewska, A.; Kiełbasa, K.; Koren, Z.C.; Michalkiewicz, B. Sulfuric acid modified clinoptilolite as a solid green catalyst for solvent-free α-pinene isomerization process. Microporous Mesoporous Mater. 2021, 324, 111266–111279. [Google Scholar] [CrossRef]
- Mohadesi, M.; Aghel, B.; Maleki, M.; Ansari, A. The use of KOH/Clinoptilolite catalyst in pilot of microreactor for biodiesel production from waste cooking oil. Fuel 2020, 263, 116659–116668. [Google Scholar] [CrossRef]
- Balou, J.; Khalilzadeh, M.A.; Zareyee, D. KF/Nano-clinoptilolite Catalyzed Aldol-Type Reaction of Aldehydes with Ethyl Diazoacetate. Catal. Lett. 2017, 147, 2612–2618. [Google Scholar] [CrossRef]
- Chmielewská, E. Natural Zeolites as Sustainable and Environmental Inorganic Resources over the History to Present Natural Zeolites as Sustainable and Environmental Inorganic Resources over the History to Present. Gen. Chem. 2019, 5, 190001–190006. [Google Scholar] [CrossRef]
- Corma, A.; Zones, S.; Cejka, J. Zeolites and Catalysis; Wiley: Hoboken, NJ, USA, 2010. [Google Scholar]
- Adinehvand, J.; Shokuhi Rad, A.; Tehrani. A. S. Acid-treated zeolite (clinoptilolite) and its potential to zinc removal from water sample. Int. J. Environ. Sci. Technol 2016, 13, 2705–2712. [Google Scholar] [CrossRef]
- Vlad, E.; Bildea, C.S.; Bozga, G. Design and control of glycerol-tert-butyl alcohol etherification process. Sci. World J. 2012, 2012, 1–11. [Google Scholar] [CrossRef] [Green Version]
- Ozbay, N.; Oktar, N.; Dogu, G.; Dogu, T. Effects of sorption enhancement and isobutene formation on etherification of glycerol with tert-butyl alcohol in a flow reactor. Ind. Eng. Chem. Res. 2012, 51, 8788–8795. [Google Scholar] [CrossRef]
- Scherrer, P. Bestimmung der Größe und der inneren Struktur von Kolloidteilchen mittels Röntgenstrahlen. Nachr. Ges. Wiss. Göttingen 1918, 26, 98–100. [Google Scholar]
- Sultan, M.; Miyazaki, T.; Koyama, S. Optimization of adsorption isotherm types for desiccant air-conditioning applications. Renew. Energy 2018, 121, 441–450. [Google Scholar] [CrossRef]
- Flanigen, E.M.; Khatami, H.; Szymanski, H.A. Infrared Structural Studies of Zeolite Frameworks. In Advances in Chemistry; Flanigen, E.M., Sand, L.B., Eds.; American Chemical Society: Washington, DC, USA, 1974; Volume 101, pp. 201–229. [Google Scholar]
- Van Aelst, J.; Haouas, M.; Gobechiya, E.; Houthoofd, K.; Philippaerts, A.; Sree, S.P.; Kirschhock, C.E.A.; Jacobs, P.; Martens, J.A.; Sels, B.F.; et al. Hierarchization of USY zeolite by NH4OH. A postsynthetic process investigated by NMR and XRD. J. Phys. Chem. C 2014, 118, 22573–22582. [Google Scholar] [CrossRef] [Green Version]
- Fernández-Jiménez, A.; Palomo, A. Nanostructure/microstructure of fly ash geopolymers. In Geopolymers Structures, Processing, Properties and Industrial Applications; Provis, J.L., Van Deventer, S.J., Eds.; CRC Press: Boca Raton, FL, USA, 2009; pp. 89–114. [Google Scholar]
- Blumenfeld, A.L.; Coster, D.; Fripiat, J.J. Brønsted acid sites and surface structure in zeolites: A high-resolution 29Si NMR REDOR study. J. Phys. Chem. 1995, 99, 15181–15191. [Google Scholar] [CrossRef]
- Gackowski, M.; Kuterasiński, Ł.; Podobiński, J.; Sulikowski, B.; Datka, J. IR and NMR studies of hierarchical material obtained by the treatment of zeolite Y by ammonia solution. Spectrochim. Acta Part A Mol. Biomol. Spectrosc. 2018, 193, 440–446. [Google Scholar] [CrossRef]
- Vlasenko, N.V.; Kochkin, Y.N.; Telbiz, G.M.; Shvets, O.V.; Strizhak, P.E. Insight into the active site nature of zeolite H-BEA for liquid phase etherification of isobutylene with ethanol. RSC Adv. 2019, 9, 35957–35968. [Google Scholar] [CrossRef] [Green Version]
- Zhang, N.; Mao, D.; Zhai, X. Selective conversion of bio-ethanol to propene over nano-HZSM-5 zeolite: Remarkably enhanced catalytic performance by fluorine modification. Fuel Process. Technol. 2017, 167, 50–60. [Google Scholar] [CrossRef]
- Deng, F.; Yue, Y.; Ye, C. 1H/27Al TRAPDOR NMR studies on aluminum species in dealuminated zeolites. Solid State Nucl. Magn. Reson. 1998, 10, 151–160. [Google Scholar] [CrossRef]
- Greiser, S.; Gluth, G.J.G.; Sturm, P.; Jäger, C. 29Si{27Al}, 27Al{29Si} and 27Al{1H} double-resonance NMR spectroscopy study of cementitious sodium aluminosilicate gels (geopolymers) and gel-zeolite composites. RSC Adv. 2018, 8, 40164–40171. [Google Scholar] [CrossRef] [Green Version]


| Sample/Mass (%) | CLIN | NH4CLIN |
|---|---|---|
| Ca | 2.05 | 0.5 |
| K | 2.7 | 1.3 |
| Mg | 0.36 | 0.2 |
| Na | 0.77 | 0.56 |
| Si | 26.2 | 28.6 |
| Al | 6.7 | 7.1 |
| Sample | BET Surface Area m2/g | Micropore Area (m2/g) | External Area (m2/g) | Micropore Volume cm3/g | Macropore Volume m3/g |
|---|---|---|---|---|---|
| NH4 CLIN200 | 26 | 26 | 0.004 | 0.04 | |
| HCLIN300 | 43 | 6 | 37 | 0.002 | 0.02 |
| HCLIN400 | 195 | 163 | 33 | 0.067 | 0.13 |
| HCLIN500 | 151 | 120 | 30 | 0.053 | 0.11 |
| HCLIN600 | 33 | 9 | 24 | 0.005 | 0.05 |
| Sample | Total Released NH3 (μmol/g) | Formed BS$(μmol/g) | Weak BS (μmol/g) | Medium BS (μmol/g) | Strong BS(μmol/g) | Conv. Degree of NH4 to BS (%) |
|---|---|---|---|---|---|---|
| NH4CLIN | 1405 * | 0 | - | - | - | 0 |
| HCLIN300 | 1155 | 250 | 55 | 152 | 43 | 17 |
| HCLIN400 | 1002 | 403 | 66 | 162 | 175 | 28 |
| HCLIN500 | 396 | 1009 | 66 | 255 | 688 | 72 |
Publisher’s Note: MDPI stays neutral with regard to jurisdictional claims in published maps and institutional affiliations. |
© 2022 by the authors. Licensee MDPI, Basel, Switzerland. This article is an open access article distributed under the terms and conditions of the Creative Commons Attribution (CC BY) license (https://creativecommons.org/licenses/by/4.0/).
Share and Cite
Hieu, D.T.; Kosslick, H.; Riaz, M.; Schulz, A.; Springer, A.; Frank, M.; Jaeger, C.; Thu, N.T.M.; Son, L.T. Acidity and Stability of Brønsted Acid Sites in Green Clinoptilolite Catalysts and Catalytic Performance in the Etherification of Glycerol. Catalysts 2022, 12, 253. https://doi.org/10.3390/catal12030253
Hieu DT, Kosslick H, Riaz M, Schulz A, Springer A, Frank M, Jaeger C, Thu NTM, Son LT. Acidity and Stability of Brønsted Acid Sites in Green Clinoptilolite Catalysts and Catalytic Performance in the Etherification of Glycerol. Catalysts. 2022; 12(3):253. https://doi.org/10.3390/catal12030253
Chicago/Turabian StyleHieu, Do Trung, Hendrik Kosslick, Muhammad Riaz, Axel Schulz, Armin Springer, Marcus Frank, Christian Jaeger, Nguyen Thi Minh Thu, and Le Thanh Son. 2022. "Acidity and Stability of Brønsted Acid Sites in Green Clinoptilolite Catalysts and Catalytic Performance in the Etherification of Glycerol" Catalysts 12, no. 3: 253. https://doi.org/10.3390/catal12030253
APA StyleHieu, D. T., Kosslick, H., Riaz, M., Schulz, A., Springer, A., Frank, M., Jaeger, C., Thu, N. T. M., & Son, L. T. (2022). Acidity and Stability of Brønsted Acid Sites in Green Clinoptilolite Catalysts and Catalytic Performance in the Etherification of Glycerol. Catalysts, 12(3), 253. https://doi.org/10.3390/catal12030253