
Improvement in Structure and Visible Light Catalytic Performance of g-C3N4 Fabricated at a Higher Temperature


Abstract
:
1. Introduction
2. Results and Discussion
2.1. Characterization of Photocatalysts
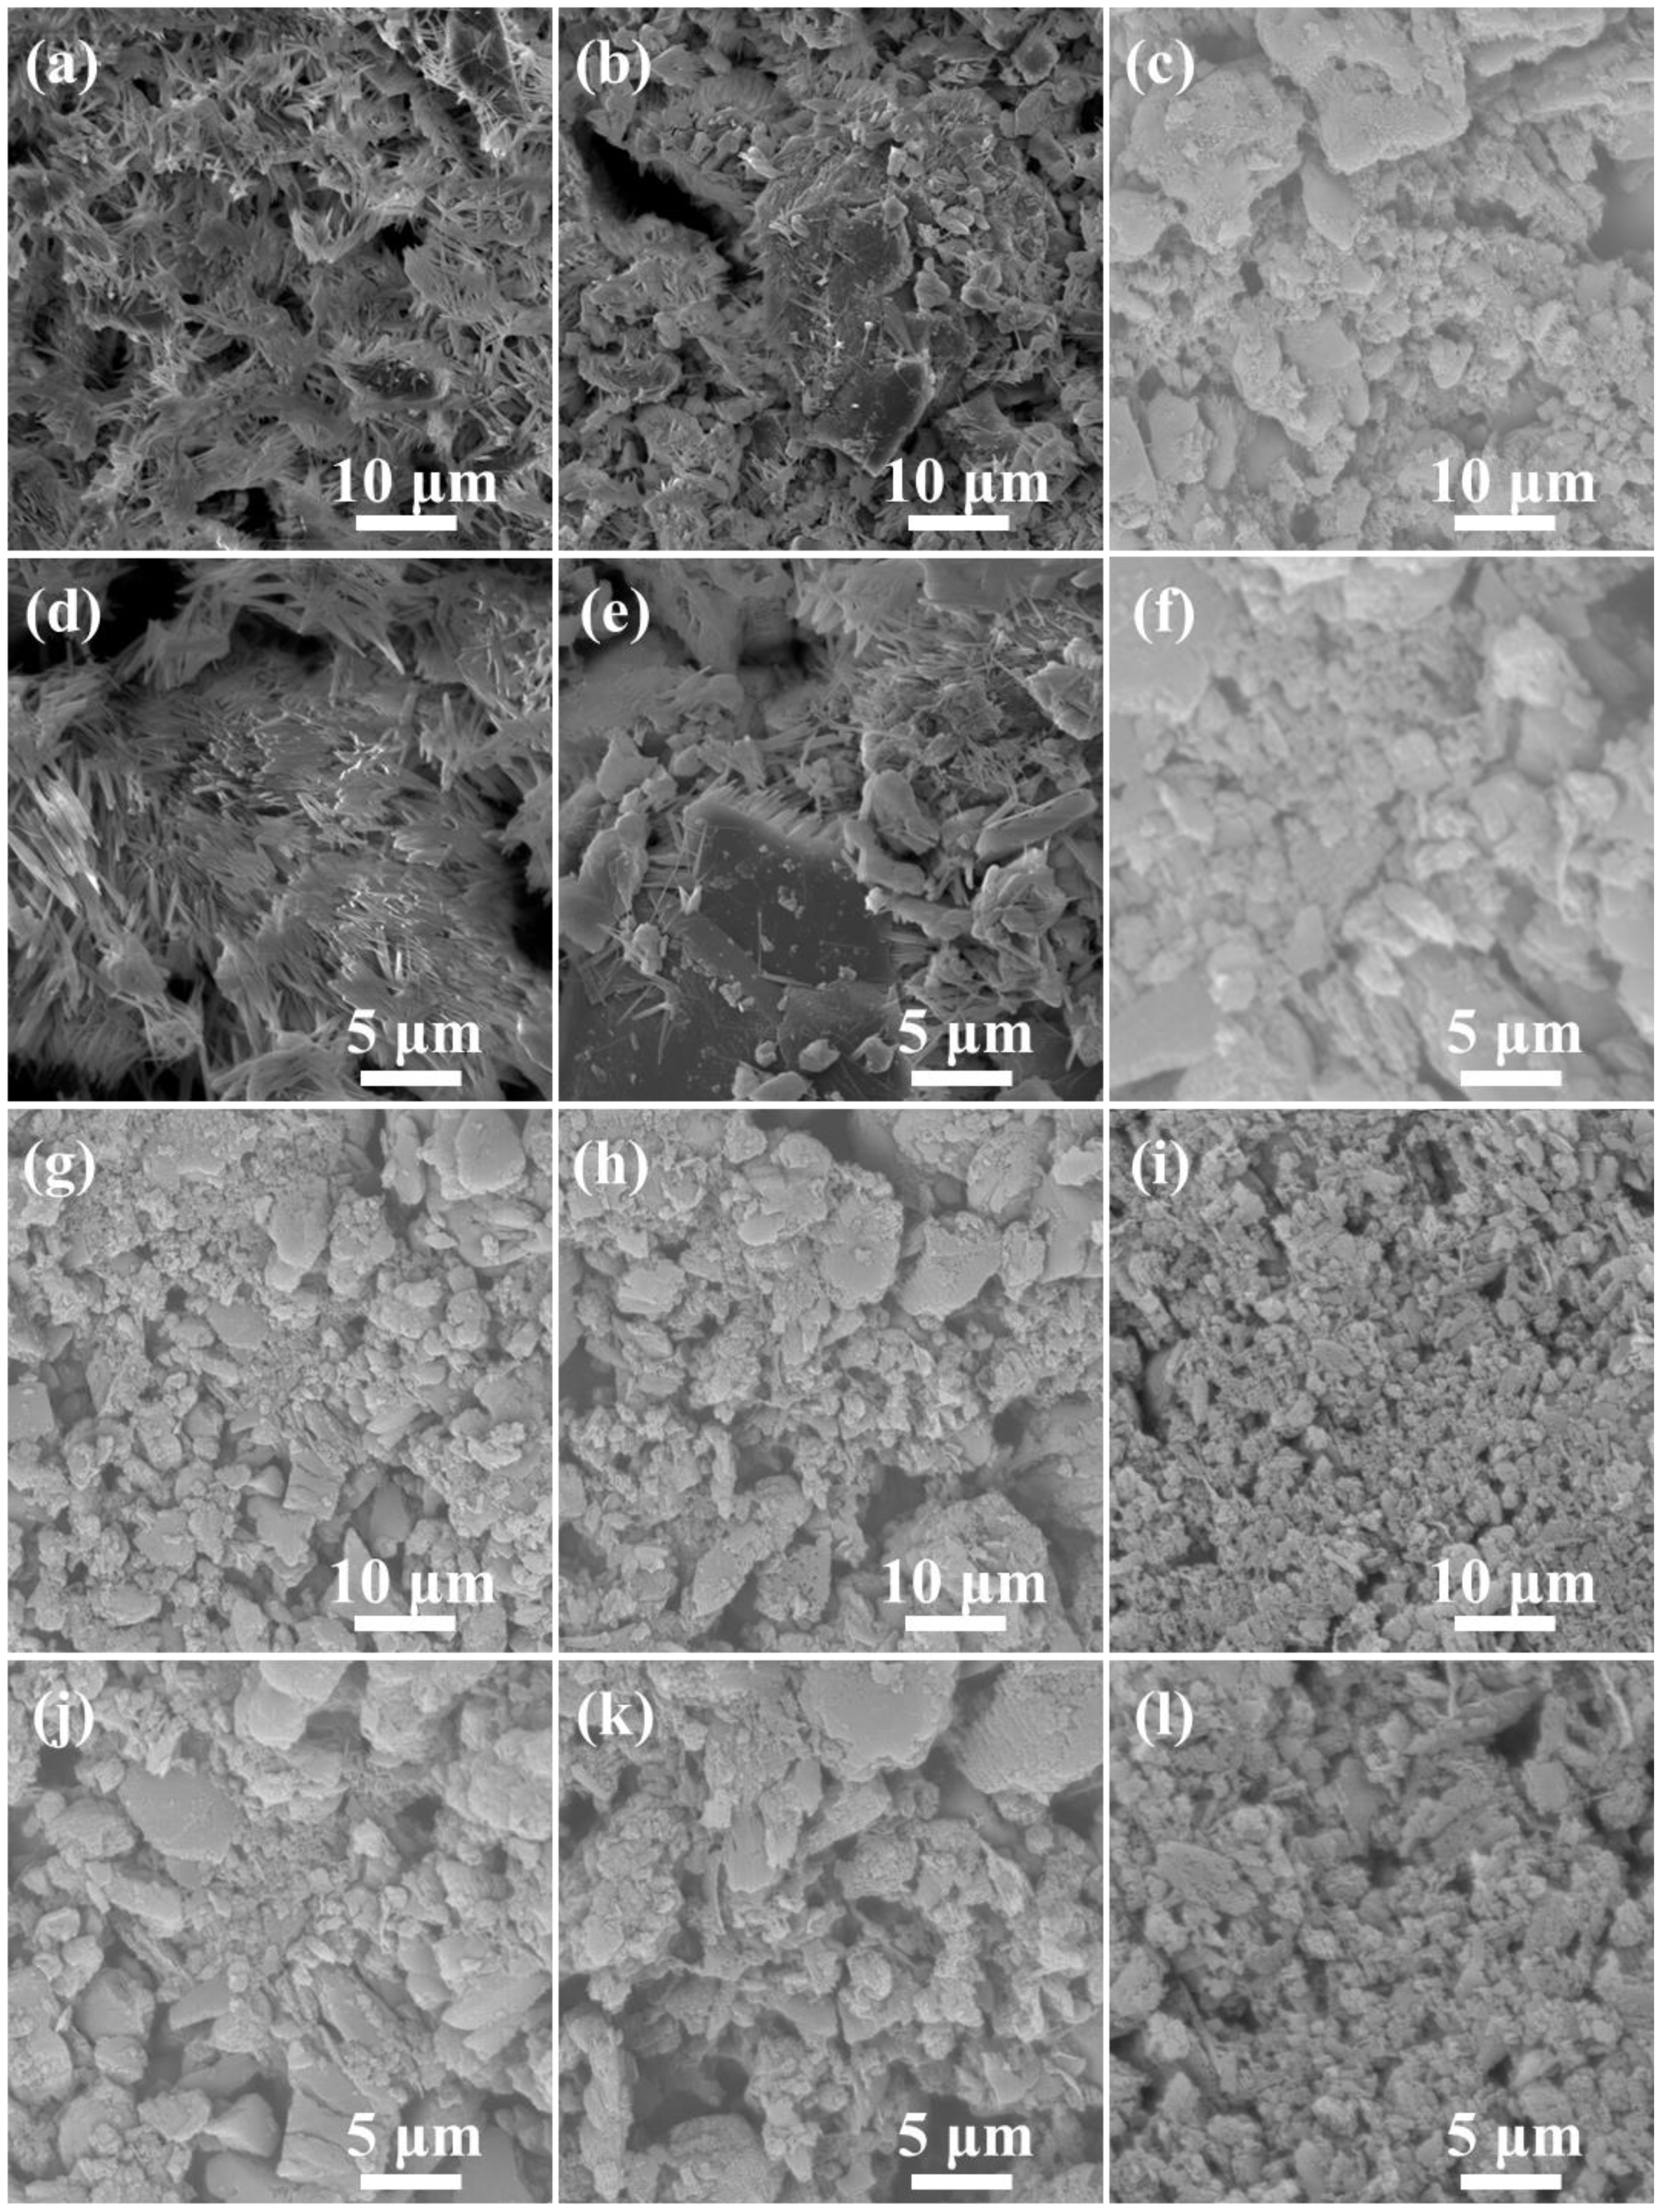
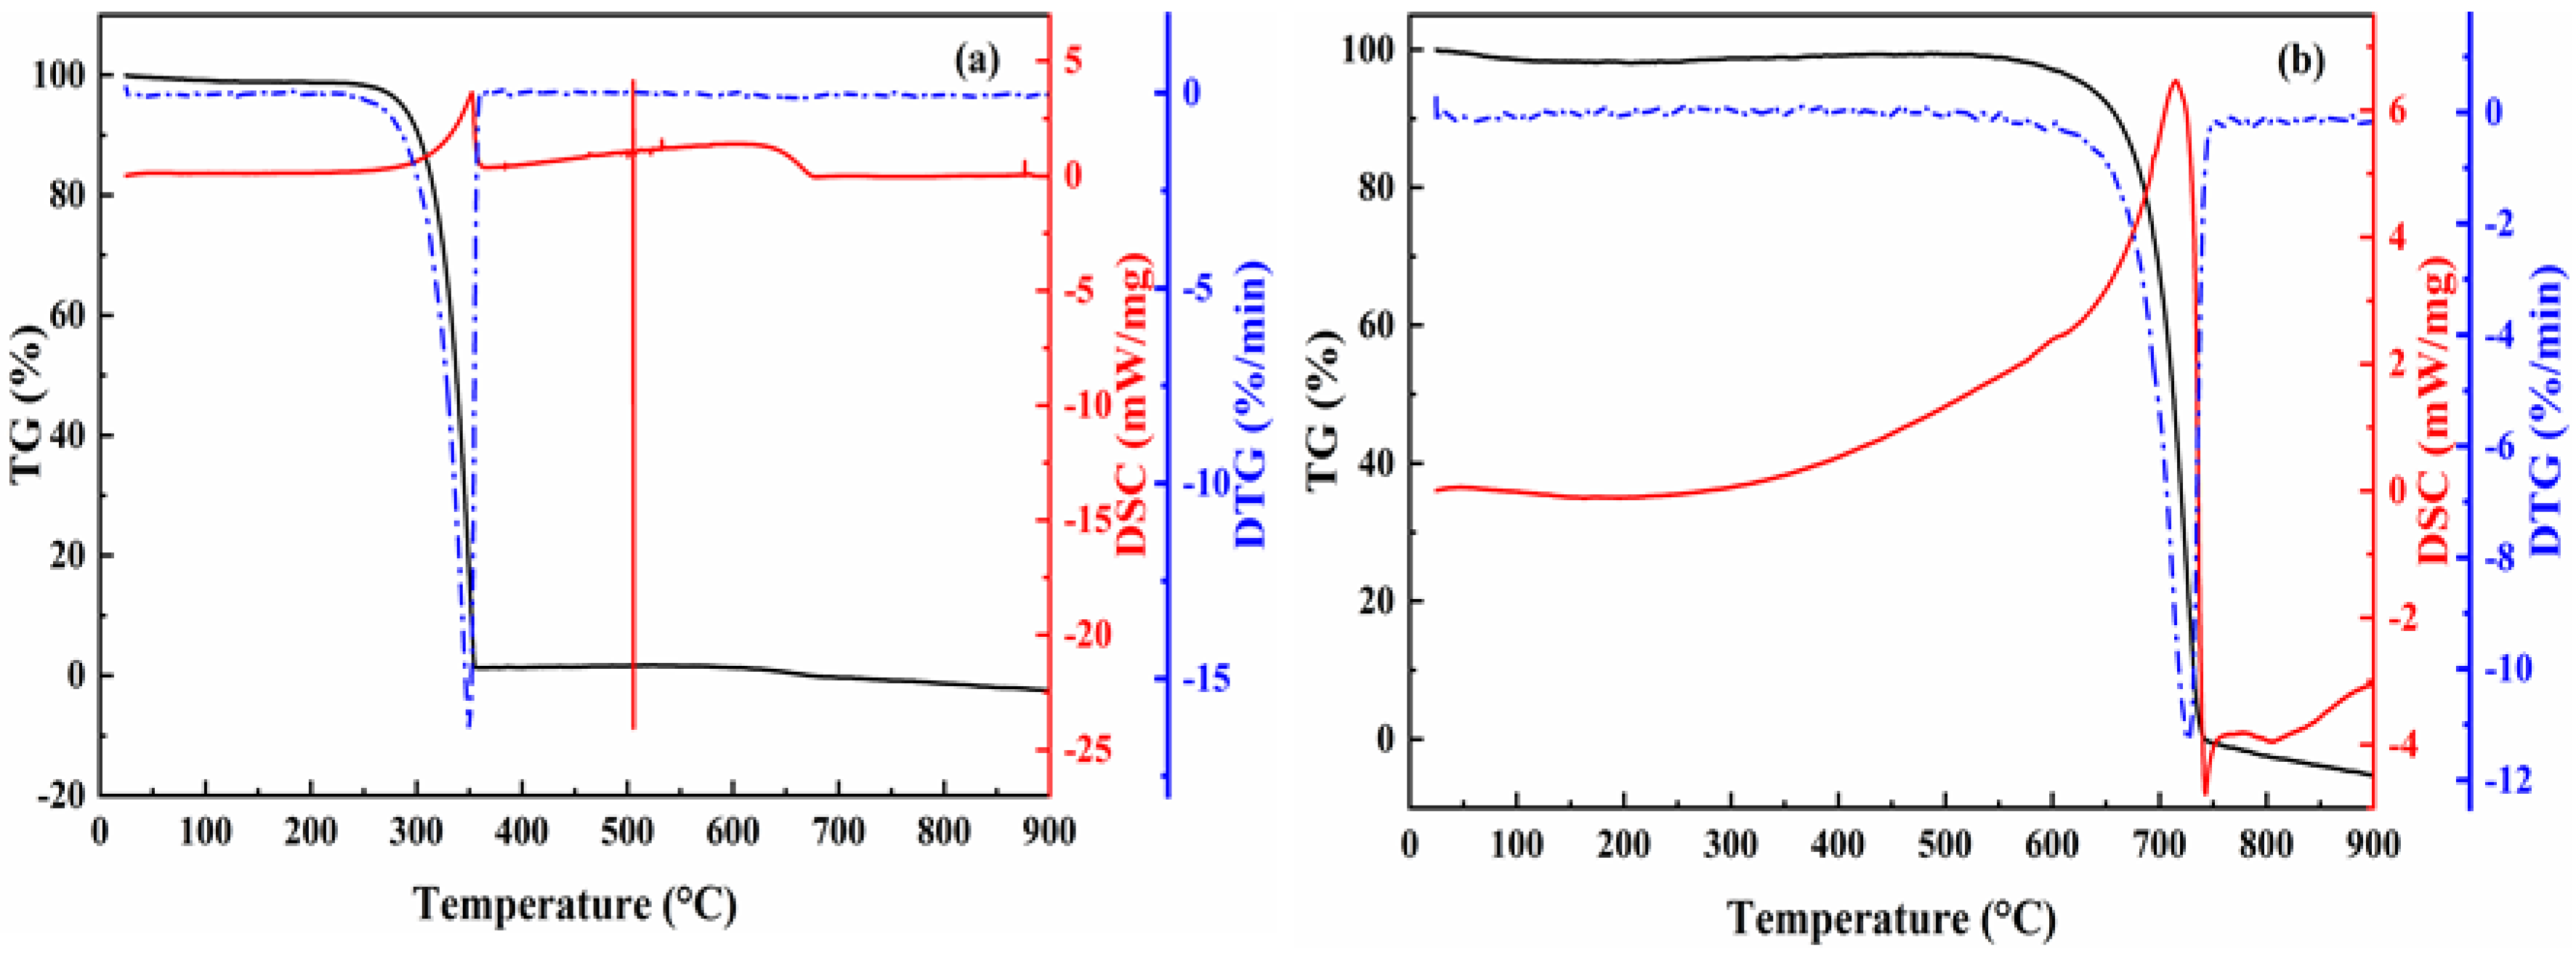
2.1.1. Morphology and Thermal Analysis
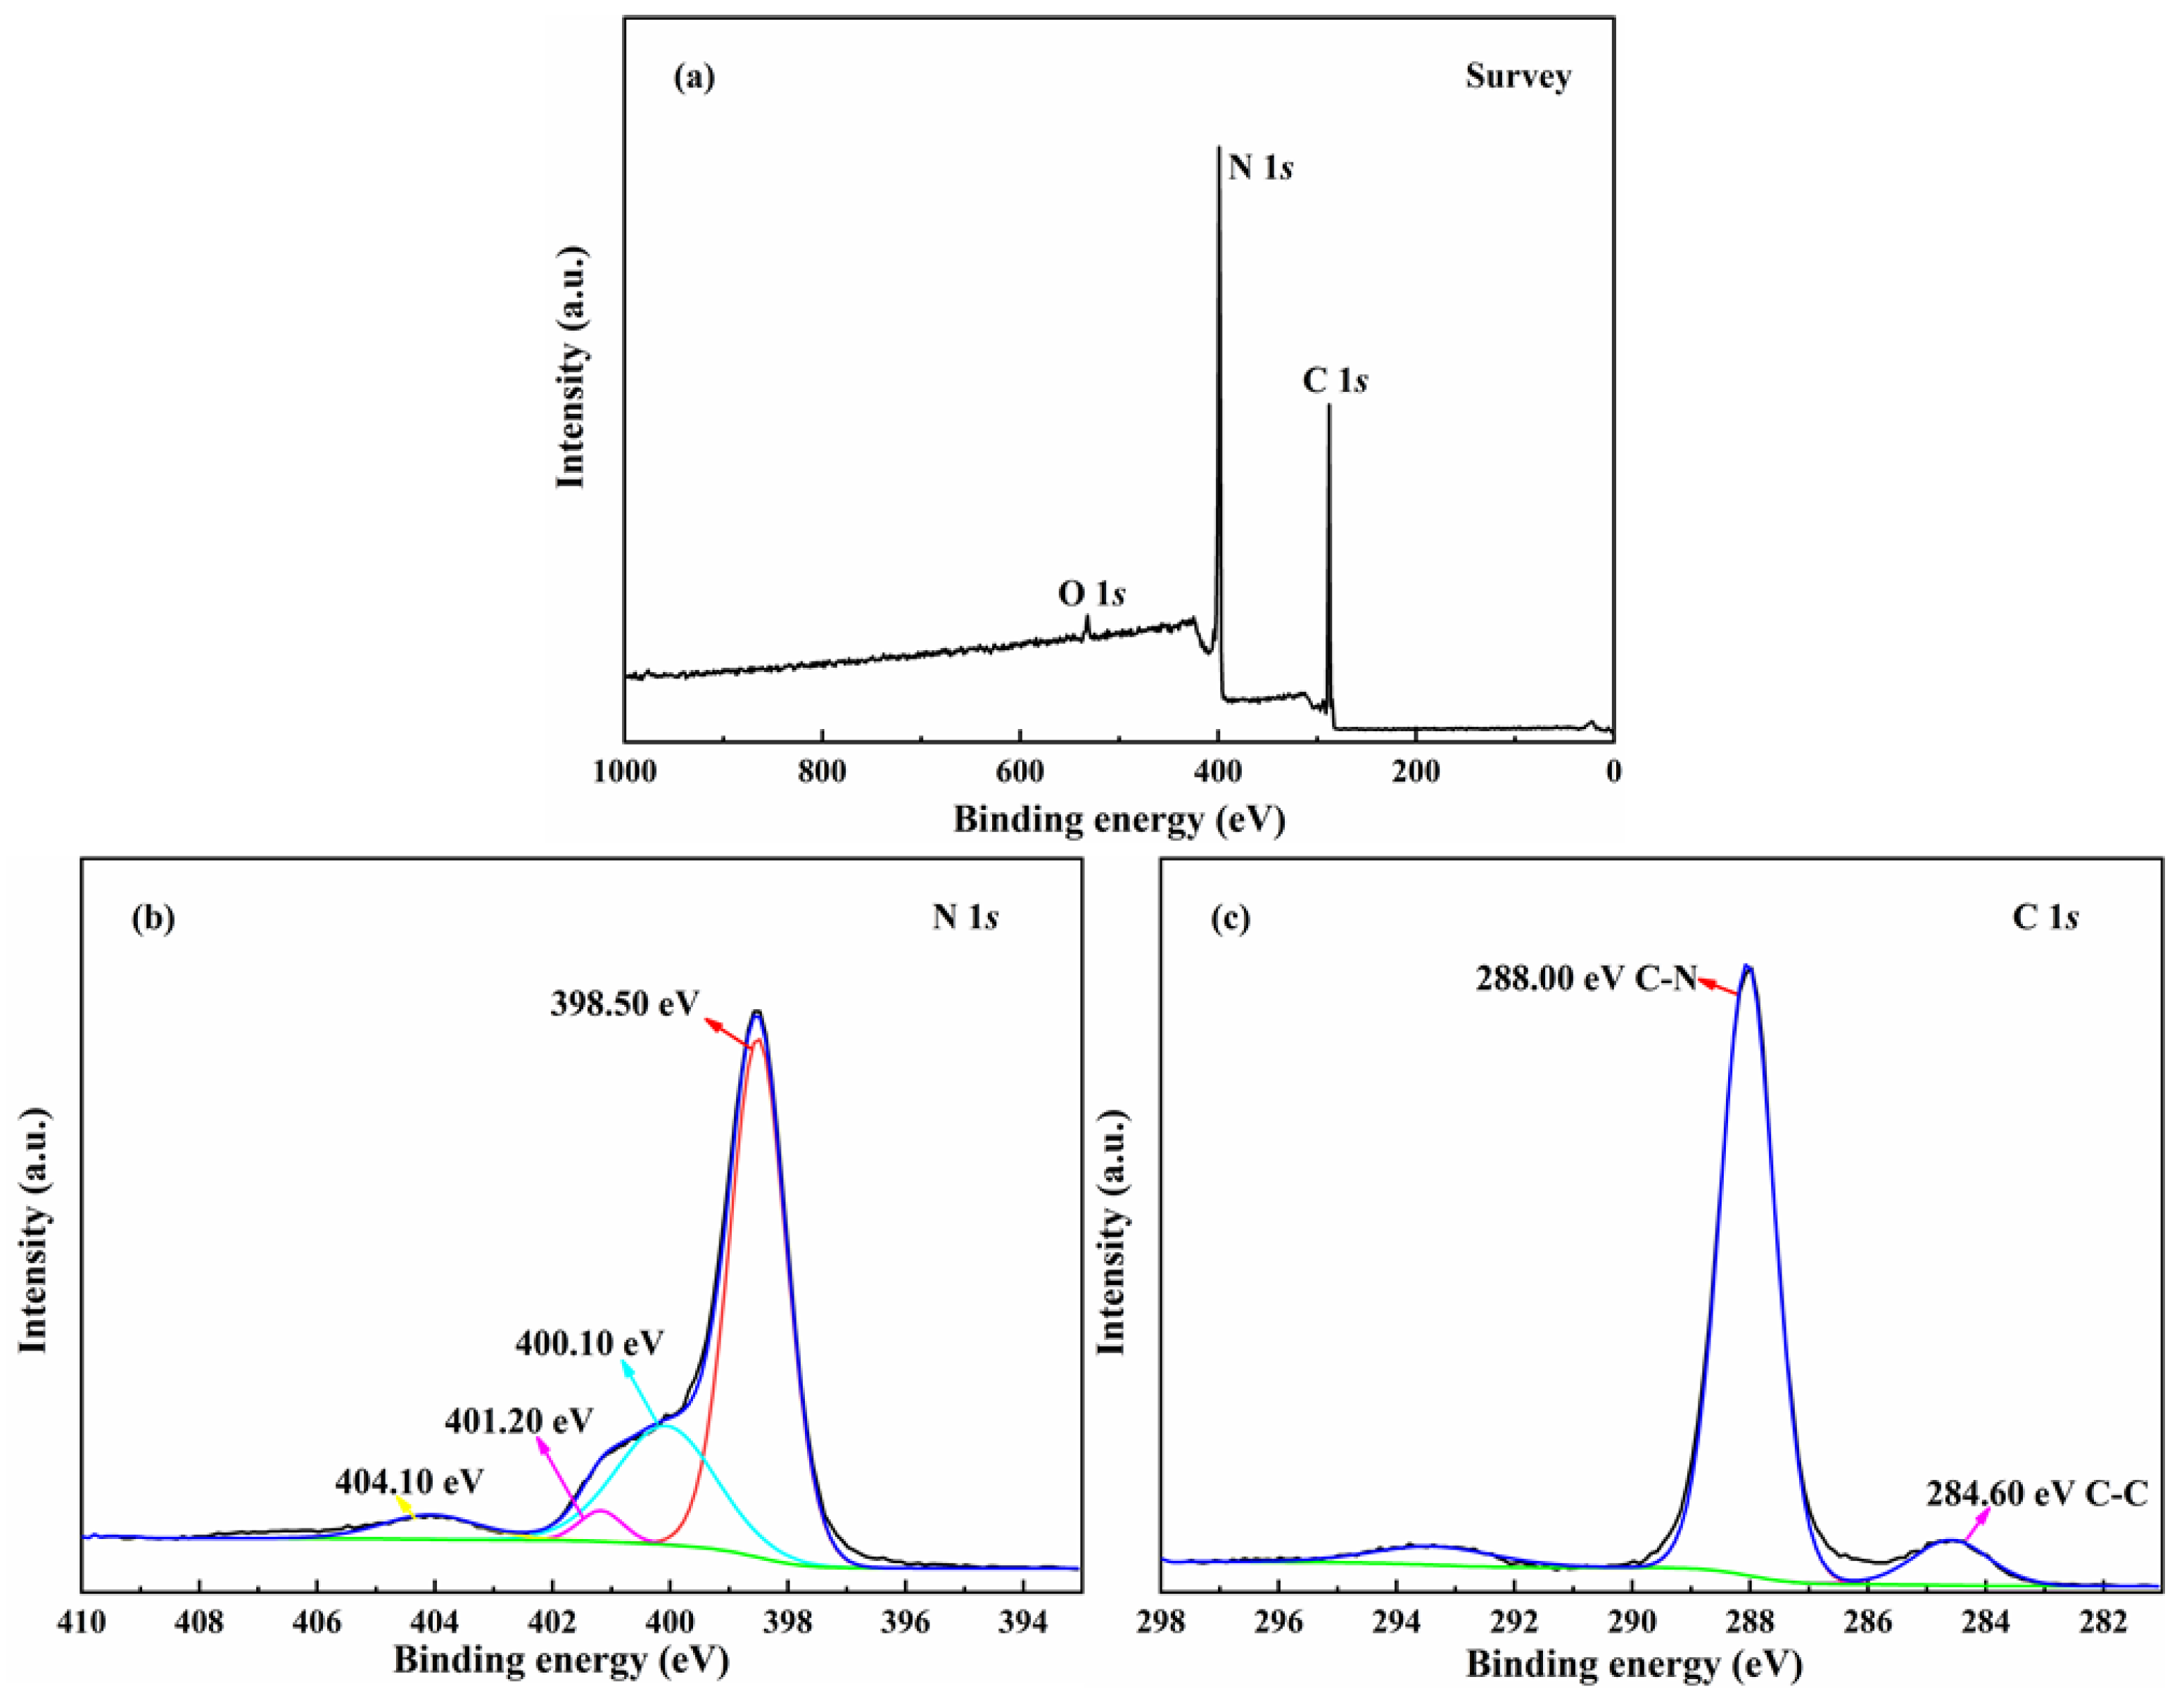
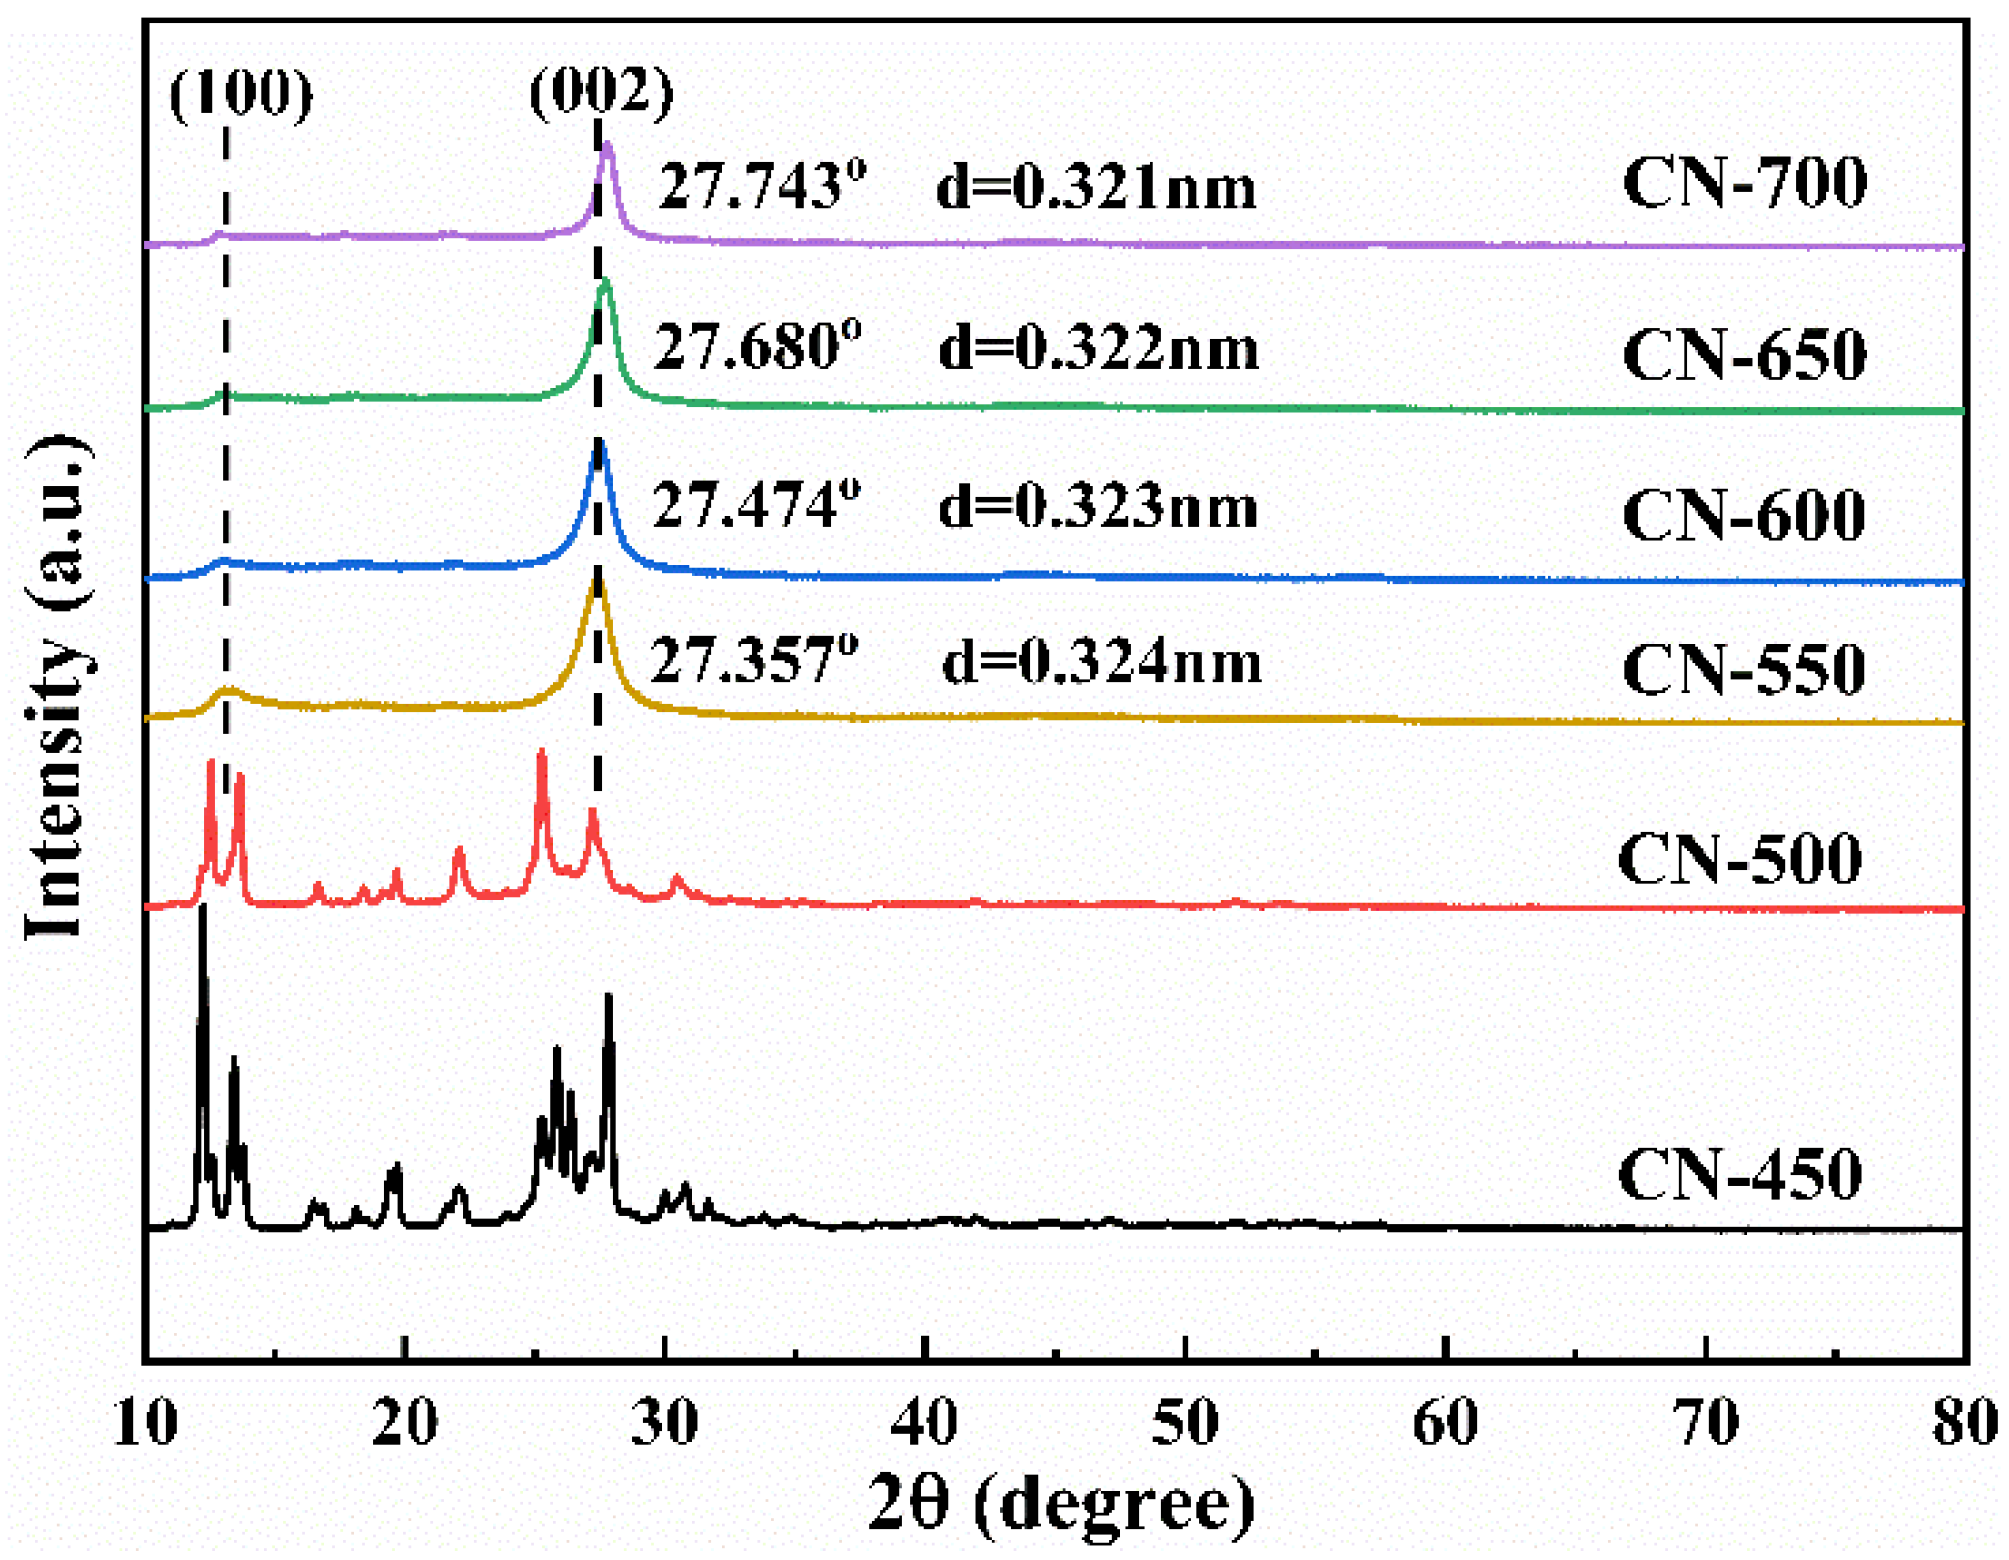
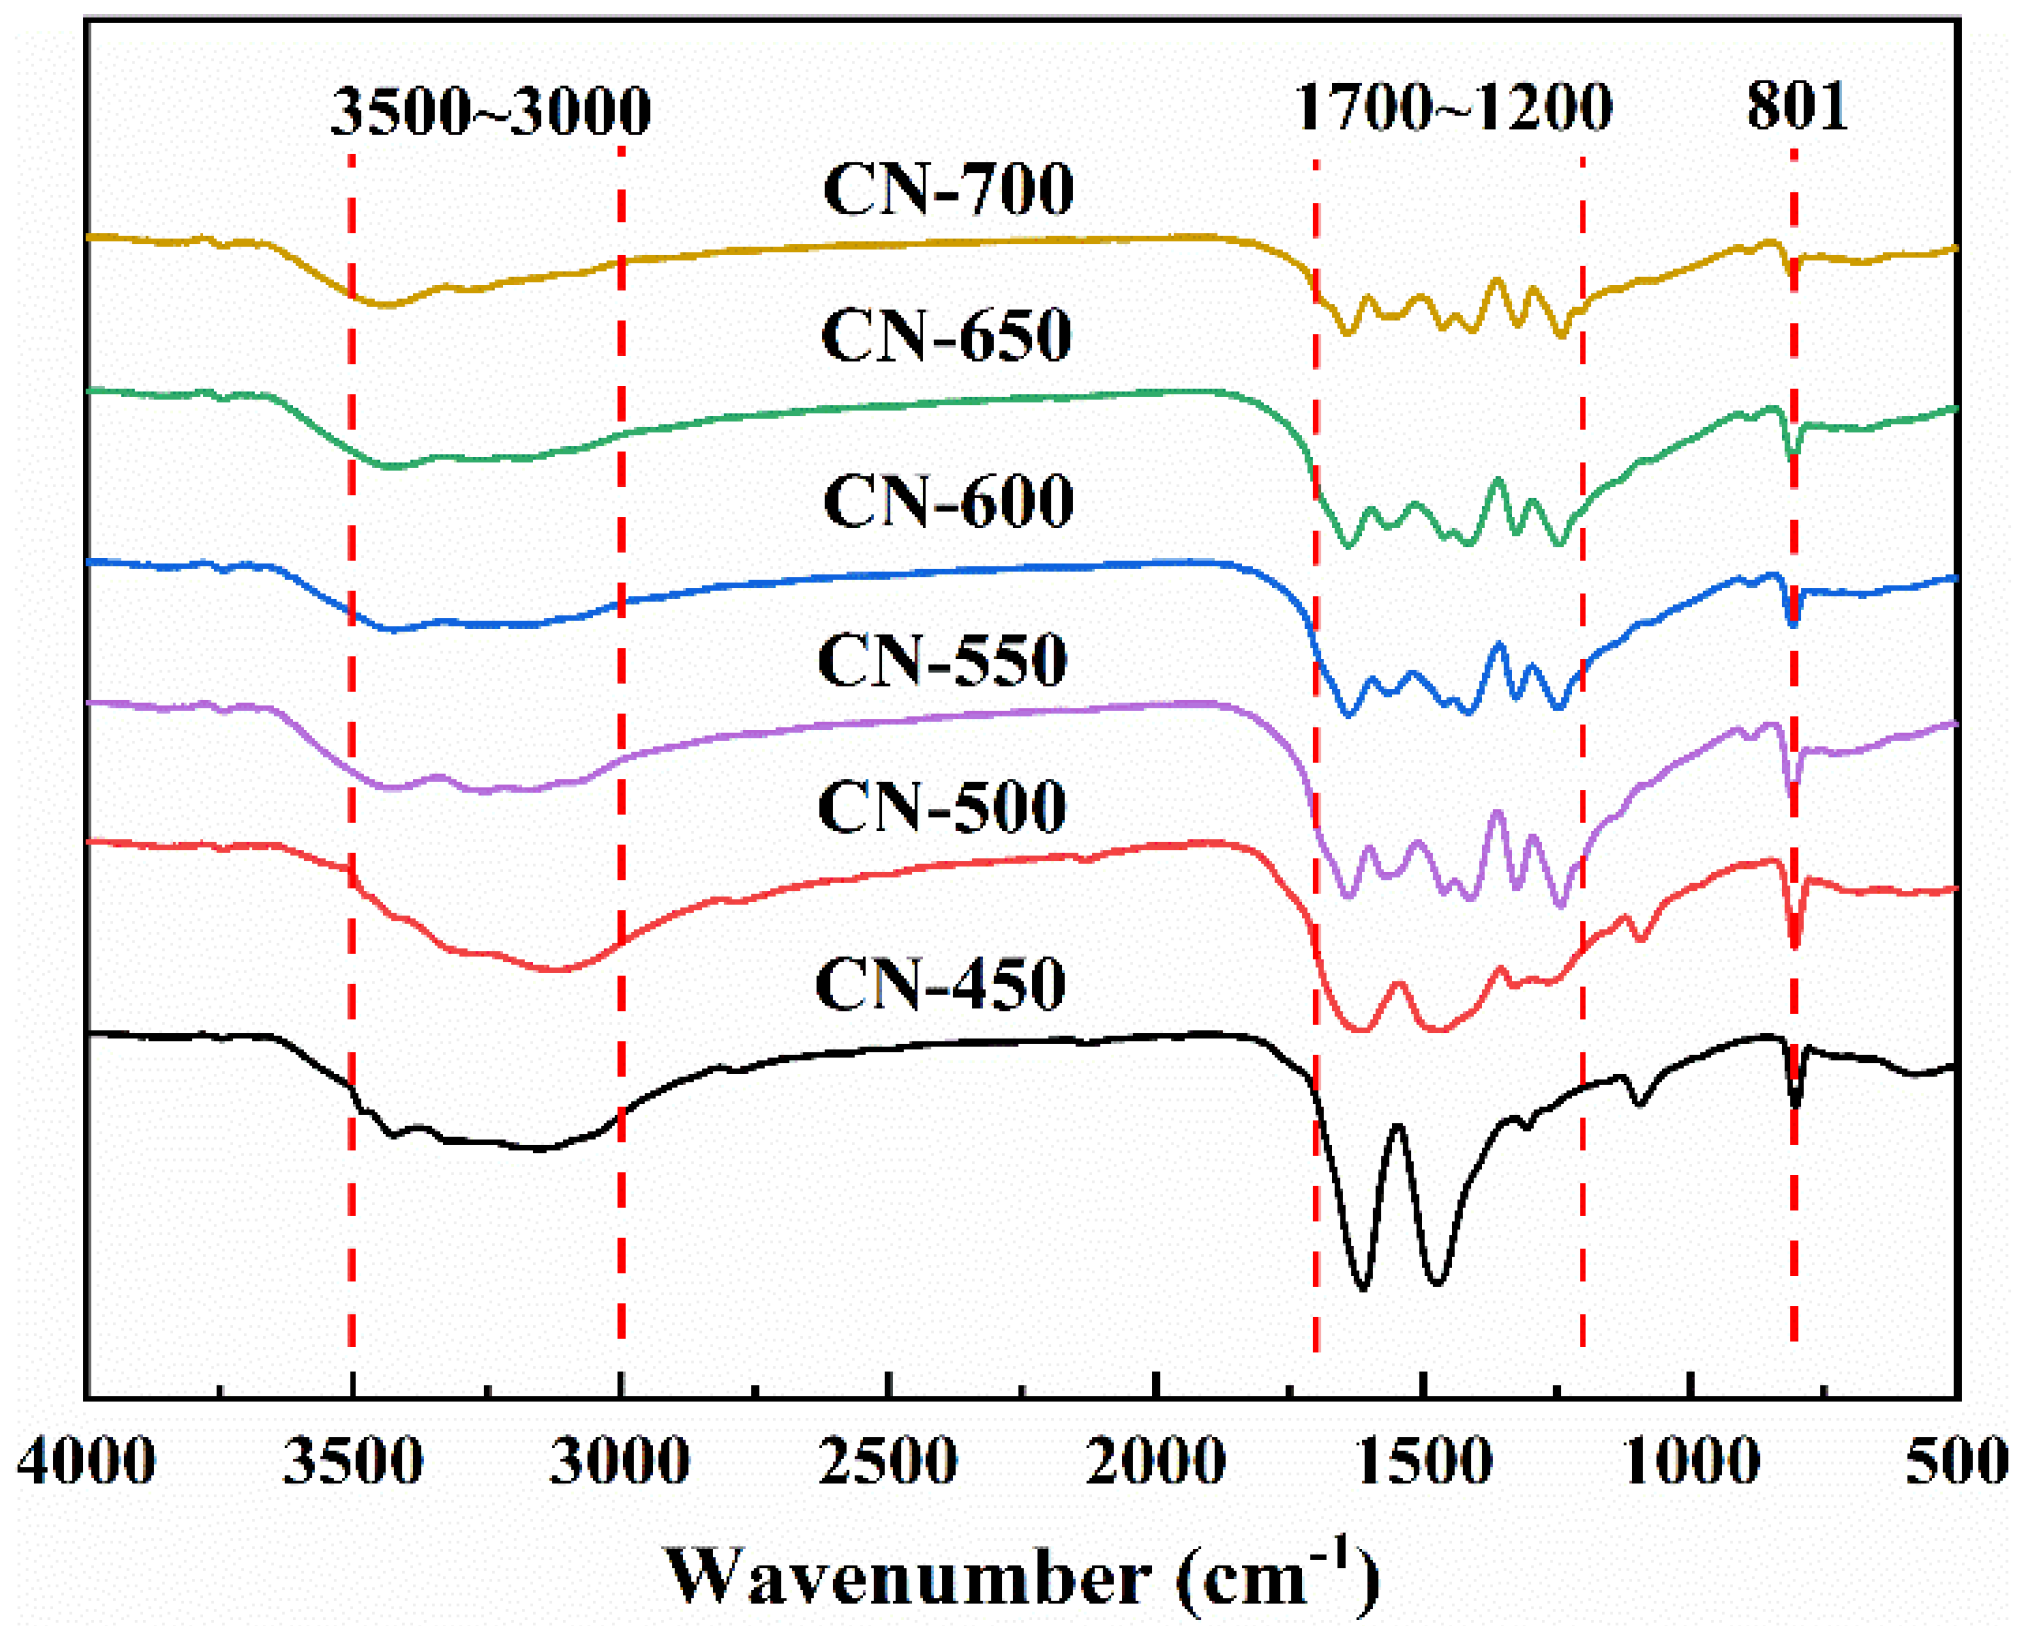
2.1.2. Structure and Composition Analysis
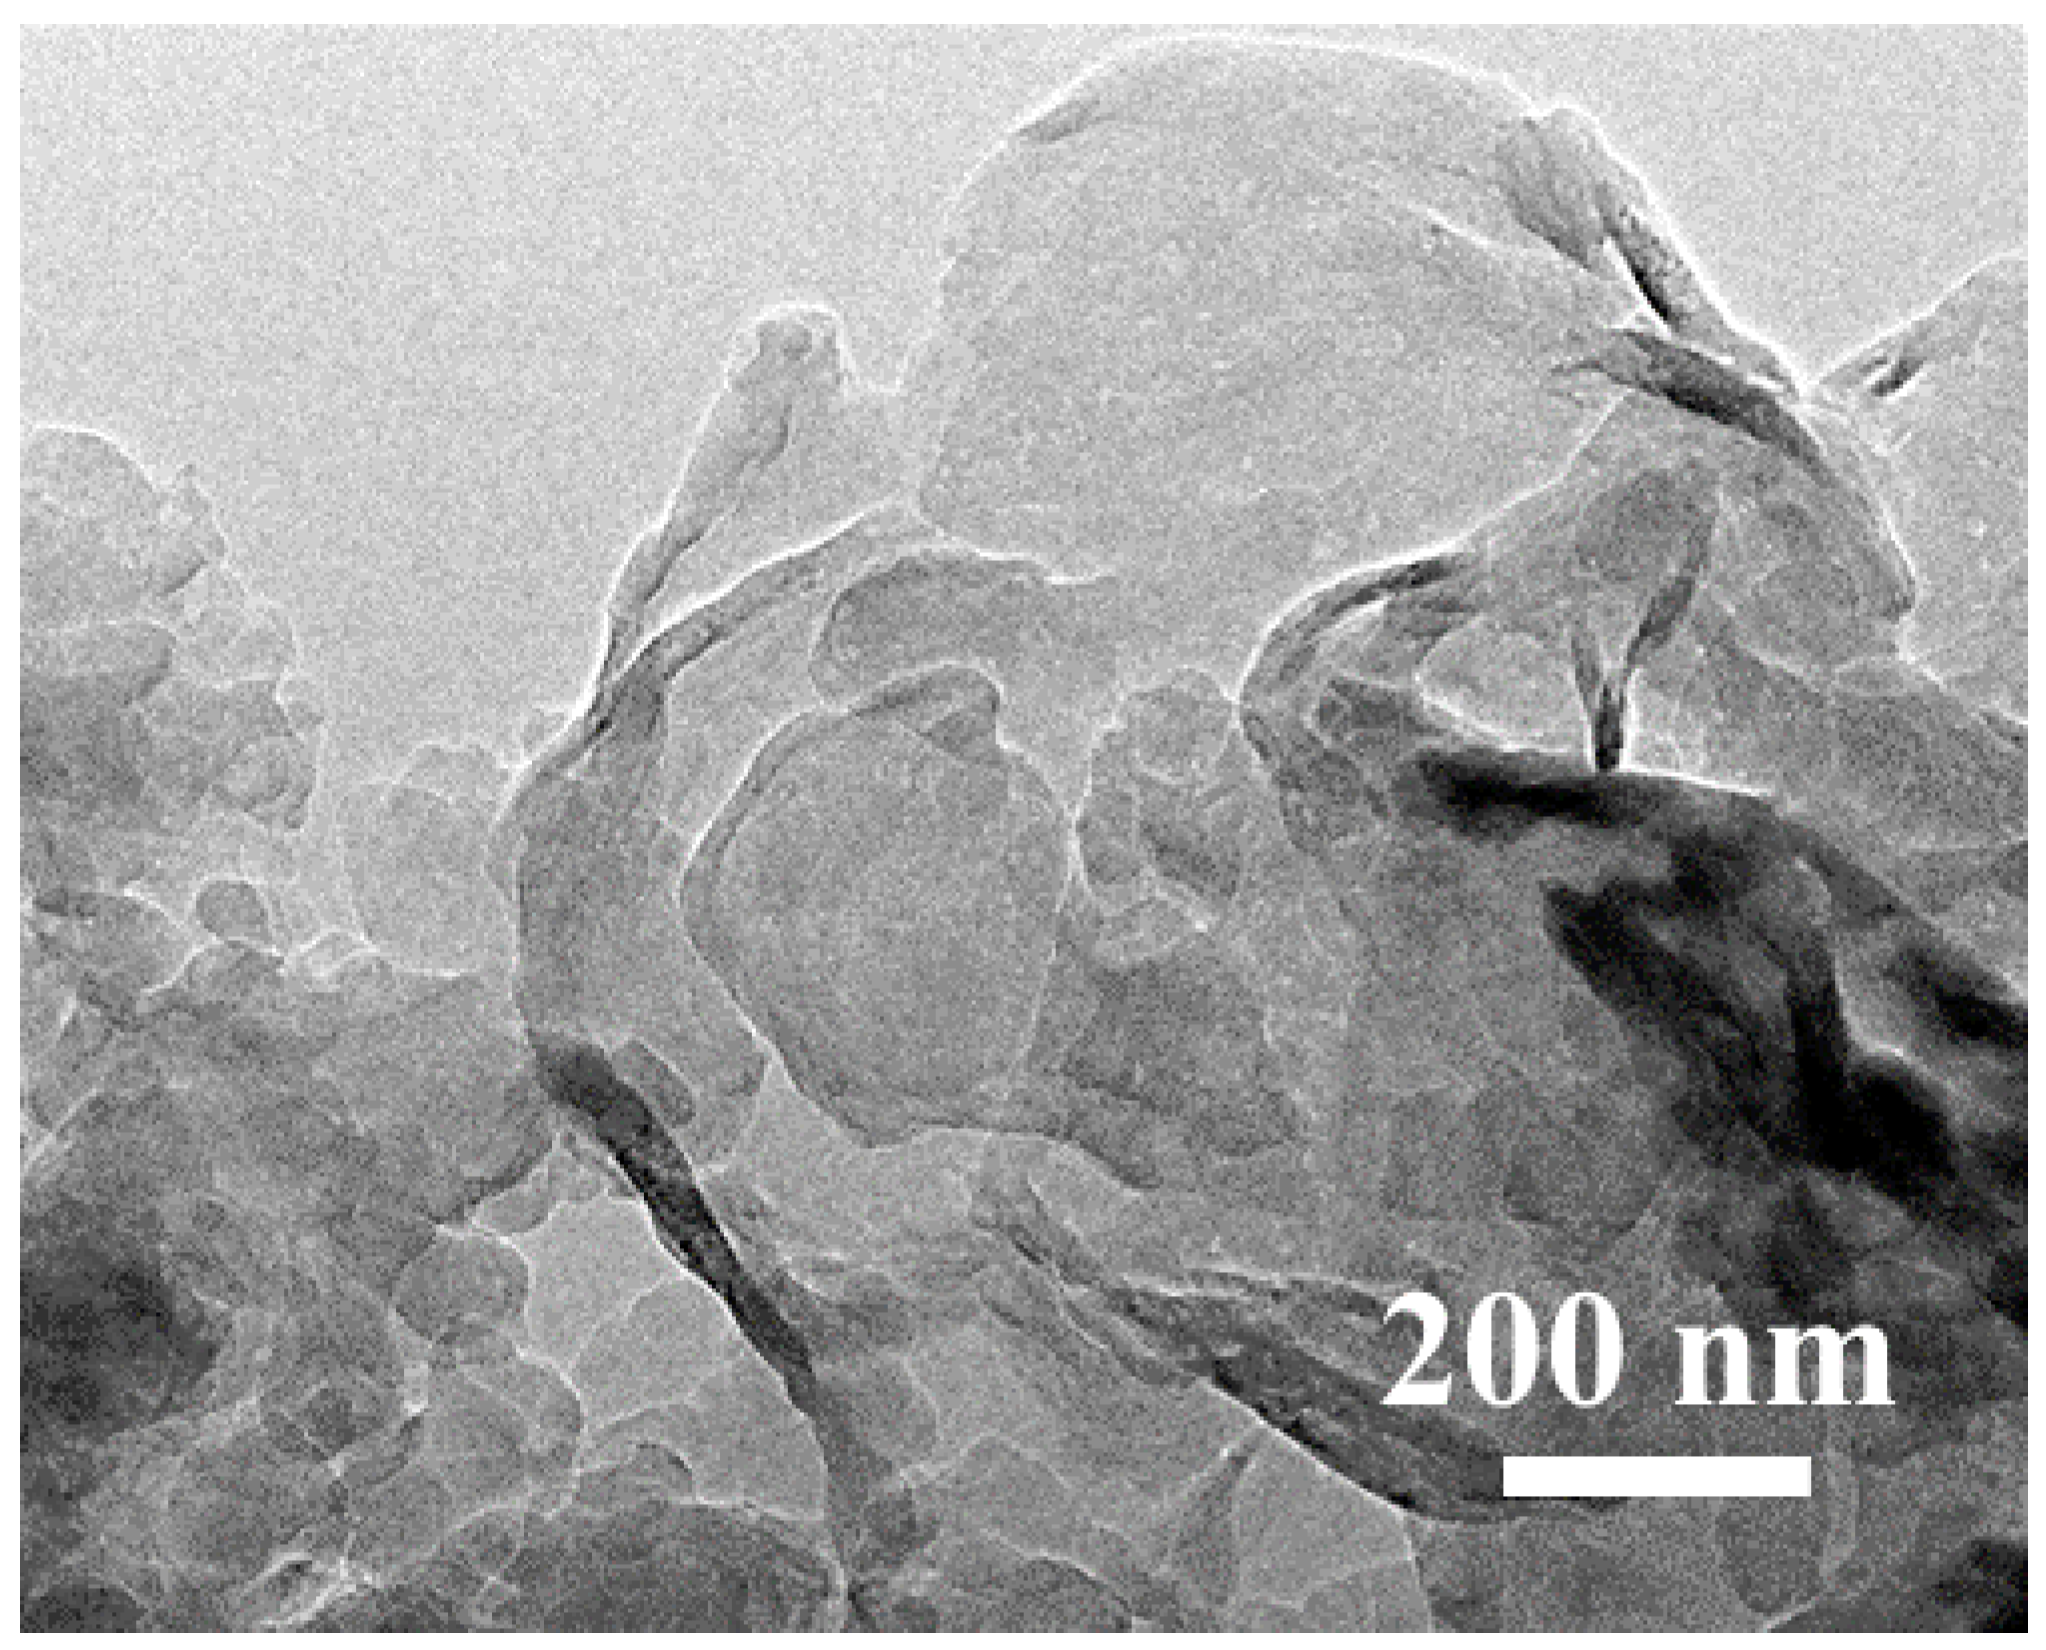
2.1.3. Microstructure Analysis
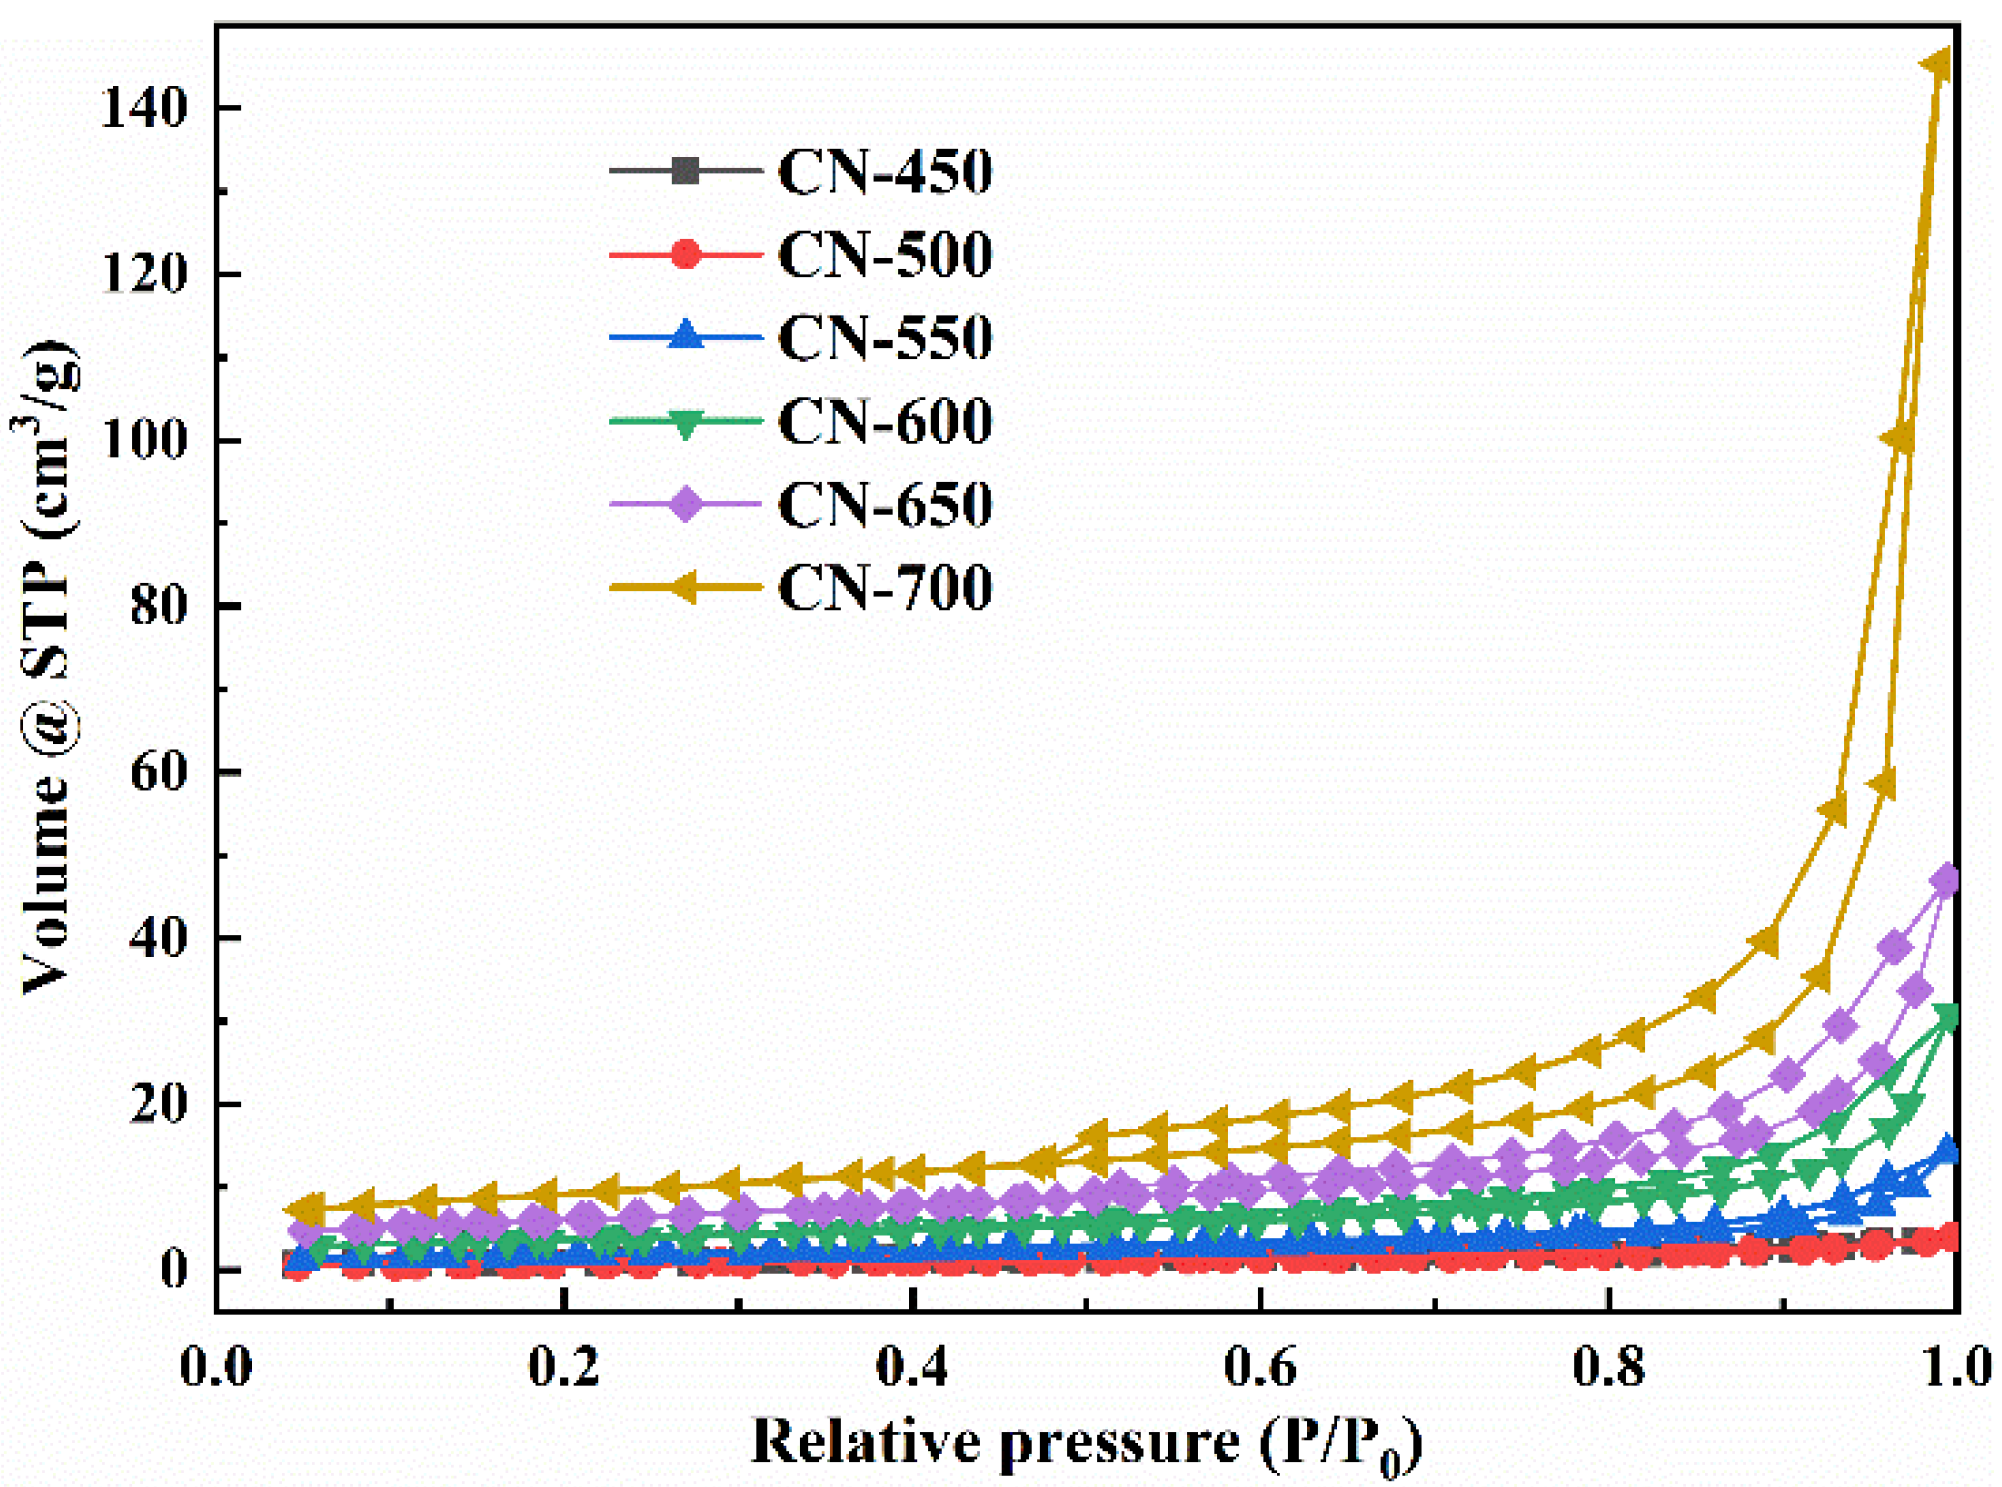
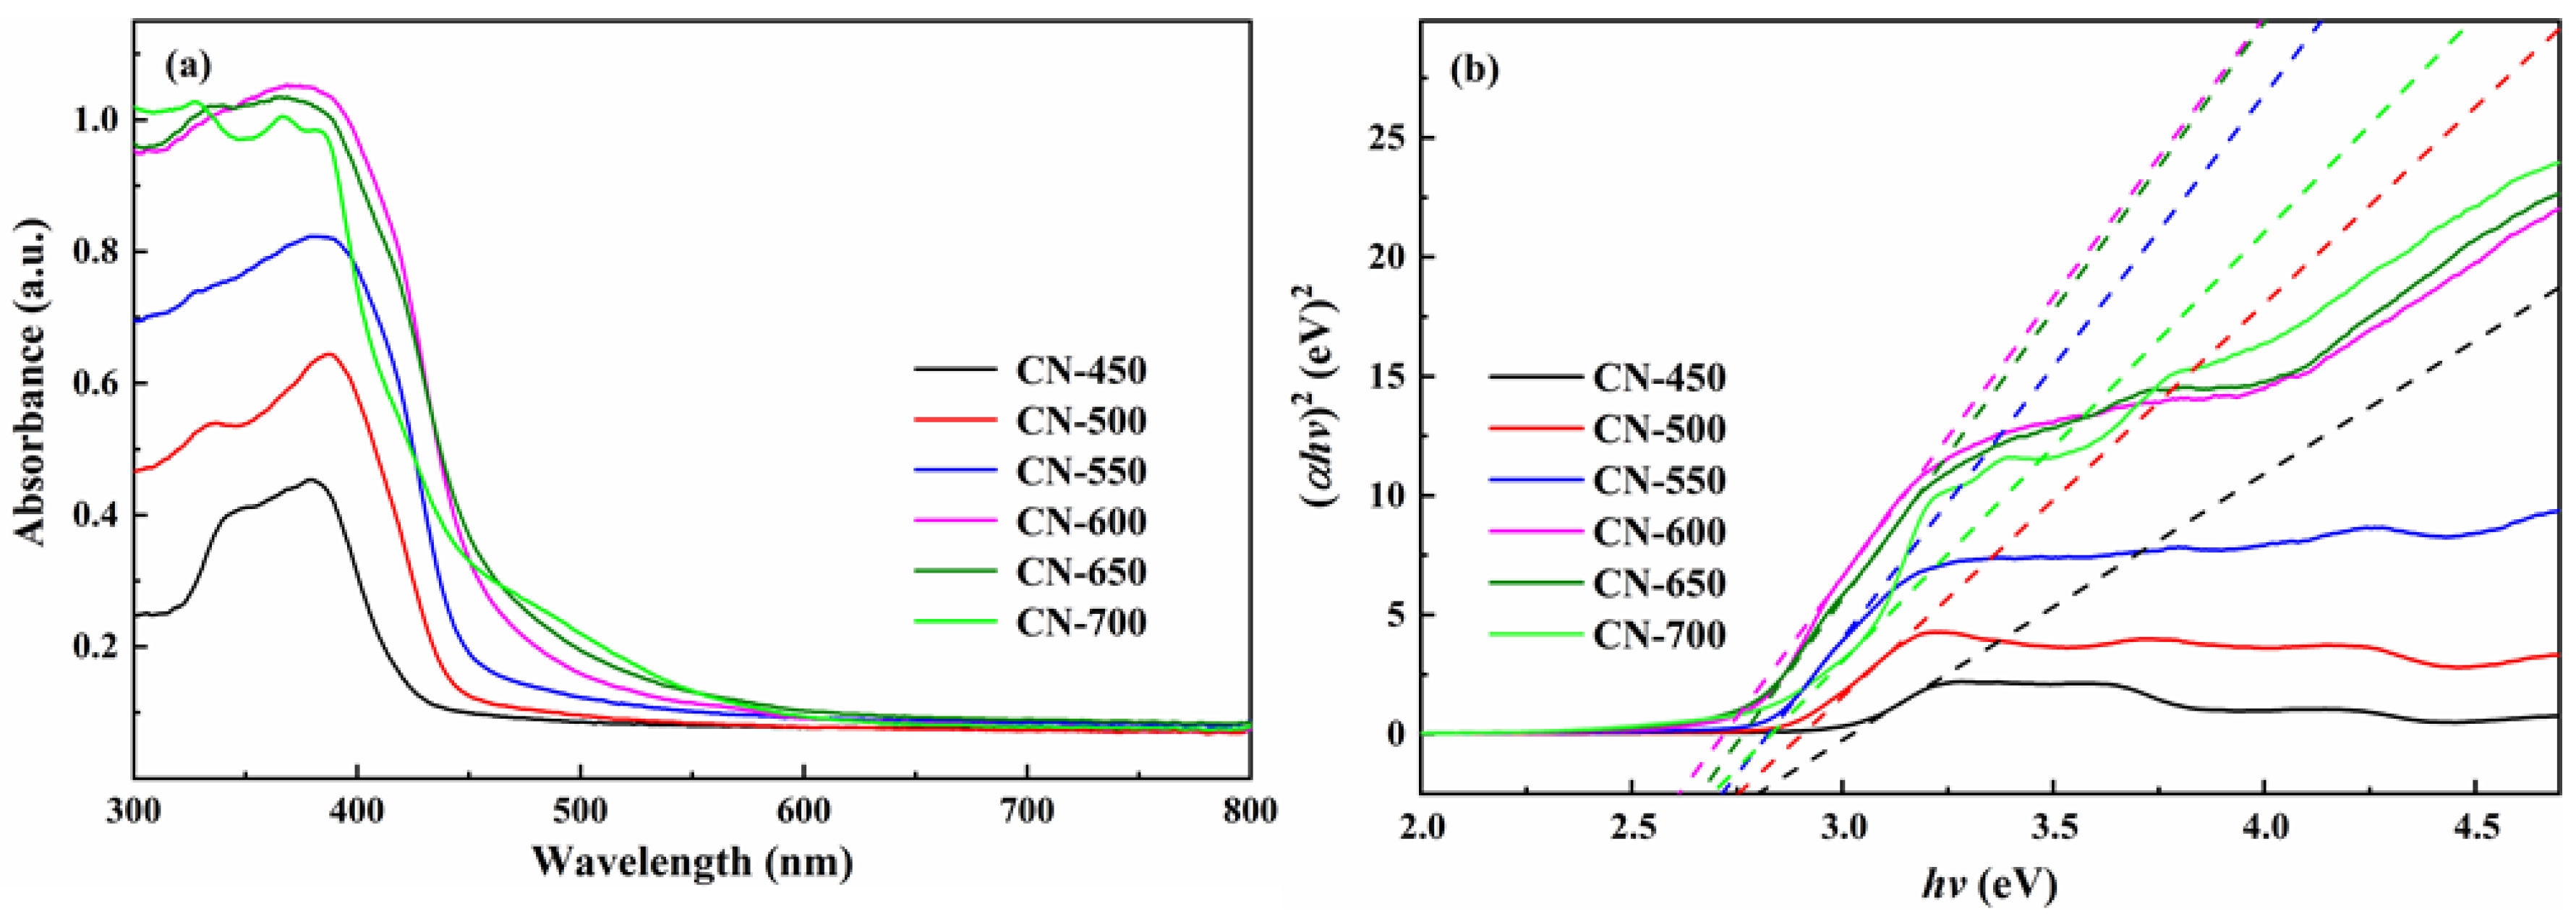
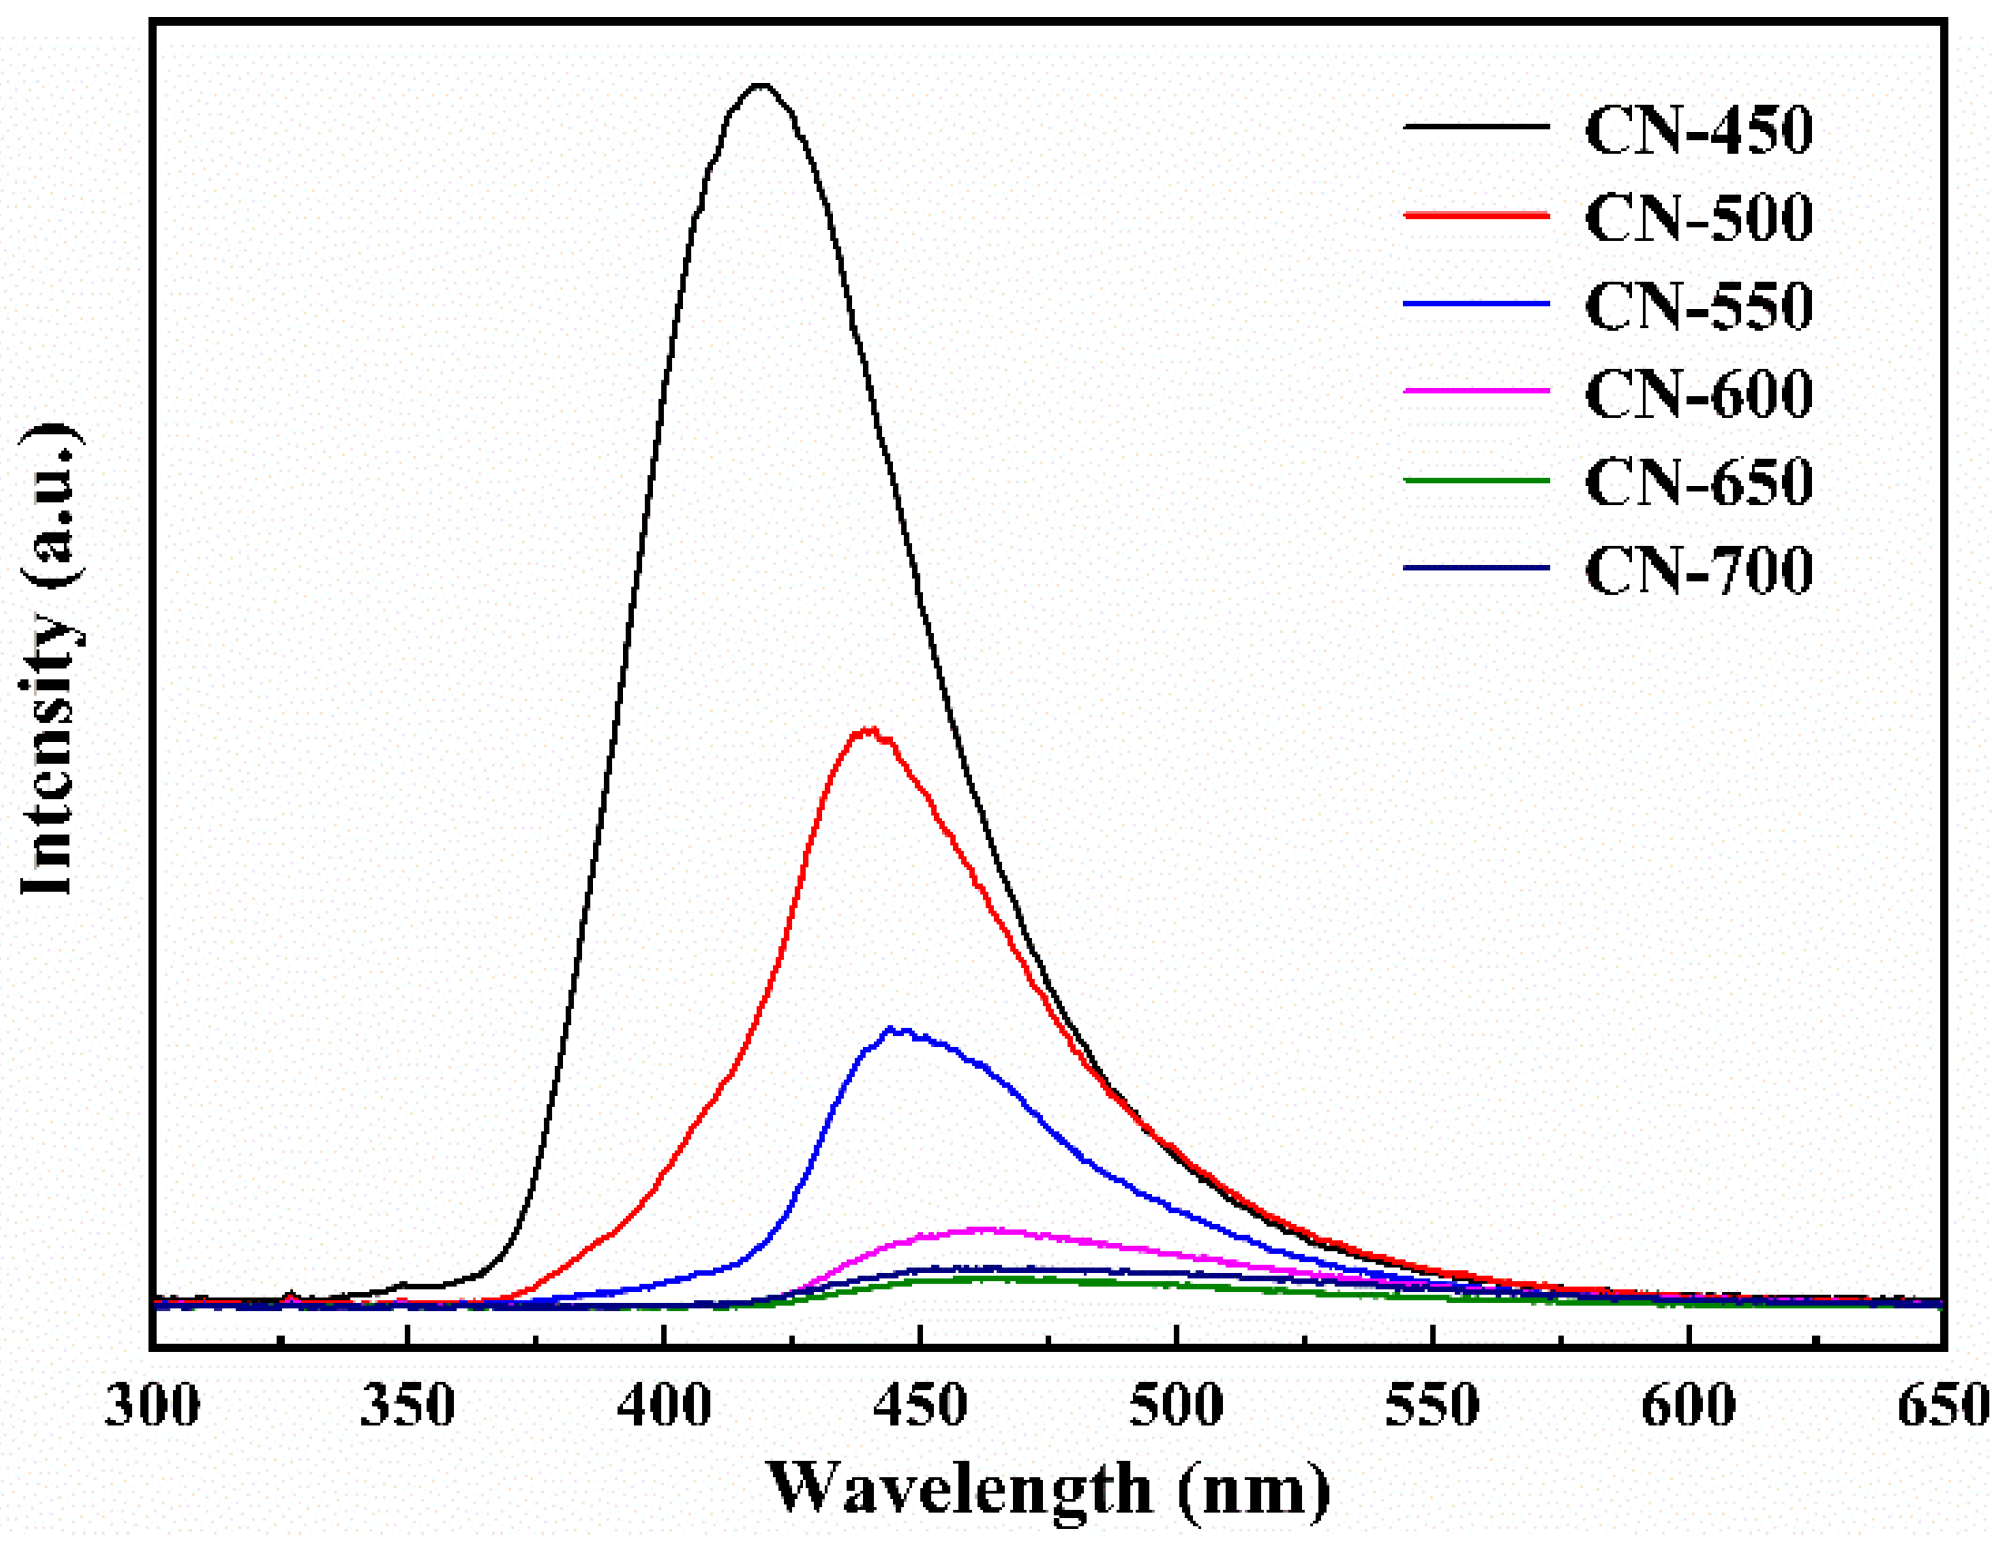
2.1.4. Optical Performance Analysis
2.2. Photocatalytic Activity Studies
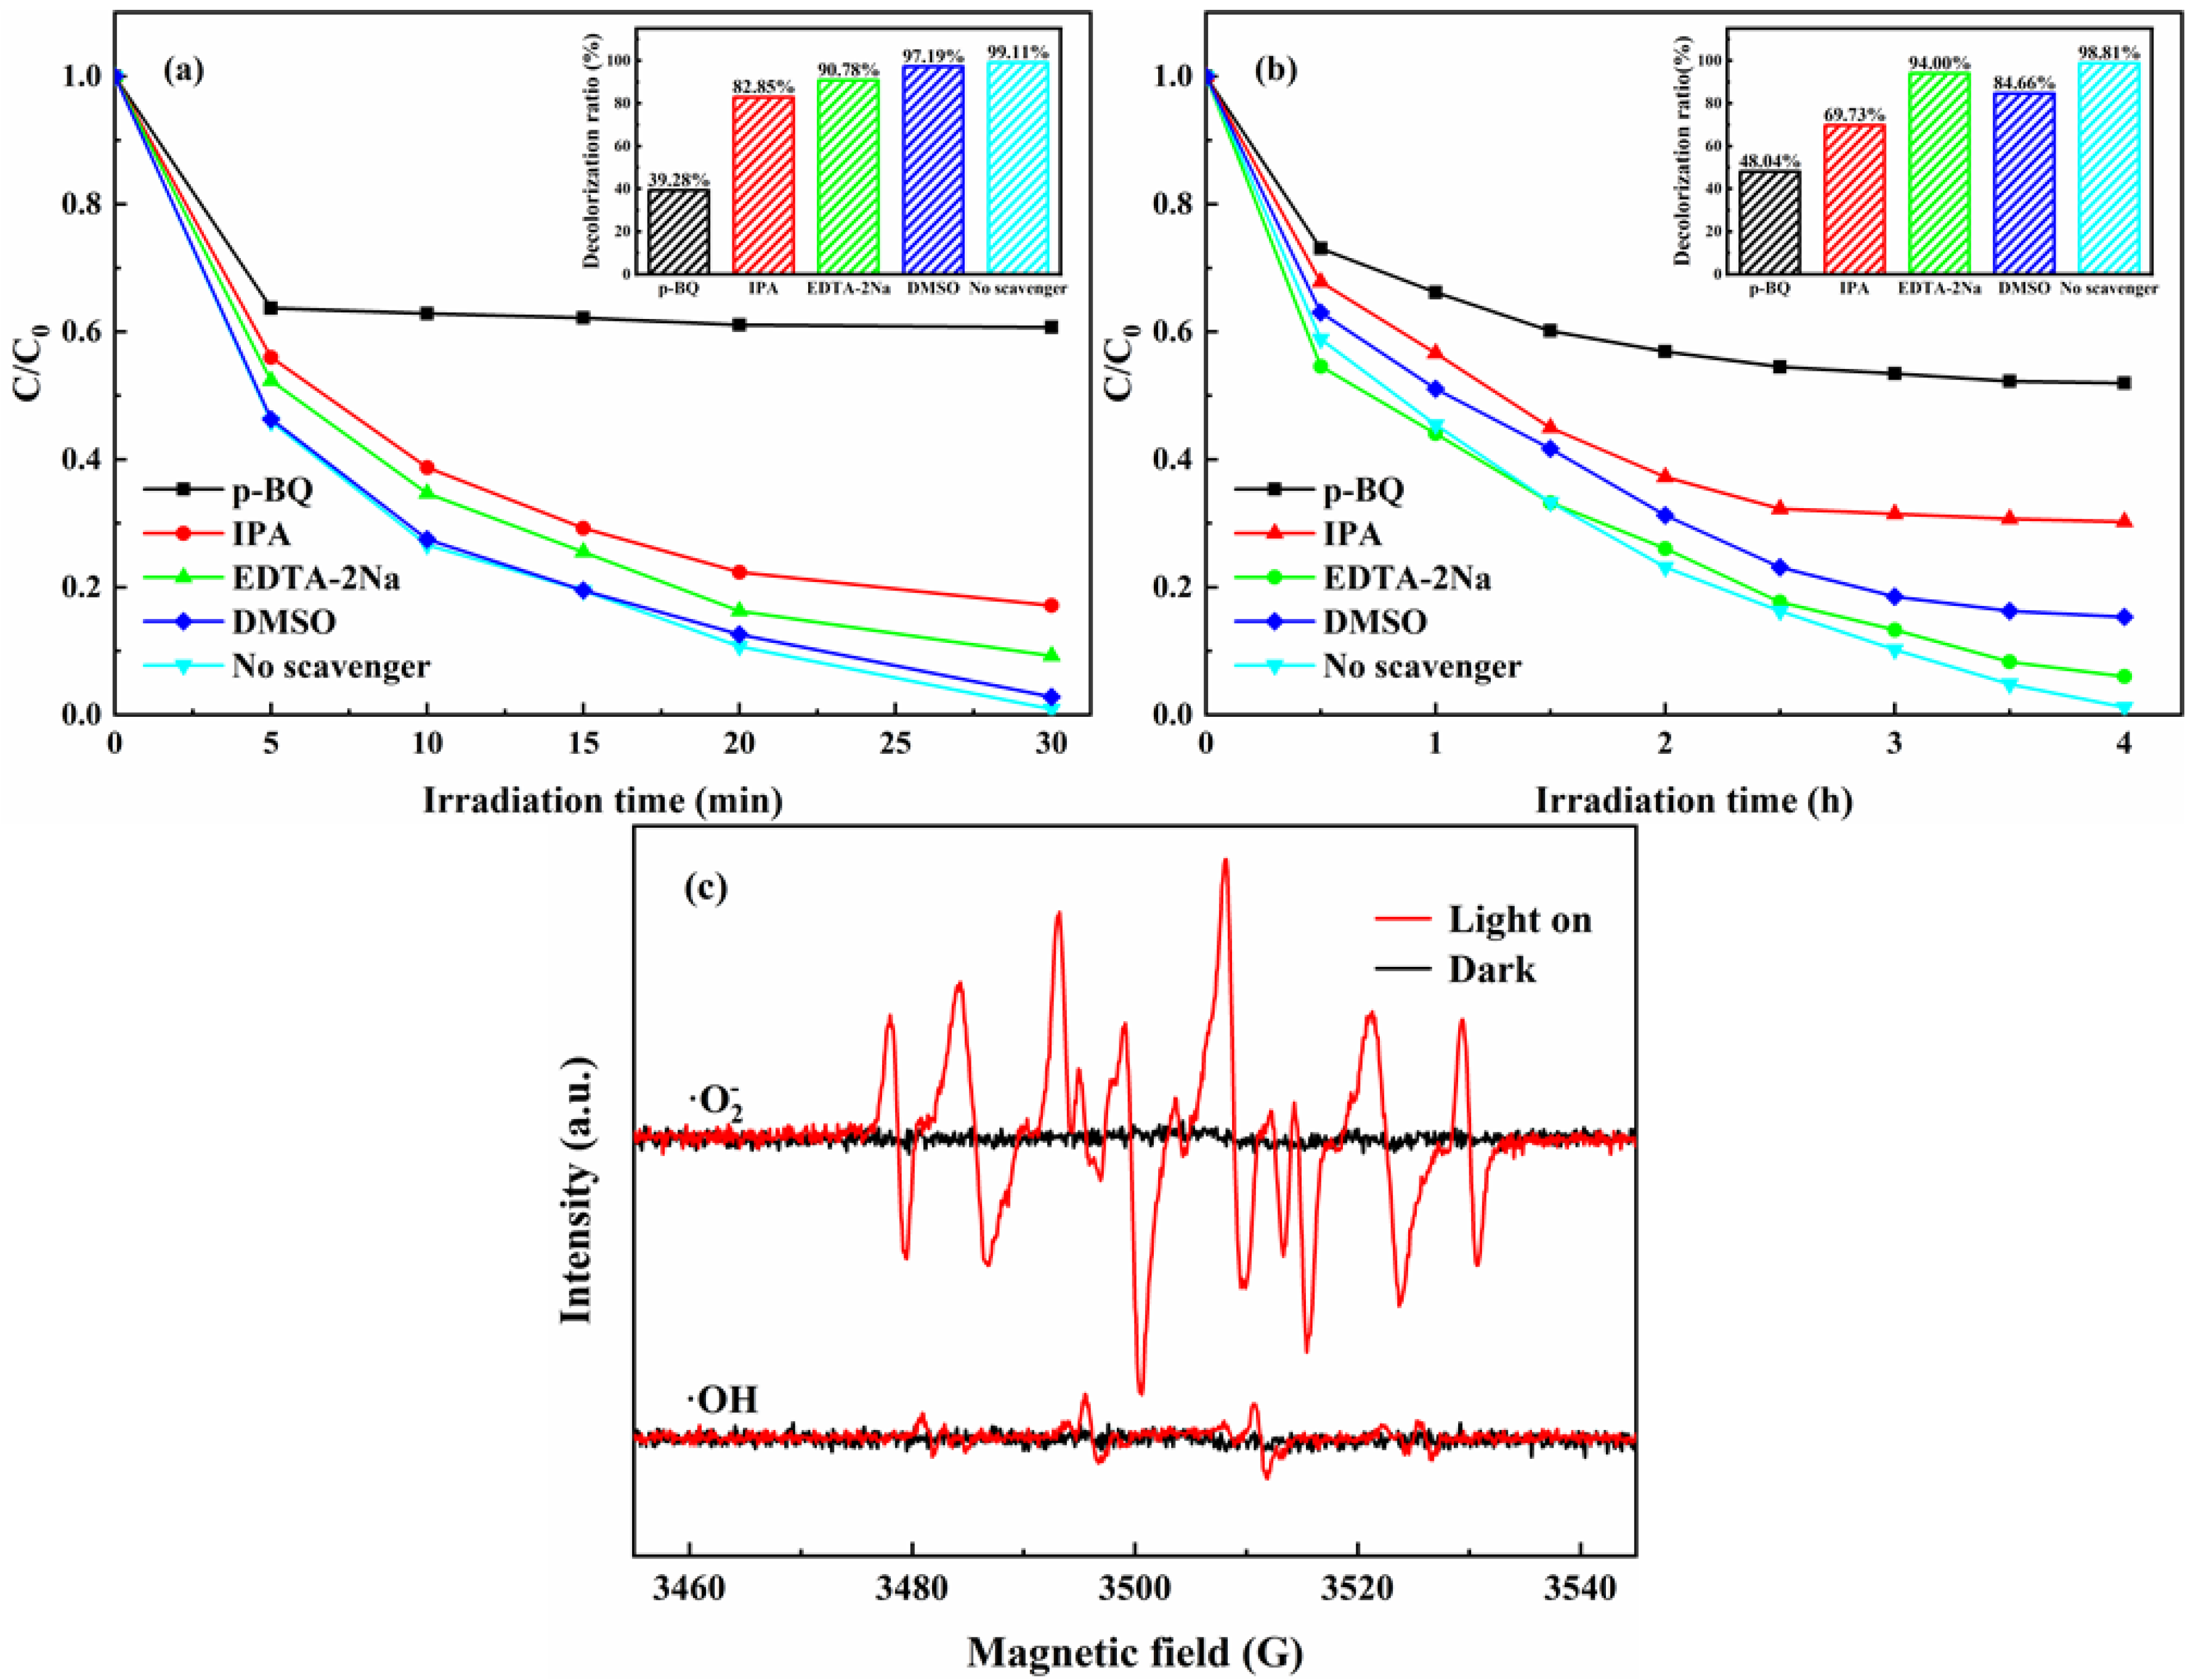
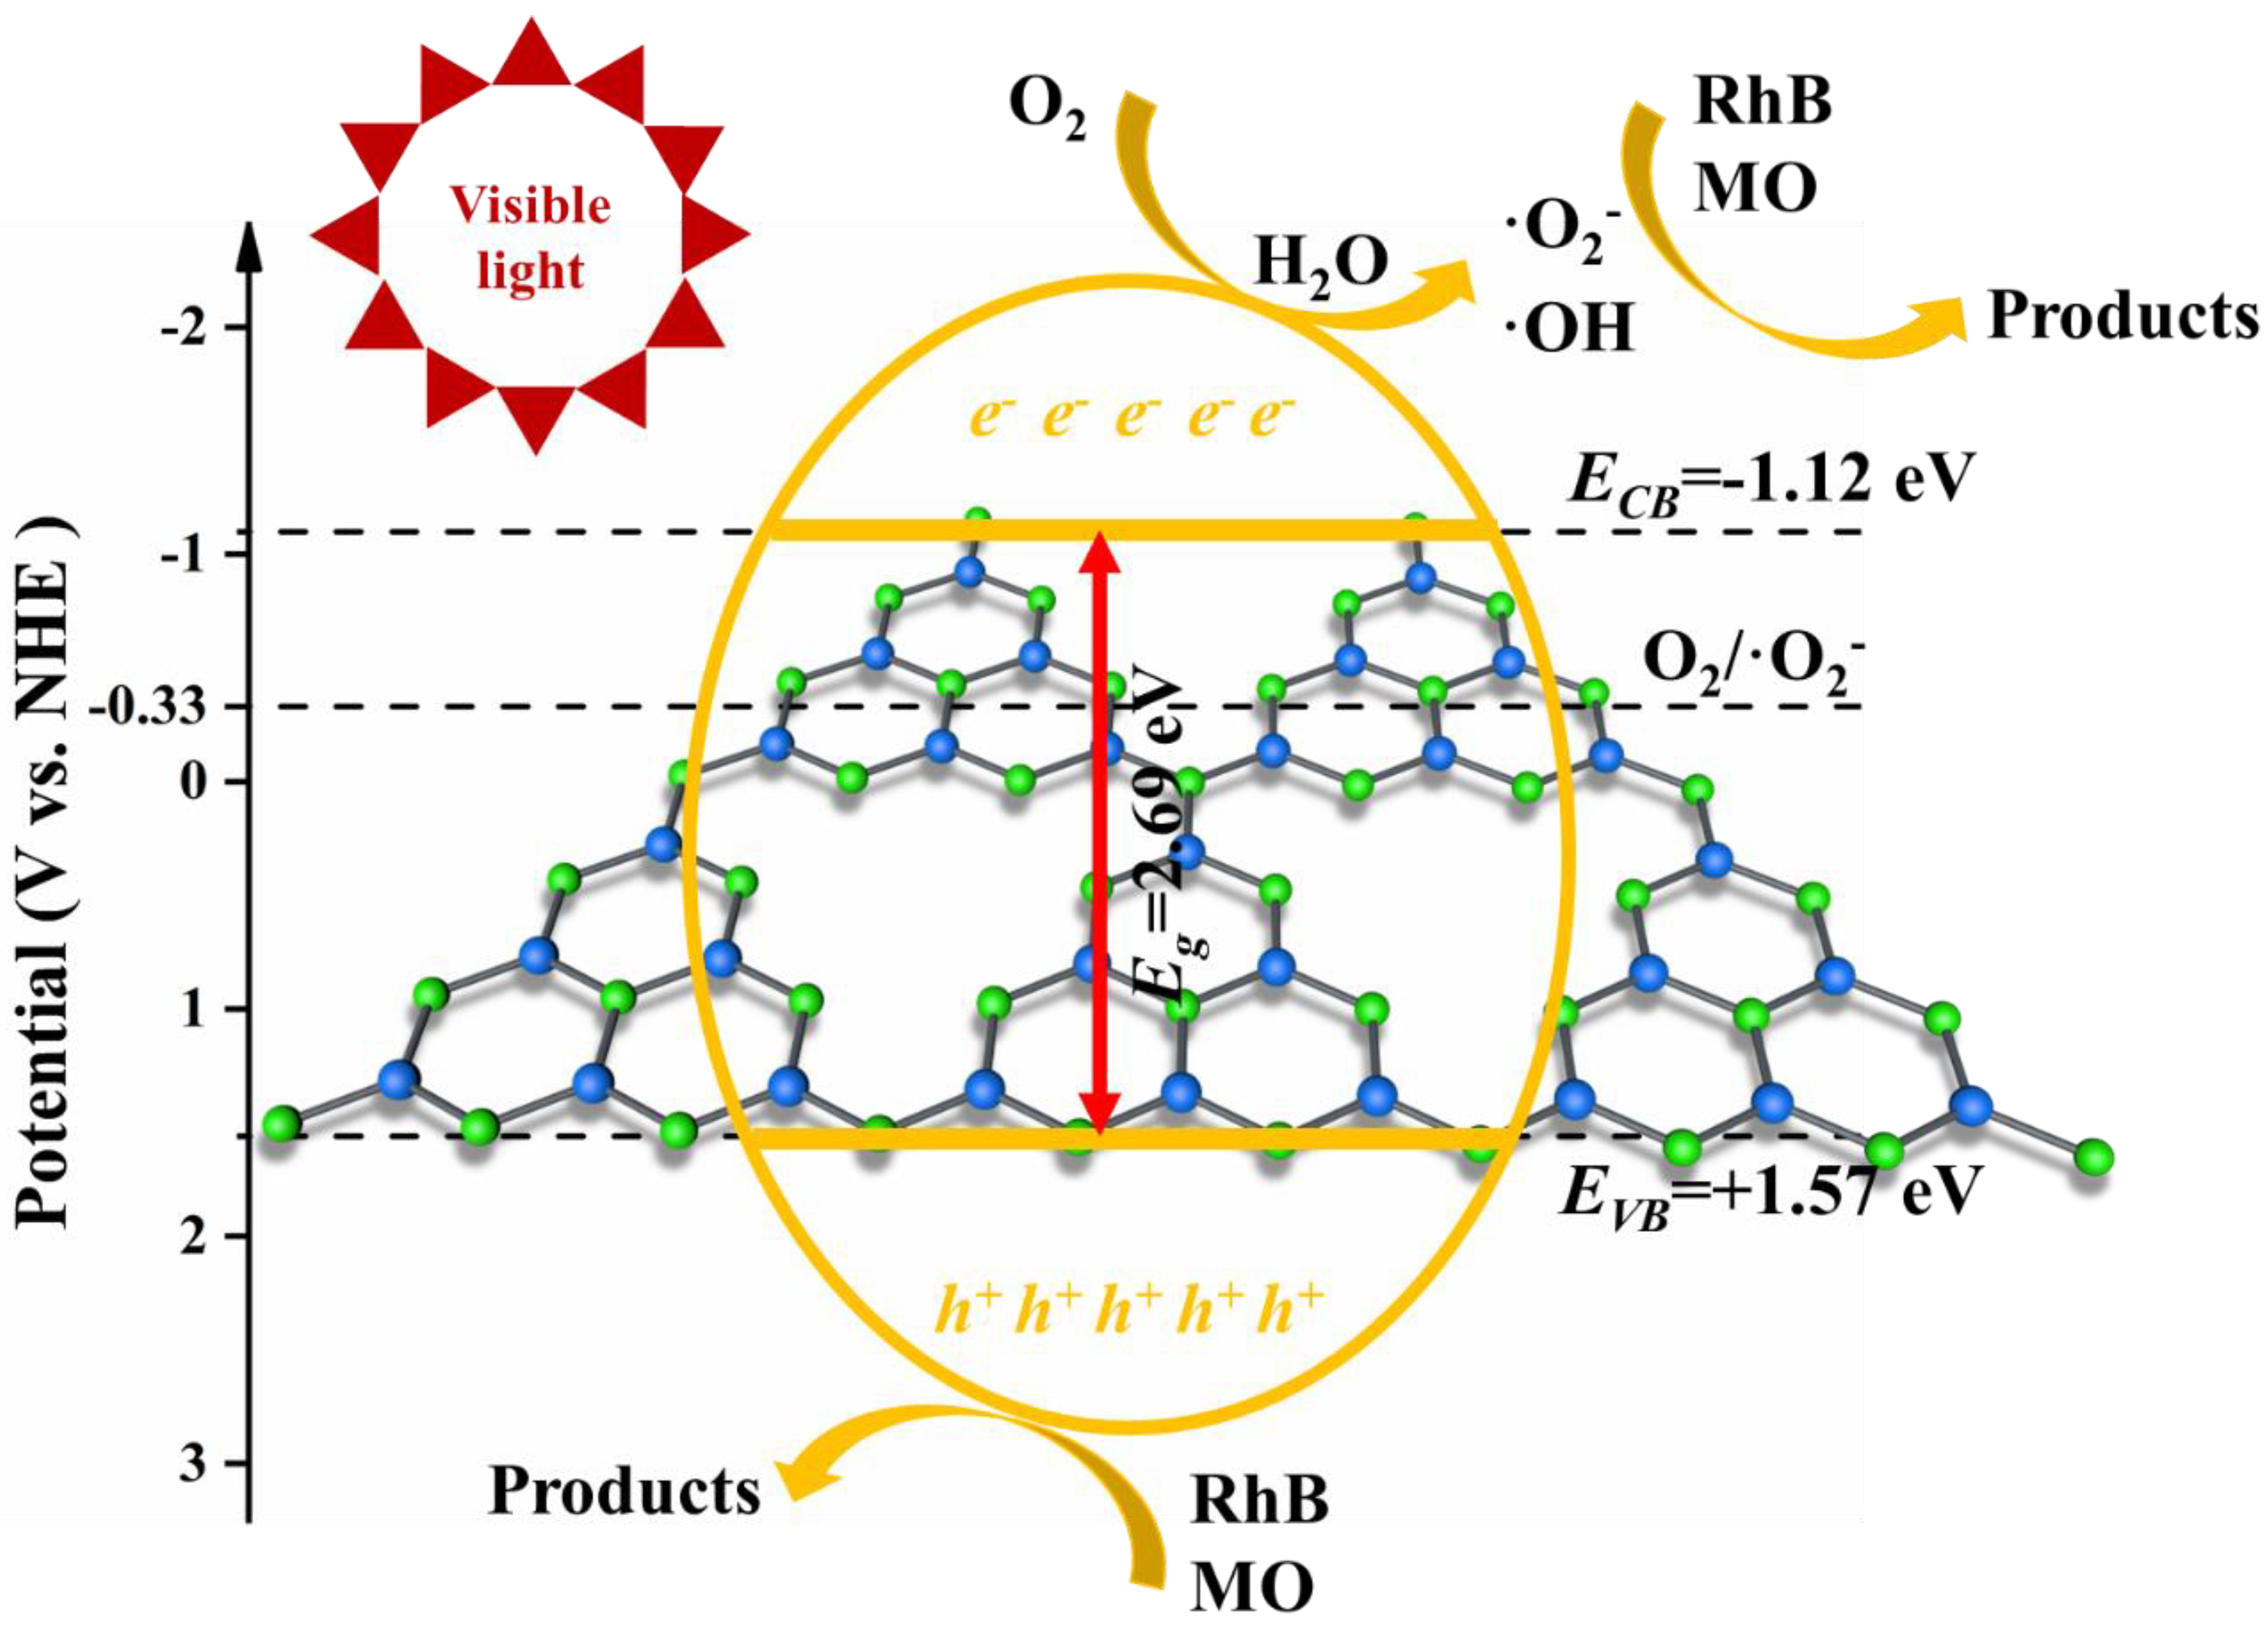
2.3. Possible Mechanism
3. Conclusions
4. Materials and Methods
4.1. Materials
4.2. Photocatalyst Synthesis
4.3. Characterization
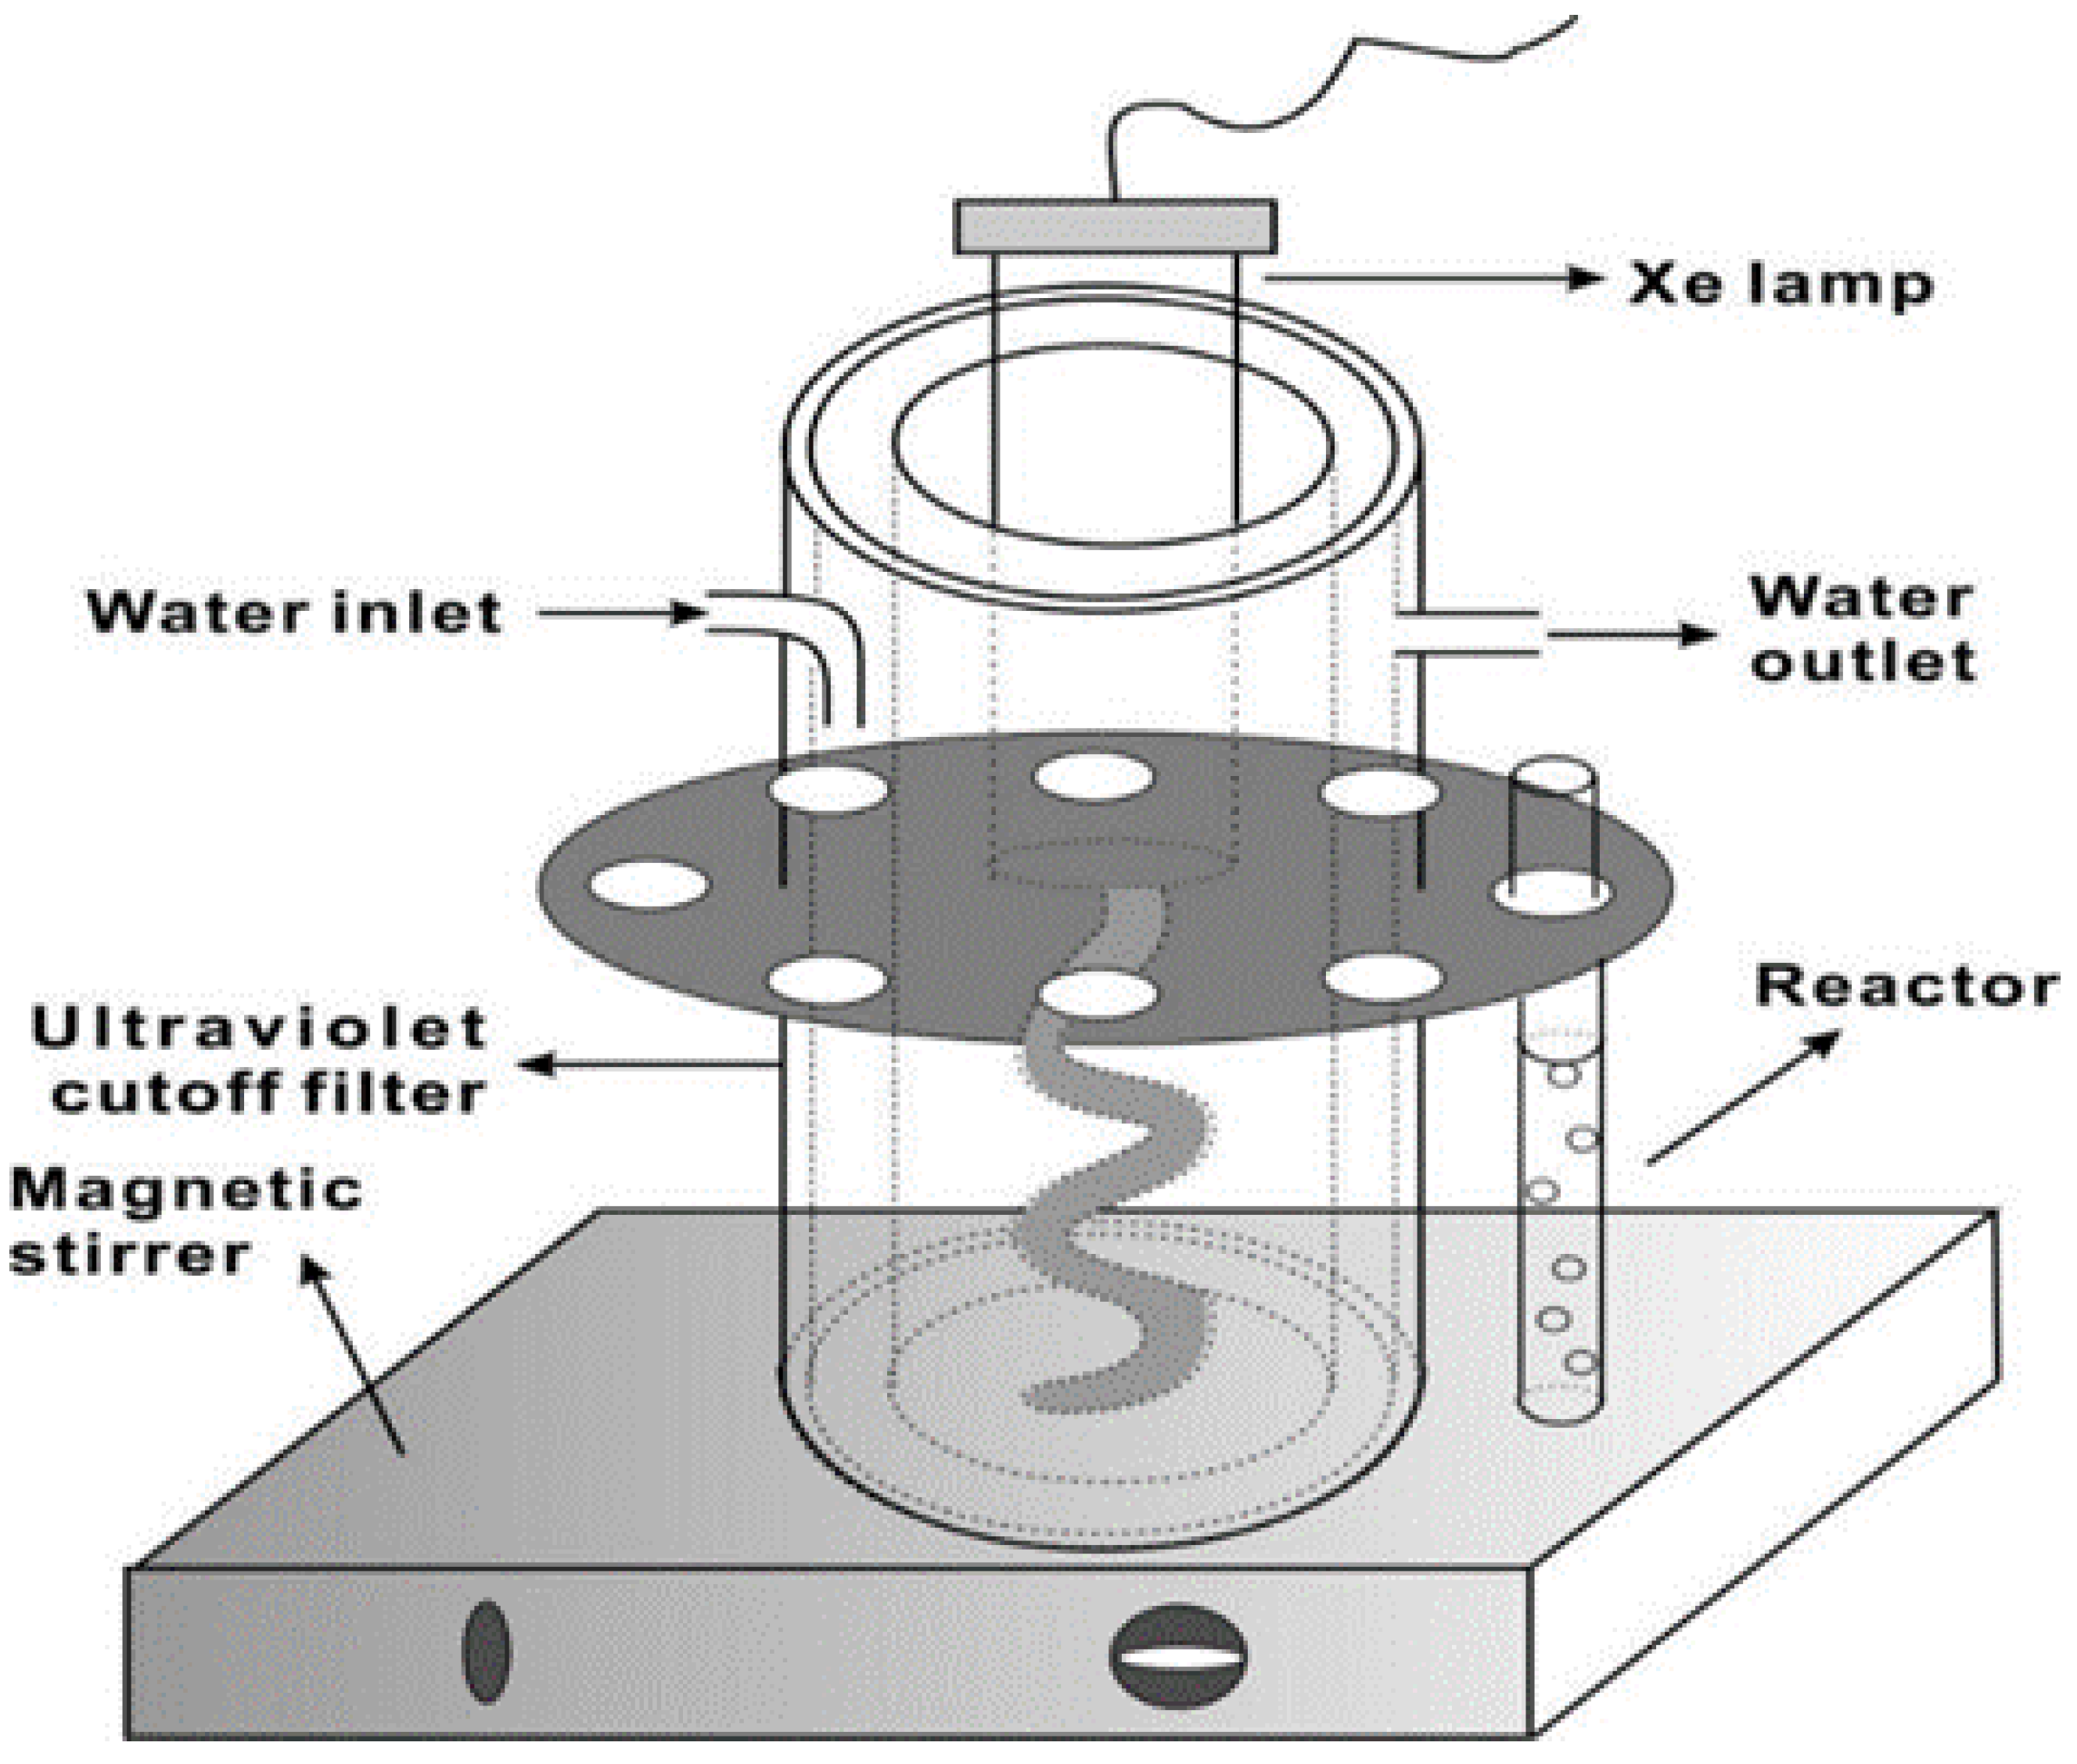
4.4. Photocatalytic Experiments
4.5. Trapping Experiments of Radicals
Author Contributions
Funding
Data Availability Statement
Acknowledgments
Conflicts of Interest
Sample Availability
References
- Jie, X.; Gonzalez-Cortes, S.; Xiao, T.; Yao, B.; Wang, J.; Slocombe, D.R.; Fang, Y.; Miller, N.; Al-Megren, H.A.; Dilworth, J.R.; et al. The decarbonisation of petroleum and other fossil hydrocarbon fuels for the facile production and safe storage of hydrogen. Energy Environ. Sci. 2019, 12, 238–249. [Google Scholar] [CrossRef]
- Zhang, P.; Lou, X.W. Design of Heterostructured Hollow Photocatalysts for Solar-to-Chemical Energy Conversion. Adv. Mater. 2019, 31, e1900281. [Google Scholar] [CrossRef]
- Linic, S.; Christopher, P.; Ingram, D.B. Plasmonic-metal nanostructures for efficient conversion of solar to chemical energy. Nat. Mater. 2011, 10, 911–921. [Google Scholar] [CrossRef]
- Li, K.; Lin, Y.-Z.; Wang, K.; Wang, Y.; Zhang, Y.; Zhang, Y.; Liu, F.-T. Rational design of cocatalyst system for improving the photocatalytic hydrogen evolution activity of graphite carbon nitride. Appl. Catal. B Environ. 2020, 268, 118402. [Google Scholar] [CrossRef]
- Wang, C.; Cai, X.; Chen, Y.; Cheng, Z.; Luo, X.; Mo, S.; Jia, L.; Lin, P.; Yang, Z. Improved hydrogen production from glycerol photoreforming over sol-gel derived TiO2 coupled with metal oxides. Chem. Eng. J. 2017, 317, 522–532. [Google Scholar] [CrossRef]
- Khan, S.; Choi, H.; Kim, D.; Lee, S.Y.; Zhu, Q.; Zhang, J.; Kim, S.; Cho, S.-H. Self-assembled heterojunction of metal sulfides for improved photocatalysis. Chem. Eng. J. 2020, 395, 125092. [Google Scholar] [CrossRef]
- He, F.; Wang, Z.; Li, Y.; Peng, S.; Liu, B. The nonmetal modulation of composition and morphology of g-C3N4-based photocatalysts. Appl. Catal. B Environ. 2020, 269, 118828. [Google Scholar] [CrossRef]
- Shi, Z.; Dong, X.; Dang, H. Facile fabrication of novel red phosphorus-CdS composite photocatalysts for H2 evolution under visible light irradiation. Int. J. Hydrog. Energy 2016, 41, 5908–5915. [Google Scholar] [CrossRef]
- Yong, X.; Zhang, J.; Ma, X. Effects of intrinsic defects on the photocatalytic water-splitting activities of PtSe2. Int. J. Hydrog. Energy 2020, 45, 8549–8557. [Google Scholar] [CrossRef]
- Zhai, Y.; Dai, Y.; Guo, J.; Zhou, L.; Chen, M.; Yang, H.; Peng, L. Novel biochar@CoFe2O4/Ag3PO4 photocatalysts for highly efficient degradation of bisphenol a under visible-light irradiation. J. Colloid Interface Sci. 2020, 560, 111–121. [Google Scholar] [CrossRef]
- Karthikeyan, C.; Arunachalam, P.; Ramachandran, K.; Al-Mayouf, A.M.; Karuppuchamy, S. Recent advances in semiconductor metal oxides with enhanced methods for solar photocatalytic applications. J. Alloys Compd. 2020, 828, 154281. [Google Scholar] [CrossRef]
- Deng, F.; Lu, X.; Pei, X.; Luo, X.; Luo, S.; Dionysiou, D. Fabrication of ternary reduced graphene oxide/SnS2 /ZnFe2O4 composite for high visible-light photocatalytic activity and stability. J. Hazard. Mater. 2017, 332, 149–161. [Google Scholar] [CrossRef]
- Deng, Q.; Xu, Y.; Wang, Z.; Miao, T.; Fu, X.; Xu, L. Visible-Light-Driven H2 Evolution with Cobalt Complexes in Aqueous Solution: Theoretical and Experimental Study. J. Phys. Chem. C 2019, 123, 30351–30359. [Google Scholar] [CrossRef]
- Qi, Y.; Chen, Y.; Wang, R.; Wang, L.; Zhang, F.; Shen, Q.; Qu, P.; Liu, D. Zinc-Deficiency Induced g-C3N4 Nanosheets: Photocatalytic Nitrogen Fixation Study and Carrier Dynamics. Catal. Lett. 2021, 151, 1546–1555. [Google Scholar] [CrossRef]
- Wang, X.; Li, Q.; Lin, Q.; Zhang, R.; Ding, M. CdS-sensitized 3D ordered macroporous g-C3N4 for enhanced visible-light photocatalytic hydrogen generation. J. Mater. Sci. Technol. 2021, 111, 204–210. [Google Scholar] [CrossRef]
- Dong, G.; Zhang, Y.; Pan, Q.; Qiu, J. A fantastic graphitic carbon nitride (g-C3N4) material: Electronic structure, photocatalytic and photoelectronic properties. J. Photochem. Photobiol. C Photochem. Rev. 2014, 20, 33–50. [Google Scholar] [CrossRef]
- Guo, X.; Duan, J.; Wang, W.; Zhang, Z. Modified graphitic carbon nitride as the photocatalyst for wastewater treatment under visible light irradiation. Fuel 2020, 280, 118544. [Google Scholar] [CrossRef]
- Liu, A.Y.; Cohen, M.L. Prediction of New Low Compressibility Solids. Science 1989, 245, 841–842. [Google Scholar] [CrossRef] [Green Version]
- Teter, D.M.; Hemley, R.J. Low-Compressibility Carbon Nitrides. Science 1996, 271, 53–55. [Google Scholar] [CrossRef]
- Ismael, M. A review on graphitic carbon nitride (g-C3N4) based nanocomposites: Synthesis, categories, and their application in photocatalysis. J. Alloys Compd. 2020, 846, 156446. [Google Scholar] [CrossRef]
- Wang, X.; Maeda, K.; Thomas, A.; Takanabe, K.; Xin, G.; Carlsson, J.M.; Domen, K.; Antonietti, M. A metal-free polymeric photocatalyst for hydrogen production from water under visible light. Nat. Mater. 2009, 8, 76–80. [Google Scholar] [CrossRef]
- Xue, B.; Jiang, H.-Y.; Sun, T.; Mao, F.; Wu, J.-K. One-step synthesis of MoS2/g-C3N4 nanocomposites with highly enhanced photocatalytic activity. Mater. Lett. 2018, 228, 475–478. [Google Scholar] [CrossRef]
- Li, H.; Wang, Z.; Lu, Y.; Liu, S.; Chen, X.; Wei, G.; Ye, G.; Chen, J. Microplasma electrochemistry (MIPEC) methods for improving the photocatalytic performance of g-C3N4 in degradation of RhB. Appl. Surf. Sci. 2020, 531, 147307. [Google Scholar] [CrossRef]
- Balakumar, V.; Ramalingam, M.; Sekar, K.; Chuaicham, C.; Sasaki, K. Fabrication and characterization of carbon quantum dots decorated hollow porous graphitic carbon nitride through polyaniline for photocatalysis. Chem. Eng. J. 2021, 426, 131739. [Google Scholar] [CrossRef]
- Wang, C.; Hu, L.; Wang, M.; Ren, Y.; Yue, B.; He, H. Vanadium supported on graphitic carbon nitride as a heterogeneous catalyst for the direct oxidation of benzene to phenol. Chin. J. Catal. 2016, 37, 2003–2008. [Google Scholar] [CrossRef]
- Zeng, X.; Liu, Y.; Kang, Y.; Li, Q.; Xia, Y.; Zhu, Y.; Hou, H.; Uddin, H.; Gengenbach, T.; Xia, D.; et al. Simultaneously Tuning Charge Separation and Oxygen Reduction Pathway on Graphitic Carbon Nitride by Polyethylenimine for Boosted Photocatalytic Hydrogen Peroxide Production. ACS Catal. 2020, 10, 3697–3706. [Google Scholar] [CrossRef]
- Tong, Y.; Wei, C.; Li, Y.; Zhang, Y.; Lin, W. Unraveling the mechanisms of S-doped carbon nitride for photocatalytic oxygen reduction to H2O2. Phys. Chem. Chem. Phys. 2020, 22, 21099–21107. [Google Scholar] [CrossRef]
- Jiang, X.X.; De Hu, X.; Tarek, M.; Saravanan, P.; Alqadhi, R.; Chin, S.Y.; Khan, M.R. Tailoring the properties of g-C3N4 with CuO for enhanced photoelectrocatalytic CO2 reduction to methanol. J. CO2 Util. 2020, 40, 101222. [Google Scholar] [CrossRef]
- Yao, X.; Zhang, W.; Huang, J.; Du, Z.; Hong, X.; Chen, X.; Hu, X.; Wang, X. Enhanced photocatalytic nitrogen fixation of Ag/B-doped g-C3N4 nanosheets by one-step in-situ decomposition-thermal polymerization method. Appl. Catal. A Gen. 2020, 601, 117647. [Google Scholar] [CrossRef]
- Luo, Z.; Song, Y.; Wang, M.; Zheng, X.; Qu, L.; Wang, J.; Wu, X.; Wu, Z. Comparison of g-C3N4 synthesized by different precursors in remediation of phenanthrene contaminated soil and ecotoxicity. J. Photochem. Photobiol. A Chem. 2019, 389, 112241. [Google Scholar] [CrossRef]
- Yu, Y.; Wang, J. Direct microwave synthesis of graphitic C3N4 with improved visible-light photocatalytic activity. Ceram. Int. 2016, 42, 4063–4071. [Google Scholar] [CrossRef]
- Wang, L.; Hou, Y.; Xiao, S.; Bi, F.; Zhao, L.; Li, Y.; Zhang, X.; Gai, G.; Dong, X. One-step, high-yield synthesis of g-C3N4 nanosheets for enhanced visible light photocatalytic activity. RSC Adv. 2019, 9, 39304–39314. [Google Scholar] [CrossRef] [Green Version]
- Liu, S.; Zhu, H.; Yao, W.; Chen, K.; Chen, D. One step synthesis of P-doped g-C3N4 with the enhanced visible light photocatalytic activity. Appl. Surf. Sci. 2018, 430, 309–315. [Google Scholar] [CrossRef]
- Liu, G.; Liao, M.; Zhang, Z.; Wang, H.; Chen, D.; Feng, Y. Enhanced photodegradation performance of Rhodamine B with g-C3N4 modified by carbon nanotubes. Sep. Purif. Technol. 2020, 244, 116618. [Google Scholar] [CrossRef]
- Ke, L.; Li, P.; Wu, X.; Jiang, S.; Luo, M.; Liu, Y.; Le, Z.; Sun, C.; Song, S. Graphene-like sulfur-doped g-C3N4 for photocatalytic reduction elimination of UO22+ under visible Light. Appl. Catal. B Environ. 2017, 205, 319–326. [Google Scholar] [CrossRef]
- Dong, F.; Li, Y.; Wang, Z.; Ho, W.K. Enhanced visible light photocatalytic activity and oxidation ability of porous graphene-like g-C3N4 nanosheets via thermal exfoliation. Appl. Surf. Sci. 2015, 358, 393–403. [Google Scholar] [CrossRef]
- Cui, J.; Wang, G.; Liu, W.; Ke, P.; Tian, Q.; Li, X.; Tian, Y. Synthesis BiVO4 modified by CuO supported onto bentonite for molecular oxygen photocatalytic oxidative desulfurization of fuel under visible light. Fuel 2021, 290, 120066. [Google Scholar] [CrossRef]
- Zhang, G.; Zhang, J.; Zhang, M.; Wang, X. Polycondensation of thiourea into carbon nitride semiconductors as visible light photocatalysts. J. Mater. Chem. 2012, 22, 8083–8091. [Google Scholar] [CrossRef]
- Jiang, D.; Zhu, J.; Chen, M.; Xie, J. Highly efficient heterojunction photocatalyst based on nanoporous g-C3N4 sheets modified by Ag3PO4 nanoparticles: Synthesis and enhanced photocatalytic activity. J. Colloid Interface Sci. 2014, 417, 115–120. [Google Scholar] [CrossRef]
- Joorabi, F.T.; Kamali, M.; Sheibani, S. Effect of aqueous inorganic anions on the photocatalytic activity of CuO–Cu2O nanocomposite on MB and MO dyes degradation. Mater. Sci. Semicond. Process. 2021, 139, 106335. [Google Scholar] [CrossRef]
- Liu, F.; Nguyen, T.-P.; Wang, Q.; Massuyeau, F.; Dan, Y.; Jiang, L. Construction of Z-scheme g-C3N4/Ag/P3HT heterojunction for enhanced visible-light photocatalytic degradation of tetracycline (TC) and methyl orange (MO). Appl. Surf. Sci. 2019, 496, 143653. [Google Scholar] [CrossRef]
- Jourshabani, M.; Shariatinia, Z.; Badiei, A. Controllable Synthesis of Mesoporous Sulfur-Doped Carbon Nitride Materials for Enhanced Visible Light Photocatalytic Degradation. Langmuir 2017, 33, 7062–7078. [Google Scholar] [CrossRef] [PubMed]
- Yan, M.; Wu, Y.; Yan, Y.; Yan, X.; Zhu, F.; Hua, Y.; Shi, W. Synthesis and Characterization of Novel BiVO4/Ag3VO4 Heterojunction with Enhanced Visible-Light-Driven Photocatalytic Degradation of Dyes. ACS Sustain. Chem. Eng. 2016, 4, 757–766. [Google Scholar] [CrossRef]


| Samples | CN-450 | CN-500 | CN-550 | CN-600 | CN-650 | CN-700 | CN-750 |
|---|---|---|---|---|---|---|---|
| Yield (wt%) | 60.0 | 58.3 | 56.2 | 49.5 | 45.0 | 33.8 | — |
 |  |  |  |  |  |
| Samples | N (wt%) | C (wt%) | H (wt%) | n (N)/n (C) |
|---|---|---|---|---|
| CN-450 | 64.46 | 32.84 | 2.36 | 1.68 |
| CN-500 | 64.20 | 33.27 | 2.13 | 1.65 |
| CN-550 | 62.62 | 34.82 | 1.43 | 1.54 |
| CN-600 | 62.47 | 35.11 | 1.29 | 1.52 |
| CN-650 | 62.34 | 35.79 | 1.11 | 1.49 |
| CN-700 | 62.24 | 35.85 | 0.98 | 1.48 |
| Samples | CN-450 | CN-500 | CN-550 | CN-600 | CN-650 | CN-700 |
|---|---|---|---|---|---|---|
| SBET(m2/g) | 3.133 | 4.325 | 7.291 | 14.060 | 21.114 | 42.465 |
| Vpore(cm3/g) | 0.005 | 0.007 | 0.022 | 0.047 | 0.072 | 0.225 |
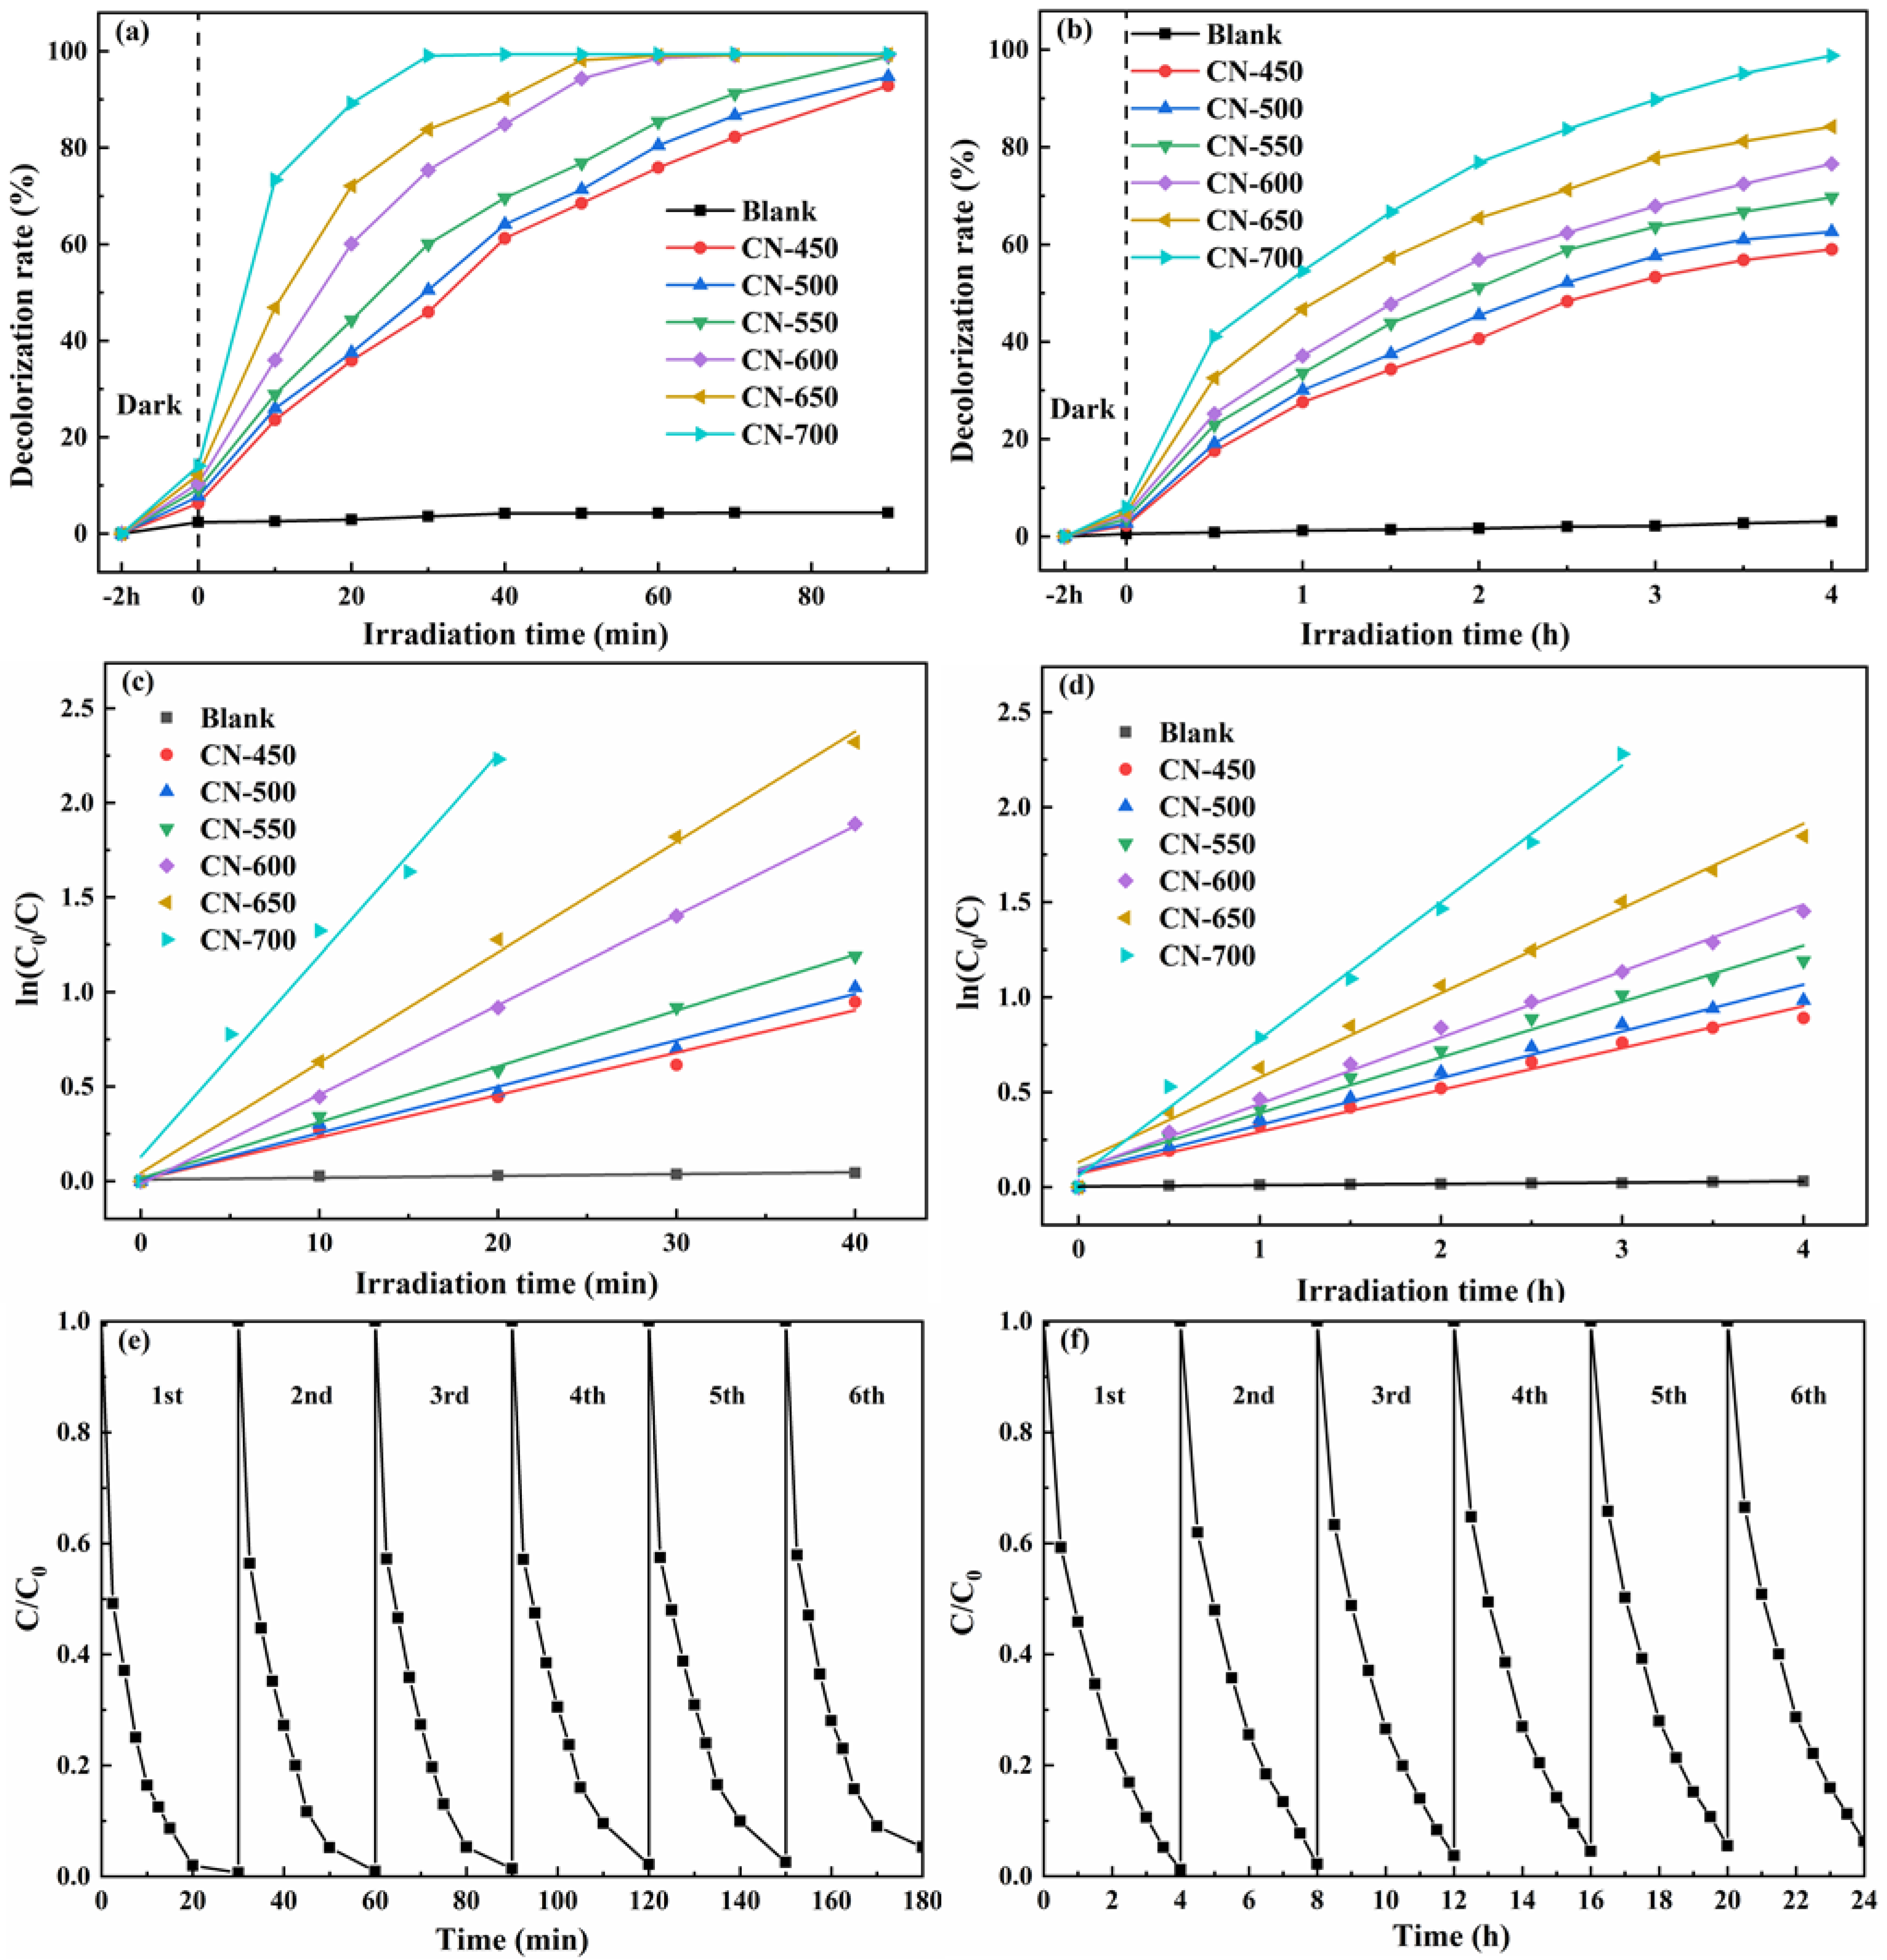
| Samples | kRhB (min−1) | R2 (RhB) | kMO (h−1) | R2 (MO) |
|---|---|---|---|---|
| CN-450 | 0.02243 | 0.98505 | 0.22073 | 0.98289 |
| CN-500 | 0.02454 | 0.99019 | 0.24660 | 0.97966 |
| CN-550 | 0.02961 | 0.99783 | 0.29348 | 0.98178 |
| CN-600 | 0.04734 | 0.99971 | 0.34919 | 0.99164 |
| CN-650 | 0.05832 | 0.99703 | 0.44543 | 0.98943 |
| CN-700 | 0.10643 | 0.98062 | 0.72071 | 0.99338 |
| Catalyst | Catalyst Dosage (mg) | Irradiation Time (min) | Dye Solution | Removal Efficiency (%) | Refs |
|---|---|---|---|---|---|
| Ag3PO4/p-g-C3N4 | 50 | 60 | RhB (10 mg/L) | 99 | Jiang, et al. [39] |
| CuO–Cu2O | 40 | 240 | MO (5 mg/L) | 60 | Joorabi, et al. [40] |
| MCN | 50 | 40 | RhB (2 mg/L) MO (2 mg/L) | 100 94.2 | Yu, et al. [31] |
| g-C3N4 | 15 | 100 | RhB (10 mg/L) | 97 | Wang, et al. [32] |
| g-C3N4/CNTs-1 | 20 | 60 | RhB (10 mg/L) | 98.1 | Liu, et al. [34] |
| CNAgP0.3 | 60 | 500 | MO (10 mg/L) | 99 | Liu, et al. [41] |
| MCNS-4 | 100 | 210 | MO (10 mg/L) | 82.7 | Jourshabani, et al. [42] |
| CN-700 | 100 | 30 240 | RhB (100 mg/L) MO (20 mg/L) | 99.11 98.81 | This work |
Publisher’s Note: MDPI stays neutral with regard to jurisdictional claims in published maps and institutional affiliations. |
© 2022 by the authors. Licensee MDPI, Basel, Switzerland. This article is an open access article distributed under the terms and conditions of the Creative Commons Attribution (CC BY) license (https://creativecommons.org/licenses/by/4.0/).
Share and Cite
Ke, P.; Zeng, D.; Cui, J.; Li, X.; Chen, Y. Improvement in Structure and Visible Light Catalytic Performance of g-C3N4 Fabricated at a Higher Temperature. Catalysts 2022, 12, 247. https://doi.org/10.3390/catal12030247
Ke P, Zeng D, Cui J, Li X, Chen Y. Improvement in Structure and Visible Light Catalytic Performance of g-C3N4 Fabricated at a Higher Temperature. Catalysts. 2022; 12(3):247. https://doi.org/10.3390/catal12030247
Chicago/Turabian StyleKe, Ping, Danlin Zeng, Jiawei Cui, Xin Li, and Yang Chen. 2022. "Improvement in Structure and Visible Light Catalytic Performance of g-C3N4 Fabricated at a Higher Temperature" Catalysts 12, no. 3: 247. https://doi.org/10.3390/catal12030247
APA StyleKe, P., Zeng, D., Cui, J., Li, X., & Chen, Y. (2022). Improvement in Structure and Visible Light Catalytic Performance of g-C3N4 Fabricated at a Higher Temperature. Catalysts, 12(3), 247. https://doi.org/10.3390/catal12030247