Article

Molecular Insights into Adsorption and Diffusion Mechanism of N-Hexane in MFI Zeolites with Different Si-to-Al Ratios and Counterions

1
College of Chemistry & Chemical Engineering, China University of Petroleum (East China), Qingdao 266555, China
2
Key Laboratory of Petrochemical Catalytic Science and Technology, Liaoning Petrochemical University, Fushun 113001, China
3
Department of Chemical Engineering, The University of Manchester, Oxford Road, Manchester M13 9PL, UK
*
Authors to whom correspondence should be addressed.
Catalysts 2022, 12(2), 144; https://doi.org/10.3390/catal12020144
Submission received: 18 December 2021 / Revised: 18 January 2022 / Accepted: 19 January 2022 / Published: 24 January 2022

Abstract

:
The effect of the silicon to aluminum ratio (SAR) and alkali metal cations on adsorption and diffusion properties of ZSM-5 and silicate-1 zeolites was investigated using n-hexane as the model probe via giant canonical Monte Carlo (GCMC) and molecular dynamics (MD) simulations. A wide range of SAR was considered in this study to explore the possible adsorption sites in the zeolites. The findings show that, at 298 K and 423 K, adsorption and diffusion of n-hexane on/in low SAR (≤50) H-ZSM-5 models were promoted due to the preferable distribution of n-hexane in straight channels and enhanced interaction between protons and n-hexane molecules (about 24 kcal·mol−1). In alkali metal cation (i.e., Na+ and K+) exchanged ZSM-5, the alkali metal cations affected transport of molecules, which led to significant differences in their adsorption and diffusion properties compared to HZSM-5. In the Na+ and K+ systems, lower saturated adsorption capacities were predicted compared to that of silicate-1, which could be attributed to the decrease in effective void size posed by alkali–metal cations. In addition, simulation results also suggested that the T9 and T3 are the most likely sites for n-hexane adsorption, followed by T2, T5, and T10. Findings of the work can be beneficial to the rational design of high-performance zeolite catalysts for n-hexane conversion.

Graphical Abstract

1. Introduction

Zeolites are important catalysts and adsorbents that are widely used by many fields such as oil refining, petrochemical conversions and environmental remediation [1,2,3]. Both the chemical and physical properties of zeolites (such as acid sites and pore structures) are crucial for their performance in different applications [4,5,6,7].
MFI frameworks especially aluminum-substituted ZSM-5 show excellent catalytic activity due to their unique structural properties and acidity [8,9,10,11,12]. The MFI framework has 12 distinct crystallographic tetrahedral framework sites; isomorphous substitution of silicon (Si) with aluminum (Al) can generate acidic sites [8,13]. These sites are mostly located within the porous frameworks of zeolites, which offer distinct steric access for guest molecules, controlling the reaction mechanism and diffusion of both reactants and products inside the framework. Thus, it can be expected that the locations and distributions of aluminum atoms would be one of the most important parameters to affect the properties and performance of zeolites.
Hence, significant efforts have been made via both experimental and numerical studies to gain insights into this topic. For example, experimental techniques, such as Fourier transform infrared (FT-IR) spectroscopy [14,15], 27 Al nuclear magnetic resonance (NMR) spectroscopy [16], diffuse reflectance ultraviolet-visible (DR UV-vis) spectroscopy [17], extended X-ray absorption fine structure (EXAFS) [6], X-ray diffraction (XRD) and density functional theory (DFT) calculation [14], have been extensively applied to study and analyze the coordination of Al atoms in zeolites; however, accurate determination of acid sites or Al atom positions is still under debate. Previous studies suggested that Al sited in the MFI framework is largely random [18] or, at least, moderately disordered [19]. There are also some other proposals to explain the locations and distributions of Al atoms in ZSM-5 zeolites [16,20,21,22]. Olson and his co-workers confirmed a nonrandom Al sitting in dehydrated CsZSM-5 zeolites (preferred Al substitution order T7 > T10 > T8 > T2) [20]. Grabow et al. found that the T7 is the most stable site to be replaced by aluminum in HZSM-5 [21]. Subsequently, Jiao et al. explored multiple Al substitutions by a periodic DFT computation, demonstrating that the T3 site appears most frequently and should represent the active site for sorption and reaction [22].
The adjustment of T sites (this refers to Al) in ZSM-5 is important to their catalytic applications, and this seems to be achievable by carefully designed synthesis [23,24,25,26,27,28]. Janda et al. found that the catalytic properties of ZSM-5 for monomolecular cracking and dehydrogenation of alkanes depended on the spatial distributions of acid sites, which can be altered by modifying Al sources, templating agents or adjusting the amount and type of cations such as H+, Na+ and K+ cations [6,29,30,31,32,33,34]. Li et al. suggested that HZSM-5 zeolites synthesized from tetraethoxysilane (TEOS) had more framework Al located in the channel intersections, which could lead to high C3~C5 alkanes selectivity. In contrast, the zeolites synthesized with silica sol exhibited relatively wide-distributed mesopores and channels and owned greatly improved propylene selectivity and activity [35].
N-hexane, a common hydrocarbon probe, is often used to explore the impact of Al distribution on catalytic performance. Voogd confirmed that Al located in outer crystal zones of the sample crystals contributes little to cracking activity [36]. Afroukhteh et al. carried out catalytic cracking of n-hexane over a series of ZSM-5 zeolites with different SiO2/Al2O3 molar ratios. They found that the maximum conversion was achieved over ZSM-5 (SiO2/Al2O3 = 50) zeolite, whilst a higher propylene selectivity was observed over ZSM-5 (SiO2/Al2O3 = 300) zeolite [37]. Previous studies demonstrated that the activity and selectivity of hydrocarbon transformation are sensitive to the location and distribution of Al atoms in a zeolite system, which is governed by conditions of zeolite syntheses [38], but the original effect of acid site distribution has not been unambiguously clarified due to the complexity of MFI crystal structure.
In this study, the impact of SAR and alkali metal cations on adsorption and diffusion of n-hexane on/in ZSM-5 and silicate-1 zeolites was explored using giant canonical Monte Carlo (GCMC) and molecular dynamics (MD) simulations. Based on the findings of the work, the correlation between the catalytic activity and the properties of the acid sites was established, which helped to reveal the nature of SAR and alkali metal cations in affecting molecular adsorption behavior and determine the possible active sites of ZSM-5 in catalytic conversion of n-hexane. The results of the current simulation work provide a theoretical basis for the design and synthesis of the improved zeolite catalysts with tailored SAR to improve experiments involving adsorption and diffusion of alkane molecules.

2. Results

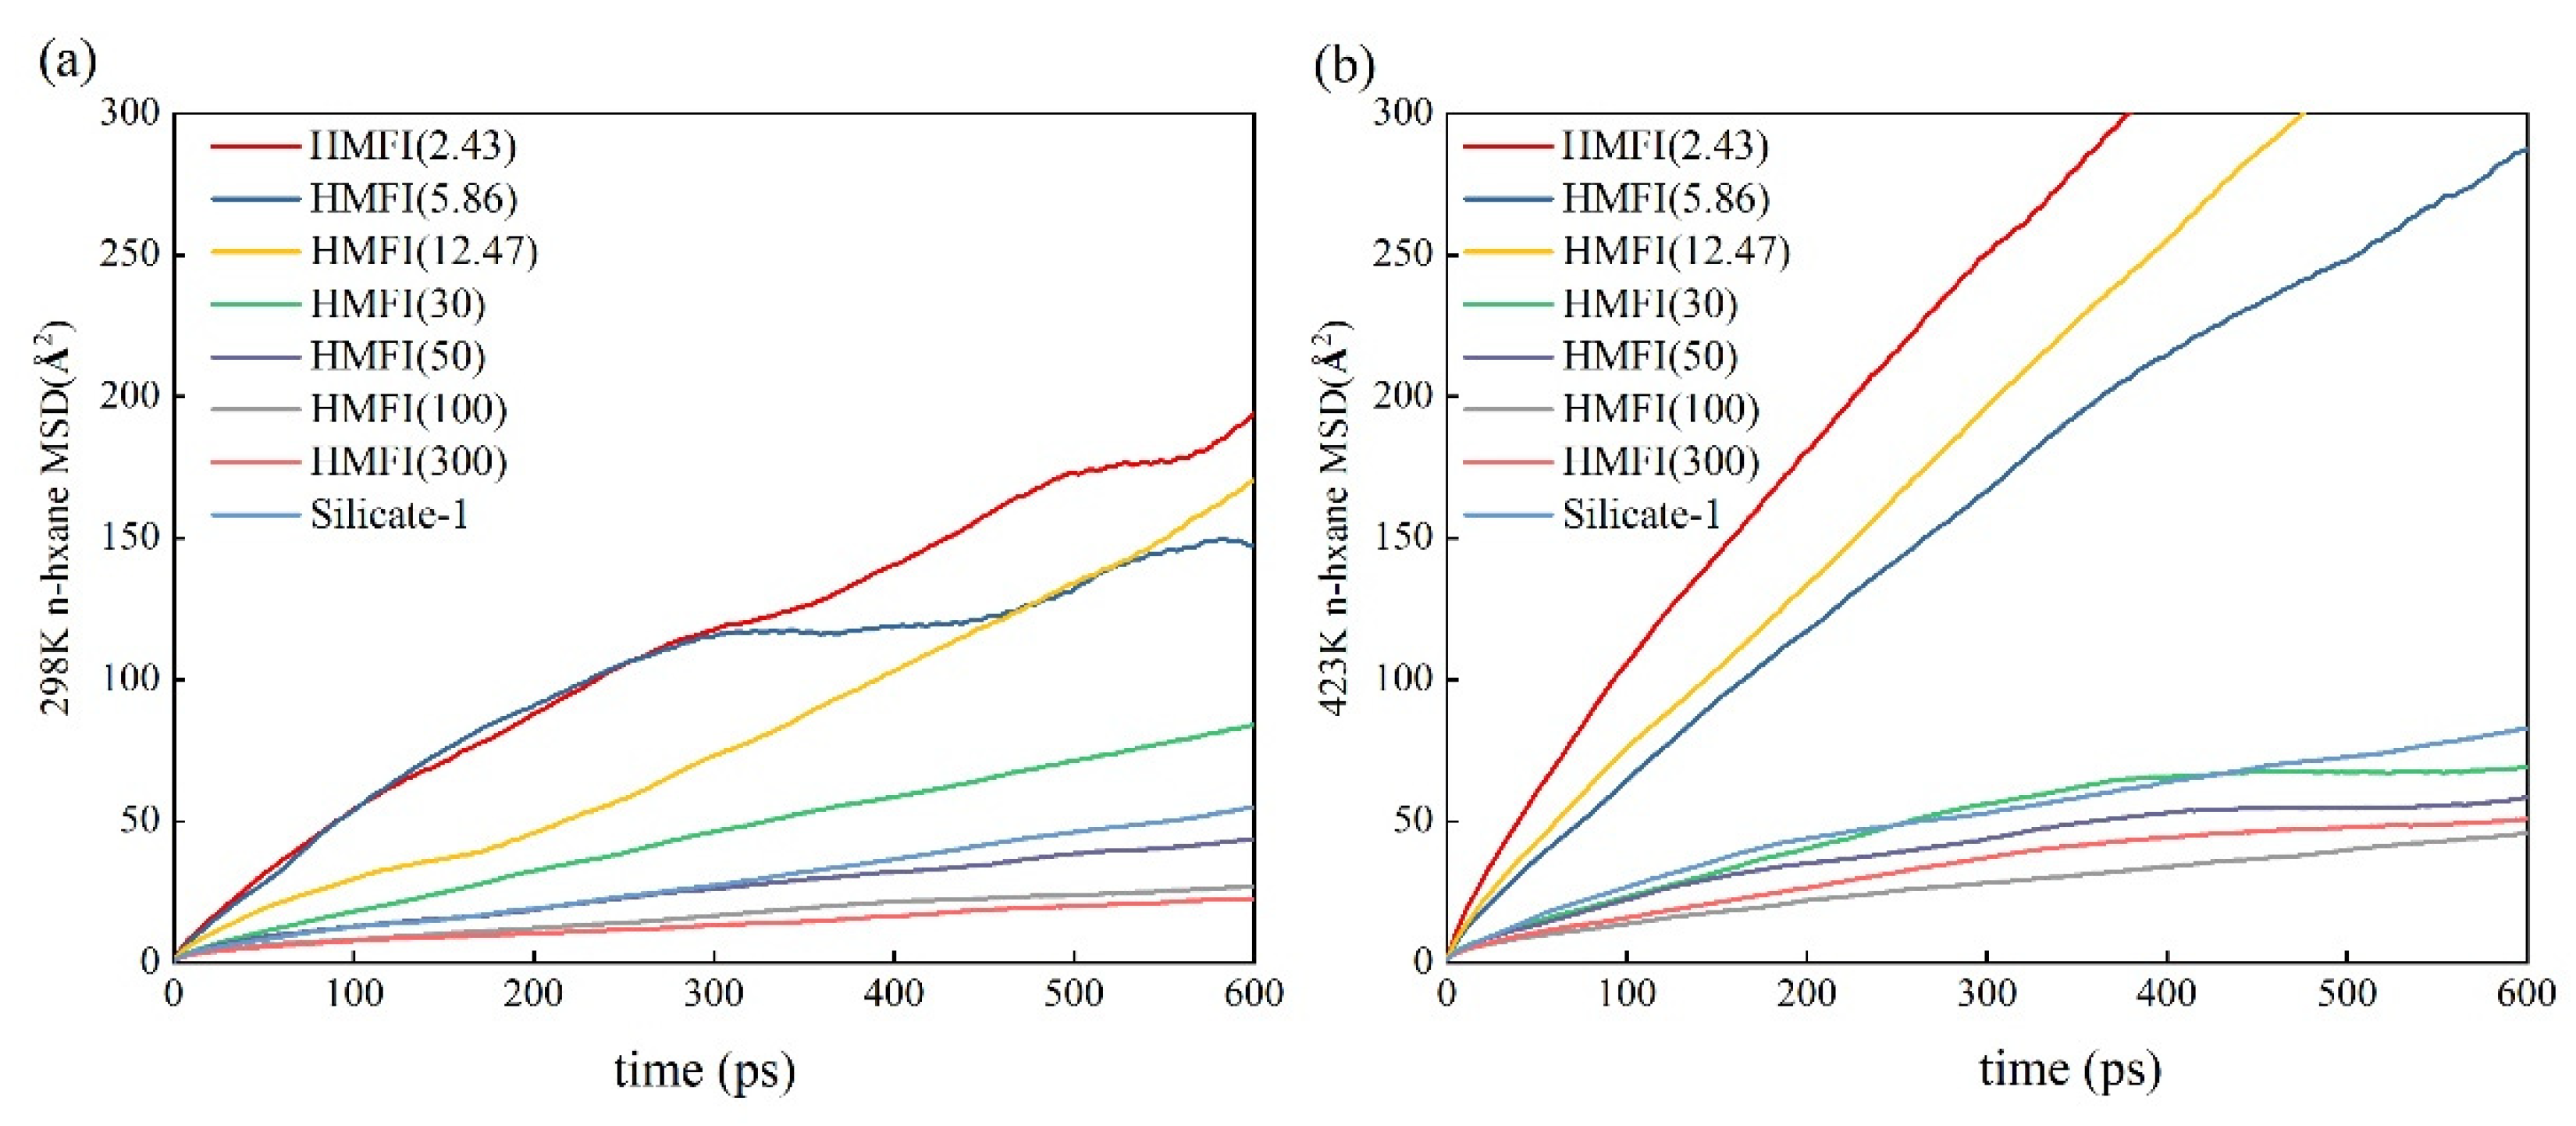
2.1. Adsorption and Diffusion Properties of N-Hexane Molecules on/in the HMFI Models

Adsorption isotherm of n-hexane on silicate-1 and HZSM-5 with different SAR values (of 300, 100, 50, 30, 12.47, 5.86 and 2.43) at 298 K and 423 K are illustrated in Figure 1. Points in the figures are the simulated data, and the lines are the fitting data using the Langmuir Freundlich mode. The simulated data agree well with the experimental and simulated isotherms as reported in the literature [39,40,41,42]. Adsorption isotherms in Figure 1a,b are similar, that is, the amounts of adsorbed n-hexane molecules with an increase in the pressure, and approached saturation. At 298 K, adsorption reached saturation at p > 1.4 × 10⁻⁵ kPa. Conversely, at 423 K, n-hexanes began to adsorb on silicate-1 and HZSM-5 at 3 × 10⁻⁶ kPa, and then adsorption increased sharply with an increase in pressure and reached saturation when p > 3 × 10⁻¹ kPa; therefore, higher pressures are required to reach the saturated adsorption capacity at higher temperatures. At 298 K, the saturation adsorption amount of each case is significantly higher than that at 423 K; that is, higher temperature corresponds to a lower saturation adsorption amount, being consistent with the reported findings [43]. At 298 K, we see three clusters of isotherms: one contains the three lowest SARs (12.47, 5.86 and 2.43) has a saturation limit ca. 40 and a half-saturation pressure value of about 10−9 kPa; the second, with SAR 30 and 50, has values near 32 and 10−8 kPa; and the third with SAR 100 and 300 has values near 28 and 10−6 kPa. At 423 K, the effect of different SAR on n-hexane adsorption shows the same trend with 298 K. Compared with silicate-1 zeolite, the adsorption limit of n-hexane on HZSM-5 decreases (30 molecules vs. 25 molecules) and then rises (30 molecules vs. 35 molecules) with the decrease in SAR. When the SAR is less than 30, the adsorption amount would exceed that of silicate-1 zeolite. It is interesting that the untreated silicate-1 has value in the second cluster, which may be attributed to a strong proton environment, resulting in a higher saturated limit of zeolites with low SARs (12.47, 5.86 and 2.43) than that of silicate-1 [44]. These differences in the adsorption behavior could be not only seen in the adsorption isotherms but reflected in the distribution of n-hexane molecules. Figure 2 depicts the density distribution of n-hexane on silicate-1 and HZSM-5 with different SAR at 298 K. In this display, the green region represents the lowest energy, preferred adsorption positions for n-hexane molecules. It can be seen that the green region in silicate-1 zeolite and HZSM-5 zeolites with high SAR (300, 100 and 50) is mainly located in the sinusoidal channels, indicating that n-hexane molecules are mainly distributed in the sinusoidal channels. At a SAR below or equal to 30, the green region in HZSM-5 zeolites almost covered both straight and sinusoidal channels, implying that the increase in proton sites promotes the adsorption of n-hexane molecules in straight channels. The blue shadow in the picture is used to provide much more information for the density distribution of n-hexane in a straight channel. We also see three clusters of density distribution: one contains the three lowest SARs (12.47, 5.86 and 2.43) has the highest probability distribution (i.e., maximum blue shaded area) of n-hexane in the straight channel and the second one is a group of SAR 30 and 50 and silicate-1, and the third with SAR 100 and 300 has the lowest probability distribution (i.e., minimum blue shaded area) of n-hexane in the straight channel. Distribution characteristics of n-hexane on silicate-1 and HZSM-5 with different SAR at 423 K are similar to that at 298 K (cf. Figure S1). Specific quantities of n-hexane in HMFI and silicate-1 models used for MD calculations for further evidence are shown in Figure S4 (20 molecules per cell). The numbers of n-hexane in the straight channels and sinusoidal channels of zeolites (SAR = 300 and 100) are 2~3 and 17~18, respectively. Whilst the numbers of n-hexane in the straight channels and sinusoidal channels of zeolites (silicate-1 and SAR = 50, 30, 12.47, 5.86 and 2.43) is 7~10 and 10~13, respectively. These results show that the HZSM-5 zeolites with SAR less than or equal to 50 are more favorable for the distribution of n-hexane molecules in the straight channels than that with SAR 300 and 100 and improve the molecular adsorption performance.
The MSD of isotropic diffusion coefficient for the n-hexane molecules on these HMFI models is characterized in Figure 3. The diffusion properties of n-hexane molecules on silicate-1 and HZSM-5 zeolites with different SAR have the same trend as the adsorption properties. The order of diffusion coefficients, can be computed by taking the slope of the MSD, is as follows: HZSM-5 (SAR = 12.47, 5.86, 2.43) > HZSM-5 (SAR = 50, 30), silicate-1 > HZSM-5 (SAR = 300, 100). Combined with Figure 2, it can be concluded that controlling the adsorption of n-hexane in the straight channel would increase the diffusion of n-hexane molecules. These findings demonstrate that the decrease in the SAR is conducive to the adsorption and diffusion of n-hexane molecules, resulting in a distribution transformation from localization to dispersion.

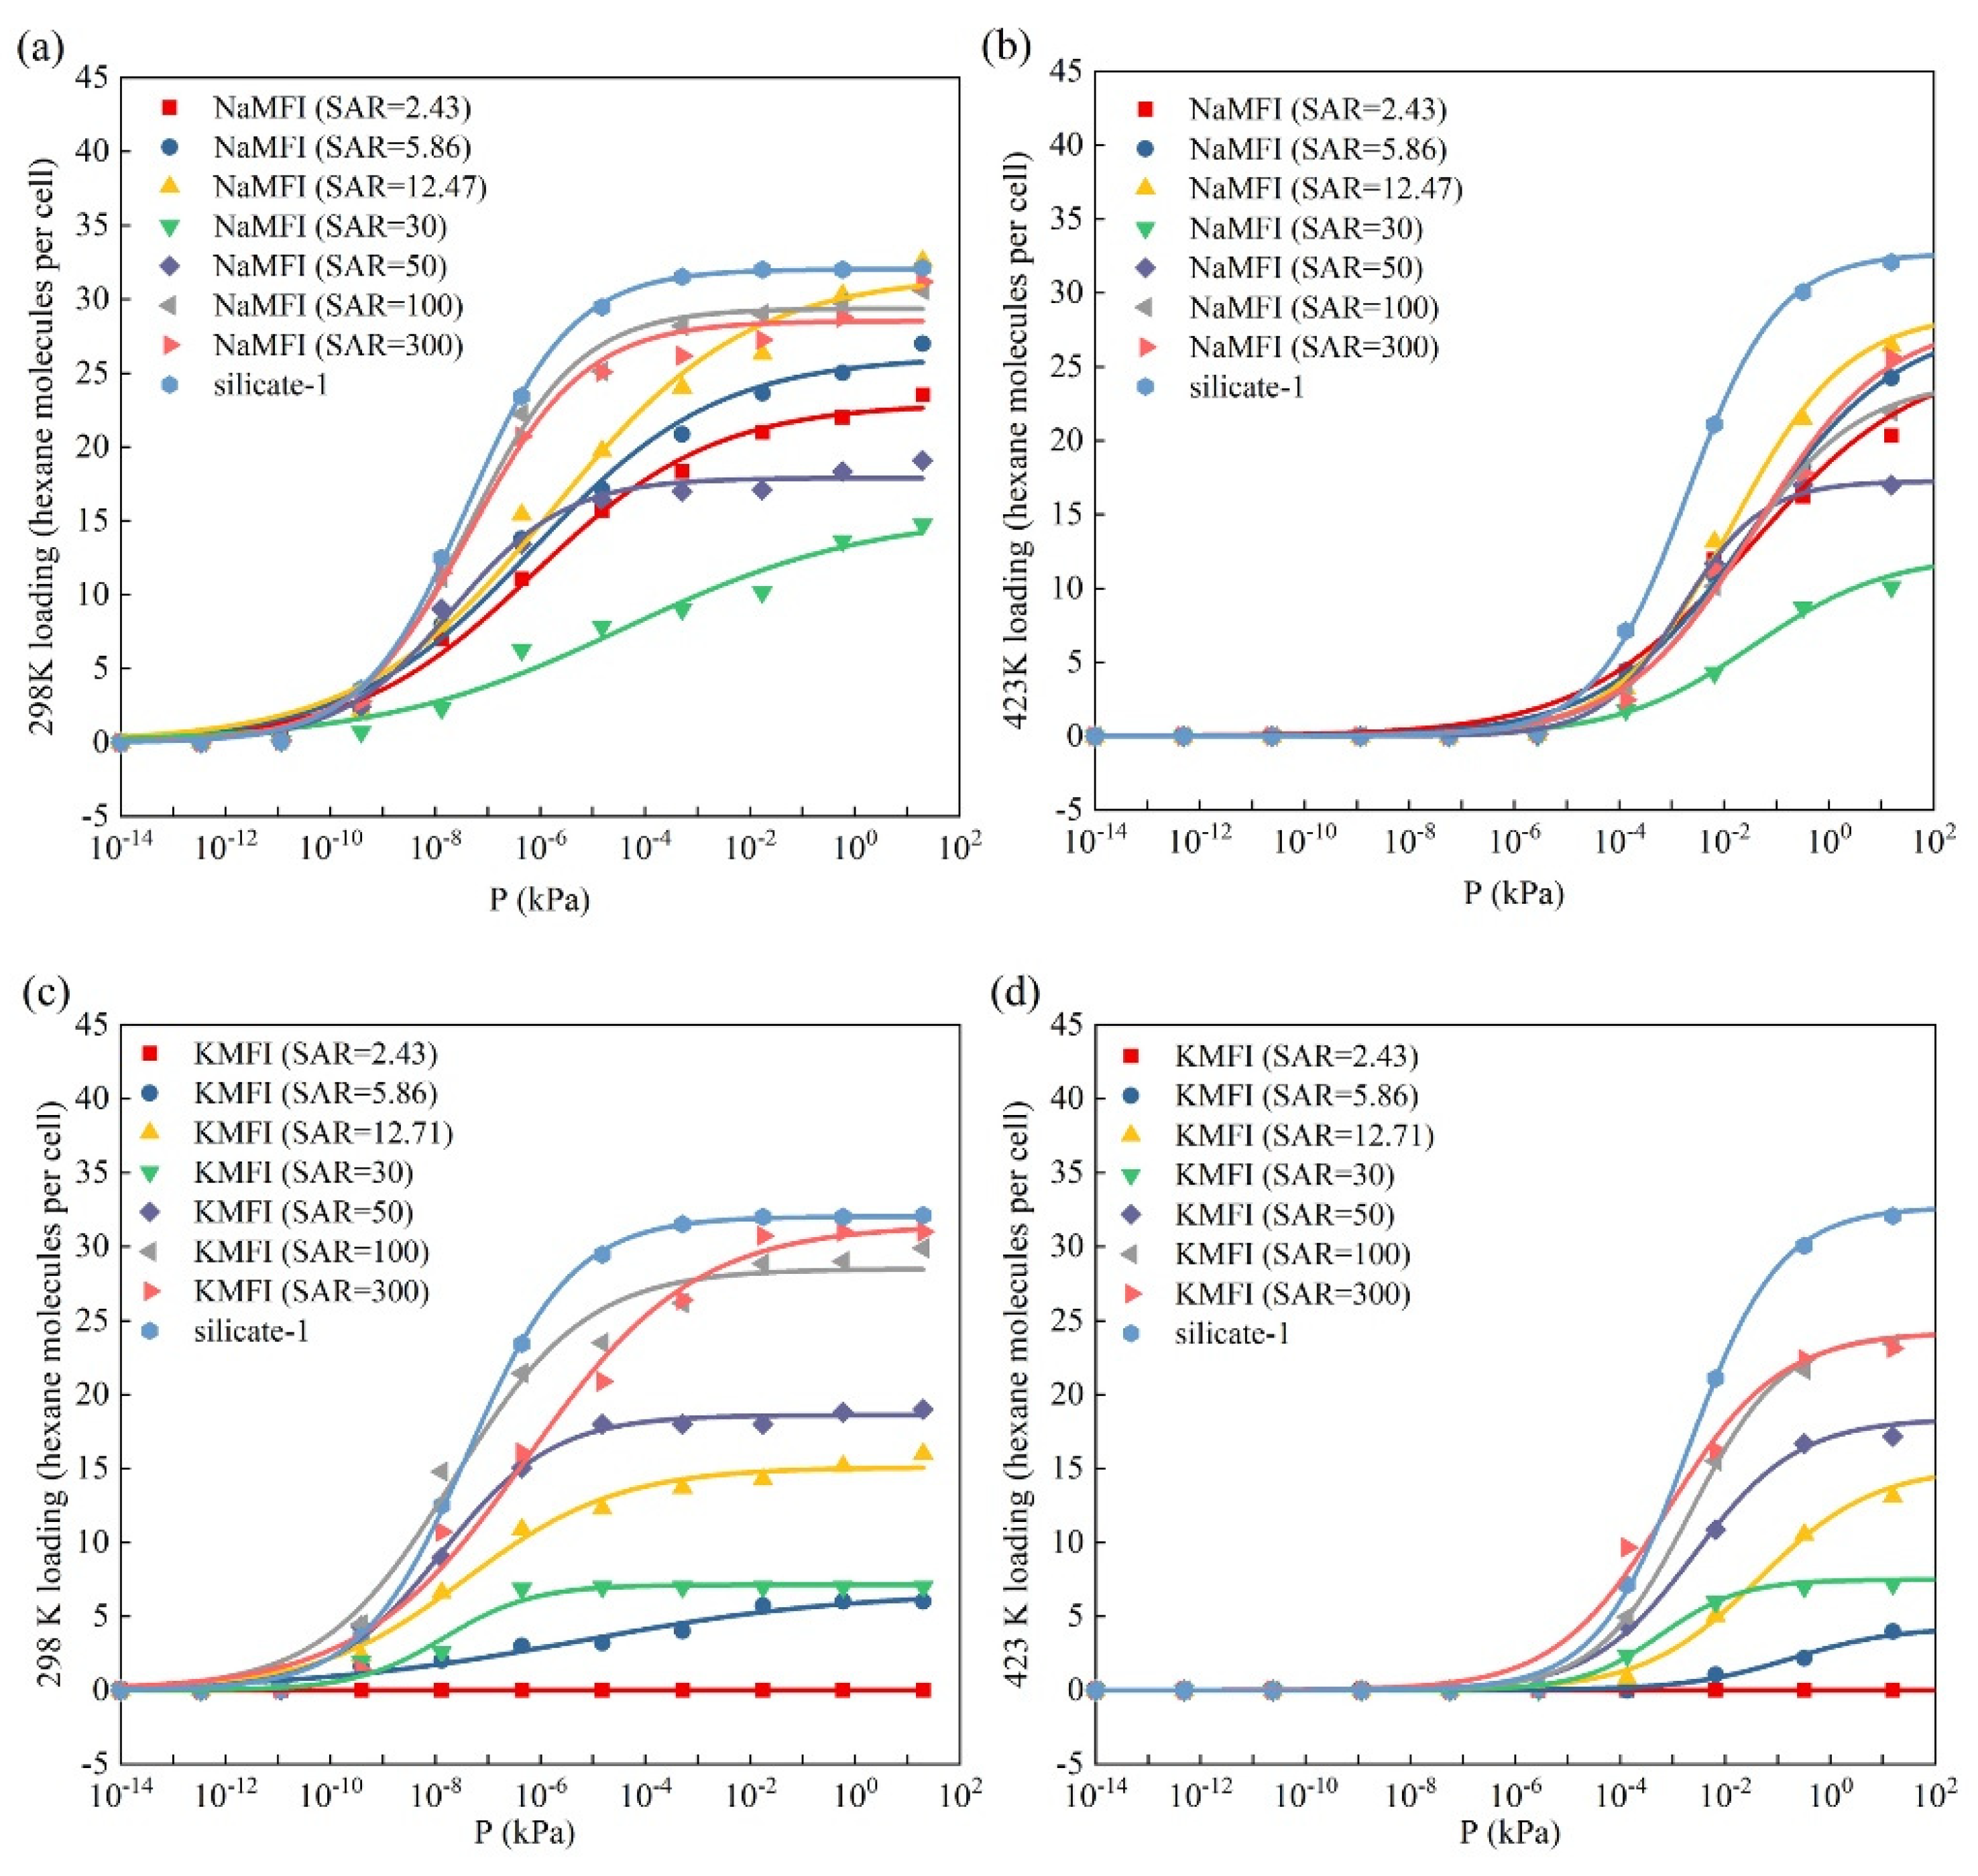
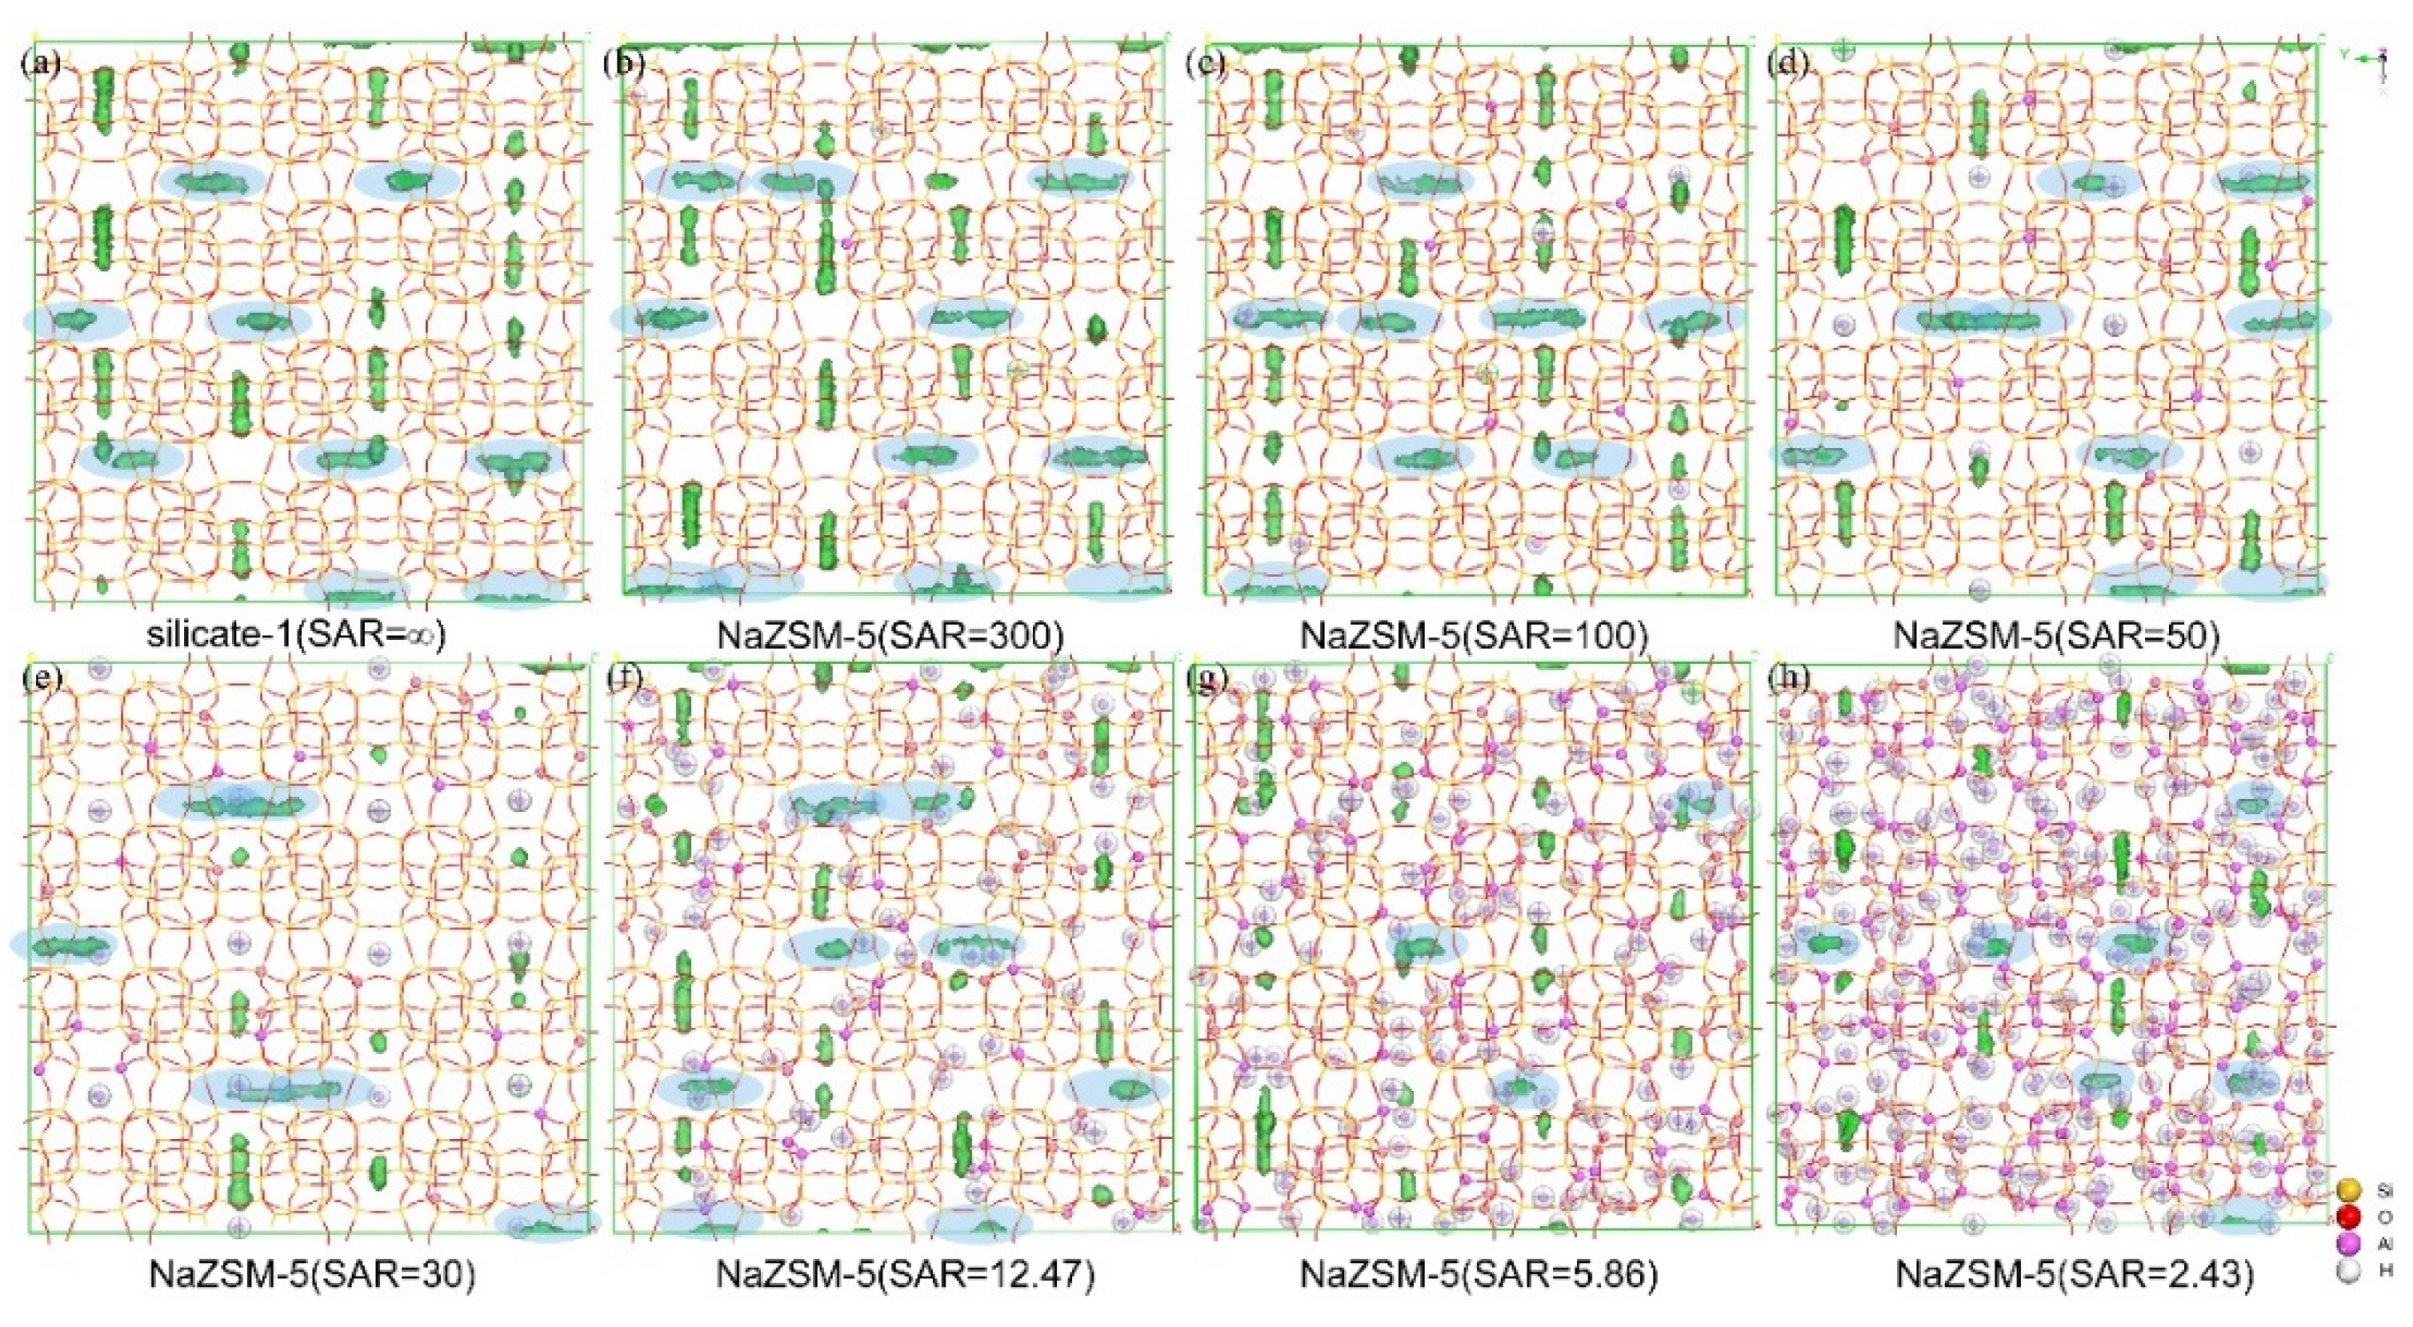
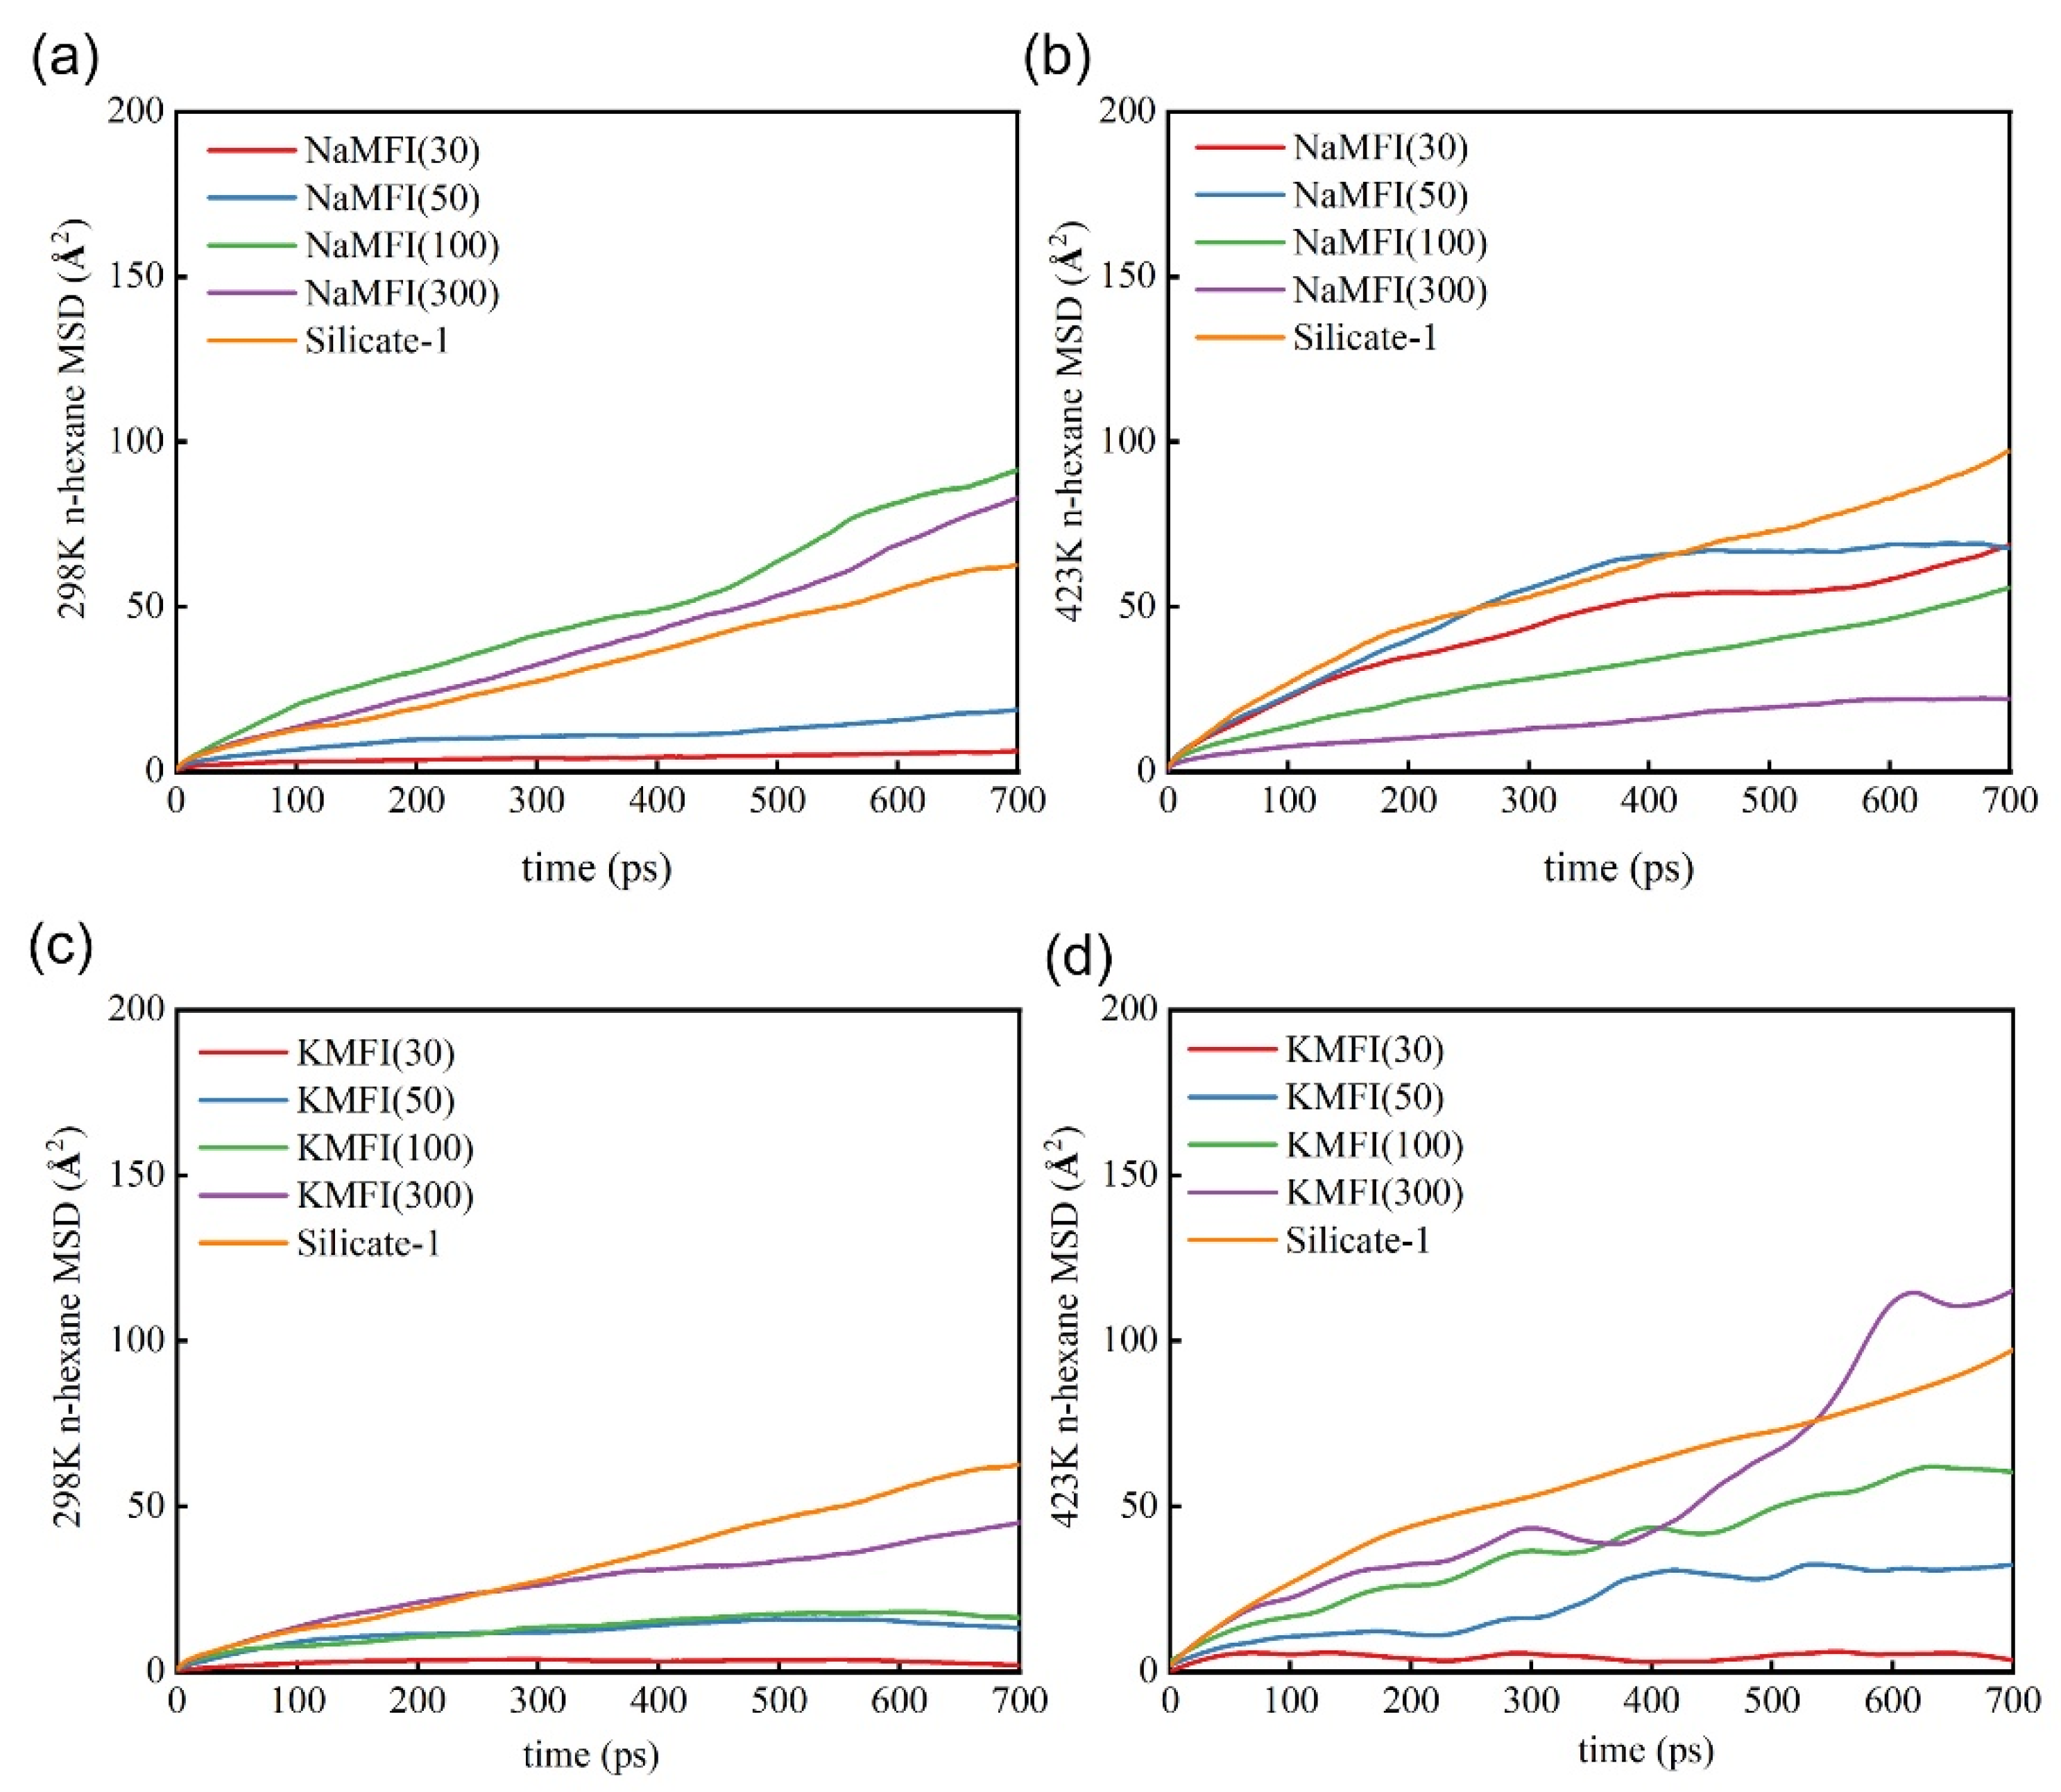
2.2. Adsorption and Diffusion Properties of N-Hexane Molecules on the NaMFI and KMFI Models

Figure 4 illustrates that adsorption isotherms of n-hexane molecules on silicate-1 and alkali metal cation exchanged ZSM-5 zeolites (i.e., NaZSM-5 and KZSM-5) at 298 K and 423 K. For NaZSM-5 and KZSM-5 zeolites, the temperature has little effect on the saturated adsorption amounts, but higher pressure is still required to achieve saturated adsorption at high temperatures. The lower saturated adsorption capacity than silicate-1 can be found in Na+ and K+ systems due to the decrease in effective void size posed by alkali-metal cations. Na+ exchanged ZSM-5 with high SAR (SAR = 300, 100) have higher saturated adsorption capacity than that with low SAR (SAR = 50, 30, 5.86 and 2.43). A suitable Na+ cationic environment (SAR = 12.47) is conducive to the n-hexane adsorption. The saturated adsorption amounts for KZSM-5 decrease with the SAR decreasing from 100 to 2.43, especially, saturated adsorption amounts of n-hexane on KZSM-5 zeolites have been reduced to 6 and 0 molecules per cell, when the SAR is at 5.86 and 2.43. These results suggest that the alkali–metal cations not only can reduce the effective void size of the system but also provide a cationic environment for the n-hexane molecules at the same time, leading to a significant difference in the adsorption performance of NaZSM-5 and KZSM-5 compared with HZSM-5.
Figure 5 and Figure 6 present the density distribution of n-hexane molecules on silicate-1, NaZSM-5 and KZSM-5 with different SAR at 298 K. The density distribution in Figure 5a–h and Figure 6a–h can also be divided into three clusters. For Na+ systems together with silicate-1, the first cluster of panels 5a–c has the highest density distribution in both channels of zeolite, the second group of panels 5d–f and the last group of panels g and h has the lowest density distribution. There are some differences in the distribution of n-hexane in K+ systems. The green area in panel f of Figure 6 (KMFI, SAR = 12.71) decreases significantly compared to that in panel f of Figure 5 (NaMFI, SAR = 12.71). Noticeably, n-hexane molecules have almost no density distribution on KZSM-5 with the SAR of 5.86 and 2.43, which is in good agreement with the change of the above adsorption isotherm. Distribution characteristics of n-hexane on silicate-1, NaZSM-5 and KZSM-5 with different SAR at 423 K is basically similar to that at 298 K (cf. Figures S2 and S3). Specific quantities of n-hexane in NaMFI, KMFI and silicate-1 models used for MD calculations for further evidence are shown in Figures S5 and S6. The numbers of n-hexane in the straight channels (eight molecules per cell) and the sinusoidal channels (12 molecules per cell) of NaMFI zeolite (silicate-1 and SAR = 300, 100, 50 and 30) are the same. The numbers of n-hexane in the straight channels (6~9 molecules per cell) and the sinusoidal channels (14~11 molecules per cell) of KMFI zeolite (silicate-1 and SAR = 300, 100, 50 and 30) are similar. The differences of n-hexane distribution in straight and sinusoidal channels are inapparent and irregular in Figure 5, Figure 6, Figures S2, S3, S5 and S6, which should be linked to the properties of alkali-cations (size and electronegativity).
Based on the above results, we only analyze and discuss the diffusion properties of n-hexane molecules on silicate-1, NaZSM-5 and KZSM-5 with typical SAR (300, 100, 50 and 30). MSD of isotropic diffusion coefficient for the n-hexane on these NaMFI and KMFI models are represented in Figure 7. From Figure 7a, the diffusion coefficient of n-hexane molecules on the NaZSM-5 zeolites with high SAR of 300 and 100 is the highest (maximum values of MSD are ca. 90 Å2), followed by silicate-1 (maximum values of MSD is ca. 60 Å2) and then the NaZSM-5 zeolites with SAR of 50 and 30 showed a much lower diffusion coefficient (maximum values of MSD are ca. 10 Å2), which is mainly attributed to the differences in properties of alkali-cations and the distribution of n-hexane molecules (cf. Figure 5). The Na+ cations on the NaZSM-5 zeolites with high SAR of 300 and 100 increase the diffusion rate of n-hexane molecules. This is all due to the negligible space-confined posed by the small amount of Na+. As the amount of Na+ cations increases, that is, a decrease in SAR, the rate of diffusion decreases. We found that the diffusion coefficient of silicate-1 is the highest when the temperature is increased to 423 (maximum values of MSD are ca. 90 Å2). Maximum values of MSD with SAR 300, 100 and with SAR 50, 30 are near 50 Å2 and 70 Å2, respectively. Contrary to 298 K, the diffusion coefficient of the NaZSM-5 with SAR of 300 and 100 is lower than that of 50 and 30, which is mainly due to the increase in mobility in channels at high temperature to affect interaction mode between host and guest. In order to explain the nature of these differences, we conducted an in-depth analysis of the anisotropic MSD with X-axis, Y-axis and Z-axis direction (cf. Figures S7 and S8). X-axis and Y-axis directions represent the sinusoidal and the straight channels, respectively. There are no channels in the Z-axis direction, which is why the diffusion coefficient in this direction is basically zero. At 298 K and 423 K, the diffusion coefficient of n-hexane molecules in the X-axis and Y-axis directions of NaZSM-5 with high SAR of 300 and 100 shows completely opposite trends, suggesting that high temperatures tip a balance so that transport in sinusoidal channels is enhanced over that in straight channels. For KZSM-5 zeolites at 298 K and 423 K (cf. Figure 7c,d), the maximum values of MSD show the following pattern: silicate-1 > KZSM-5 (SAR = 300) > KZSM-5 (SAR = 100 > KZSM-5 (SAR = 50) > KZSM-5 (SAR = 30), indicating that the diffusion coefficient of n-hexane molecules decreases with the decrease in SAR. The reason is that K+ cations pose nonnegligible diffusional limitations due to their larger size, which slows the diffusion of n-hexane molecules. Moreover, it should be noted that in the KZSM-5, in high temperatures (423 K), appears a second slow process; it may be attributed to the process of molecules approaching cations. When molecules are close to the molecules with high mobility, an opposite effect immediately occurs to accelerate the diffusion of molecules and then appear a second slow process. The second slow process does not occur in the zeolite with low SAR (i.e., higher K+ cation content) because n-hexane would approach another K+ cation with high mobility when it is close to one K+ cation with high mobility, which would limit the transport of hexane molecules. The properties of alkali cations in MFI models are closely related to the adsorption and diffusion performance of n-hexane molecules, and the alkali cations with low electronegativity and large size are unfavorable to the adsorption and diffusion of n-hexane molecules.

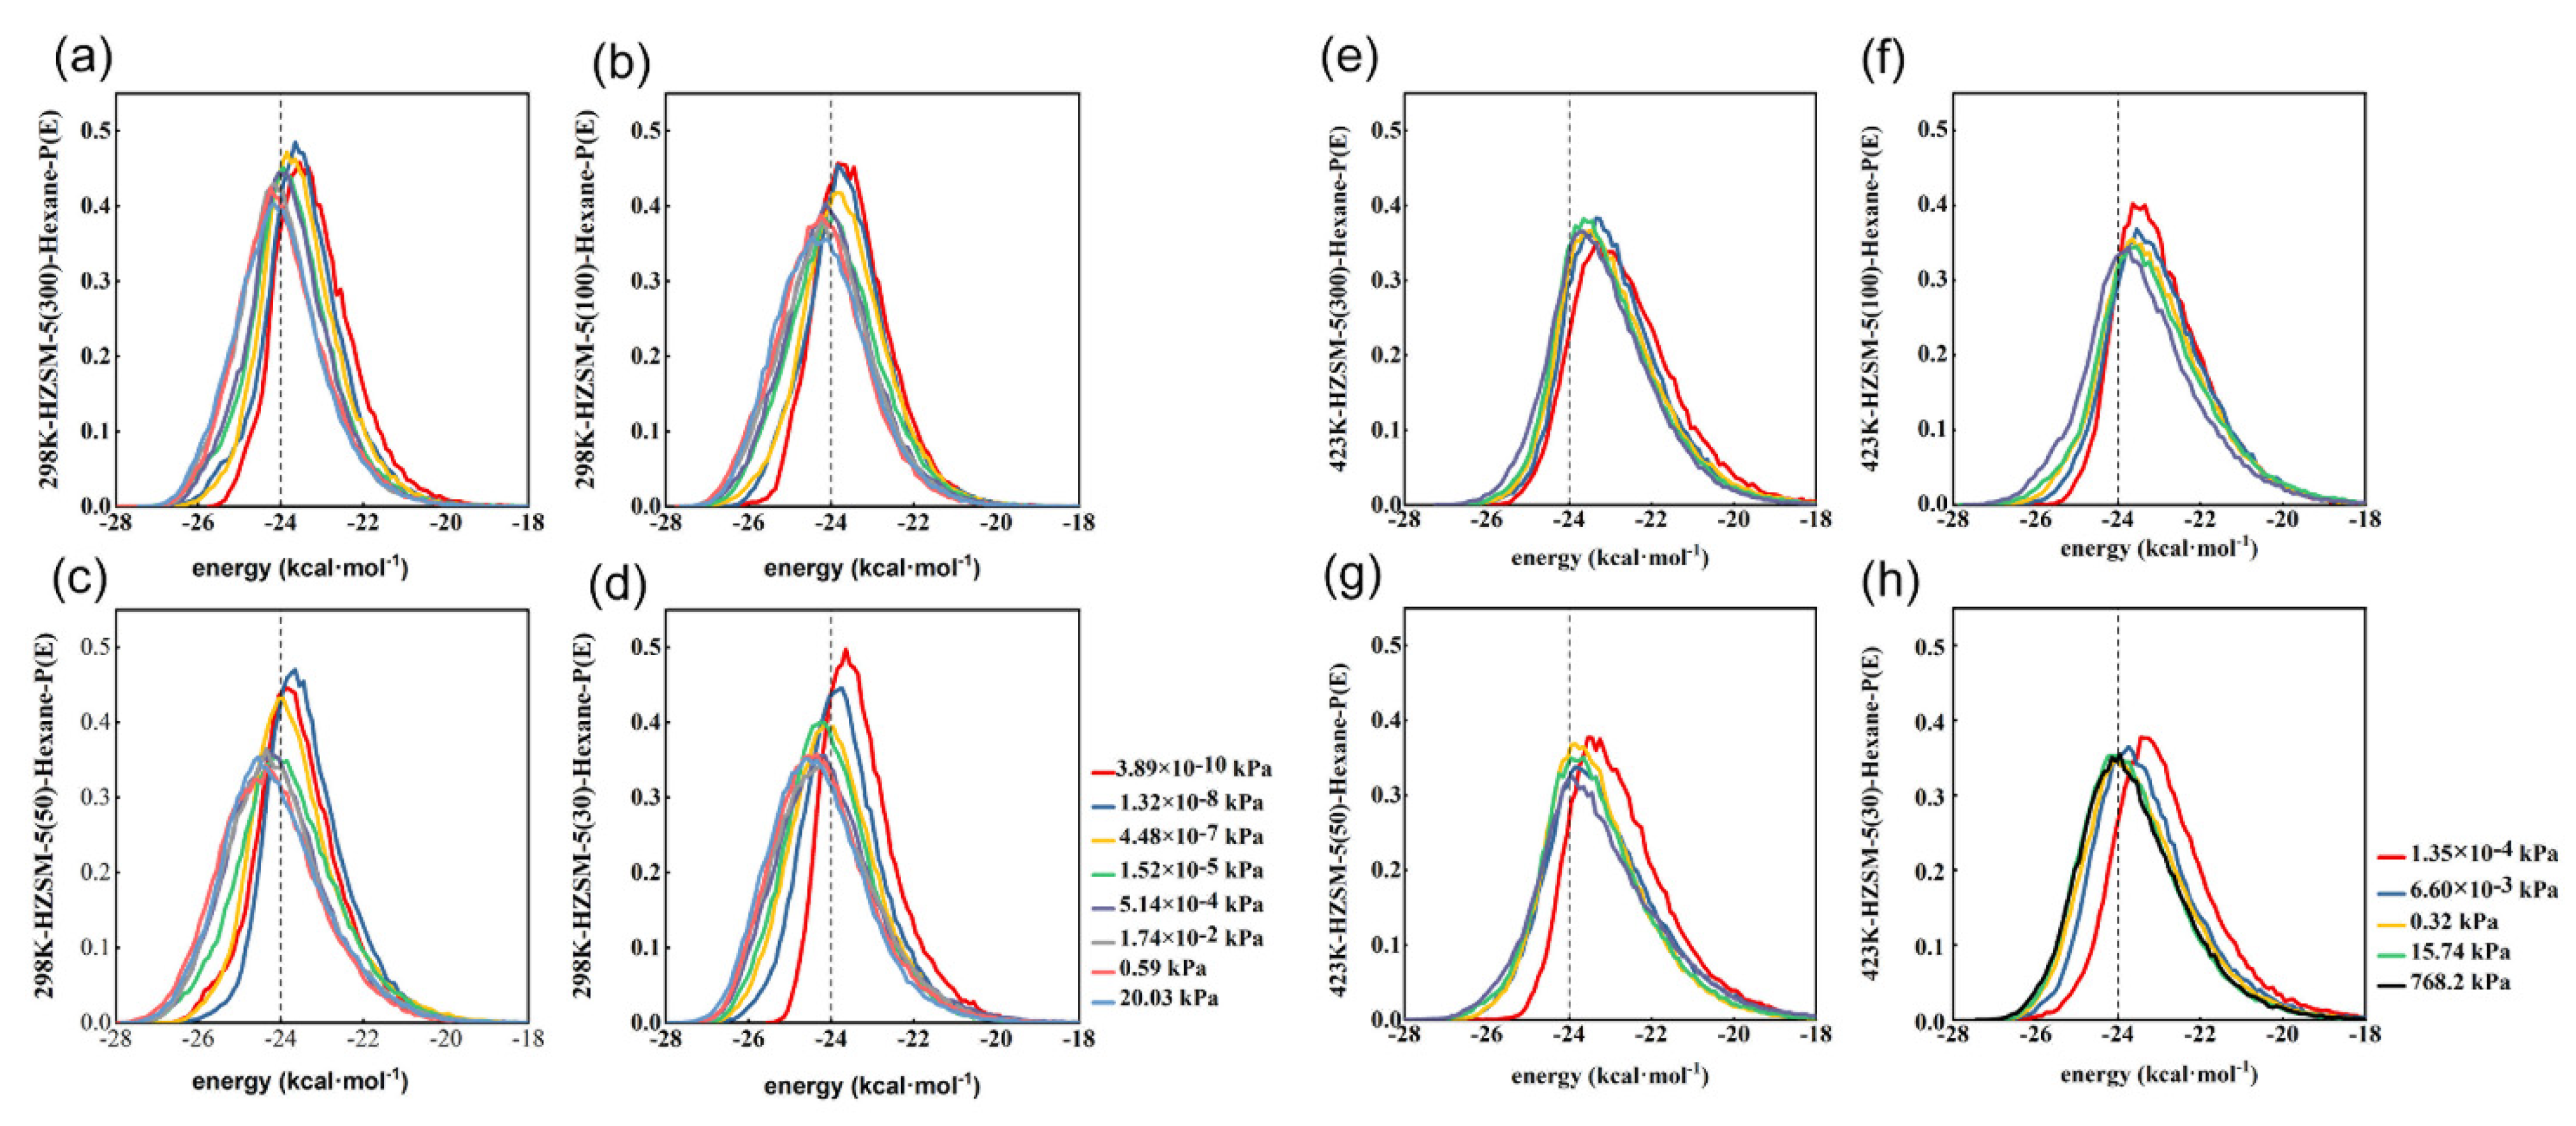
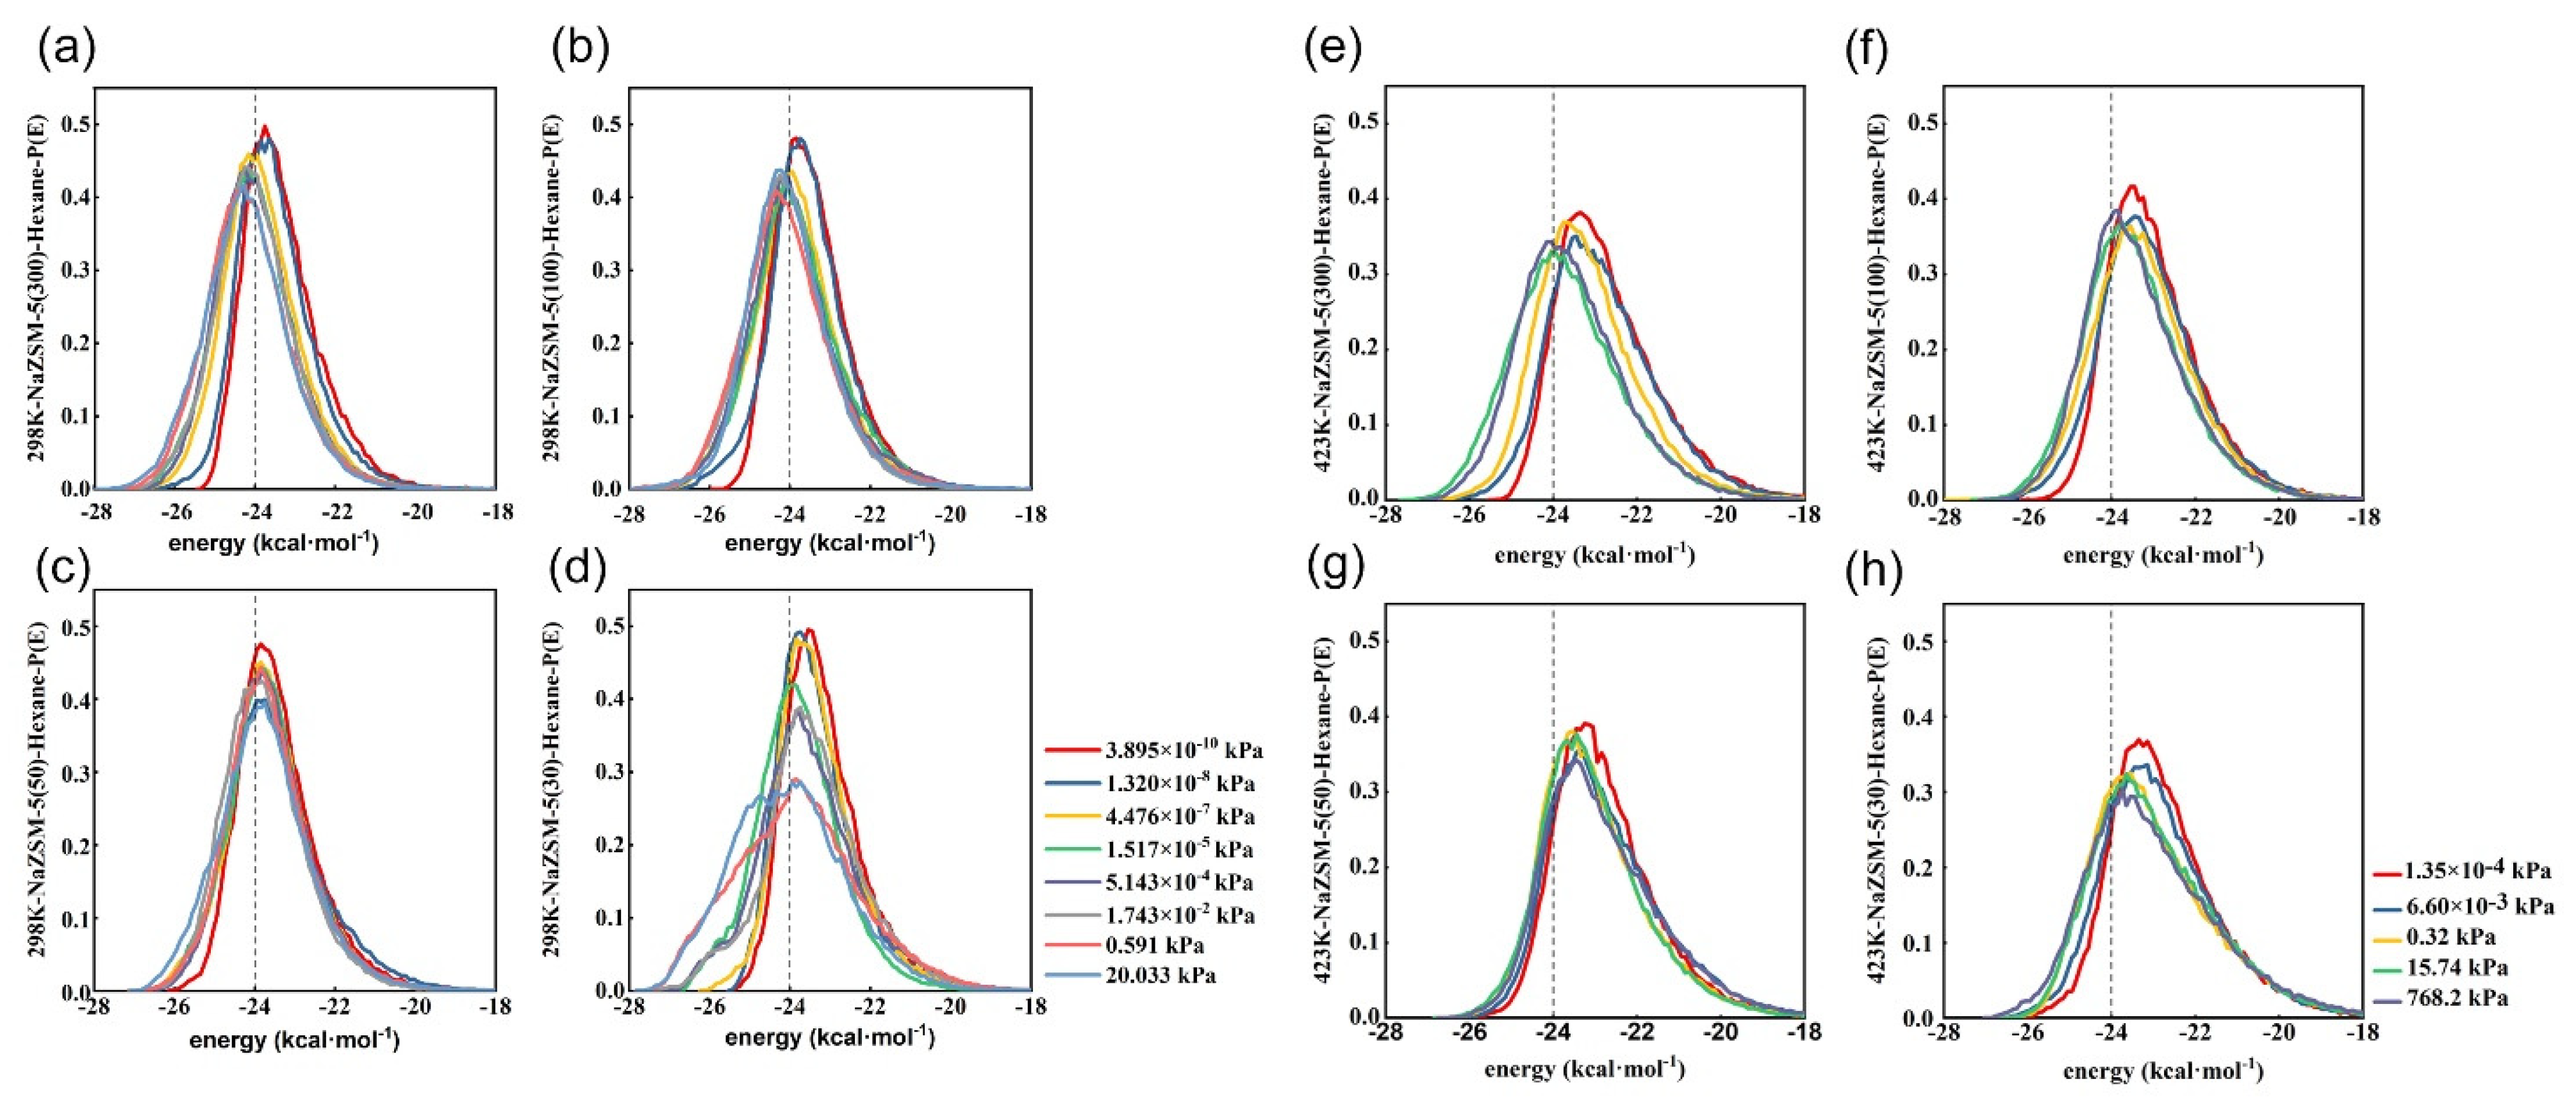
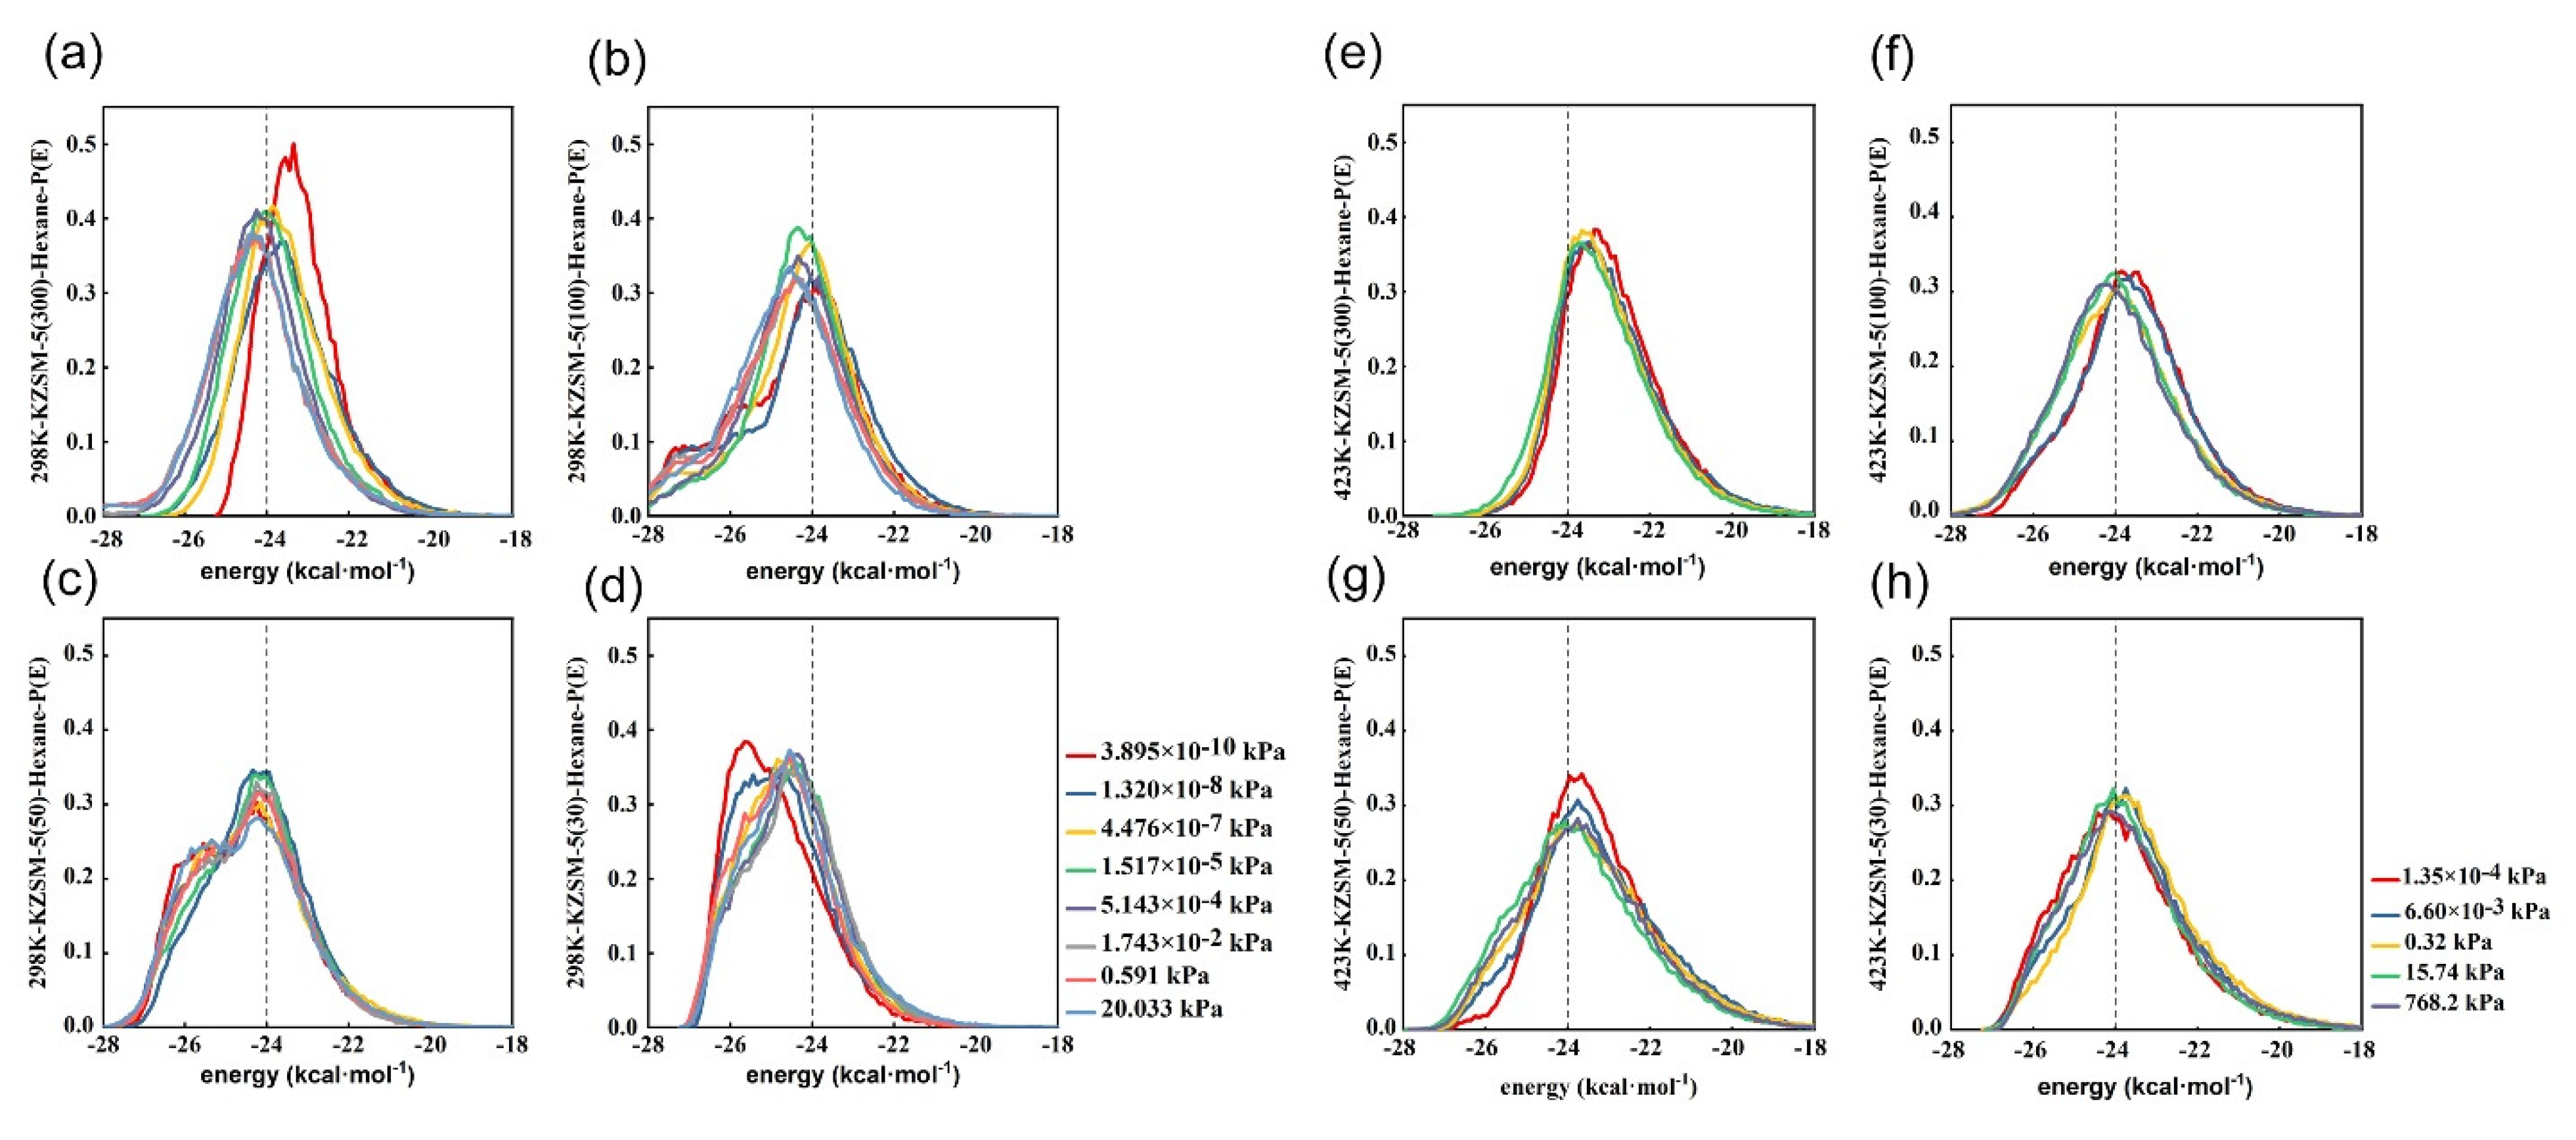
2.3. Comparative Analysis of Energy Distribution of N-Hexane Molecules on the HMFI, NaMFI and KMFI Zeolites with Typical SAR

In order to further explore the essence of the change of adsorption state, the isosteric heats and the interaction energy distribution curves of n-hexane molecules on the HMFI, NaMFI and KMFI zeolites with typical SAR are analyzed in Figure 8, Figure 9, Figure 10 and Figure 11. Figure 8 illustrates the isosteric heats of n-hexane molecules on the HMFI, NaMFI and KMFI zeolites with typical SAR at 298 K and 423 K. These figures make it clear that increasing temperature would reduce the isosteric heats of n-hexane molecules over these MFI zeolites. This trend agrees well with the interaction energy distribution curves; interactions between n-hexane molecules and these MFI zeolites were decreased with the increase in temperature corresponding to the right shift of the energy distribution curve (cf. Figure 9, Figure 10 and Figure 11). Figure 8a,b refer to HZSM-5 and silicate-1 show a roughly linear increase in strength as loading increases, curves for the range of SAR values (300, 100 and 50) seem noisier. The results of linear fitting the data are listed in Table S1. The values of R2 for HZSM-5 and silicate-1 are 0.65 (SAR = 300), 0.90 (SAR = 100), 0.93 (SAR = 50), 0.97 (SAR = 30) and 0.94 (silicate-1). The localized and uneven distribution of n-hexane in the HZSM-5 with SAR of 300, 100 and 50 can be seen as the cause of the fact that curves occur some degree of deviation from the regression line. The distribution of n-hexane delocalizes well with a low SAR of 30, presenting a better linear relationship than silicate-1. The same trend also can be found in high temperatures (cf. Table S1). The order of isosteric heats at 298 K is as follows: HZSM-5 (SAR = 30) > silicate-1 > HZSM-5 (SAR = 300, 100 and 50). The temperature rises to 423 K, the adsorption heat on silicate-1 is higher than that on the HZSM-5 due to the reduction in the interaction between the proton adsorption site and the n-hexane molecules. It is important to note that the more acidic sites, the more significant the effect of high temperature weakening interaction (cf. Figure 8b). From Figure 9, there are two kinds of interactions, which are distributed on the left and right of 24 kcal·mol−1, respectively. In Figure 9a–d, the higher-pressure (>10−5 kPa or >5 × 10⁻⁷ kPa) cluster refers to relatively strong interaction around about −24.5 kcal/mol and the low-pressure cluster (<5 × 10⁻⁷ kPa or <10−8) refers to weaker interaction, at most −24 kcal. There is considerable overlap of the several distributions. At the higher temperature, the clustering is less evident and there seems to be a shift toward lower adsorption energy. There is at least a hint that the two peak values may refer to the straight and sinusoidal channels.
Figure 8c,d referring to NaZSM-5 represent a slight linear increase in strength as loading increases, especially at high temperatures. The synergistic mechanism of multiple Na+ sites at low SAR may be seen as the cause for the departure from linearity. The isosteric heats of n-hexane molecules on NaMFI zeolites at 298 K are almost identical, with the exception of the NaZSM-5 with SAR of 30 (see Figure 8c). Interaction energy distribution curves of n-hexane molecules on NaZSM-5 with SAR of 30 present the special peak at 25 kcal·mol−1, indicating the stronger interactions between the n-hexane molecules and the Na+ sites (see Figure 10d), which can account for the higher isosteric heat in Figure 8c at 30 SAR. At 423 K, isosteric heats curves on NaZSM-5 zeolites are all lower than on silicate-1, possibly because kinetic energy in high temperature overcome the attraction between n-hexane and the zeolites. The specific difference for different SAR mainly depends on the interaction mode between Na+ cation sites and n-hexane and the distribution of n-hexane molecules, which will cause the completely opposite trend of the anisotropic MSD (cf. Figure 7, Figures S7 and S8). Figure 8e,f refer to KMFI that depict further scatter, that is, the lack of linear correlation between isosteric heat and loading. The isometric heats are much higher than that of the HMFI and NaMFI, and the order is basically followed, the lower the SAR, the higher the isometric heat (see Figure 8e,f). The interaction mode of host–guest is similar to the NaMFI, but K+ has a larger size and lower electronegativity, resulting in stronger diffusion limitation and interaction energy; therefore, the decrease in adsorption amount of n-hexane and the increase in complexity of interaction mode are the reasons for the erratic data. This trend keeps with the energy distribution curve in the K+ systems that show quite different behavior in detail. The new cluster is shown in Figure 11b–d, which refers to the stronger interaction around about −26 kcal, which should be linked to the synergistic mechanism between K+ cations, which is much stronger than Na+ systems. This interaction is greatly improved with the decrease in the SAR that is also according to the change in adsorption and diffusion properties of n-hexane molecules. These findings show that the interactions between the n-hexane molecules and proton sites are favorable to the adsorption and diffusion of n-hexane molecules (about −24 kcal·mol−1), while the strong interactions between the n-hexane molecules and alkali-cation sites are not conducive to the adsorption and diffusion of n-hexane molecules (above −25 kcal·mol−1).

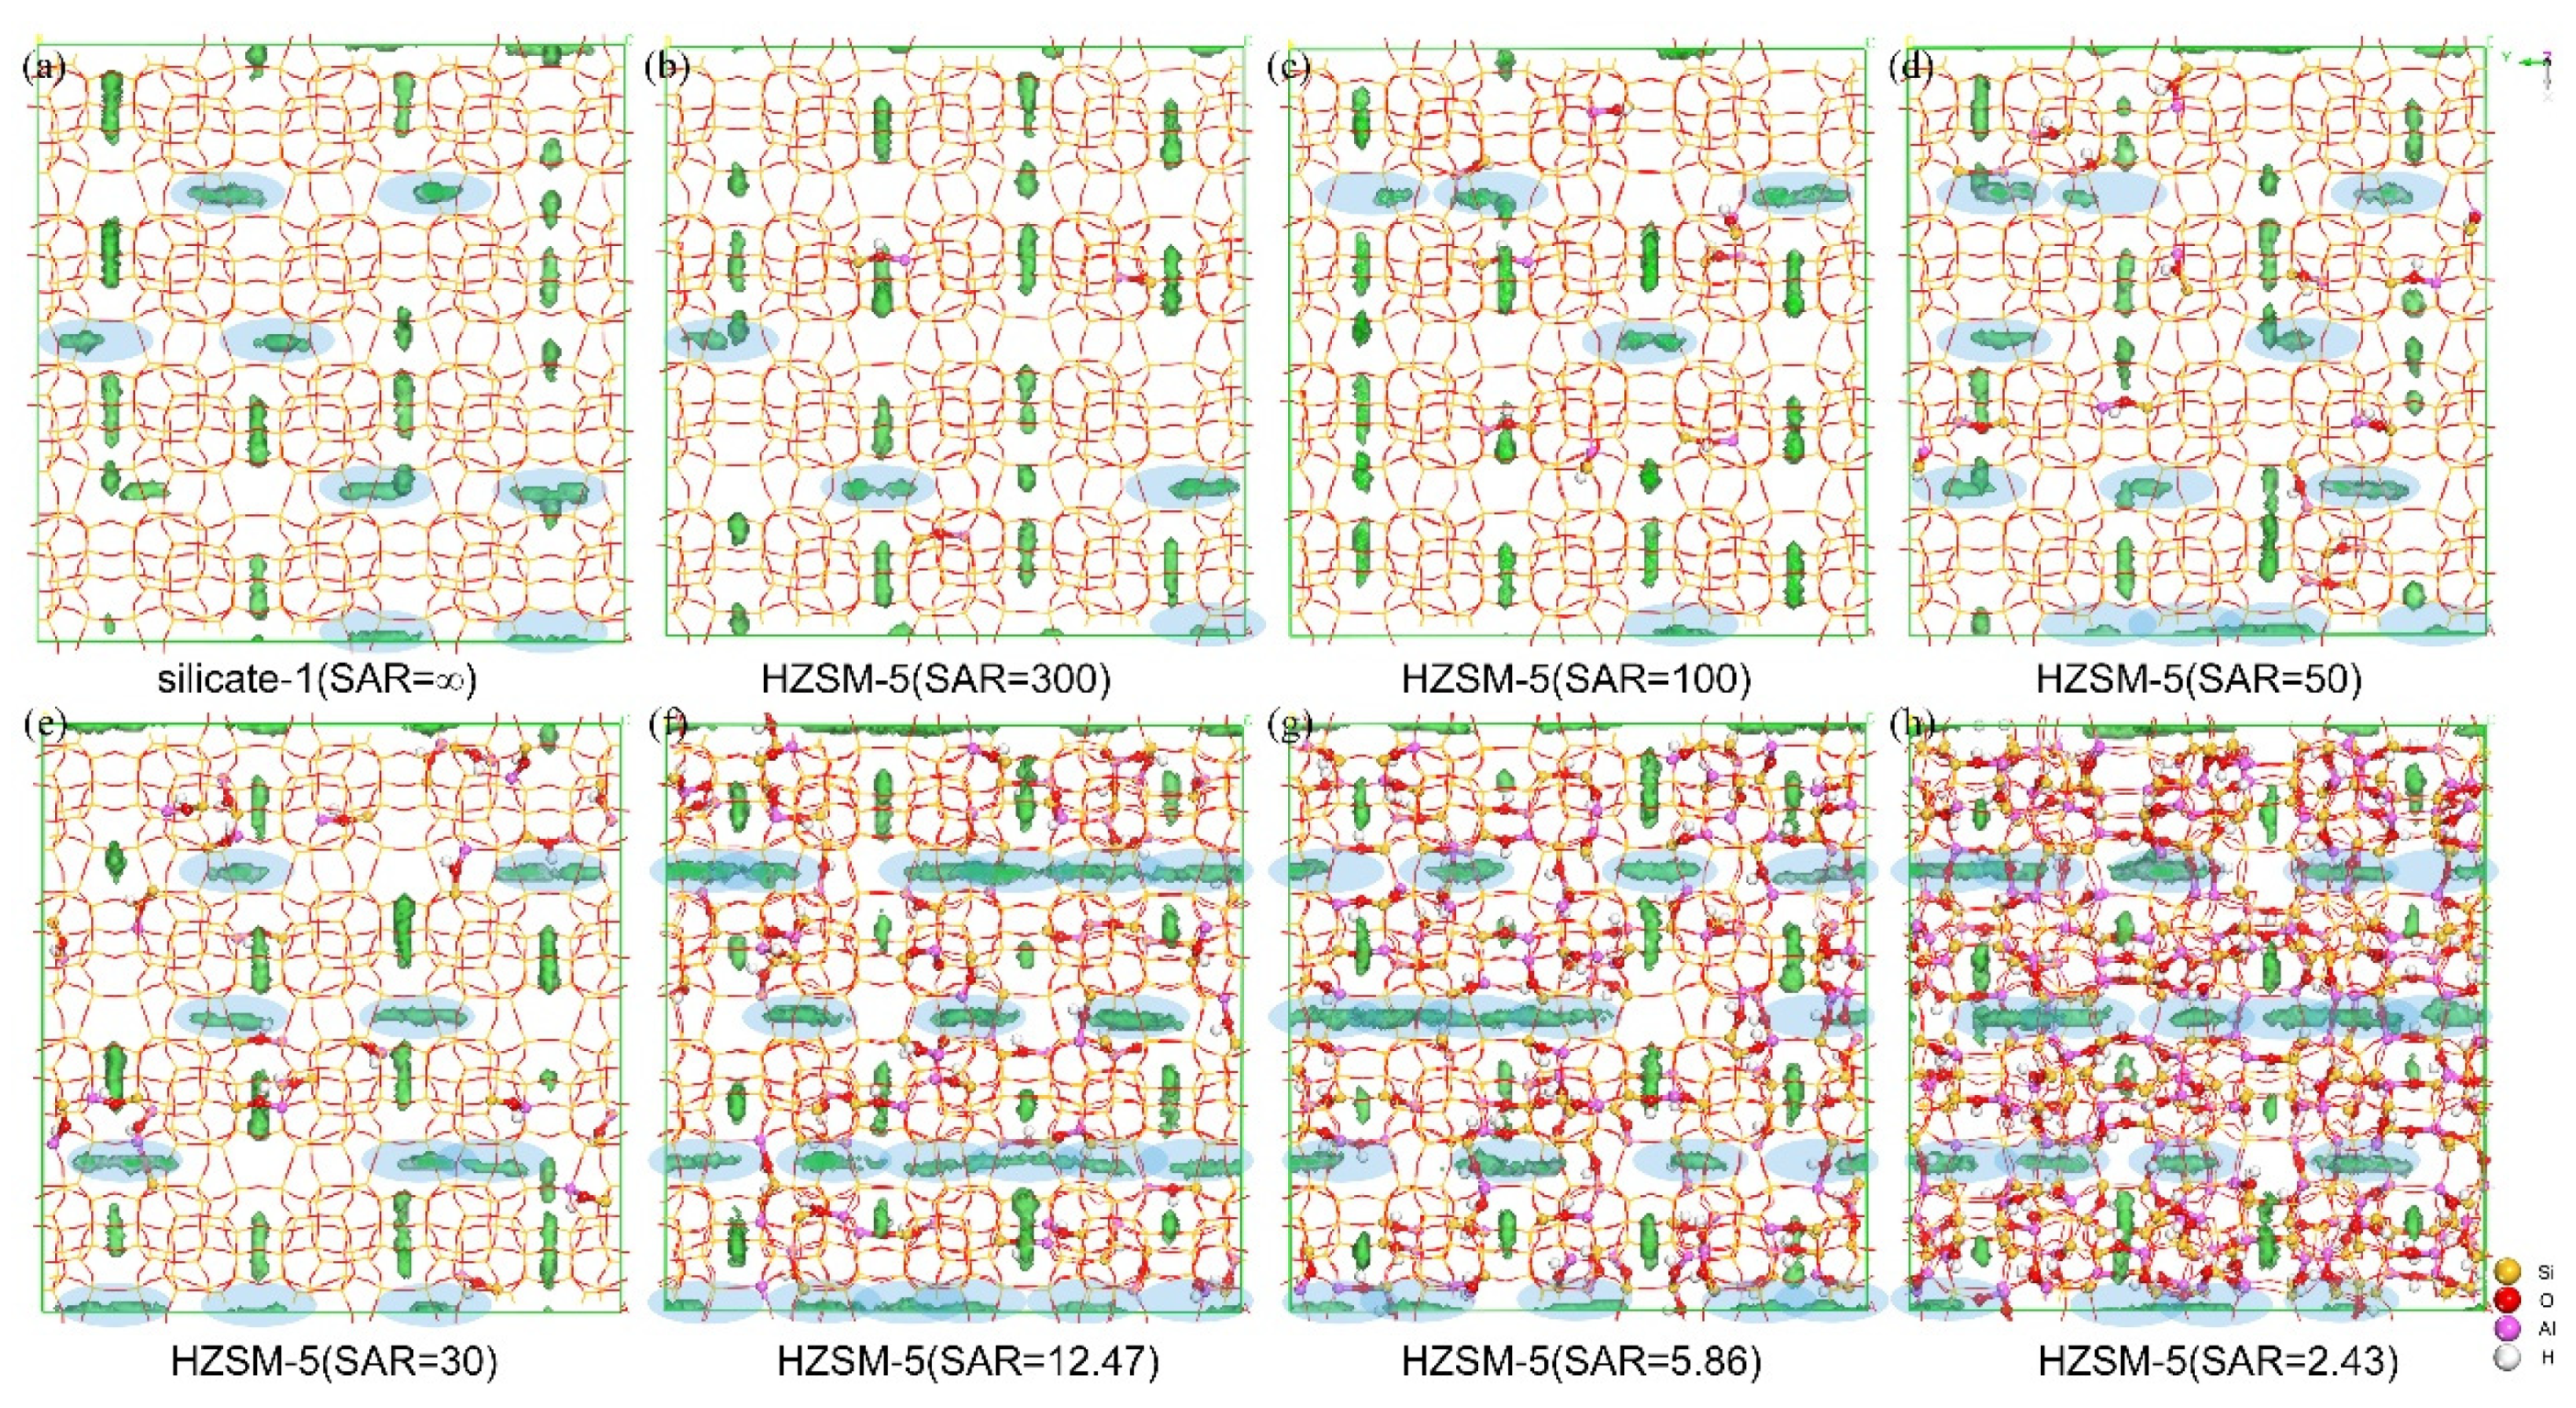
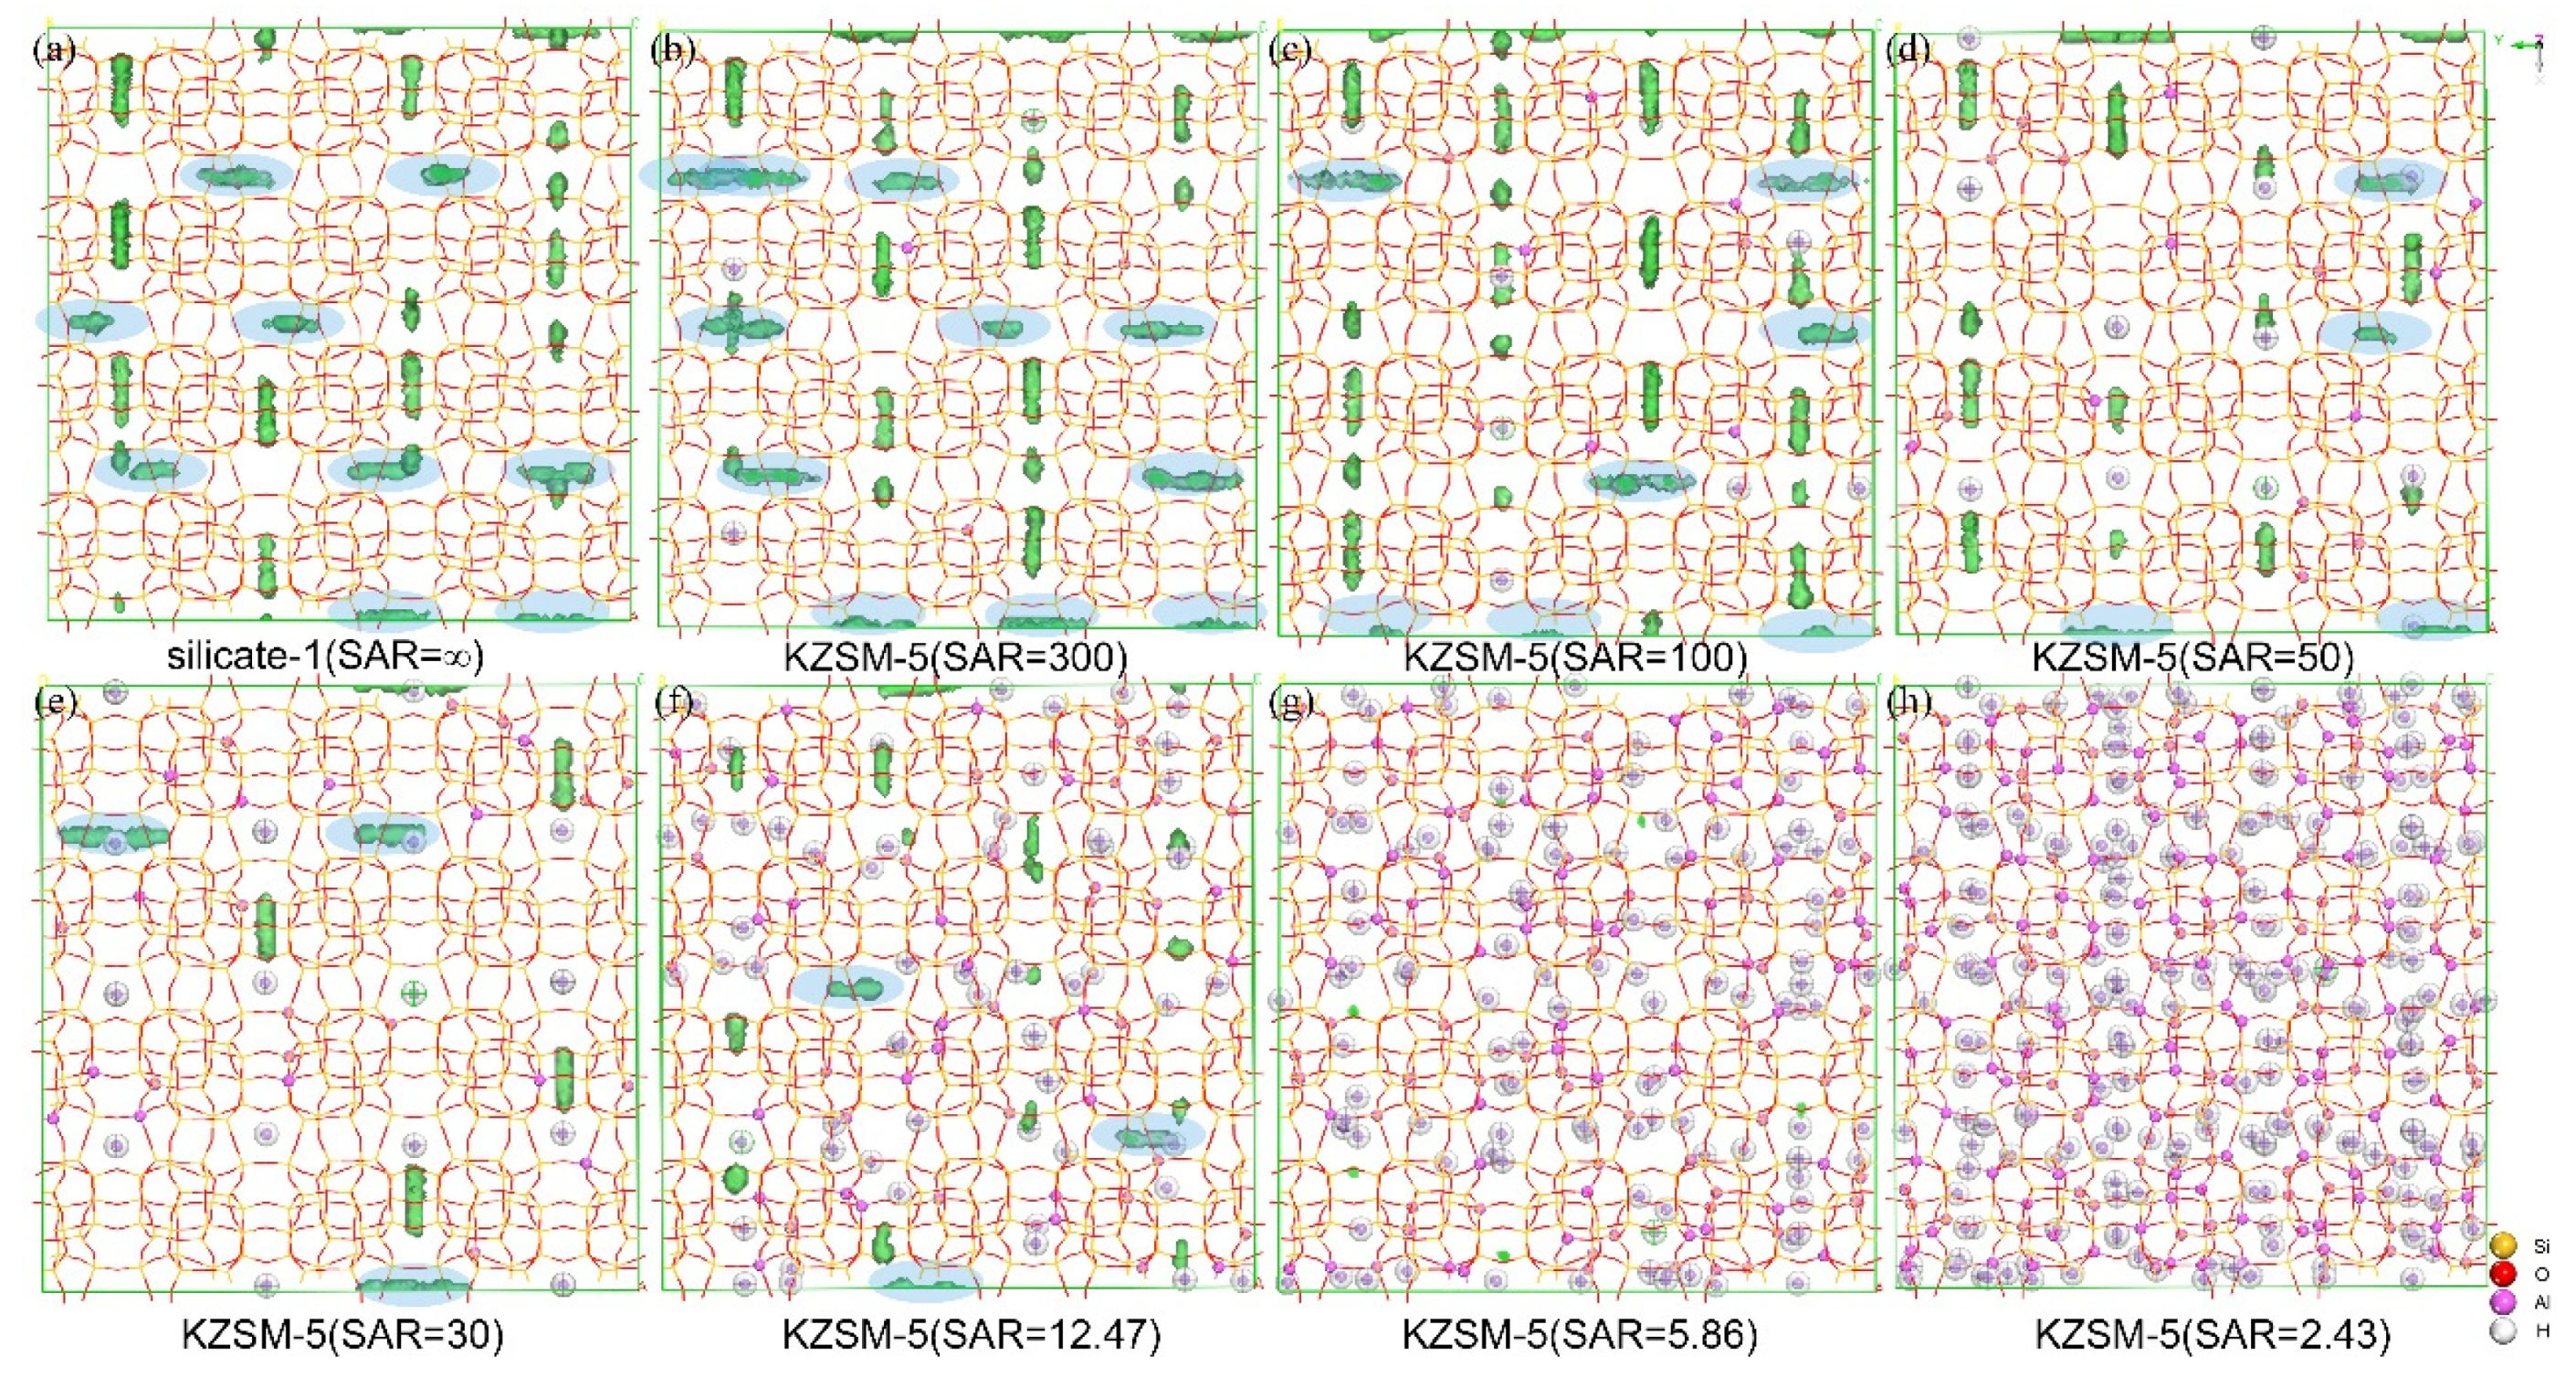
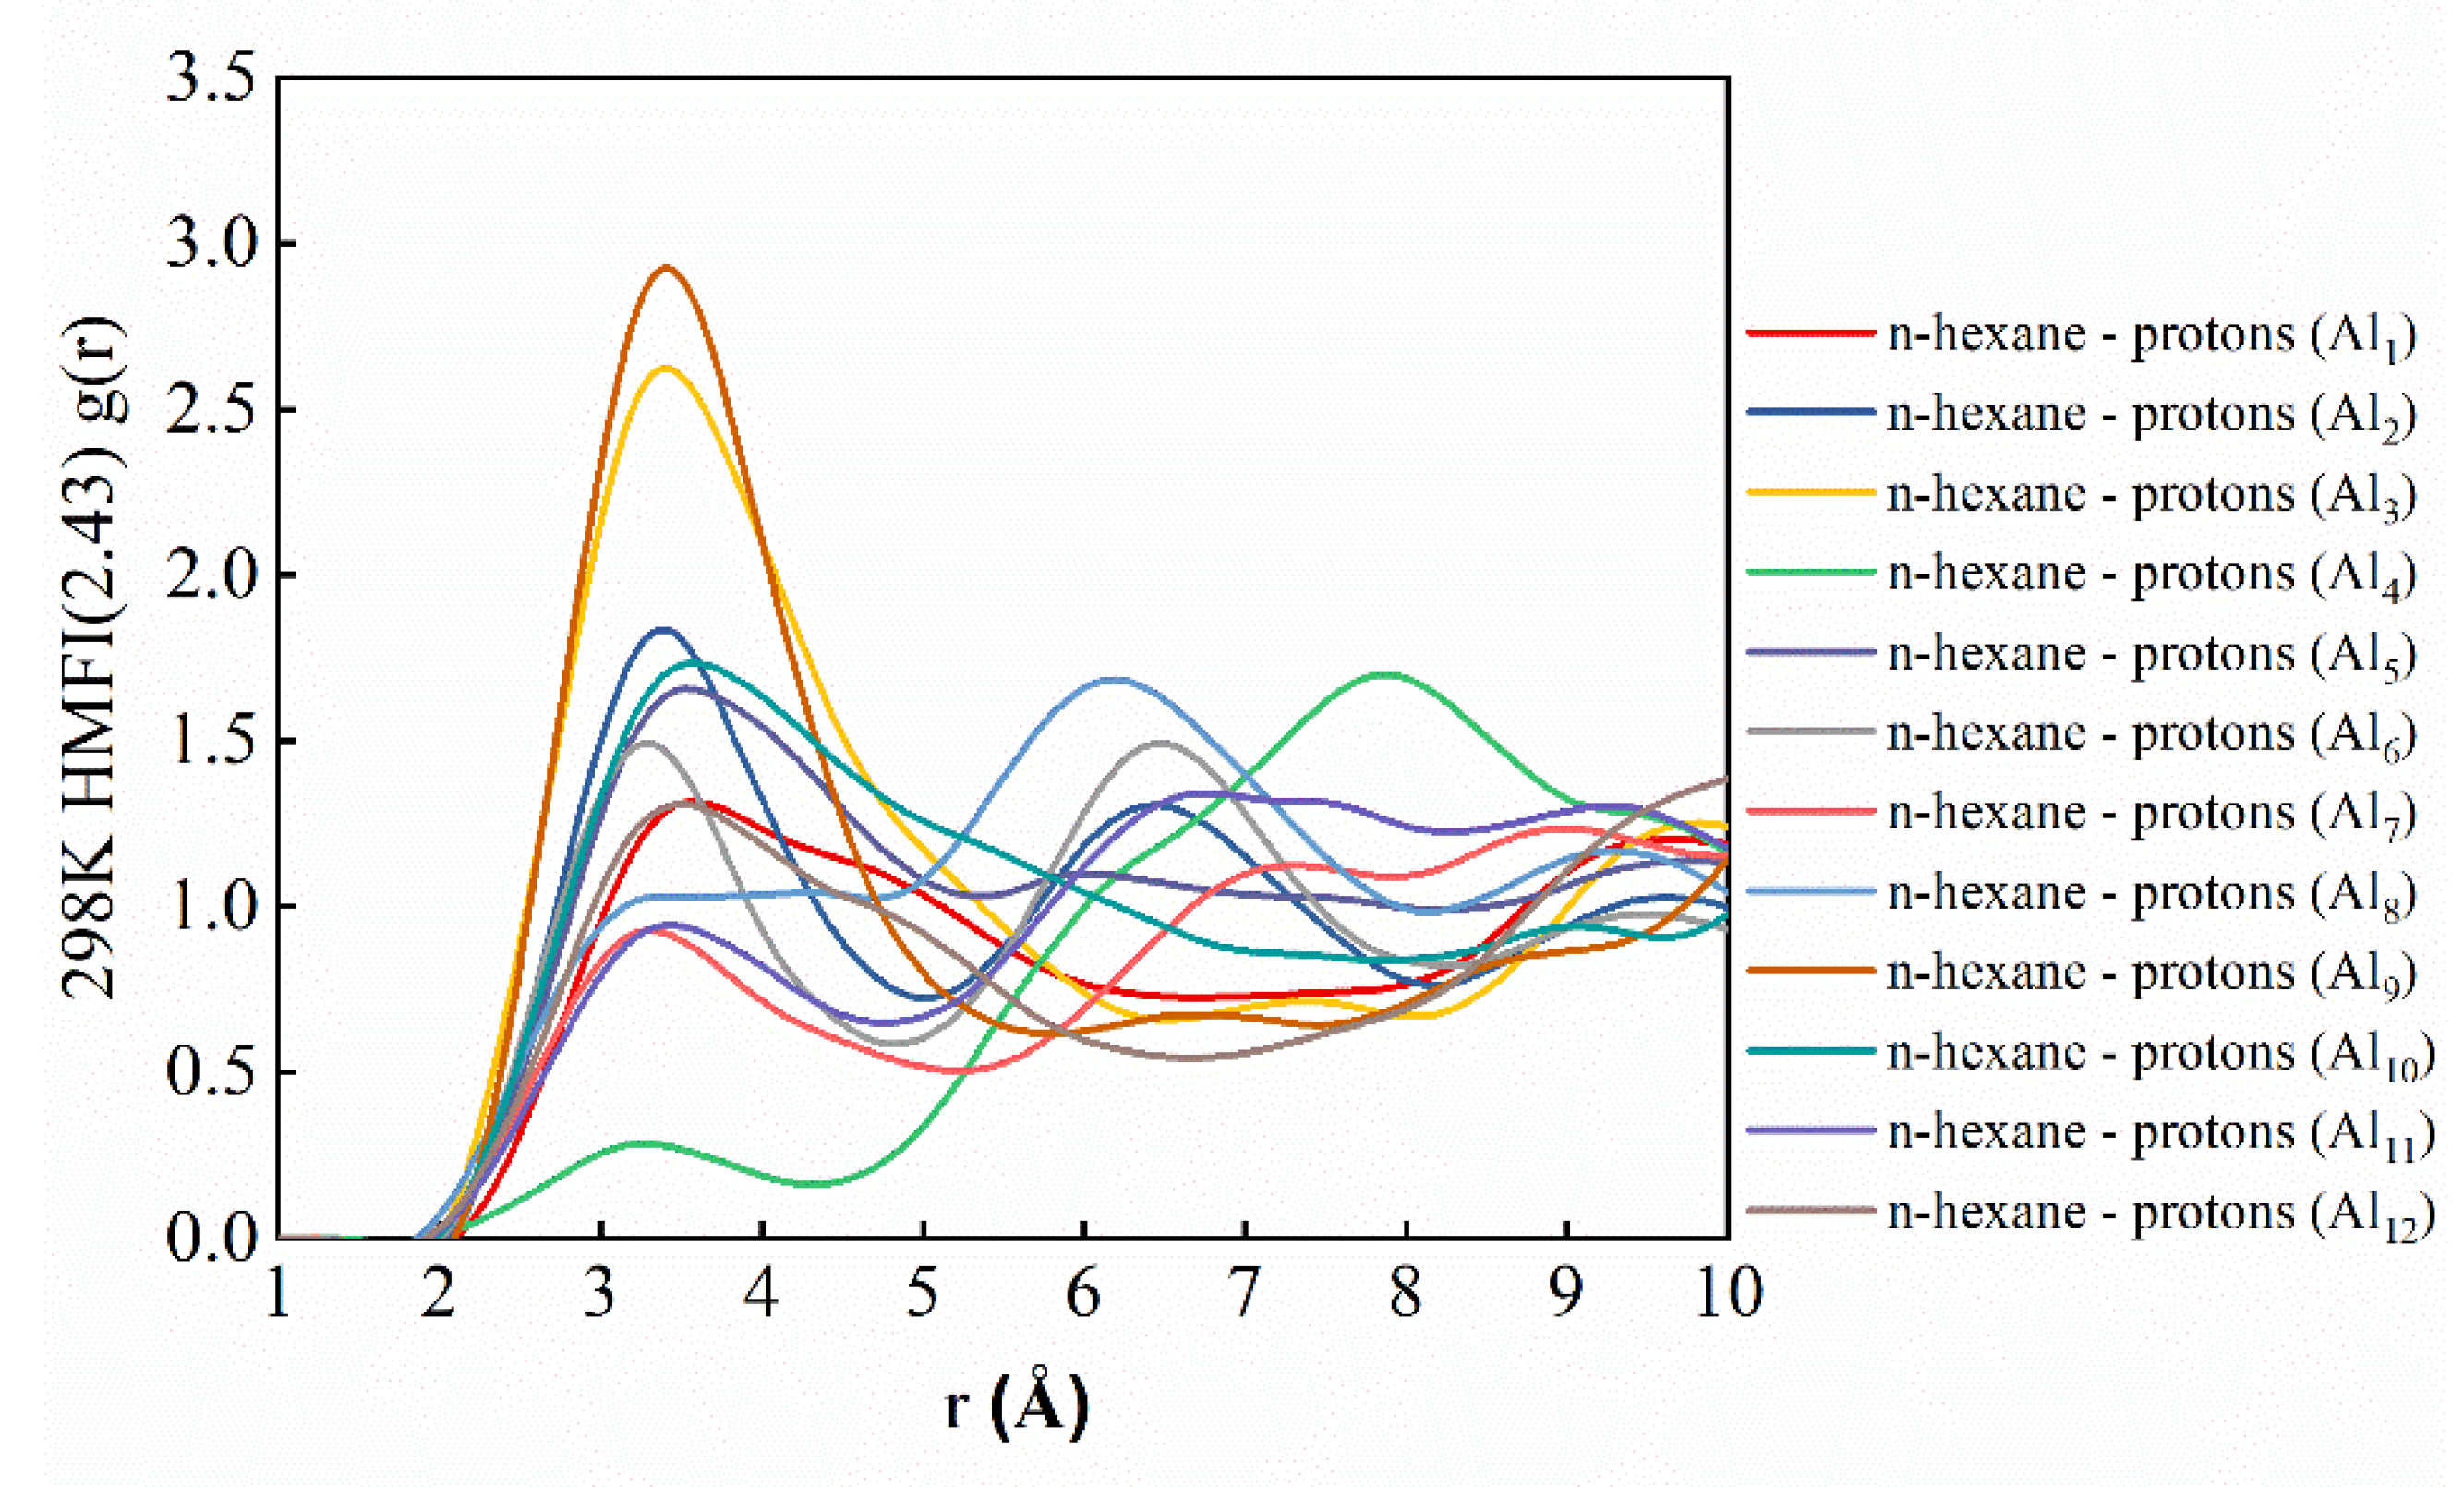
2.4. Identification of Adsorption Sites of N-Hexane Molecules on HZSM-5

HZSM-5 model with the SAR of 2.43, which contains substituted Al atoms at all 12 T sites, was selected for exploring the adsorption site of n-hexane. RDFs can clearly identify the relative locations of particles by calculating the possibility of the presence of other particles surrounding a particular particle. Figure 12 gives the RDFs of COM-H (COM refers to the mass of the center of the n-hexane molecules; H refers to a proton in the Si-O(H)-Al) on HZSM-5 with the SAR of 2.43. It can be seen that the acid sites in T9 and T3 have the highest adsorption probability with the r (Å) of 3.5 Å, followed by T2, T5 and T10. The result reported here agrees well with previous related studies that suggest that T2, T3, T5 and T10 sites are all stable acidic sites in MFI structure and should represent the active site for sorption and reaction [8,20,22]. For T9 site, it is a very promising n-hexane adsorption site, although it may not be easily replaced by aluminum.

3. Discussion

The adsorption and diffusion of n-hexane on/in low SAR (<50) H-ZSM-5 models were enhanced by the preferable distribution of n-hexane in straight channels and enhanced interaction between protons and n-hexane molecules (about 24 kcal·mol−1). In Na+/K+ exchanged ZSM-5, the presence of alkali metal cations in the framework affects the transport of molecules, which alters the adsorption and diffusion properties of the alkali metal cations exchanged ZSM-5 in comparison to HZSM-5. The cations not only can reduce the effective void size of the system but also provide a cationic environment for the n-hexane molecules at the same time. The lower saturated adsorption capacity than silicate-1 can be found in Na+ and K+ systems due to the decrease in effective void size posed by alkali-metal cations. Na+ exchanged ZSM-5 with high SAR (SAR = 300 and 100) have higher saturated adsorption capacity than that with low SAR (SAR = 50, 30, 5.86 and 2.43). A suitable cationic environment (SAR = 12.47) is beneficial to the n-hexane adsorption. The various ionic environments will lead to differences in the interaction mode between the host and the guest, thereby changing the molecular diffusion. The existence of optimal amount of Na+ (SAR = 300, 100 at 298 K or SAR = 50, 30, at 423 K) is beneficial to the diffusion of n-hexane molecules. This phenomenon is not seen in the K+ system. The adsorption–diffusion performance of n-hexane gradually decreases with the increase in K+ concentration. It was found that the strong interaction between n-hexane molecules and alkali-metal cations (above 25 kcal·mol−1) is not beneficial to the adsorption and diffusion of n-hexane molecules on/in the zeolite framework. The effect of temperature on the adsorption and diffusion behavior of n-hexane molecules in the zeolite models was also studied, which shows that kinetic energy in high temperature possibly overcome the attraction between n-hexane and the zeolites, easing diffusion. In addition, simulation results also suggested that the T9 and T3 are the most likely sites for n-hexane adsorption, followed by T2, T5 and T10. The findings of the work provide a theoretical basis for the rational design and synthesis of zeolites with the tailored SAR for processes involving adsorption and diffusion of alkane molecules.

4. Computational Model and Methods

Models: The one-unit-cell siliceous MFI zeolite model with the lattice parameters of a = 20.090 Å, b = 19.738 Å and c = 13.142 Å and α = β = γ = 90.0° is selected to construct 2 × 2 × 2 supercell with 768 silicon and 1536 oxygen atoms based on the International Zeolite Association (IZA) database of zeolite structures. The MFI structure consists of intersectional straight and sinusoidal ten-membered-ring (10 MR) channels (5.3 × 5.6 Å (10 MR-str), 5.1 × 5.5 Å (10 MR-sin)). (see Figure S9).
The MFI models with different SAR and counterions (proton and alkali-cations) used in this study were all established from the MFI supercell mentioned above. The ZSM-5 models with typical and considered SAR of 300, 100, 50 and 30 are constructed for the calculation of this work. Moreover, we also considered ZSM-5 models with smaller SAR of 12.47, 5.86 and 2.43, in which the 12 kinds of T positions of Si atoms were all replaced by Al atoms to obtain the possible adsorption sites to active n-hexane molecules. The Al atoms are randomly introduced by the program, following Lowenstein′s rule [45,46]. After substitution, protons (H+) and metal ions (Na+ and K+) with positive charge compensate the negatively charged aluminosilicate framework, forming Brønsted and Lewis acid sites, respectively. The computational models are shown in Figures S10–S12.
Methods: All calculations were performed using the Sorption and Forcite software package (5.5, Accelrys, San Diego, CA, USA, 2010), contained in the Materials Studio 5.5 of Accelrys, based on giant canonical Monte Carlo (GCMC) and molecular dynamics (MD). Adsorption behavior and properties were calculated by the Sorption module. The Forcite module was used to calculate structural optimization and diffusion properties. For all the simulations, the consistent valence force field (CVFF), successfully utilized with silicate, aluminosilicate and other inorganic systems, was used in this study to measure the valence and nonbonding interactions of zeolite frameworks with adsorbates (host–guest) and adsorbates with adsorbates (guest and guest) [47]. The interactions were modeled by Lenard–Jones (LJ) potential plus Coulomb potential, as shown in the following part:
V ( r i j ) = 4 ε i j { [ ( σ ) i j r i j ] 12 [ ( σ ) i j r i j ] 6 } + q i q j r i j
where σij and εij are the LJ parameters, rij is the distance between i and j sites, qi and qj are the charges on the interaction center. Ewald summation method [48,49,50] is used to deal with the electrostatic interactions with a calculation accuracy of 4.184 J/mol; the Atom-based method is selected for van der Waals force interactions. The cutoff radius is 12.5 Å.
During the GCMC calculation process, the equilibrium steps were set to l × 105, followed by other production steps of l × 107. Each of the steps attempted to move every adsorbate once. The distribution of movement was chosen randomly with a fixed probability, which was 40% exchange, 20% translation, 20% rotation and 20% conformation [51]. The isosteric heat equation used in the adsorption process was calculated as follows:
Q s t = R T ( ( E a d E int r a ) N a d ) V , T
where Nad is the loading of n-hexane, Eintra is the intramolecular energy of n-hexane molecules, Ead is the sum of all interactions among adsorbate molecules (Eads−ads) and all adsorbate interactions with the framework of the MFI zeolites (Eads−zeo).
For the calculation process of MD, one simulation time step of 1.0 fs was employed, which was short enough to ensure good energy conservation. The system was performed using 1000 ps NVE-MD simulations and a Nose–Hoover thermostat was used for temperature control. The mean square displacement (MSD) of alkanes was used in analyzing the diffusion coefficients and is defined by the following equation
D s = lim t 1 6 t | r ( t ) r ( 0 ) | 2
where Ds is the self-diffusion coefficient, r (0) and r (t) are the initial position vector of the molecule and the position vector of the molecule at time t separately.
Further, radial distribution functions (RDFs) are mainly used for confirming the adsorption sites of n-hexane molecules on MFI models. The relative equation is
g i j ( r ) = Δ N i j ( r , r + Δ r ) V 4 π r 2 Δ r N i N j
where i and j stand for two particles, r is the distance between these two species, V is volume of the system, ΔNij (r, r + Δr) represents the ensemble-averaged number of the species j around i within a shell of Δr, and Ni and Nj are the number of i and j species.

Supplementary Materials

The following supporting information can be downloaded at: https://www.mdpi.com/article/10.3390/catal12020144/s1, Figures S1–S12 and Table S1.

Author Contributions

Methodology, J.Z. and L.H.; software, J.Z., L.H. and Q.L.; formal analysis, J.Z. and L.H.; investigation, J.Z., L.H. and P.W.; writing—original draft, J.Z.; Visualization, J.Z.; writing—review and editing, X.F.; conceptualization, Y.Q.; supervision, L.S. All authors have read and agreed to the published version of the manuscript.

Funding

This research was funded by the National Natural Science Foundation of China (Nos. 21902068, U20A20120 and U1908203) and by PetroChina Innovation Foundation (2020D-5007-0401).

Data Availability Statement

The datasets used or analyzed during the current study are available from the corresponding author on reasonable request.

Acknowledgments

The supports of this work by the National Natural Science Foundation of China (Nos. 21902068, U20A20120 and U1908203) and PetroChina Innovation Foundation (2020D-5007-0401) are gratefully acknowledged.

Conflicts of Interest

The authors declare no conflict of interest.

References

  1. Liu, C.; Li, G.; Hensen, E.J.M.; Pidko, E.A. Nature and catalytic role of extraframework aluminum in faujasite zeolite: A theoretical perspective. ACS Catal. 2015, 5, 7024–7033. [Google Scholar] [CrossRef]
  2. Liu, C.; Li, G.; Hensen, E.J.M.; Pidko, E.A. Relationship between acidity and catalytic reactivity of faujasite zeolite: A periodic DFT study. J. Catal. 2016, 344, 570–577. [Google Scholar] [CrossRef]
  3. Zheng, J.; Qin, Y.; Li, Q.; Zhang, L.; Gao, X.; Song, L. A periodic DFT study of the synergistic mechanisms between extraframework aluminum species and Brønsted acid sites in HY zeolites. Ind. Eng. Chem. Res. 2020, 59, 2736–2744. [Google Scholar] [CrossRef]
  4. Huang, C.; Han, D.; Guan, L.; Zhu, L.; Mei, Y.; He, D.; Zu, Y. Bimetallic Ni-Zn site anchored in siliceous zeolite framework for synergistically boosting propane dehydrogenation. Fuel 2022, 307, 121790. [Google Scholar] [CrossRef]
  5. Park, S.; Biligetu, T.; Wang, Y.; Nishitoba, T.; Kondo, J.N.; Yokoi, T. Acidic and catalytic properties of ZSM-5 zeolites with different Al distributions. Catal. Today 2018, 303, 64–70. [Google Scholar] [CrossRef]
  6. Vjunov, A.; Fulton, J.L.; Huthwelker, T.; Pin, S.; Mei, D.; Schenter, G.K.; Govind, N.; Camaioni, D.M.; Hu, J.Z.; Lercher, J.A. Quantitatively probing the Al distribution in zeolites. J. Am. Chem. Soc. 2015, 136, 8296. [Google Scholar] [CrossRef] [PubMed]
  7. Alswat, A.A.; Ahmad, M.B.; Hussein, M.Z.; Ibrahim, N.A.; Saleh, T.A. Copper oxide nanoparticles-loaded zeolite and its characteristics and antibacterial activities. J. Mater. Sci. Technol. 2017, 33, 889–896. [Google Scholar] [CrossRef]
  8. Zhang, N.; Liu, C.; Ma, J.; Li, R.; Jiao, H. Determining the structures, acidity and adsorption properties of Al substituted HZSM-5. Phys. Chem. Chem. Phys. 2019, 21, 18758–18768. [Google Scholar] [CrossRef]
  9. Jones, A.J.; Iglesia, E. The strength of Brønsted acid sites in microporous aluminosilicates. ACS Catal. 2015, 5, 5741–5755. [Google Scholar] [CrossRef]
  10. Védrine, J.C.; Auroux, A.; Dejaifve, P.; Ducarme, V.; Hoser, H.; Zhou, S. Catalytic and physical properties of phosphorus-modified ZSM-5 zeolite. J. Catal. 1982, 73, 147–160. [Google Scholar] [CrossRef]
  11. Castella-Ventura, M.; Moissette, A.; Kassab, E. A theoretical study of the confinement effects on the energetics and vibrational properties of 4,4-bipyridine adsorption on H-ZSM-5 zeolite. Phys. Chem. Chem. Phys. 2018, 20, 6354–6364. [Google Scholar] [CrossRef] [PubMed]
  12. Thivasasith, A.; Maihom, T.; Pengpanich, S.; Limtrakul, J.; Wattanakit, C. Insights into the reaction mechanism of n-hexane dehydroaromatization to benzene over gallium embedded HZSM-5: Effect of H2 incorporated on active sites. Phys. Chem. Chem. Phys. 2019, 21, 5359–5367. [Google Scholar] [CrossRef] [PubMed]
  13. Baerlocher, C.; Mccusker, L.B. Database of zeolite structures. Microporous Mesoporous Mater. 2020, 297, 110000. [Google Scholar] [CrossRef]
  14. Wang, S.; Wang, P.; Qin, Z.; Chen, Y.Y.; Fan, W. Relation of catalytic performance to the aluminum siting of acidic zeolites in the conversion of methanol to olefins, viewed via a comparison between ZSM-5 and ZSM-11. ACS Catal. 2018, 8, 5485–5505. [Google Scholar] [CrossRef]
  15. Sastre, G.; Fornes, V.; Corma, A. On the preferential location of Al and proton siting in zeolites: A computational and infrared study. J. Phys. Chem. B 2002, 106, 701–708. [Google Scholar] [CrossRef]
  16. Sklenak, S.; Dedecek, J.; Li, C.; Wichterlová, B.; Sauer, J. Aluminium siting in the ZSM-5 framework by combination of high resolution 27Al NMR and DFT/MM calculations. Phys. Chem. Chem. Phys. 2009, 11, 1237–1247. [Google Scholar] [CrossRef] [PubMed]
  17. Iorio, J.; Gounder, R. Controlling the isolation and pairing of aluminum in chabazite zeolites using mixtures of organic and inorganic structure-directing agents. Chem. Mater. 2016, 28, 2236–2247. [Google Scholar] [CrossRef]
  18. SchrDer, K.P.; Sauer, J.; Leslie, M.; Richard, C.; Catlow, A. Siting of Al and bridging hydroxyl groups in ZSM-5: A computer simulation study. Zeolites 1992, 12, 20–23. [Google Scholar] [CrossRef]
  19. Ricchiardi, G.; Newsam, J.M. Predicted effects of site-specific aluminum substitution on the framework geometry and unit cell dimensions of zeolite ZSM-5 materials. J. Phys. Chem. B 2001, 101, 9943–9950. [Google Scholar] [CrossRef]
  20. Olson, D.H.; Khosrovani, N.; Peters, A.W.; Toby, B.H. Crystal structure of dehydrated CsZSM-5 (5.8Al):  evidence for nonrandom aluminum distribution. J. Phys. Chem. B 2000, 104, 4844–4848. [Google Scholar] [CrossRef]
  21. Ghorbanpour, A.; Rimer, J.D.; Grabow, L.C. Periodic, VDW-corrected density functional theory investigation of the effect of Al siting in H-ZSM-5 on chemisorption properties and site-specific acidity. Catal. Commun. 2014, 52, 98–102. [Google Scholar] [CrossRef]
  22. Xing, B.; Ma, J.; Li, R.; Jiao, H. Location, distribution and acidity of Al substitution in ZSM-5 with different Si/Al ratios—A periodic DFT computation. Catal. Sci. Technol. 2017, 7, 5694–5708. [Google Scholar] [CrossRef]
  23. Dědeček, J.; Kaucký, D.; Wichterlová, B.; Gonsiorová, O. Co2+ ions as probes of Al distribution in the framework of zeolites. ZSM-5 study. Phys. Chem. Chem. Phys. 2002, 4, 5406–5413. [Google Scholar] [CrossRef]
  24. Gábová, V.; Dědeček, J.; Čejka, J. Control of Al distribution in ZSM-5 by conditions of zeolite synthesis. Chem. Commun. 2003, 10, 1196–1197. [Google Scholar] [CrossRef]
  25. Mann, S.; Perry, C.C.; Williams, R.; Fyfe, C.A.; Gobbi, G.C.; Kennedy, G.J. The characterisation of the nature of silica in biological systems. J. Chem. Soc. Chem. Commun. 1983, 4, 168–170. [Google Scholar] [CrossRef]
  26. Gonzales, N.O.; Chakraborty, A.K.; Bell, A.T. A density functional theory study of the effects of metal cations on the Brøsted acidity of H-ZSM-5. Catal. Lett. 1998, 50, 135–139. [Google Scholar] [CrossRef]
  27. Li, C.; Vidal-Moya, A.; Miguel, P.J.; Dedecek, J.; Boronat, M.; Corma, A. Selective introduction of acid sites in different confined positions in ZSM-5 and its catalytic implications. ACS Catal. 2018, 8, 7688–7697. [Google Scholar] [CrossRef]
  28. Rice, M.J.; Chakraborty, A.K.; Bell, A.T. Al Next Nearest Neighbor, Ring occupation, and proximity statistics in ZSM-5. J. Catal. 1999, 186, 222–227. [Google Scholar] [CrossRef] [Green Version]
  29. Yokoi, T.; Mochizuki, H.; Namba, S.; Kondo, J.N.; Tatsumi, T. Control of the Al distribution in the framework of ZSM-5 zeolite and its evaluation by solid-state NMR technique and catalytic properties. J. Phys. Chem. C 2015, 119, 15303–15315. [Google Scholar] [CrossRef]
  30. Román-Leshkov, Y.; Moliner, M.; Davis, M.E. Impact of controlling the site distribution of al atoms on catalytic properties in Ferrierite-type zeolites. J. Phys. Chem. C 2010, 115, 1096–1102. [Google Scholar] [CrossRef]
  31. Ajj, A.; Rtc, A.; Siza, B.; Ei, A. Acid strength and solvation in catalysis by MFI zeolites and effects of the identity, concentration and location of framework heteroatoms. J. Catal. 2014, 312, 58–68. [Google Scholar] [CrossRef]
  32. von Ballmoos, R.; Meier, W.M. Zoned aluminium distribution in synthetic zeolite ZSM-5. Nature 1981, 289, 782–783. [Google Scholar] [CrossRef]
  33. Groen, J.C.; Bach, T.; Ziese, U.; Paulaime-van Donk, A.M.; de Jong, K.P.; Moulijn, J.A.; Pérez-Ramírez, J. Creation of hollow zeolite architectures by controlled desilication of Al-zoned ZSM-5 crystals. J. Am. Chem. Soc. 2005, 127, 10792–10793. [Google Scholar] [CrossRef] [PubMed] [Green Version]
  34. Deguchi, M.; Iyoki, K.; Anand, C.; Yanaba, Y.; Yoshikawa, T.; Okubo, T.; Wakihara, T. Temperature-controlled, two-stage synthesis of ZSM-5 zeolite nanoparticles with Al atoms tetrahedrally coordinated in the framework. Microporous Mesoporous Mater. 2018, 270, 200–203. [Google Scholar] [CrossRef]
  35. Li, J.; Ma, H.; Chen, Y.; Xu, Z.; Li, C.; Ying, W. Conversion of methanol to propylene over hierarchical HZSM-5: The effect of Al spatial distribution. Chem. Commun. 2018, 54, 6032–6035. [Google Scholar] [CrossRef]
  36. Voogd, P.; Bekkum, H.V. Limitation of n-hexane and 3-methylpentane conversion over zeolite ZSM-5 by intracrystalline diffusion. Appl. Catal. 1990, 59, 311–331. [Google Scholar] [CrossRef]
  37. Afroukhteh-Langaroudi, N.; Tarighi, S.; Khonakdara, H.A. Catalytic cracking of n -hexane and n -heptane over ZSM-5 zeolite: Influence of SiO2/Al2O3 ratio. Pet. Chem. 2018, 58, 457–463. [Google Scholar] [CrossRef]
  38. Liu, X.; Zhang, J.; Huang, C.; Sun, X. Density functional theory study of Cu-ZSM-5-catalyzed C–H bond activation: The importance of active centers. J. Phys. Chem. C 2018, 122, 28645–28651. [Google Scholar] [CrossRef]
  39. Jobic, H.; Laloué, N.; Laroche, C.; van Baten, J.M. Influence of isotherm inflection on the loading dependence of the diffusivities of n-hexane and n-heptane in MFI zeolite. J. Phys. Chem. B 2006, 110, 2195–2201. [Google Scholar] [CrossRef]
  40. Ruthven, D.M.; Kaul, B.K. Adsorption of n-hexane and intermediate molecular weight aromatic hydrocarbons on LaY zeolite. Ind. Eng. Chem. Res. 1996, 35, 2060–2064. [Google Scholar] [CrossRef]
  41. Bozbiyik, B.; Duerinck, T.; Lannoeye, J.; De Vos, D.E.; Baron, G.V.; Denayer, J.F.M. Adsorption and separation of n-hexane and cyclohexane on the UiO-66 metal-organic framework. Microporous Mesoporous Mater. 2014, 183, 143–149. [Google Scholar] [CrossRef]
  42. Vlugt, T.; Krishna, R.; Smit, B. Molecular simulations of adsorption isotherms of linear and branched alkanes and their mixtures in silicalite. J. Phys. Chem. B 1999, 103, 1102–1118. [Google Scholar] [CrossRef] [Green Version]
  43. Ju, S.G.; Zeng, Y.P.; Xing, W.H.; Chen, C.L. Computer simulation of the adsorption of thiophene in all-silica Y and Na-Y. ACS J. Surf. Colloids 2006, 22, 8353. [Google Scholar] [CrossRef] [PubMed]
  44. Pfriem, N.; Hintermeier, P.H.; Eckstein, S.; Kim, S.; Liu, Q.; Shi, H.; Milakovic, L.; Liu, Y.; Haller, G.L.; Baráth, E. Role of the ionic environment in enhancing the activity of reacting molecules in zeolite pores. Science 2021, 372, 952–957. [Google Scholar] [CrossRef]
  45. Loewenstein, W. The distribution of aluminum in the tetrahedra of silicates and aluminates. Am. Miner. 1954, 39, 92–97. [Google Scholar]
  46. Zheng, H.; Liang, Z.; Yang, Q.; Gao, J.; Xu, C. Influence of framework protons on the adsorption sites of the benzene/HY system. Ind. Eng. Chem. Res. 2014, 53, 13610–13617. [Google Scholar] [CrossRef]
  47. Liu, Y.B.; Li, Y.Z.; Ding, X. Adsorption simulation of basic nitrogen compounds in ZSM-5 and USY zeolites by grand canonical monte carlo method. In Advanced Materials Research; Trans Tech Publications Ltd.: Baech, Switzerland, 2015; Volume 1096, Available online: https://doi.org/10.4028/www.scientific.net/AMR.1096.189 (accessed on 17 December 2021).
  48. Dang, S.; Zhao, L.; Gao, J.; Xu, C. Loading dependence of the adsorption mechanism of thiophene in FAU zeolite. Ind. Eng. Chem. Res. 2016, 55, 11801–11808. [Google Scholar] [CrossRef]
  49. Bai, P.; Siepmann, J.I.; Deem, M.W. Adsorption of glucose into zeolite beta from aqueous solution. AIChE J. 2013, 59, 3523–3529. [Google Scholar] [CrossRef]
  50. Brémard, C.; Ginestet, G.; Le Maire, M. Sorption sites, energetics, and reactions of molybdenum hexacarbonyl and benzene cosorbed in faujasitic zeolites. J. Am. Chem. Soc. 1996, 118, 12724–12734. [Google Scholar] [CrossRef]
  51. Yang, J.Z.; Liu, Q.L.; Wang, H.T. Analyzing adsorption and diffusion behaviors of ethanol/water through silicalite membranes by molecular simulation. J. Membr. Sci. 2007, 291, 1–9. [Google Scholar] [CrossRef]
Figure 1. Adsorption isotherms of n-hexane on silicate-1 and HZSM-5 with different SAR (300, 100, 50, 30, 12.47, 5.86 and 2.43) at 298 K (a) and 423 K (b).
Catalysts 12 00144 g001
Figure 2. Density distribution of n-hexane on silicate-1 (a) and HZSM-5 with different SAR of 300 (b), 100 (c), 50 (d), 30 (e), 12.47 (f), 5.86 (g) and 2.43 (h) at 298 K. The X-axis direction (vertical direction in picture) represents the sinusoidal channels; the Y-axis direction (horizontal direction in picture) represents the straight channels (blue shadow area). green region represents the lowest energy, preferred adsorption positions for n-hexane molecules.
Catalysts 12 00144 g002
Figure 3. MSD of isotropic diffusion coefficient of n-hexane molecules on silicate-1 and HZSM-5 with the SAR (300, 100, 50, 30, 12.47, 5.86 and 2.43) at 298 K (a) and 423 K (b).
Catalysts 12 00144 g003
Figure 4. Adsorption isotherm of n-hexane molecules on silicate-1, NaMFI (a,b) and KMFI (c,d) with different SAR (300, 100, 50, 30, 12.47, 5.86 and 2.43) at 298 K (a,c) and 423 K (b,d).
Catalysts 12 00144 g004
Figure 5. Density distribution of n-hexane on silicate-1 (a) and NaZSM-5 with different SAR of 300 (b), 100 (c), 50 (d), 30 (e), 12.47 (f), 5.86 (g) and 2.43 (h) at 298 K. The X-axis direction (vertical direction in picture) represents the sinusoidal channels; the Y-axis direction (horizontal direction in picture) represents the straight channels (blue shadow area). The green region represents the lowest energy, preferred adsorption positions for n-hexane molecules.
Catalysts 12 00144 g005
Figure 6. Density distribution of n-hexane on silicate-1 (a) and KZSM-5 with different SAR of 300 (b), 100 (c), 50 (d), 30 (e), 12.47 (f), 5.86 (g) and 2.43 (h) at 298 K. The X-axis direction (vertical direction in picture) represents the sinusoidal channels; the Y-axis direction (horizontal direction in picture) represents the straight channels (blue shadow area). The green region represents the lowest energy, preferred adsorption positions for n-hexane molecules.
Catalysts 12 00144 g006
Figure 7. MSD of isotropic diffusion coefficient of n-hexane molecules on silicate-1, NaZSM-5 (a,b) and KZSM-5 (c,d) with different SAR (300, 100, 50 and 30) at 298 K (a,c) and 423 K (b,d).
Catalysts 12 00144 g007
Figure 8. Isosteric heat of n-hexane molecules on HZSM-5 (a,b), NaZSM-5 (c,d) and KZSM-5 (e,f) zeolites with typical SAR of 300, 100, 50 and 30 at 298 K (a,c,e) and 423 K (b,d,f).
Catalysts 12 00144 g008
Figure 9. Interaction energy distribution curves of n-hexane molecules on HZSM-5 zeolite with typical SAR of 300 (a,e), 100 (b,f), 50 (c,g) and 30 (d,h) at 298 K (ad) and 423 K (eh).
Catalysts 12 00144 g009
Figure 10. Interaction energy distribution curves of n-hexane molecules on NaZSM-5 zeolite with typical SAR of 300 (a,e), 100 (b,f), 50 (c,g) and 30 (d,h) at 298 K (ad) and 423 K (eh).
Catalysts 12 00144 g010
Figure 11. Interaction energy distribution curves of n-hexane molecules on KZSM-5 zeolite with typical SAR of 300 (a,e), 100 (b,f), 50 (c,g) and 30 (d,h) at 298 K (ad) and 423 K (eh).
Catalysts 12 00144 g011
Figure 12. RDFs of COM-H on the HZSM-5 zeolite with a SAR of 2.43. COM refers to the mass of the center of the n-hexane molecules; H refers to the protons connecting the Al-O bonds with different T sites. The function g(r) represents the possibility of emergence, and the value of r is the distance between two particles.
Catalysts 12 00144 g012
Publisher’s Note: MDPI stays neutral with regard to jurisdictional claims in published maps and institutional affiliations.

