Article

Modeling and Investigation of an Industrial Dehydration and Hydrocarbon-Removal Process by Temperature Swing Adsorption

by
Hossein Ghasemzadeh
1,
Mehdi Mehrpooya
1,*,
Fathollah Pourfayaz
1,
Azad Jarrahian
2 and
Mohammad Reza Ganjali
3,4
1
Department of Renewable Energies and Environment, Faculty of New Science and Technologies, University of Tehran, Tehran 79416-55665, Iran
2
Department of Petroleum Engineering, Kish International Campus, University of Tehran, Kish 79416-39982, Iran
3
Center of Excellence in Electrochemistry, School of Chemistry, College of Science, University of Tehran, Tehran 79416-55665, Iran
4
Institute of Industrial and Environmental Biotechnology, National Institute of Genetic Engineering and Biotechnology (NIGEB), Tehran 79416-55665, Iran
*
Author to whom correspondence should be addressed.
Catalysts 2022, 12(12), 1509; https://doi.org/10.3390/catal12121509
Submission received: 5 September 2022 / Revised: 19 November 2022 / Accepted: 22 November 2022 / Published: 24 November 2022

Abstract

:
In this study, a water- and heavy hydrocarbon-removal process of a natural gas refinery currently in operation using the temperature swing adsorption method is modeled and investigated. The aim of this process is to decrease the hydrocarbon dew point to −10 °C and diminish the water content of the gas to about 0.1 ppm. This unit consists of four beds with two layers in which two beds are in the adsorption state, while the others are kept in the regeneration state. The gas composition and the bed specification are obtained from the available data from the refinery. The Ergun equation is considered for the pressure drop calculation. The results show that the developed model can predict the outputs with good accuracy. Sensitivity analysis of operating condition parameters such as temperature, pressure, and regeneration gas flowrate are carried out. Analysis of the regeneration temperature proved that temperature reduction from 268 °C to 210 °C can improve recovery of the heavy components. In addition, the regeneration gas flow rate can be reduced to about 0.4 kmole·s−1 as an optimum value. Moreover, 303 to 310 °C is the optimum range for the feed temperature. Due to the presence of the air cooler in the upstream process, and according to the ambient air temperature, feed temperature can be decreased to obtain better results.

1. Introduction

Raw natural gas contains some quantities of impurities. This issue causes problems in operations containing natural gas transfer or in other processes using it as a feed [1]. Therefore, some purification processes such as dehydration, sweetening, and other operations are used after extraction of natural gas [2]. Processes such as dehydration are used for minimizing the amount of water in the gas to about 0.1 ppm. Hydrocarbon dew point-tuning operations act with heavy hydrocarbon removal [3]. These operations adjust the hydrocarbon dew point in a specified point based on the gas usage in downstream processes. In this work, an adsorption method for water and heavy hydrocarbons removal from natural gas is investigated. In this regard, an industrial unit with industrial data is modeled and analyzed. The simulation results are verified and compared with process data of a refinery currently in operation. Specifically, dehydration of natural gas decreases the possibility of corrosion and hydration and freezing of the water in the pipeline. This operation eliminates the slowing down of flow arising from vapor condensation. The presence of water in the gas stream causes the following fundamental problems: 1—corrosion; 2—liquid water formation; 3—ice formation; and 4—hydration [4]. By decreasing the temperature and pressure, the heavy hydrocarbons content of natural gas causes liquid phase formation inside the gas pipeline and consequently pressure drop occurrence. Other problems originating from these liquid gases include undesirable combustion in furnaces, turbines, and heating equipment. In addition, using such a gas as petrochemical feed causes undesirable chemical compounds. Dehydration is suggested to avoid these problems. Different methods could be used such as water condensation with cooling, dehydration with liquid absorbents, and dehydration with solid adsorbents. The last one is used significantly because of its advantages.
Mehrpoya et al. simulated mercaptan removal from natural gas by the adsorption method using five beds. Operating conditions and the amount of mercaptans in the output product were examined, and optimum conditions were found [5]. In another study, the effect of carbon dioxide in natural gas was investigated. In that work, a 4A molecular sieve adsorbent was used, and simulation of the process was carried out by Aspen Adsim software. It was observed that increasing the concentration of carbon dioxide increases the amount of water saturation in the natural gas and also increases the amount of absorbent and raises the operating pressure up to 35 bar [6]. Gholami and et al. [7] studied mathematical modeling of water removal from natural gas and compared it with experimental results. In this study, the Ergun equation and the Langmuir isotherm were implemented for the pressure drop and for the adsorber equilibrium curve, respectively. It was shown that the breakthrough time curve linearly decreased with the square of the particle diameter, and also the pressure drop increased with the inverse of the particle diameter [7]. In another study, water and heavy hydrocarbon removal was investigated by two beds including three layers filled with adsorbents. The first two layers of these three layers were filled with silica gel and 13x adsorbents, which were used to remove water. Another layer was filled with activated carbon adsorbent to remove organic compounds. By comparing the modeling of this process with the experimental results, good validation was achieved [8]. Michal Netusil et al. [9] compared natural gas water removal in three different ways, namely, water removal by absorption, adsorption, and condensation. The allowable amount of water in the natural gas was equivalent to a dew point of −10 degrees Celsius at 4 MPa. As a result of this comparison, the amount of energy consumption was presented in terms of vapor pressure of water in natural gas. The dehydration process with 3A adsorbent was used to adjust the dew point. In addition, the impact of operating conditions in that study was investigated. Dehydration process efficiency decreased by increasing the amount of water in the natural gas and increased by inlet pressure [10]. In a study [11], the value of adsorption and regeneration of water on 13x adsorbent was investigated. In that work, in the regeneration temperature of 90 °C, the adsorption capacity decreased from 23% (w/w) to 19% (w/w) by increasing the adsorption temperature from 35 to 60 °C. The adsorption capacity increased by the temperature of regeneration. Shirani et al. [12] studied the adsorption of water and mercaptans by a 13x adsorbent. In that process, three beds were considered, and two of them were used in the adsorption mode. The effect of the pressure and the bed length on the breakthrough curve was investigated. In [13], CO2 adsorption with a polyaniline adsorber by the TSA process was investigated. In that study, a Langmuir–Freundlich isotherm for the adsorption equilibrium curve was used. The amount of carbon dioxide, according to operating conditions such as adsorption temperature, feed pressure, and desorption temperature was investigated to obtain the optimal conditions. Gandhidasan et al. [14] studied the process of dehydration by silica gel adsorbent in two beds. The effect of different operating conditions on the process performance and energy consumption of the regeneration were considered in their work. The process of mercaptan removal from natural gas by the PVSA method and achieving an allowable amount of 10 ppm was investigated. As a result of that study, the PVSA process had better performance than PTSA. Comparing these two methods with the same operating conditions and feed, the PVSA method had a shorter cycle time and better purity in the feed [15]. The process of mercaptan and water removal from natural gas by the PTSA method was simulated with two beds filled with 13x adsorbents and active alumina. As a result of that simulation, good validation was obtained with industrial data. By reviewing the operating conditions, the value of adsorption pressure was reduced from 6.8 bar to 6.1 bar [16]. In [17], a comparison of PSA and TPSA methods for carbon dioxide recovery with 13x adsorbent was carried out. In another study [18], a comparison of the amount of carbon dioxide adsorption by molecular adsorbents and 13x at different operating pressures was investigated.
In this work, an industrial natural gas purification process, which is currently in operation, was considered and modeled. Simulation and determination of the optimal design of water and heavy hydrocarbons removal from natural gas by TSA method were conducted. A model was trained exactly based on the industrial data, including the inlet feed composition, the operating conditions, the adsorption kinetics of the adsorbers used, and the process configuration and equipment. The model outputs were compared with industrial data. The process performance through varying operating parameters was analyzed. Operating conditions such as temperature and pressure were investigated in different situations. Sensitivity analysis was conducted, and optimum conditions were investigated based on the developed model. In addition, this model can be used for optimization and retrofit design projects.
2. Process Description

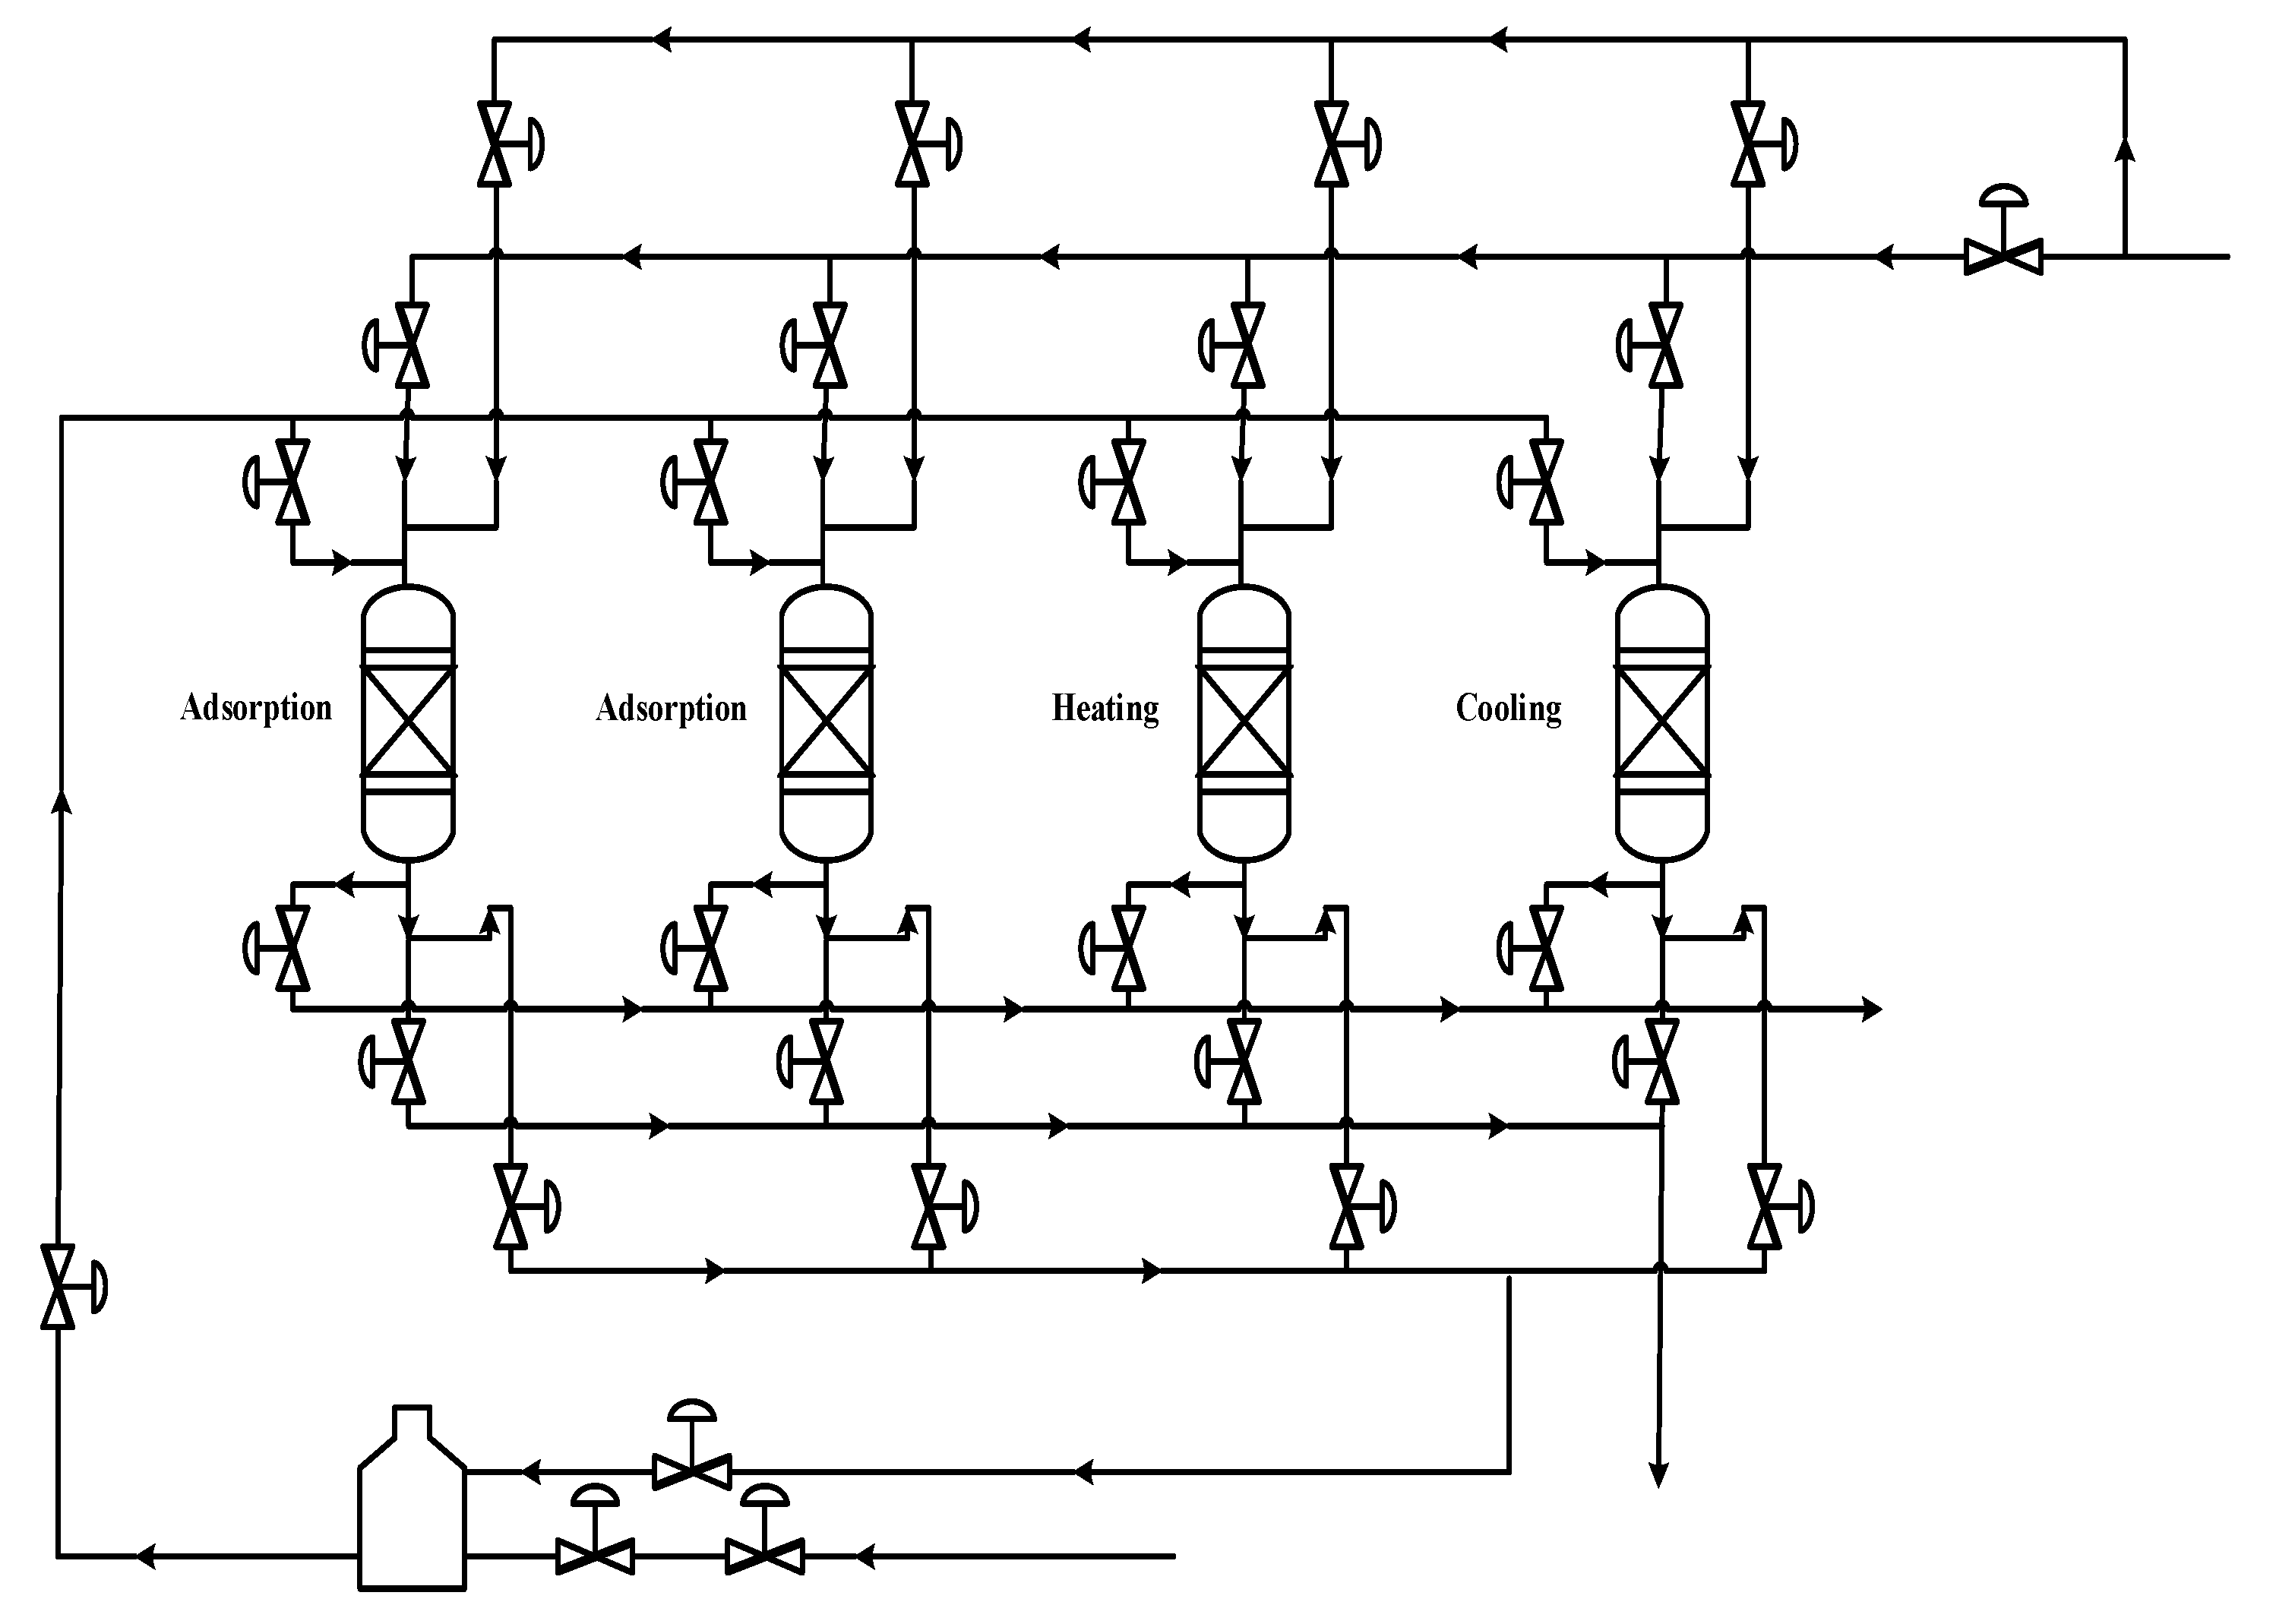
This process consists of four double layer beds (Figure 1). The first layer is used at the beginning of the tower for removing the water. The second layer in the tower is designed for removing the heavy hydrocarbons. The length of the bed is 5.92 m. The initial part of the bed, with a length of 0.305, is filled with silica gel type WS used to adsorb water from the natural gas. The rest of the bed, which includes the largest part of it, is filled with silica gel type H, which is used for removing the heavy hydrocarbons and dew point adjustment. The characteristics of the adsorbents are shown in Table 1. The characteristics of the adsorbent bed are as follows: bed length (m) = 5.92, bed diameter (m) = 2.286, bed void fraction = 0.4, bulk density (g·cm−3) = 700. Silica gel adsorbents were used in this process. The feed gas contains methane, ethane, propane, butane, pentane, hexane, carbon dioxide, water, and nitrogen. This stream enters the process at 73 bar and 38 °C. Table 2 illustrates the composition and specifications of the feed.
All of the four beds in this process are filled with silica gel adsorbents. In a cycle, two beds are in the adsorption mode, one bed is in the heating mode, and one bed is in the cooling mode. Each cycle of the bed takes about 2 h. One hour of each cycle is in the adsorption mode, 30 min in heating, and 30 min in cooling. Adsorption beds have a time difference of 30 min. After completion of 60 min of adsorption, the bed will go to the heating mode, and after heating, it will pass to the cooling mode. The feed gas of the process is divided into two streams; approximately 1/3 of the feed gas is used for cooling and enters the bed, which is in the cooling mode. This stream enters the heater after the exit of the cooling bed and is heated up to 268 °C. The heated gas enters the bed that just finished its adsorption mode and now is in the heating mode. The outlet gas from the bed that is in the heating mode enters the cooler, and its temperature decreases to about 38 °C and then returns to the main stream of the inlet gas process.
Figure 2 and Figure 3 illustrate the beds’ interconnection sequence.

3. Process Modeling

For modeling and simulation of the process, the considered assumptions are as follows:
  • The bed is vertical and one-dimensional. Variations of concentration are considered along the length.
  • The QDS numerical method, with the highest accuracy, is used in modeling.
  • The mass balance is considered as a plug flow with the estimated dispersion.
  • Linear driving force (LDF) is assumed for mass transfer.
  • The Ergun equation is used for pressure drop calculation.
  • The Langmuir isotherm model is used.
  • Axial thermal conductivity is not considered for solid and gas phases.
  • There is no heat transfer between the wall and the bed (adiabatic).

3.1. Adsorption Equilibrium

The tendency of molecules to move from the fluid phase to the surface of the adsorbent is called adsorption. Adsorption isotherms indicate the tendency of these components to move to the solid surface. After balancing between adsorbent and fluid, the following equation is established.
q = f (T,P)
P is the gas partial pressure, T is the gas temperature, and q is the amount of the material adsorbed.
q q m = θ = KP 1 + KP
K i = β i , 0 e Δ H RT
where βi,0 is the adsorption constant at infinite temperature, and ΔH is the heat of adsorption [19]. In this simulation, the adsorption of water, pentane, and hexane were considered [20,21]. Equilibrium data of the pentane were obtained from [22]. Equilibrium data of the hexane were derived from [23]. ΔH values for the components were from [24,25,26] (see Table 3):

3.2. Energy Balance

The energy balance equation in the gas phase is as follows [5]:
ε K ax 2 T z 2 ρ C pg ( uT ) z ε ρ   C pg T t a p ( 1 ε ) h ( T   T s ) = 0
The energy balance equation in the solid phase is as follows:
K s 2 T s x 2 + ρ s C ps T s t + ρ s i = 1 n c ( Δ H i ) q i t a p HTC ( T T s ) = 0
In the simulation, by neglecting the axial thermal conductivity, the equation is summarized as follows:
ρ s C ps T s t + ρ s i = 1 n c ( Δ H i ) q i t a p HTC ( T T s ) = 0

3.3. Heat Transfer Equation

Due to the high heat transfer coefficient of adsorbents, they can be considered in the same uniform temperature. The following equation is used for heat transfer. The Nusselt number around a sphere should be 2 [16,27].
Nu = h i d p K g = 2 + 1.1 ( c pg μ K ) 1 3 ( d p G μ ) 0.6

3.4. Momentum Balance

For momentum balance, the Ergun equation is considered as follows [28]:
P z = ( 37.5   ( 1 ε ) 2 μ u ( r p φ ) 2 ε 3 + 0.875 ρ   ( 1 ε ) u 2 r p φ ε 3 )
In this equation, φ is the adsorption shape factor, μ is the viscosity of the gas,   r p is the particle radius, u is the gas velocity, and ε is the porosity of the bed.

3.5. Mass Balance

The mass balance for the gas components is as follows [5,16]:
ε b C i t + ( 1 ε b ) ρ s q i t = ( uC i ) z + ε b D ax , i 2 C i z 2
where c i is the concentration of component i in the gas phase ( mol m 3 ) , q i is the concentration of component i in the solid phase ( mol m 3 ) , t is time (s), ε b is bed porosity, ρ s is adsorbent density ( kg m 3 ) , and D ax , i is axial the dispersion coefficient of component i ( m 2 s ) .
Th axial dispersion coefficient is obtained as follows [5]:
D ax , i = 0.73 + ur p ε ( 1 + 9.49 ε D m , i 2 v g d p )
According to the assumptions, the mass balance for the solid components is as follows [5,15]:
q i t = k i ( q i * q i )

3.5.1. Mass Transfer Mechanism

Overall mass transfer is derived from the following equation, which consists of three sections, namely, film mass transfer, mass transfer due to molecular diffusion and Knudsen diffusion, and mass transfer due to diffusion in micro pores (crystal) [29].
1 K i = r p 3 K f , i + r p 2 15 ε p K p , i + r c 2 15 K c D ci

3.5.2. Film Mass Transfer

There are several experimental works about the mass transfer surrounding a sphere. Approximately all of the reported relations can be classified in three categories. The first category is for mass transfers in which the Reynolds number is low, namely, laminar. Mass transfer consists of diffusion and bulk transfer. The equation is as follows:
Sh = 2 + cRe m Sc 1 / 3
The second category is related to mass transfers in which the Reynolds number is high. The diffusion mass transfer in comparison with the bulk mass transfer is negligible.
Sh = c Re m Sc 1 / 3
The third category is about mass transfers involving natural bulk mass transfer in addition to the diffusion and forced bulk mass transfer.
Sh = Sh 0 + c Re m Sc 1 / 3 ( Sh 0 = 2 + . )
The film mass transfer coefficient is obtained by the following equation:
K fi = ShD d p
In this work, the following equation is used to obtain the Sherwood number [30]:
Sh = 2 + 1.1 Re 0.6 Sc 1 / 3

3.5.3. Molecular Diffusion

Fick’s law is used to express the flux in the molecular diffusion mechanism:
J A = D AB dC A dZ
D AB is the molecular diffusion of component A into component B. The Wilke–Lee equation for obtaining the diffusion coefficient is shown as follows. This equation is used to mixture of non-polar gases or a non-polar gas with a polar gas [31].
D AB = ( 0.00217 0.0005 M AB 1 2 ) T 3 2 M AB 1 2 P σ AB 1 2 Ω D
The value of separation after the collision is defined as follows, and its unit is Angstroms.
σ AB = ( σ A + σ B ) / 2
For Ω D , the experimental equation is presented as follows. The collision function is dimensionless.
Ω D = A T 0 B + C exp ( DT 0 ) + E exp ( FT 0 ) + G exp ( HT 0 )
A = 1.06036, B = 0.15610, C = 0.1930, D = 0.047635, E = 1.03587, F = 1.52996, G = 1.76474, H = 3.89411
T 0 = KT ε AB 2
ε AB is the maximum absorption energy. The Table 4 is used to obtain the values of σ AB and ε AB .
The following equation is used to calculate the amount of diffusion of each component in the gas mixture [32]:
D m , i = 1 y i j y j D i , j
The diffusion coefficient of some components in the mixture of natural gas is shown in Table 5. Also, considered intervals for simulation is presented in Table 6.

3.5.4. Knudsen Diffusion

If the diameters of the cavities are small, collisions between the molecules and the cavity are important. In a very small cavity, collisions with the wall dominate, and the process is assumed to be based on a different mechanism such as Knudsen diffusion. The relative importance of the two diffusion mechanisms is determined by the particle diameter ratio and the mean free path of the gas molecules. The mean free path is defined by the ratio between the average molecular velocity and the collision frequency:
Mean   free   path = 1 n n π σ 2
where n is the number of gas molecules per unit volume, and σ is the diameter of the collision.
In Knudsen diffusion, the transfer of the momentum from gas molecules to the wall of the cavity is very important.
The transferred momentum as a result of the molecules’ collisions with the walls is in dynamic equilibrium with the force applied from two ends of the pore, which is determined by the pressure gradient along the pore. The Knudsen diffusion coefficient is obtained from the following equation:
D ki = 2 R p 3 ( 8 RT π M i ) 0.5 = 97 R p ( T M i ) 0.5
In this equation, R p is the radius of the grain in cm, T is the temperature in Kelvin, M is the molecular weight, and D ki is the Knudsen diffusion coefficient in cm·s−1.
The following equations are used to obtain the mass transfer coefficients derived from diffusion [16,33]:
τ p = ε p + 1.5 ( 1 ε p )
1 k pi = τ ( 1 D ki + 1 D mi )

3.6. Boundary Conditions

The first step is adsorption:
In this stage, adsorption takes about 1 h. Natural gas enters the top of the bed. The concentration of gas in this stage is equal to the concentration of the incoming gas. The following boundary conditions are presented for this stage.
t = 0 ,   C i = C iproduct   ,   q i = q is   ,   P = 73   bar ,   T = 313.15   K
Z = Z 0 , ( C i ) z = u D ax , i ( C 0 , i C i ) , T Z = uc pg P K ax RT ( T T 0 ) ,   P = 72.6   bar
Z = Z 0 MTZ , C i Z = 0 , T Z = 0
The second stage is cooling:
The feed is used for cooling. Its boundary conditions are as follows:
t = 0 ,   C i = C iproduct   ,   q i = q is   ,   T = 541.15   K
Z = Z 0 , ( C i ) z = u D ax , i ( C 0 , i C i ) , T Z = uc pg P K ax RT ( T T 0 ) ,   P = 72.6   bar
Z = 0 , C i Z = 0 , T Z = 0
The third stage is heating:
t = 0 ,   C i = C iproduct   ,   q i = q is   ,   T = 313.15   K
Z = Z 0 , ( C i ) z = u D ax , i ( C 0 , i C i ) , T Z = uc pg P K ax RT ( T T 0 ) ,   P = 72.6   bar
Z = 0 , C i Z = 0 , T Z = 0

4. Results

In this part, validation of the developed model and the results are discussed.

4.1. Validation

The stable state of the process in simulation was obtained after a 100-cycle iteration. The outcomes of this model were compared to the industrial data of the refinery located in the south of Iran for validation. The results were acceptable. A comparison of the two mole fraction components (pentane, hexane) in the output stream was carried out. The results are presented in Figure 4 and Figure 5.
Heavy hydrocarbons, especially hexane, play a major role in the hydrocarbon dew point specification. For tuning the natural gas dew point, silica gels were used for water removal in the upper part of the bed and for heavy hydrocarbon elimination in the remaining part of the bed. The allowable hydrocarbon dew point was about 263 K. The water content should be based on the allowable quantity certified by the refinery. As mentioned before, the top section of the bed was filled by silica gel for adsorbing the water. This step was conducted for preventing hydration in the transfer line. The natural gas water content decreased through passing the bed. The output water content was supposed to be about 0.1 ppm. Given the simulation data, this optimal amount was obtained. Figure 6 shows the water mole fraction versus time.

4.2. Water Concentration Variation against Time in Different Sections of the Bed

Figure 7 shows the water concentration in different zones of the bed. The feed entered the bed from the upper side and crossed the water adsorbent layer. The time-dependent water content was measured in three different zones. It is clear that after some time, the layers became water saturated.

4.3. Hydrocarbon Dew Point

According to the breakthrough curves (Figure 4 and Figure 5), there was good proximity between the simulation and the industrial data at the dew point. The reported dew point in the refinery, measured in the site, was 263 K to 268 K, and simulation result was 262 K.
Figure 8 illustrates the hydrocarbon dew points before and after adsorption. At 700 kPa, the gas dew points before and after adsorption were 288 K and 262 K, respectively. This change in dew point arose from heavy hydrocarbon removal with adsorption. C6+ concentration variation had the most effect on the gas hydrocarbon dew point.

4.4. Hexane Concentration Effect on Hydrocarbon Dew Point

Hexane content had a great effect on the dew point, as seen in Figure 9. More hexane adsorption could reduce the dew point, which could be achieved by some alterations in the unit.

4.5. Bed Temperature Variation

Figure 10 and Figure 11 show the time-dependent temperature variation. Figure 10 is related to the first layer of the bed, which was considered for water adsorption. The differences in various points of this layer was little because of its low height. Figure 11 is related to the second layer in five points. The first part, the central part, and the last part of each curve are related to the cooling down, adsorption, and warming up operations, respectively.

4.6. Gas Concentration Variation versus Time in the Regeneration Step

This step was done within 30 min. Various components were adsorbed in the bed through this step of adsorption. Desorption was conducted by increasing the bed temperature by means of the hot gases warmed up to 541 K in the furnace. Figure 12 shows the water regeneration, which was removed from the bed in the first layer.
Figure 13 shows the pentane regeneration curve. The bed was regenerated up to about 1000 s and was prepared for adsorption.
Figure 14 shows the C6+ regeneration results. Hexane and heavier hydrocarbons were regenerated later than pentane because of their molecular weight. C6+ regeneration needed more energy, and it was also an effective parameter in the gas dew point.

4.7. Concentration of Various Components in Gas versus Time

Figure 15 shows the pentane mole fraction in four different zones in the bed. The bed became saturated after about 800 s. After saturation, the gas output concentration remained constant, and no pentane was adsorbed.
Figure 16 illustrates the hexane concentration variation versus time in four different heights (Z = 1.4, Z = 2.8, Z = 4.2, Z = 5.6) of the bed. Hexane adsorption was higher than the pentane and occurred up to the last moment in function.
Figure 17 shows the water content variation in three points of the first layer. It was demonstrated that its adsorption would continue to the last moment of operation.

5. Sensitivity Analysis and Optimization

5.1. Cycle Time Variation

It is understood that by increasing the process duration, the output concentration deviates from the desired value. The results showed that 5600 s (2800 s for adsorption) was the best cycle time. Hexane, as the heaviest component, was regenerated properly in this time duration. With lower duration time, the bed was filled with hexane after some cycles due to improper hexane regeneration. Figure 18 shows the time duration of hexane regeneration.

5.2. Pressure Effect

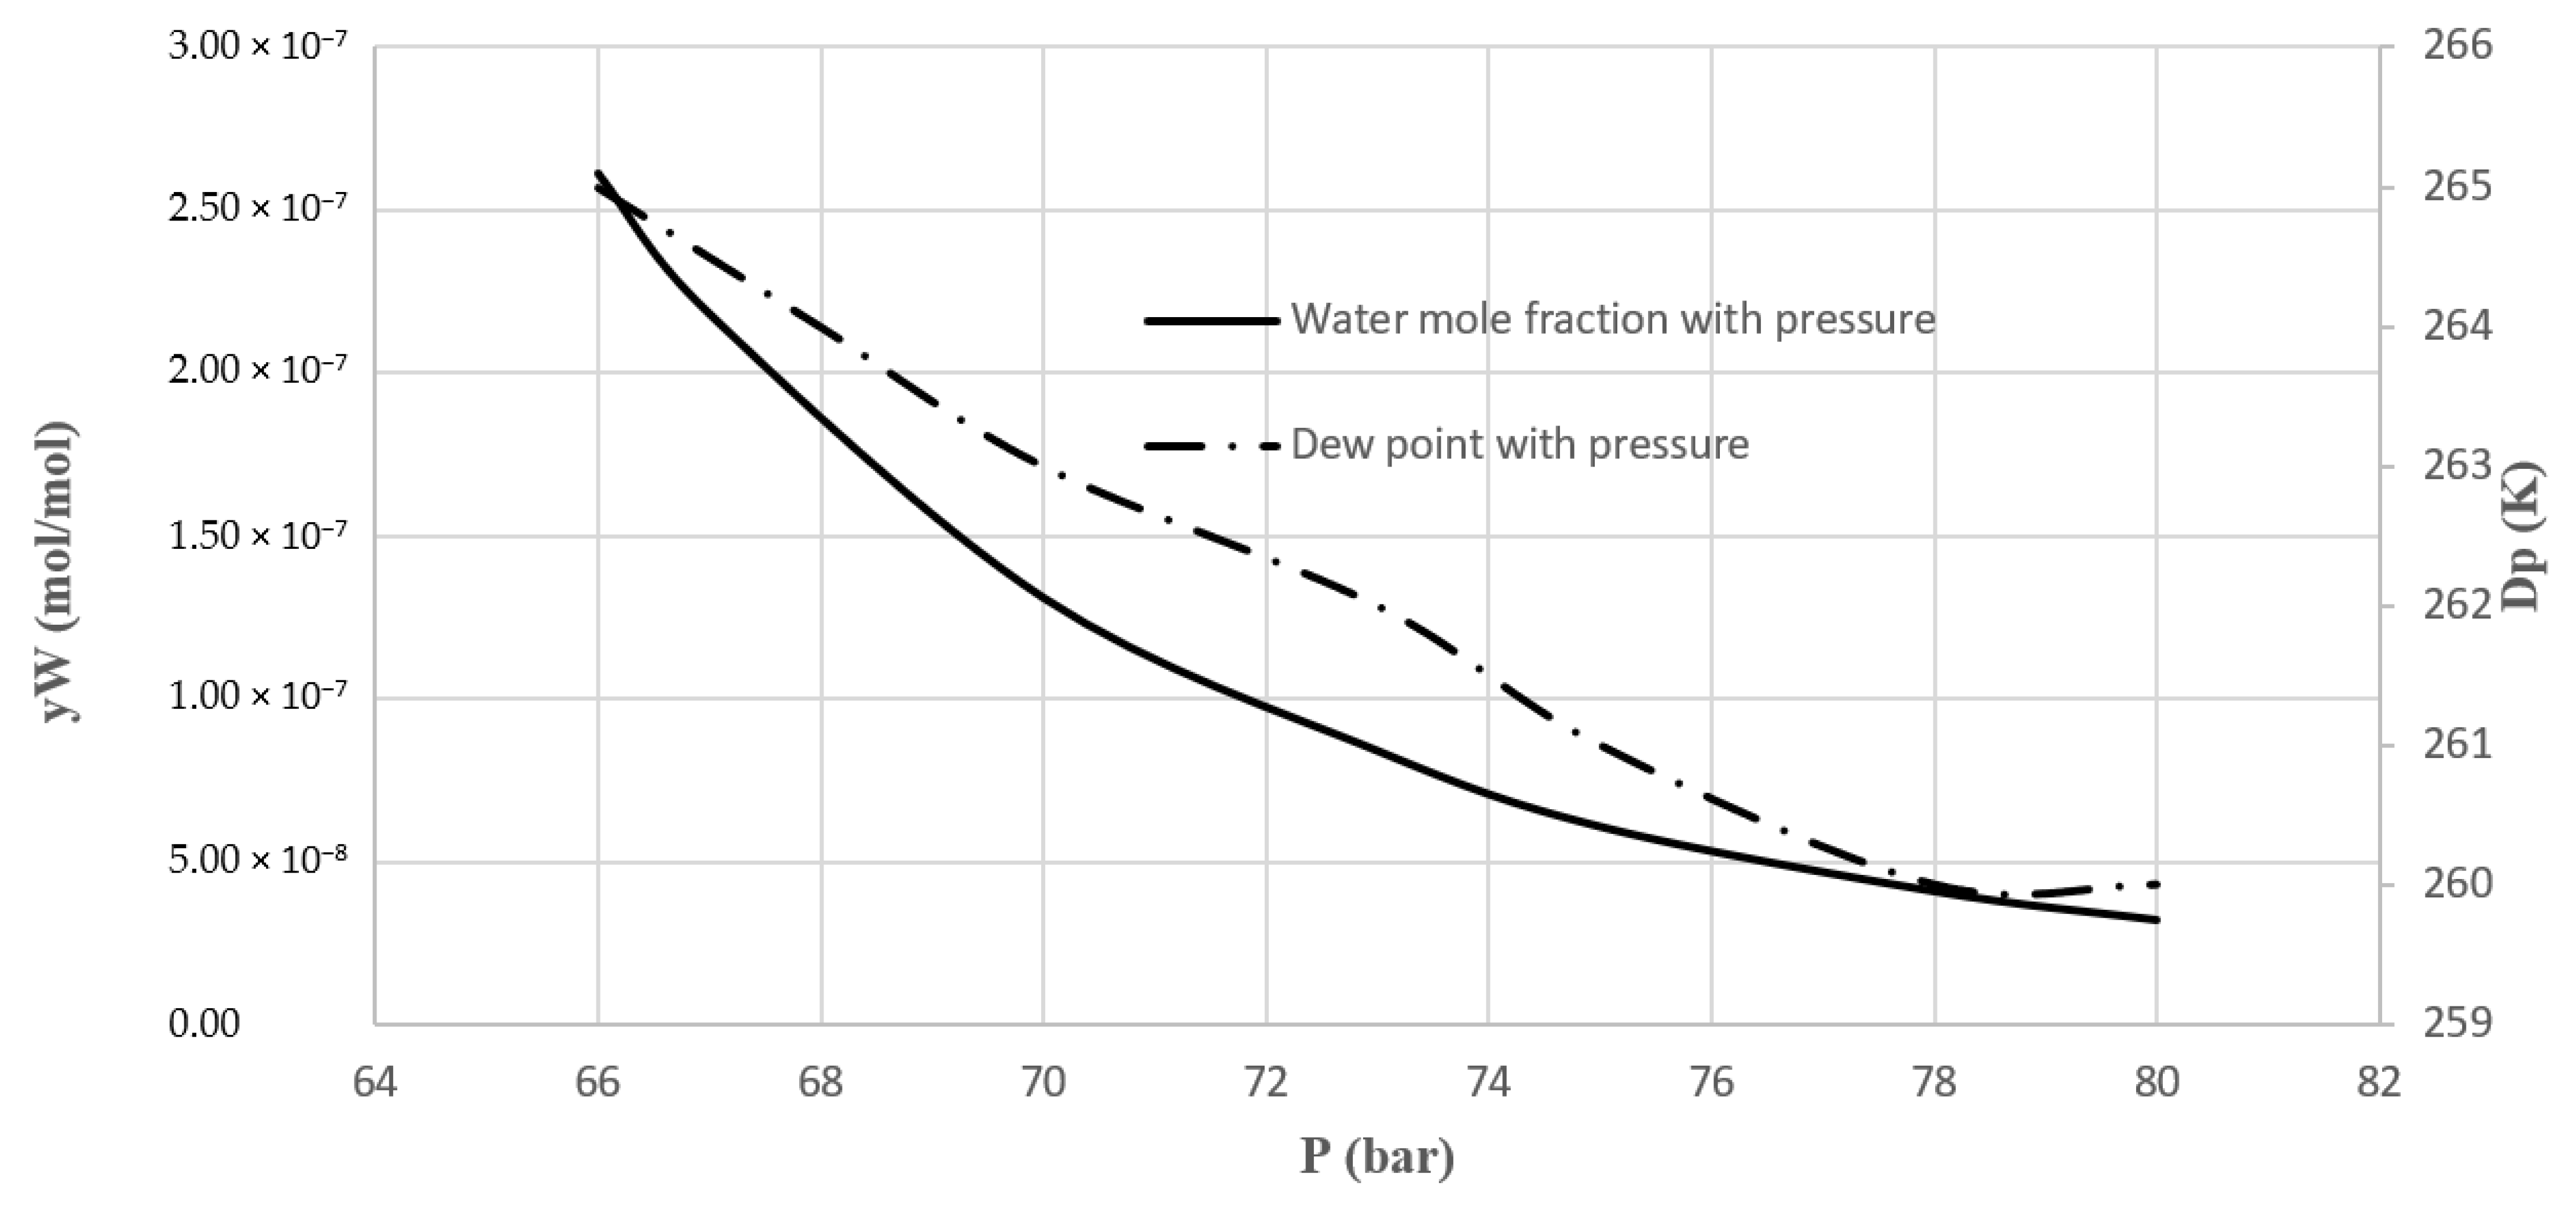
According to Figure 19, increasing the pressure gave favorable results. The operating pressure of the process was 73 bar. By decreasing the pressure to 70 bar, the results were getting better. By decreasing the pressure more than 70 bar, the water content of the gas and gas hydrocarbon dew point moved away from the desired values.

5.3. Feed Temperature Effect

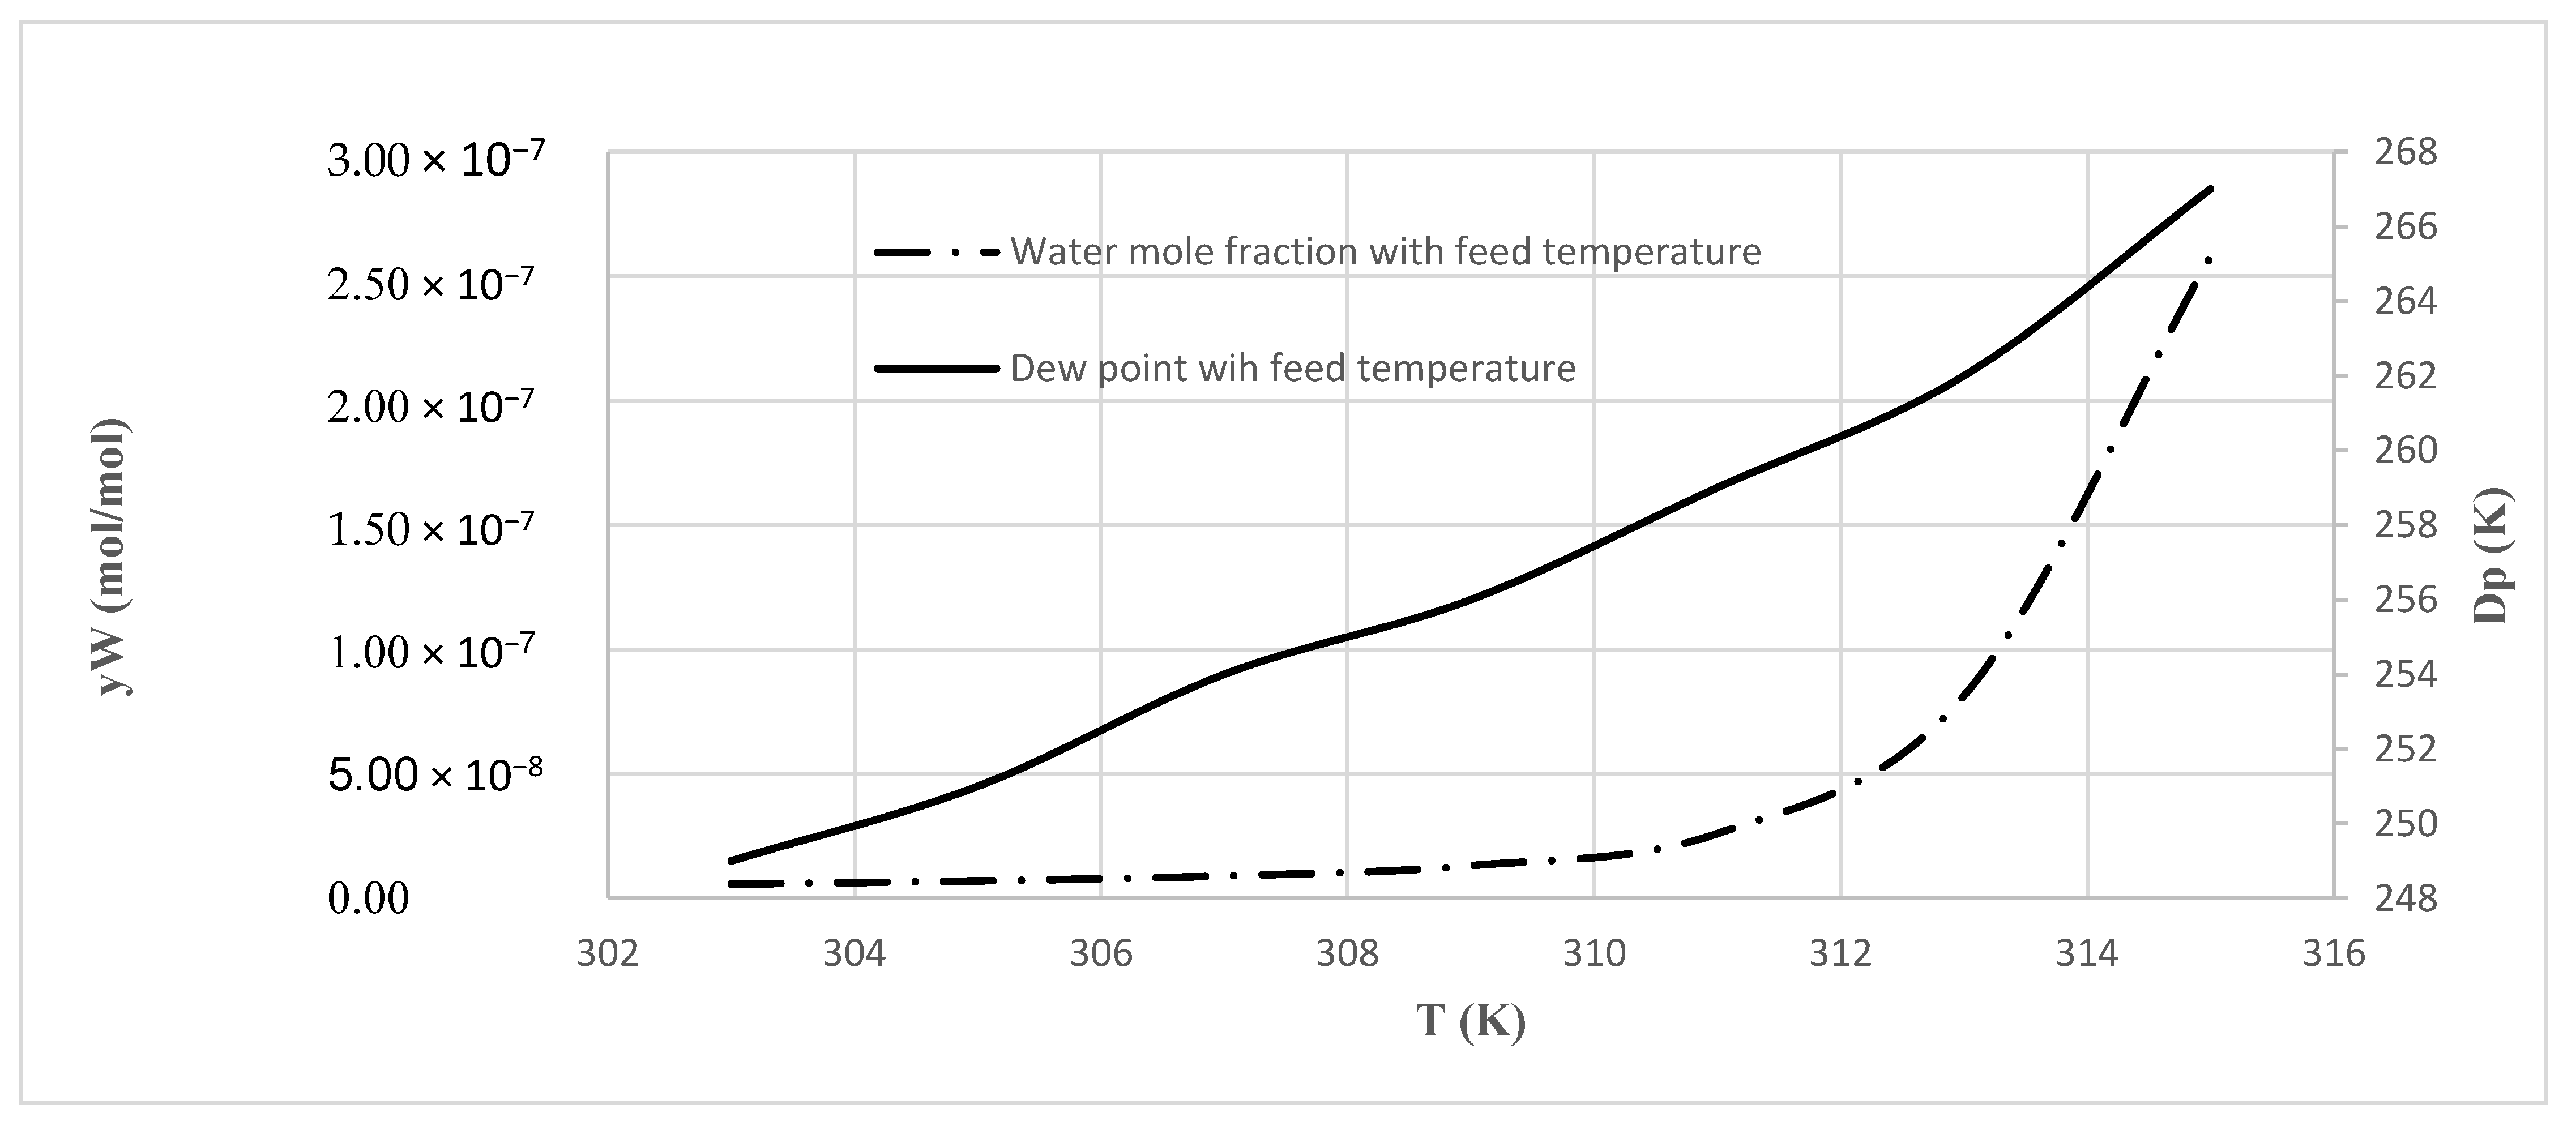
Figure 20 shows that with decreases in the feed temperature, results showed more desirable values. If the feed temperature was reduced 3 °C, the dew point temperature decreased 5 °C. Thus, feed temperature reduction can be used for dew point adjustment and to achieve better results in the water content of the gas.

5.4. Regeneration Flow Rate Effect

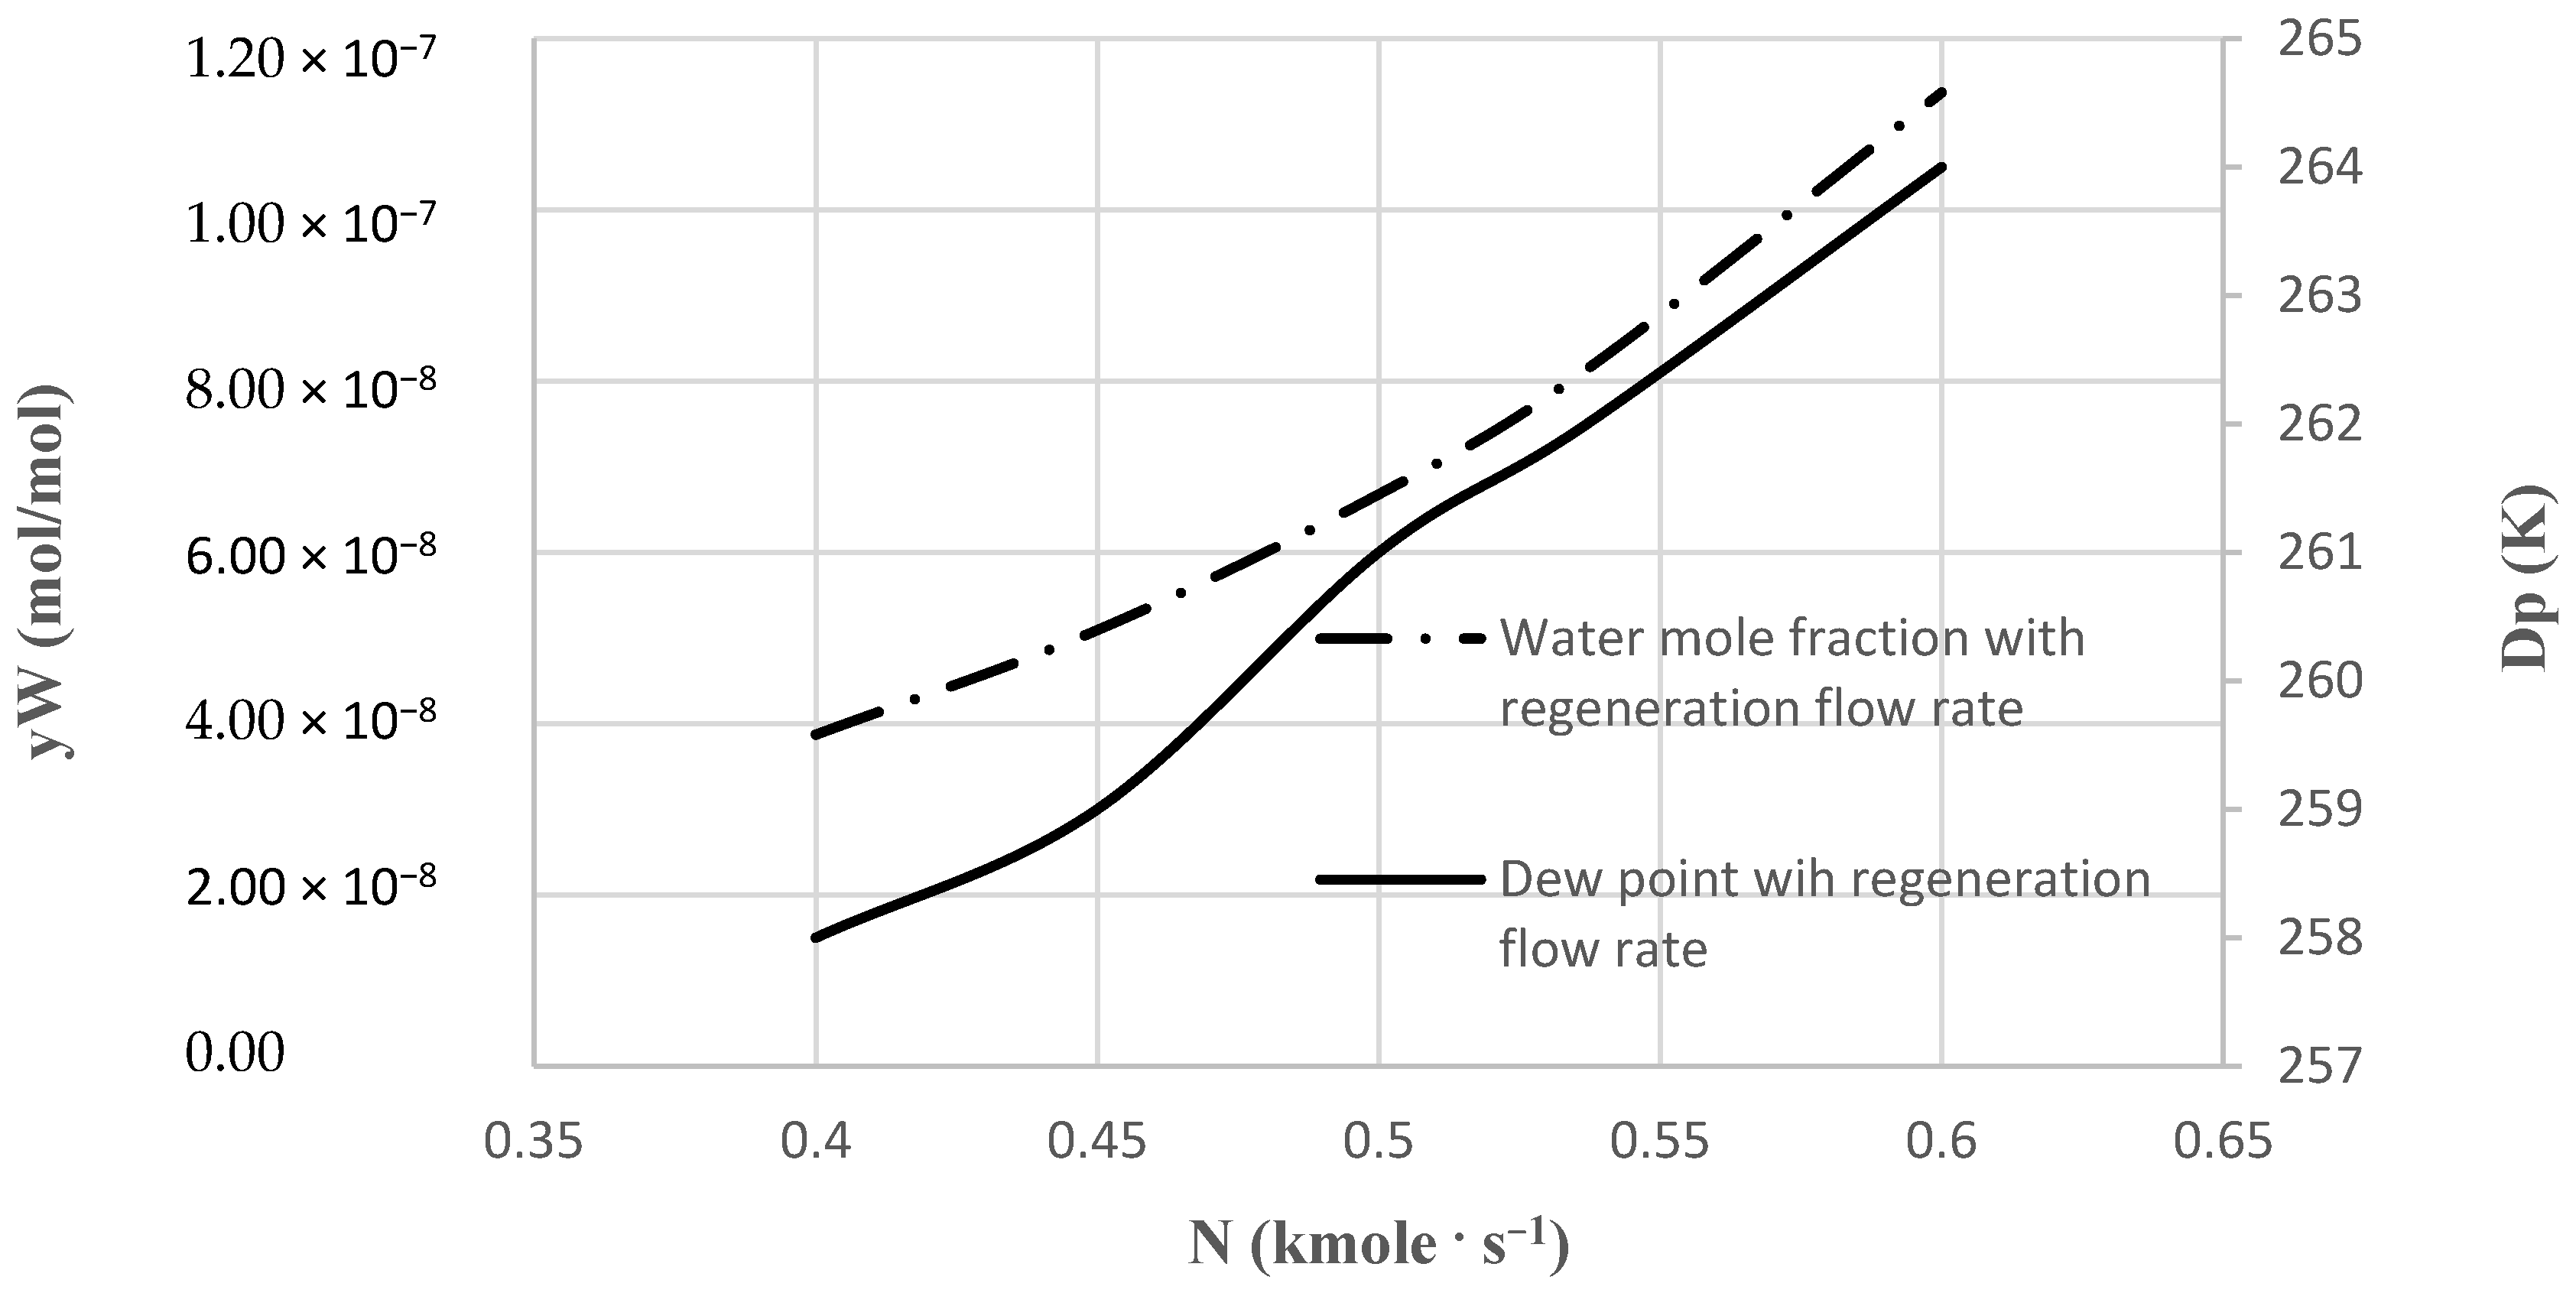
Feed gas was used for regeneration, so in the cooling down mode of the bed, some adsorption took place. The adsorption value during the cooling down decreased with the feed flow rate. As shown in Figure 21, decreasing the feed molar flow rate to 0.4 resulted in desirable outcomes. With lower flow rates, the hexane regeneration was not taking place properly, and the bed would become saturated with time.

5.5. Effect of the Furnace Temperature

The inlet gas was warmed up to 268 °C in the present condition of the furnace. Regeneration was still run when this temperature was decreased to 210 °C. Even this temperature was proper for hexane reduction as the heaviest component in the bed. As a result, the energy consumption can be reduced by decreasing the temperature (Figure 22).

6. Optimization

It is necessary to define variables and objective functions for optimization of the process.
The objectives that should be specified in this process are as follows:
  • Hydrocarbon dew point up to −10 °C;
  • Water concentration in the output stream up to 0.1 ppm;
  • Minimum energy consumption.
The variables considered for this part are as follows:
  • Input feed temperature;
  • Regeneration flow rate;
  • Heating temperature.
Pressure could have been included in these variables, and pressure enhancement is effective for adsorption. However, since pressure increases require a compressor to be cost effective and have no positive effect at the end, pressure was not considered as a variable.
The software used for optimization was DesignExpert, which proposes data for simulation randomly. The intervals considered are as follows (Table 7).
According to the results, the most proper ranges for regeneration temperature, regeneration flow rate, and input feed temperature were 483–498 K, 0.4–0.45 kmole·s−1, and 303–310 K, respectively.
Lower regeneration temperature leads to lower furnace heat load, but heavy component regeneration is not done well in the bed. Thus, this temperature could not be reduced significantly.
A split stream from the feed was used as the regeneration gas, decreasing its flow rate, which resulted in better outcomes in simulation. Low flow rates caused inappropriate heavy component regeneration, so after some cycles, the bed would be saturated by hexane.
At lower feed temperatures, better results in the simulation were gained, since an air cooler was used for gas cooling before its entrance, and ambient air was utilized in the cooler. However, the feed temperature could not be decreased unlimitedly. The lowest output temperature difference in the cooler should be 5 degrees due to the approach temperature. Since the ambient temperature in the intended city is high, the cooler output gas temperature can decrease to 303 K for winters and to 310 K in summers.

7. Conclusions

In this study, the natural gas dehydration process, which is currently in operation, is simulated and investigated. The simulation results were compared with data from a refinery located in the south of Iran, and a good validation was obtained. As a result of validation, other conditions in the unit such as operating temperature and pressure were investigated in different situations. Sensitivity analysis was discussed, and optimum conditions for the process were obtained. The bed was made up of two layers. In the first layer, water was adsorbed from the gas. In the second layer, heavy hydrocarbons were separated from the gas. In the second layer, adsorption of pentane and hexane was investigated. The pentane was adsorbed earlier than hexane. By comparing the gas dew point of the gas before and after adsorption, it was observed that its dew point decreased due to the removal of heavy hydrocarbons and the reduction of its concentration in the gas mixture. By examining the regeneration diagrams, it was shown that lighter components were regenerated earlier. Pentane was regenerated sooner than hexane. By changing the pressure, it was found that at the pressures less than 70 bar the results were different from the specified value, and at pressures higher than 80 bar, there was no significant change in the achieved results. By investigating the regeneration rate, it was observed that by decreasing the regeneration rate to 0.4 kmol/s, good results were obtained. In the rates less than 0.4 kmol/s, hexane was not completely regenerated, and after several cycles, the tower was saturated with hexane, and inappropriate results were obtained.
By changing the regeneration temperature to about 210 °C, the components that adsorbed in the bed were well regenerated. As a result of this temperature reduction, the furnace temperature could be reduced from 268 °C to 210 °C, and the required thermal load in the furnace also decreased. According to the results, the optimum intervals for regeneration temperature could be considered from 210 to 240 degrees Celsius. In addition, an optimum range for the regeneration gas flow rate was achieved at 0.4 to 0.45 kmol/s. In the case of inlet feed temperature, 303 to 310 °C was the optimum range.

Author Contributions

Investigation, H.G., M.M., F.P., A.J. and M.R.G.; Software, H.G., M.M., F.P. and A.J.; Writing—review and editing, H.G., M.M. and A.J.; Methodoloyg, H.G., M.M., A.J. and M.R.G.; Validation, H.G.; Funding acquisition, M.M., A.J. and M.R.G.; Supervision, M.M. All authors have read and agreed to the published version of the manuscript.

Funding

This research received no external funding.

Data Availability Statement

The study did not report any data.

Conflicts of Interest

The authors declare no conflict of interest.

Nomenclature

a p Specific surface area of the adsorbent ( m 2 ) T s Adsorbent temperature (K)
cHHexane concentration (ppm) T m Melting point temperature (K)
C i Concentration of component i in the gas phase (mol·m−3) V b Volume at normal boiling point
C pg Heat capacity of gas (J/kg/K) V C Critical molar volume (m3/kmol)
C ps Heat capacity of adsorbent (J/kg/K) y i Mole fraction of component i (mol/mol)
D ki Knudsen diffusion coefficient (cm·s−1) y p Pentane mole fraction (mol/mol)
d p Diameter of sphere (m) y H Hexane mole fraction (mol/mol)
D ax , i Axial dispersion coefficient for component I (m2/s) y W Water mole fraction (mol/mol)
D AB Mutual diffusion coefficient for components A and B (m2/s)ZAxial coordinate (m)
D ci Molecular diffusivity in micropore (m2/s) Z C Critical compressibility factor
D mi Molecular diffusion coefficiEnt of component i in the mix (m2/s) Greek letters
D p Dew point temperature (K) β i 0 Adsorption constant at infinite temperature
hHeat transfer coefficient(W/m2/K)ɛPorosity
Δ H Heat of adsorption (KJ/Kmol) ε AB Maximum absorption energy
Δ H i Heat of adsorption for component i (KJ/Kmol) ε b Bed porosity
K ax Effective axial thermal conductivity (W/m/K) ε p Adsorbent porosity
K c Henry’s coefficient μ g Viscosity of gas (kg/m s)
K f , i Film mass transfer coefficient (m/s) υ g Gas velocity(m/s)
K g Gas thermal conductivity (W/m/K) ρ s Adsorbent density (kg·m−3)
K i Mass transfer coefficient (m/s) ρ g gas density (kg·m−3)
K p , i Effective diffusion coefficient (m2/s) τ Tortuosity factor
MMolecular weight (kg/kmol)σDiameter of the collision
NMass flux (cm·s−1) σ AB Binary pair characteristic length = ( σ A + σ B / 2 ) (m)
NUNusselt numberΦThe adsorption shape factor
PPressure (bar) ω Acentric factor
qAmount of material adsorbed Ω D Wilke–Lee diffusion relation parameter
q i Concentration of component i in the solid phase (mol·m−3) Abbreviations
RUniversal gas constantAAdsorption
ReReynolds numberCCooling
r c Micro-pore radius (m)HHeating
r p Grain radius (m)HTCHeat transfer coefficient
ScSchmidt numberLDFLinear driving force
ShSherwood numberPVSAPressure-vacuum-swing adsorption
TGas temperature (K)PSAPressure swing adsorption
tTime(s)PTSAPressure and thermal swing adsorption
T b Normal boiling point (K)TPSAThermal pressure swing adsorption
T C Critical temperatureTSATemperature swing adsorption

References

  1. Ghorbani, B.; Hamedi, M.-H.; Amidpour, M.; Mehrpooya, M. Cascade refrigeration systems in integrated cryogenic natural gas process (natural gas liquids (NGL), liquefied natural gas (LNG) and nitrogen rejection unit (NRU)). Energy 2016, 115, 88–106. [Google Scholar] [CrossRef]
  2. Ghorbani, B.; Hamedi, M.-H.; Amidpour, M.; Shirmohammadi, R. Implementing absorption refrigeration cycle in lieu of DMR and C3MR cycles in the integrated NGL, LNG and NRU unit. Int. J. Refrig. 2017, 77, 20–38. [Google Scholar] [CrossRef]
  3. Ghorbani, B.; Mehrpooya, M.; Hamedi, M.-H.; Amidpour, M. Exergoeconomic analysis of integrated natural gas liquids (NGL) and liquefied natural gas (LNG) processes. Appl. Therm. Eng. 2017, 113, 1483–1495. [Google Scholar] [CrossRef]
  4. Kidnay, A.J.; Parrish, W.R.; McCartney, D.G. Fundamentals of Natural Gas Processing; CRC Press: Boca Raton, FL, USA, 2011. [Google Scholar]
  5. Yousefi, H.; Mehrpooya, M.; Naeiji, E. Modeling and optimization of currently in operation natural gas desulfurization process using adsorption separation method. Chem. Eng. Process. Process Intensif. 2017, 120, 220–233. [Google Scholar] [CrossRef]
  6. Santos, M.G.; Correia, L.M.; de Medeiros, J.L.; Ofélia de Queiroz, F.A. Natural gas dehydration by molecular sieve in offshore plants: Impact of increasing carbon dioxide content. Energy Convers. Manag. 2017, 149, 760–773. [Google Scholar] [CrossRef]
  7. Gholami, M.; Talaie, M.; Roodpeyma, S. Mathematical modeling of gas dehydration using adsorption process. Chem. Eng. Sci. 2010, 65, 5942–5949. [Google Scholar] [CrossRef]
  8. Nastaj, J.; Ambrożek, B. Analysis of gas dehydration in TSA system with multi-layered bed of solid adsorbents. Chem. Eng. Process. Process Intensif. 2015, 96, 44–53. [Google Scholar] [CrossRef]
  9. Netusil, M.; Ditl, P. Comparison of three methods for natural gas dehydration. J. Nat. Gas Chem. 2011, 20, 471–476. [Google Scholar] [CrossRef]
  10. Farag, H.A.; Ezzat, M.M.; Amer, H.; Nashed, A.W. Natural gas dehydration by desiccant materials. Alex. Eng. J. 2011, 50, 431–439. [Google Scholar] [CrossRef] [Green Version]
  11. Sayılgan, Ş.Ç.; Mobedi, M.; Ülkü, S. Effect of regeneration temperature on adsorption equilibria and mass diffusivity of zeolite 13x-water pair. Microporous Mesoporous Mater. 2016, 224, 9–16. [Google Scholar] [CrossRef]
  12. Shirani, B.; Kaghazchi, T.; Beheshti, M. Water and mercaptan adsorption on 13X zeolite in natural gas purification process. Korean J. Chem. Eng. 2010, 27, 253–260. [Google Scholar] [CrossRef]
  13. Yang, M.-W.; Chen, N.-C.; Huang, C.-H.; Shen, Y.-T.; Yang, H.-S.; Chou, C.-T. Temperature swing adsorption process for CO2 capture using polyaniline solid sorbent. Energy Procedia 2014, 63, 2351–2358. [Google Scholar] [CrossRef] [Green Version]
  14. Gandhidasan, P.; Al-Farayedhi, A.A.; Al-Mubarak, A.A. Dehydration of natural gas using solid desiccants. Energy 2001, 26, 855–868. [Google Scholar] [CrossRef]
  15. Tohidi, Z.; Fatemi, S.; Qazvini, O.T. Mercaptan removal from natural gas by the efficient cyclic adsorption process; a simulation study. J. Nat. Gas Sci. Eng. 2015, 26, 758–769. [Google Scholar] [CrossRef]
  16. Qazvini, O.T.; Fatemi, S. Modeling and simulation pressure–temperature swing adsorption process to remove mercaptan from humid natural gas; a commercial case study. Sep. Purif. Technol. 2015, 139, 88–103. [Google Scholar] [CrossRef]
  17. Mulgundmath, V.; Tezel, F.H. Optimisation of carbon dioxide recovery from flue gas in a TPSA system. Adsorption 2010, 16, 587–598. [Google Scholar] [CrossRef]
  18. Siriwardane, R.V.; Shen, M.-S.; Fisher, E.P.; Poston, J.A. Adsorption of CO2 on molecular sieves and activated carbon. Energy Fuels 2001, 15, 279–284. [Google Scholar] [CrossRef]
  19. Do, D.D. Adsorption Analysis: Equilibria and Kinetics; Imperial College Press: London, UK, 1998. [Google Scholar]
  20. Wang, Y.; LeVan, M.D. Adsorption equilibrium of carbon dioxide and water vapor on zeolites 5A and 13X and silica gel: Pure components. J. Chem. Eng. Data 2009, 54, 2839–2844. [Google Scholar] [CrossRef]
  21. Jiayou, Q. Characterization of Silica Gel-Water Vapor Adsorption and Its Measuring Facility. Master’s Thesis, National University of Singapore, Singapore, 2003. [Google Scholar]
  22. Hien, N.T.M.; Serpinskii, V.V.; Yakubov, T.S. Adsorption of n-pentane on silica gel. Bull. Acad. Sci. USSR Div. Chem. Sci. 1987, 35, 1554–1557. [Google Scholar] [CrossRef]
  23. Bartell, F.E.; Bower, J.E. Adsorption of vapors by silica gels of different structures. J. Colloid Sci. 1951, 7, 80–93. [Google Scholar] [CrossRef]
  24. Preston Mason, J.; Cooke, C., Jr. Adsorption of hydrocarbon gas mixtures at high pressure. AIChE J. 1966, 12, 1097–1103. [Google Scholar] [CrossRef]
  25. Gonzalez, A.; Holland, C. Adsorption equilibria of the light hydrocarbon gases on the activated carbon and silica gel. AIChE J. 1971, 17, 470–475. [Google Scholar] [CrossRef]
  26. Ng, K.; Chua, H.; Chung, C.; Loke, C.; Kashiwagi, T.; Akisawa, A.; Saha, B. Experimental investigation of the silica gel–water adsorption isotherm characteristics. Appl. Therm. Eng. 2001, 21, 1631–1642. [Google Scholar] [CrossRef]
  27. Bergman, T.L.; Incropera, F.P.; DeWitt, D.P.; Lavine, A.S. Fundamentals of Heat and Mass Transfer; John Wiley & Sons: Hoboken, NJ, USA, 2011. [Google Scholar]
  28. Ntiamoah, A.; Ling, J.; Xiao, P.; Webley, P.A.; Zhai, Y. CO2 capture by vacuum swing adsorption: Role of multiple pressure equalization steps. Adsorption 2015, 21, 509–522. [Google Scholar] [CrossRef] [Green Version]
  29. Douglas, M.; Ruthven, S.; Farooq, S.; Knaebel, K. Pressure Swing Adsorption; Wiley: Hoboken, NJ, USA, 1993. [Google Scholar]
  30. Wakao, N.; Funazkri, T. Effect of fluid dispersion coefficients on particle-to-fluid mass transfer coefficients in packed beds: Correlation of Sherwood numbers. Chem. Eng. Sci. 1978, 33, 1375–1384. [Google Scholar] [CrossRef]
  31. Green, D.W. Perry’s Chemical Engineers’ Handbook; McGraw Hill: New York, NY, USA, 2008. [Google Scholar]
  32. Treybal, R.E. Mass Transfer Operations; McGraw Hill: New York, NY, USA, 1980. [Google Scholar]
  33. Yang, R. Gas separation by adsorption processes. Chem. Eng. Sci. 1988, 43, 985. [Google Scholar] [CrossRef]
Figure 1. Schematic representation of the process with four beds.
Catalysts 12 01509 g001
Figure 2. Four parallel beds’ interconnection sequence (A: adsorption, C: cooling, H: heating).
Catalysts 12 01509 g002
Figure 3. View of the four beds in a complete cycle (A: adsorption, C: cooling, H: heating).
Catalysts 12 01509 g003
Figure 4. Comparison of simulation and industrial data for the pentane mole fraction in the output stream.
Catalysts 12 01509 g004
Figure 5. Comparison of simulation and industrial data of the refinery for the hexane mole fraction in the output stream.
Catalysts 12 01509 g005
Figure 6. Water mole fraction in the output stream in natural gas with time.
Catalysts 12 01509 g006
Figure 7. Water mole fraction in different zones of the bed with time.
Catalysts 12 01509 g007
Figure 8. Pressure versus temperature for hydrocarbon dew points before and after desorption.
Catalysts 12 01509 g008
Figure 9. Relationship of the dew point versus hexane concentration.
Catalysts 12 01509 g009
Figure 10. Temperature variation of the bed in the first layer with time.
Catalysts 12 01509 g010
Figure 11. Temperature variation of the bed in the second layer with time.
Catalysts 12 01509 g011
Figure 12. Water mole fraction in the output stream in the desorption step with time.
Catalysts 12 01509 g012
Figure 13. Pentane mole fraction in the output stream in the desorption step with time.
Catalysts 12 01509 g013
Figure 14. C6+ mole fraction in the output stream in the desorption step with time.
Catalysts 12 01509 g014
Figure 15. Pentane output mole fraction in four different zones of the bed.
Catalysts 12 01509 g015
Figure 16. Hexane output mole fraction in four different zones of the bed.
Catalysts 12 01509 g016
Figure 17. Water output mole fraction in three different zones of the bed.
Catalysts 12 01509 g017
Figure 18. Hexane regeneration with time.
Catalysts 12 01509 g018
Figure 19. Pressure effect on dew point and water mole fraction in output stream.
Catalysts 12 01509 g019
Figure 20. Water mole fraction and hydrocarbon dew point feed temperature in output stream.
Catalysts 12 01509 g020
Figure 21. Relationship of water mole fraction and hydrocarbon dew point versus gas regeneration mass flux.
Catalysts 12 01509 g021
Figure 22. Energy required variation with temperature for regeneration.
Catalysts 12 01509 g022
Table 1. Characteristics of adsorbents.
AdsorbentSilica Gel HSilica Gel WS
Specific surface area (m2·g−1)650550
Bulk density (kg·m−3)700700
Average pore diameter (nm)2.52.5
Pore volume (cm3·g−1)0.450.4
Average particle diameter (mm)33
Heat capacity (kJ·kg−1·K−1)1.051.05
Table 2. Composition and specifications of the feed.
Flow Rate (kmole·s−1)0.537
Pressure (bar)73
Temperature (°C)40
CH4863.7 × 10−3
C2H650.048 × 10−3
C3H817.382 × 10−3
C4H1010.489 × 10−3
C5H124.595 × 10−3
C6H145.594 × 10−3
CO222.976 × 10−3
N225.074 × 10−3
H2O1.041 × 10−3
Table 3. Heat of adsorption for three components.
ComponentΔHi (KJ/Kmol)
Pentane−34,000
Hexane−38,000
Water−45,000
Table 4. Considered values for σi and εi [31].
(Å) σε/k
Critical point0.841 VC1/30.75 TC
Critical point(1.866 VC1/3)/(ZC0.5)65.3 TCZC3.6
Normal boiling point1.18 Vb1/31.15 Tb
Melting point1.222 Vm1/3ε/k = 1.92 Tm
Acentric factor(2.3551 − 0.087 ω) (TC/PC)1/3(0.7915 + 0.1693 ω) TC
Table 5. Diffusion coefficient of the components.
ComponentAdsorption (m2·s−1)Regeneration (m2·s−1)
C 6 H 14 1.36 ⨉ 10−73.82 ⨉ 10−7
C 5 H 12 1.47 ⨉ 10−74.10 ⨉ 10−7
H 2 O 3.26 ⨉ 10−79.55 ⨉ 10−7
Table 6. Considered intervals for simulation.
VariableVariation Range
Feed temp. (K)303–315
Regeneration temp. (K)473–573
Regeneration flow rate (kmole·s−1)0.4–0.6
Table 7. Required data for optimization.
Input Feed Temp. (K)Regeneration Temp. (K)Regeneration Flow Rate (kmole·s−1)Output Water Concentration (ppm)Hydrocarbon Dew Point (K)Consumption Energy (kW)
13095230.40.005249.151350
23095230.450.009254.152025
33035730.60.005248.154200
43095230.60.015258.152700
53034730.60.0003250.151200
63095230.450.009254.152025
73094980.450.005249.151462.5
83035730.40.015241.152100
93034730.40.0001242.15600
103094730.450.002255.15900
113095230.450.001254.152025
123155730.40.06257.252100
133095730.450.007254.253150
143155230.450.15262.152025
153094980.60.01259.151950
163154730.40.05227.15600
173094980.40.0042253.25975
183035230.450.004246.152025
193154730.60.34266.151200
203155730.60.25264.154200
Publisher’s Note: MDPI stays neutral with regard to jurisdictional claims in published maps and institutional affiliations.