Abstract
Semiconductor-based photocatalyst materials play an important role in solar hydrogen production. In the present work, we achieved the successful synthesis of a CeO2/MoS2 composite using a facile hydrothermal method. For the preparation of the CeO2/MoS2 composite, the hydrothermal process was carried out at a temperature of 120 °C for 24 h, and its performance in hydrogen production was tested. The CeO2/MoS2 composite was characterized using XRD, XPS, Raman spectroscopy, SEM, and optical investigation. The optical study showed that after forming a composite with MoS2, the absorption edge of CeO2 is shifted from the ultraviolet to the visible light region. Bandgap values decreased from 2.93 for CeO2 to 2.34 eV for the CeO2/MoS2 composite. In photocatalytic hydrogen production, Na2SO3–Na2S was used as a sacrificial agent. The CeO2/MoS2 composite exhibited superior photocatalytic hydrogen production performance compared to CeO2 and MoS2. The CeO2/MoS2 composite achieved higher charge separation efficiency, faster charge transfer, more active sites available for redox reactions, and greater affinity towards the reactant ions due to such properties its hydrogen evolution rate has reached 112.5 μmol/h. The photostability of the CeO2/MoS2 composite was tested in up to four cycles, with each cycle being four hours.
1. Introduction
The synthesis of visible light-responsive semiconductor photocatalyst materials to harvest hydrogen as a clean energy source by the photocatalytic method is an attractive, economical, and environmentally friendly process. It involves capturing light (Ultraviolet, visible, sunlight) by photocatalyst material and converting it into hydrogen [1,2]. Numerous methods have been adopted to generate hydrogen. These include steam reforming of hydrocarbons, electrolysis of water, fermentation, gasification of biomass, and photocatalytic hydrogen production. Compared to photocatalytic hydrogen production, steam reforming of hydrocarbons is an endothermic, reversible, and high-temperature reaction that generates CO2. Other methods have the same drawbacks. Photocatalytic hydrogen production is a green technology in which photo-created H2 can easily be stored, and it is a potential approach to meet energy demands and is safe for the environment. It has gained more attention due to its easy operation, cost-effectiveness, efficiency, and pollution-free technique, and hydrogen energy can replace fossil fuels in the near future [3,4,5].
Different kinds of semiconductor materials have been used for photocatalytic hydrogen production under sunlight, UV, and visible light illumination. Among the semiconductors, TiO2, CuO, ZnO2, Fe2O3, CdS, AgX, V2O3, g-C3N4, and WO3 are commonly used in photocatalytic hydrogen production [6]. CeO2 has been studied as a catalyst material for decades. CeO2 has similar properties to TiO2 and ZnO. It is chemically stable, non-toxic, inexpensive, etc., and it is a substitute for TiO2 and ZnO materials [7]. Its applications as a photocatalyst are limited due to its disadvantages such as its large bandgap, the ability to absorb only a small portion of UV light, and more recombination of photogenerated charge carriers. Most studies proved that the photocatalytic activity of CeO2 can be enhanced using different strategies such as bandgap engineering, doping, heterojunction, composites, etc. Among the different strategies, the most effective method is making a composite of CeO2 with visible light response semiconductor materials that have a lower bandgap, such as transition metal dichalcogenides (TMDs), which cover the broader solar spectrum and promote charge generation and separation [8,9].
In the past few years, TMDs have received considerable attention because of their impressive structural, optical, electronic properties, and efficient co-catalytic supports, and suitable bandgaps. Thus, they are used in different fields such as photonics, energy, technology, electronics, physics, and chemistry. TMDs have layered structures similar to graphene. MoS2 is widely used as a visible light-active photocatalyst material in which Mo atoms are sandwiched between two layers of hexagonal, closely packed sulfur atoms. Such layered structures can be used in different applications such as photocatalysis, batteries, supercapacitors, CO2 reduction, water splitting, hydrogen production, etc. [10,11]. Furthermore, MoS2 is reported to be an alternative option for noble metals such as Pt, Ag, Au, etc. In addition, it is considered a suitable co-catalyst material for H2 generation using the photocatalytic and electrocatalytic methods. In many studies, MoS2 has been used as a co-catalyst or component material in the formation of a composite/heterojunction. A heterojunction provides a potential driving force, which is helpful for the generation and separation of photogenerated charge carriers, fast charge transfer, better interface contact, etc. [12,13]. MoS2 possesses favorable electronic properties and thermal stability, a large surface area, and a narrow bandgap, responsible for visible light absorption due to its efficient charge transfer properties and for increasing the photocatalytic H2 evolution activity [14]. Gong et al. synthesized MoS2/CeO2 material by a facile two-step wet chemistry process and studied the catalytic activity toward H2 production [15]. Li et al. prepared a CeO2@MoS2 core-shell nanocomposite and used it to study supercapacitor applications (symmetric supercapacitors) [16]. Li et al. fabricated a ternary attapulgite–CeO2/MoS2 nanocomposite and studied the degradation of dibenzothiophene in gasoline under visible light irradiation [17]. Liu et al. prepared a MoS2/CeO2 heterojunction and studied the photocatalytic degradation of methyl orange under visible light illumination [18]. From the above discussion, we can conclude that there are few reports available on H2 evolution using MoS2/CeO2 photocatalyst.
In this work, CeO2 and CeO2/MoS2 composite were prepared by the hydrothermal route and used to study photocatalytic hydrogen production. Prepared catalyst materials were characterized using different techniques, including X-ray diffraction (XRD), Raman spectroscopy, X-ray photoelectron spectroscopy (XPS), scanning electron microscopy (SEM), and UV–Vis spectroscopy, etc. A comparative study of CeO2, MoS2, and the CeO2/MoS2 composite was conducted to evaluate the photocatalytic hydrogen production activity. To evaluate the photostability of the CeO2/MoS2 composite, recycling tests were performed with up to four cycles, each cycle being four hours. The presence of a sacrificial agent (Na2S/Na2SO3) stimulated H2 evolution by scavenging photogenerated holes.
2. Results and Discussion
The crystallographic structures of the prepared catalyst materials were investigated using the XRD technique. Figure 1 presents the XRD patterns of CeO2, MoS2, and the CeO2/MoS2 composite. The XRD pattern shows that all the prepared materials were well crystallized. For CeO2, major diffraction peaks located at 28.5°, 33.1°, 47.5°, and 56.3° were well indexed as (111), (200), (220), and (311) crystal planes, respectively. The matching of standard and observed d values confirm the cubic crystal structure (Powder Diffraction File no. 34-0394) of CeO2 [19]. For MoS2, major diffraction peaks located at 14.44°, 32.79°, and 39.66° correspond to (002), (100), and (103), respectively. The matching of standard and observed d values using the Powder Diffraction File no. (PDF no. 77-1716) confirmed the hexagonal crystal structure of MoS2 [20]. In the case of the CeO2/MoS2 composite, MoS2 and CeO2 peaks are denoted by symbols # and *, respectively. Major CeO2 and MoS2 diffraction peaks remain in the same positions in the CeO2/MoS2 composite. XRD results confirm the formation of the CeO2/MoS2 composite without any impurities. Additionally, prepared materials were characterized using Raman spectroscopy.
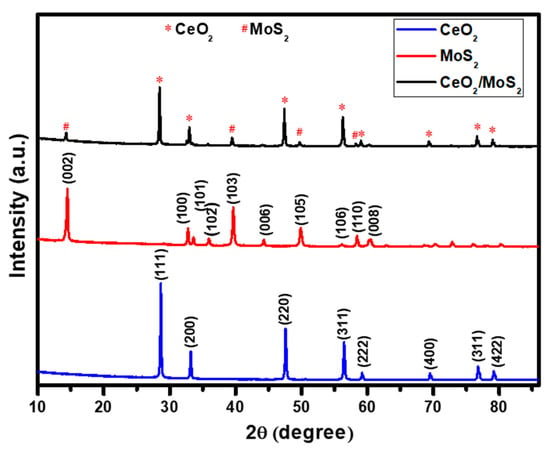
Figure 1.
X-ray diffraction patterns of CeO2, MoS2, and CeO2/MoS2 composite.
Raman spectroscopy is primarily used to characterize composite materials, and it also reveals information about types of bonding, symmetry, and structure in two-dimensional nanostructures [21]. Figure S1 presents the Raman spectrum of CeO2. From Figure S1, it is observed that the sharp and most intense characteristic peak was found at 442.48 cm−1 (F2g band) which is associated with the symmetrical stretching mode of the oxygen atoms around each Ce cation [22]. Figure 2 presents Raman spectra of MoS2 and the CeO2/MoS2 composite. For MoS2, two major peaks positioned at 379.15 cm−1 and 404.48 cm−1 correspond to E1 2g and A1g modes respectively of pure MoS2. Out of these two modes, the E1 2g mode is associated with the in-plane opposite vibration of two S atoms, while the A1g mode is associated with the out-of-plane vibration of the S atoms in opposite directions with respect to the Mo atom. Peaks were observed at 820.55 and 993.22 cm−1 due to the oxidation of MoS2 by laser irradiation, leading to the formation of MoO3, which presents the vibrational energy of MoO3 [23]. In the case of the CeO2/MoS2 composite, CeO2 peaks are denoted by the symbol *. The E1 2g, A1g, and F2g modes correspond to the pure CeO2 and MoS2 samples. A small shift was detected in the CeO2 peaks of the CeO2/MoS2 composite due to an alteration or tension in the crystal lattice during the formation of the composite [24].
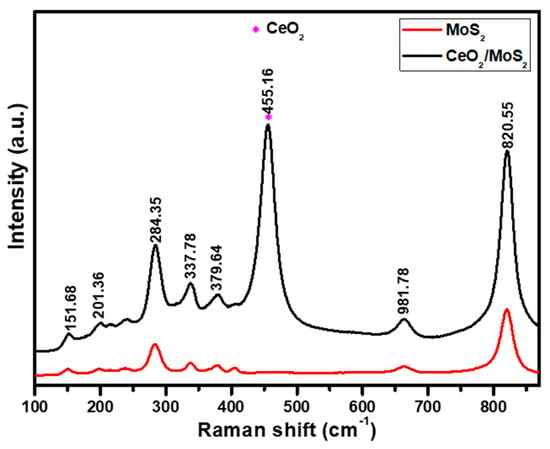
Figure 2.
Raman spectra of MoS2 and CeO2/MoS2 composite.
The CeO2/MoS2 composite was further characterized by XPS. XPS study provides information about the chemical composition as well as the valence state of the CeO2/MoS2 composite [25]. Figure 3a presents the XPS survey scan spectrum of the CeO2/MoS2 composite. From the XPS survey scan spectrum, Mo 3d, S 2p, Ce 3d, and O 1s elements were detected. No other impurity elements were found. The Mo 3d high-resolution spectrum is presented in Figure 3b. The Mo 3d spectrum split into Mo 3d 5/2 and Mo 3d 3/2, which correspond to the binding energy of 229.05 and 232.20 eV, respectively, suggesting that Mo exists in a +4 oxidation state [26]. Figure 3c presents the S 2p spectrum, featuring two major bands with a binding energy of 161.85 and 162.79 eV, which correspond to S 2p 3/2 and S 2p 1/2, respectively [27]. Figure 3d shows the Ce (3d) XPS spectrum, which is deconvoluted into two sets. One set is in the range 880–900 eV, which is associated with Ce 3d 5/2, and the second one is in the range 900–920 eV, which corresponds to Ce 3d 3/2. Splitting of Ce 3d 5/2 and 3/2 reveals that Ce exists in the mixed valence state with oxidation states Ce3+ and Ce4+. The main characteristic peaks of Ce at 900.05 and 882.02 eV belong to Ce3+ 3d 3/2 and 3d 5/2, respectively. Along with this satellite, peaks observed at 907.1 eV correspond to Ce3+ 3d 3/2, and those at 889.01 and 885.08 eV correspond to Ce3+ 3d 5/2. In addition, three other satellite peaks were observed at 907.1 eV for Ce3+ 3d 3/2 and at 888.7 and 885.1 eV for Ce3+ 3d 5/2 [28]. The O 1s spectrum is shown in Figure 3e, and it is split into three major peaks with a binding energy of 529.40 eV (O1), 532.15 eV (O2), and 533.21 eV (O3), which correspond to the lattice, core level O2, and S-O bonds, respectively [29].
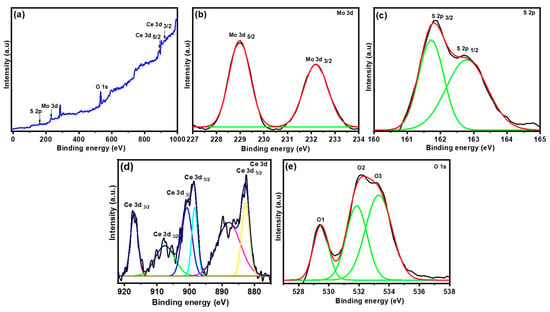
Figure 3.
(a) X-ray photoelectron spectroscopy (XPS) spectrum of CeO2/MoS2 composite, (b) Mo 3d spectrum, (c) S2 p spectrum, (d) Ce 3d spectrum, and (e) O 1s spectrum.
After structural characterization, a morphological study of the CeO2/MoS2 composite catalyst was performed using scanning electron microscopy. Figure 4 shows the SEM images of the CeO2/MoS2 composite at different magnifications. From the SEM images, it is observed that small flakes shaped MoS2 particles, and CeO2 particles have grains of different sizes and shapes (Figure 4a,b). Furthermore, a uniform distribution of both CeO2 and MoS2 in the particles is observed. At higher magnification (1 µm), particles are clearly seen (Figure 4c–e).
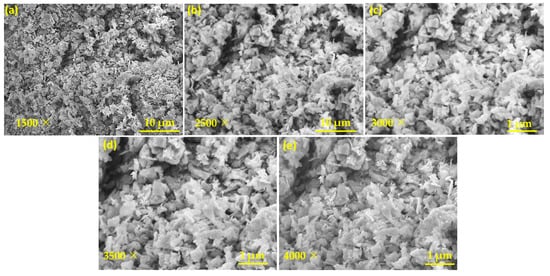
Figure 4.
SEM images of CeO2/MoS2 composite at different magnifications (a) 1500×, (b) 2500×, (c) 3000×, (d) 3500×, and (e) 4000×.
An optical study is important while investigating the photocatalytic properties of MoS2, CeO2, and the CeO2/MoS2 composite. Figure 5 shows the optical properties of prepared photocatalyst materials. Figure 5a presents the UV–Vis absorption spectra. CeO2 shows the absorption edge at 460 nm and exhibits strong absorption in the ultraviolet region. For MoS2, the absorption edge is found at 875 nm, and it covers the visible region. The formation of the CeO2/MoS2 composite caused the absorption edge of CeO2 to shift towards the higher wavelength side due to the electronic interactions between the CeO2 and MoS2 grains through physical contact while making the composite [30]. The CeO2/MoS2 composite covers both the visible and ultraviolet regions, which is beneficial for photocatalytic activity.
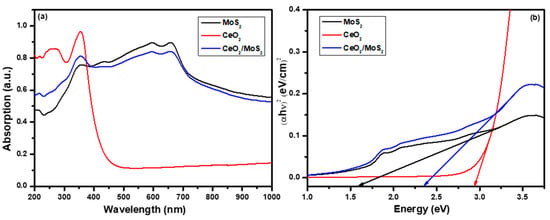
Figure 5.
(a) Absorption spectra and (b) bandgap plots of MoS2 and CeO2/MoS2 composite.
Using the absorption data, the bandgap values were estimated. Figure 5b shows the plot of (αhν)2 vs. hν for MoS2, CeO2, and the CeO2/MoS2 composite. Using the following equation, bandgap energy, i.e., the energy difference between the conduction and valence bands, was calculated [31]:
where A is a constant, Eg is the difference between the bottom of the conduction band and the top of the valence band, hν is the photon energy, and n is the order. Bandgap values were found to be 1.60, 2.93, and 2.34 eV for MoS2, CeO2, and the CeO2/MoS2 composite respectively. Making the composite was beneficial for enhancing light absorption and reducing the bandgap energy of CeO2, suggesting a change in the electronic structure of CeO2. Along with this, it is essential to understand the band positions of CeO2 and MoS2. The following equations were used to calculate the band positions [10],
where X represents the electronegativity of the catalyst material, EVB is valence band potential, ECB is conduction band potential, Eg is the bandgap energy, and Ee is the free electron energy (4.5 eV on the hydrogen scale). The electronegativity values for CeO2 and MoS2 were calculated as 5.56 eV and 5.32 eV, respectively [32]. Calculated values for CB potential for CeO2 and MoS2 were −0.41 and 0.02 eV, and VB potential values were 2.52 and 1.62 eV, respectively. Table S1 (Supplementary Materials) presents the bandgap values and the CB and VB potentials (band positions) of MoS2, CeO2, and the CeO2/MoS2 composite.
αhν = A(hν − Eg)n
EVB = X − Ee + 0.5 Eg
ECB = EVB − Eg
The specific surface area and pore size distribution are important parameters while studying photocatalytic activity. To study these surface properties, nitrogen adsorption and desorption isotherm studies were performed for the CeO2/MoS2 composite (Figure S2a,b). The CeO2/MoS2 composite has H3 hysteresis-like loop and type IV adsorption and desorption, confirming its porous nature [33]. In Figure S2a, the calculated active surface area for the CeO2/MoS2 composite is 48.72 m2 g−1. The BJH model was used to study the pore size distribution of the CeO2/MoS2 composite (Figure S2b). From the graph, the pore size was found to be ~6.5 nm. This study shows that the porous nature of the CeO2/MoS2 composite, which is useful for redox reactions and thereby photocatalytic study [34].
3. Photocatalytic Hydrogen Evolution Activity
The photocatalytic hydrogen evolution activity of MoS2, CeO2, and the CeO2/MoS2 composite was measured under illumination. The yield of the hydrogen evolution rate of all the samples increased with the irradiation time increasing from 0 to 2 h. Figure 6a presents a plot of hydrogen evolution vs. time. For CeO2, MoS2 and the CeO2/MoS2 composite, the hydrogen production rates were 12.2, 21.5, and 112.5 µmol/h, respectively. The CeO2/MoS2 composite exhibits superior photocatalytic activity towards hydrogen production as compared to CeO2 and MoS2. Higher hydrogen production activity of the CeO2/MoS2 composite sample corresponds to the effective charge generation, separation, and transfer, along with more active sites available for redox reactions and minimum charge recombination [10,35]. Active redox sites are situated at the edges and corners of the MoS2 plane, helping to improve the hydrogen production rate of CeO2. Recycling tests of the CeO2/MoS2 composite were performed to further study its stability. Figure 6b presents the recycling study of the CeO2/MoS2 composite to observe its photostability. Recycling tests were performed with up to four cycles, each cycle being four hours. From the graph, it is observed that the CeO2/MoS2 composite exhibits adequate photostability. For the first cycle, 472.5 µmol hydrogen evolution was detected. After the fourth cycle, this value was. A slight decrease in the hydrogen production rate was observed after the fourth cycle. The loss of the photocatalyst during the recovery process and the generation of the hydroxide layer on the catalyst surface are responsible for the decrease in H2 production activity [36]. In addition, the photo-corrosion of photocatalysts is also responsible for the decrease in the H2 production rate.
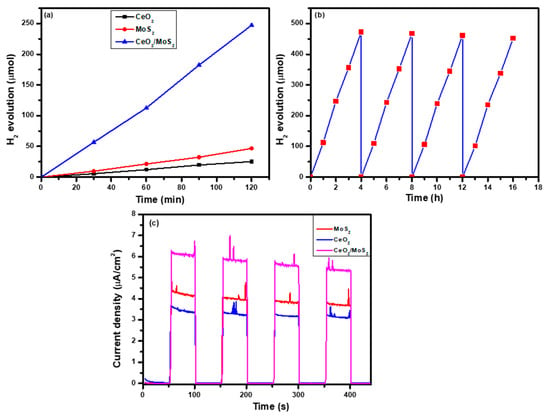
Figure 6.
Photocatalytic H2 production by CeO2, MoS2, and CeO2/MoS2 composite: (a) recycling tests for photocatalytic H2 production; (b) H2 evolution in four consecutive for 4 h cycles using CeO2/MoS2 composite; (c) photocurrent density vs. time test.
A possible mechanism of hydrogen production is proposed using the CeO2/MoS2 composite. Under illumination, the CeO2/MoS2 composite was easily excited, resulting in the generation of electrons and holes in the VB and CB respectively. The photo-generated electrons in the conduction band of CeO2 can be transferred into the conduction band of MoS2 because the conduction band potential of MoS2 was more positive than that of CeO2. This type of composite can improve the lifetime of charge carriers, along with charge separation efficiency and the fast transfer of charge carriers from the CB of CeO2 to the CB of MoS2 for hydrogen evolution [37,38]. The CB electrons of MoS2 exhibit strong reducibility and can easily reduce H+ to H2, which agrees well with the results from the experiments of H2 evolution. Furthermore, the role of MoS2 as a co-catalyst is highly active for H2 evolution as a result of the quantum confinement effect [39,40,41]. A comparison of photocatalytic hydrogen production activity using MoS2-based photocatalysts is presented in Table S2.
A photo-response study gives evidence regarding the highest current density and charge recombination process in the prepared materials. Figure 6c presents the transient chopping photocurrent responses of MoS2, CeO2, and the CeO2/MoS2 composite deposited onto FTO-coated glass substrates, checked every 50 s of on/off cycles at an applied voltage of 0 V vs. Ag/AgCl. For all samples, under illumination, a swift photocurrent response was detected. The study revealed that the CeO2/MoS2 composite exhibits a higher current density than pure MoS2 and CeO2. The CeO2/MoS2 composite sample achieved the highest current density of 6.15 µA/cm2, which is nearly double that of CeO2. The higher current density of the CeO2/MoS2 composite sample corresponds to the appropriate band positions for effective charge transfer [42]. For CeO2 and MoS2, the lowest current density values of 3.40 and 4.35 µA/cm2 were observed due to higher recombination of photo-generated charge carriers.
4. Experimental Details
Materials: Sodium hydroxide (NaOH, 99.8%), cerium hexahydrate nitrate (Ce(NO)3·6H2O, 99%), and MoS2 powder (flakes, 98.8%) were all purchased from Sigma-Aldrich. Deionized water (D.W.) was used during the experiment. Analytical-grade (A.R.) chemical reagents were used in the experiment.
4.1. Synthesis of Cerium Oxide
CeO2 was prepared using the hydrothermal method. A certain amount of Ce(NO)3·6H2O was dissolved in 40 mL D.W. NaOH (5 M) solution was added dropwise to the solution. Then, the reaction mixture was transferred into a 50 mL Teflon-lined autoclave. The hydrothermal process was carried out at 120 °C for 24 h. After the completion of the hydrothermal process, the formed product was filtered out, washed with D.W., and calcinated at 300 °C.
4.2. Synthesis of CeO2/MoS2 Composite
To synthesize the CeO2/MoS2 composite, the CeO2 solution was prepared as mentioned above. A certain amount of MoS2 powder was put into a distilled water-ethanol mixture. To achieve better dispersion of MoS2 flakes in the water-ethanol mixture, it was sonicated for 30 min. Finally, the two reaction solutions were mixed well. The reaction solution was kept in a 50 mL hydrothermal reactor at 120 °C for 24 h in an oven.
4.3. Characterizations
Crystal structures of the prepared materials were analyzed using X-ray diffraction (XRD; CuKα radiation (λ = 1.5406 A°) from a Bruker D2 Phaser, Germany). Raman spectra were recorded in the range 100–875 cm−1 using the NRS-5100 instrument of the Japan Spectroscopic Company (JASCO, Tokyo, Japan) with an excitation wavelength of 532 nm. Elemental composition was analyzed by X-ray photoelectron spectroscopy (XPS, Thermo Scientific, Waltham, MA, USA. K-Alpha set up using monochromatic Al Kα X-ray source). The morphology of the prepared material was observed using the SEM instrument JSM-7600F of the Japan Electron Optics Laboratory (JEOL, Tokyo, Japan). Optical properties were studied using UV–Vis absorption spectroscopy (Shimadzu: UV-1800, Kyoto, Japan). The measurement of the BET-specific surface area of the photocatalysts was carried out using a nitrogen adsorption instrument at 77 K (Micrometrics, Norcross, GA, USA, ASAP 2020).
4.4. Photocatalytic H2 Production Study
A photocatalytic H2 evolution study was conducted in a 100 mL sealed quartz batch reactor. A 150 W xenon arc lamp (>400 nm) was used as a light source. First, 50 mg of the catalyst was dispersed into a 100 mL aqueous solution containing 0.3 M Na2SO3/Na2S. Before light irradiation, N2 gas was purged in a reaction mixture for 30 min through the reactor to remove the dissolved oxygen. After a particular interval of time, the quantity of gas was collected through a gas syringe. The collected gas sample was analyzed by gas chromatography (GC; GC-2014AT, Shimadzu, Japan) to observe the gas composition and quantity. Recycling (stability) tests were conducted using the same experimental conditions. In the recycling experiment, after each cycle, the catalyst powder was collected, washed with DI water, and reused. A total of four cycles were performed, with each cycle being 4 h.
5. Conclusions
Visible light-activated photocatalyst materials such as CeO2/MoS2 composite can be successfully synthesized by the hydrothermal route. XRD, Raman spectroscopy, and XPS results confirmed the formation of a CeO2/MoS2 composite without any impurities. An optical study revealed that the bandgap of CeO2 reduced from 2.93 eV to 2.34 eV upon forming a composite with MoS2. The photocurrent response study showed that the CeO2/MoS2 composite sample achieved the highest current density of 6.15 µA/cm2. The study of photocatalytic hydrogen production activity revealed that the CeO2/MoS2 composite exhibits superior photocatalytic activity compared to pure MoS2 and CeO2. For MoS2, CeO2, and the CeO2/MoS2 composite, the hydrogen production rates were found to be 12.2, 21.5, and 112.5 µmol/h, respectively. The enhanced photocatalytic activity of the CeO2/MoS2 composite is attributed to its effective photo-response and charge generation, separation, and transfer, as well as its minimal recombination of photogenerated charge carriers. Thus, the CeO2/MoS2 composite is a suitable photocatalytic material to support environmental remediation.
Supplementary Materials
The following supporting information can be downloaded at: https://www.mdpi.com/article/10.3390/catal12101185/s1, Figure S1. Raman spectrum of CeO2, Figure S2. (a) BET surface area and (b) pore size distribution curves of CeO2/MoS2 composite, Table S1. Bandgap values of prepared photocatalyst materials with CB and VB potentials, Table S2. A comparison table showing photocatalytic hydrogen production activity using MoS2-based photo-catalysts. The references [40,43,44,45] are cited int supplementary materials.
Author Contributions
Conceptualization, S.-W.K.; methodology, Y.M.H.; formal analysis, A.A.Y.; investigation, A.A.Y., Y.M.H. and S.-W.K.; writing—original draft preparation, Y.M.H. and A.A.Y.; writing—review and editing, A.A.Y., Y.M.H. and S.-W.K.; supervision, S.-W.K.; validation, S.-W.K.; project administration, S.-W.K.; funding acquisition, S.-W.K. All authors have read and agreed to the published version of the manuscript.
Data Availability Statement
All data included in this study are available upon request by contact with the corresponding author.
Acknowledgments
This work was supported by the National Research Foundation of Korea (NRF) grant funded by the Korea government (MSIT) (no. 2019R1A5A8080290).
Conflicts of Interest
The authors declare no conflict of interest.
References
- Swain, G.; Sultana, S.; Naik, B.; Parida, K. Coupling of Crumpled-Type Novel MoS2 with CeO2 Nanoparticles: A Noble-Metal-Free p–n Heterojunction Composite for Visible Light Photocatalytic H2 Production. ACS Omega 2017, 7, 3745–3753. [Google Scholar] [CrossRef] [PubMed]
- Hunge, Y.M.; Mahadik, M.A.; Bulakhe, R.N.; Yadav, S.P.; Shim, J.J.; Moholkar, A.V.; Bhosale, C.H. Oxidative degradation of benzoic acid using spray deposited WO3/TiO2 thin films. J. Mater. Sci. Mater. Electron. 2017, 28, 17976–17984. [Google Scholar] [CrossRef]
- Hunge, Y.M.; Yadav, A.A.; Kang, S.W.; Kim, H. Facile synthesis of multitasking composite of Silver nanoparticle with Zinc oxide for 4-nitrophenol reduction, photocatalytic hydrogen production, and 4-chlorophenol degradation. J. Alloys Compd. 2022, 928, 167133. [Google Scholar] [CrossRef]
- Hunge, Y.M.; Yadav, A.A.; Kang, S.W.; Lim, S.J.; Kim, H. Visible light activated MoS2/ZnO composites for photocatalytic degradation of ciprofloxacin antibiotic and hydrogen production. J. Photochem. Photobio. A Chem. 2023, 434, 114250. [Google Scholar] [CrossRef]
- Vyas, Y.; Chundawat, P.; Dharmendra, D.; Punjabi, P.B.; Ameta, C. Review on hydrogen production photocatalytically using carbon quantum dots: Future fuel. Int. J. Hydrogen Energy 2021, 46, 37208–37241. [Google Scholar] [CrossRef]
- Tahir, M.; Tasleem, S.; Tahir, B. Recent development in band engineering of binary semiconductor materials for solar driven photocatalytic hydrogen production. Int. J. Hydrogen Energy 2020, 45, 15985–16038. [Google Scholar] [CrossRef]
- Zhang, X.; Zhang, N.; Xu, Y.-J.; Tang, Z.-R. One-dimensional CdS nanowires–CeO2 nanoparticles composites with boosted photocatalytic activity. N. J. Chem. 2015, 39, 6756–6764. [Google Scholar] [CrossRef]
- You, D.; Pan, B.; Jiang, F.; Zhou, Y.; Su, W. CdS nanoparticles/CeO2 nanorods composite with high-efficiency visible-light-driven photocatalytic activity. Appl. Surf. Sci. 2016, 363, 154–160. [Google Scholar] [CrossRef]
- Liu, Z.-Q.; Kuang, P.-Y.; Wei, R.-B.; Li, N.; Chen, Y.-B.; Su, Y.-Z. BiOBr nanoplate-wrapped ZnO nanorod arrays for high performance photoelectrocatalytic application. RSC Adv. 2016, 6, 16122–16130. [Google Scholar] [CrossRef]
- Hunge, Y.M.; Yadav, A.A.; Kang, S.W.; Kim, H. Photocatalytic degradation of tetracycline antibiotics using hydrothermally synthesized two-dimensional molybdenum disulfide/titanium dioxide composites. J. Colloid Interface Sci. 2022, 606, 454–463. [Google Scholar] [CrossRef] [PubMed]
- Yadav, A.; Hunge, Y.M.; Kang, S.W. Ultrasound assisted synthesis of highly active nanoflower-like CoMoS4 electrocatalyst for oxygen and hydrogen evolution reactions. Ultrason. Sonochem. 2021, 72, 105454. [Google Scholar] [CrossRef] [PubMed]
- Ye, G.; Gong, Y.; Lin, J.; Li, B.; He, Y.; Pantelides, S.T.; Zhou, W.; Vajtai, R.; Ajayan, P.M. Defects Engineered Monolayer MoS2 for Improved Hydrogen Evolution Reaction. Nano Lett. 2016, 16, 1097–1103. [Google Scholar] [CrossRef] [PubMed]
- Yuan, Y.-J.; Ye, Z.-J.; Lu, H.-W.; Hu, B.; Li, Y.-H.; Chen, D.-Q.; Zhong, J.-S.; Yu, Z.-T.; Zou, Z.-G. Constructing Anatase TiO2 Nanosheets with Exposed (001) Facets/Layered MoS2 Two-Dimensional Nanojunctions for Enhanced Solar Hydrogen Generation. ACS Catal. 2016, 6, 532–541. [Google Scholar] [CrossRef]
- Kuang, P.-Y.; Ran, J.-R.; Liu, Z.-Q.; Wang, H.-J.; Li, N.; Su, Y.-Z.; Jin, Y.-G.; Qiao, S.-Z. Enhanced Photoelectrocatalytic Activity of BiOI Nanoplate–Zinc Oxide Nanorod p–n Heterojunction. Chem. Eur. J. 2015, 21, 15360–15368. [Google Scholar] [CrossRef] [PubMed]
- Gong, X.; Gu, Y.-Q.; Li, N.; Zhao, H.; Jia, C.-J.; Du, Y. Thermally Stable Hierarchical Nanostructures of Ultrathin MoS2 Nanosheet-Coated CeO2 Hollow Spheres as Catalyst for Ammonia Decomposition. Inorg. Chem. 2016, 55, 3992–3999. [Google Scholar] [CrossRef] [PubMed]
- Li, N.; Zhao, H.; Zhang, Y.; Liu, Z.; Gong, X.; Du, Y. Core–shell structured CeO2@MoS2 nanocomposites for high performance symmetric supercapacitors. CrystEngComm 2016, 18, 4158–4164. [Google Scholar] [CrossRef]
- Li, X.; Zhang, Z.; Yao, C.; Lu, X.; Zhao, X.; Ni, C. Attapulgite-CeO2/MoS2 ternary nanocomposite for photocatalytic oxidative desulfurization. Appl. Surf. Sci. 2016, 364, 589–596. [Google Scholar] [CrossRef]
- Liu, X.; Meng, F.; Yu, B.; Wu, H. Self-assembly synthesis of flower-like CeO2/MoS2 heterojunction with enhancement of visible light photocatalytic activity for methyl Orange. J. Mater. Sci. Mater. Electron. 2020, 31, 6690–6697. [Google Scholar] [CrossRef]
- Taniguchi, T.; Sonoda, Y.; Echikawa, M.; Watanabe, Y.; Hatakeyama, K.; Ida, S.; Koinuma, M.; Matsumoto, Y. Intense Photoluminescence from Ceria-Based Nanoscale Lamellar Hybrid. ACS Appl. Mater. Interfaces 2012, 4, 1010–1015. [Google Scholar] [CrossRef] [PubMed]
- Gao, X.; Zhang, X. Synthesis of MoS2 Inorganic Fullerene-like Nanoparticles by a Chemical Vapour Deposition Method. S.Afr. J. Chem. 2014, 67, 6–11. [Google Scholar]
- Yadav, A.; Hunge, Y.M.; Kang, S.W. Porous nanoplate-like tungsten trioxide/reduced graphene oxide catalyst for sonocatalytic degradation and photocatalytic hydrogen production. Surf. Interf. 2021, 24, 101075. [Google Scholar] [CrossRef]
- Yang, H.; Xu, B.; Yuan, S.S.; Zhang, Q.T.; Zhang, M.; Ohno, T. Synthesis of Y-doped CeO2/PCN nanocomposited photocatalyst with promoted photoredox performance. Appl. Catal. B 2019, 243, 513–521. [Google Scholar] [CrossRef]
- Cao, H.; Bai, Z.; Li, Y.; Xiao, Z.; Zhang, X.; Li, G. Solvothermal Synthesis of Defect-Rich Mixed 1T-2H MoS2 Nanoflowers for Enhanced Hydrodesulfurization. ACS Sustain. Chem. Eng. 2020, 819, 7343–7352. [Google Scholar] [CrossRef]
- Talukdar, K.; Saravanakumar, K.; Kim, Y.; Fayyaz, A.; Kim, G.; Yoon, Y.; Park, C.M. Rational construction of CeO2–ZrO2@MoS2 hybrid nanoflowers for enhanced sonophotocatalytic degradation of naproxen: Mechanisms and degradation pathways. Compos. Part B 2021, 215, 108780. [Google Scholar] [CrossRef]
- Yadav, A.A.; Hunge, Y.M.; Ko, S.; Kang, S.W. Chemically Synthesized Iron-Oxide-Based Pure Negative Electrode for Solid-State Asymmetric Supercapacitor Devices. Materials 2021, 15, 6133. [Google Scholar] [CrossRef]
- Fu, Y.; Ren, Z.; Wu, J.; Li, Y.; Liu, W.; Li, P.; Xing, L.; Ma, J.; Wang, H.; Xu, X. Direct Z-scheme heterojunction of ZnO/MoS2 nanoarrays realized by flowing-induced piezoelectric field for enhanced sunlight photocatalytic performances. Appl. Catal. B 2021, 285, 119785. [Google Scholar] [CrossRef]
- Jian, W.; Cheng, X.; Huang, Y.; You, Y.; Zhou, R.; Sun, T.; Xu, J. Arrays of ZnO/MoS2 nanocables and MoS2 nanotubes with phase engineering for bifunctional photoelectrochemical and electrochemical water splitting. Chem. Eng. J. 2017, 328, 474–483. [Google Scholar] [CrossRef]
- Islam, M.J.; Reddy, D.A.; Choi, J.; Kim, T.K. An oxygen-vacancy rich 3D novel hierarchical MoS2/BiOI/AgI ternary nanocomposite: Enhanced photocatalytic activity through photogenerated electron shuttling in a Z-scheme manner. RSC Adv. 2016, 6, 19341–19350. [Google Scholar] [CrossRef]
- Hunge, Y.M.; Yadav, A.A.; Kang, S.W.; Kim, H.; Fujishima, A.; Terashima, C. Nanoflakes-like nickel cobaltite as active electrode material for 4-nitrophenol reduction and supercapacitor applications. J. Hazard. Mater. 2021, 419, 126453. [Google Scholar] [CrossRef]
- Zhi, M.; Huang, W.; Shi, Q.; Wang, M.; Wang, Q. Sol–gel fabrication of WO3/RGO nanocomposite film with enhanced electrochromic performance. RSC Adv. 2016, 6, 67488–67494. [Google Scholar] [CrossRef]
- Hunge, Y.M.; Uchida, A.; Tominaga, Y.; Fujii, Y.; Yadav, A.A.; Kang, S.W.; Suzuki, N.; Shitanda, I.; Kondo, T.; Itagaki, M.; et al. Visible Light-Assisted Photocatalysis Using Spherical-Shaped BiVO4 Photocatalyst. Catalysts 2021, 11, 460. [Google Scholar] [CrossRef]
- Sharma, V.; Maivizhikannan, V.; Rao, V.N.; Kumar, S.; Kumar, A.; Kumar, A.; Shankar, M.V.; Krishnan, V. Sea urchin shaped ZnO coupled with MoS2 and polyaniline as highly efficient photocatalysts for organic pollutant decomposition and hydrogen evolution. Ceram. Int. 2021, 47, 10301–10313. [Google Scholar] [CrossRef]
- Yadav, A.A.; Hunge, Y.M.; Kulkarni, S.B.; Terashima, C.; Kang, S.W. Three-dimensional nanoflower–like hierarchical array of multifunctional copper cobaltate electrode as efficient electrocatalyst for oxygen evolution reaction and energy storage. J. Colloid Interface Sci. 2020, 576, 476–485. [Google Scholar] [CrossRef] [PubMed]
- Yadav, A.A.; Kang, S.W.; Hunge, Y.M. Photocatalytic degradation of Rhodamine B using graphitic carbon nitride photocatalyst. J. Mater. Sci. Mater. Electron. 2021, 3211, 15577–15585. [Google Scholar] [CrossRef]
- Yadav, A.A.; Hunge, Y.M.; Kang, S.W. Spongy ball-like copper oxide nanostructure modified by reduced graphene oxide for enhanced photocatalytic hydrogen production. Mater. Res. Bull. 2021, 133, 111026. [Google Scholar] [CrossRef]
- Hunge, Y.M.; Yadav, A.A.; Mathe, V.L. Photocatalytic hydrogen production using TiO2 nanogranules prepared by hydrothermal route. Chem. Phys. Lett. 2019, 731, 136582. [Google Scholar] [CrossRef]
- Zhang, J.; Huang, L.H.; Jin, H.Y.; Sun, Y.L.; Ma, X.M.; Zhang, E.P.; Wang, H.B.; Kong, Z.; Xi, J.H.; Jia, Z.G. Constructing two-dimension MoS2/Bi2WO6 core-shell heterostructure as carriers transfer channel for enhancing photocatalytic activity. Mater. Res. Bull. 2017, 85, 140–146. [Google Scholar] [CrossRef]
- Chen, L.; Xu, F.; Zhang, J.; Ding, H.; Yang, J. Structure design of CeO2–MoS2 composites and their efficient activity for imine synthesis. Appl. Nanosci. 2020, 10, 233–241. [Google Scholar] [CrossRef]
- Liu, C.; Wang, L.; Tang, Y.; Luo, S.; Liu, Y.; Zhang, S.; Zeng, Y.; Xu, Y. Vertical single or few-layer MoS2 nanosheets rooting into TiO2 nanofibers for highly efficient photocatalytic hydrogen evolution. Appl. Catal. B Environ. 2015, 164, 1–9. [Google Scholar] [CrossRef]
- Lu, D.; Wang, H.; Zhao, X.; Kondamareddy, K.K.; Ding, J.; Li, C.; Fang, P. Highly Efficient Visible-Light-Induced Photoactivity of Z-Scheme g-C3N4/Ag/MoS2 Ternary Photocatalysts for Organic Pollutant Degradation and Production of Hydrogen. ACS Sustain. Chem. Eng. 2017, 52, 1436–1445. [Google Scholar] [CrossRef]
- Zhang, J.; Huang, G.; Zeng, J.; Jiang, X.; Shi, Y.; Lin, S.; Chen, X.; Wang, H.; Kong, Z.; Xi, J.; et al. SnS2 nanosheets coupled with 2D ultrathin MoS2 nanolayers as face-to-face 2D/2D heterojunction photocatalysts with excellent photocatalytic and photoelectrochemical activities. J. Alloys Compd. 2019, 775, 726–735. [Google Scholar] [CrossRef]
- Rabell, G.O.; Cruz, M.R.A.; Juarez-Ramírez, I. Hydrogen production of ZnO and ZnO/Ag films by photocatalysis and photoelectrocatalysis. Mater. Sci. Semicond. Process. 2021, 134, 105985. [Google Scholar] [CrossRef]
- Zhu, C.; Wang, Y.; Jiang, Z.; Xu, F.; Xian, Q.; Sun, C.; Tong, Q.; Zou, W.; Duan, X.; Wang, S. CeO2 nanocrystal-modified layered MoS2/g-C3N4 as 0D/2D ternary composite for visible-light photocatalytic hydrogen evolution: Interfacial consecutive multi-step electron transfer and enhanced H2O reactant adsorption. Appl. Catal. B Environ. 2019, 259, 118072. [Google Scholar] [CrossRef]
- Chang, Y.; Lin, Y. MoS2@SnO2 core-shell sub-microspheres for high efficient visible-light photodegradation and photocatalytic hydrogen production. Mater. Res. Bull. 2020, 129, 110912. [Google Scholar] [CrossRef]
- Wang, Z.; Jin, Z.; Wang, G.; Ma, B. Efficient hydrogen production over MOFs (ZIF-67) and g-C3N4 boosted with MoS2 nanoparticles. Int. J. Hydrog. Energy 2018, 43, 13039–13050. [Google Scholar] [CrossRef]
Publisher’s Note: MDPI stays neutral with regard to jurisdictional claims in published maps and institutional affiliations. |
© 2022 by the authors. Licensee MDPI, Basel, Switzerland. This article is an open access article distributed under the terms and conditions of the Creative Commons Attribution (CC BY) license (https://creativecommons.org/licenses/by/4.0/).