Article

Influences of Ni Content on the Microstructural and Catalytic Properties of Perovskite LaNixCr1−xO3 for Dry Reforming of Methane

Hefei National Research Center for Physical Science at the Microscale, University of Science and Technology of China, Hefei 230026, China
*
Author to whom correspondence should be addressed.
Catalysts 2022, 12(10), 1143; https://doi.org/10.3390/catal12101143
Submission received: 29 August 2022 / Revised: 24 September 2022 / Accepted: 26 September 2022 / Published: 29 September 2022

Abstract

:
Perovskite oxides were widely used as precursors for developing metal-support type catalysts. It is attractive to explore the catalytic properties of the oxides themselves for dry reforming of methane (DRM). We synthesized LaNixCr1−xO3 (x = 0.05–0.5) samples in powder form using the sol-gel self-combustion method. Ni atoms are successfully doped into the LaCrO3 perovskite lattice. The perovskite grains are polycrystalline, and the crystallite size decreases with increasing Ni content. We demonstrated that the LaNixCr1−xO3 perovskites show intrinsically catalytic activity for DRM reactions. Reducing the Ni content is helpful to reduce carbon deposition resulting from the metal Ni nanoparticles that usually coexist with the highly active perovskite oxides. The CH4 conversion over the LaNi0.1Cr0.9O3 sample reaches approximately 84% at 750 °C, and the carbon deposition is negligible.

Graphical Abstract

1. Introduction

Dry reforming of methane (DRM) is an important reaction that converts two greenhouse gases, CH4 and CO2, to valuable syngas, H2 and CO, with an H2/CO ratio close to 1, which is suitable for synthesizing long-chain hydrocarbon chemicals through the Fischer-Tropsch reaction [1,2]. DRM is also attractive in saving the cost of CO2 separation when CO2-rich CH4 gas, such as biogas, is used as a feedstock to produce syngas [3,4]. Catalysts play a crucial role in a DRM reaction because both CH4 and CO2 are very stable molecules, and the reaction kinetics at economic reaction temperatures will be very sluggish without a high-performance catalyst. A DRM reaction is endothermic. To achieve acceptable CH4 and CO2 conversions limited by thermodynamics, the reaction needs to be carried out at temperatures typically higher than 600 °C [5]. Side reactions, such as the CH4 decomposition reaction (CH4 = 2H2 + C) and the Boudouard reaction (2CO = CO2 + C), may result in coking that will deactivate the catalysts or even block the reactor [6,7]. The reverse water–gas shift side reaction (RWGS, CO2 + H2 = CO + H2O) always occurs simultaneously with DRM, which reduces the H2/CO ratio to lower than 1. Thus, an ideal catalyst for DRM should be highly active, coking resistant, and thermostable [3].
Ni is the most investigated transition metal element for a DRM reaction because of its high catalytic activity and low cost compared to noble metals. However, supported Ni nanoparticles that act as catalytic active centers in metal-support catalysts suffer from coking and sintering problems [8,9,10]. Perovskite oxides were widely used as precursors for developing metal-support type catalysts because the in situ formation of highly dispersed Ni nanoparticles on oxide support may improve the activity and suppress coking [11,12]. What is more, the feasible application of doping of noble or non-noble metal atoms in perovskite precursors can improve the catalysts by further reducing the size of active metal nanoparticles, introducing active oxygen species in the support, and tailoring the metal-support interactions [13,14,15,16,17]. It has been reported that small Ni nanoparticles have strong anti-coking resistance [18]. An extreme case is that the single-atom catalyst with isolated Ni atoms dispersed over hydroxyapatite (HAP) is highly active and completely coke-resistant during high-temperature DRM [18].
Other than the usual metal-support type catalysts and single-atom catalysts, it is reported that perovskite oxides with the general formula ABO3 (A: lanthanide or alkaline earth metal; B: transition metal) show intrinsic activity for many reactions [19,20,21]. Perovskites have good flexibility and diversity in their chemical composition and can accommodate solid defects, such as vacancies at both the cation and anion sites [22,23]. The B-site transition metals on the surface are believed to be the active centers owing to the exposed d electron orbitals (e.g., Ni 3d). Considering that the B-site transition metals embedded in the perovskite lattice are atomically dispersed, we can expect to develop highly active and anti-coking catalysts for DRM. For instance, Ni-containing perovskites have been developed and proved to be highly active [22,24]. However, the usual Ni-containing perovskites, such as LaNiO3 and La(NiFe)O3, are not stable under DRM conditions and will be over-reduced to metal-support catalysts [8,25,26]. On the other hand, perovskite LaCrO3 is very stable in both reducing and oxidizing environments, but it is catalytically inert for DRM [27,28]. We recently demonstrated that Ni-containing perovskite oxides in the two-dimensional submonolayer (SML) form, such as LaNiOΔ-SML and La(NiCo)OΔ-SML, can be stabilized by a perovskite LaCrO3 support and used for catalyzing a DRM reaction [29]. The interesting point is that Ni atoms in the low-valent oxide form are highly active and anti-coking for a DRM reaction, even though the long-term stability of LaNiOΔ-SML needs to be further improved. Understanding the microstructural and catalytic properties of such materials will pave an attractive way for us to explore atomically dispersed catalysts.
In the present work, perovskite LaNixCr1−xO3 (x ≤ 0.5) catalysts were synthesized and characterized. The influences of the Ni content on the microstructural and catalytic properties for catalyzing the DRM reaction are discussed. The intrinsic activity of perovskite oxides is confirmed.

2. Results and Discussion

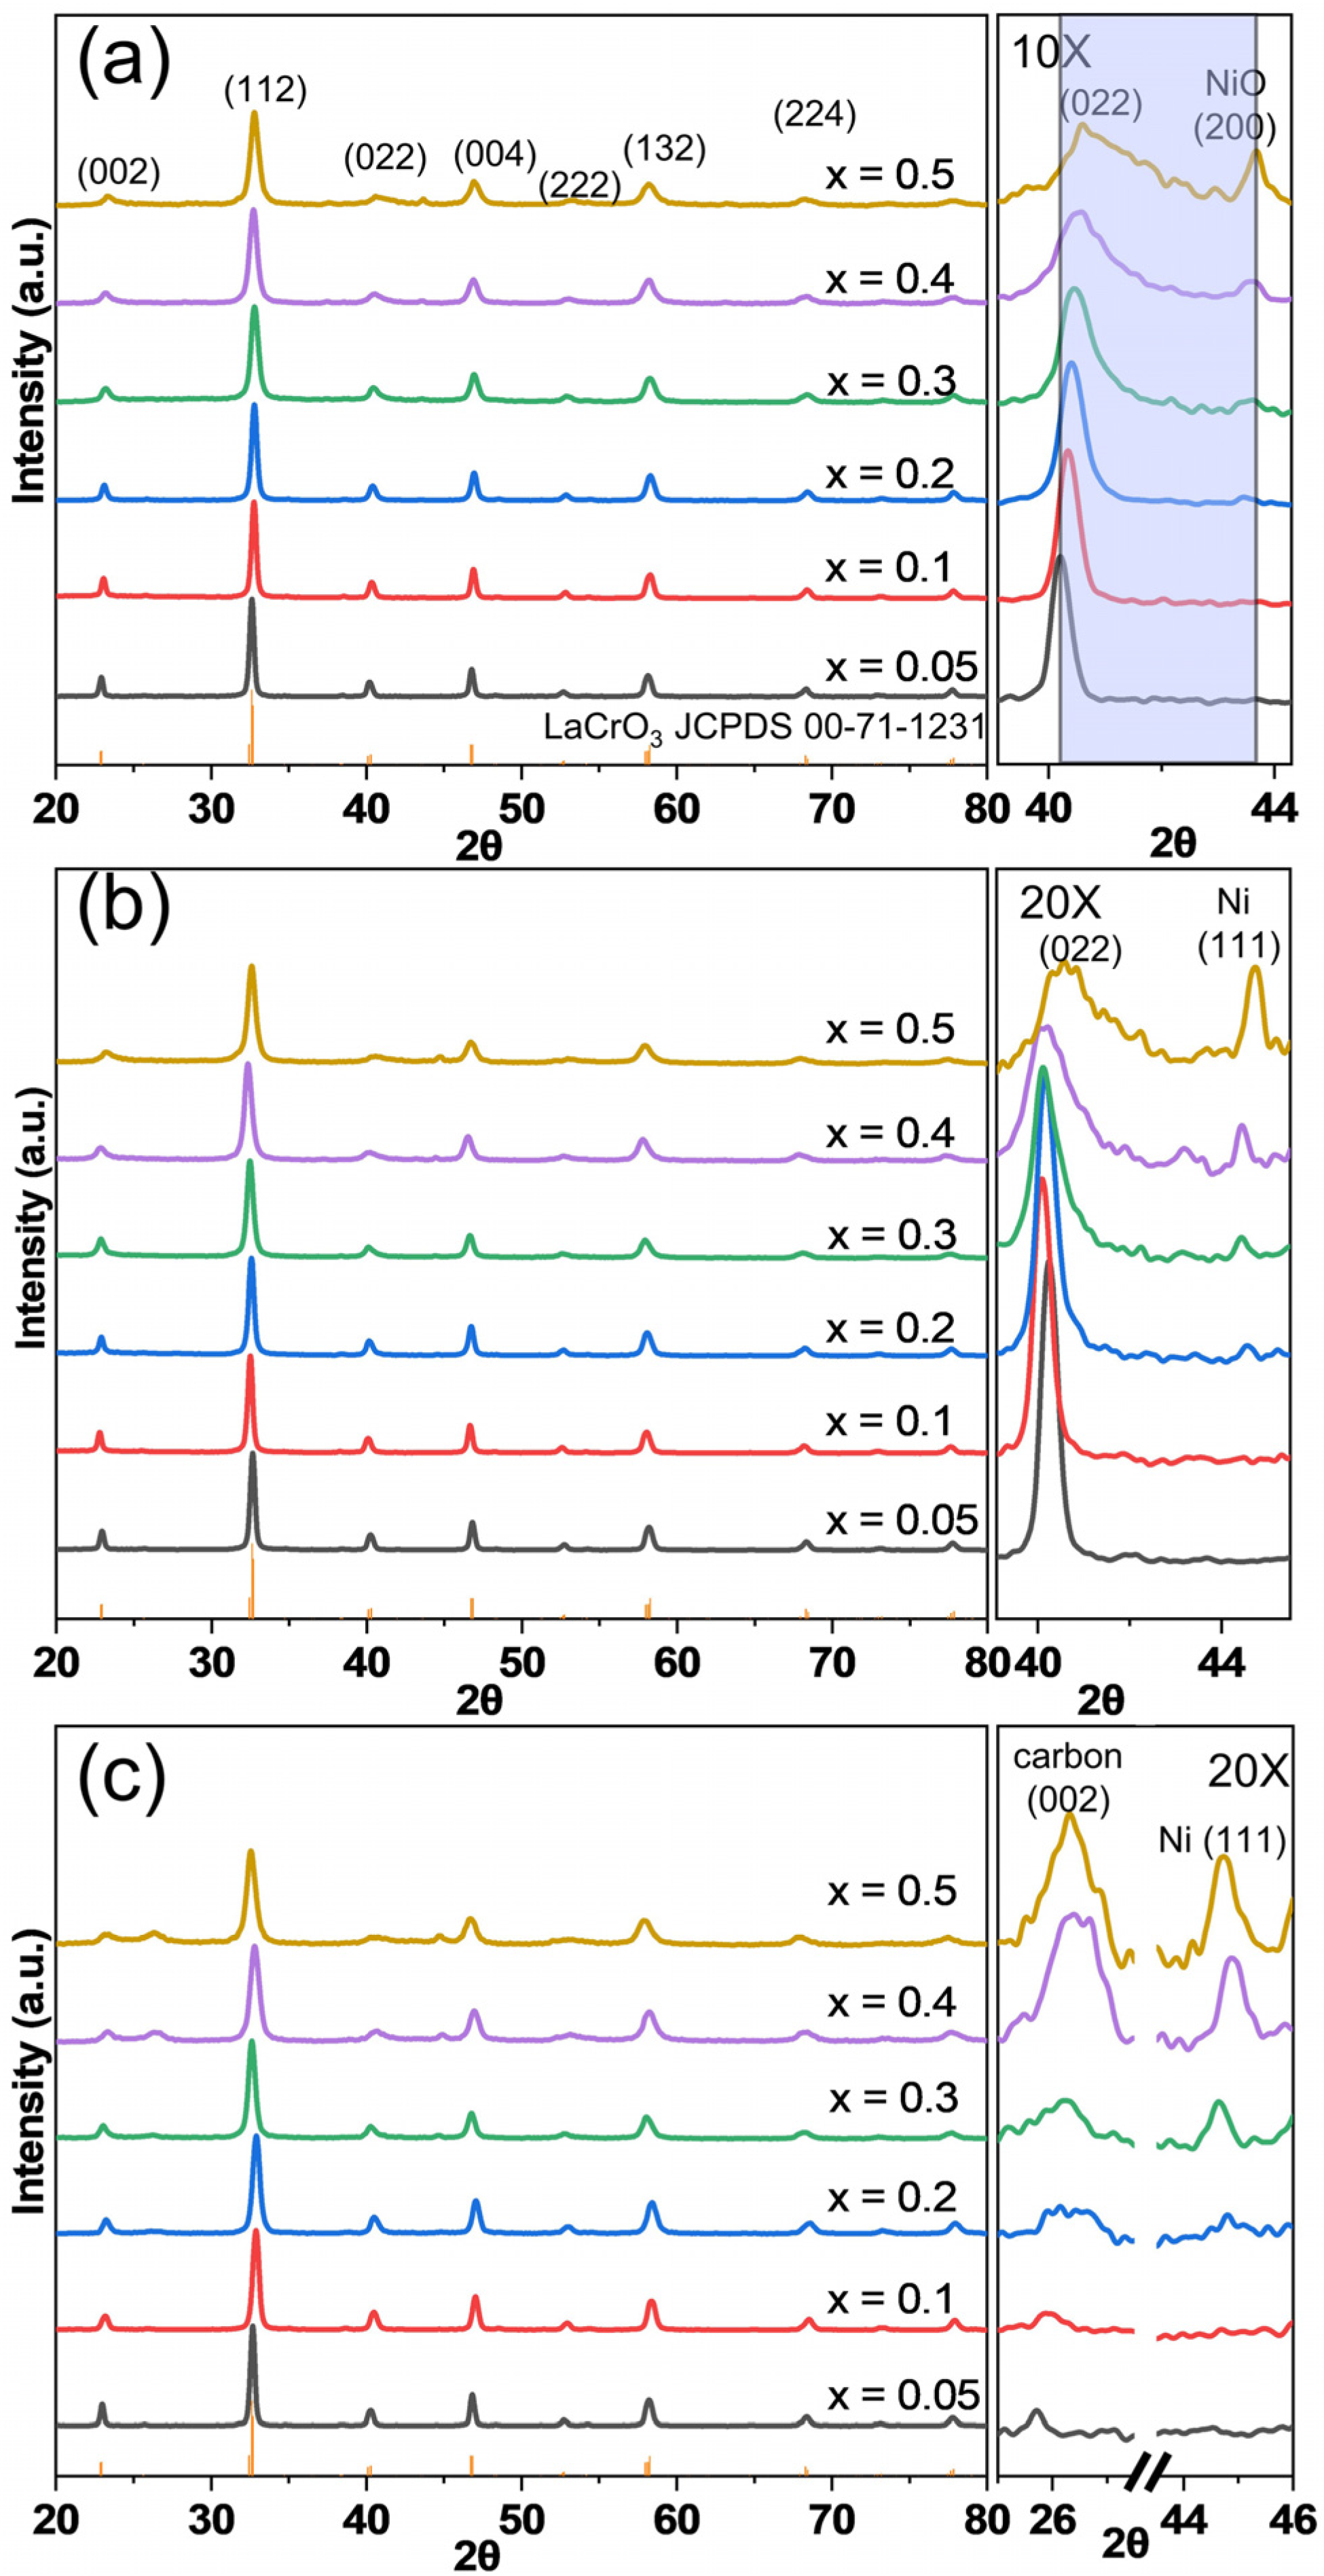
2.1. Crystalline Structure and Specific Surface Areas
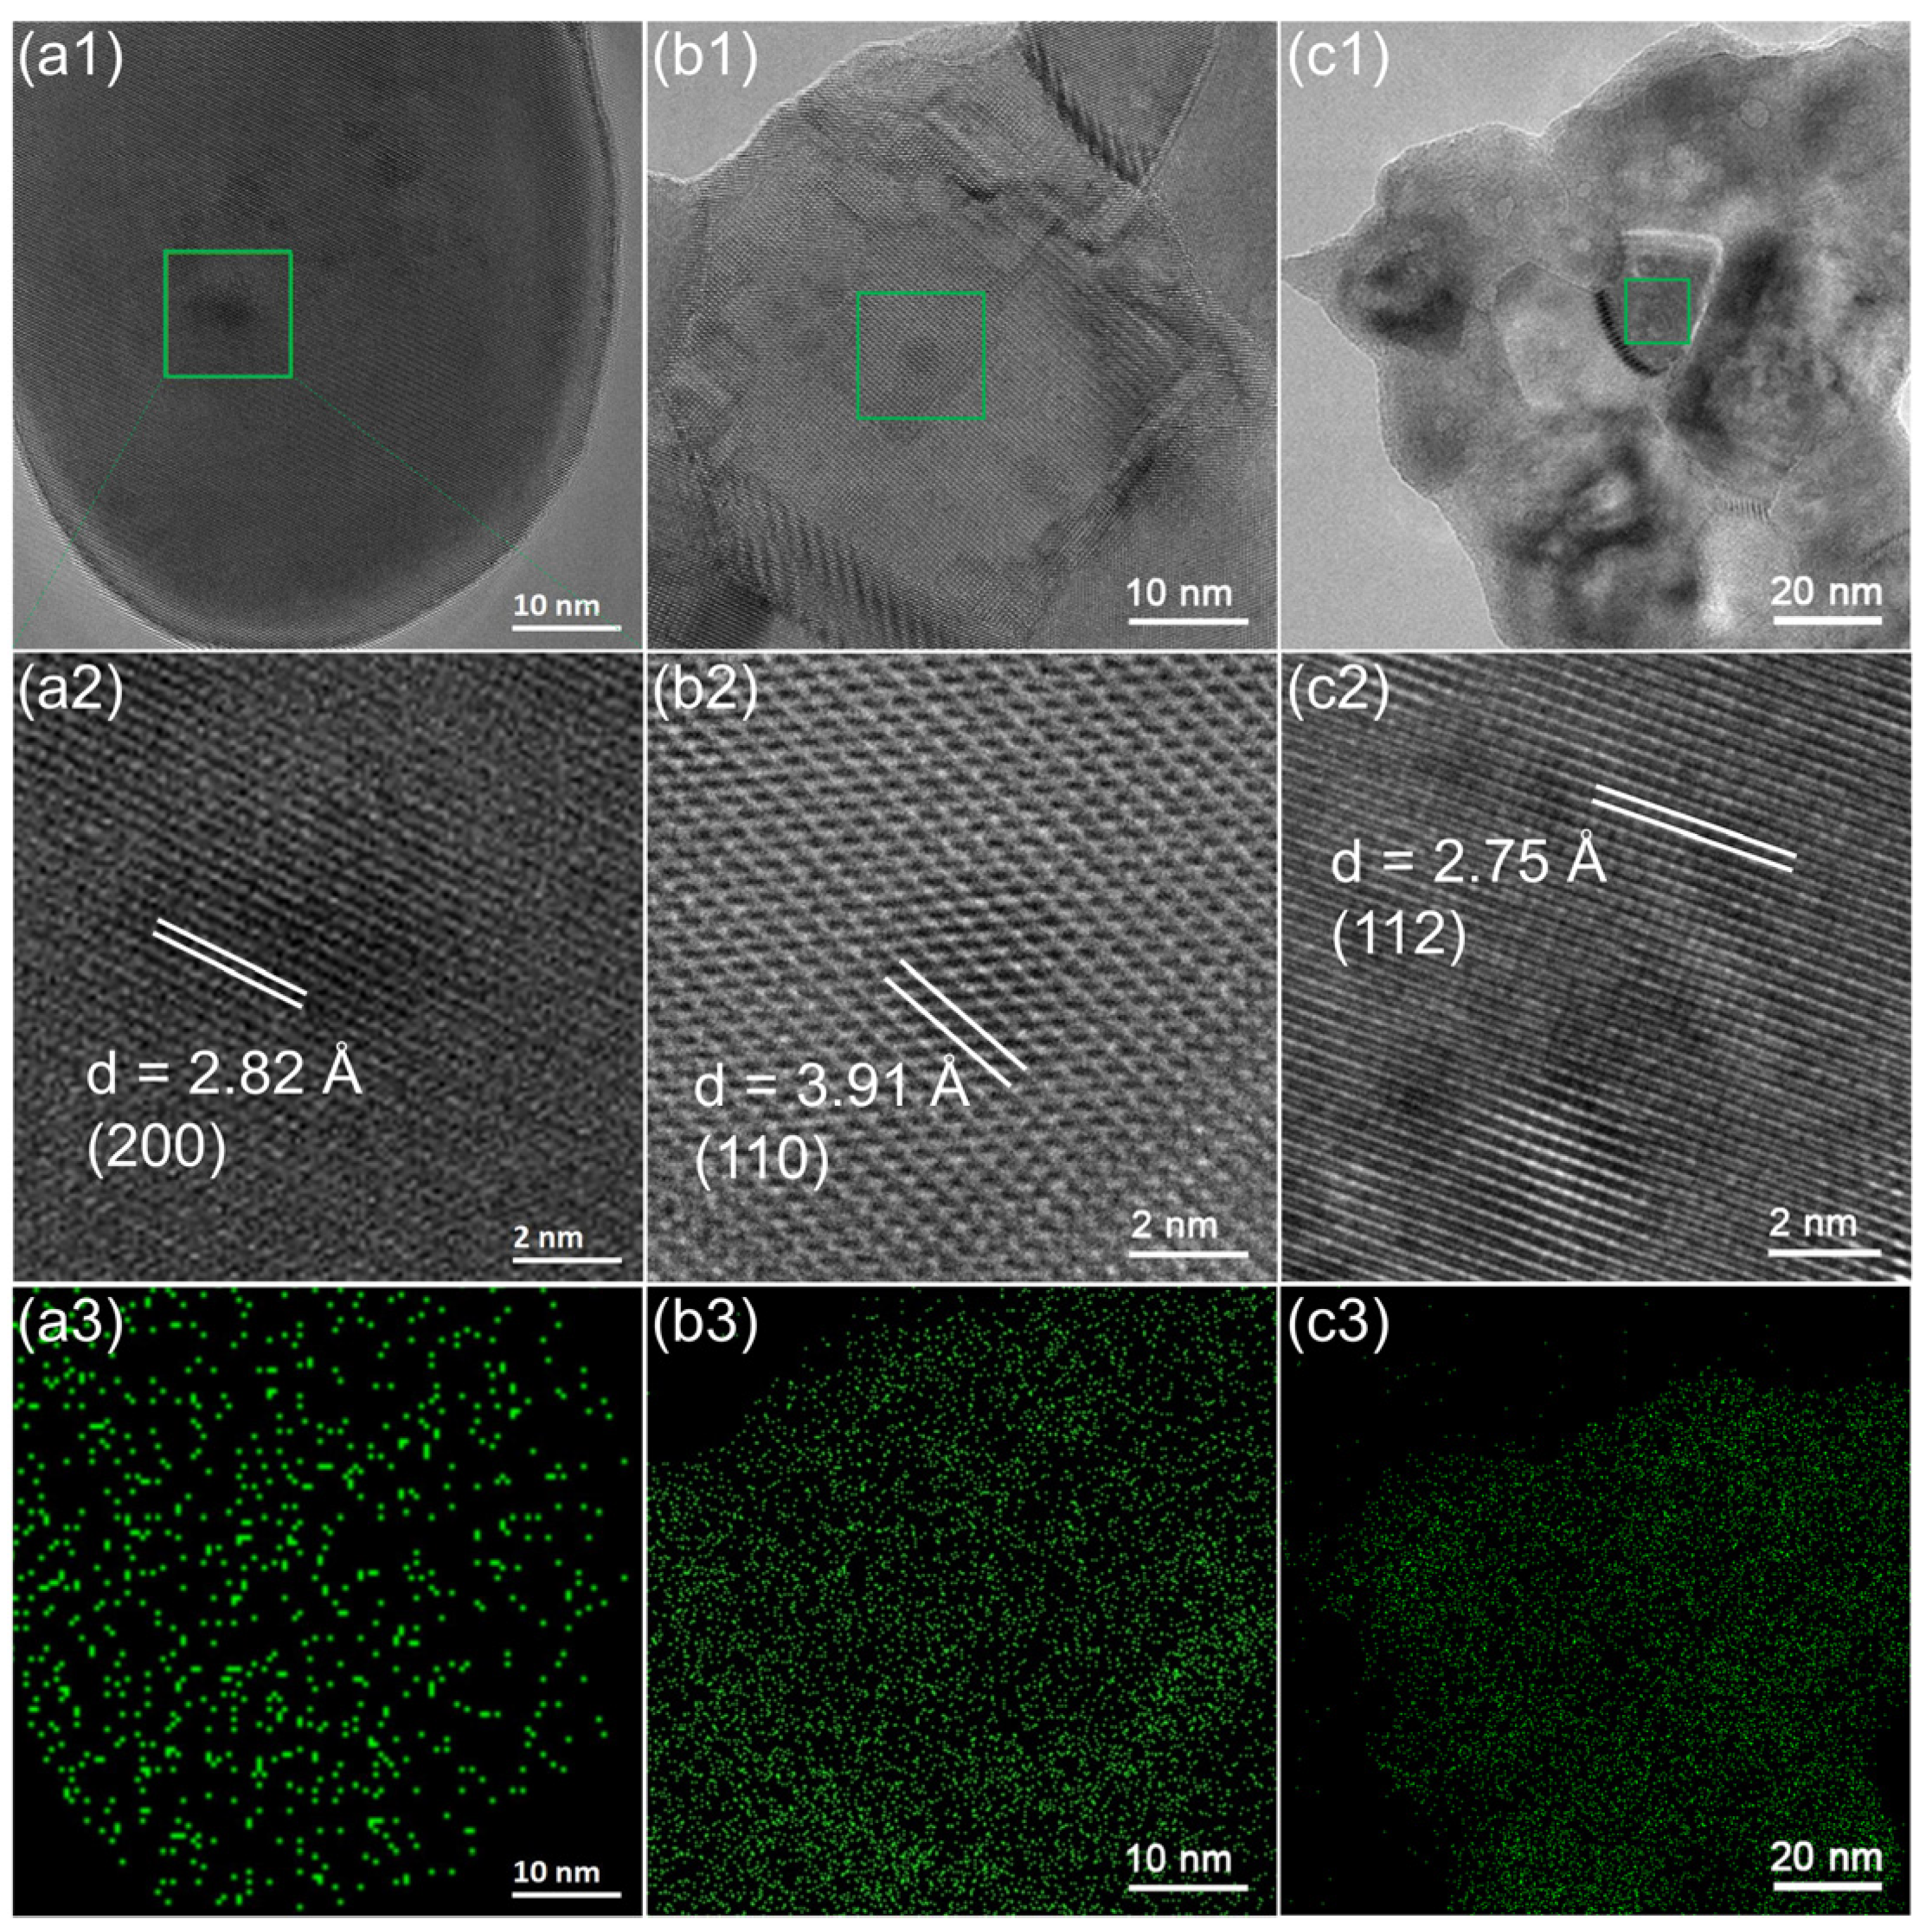
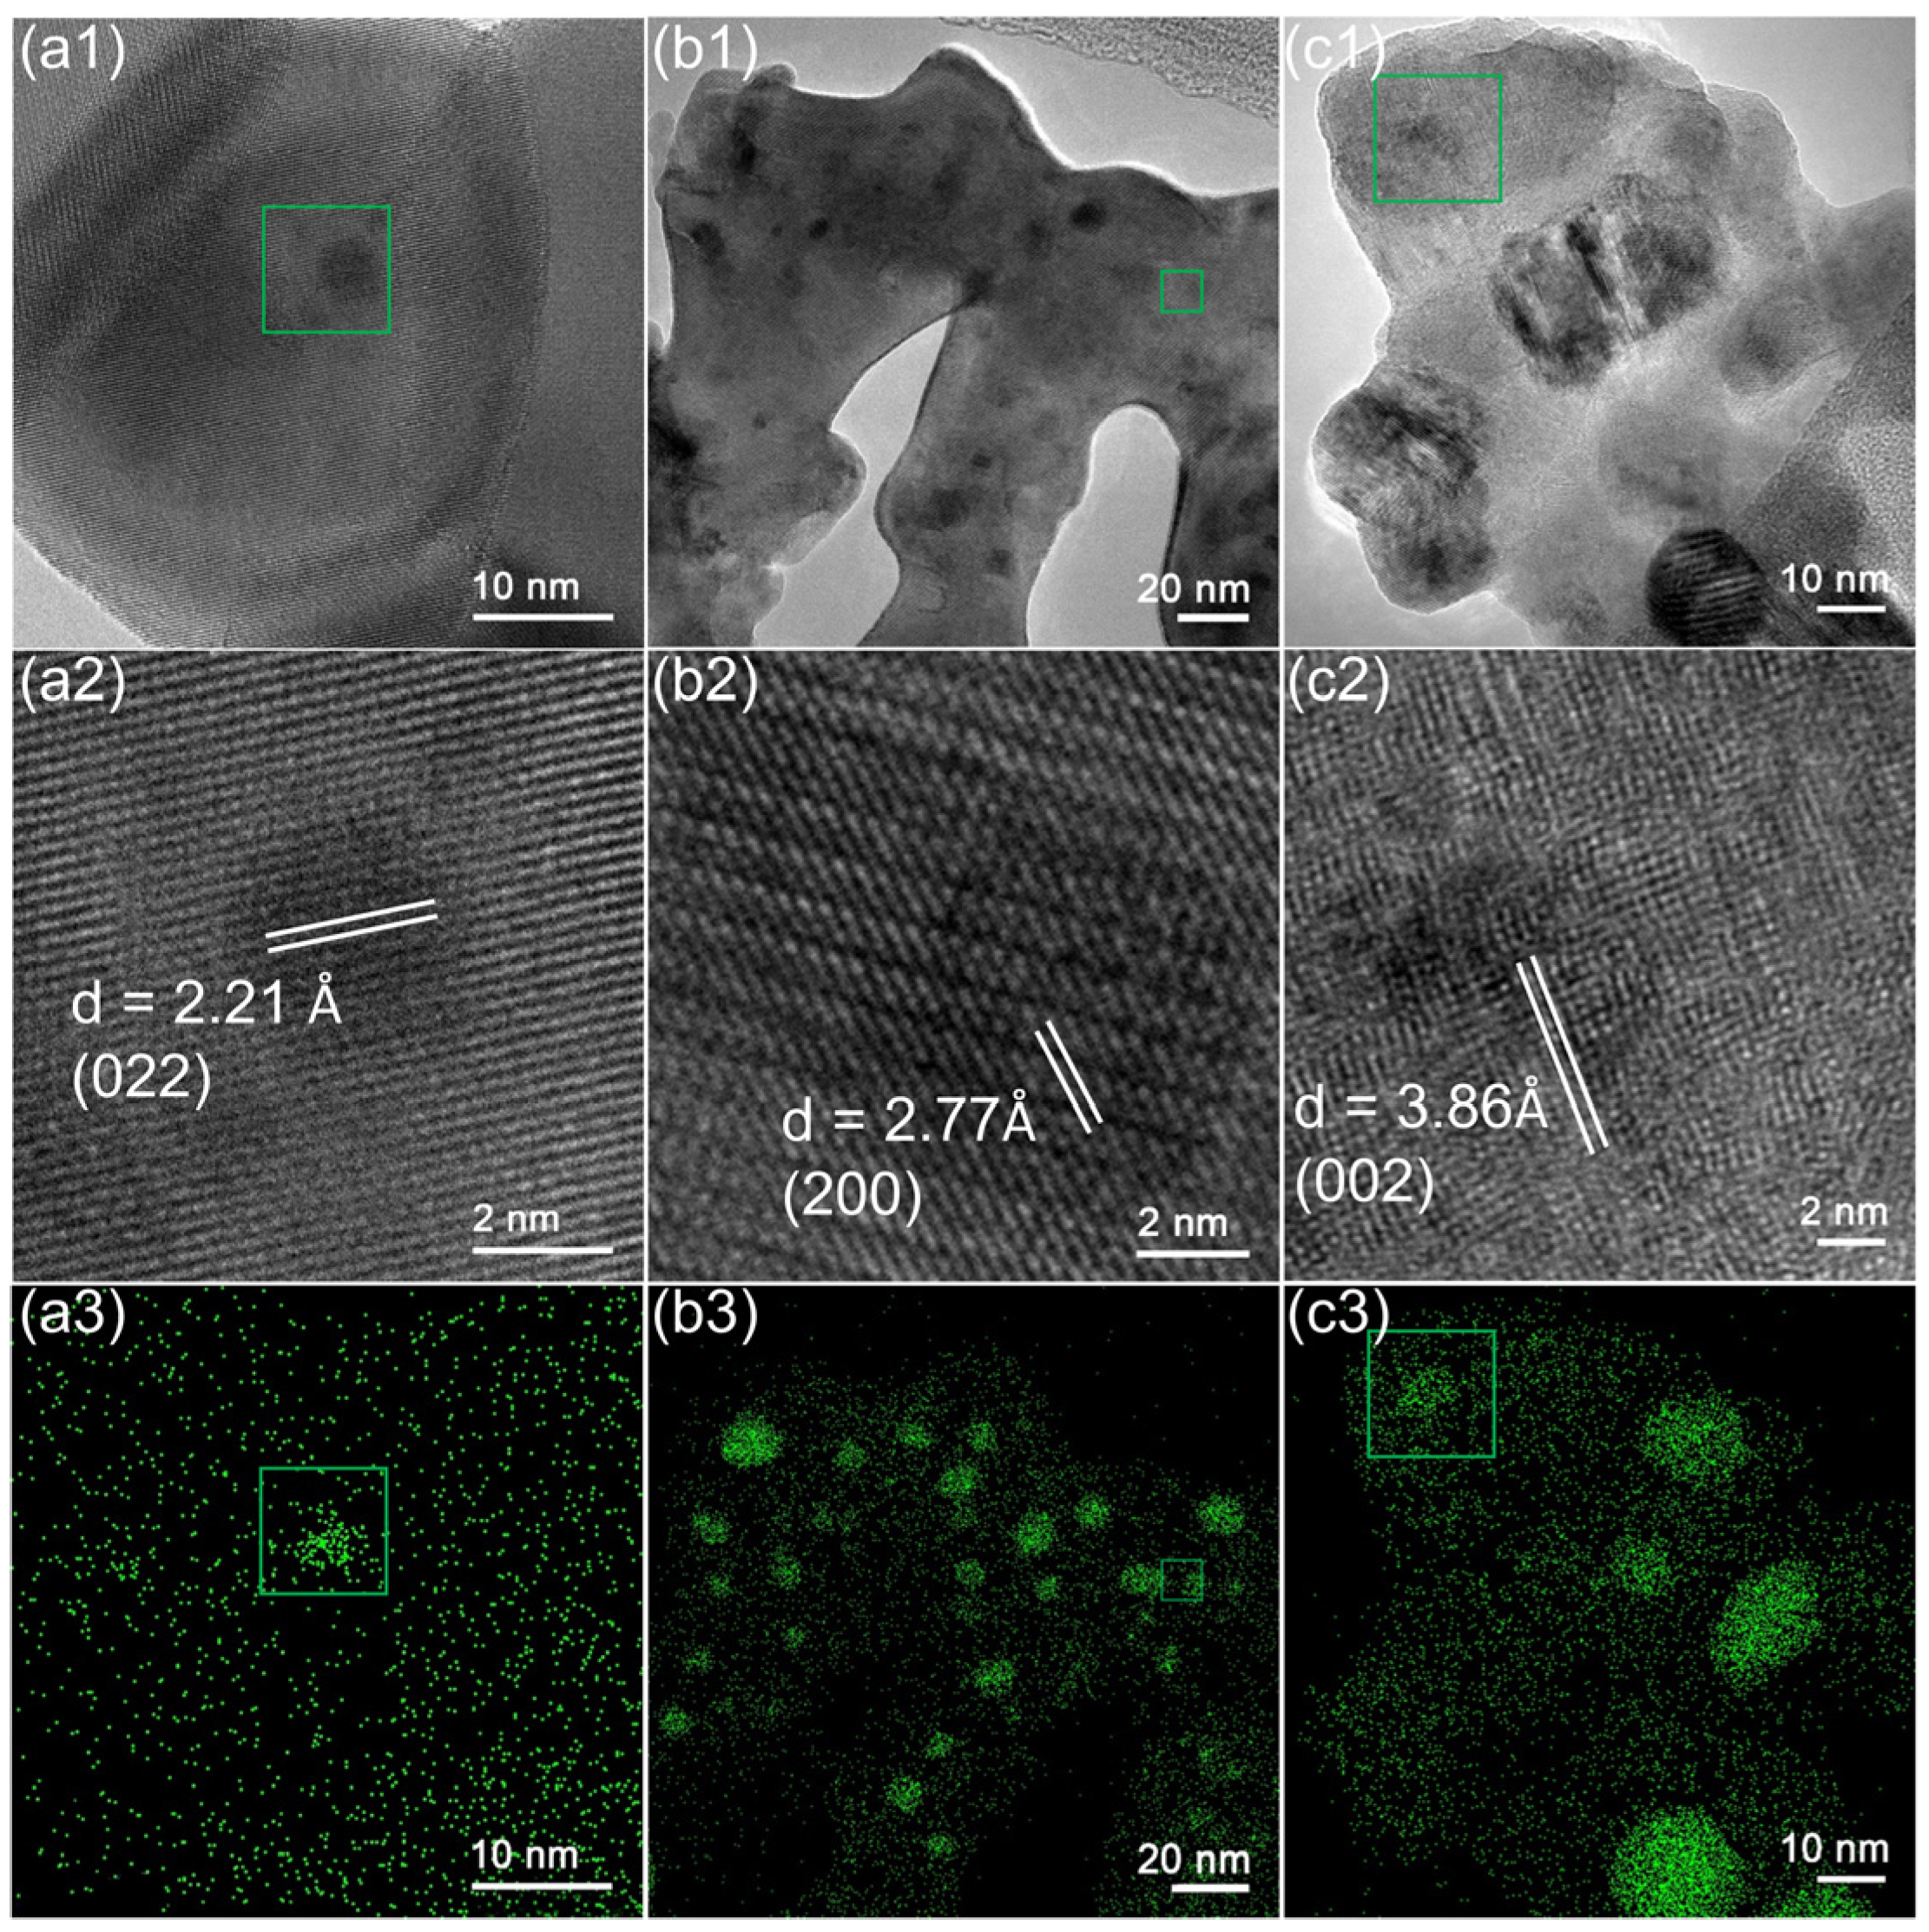
Figure 1a shows that the XRD patterns of all the fresh LaNixCr1−xO3 (x = 0.05–0.5) samples are dominated by a well-defined ABO3 perovskite phase with the space group of Pbnm (LaCrO3: JCPDS 00-71-1231). The peaks at approximate 22.9°, 32.6°, 40.1°, 46.7°, 52.6°, 58.1°, and 68.4° correspond to (002), (112), (022), (004), (222), (132), and (224) planes, respectively. The NiO phase appears as x increases to above 0.2, and the intensity of the NiO peak increases with x, indicating that the solubility of Ni cations in the perovskite is limited (see the right panel of Figure 1a). However, no La2CrO6, La2O3, or its derivatives can be detected, indicating that the perovskite is B-site deficient or that the La2O3 or its derivatives exist in an amorphous form. As x increases, the XRD diffraction peaks of the perovskite slightly shift to higher 2θ angles. For example, the (022) peak belonging to the perovskite becomes broadened and shifts slightly from 40.3 to 40.7° as x increases from 0.1 to 0.5 (see the right panel of Figure 1a), suggesting that the perovskite lattice shrinks as more Cr is replaced by Ni because the standard six-coordinate ionic radius of Ni3+ (0.60 Å) is smaller than that of Cr3+ (0.615 Å). This phenomenon agrees with that reported by Yang [30].
To understand the microstructural evolution of the catalysts induced by the H2 activation and DRM reaction, we examined the XRD patterns of the reduced and used catalysts. As shown in Figure 1b,c, the main features of the catalyst remain the same as those of the fresh catalyst. The perovskite phase dominates the XRD, and no La2O3 or its derivatives can be detected, indicating that the LaCrO3 perovskite structure is very stable. The Ni phase observed in the reduced and used samples with x ≥ 0.2 (shown in the right panel of Figure 1b,c, magnified by 20 times) comes from the reduction of NiO, as well as the Ni atoms exsolved from the LaNixCr1−xO3 perovskite. No Ni phase can be observed in the samples with x ≤ 0.1, which should be because of the very low Ni content or the Ni atoms being highly dispersed. The increased intensity in the XRD diffraction peak at approximately 26.3° for the x ≥ 0.2 used samples indicates that heavy carbon deposition occurred in the catalysts when the Ni loading was high (see the right panel of Figure 1c).
Table 1 shows the average crystallite sizes of the perovskite in the fresh, reduced, and used samples calculated by refining the (002), (112), (022), (004), and (132) XRD peaks with MDI Jade software. The average crystallite size of the fresh sample decreases with increasing Ni content. This is because the periodicity of the LaCrO3 perovskite lattice is disturbed by the doping of Ni atoms. The defects produced around the dopant may create charge imbalance and oxygen vacancies and introduce lattice strain, which in turn increase the amorphous nature leading to the decrease in the crystallite size [31]. As an increasing number of Ni ions are doped into the perovskite lattice, the increased concentration of solid defects impedes the grains from growing larger [32]. The same changing trend of the crystallite size with Ni content was also observed in the reduced and used samples. It is interesting to note that the average crystallite sizes of the used samples are smaller than the corresponding fresh ones even though they were sintered under DRM conditions at 750 °C for many hours. This should be related to the migration and aggregation of the point defects (zero dimension, 0D), such as Ni ions and O vacancies. These point defects may aggregate into larger ones, leaving behind aggregated defects inside the perovskite grains, such as dislocations (1D), grain boundaries (2D), or even microcracks, which make the crystalline grains smaller. It is also possible that Ni ions and O vacancies migrate from the inside of a LaNixCr1−xO3 crystalline grain out to the surface or interface, making the perovskite grain smaller and denser.
Different from the changing trend of the perovskite crystallite size determined by XRD, the BET-specific surface area of fresh LaNixCr1−xO3 samples is between 7–10 m2 g−1, and it did not show an increasing trend with the Ni content (see Table 2), indicating that the perovskite grains are polycrystalline, so the BET surface area did not change much. The relatively smaller BET-specific surface area is common for perovskite powders prepared by the sol–gel combustion method because the synthesis process temperature is high [33].

2.2. Microstructure

Figure 2 and Figure 3 compare some typical HR-TEM images and relative EDS mapping of Ni in the fresh and used LaNixCr1−xO3 samples for x = 0.1, 0.3, and 0.5. Both the fresh and used samples mainly consist of perovskite grains, which can be confirmed by matching the spacing between the fringes in the HR-TEM images to the d-spacing determined by XRD. Solid defects, including grain boundaries, can be found, especially in the samples with high Ni content, confirming that the perovskite grains are polycrystalline (see Figure 2c and Figure 3c). The EDS mapping images of the fresh samples (Figure 2 and Figures S1, S3, S5, and S6 in Supplementary Materials) show that La, Cr, Ni, and O elements are distributed homogeneously in the perovskite grains. Nevertheless, NiO grains can be observed in the fresh samples with high Ni contents (x = 0.3 and 0.5). These NiO grains are recognized in the regions with a brighter Ni signal and weaker Cr and La signals in the EDS mapping images, for example, see Figure S5 (x = 0.5). This observation agrees with our XRD analyses.
After the catalysts were used for DRM reactions, we can see many Ni-rich regions from the EDS mapping corresponding to the dark regions in the HR-TEM images (Figure 3b,c). The Ni-rich regions share the same lattice with the perovskite grains. It has been proven in our recent work that these regions are two-dimensional (2D) perovskite oxide, LaNiOΔ submonolayers (SML), which are highly active for DRM reactions [29]. The surface coverage of SMLs increases with x in the LaNixCr1−xO3 samples. In addition to SMLs on the surface of perovskite grains, we can also see many Ni metal particles and filamentous carbon in the samples with high Ni content (Figures S7 and S8, x = 0.5). Some of the Ni nanoparticles are detached from the perovskite grains by filamentous carbon, indicating that the filamentous carbon is very likely induced by the Ni nanoparticles and that the interaction between the metal Ni nanoparticles and the perovskite support is weak. No deposited carbon can be observed in the SML regions, suggesting that SMLs have a good anti-coking ability. Considering that the Ni ions in the SML are embedded in the perovskite-like oxide, we think the atomic-scale dispersion of Ni ions should help suppress the nucleation and growth of filamentous carbon, which is harmful to a DRM reaction.

2.3. Electronic Structure

Ni is the active element in the LaNixCr1−xO3 catalysts. The surface distribution of Ni and its interaction with neighboring atoms can be characterized by the surface-sensitive XPS technique. We use Ni 3p spectra for the characterization because the stronger Ni 2p XPS spectra overlap heavily with La 3d [34]. Figure 4a shows the Cr 3s and Ni 3p XPS spectra of fresh and used samples. As expected, the surface Ni content increases with x in both the fresh and used samples. It is noted that the surface Ni contents of the used samples are less than those of the corresponding fresh samples, indicating that some of the Ni atoms aggregated into large particles and that the lateral size of the metal Ni nanoparticles is larger than the probing depth (2–5 nm) of XPS [29].
The energy separation (ΔE) (Table 3) of the Cr 3s multiplet splitting spectra depends on the charge transfer between Cr and Ni atoms in the LaNixCr1−xO3 perovskite and has a positive correlation with the Ni content in B-sites of LaNixCr1−xO3 [29]. ΔE increases with x in the fresh samples, indicating that the Ni content in the perovskite phase increases, and some of the Ni atoms may even exist in the NiO phase, as evidenced by the above XRD analyses. The ΔE of the used samples is smaller than that of the fresh samples, indicating that some of the Ni atoms are exsolved from the perovskite phase.
Figure 4b shows the Cr 2p XPS spectra of fresh and used samples of x = 0.1, 0.3 and 0.5. The strong spin–orbit interaction splits the Cr 2p main peaks into Cr 2p3/2 and Cr 2p1/2 doublets separated by ~10 eV. The Cr 2p spectra of the fresh sample show two sets of Cr 2p doublets that belong to Cr3+ and Cr6+, respectively. The peaks located at approximately 576 eV (Cr 2p3/2) and 585 eV (Cr 2p1/2) can be ascribed to Cr3+, while the peaks located at approximately 580 and 589 eV arise from Cr6+ [35,36]. Although the Cr6+ XPS peaks in the fresh samples are prominent, especially in the samples with high Ni content, we did not detect any Cr6+ compounds in the XRD (see Figure 1). This is because La2CrO6 mainly exists on the surface of the perovskite, which can easily be detected by XPS [37].
Cr6+ increases with Ni content in the fresh catalysts should be related to the charge disproportion effect in the perovskite [38]. In the fresh catalysts, Ni3+ and Cr3+ occupy the B-site of perovskite LaNixCr1−xO3 and are stabilized by the BO6 octahedral crystal field. However, Ni3+ tends to become Ni2+ because Ni2+ is a stable oxidation state of Ni. The reduced Ni oxidation state will in turn drive the Cr3+ to Cr6+ to keep charge neutrality in the perovskite. This charge disproportion effect is more likely to happen at the surface region because the surface lattice relaxation weakens the crystal field, and thus reduces the stability of Ni3+ and Cr3+. This explains why the Cr6+ is sensitive to XPS but not XRD, as well as why Cr6+ increases with Ni content in the fresh catalysts.
After the DRM test, most of the Ni atoms are exsolved from the perovskite lattice out to the surface, and thus the charge disproportion effect between Ni and Cr no longer dominates the oxidation state of Cr. What is more, the DRM atmosphere is a relatively reducing atmosphere (with H2 and CO in the product). Thus, no Cr6+ can be observed by XPS in the used catalysts because it is reduced to Cr3+.
Figure 4c shows the O 2p XPS spectra of the fresh and used LaNixCr1−xO3 samples with x = 0.1, 0.3 and 0.5. The peak around 529 eV, denoted as Olat, can be assigned to lattice oxygen (O2−) in the perovskite and NiO oxides, while the peak around 531 eV, denoted as Oads, comes from surface adsorption oxygen species and other hydroxyls (OH) and carbonate species (CO32−), whose intensity reflects the concentration of oxygen vacancy in the perovskite [39,40]. The surface oxygen species usually relate to defects/oxygen vacancies since they can act as absorption centers [41]. The peak at about 533 eV is usually considered to be correlated to adsorbed molecular water [42]. The area ratio of Oads/Olat (Table S1) in the XPS spectra increases with the Ni content in the fresh samples, suggesting that there are more oxygen vacancies in the samples with high Ni content. Or in other words, δ in LaNixCr1−xO3−δ increases with x, indicating that the perovskite becomes more oxygen deficient as more Ni atoms are doped. The used samples show a smaller Oads/Olat ratio as compared to the fresh ones, indicating that some oxygen vacancies migrated out of the perovskite with the exsolvement of Ni atoms. It is reported the active oxygen species related to the oxygen vacancies help reduce carbon deposition [43]. However, as we see in Figure 4c and Table S1 that the Oads/Olat ratio in the used samples increases with Ni content, while we know from the XRD, TEM, and TPO (will be discussed later) analyses that carbon deposition is more severe in the high Ni content samples. Thus, the increases in Oads/Olat ratio cannot compensate for the increased carbon deposition trend that resulted from the increase in Ni loading.

2.4. Reducibility

Figure 5 shows the TG and DTG profiles of fresh LaNixCr1−xO3 samples obtained by H2-TPR measurements. The TG profiles show that the samples are reduced in two steps. The first step is between 200 and 360 °C, and the second step is between 370 and 570 °C. Correspondingly, two well-resolved peaks are observed in each of the DTG profiles. Based on the above XRD analysis and literature survey [44,45] we can assign the low-temperature reduction step to the reduction of Ni3+ to Ni2+ in the LaNixCr1−xO3 perovskite and the high-temperature step to the reduction of NiO to Ni. Thus, we see that both the Ni content in the perovskite and the amount of NiO increase with x in the LaNixCr1−xO3 samples, and the Ni content in the perovskite is higher than that in NiO. It is also noted that no clear reduction step corresponding to the reduction of Ni2+ to Ni0 in the LaNixCr1−xO3 perovskite can be resolved up to 900 °C in the TPR profiles, indicating that Ni2+ is rather stable in the perovskite and difficult to reduce to Ni0. Stojanović et al. [45] reported that LaNixCr1−xO3 compounds with x < 0.5 did not reduce to nickel metal in an H2 atmosphere at <900 °C. Nevertheless, the slowly decreasing trend in the TG profiles in the high-temperature section suggests that at least some of the Ni2+ cations in the perovskite were gradually reduced to Ni0 at high temperatures.

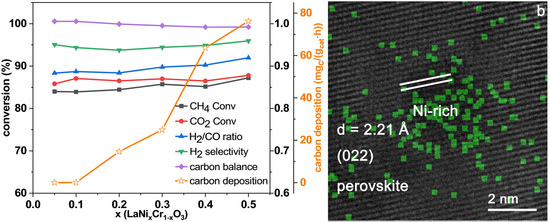
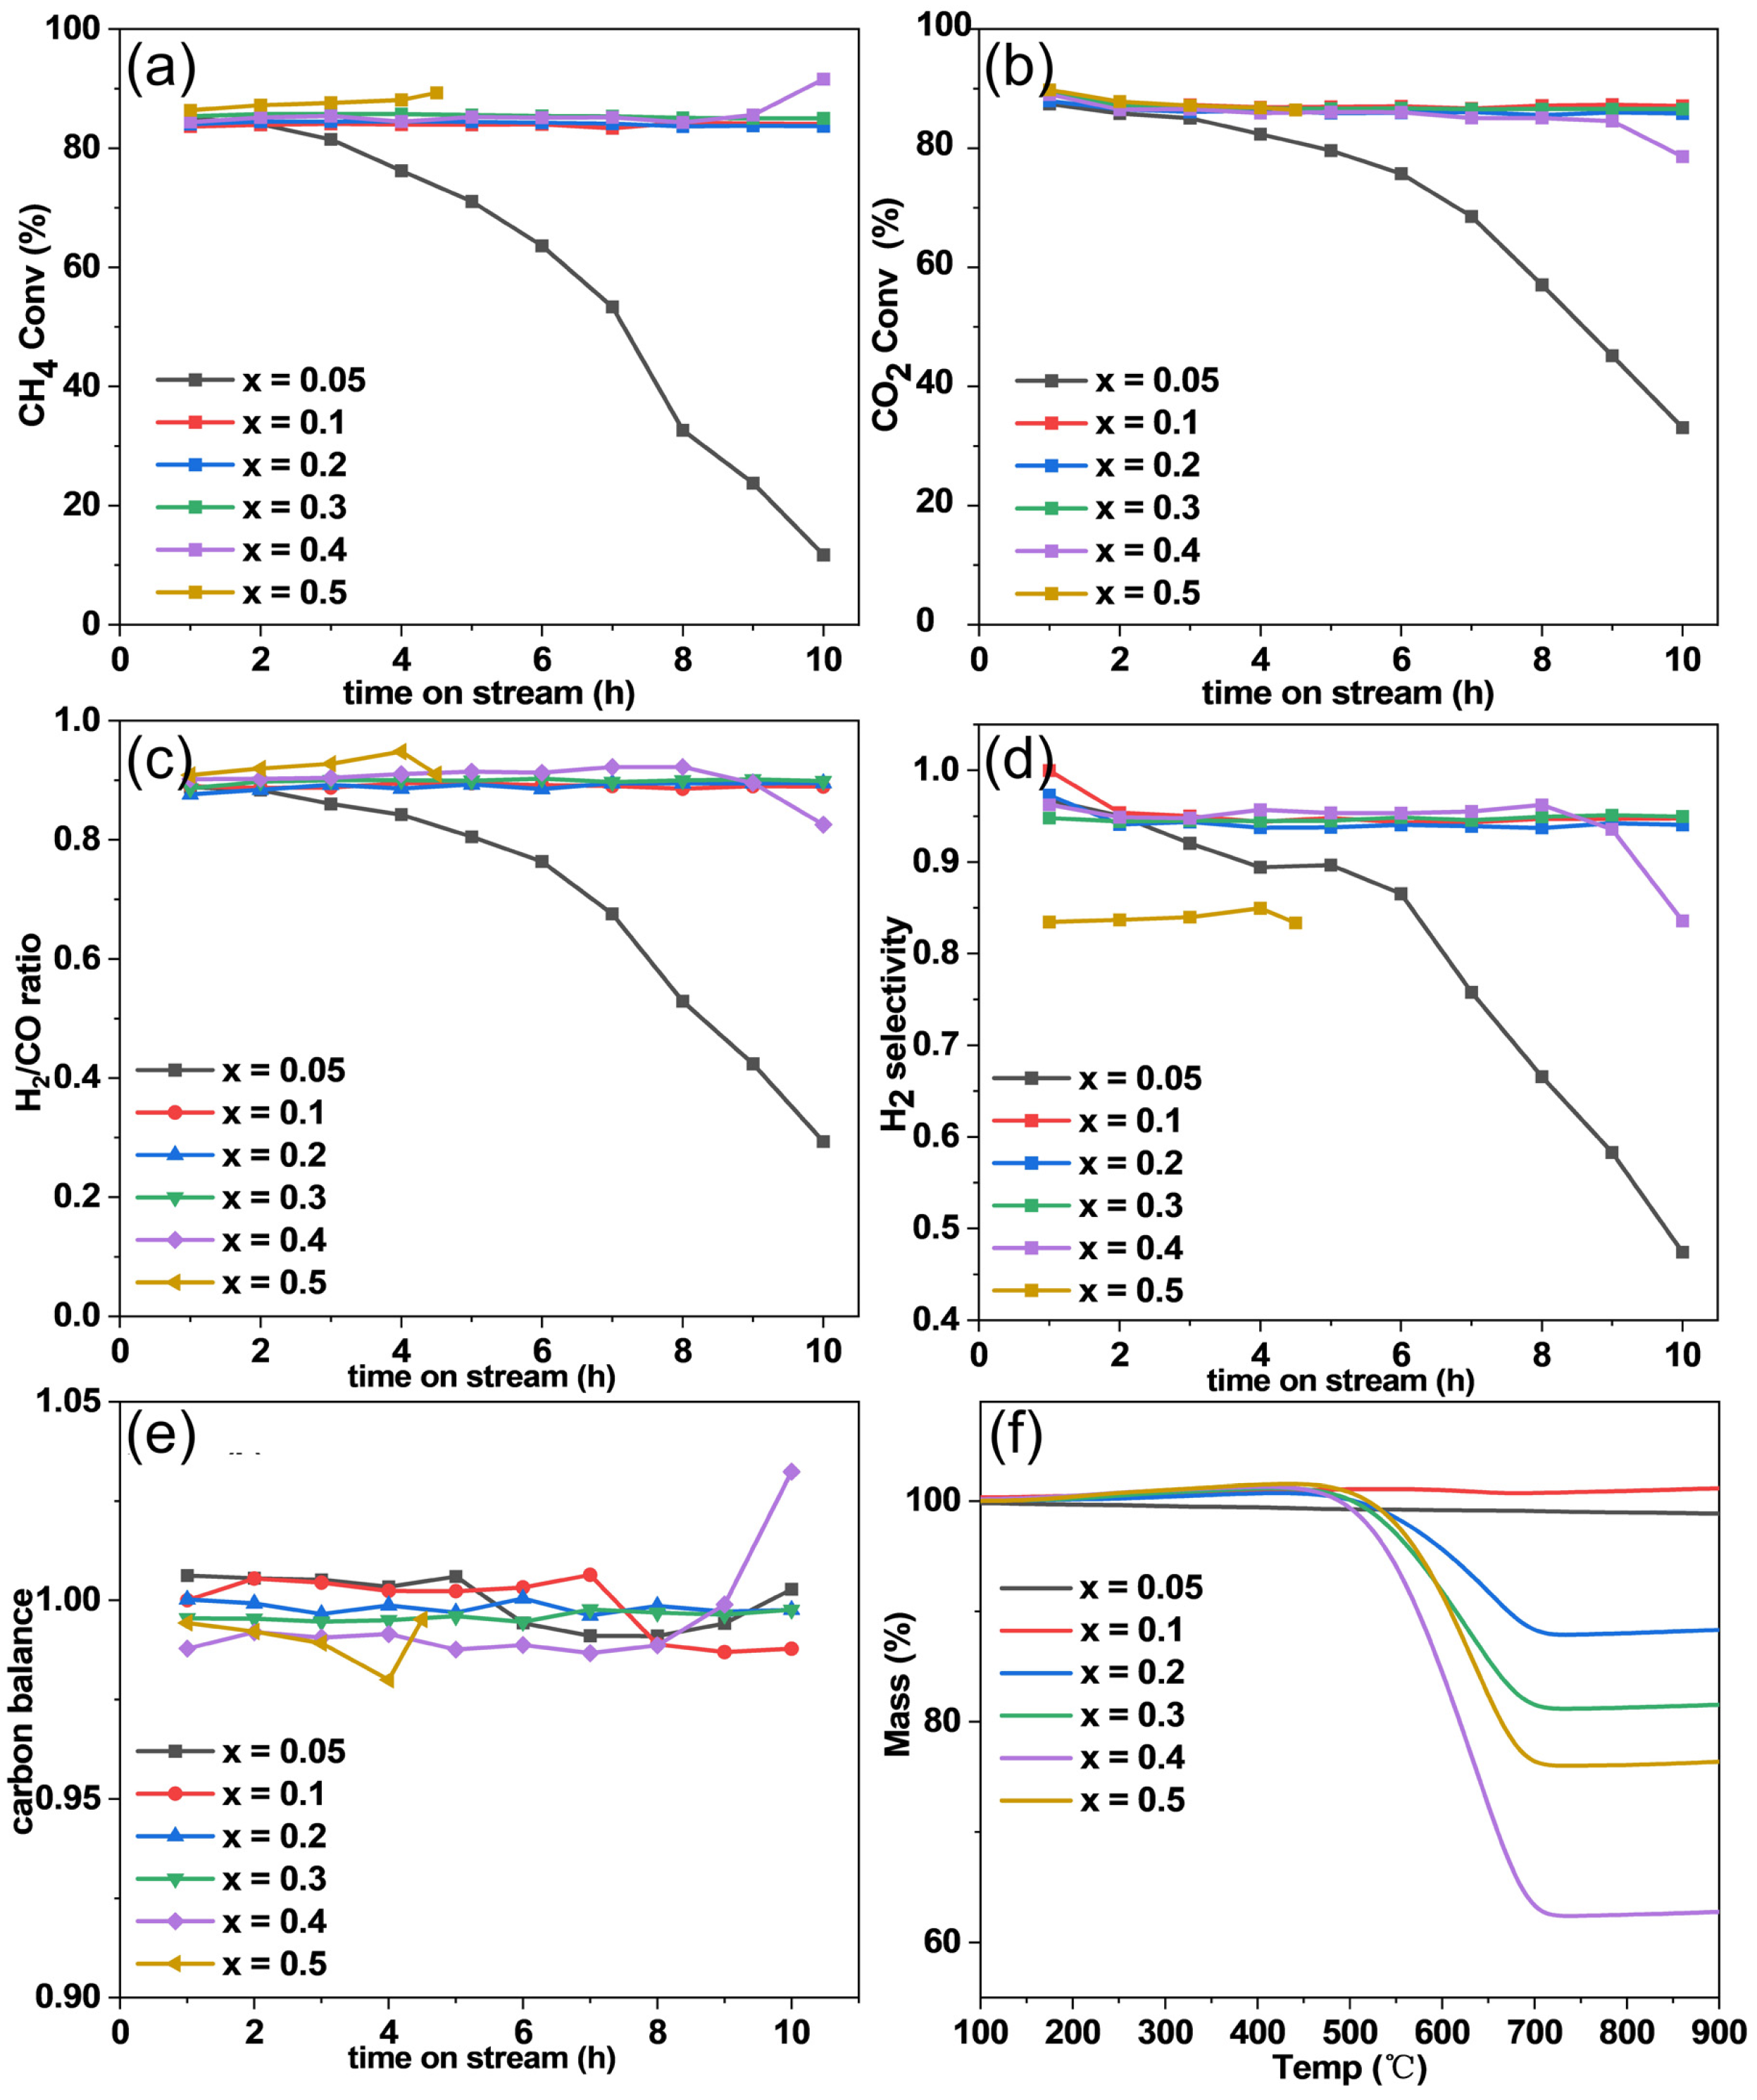
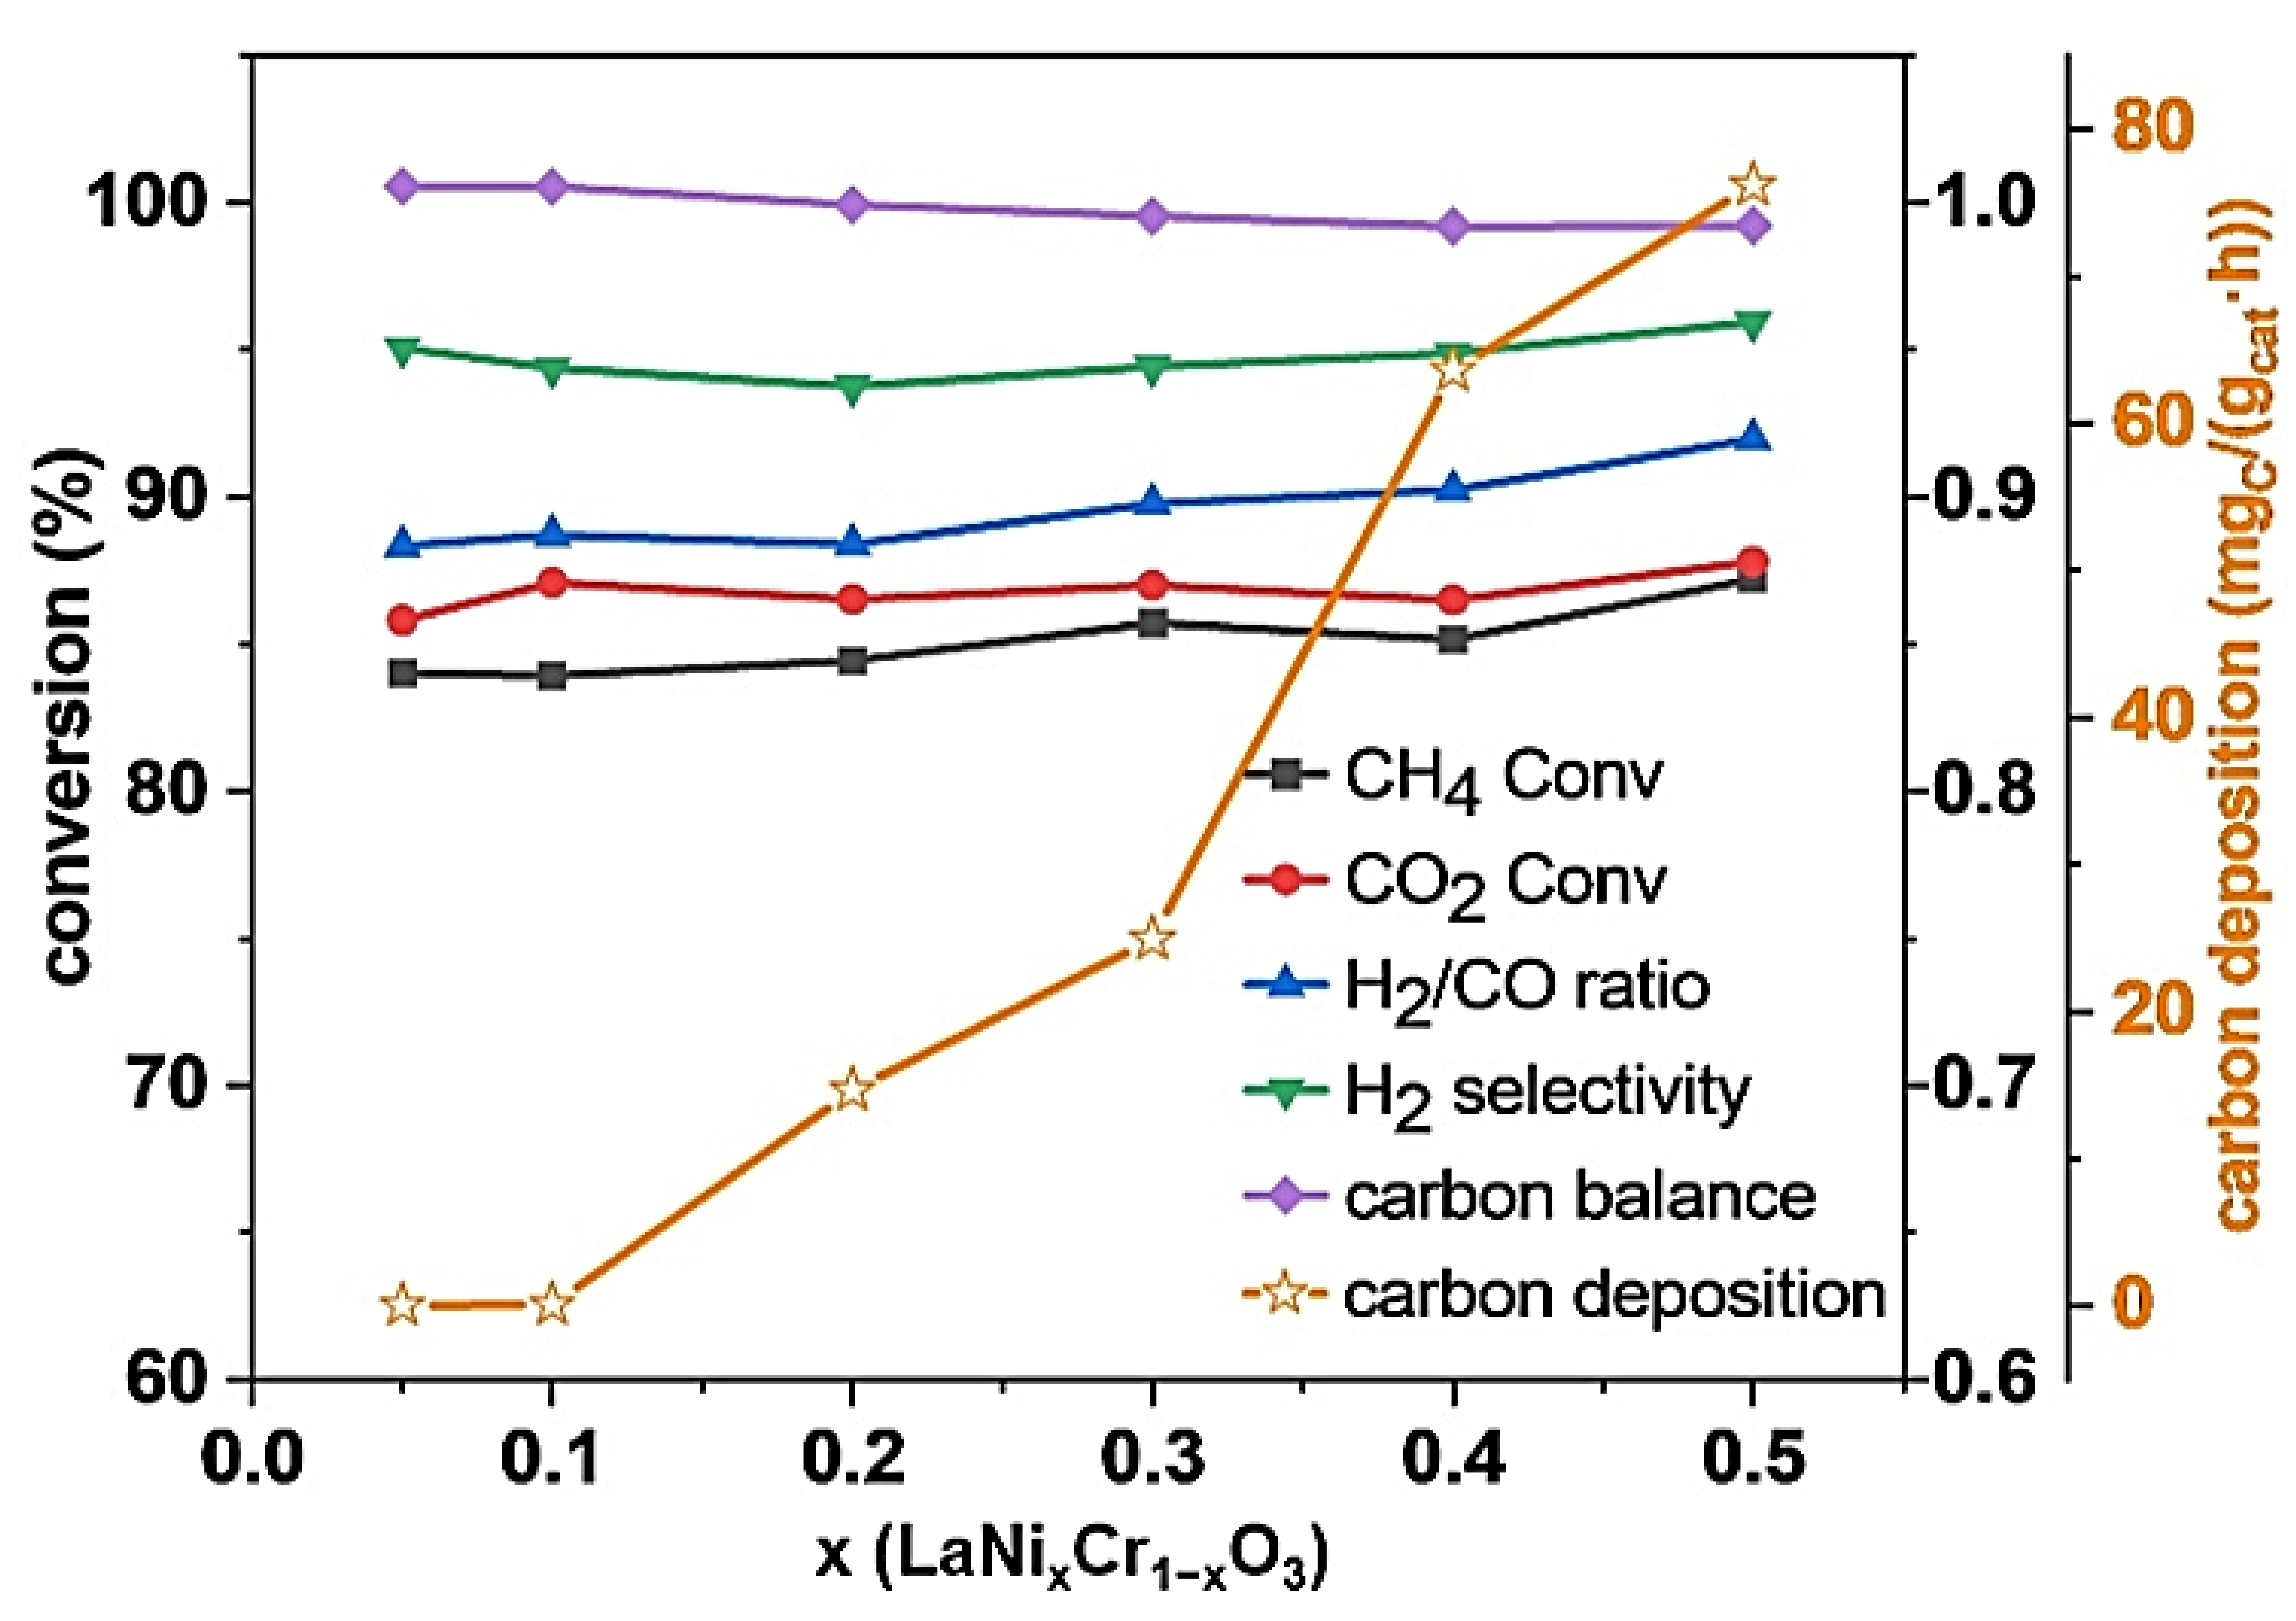
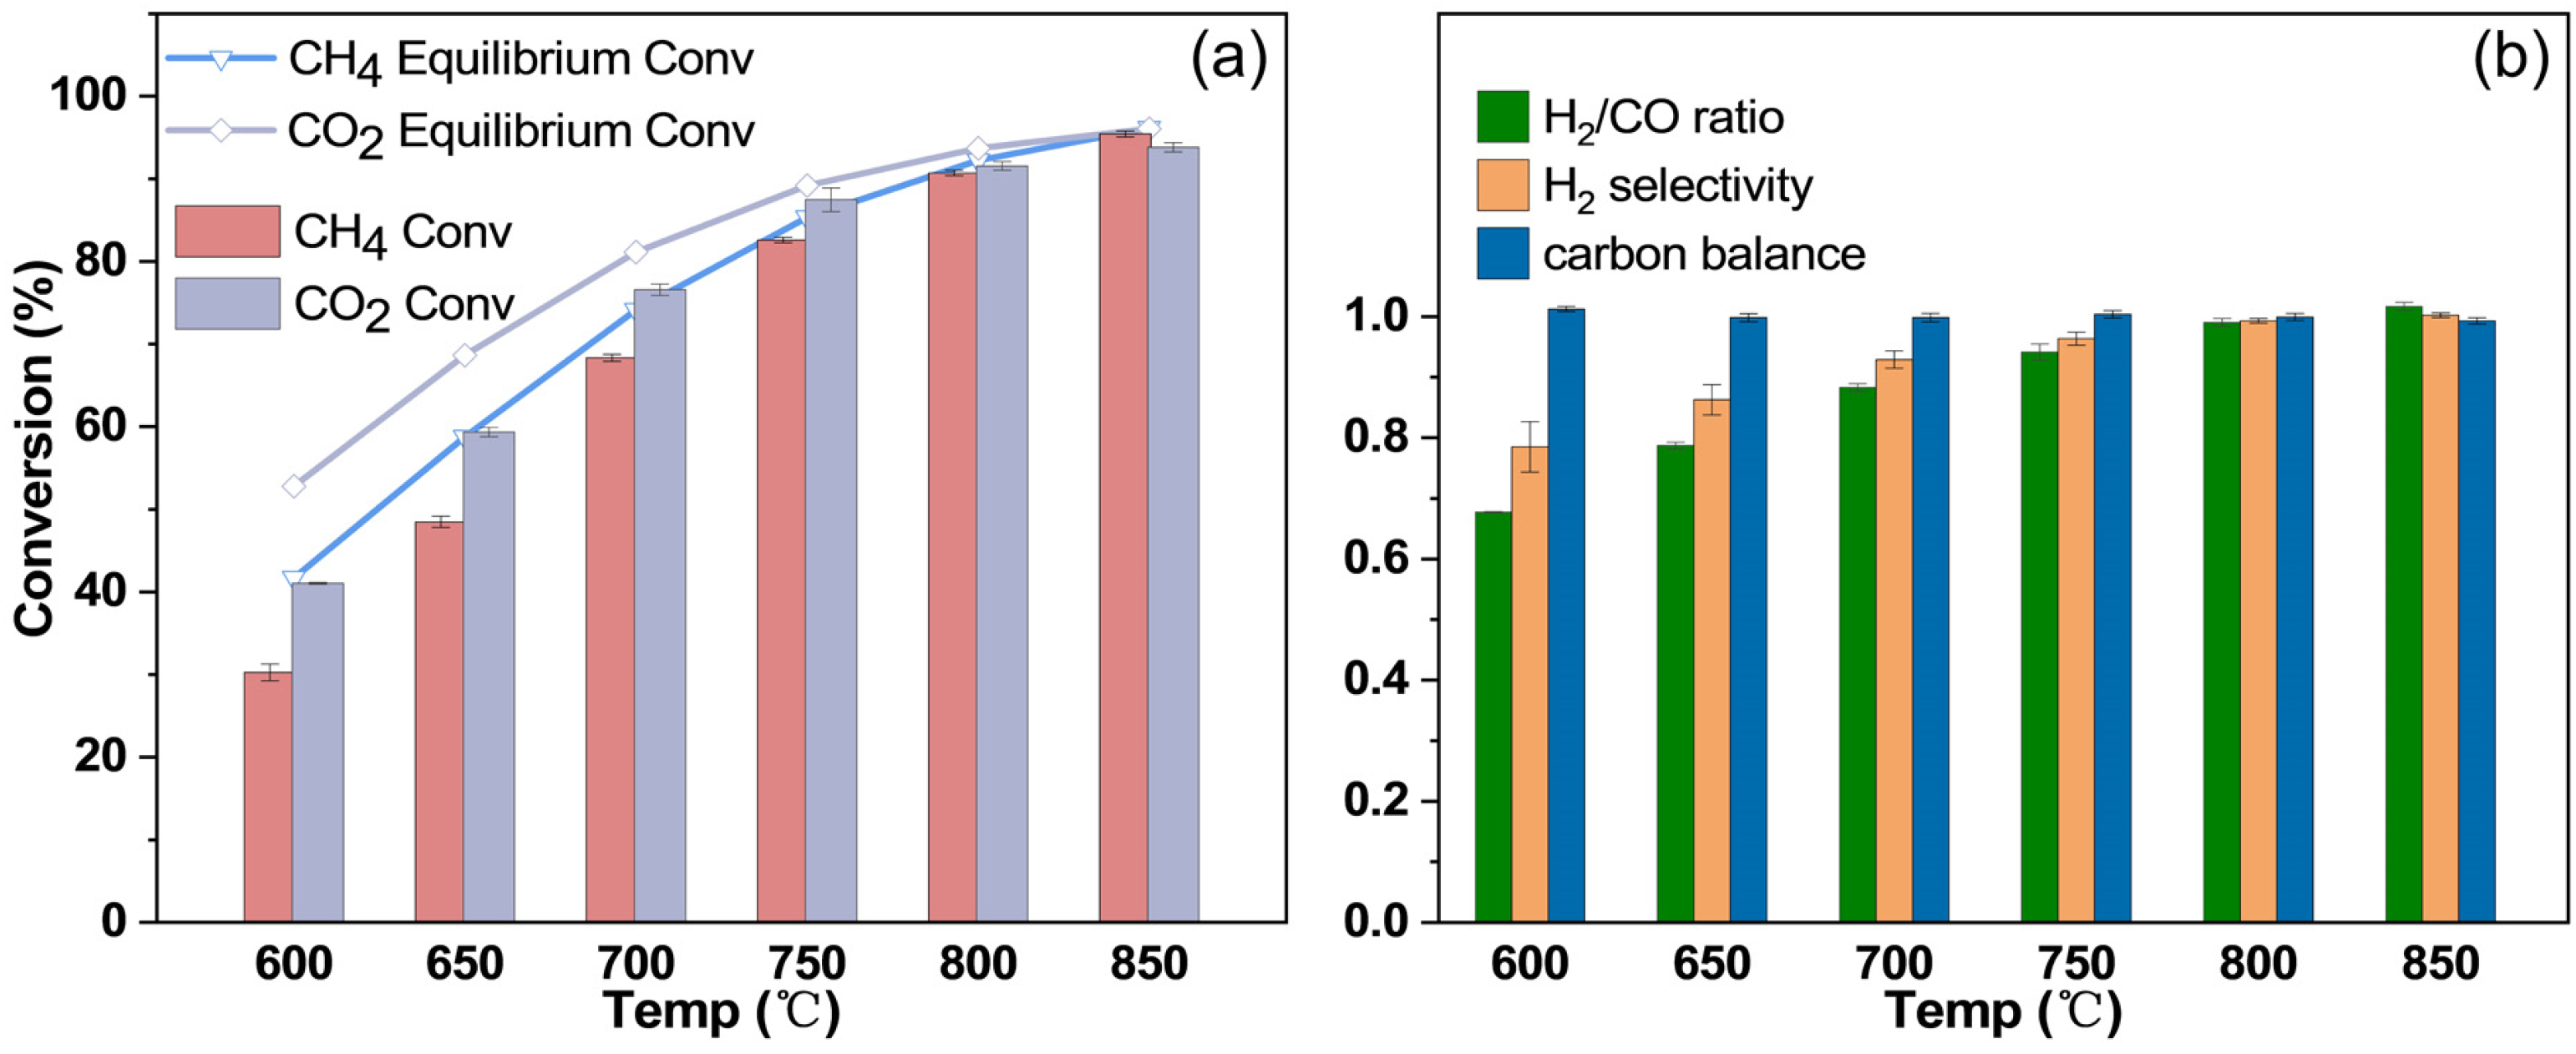
2.5. Catalytic Performance

Figure 6a,b shows that for the x = 0.1–0.3 samples, the CH4 and CO2 conversions are stable within the 10 h on stream test. When the Ni loading is very low (x = 0.05), the CH4 and CO2 conversions show a decreasing trend. Nevertheless, the very high initial activity of the x = 0.05 samples indicates that the dispersion of Ni atoms on the catalyst surface is very high. The fast drop in the activity of the x = 0.05 sample should be because the Ni-support interaction is not strong enough to prevent the migration and aggregation of the highly dispersed Ni atoms [29]. Similar quick deactivation behavior in very low Ni loading catalyst was also observed in Ni/CeO2 [46]. On the other hand, when the Ni loading is too high (x = 0.4 and 0.5), the DRM reaction fails to proceed long because of the blockage of the fixed bed reactor by carbon deposition. The CH4 conversions over the x = 0.4 and 0.5 samples increase sharply at the end of the test, indicating that the CH4 decomposition side reaction dominates the carbon deposition side reactions. The H2/CO ratio, H2 selectivity, and carbon balance are also shown in Figure 6c–e, which will be discussed later. The mass loss in the TPO profiles (Figure 6f) between approximate 500–700 °C reflects the amount of deposited carbon, which increases remarkably with Ni content.
To investigate the influence of Ni loading on the catalytic performance, we compared the CH4 and CO2 conversions, H2/CO ratio, H2 selectivity, and carbon balance of the x = 0.05–0.5 catalysts at 2 h on stream (Figure 7). The CH4 conversion slightly increases from 83% to 87% as the Ni loading increases from x = 0.05 to 0.5, implying that a higher Ni loading is favorable for the main DRM reaction. The CO2 conversion shows the same changing trend as that of CH4 conversion but is a little higher than the CH4 conversion owing to the RWGS side reaction. Meanwhile, the H2/CO ratio also increases from 89% to 92%. The H2/CO ratio for all the samples is smaller than 1 because of the RWGS side reaction (H2 + CO2 = CO + H2O), which consumes H2 and generates an extra amount of CO. The H2 selectivity, which depends on the H2 supply from the converted CH4 and the amount of H2 consumed by the RWGS reaction, is around 95% for all the catalysts. The carbon balance is very close to 1 but shows a slightly decreasing trend with increasing Ni content due to carbon deposition. The carbon deposition rate of the catalysts can be more precisely determined from the TPO results (see Figure 6f) and is also illustrated in Figure 7. The carbon deposition rate shows a monotonous and quick increase from 0.02 mgC gcat−1 h−1 (x = 0.05) to 76.2 mgC gcat−1 h−1 (x = 0.5) with increasing Ni loading. Thus, the x = 0.1 sample is preferred because it has a relatively low Ni loading (2.5 wt%) and shows high catalytic activity and negligible carbon deposition.
The temperature-dependent activity of the x = 0.1 sample is shown in Figure 8. The CH4 and CO2 conversions are very close to the thermoequilibrium values from 600–850 °C, indicating that the catalyst is highly active. As expected, the H2/CO ratio and H2 selectivity increase with temperature because a high temperature favors the main DRM reaction. The carbon balance is very close to 1 indicating that the x = 0.1 sample has good anti-coking properties. Moreover, we also tested the DRM performance of the x = 0.1 sample without H2 activation (Figure 9). It is interesting to see that the sample shows an equivalent catalytic activity in terms of CH4 and CO2 conversions, H2/CO ratio, H2 selectivity, and carbon balance compared to its counterpart with H2 activation. The close CH4 and CO2 conversions indicate that the DRM main reaction dominates the total reaction while the RWGS side reaction is minor, as evidenced by the relatively high H2/CO ratio. The self-activation behavior of the sample implies that the LaNixCr1−xO3 perovskite oxides are highly active for a DRM reaction before the formation of SMLs and metal Ni nanoparticles. This should be because the perovskites are oxygen deficient, especially on the surface. Oxygen vacancies will drive the Ni cations embedded in the perovskite into their lower oxidation states, making the Ni 3d electron orbitals open to the reactants.
We compared our catalysts with those reported in the literature applied to DRM under similar conditions (Table 4). The optimized LaNi0.1Cr0.9O3 with a low Ni loading performed well among the reported catalysts.

3. Materials and Methods

3.1. Catalyst Preparation

LaNixCr1−xO3 (x = 0.05, 0.1, 0.2, 0.3, 0.4, 0.5) catalyst precursors were synthesized using the sol-gel self-combustion method [25,48]. All the chemicals of analytical grade were purchased from Sinopharm Chemical Agent Company (Shanghai, China), including lanthanum oxide (La2O3), nitric acid, nickel nitrate hexahydrate (Ni(NO3)2·6H2O), chromium nitrate nonahydrate (Cr(NO3)3·9H2O), citric acid monohydrate (C6H8O7·H2O), and ammonia solution. La2O3 was entirely dissolved in nitric acid aqueous solution. A stoichiometric ratio of Ni(NO3)2·6H2O and Cr(NO3)3·9H2O was added to the solution under constant stirring. The mixed nitrate solution is combined with the complexing agent C6H8O7·H2O (the ratio of metal ions and citric acid is 1.5:1). Ammonia solution (25% NH3 by weight in water) was added to adjust the pH value of the solution to 7~9. After constant stirring at room temperature for a proper time, the mixed solution was heated on a heating platform until ignition. The flame temperature detected by an infrared detector was well above 1000 °C. Then, the product powder was collected and calcined at 700 °C in air for 4 h to remove residual organic chemicals. The obtained catalysts were in the spongy powder form, and their colors darkened with increasing x. The actual chemical composition of the catalysts determined by ICP is listed in Table 5. It is seen that the La content in the catalysts is a little higher than the nominal composition while the Ni/Cr atomic ratios are close to the nominal ones.

3.2. Characterization

XRD. The crystalline phase structure of the catalyst samples was examined by an X-ray diffractometer (XRD, MXPAHF, MacScience, Kanagawa, Japan) using Cu Kα radiation (λ = 1.5406 Å) over the range of 2θ = 20–80° at room temperature.
XPS. X-ray photoelectron spectroscopy (XPS) analysis was performed using an electron spectrometer (ESCALAB 250, Thermo-VG Scientific, Waltham, MA, USA) with an exciting source of Al Kα = 1486.6 eV.
TEM and EDS Mapping. The microstructures of the samples were observed by high-resolution transmission electron microscopy (HR-TEM, Talos F200X, FEI, Portland, OR, USA) and high-angle annular dark-field scanning transmission electron microscopy (HAADF-STEM, JEM-ARM200F, JEOL, Tokyo, Japan) operating at an accelerating voltage of 200 kV. The element distribution was measured by energy-dispersive X-ray spectroscopy mapping analysis (EDS-Mapping, Talos F200X, FEI, Portland, OR, USA)
TPR. Temperature-programmed reduction (TPR) was carried out with a simultaneous thermal analyzer (STA449F3, NETZSCH, Selb, Germany). A 10–15 mg powder sample was placed in an alumina crucible and degassed at 230 °C for 1 h to remove adsorbates. After cooling to room temperature, the sample was heated in situ in the flow of forming gas (5 vol% H2/N2, flow rate = 60 sccm) to 1000 °C with a heating rate of 10 °C min−1. We take the first-order derivative on the thermogravimetric curve (TG) as DTG.
TPO. Temperature-programmed oxidation (TPO) was performed on the used catalysts to analyze the carbon deposition. The analysis was carried out with a simultaneous thermal analyzer. A 10–15 mg powder sample was placed in an alumina crucible. The sample was first heated under 10 sccm N2 protection to 800 °C with a heating rate of 10 °C min−1 to remove adsorbed gas molecules and to decompose the possible La2O2(CO3). After cooling to room temperature, the sample was heated to 1000 °C in dry air (flow rate = 60 sccm) with a heating rate of 10 °C min−1. The weight loss detected in the high-temperature stage above 500 °C reflects the amount of deposited carbon.
Specific surface area analysis. The BET-specific surface areas were measured by nitrogen adsorption at liquid nitrogen temperature (77 K) using a surface area analyzer (NOVA 3200e, Quantachrome, Boynton Beach, FL, USA). Before N2 adsorption, the samples were degassed at 300 °C for 3 h to remove any residual moisture and other volatiles.
ICP-AES. The atomic ratios of La, Ni, and Cr in the fresh LaNixCr1−xO3 samples were measured by inductively coupled plasma atomic emission spectrometry (ICP-AES) (Optima 7300 DV, PerkinElmer, Waltham, MA, USA). A 25 mg powder sample was dissolved in nitric acid aqueous solution under heated conditions. The obtained solution was diluted to ppm levels of metal ions to be measured by ICP-AES.

3.3. Catalytic Activity Tests

A 300 mg sample was placed in a fixed bed quartz reactor (i.d. = 6 mm) without dilution. The sample was heated to 700 °C in N2 (30 sccm) and activated in pure H2 (30 sccm) at 700 °C for 1 h before the DRM tests unless otherwise specified. After purging with N2 for 30 min, the reactor was heated to the test temperature to carry out the catalyst activity test under a continuous feed of approximately equimolecular CO2/CH4 mixture with a flow rate of 60 sccm without dilution. The same gaseous hourly space velocity (GHSV) of 1.2 × 10⁴ mL gcat−1 h−1 was maintained throughout the test. The steady-state tests were performed under atmospheric pressure at 750 °C. The reaction products were analyzed by on-line gas chromatography (GC9790, FULI, Taizhou, China), and the flow rate of the tail gas was measured by a soap film flowmeter. The conversions of CH4 and CO2 and the H2/CO ratio of H2 and CO are defined as:
Conv   CH 4   = [ CH 4 ] in [ CH 4 ] out [ CH 4 ] in   ×   100 %
Conv   CO 2 = [ CO 2 ] in [ CO 2 ] out [ CO 2 ] in   ×   100 %
H 2 / CO   ratio = [ H 2 ] out [ CO ] out
H 2   selectivity = 2   ×   [ H 2 ] out [ CH 4 ] in [ CH 4 ] out
Carbon   balance = [ CH 4 ] out + [ CO 2 ] out + [ CO ] out [ CH 4 ] in + [ CO 2 ] in
where [CH4]in and [CO2]in are the molar flow rates of the introduced CH4 and CO2, and [CH4]out, [CO2]out, [H2]out and [CO]out are the molar flow rates of CH4, CO2, H2 and CO in the tail gas.

4. Conclusions

LaNixCr1−xO3 (x = 0.05–0.5) samples in powder form were synthesized by the sol-gel self-combustion combustion method. Ni atoms are successfully doped into the LaCrO3 perovskite lattice. The perovskite grains are polycrystalline, and the crystallite size decreases with increasing Ni content. The CH4 conversion increases from 83% to 87% at 750 °C as the Ni loading increases from x = 0.05 to x = 0.5, meanwhile the carbon deposition rate increases from 0.02 to 76.2 mgc gcat−1 h−1. The CH4 and CO2 conversions over the optimized sample (x = 0.1) are 83.9% and 87.1%, respectively, and the carbon deposition is negligible. We demonstrated that the LaNixCr1−xO3 perovskites show good stability and intrinsic catalytic activity for DRM reactions. We proposed that Ni atoms embedded on the surface of perovskite oxides (perovskite LaNixCr1−xO3 form or LaNiOΔ submonolayer), are highly active owing to the open Ni 3d orbitals that resulted from oxygen vacancies. Such Ni atoms are atomically dispersed and act as the active centers for a DRM reaction. However, metal Ni nanoparticles usually coexist with the atomically dispersed Ni atoms embedded in the oxides, especially in samples with high Ni contents, which should be the main reason for carbon deposition. How to make the Ni-embedded perovskite catalysts more stable and suppress the formation of Ni nanoparticles still leaves an open question.

Supplementary Materials

The following supporting information can be downloaded at: https://www.mdpi.com/article/10.3390/catal12101143/s1, Figure S1: TEM images and EDS-Mapping of fresh LaNi0.1Cr0.9O3 sample. (a) high magnification images to show the lattice structure and element distribution. The selected area (marked by a green square) is also magnified to reveal details of the lattice. (b) low magnification images to show the element distribution in a larger area; Figure S2: TEM images and EDS-Mapping of used LaNi0.1Cr0.9O3 sample. (a) high magnification images to show the lattice structure and element distribution. The selected area (marked by a green square) is also magnified to reveal details of the lattice. (b) low magnification images to show the element distribution in a larger area; Figure S3: TEM images and EDS-Mapping of fresh LaNi0.3Cr0.7O3 sample. (a) high magnification images to show the lattice structure and element distribution. The selected area (marked by a green square) is also magnified to reveal details of the lattice. (b) low magnification images to show the element distribution in a larger area; Figure S4: TEM images and EDS-Mapping of used LaNi0.3Cr0.7O3 sample. (a) high magnification images to show the lattice structure and element distribution. The selected area (marked by a green square) is also magnified to reveal details of the lattice. (b) low magnification images to show the element distribution in a larger area; Figure S5: TEM images and EDS-Mapping of fresh LaNi0.5Cr0.5O3 sample; Figure S6: TEM images and EDS-Mapping of fresh LaNi0.5Cr0.5O3 sample. (a) high magnification images to show the lattice structure and element distribution. The selected area (marked by a green square) is also magnified to reveal details of the lattice. (b) low magnification images to show the element distribution in a larger area; Figure S7: TEM images and EDS-Mapping of used LaNi0.5Cr0.5O3 sample. (a) high magnification images to show the lattice structure and element distribution. The selected area (marked by a green square) is also magnified to reveal details of the lattice. (b) low magnification images to show the element distribution in a larger area; Figure S8: TEM images and EDS-Mapping of used LaNi0.5Cr0.5O3 sample. The selected area (marked by green square) is also magnified to reveal details of the lattice; Table S1: Area ratio of Oads/Olat for fresh and used LaNixCr1−xO3 samples in O 1s spectra.

Author Contributions

Conceptualization, T.Z.; data curation, T.Z.; formal analysis, F.Y.; investigation, H.Y. and X.T.; software, H.Y.; supervision, H.W.; writing—original draft, T.Z.; writing—review and editing, M.L. and H.W. All authors have read and agreed to the published version of the manuscript.

Funding

This research was funded by the National Natural Science Foundation of China (Grant no.: 21872129).

Data Availability Statement

All data included in this study are available upon request by contact with the corresponding author.

Acknowledgments

The authors thank the Instruments Center for Physical Science of the University of Science and Technology of China for the sample characterizations.

Conflicts of Interest

The authors declare no conflict of interest.

References

  1. Pakhare, D.; Spivey, J. A review of dry (CO2) reforming of methane over noble metal catalysts. Chem. Soc. Rev. 2014, 43, 7813–7837. [Google Scholar] [CrossRef]
  2. Djinović, P.; Črnivec, I.G.O.; Batista, J.; Levec, J.; Pintar, A. Catalytic syngas production from greenhouse gasses: Performance comparison of Ru-Al2O3 and Rh-CeO2 catalysts. Chem. Eng. Process. Process Intensif. 2011, 50, 1054–1062. [Google Scholar] [CrossRef]
  3. Mortensen, P.M.; Dybkjær, I. Industrial scale experience on steam reforming of CO2-rich gas. Appl. Catal. A Gen. 2015, 495, 141–151. [Google Scholar] [CrossRef]
  4. Yentekakis, I.V.; Panagiotopoulou, P.; Artemakis, G. A review of recent efforts to promote dry reforming of methane (DRM) to syngas production via bimetallic catalyst formulations. Appl. Catal. B Environ. 2021, 296, 120210. [Google Scholar] [CrossRef]
  5. Aramouni, N.A.K.; Touma, J.G.; Tarboush, B.A.; Zeaiter, J.; Ahmad, M.N. Catalyst design for dry reforming of methane: Analysis review. Renew. Sustain. Energy Rev. 2018, 82, 2570–2585. [Google Scholar] [CrossRef]
  6. Jang, W.-J.; Shim, J.-O.; Kim, H.-M.; Yoo, S.-Y.; Roh, H.-S. A review on dry reforming of methane in aspect of catalytic properties. Catal. Today 2019, 324, 15–26. [Google Scholar] [CrossRef]
  7. Arora, S.; Prasad, R. An overview on dry reforming of methane: Strategies to reduce carbonaceous deactivation of catalysts. RSC Adv. 2016, 6, 108668. [Google Scholar] [CrossRef]
  8. Wang, N.; Yu, X.; Wang, Y.; Chu, W.; Liu, M. A comparison study on methane dry reforming with carbon dioxide over LaNiO3 perovskite catalysts supported on mesoporous SBA-15, MCM-41 and silica carrier. Catal. Today 2013, 212, 98–107. [Google Scholar] [CrossRef]
  9. Li, X.; Li, D.; Tian, H.; Zeng, L.; Zhao, Z.-J.; Gong, J. Dry reforming of methane over Ni/La2O3 nanorod catalysts with stabilized Ni nanoparticles. Appl. Catal. B Environ. 2017, 202, 683–694. [Google Scholar] [CrossRef]
  10. Li, Z.; Ji, S.; Liu, Y.; Cao, X.; Tian, S.; Chen, Y.; Niu, Z.; Li, Y. Well-Defined Materials for Heterogeneous Catalysis: From Nanoparticles to Isolated Single-Atom Sites. Chem. Rev. 2020, 120, 623–682. [Google Scholar] [CrossRef]
  11. Valderrama, G.; Kiennemann, A.; de Navarro, C.U.; Goldwasser, M.R. LaNi1−xMnxO3 perovskite-type oxides as catalysts precursors for dry reforming of methane. Appl. Catal. A Gen. 2018, 565, 26–33. [Google Scholar] [CrossRef]
  12. Sagar, T.V.; Sreelatha, N.; Hanmant, G.; Surendar, M.; Lingaiah, N.; Rama Rao, K.S.; Satyanarayana, C.V.V.; Reddy, I.A.K.; Sai Prasad, P.S. Influence of method of preparation on the activity of La-Ni-Ce mixed oxide catalysts for dry reforming of methane. RSC Adv. 2014, 4, 50226–50232. [Google Scholar] [CrossRef]
  13. Surendar, M.; Sagar, T.V.; Raveendra, G.; Ashwani Kumar, M.; Lingaiah, N.; Rama Rao, K.S.; Sai Prasad, P.S. Pt doped LaCoO3 perovskite: A precursor for a highly efficient catalyst for hydrogen production from glycerol. Int. J. Hydrogen Energy 2016, 41, 2285–2297. [Google Scholar] [CrossRef]
  14. Wang, M.; Zhao, T.; Dong, X.; Li, M.; Wang, H. Effects of Ce substitution at the A-site of LaNi0.5Fe0.5O3 perovskite on the enhanced catalytic activity for dry reforming of methane. Appl. Catal. B Environ. 2018, 224, 214–221. [Google Scholar] [CrossRef]
  15. Al-Fatesh, A.S.; Khatri, J.; Kumar, R.; Kumar Srivastava, V.; Osman, A.I.; AlGarni, T.S.; Ibrahim, A.A.; Abasaeed, A.E.; Fakeeha, A.H.; Rooney, D.W. Role of Ca, Cr, Ga and Gd promotor over lanthana-zirconia–supported Ni catalyst towards H2-rich syngas production through dry reforming of methane. Energy Sci. Eng. 2022, 10, 866–880. [Google Scholar] [CrossRef]
  16. Lanre, M.S.; Abasaeed, A.E.; Fakeeha, A.H.; Ibrahim, A.A.; Al-Awadi, A.S.; Jumah, A.B.; Al-Mubaddel, F.S.; Al-Fatesh, A.S. Lanthanum-Cerium-Modified Nickel Catalysts for Dry Reforming of Methane. Catalysts 2022, 12, 715. [Google Scholar] [CrossRef]
  17. Lanre, M.S.; Abasaeed, A.E.; Fakeeha, A.H.; Ibrahim, A.A.; Alquraini, A.A.; AlReshaidan, S.B.; Al-Fatesh, A.S. Modification of CeNi0.9Zr0.1O3 Perovskite Catalyst by Partially Substituting Yttrium with Zirconia in Dry Reforming of Methane. Materials 2022, 15, 3564. [Google Scholar] [CrossRef]
  18. Akri, M.; Zhao, S.; Li, X.; Zang, K.; Lee, A.F.; Isaacs, M.A.; Xi, W.; Gangarajula, Y.; Luo, J.; Ren, Y.; et al. Atomically dispersed nickel as coke-resistant active sites for methane dry reforming. Nat. Commun. 2019, 10, 5181. [Google Scholar] [CrossRef]
  19. Seiyama, T. Total Oxidation of Hydrocarbons on Perovskite Oxides. Catal. Rev. 1992, 34, 281–300. [Google Scholar] [CrossRef]
  20. Voorhoeve, R.J.H.; Johnson, D.W., Jr.; Remeika, J.P.; Gallagher, P.K. Perovskite oxides: Materials science in catalysis. Science 1977, 195, 827–833. [Google Scholar] [CrossRef]
  21. Singh, U.G.; Li, J.; Bennett, J.W.; Rappe, A.M.; Seshadri, R.; Scott, S.L. A Pd-doped perovskite catalyst, BaCe1−xPdxO3−δ, for CO oxidation. J. Catal. 2007, 249, 349–358. [Google Scholar] [CrossRef]
  22. Peña, M.A.; Fierro, J.L.G. Chemical Structures and Performance of Perovskite Oxides. Chem. Rev. 2001, 101, 1981–2018. [Google Scholar] [CrossRef] [PubMed]
  23. Oh, J.H.; Kwon, B.W.; Cho, J.; Lee, C.H.; Kim, M.K.; Choi, S.H.; Yoon, S.P.; Han, J.; Nam, S.W.; Kim, J.Y.; et al. Importance of Exsolution in Transition-Metal (Co, Rh, and Ir)-Doped LaCrO3 Perovskite Catalysts for Boosting Dry Reforming of CH4 Using CO2 for Hydrogen Production. Ind. Eng. Chem. Res. 2019, 58, 6385–6393. [Google Scholar] [CrossRef]
  24. Urasaki, K.; Sekine, Y.; Kawabe, S.; Kikuchi, E.; Matsukata, M. Catalytic activities and coking resistance of Ni/perovskites in steam reforming of methane. Appl. Catal. A Gen. 2005, 286, 23–29. [Google Scholar] [CrossRef]
  25. Wang, H.; Dong, X.; Zhao, T.; Yu, H.; Li, M. Dry reforming of methane over bimetallic Ni-Co catalyst prepared from La(CoxNi1−x)0.5Fe0.5O3 perovskite precursor: Catalytic activity and coking resistance. Appl. Catal. B Environ. 2019, 245, 302–313. [Google Scholar] [CrossRef]
  26. Song, X.; Dong, X.L.; Yin, S.L.; Wang, M.; Li, M.; Wang, H.Q. Effects of Fe partial substitution of La2NiO4/LaNiO3 catalyst precursors prepared by wet impregnation method for the dry reforming of methane. Appl. Catal. A-Gen. 2016, 526, 132–138. [Google Scholar] [CrossRef]
  27. Wan, Y.; Yang, J.; Hou, H.; Xu, S.; Liu, G.; Hussain, S.; Qiao, G. Synthesis and microstructures of La1−xCaxCrO3 perovskite powders for optical properties. J. Mater. Sci. Mater. Electron. 2019, 30, 3472–3481. [Google Scholar] [CrossRef]
  28. Nakamura, T.; Petzow, G.; Gauckler, L.J. Stability of the perovskite phase LaBO3 (B = V, Cr, Mn, Fe, Co, Ni) in reducing atmosphere I. Experimental results. Mater. Res. Bull. 1979, 14, 649–659. [Google Scholar] [CrossRef]
  29. Zhao, T.; Zhao, J.; Tao, X.; Yu, H.; Li, M.; Zeng, J.; Wang, H. Highly active and thermostable submonolayer La(NiCo)OΔ catalyst stabilized by a perovskite LaCrO3 support. Commun. Chem. 2022, 5, 70. [Google Scholar] [CrossRef]
  30. Yang, J. Structural analysis of perovskite LaCr1−xNixO3 by Rietveld refinement of X-ray powder diffraction data. Acta Cryst. B 2008, 64, 281–286. [Google Scholar] [CrossRef]
  31. Baraneedharan, P.; Siva, C.; Saranya, A.; Jayavel, R.; Nehru, K.; Sivakumar, M. Dual emissive Sn(1−2x)CuxCoxO2 nanostructures—A correlation study of doping concentration on structural, optical and electrical properties. Superlattices Microstruct. 2014, 68, 66–75. [Google Scholar] [CrossRef]
  32. Koli, P.B.; Kapadnis, K.H.; Deshpande, U.G.; Tupe, U.J.; Shinde, S.G.; Ingale, R.S. Fabrication of thin film sensors by spin coating using sol-gel LaCrO3 Perovskite material modified with transition metals for sensing environmental pollutants, greenhouse gases and relative humidity. Environ. Chall. 2021, 3, 100043. [Google Scholar] [CrossRef]
  33. Valderrama, G.; Urbina de Navarro, C.; Goldwasser, M.R. CO2 reforming of CH4 over Co–La-based perovskite-type catalyst precursors. J. Power Sources 2013, 234, 31–37. [Google Scholar] [CrossRef]
  34. Qiao, L.; Bi, X. Direct observation of Ni3+ and Ni2+ in correlated LaNiO3−δ films. EPL 2011, 93, 57002. [Google Scholar] [CrossRef]
  35. Liu, X.; Su, W.; Lu, Z.; Liu, J.; Pei, L.; Liu, W.; He, L. Mixed valence state and electrical conductivity of La1−xSrxCrO3. J. Alloys Compd. 2000, 305, 21–23. [Google Scholar] [CrossRef]
  36. Álvarez-Galván, M.C.; de la Peña O’Shea, V.A.; Arzamendi, G.; Pawelec, B.; Gandía, L.M.; Fierro, J.L.G. Methyl ethyl ketone combustion over La-transition metal (Cr, Co, Ni, Mn) perovskites. Appl. Catal. B Environ. 2009, 92, 445–453. [Google Scholar] [CrossRef]
  37. Rida, K.; Benabbas, A.; Bouremmad, F.; Peña, M.A.; Sastre, E.; Martínez-Arias, A. Effect of calcination temperature on the structural characteristics and catalytic activity for propene combustion of sol-gel derived lanthanum chromite perovskite. Appl. Catal. A Gen. 2007, 327, 173–179. [Google Scholar] [CrossRef]
  38. Zhang, G.J.; Liu, R.; Yang, Y.; Jia, Y.Q. Metal-insulator transition and variations of crystal structures and valence states of Cr and Ni ions in LaCr1−xNixO3. Phys. Status Solidi A 1997, 160, 19–27. [Google Scholar] [CrossRef]
  39. Liang, H.; Hong, Y.; Zhu, C.; Li, S.; Chen, Y.; Liu, Z.; Ye, D. Influence of partial Mn-substitution on surface oxygen species of LaCoO3 catalysts. Catal. Today 2013, 201, 98–102. [Google Scholar] [CrossRef]
  40. Yang, M.; Wang, Y.; Zhang, R.; Liu, T.; Xia, L.; Chen, Z.; Fang, X.; Xu, X.; Xu, J.; Wang, X. Ni/LaBO3 (B = Al, Cr, Fe) Catalysts for Steam Reforming of Methane (SRM): On the Interaction Between Ni and LaBO3 Perovskites with Differed Fine Structures. Catal. Surv. Asia 2021, 25, 424–436. [Google Scholar] [CrossRef]
  41. Zhao, X.; Yang, Q.; Cui, J. XPS study of surface absorbed oxygen of ABO3 mixed oxides. J. Rare Earths 2008, 26, 511–514. [Google Scholar] [CrossRef]
  42. Rida, K.; Peña, M.A.; Sastre, E.; Martinez-Arias, A. Effect of calcination temperature on structural properties and catalytic activity in oxidation reactions of LaNiO3 perovskite prepared by Pechini method. J. Rare Earths 2012, 30, 210–216. [Google Scholar] [CrossRef]
  43. Wei, T.; Jia, L.; Luo, J.-L.; Chi, B.; Pu, J.; Li, J. CO2 dry reforming of CH4 with Sr and Ni co-doped LaCrO3 perovskite catalysts. Appl. Surf. Sci. 2020, 506, 144699. [Google Scholar] [CrossRef]
  44. Guo, T.; Dong, X.; Shirolkar, M.M.; Song, X.; Wang, M.; Zhang, L.; Li, M.; Wang, H. Effects of Cobalt Addition on the Catalytic Activity of the Ni-YSZ Anode Functional Layer and the Electrochemical Performance of Solid Oxide Fuel Cells. ACS Appl. Mater. Interfaces 2014, 6, 16131–16139. [Google Scholar] [CrossRef] [PubMed]
  45. Stojanović, M.; Haverkamp, R.G.; Mims, C.A.; Moudallal, H.; Jacobson, A.J. Synthesis and Characterization of LaCr1−xNixO3Perovskite Oxide Catalysts. J. Catal. 1997, 166, 315–323. [Google Scholar] [CrossRef]
  46. Zhou, R.; Mohamedali, M.; Ren, Y.; Lu, Q.; Mahinpey, N. Facile synthesis of multi-layered nanostructured Ni/CeO2 catalyst plus in-situ pre-treatment for efficient dry reforming of methane. Appl. Catal. B Environ. 2022, 316, 121696. [Google Scholar] [CrossRef]
  47. Odedairo, T.; Zhou, W.; Chen, J.; Zhu, Z. Flower-like perovskite LaCr0.9Ni0.1O3−δ-NiO nanostructures: A new candidate for CO2 reforming of methane. RSC Adv. 2014, 4, 21306–21312. [Google Scholar] [CrossRef]
  48. Ward, D.A.; Ko, E.I. Preparing catalytic materials by the sol-gel method. Ind. Eng. Chem. Res. 1995, 34, 421–433. [Google Scholar] [CrossRef]
Figure 1. XRD patterns of fresh (a), reduced (b), and used (c) LaNixCr1−xO3 samples. The time on stream of used samples is 10 h, except for the x = 0.5 sample, which has a 4.5 h time on stream due to heavy carbon deposition. The lattice planes labeled in the figure are those of the perovskite phase except otherwise specified. Perovskite: orthorhombic, Pbnm, JCPDS 00-71-1231. NiO: Cubic, Fm-3m, JCPDS 00-89-7130. Ni: Cubic, Fm-3m, JCPDS 00-87-0712.
Catalysts 12 01143 g001
Figure 2. TEM and EDS mapping images of fresh LaNixCr1−xO3 samples with x = 0.1 (a1a3), 0.3 (b1b3), and 0.5 (c1c3). The first row shows TEM images, and the second row shows the corresponding magnified images of green squares in the first row. The third row shows EDS mapping images of Ni elements in the first row. The d-spacing values and their corresponding lattice planes of the perovskite oxides are labeled in the magnified TEM images.
Catalysts 12 01143 g002
Figure 3. TEM and EDS mapping images of the used LaNixCr1−xO3 samples with x = 0.1 (a1a3), 0.3 (b1b3), and 0.5 (c1c3). The first row shows TEM images, and the second row shows the corresponding magnified images of green squares in the first row. The third row shows EDS mapping images of Ni elements in the first row. The d-spacing values and their corresponding lattice planes of the perovskite oxides are labeled in the magnified TEM images.
Catalysts 12 01143 g003
Figure 4. XPS spectra of the LaNixCr1−xO3 sample with x = 0.1, 0.3, and 0.5. (a) Cr 3s and Ni 3p spectra. (b) Cr 2p spectra. (c) O 1s spectra. The top half of Figure 4 shows the used samples, and the bottom half shows the fresh samples.
Catalysts 12 01143 g004
Figure 5. H2-TPR profiles of fresh LaNixCr1−xO3 samples. (a) Thermogravimetric curve (TG). (b) First-order derivative on the TG curve.
Catalysts 12 01143 g005
Figure 6. DRM performance of LaNixCr1−xO3 under different conditions. CH4 conversion (a), CO2 conversion (b), H2/CO ratio (c), H2 selectivity (d), and carbon balance (e) as a function of time on stream during the DRM reactions over LaNixCr1−xO3 with different x values at 750 °C. (f) TPO profiles of used LaNixCr1−xO3 samples.
Catalysts 12 01143 g006
Figure 7. Changes in CH4 conversion, CO2 conversion, H2/CO ratio, H2 selectivity, carbon balance and carbon deposition with x in LaNixCr1−xO3 at 750 °C. Condition: 12 L g−1 h−1, CH4:CO2 = 1. The data reported in Figure 7 are those collected at a reaction time of 2 h.
Catalysts 12 01143 g007
Figure 8. Temperature-dependent catalytic performance of the as-reduced LaNi0.1Cr0.9O3 catalyst between 600–850 °C. Condition: 12 L g−1 h−1, CH4:CO2 = 1.
Catalysts 12 01143 g008
Figure 9. DRM catalytic performance of LaNi0.1Cr0.9O3 without H2 activation. Condition: 750 °C, 12 L g−1 h−1, CH4:CO2 = 1.
Catalysts 12 01143 g009
Table 1. The average crystallite size of fresh, reduced, and used LaNixCr1−xO3 samples.
x in LaNixCr1−xO3Average Crystallite Size/nm
FreshReducedUsed
0.0529.126.128.4
0.125.825.819.3
0.221.121.816.0
0.315.117.316.3
0.413.714.912.4
0.512.713.912.0
Note: The average crystallite sizes in Table 1 were determined from the (002), (112), (022), (004), and (132) XRD peaks.
Table 2. The BET-specific surface area of fresh LaNixCr1−xO3 samples.
x in LaNixCr1−xO3Specific Surface Area (m2 g−1)Correlation Coefficient
0.059.70.9999
0.19.40.9977
0.27.20.9984
0.39.40.9996
0.49.90.9997
0.59.50.9998
Table 3. ΔE of Cr 3s for fresh and used LaNixCr1−xO3 samples in Cr 3s spectra.
x in LaNixCr1−xO3ΔE of Cr 3s for Fresh Samples (eV)ΔE of Cr 3s for Used Samples (eV)
0.14.23.8
0.34.54.0
0.55.04.6
Table 4. DRM catalytic performance, as reported in the literature.
CatalystGHSVTemperature (°C)CH4 Conv (%)CO2 Conv (%)Ref.
LaNiO315 L g−1 h−17509995[11]
LaNi0.8Mn0.2O315 L g−1 h−17509795[11]
LaNi0.4Ce0.6O312 L g−1 h−18009393[12]
La0.6Ce0.4Ni0.5Fe0.5O312 L g−1 h−17506272[14]
La0.6Ce0.4Ni0.9Zr0.01Y0.09O342 L g−1 h−18008991[16]
CeNi0.9Zr0.01Y0.09O342 L g−1 h−18009091[17]
LaCr0.95Ir0.05O3−δ4000 h−17508182[23]
10 wt% Pd–LaCr0.9Ni0.1O3−δ19.2 L g−1 h−17506396[47]
LaNi0.05Co0.05Cr0.9O312 L g−1 h−17508588[29]
LaNi0.1Cr0.9O312 L g−1 h−17508487this work
Table 5. Chemical composition of the fresh catalysts determined by ICP.
x in LaNixCr1−xO3La:Ni:Cr (Atomic Ratio)
0.05100:4.5:91.0
0.1100:9.1:86.3
0.2100:19.0:76.5
0.3100:27.9:66.7
0.4100:38.0:55.6
0.5100:47.3:48.6
Publisher’s Note: MDPI stays neutral with regard to jurisdictional claims in published maps and institutional affiliations.

