Communication

Sustainable Electrochemical NO Capture and Storage System Based on the Reversible Fe2+/Fe3+-EDTA Redox Reaction

1
Clean Energy Research Center, Korea Institute of Science and Technology, Seoul 02792, Korea
2
Graduate School of Energy and Environment, Korea University, Seoul 02841, Korea
3
Chemical Kinomics Research Center, Korea Institute of Science and Technology, Seoul 02792, Korea
4
Division of Bio-Medical Science & Technology, KIST School, University of Science and Technology, Seoul 02792, Korea
5
Department of Chemistry, Kyung Hee University, Seoul 02447, Korea
6
Division of Energy and Environmental Technology, KIST School, Korea University of Science and Technology, Seoul 02792, Korea
*
Author to whom correspondence should be addressed.
Catalysts 2022, 12(1), 79; https://doi.org/10.3390/catal12010079
Submission received: 2 December 2021 / Revised: 6 January 2022 / Accepted: 8 January 2022 / Published: 11 January 2022
(This article belongs to the Section Environmental Catalysis)

Abstract

:
The removal of nitric oxide (NO), which is an aggregation agent for fine dust that causes air pollution, from exhaust gas has been considered an important treatment in the context of environmental conservation. Herein, we propose a sustainable electrochemical NO removal system based on the reversible Fe2+/Fe3+-ethylenediamine tetraacetic acid (EDTA) redox reaction, which enables continuous NO capture and storage at ambient temperature without the addition of any sacrificial agents. We have designed a flow-type reaction system in which the NO absorption and emission can be separately conducted in the individual reservoirs of the catholyte and anolyte with the continuous regeneration of Fe2+-EDTA by the electrochemical reduction in Fe3+-EDTA. A continuous flow reaction using a silver cathode and glassy carbon anode showed that the concentrations of Fe2+ and Fe3+-EDTA in the electrolyte were successfully maintained at a 1:1 ratio, which demonstrates that the proposed system can be applied for continuous NO capture and storage.

1. Introduction

Recently, the removal of nitric oxide (NO) in exhaust gas generated by the combustion of fossil fuels has been considered an important treatment to ensure a clean atmospheric environment [1,2,3]. NO is not only an aggregation agent for fine dust, which causes air pollution, but it also provokes acid rain and the depletion of the ozone layer. Although the NO concentration in exhausted gas is as low as approximately 500 ppm, NO emission without proper treatment is severely restricted around the world because of the high environmental toxicity [4,5,6]. Thus, selective non-catalyst reduction (SNCR), which involves spraying an ammonia or urea solution at 1000 °C to the exhaust gas to convert NO to N2 and water (4NH3 + 6NO → 5N2 + 6H2O) [7,8], has been used industry wide for the NO removal. However, SNCR causes some issues: (i) unreacted hot ammonia solution is frequently released into the air, causing yellow smoke with odor; and (ii) the ammonium salts formed by side reactions cause clogging of the pipelines and act as an aggregation agent for the fine dust. Alternatively, selective catalyst reduction (SCR), which catalytically converts NO to N2 by using V2O5, TiO2, WO3, or MoO3 catalysis, can be used for NO removal [9,10]. However, the high maintenance cost for the frequent replacement of catalysts due to the poor stability in the given reaction conditions with NO is a major drawback for practical use [10]. Therefore, the development of new solutions that can overcome these issues of SCR and SNCR is required.
NO absorption using Fe complexes has attracted significant attention as an alternative solution for the NO removal [11]. For example, the Fe2+-ethylenediamine tertaacetic acid (EDTA) complex can be combined with NO as Fe2+-EDTA-NO (Equation (1)) [12]. The equilibrium constant (Kc) and rate constant (k) for this reaction are substantially high, namely Kc = 3.48 × 10⁶ at 311 K and k = 6.0 × 10⁷ M−1 s−1 at 298 K [13], respectively, which demonstrates that NO can be easily and quickly captured by Fe2+-EDTA and stably exist as a liquid phase in the Fe2+-EDTA solution. In this manner, the solubility of NO in water can significantly be increased from 56 mg/L to the equivalent amount of Fe2+-EDTA dissolved in water. In addition, the liquid-phased NO does not only have many benefits in terms of handling and transport compared to NO gas, but also has further possibilities to be converted to value-added chemicals such as ammonia by post-reactions. Nevertheless, due to the poor resistance of Fe2+-EDTA to being oxidized to Fe3+-EDTA by O2 in the air, the practical use of Fe2+-EDTA for NO removal is still challenging because Fe3+-EDTA has no absorption ability. Thus, research efforts have been focused on reducing Fe3+-EDTA to Fe2+-EDTA in NO removal systems by using a reducing agent or microorganism system [14,15,16,17]. However, the continuous addition of reducing agents is not a promising solution [14], and microorganism systems exhibited very slow reduction speeds and required the repeated addition of nutrients for metabolism [15,16,17]. Meanwhile, a fuel-cell type electrochemical system using the Fe-EDTA mediated NO capture and release has been reported, in which the Fe2+/Fe3+-EDTA reduction and oxidation reactions with NO gas were paired with the methanol oxidation to CO2 and the O2 reduction to water, receptivity, in a dual electrochemical cell [18]. However, this study focused only on utilizing NO mediated Fe-EDTA conversion reaction for the electricity generation, so that their fuel-cell was designed to release NO to the air after the Fe2+- to Fe3+-EDTA oxidation reaction without any consideration of the environmental hazard of NO gas.
Recently, as the share of renewable energy sources such as solar and wind power in global electricity generation is continuously increasing, chemical synthesis and pollutant treatment through electrochemical methods have rapidly emerged [19,20,21,22,23]. This is an inevitable trend to develop diverse electrochemical processes that can be directly powered by renewables without the loss of energy through conversion to heat or pressure. The performance of an electrochemical system is strongly dependent on the electrode materials and operating conditions. Consequently, engineering the reaction environment such as tuning the electrolyte composition and pH [24], modifying the reactor design and compartment [25], and the altering reactant [26] has become an important factor that significantly affects the product yield and Faraday efficiency of the electrochemical reaction. In this respect, the innovative design of conventional reaction systems could provide new opportunities to extend the usability of electrochemical methods.
In this study, we propose a sustainable electrochemical NO removal system based on the reversible Fe2+/Fe3+-EDTA redox reaction, which enables the continuous NO capture and storage at ambient temperature without the addition of any sacrificial agents. We designed a flow-type reaction system in which strong NO absorption and fast NO emission was separately conducted in the individual reservoirs of the catholyte and anolyte with the continuous regeneration of Fe2+-EDTA by the electrochemical reduction in Fe3+-EDTA (Scheme 1a). This system consisted of four steps (Scheme 1b): (i) NO absorption in the Fe2+-EDTA solution (Equation (1)); (ii) the electrochemical oxidation of Fe2+-EDTA-NO to Fe3+-EDTA to release NO from Fe2+-EDTA (Equation (2)); (iii) electrochemical regeneration of Fe2+-EDTA by the reduction of Fe3+-EDTA (Equation (3)); and (iv) repeated NO absorption using the regenerated Fe2+-EDTA solution (Equation (1)).
(i, iv) Fe2+-EDTA(l) + NO(g) → Fe2+-EDTA-NO(l)
(ii) Fe2+-EDTA-NO(l) → Fe3+-EDTA(l) + e + NO(g)
(iii) Fe3+-EDTA(l) + e → Fe2+-EDTA(l)
To enhance the efficiency of the NO capture and storage system, we performed electrode screening to identify the most reactive element for the electrochemical Fe2+/Fe3+-EDTA redox reaction with strong stability under the given electrolyte conditions. In addition, five different Fe2+-complexes were prepared, and their NO absorption capacity and oxidation resistance ability were compared to those of Fe2+-EDTA to examine which Fe-complex is most suitable for this NO removal system. The individual conversions of Fe2+-EDTA to Fe3+-EDTA and Fe3+-EDTA to Fe2+-EDTA using a half-cell reaction system with glassy carbon cathode and anode were completely conducted with conversion and Faraday efficiencies higher than 90%. Furthermore, in the full-cell reaction system with the silver cathode and glassy carbon anode, the concentration of Fe2+ and Fe3+-EDTA in the electrolyte was maintained at approximately 1:1 ratio for 10 h, which demonstrates that the proposed system can be applied for continuous NO capture and storage. The novelty of our system is that (i) NO capture can be performed semi-permanently without the addition of consumable compounds and degradation of catalysts; (ii) side reactions involving harmful fumes and pipe blockage do not occur; (iii) it is an energy-efficient process compared to SNCR and SCR because electrical energy can be directly consumed by the NO capture reaction; and (iv) valuable NO-derived chemicals such as ammonia or nitric acid can be easily synthesized by post-treatment. Although the NO removal efficiency of the full-cell reaction was not sufficient for practical use, we ensured that the concept of using the reversible electrochemical Fe-complex redox cycle at ambient temperature and pressure could be a promising and environmentally friendly NO removal method that is an alternative to SCR and SNCR.

2. Experiment

2.1. Materials

Glassy carbon plate(Alfa Aesar, Tewksbury, MA, USA, 1 mm thick, type 2), nickel foil (Alfa Aesar, 0.25 mm thick, annealed, 99.5%), titanium foil (Alfa Aesar, 0.127 mm thick, annealed, 99%), copper foil (Alfa Aesar, 0.254 mm thick, 99.9%), silver foil (Alfa Aesar, 0.05 mm thick, annealed, 99.9%), platinum foil (Alfa Aesar, 0.127 mm thick, Premion®, 99.99%), iron foil (DASOM RMS Co., Ltd., Anyang, Korea, 0.1 mm thick, 99.5%), tungsten foil (Alfa Aesar, 0.1 mm thick, 99.95%), silver foam (MTI, Richmond, CA, USA, >99.99%, porosity ≥85%, 1 mm thick), glassy carbon foam (Duocel®, CA, USA, 100 PPI, 0.4 cm thick), Na2SO4 (Alfa Aesar, ACS, 99.0%), FeSO4∙7H2O (Alfa Aesar, ACS, 99+% crystalline), Na2EDTA∙2H2O (Alfa Aesar, 99+%), sodium 2,3-dimercaptopropanesulfonate monohydrate (TCI, Tokyo, Japan, >97.0%), l-cysteic acid monohydrate (Sigma-Aldrich, St. Louis, MO, USA, ≥99.0%), triphenylphosphine-3,3′,3″-trisulfonic acid trisodium salt (TCI, >97.0%), 1,10-phenanthroline (SAMCHUN, Seoul, Korea, 99.0%), N2 (Sinyang Oxygen (medical), Seoul, Korea, 99.9%), NO (Sinyang Oxygen (medical), 99.9%), deionized water (18 MΩ, Smart2Pure 6 UV/UF, ThermoFisher, Waltham, MA, USA), ethyl alcohol (SAMCHUN, 99.9%), sulfuric acid (DUKSAN, Seoul, Korea, Extra Pure GRADE), sodium hydroxide (Sigma-Aldrich, ≥98%), ammonium chloride (Sigma-Aldrich, ACS reagent, ≥99.5%), phenol (Sigma-Aldrich, ACS reagent, ≥99.0%), sodium citrate tribasic dehydrate (Sigma-Aldrich, ACS reagent, ≥99.0%), sodium hypodhlorite solution (Sigma-Aldrich, available chlorine 4.00–4.99%), sodium nitroprusside dihydrate (Sigma-Aldrich, ACS reagent, ≥99%), sarcosine ethyl ester hydrochloride (TCI, >98.0%), methanol (Alfa Aesar, 99%), pyridine-2-carboxaldehyde (Alfa Aesar, 99%), sodium cyanoborohydride (Alfa Aesar, 95%), hydrochloric acid (Alfa Aesar, ACS, HCl 36.5~38.0%), sodium bicarbonate (Alfa Aesar, 99+%), methylene chloride (Fisherbrand, NH, USA, ACS Grade), magnesium sulfate heptahydrate (Alfa Aesar, 99+%), trimethylamine (Alfa Aesar, 99%), ethyl acetate (Alfa Aesar, 99%), benzene (Alfa Aesar, 99.8%), 1,2-bis(diphenylphosphino)ethane (Alfa Aesar, 97+%), and oleum (Sigma-Aldrich, 20% free SO3 basis) were purchased and used without pretreatment.

2.2. Preparation of Fe-Complex Solutions

Fe2+-EDTA: The Fe2+-EDTA solution was prepared by mixing 10 mM FeSO4∙7H2O and 10 mM Na2EDTA∙2H2O in deionized water. The water was purged with N2 for 15 min at least before mixing to remove dissolved oxygen. The pH of the as-prepared Fe2+-EDTA solution was 2.7. The Fe3+-EDTA solution was prepared by exposing the as-prepared Fe2+-EDTA solution to air for 24 h.
Fe2+-(DMPS)2, Fe2+-(CA)2, and Fe2+-(TPPTS)2: These solutions were prepared by mixing 20 mM sodium 2,3-dimercaptopropanesulfonate∙H2O, l-cysteic acid∙H2O, and triphenylphosphine-3,3′,3″-trisulfonic acid trisodium with 10 mM FeSO4∙7H2O, respectively, in the N2 purged deionized water.
Synthesis of MPMAA and DPPETS and preparation of Fe2+MPMAA and Fe2+-(DPPETS)2: The (methyl-pyridine-2-ylmethyl-amino)-acetic acid (MPMAA) was synthesized with ethyl sarcosine hydrochloride and pyridine-2-carboxaldehyde. Furthermore, 12.28 g of ethyl sarcosine hydrochloride was dissolved in 400 mL of methanol at 0 °C. Then, 88 mmol pyridine-2-carboxaldehyde in 40 mL methanol and 68.9 mmol solid sodium cyanoborohydride was added to the solution at 0 °C. The resulting clear yellow solution was stirred at room temperature for 18 h. HCl (12.1 M) was added to the solution, and the yellow suspensions were stirred for 2 h. The solvent was removed under vacuum and the residue was basified with saturated aqueous sodium bicarbonate. The resulting mixtures were extracted with methylene chloride, and the organic layer was dried over magnesium sulfate, followed by evaporation of the organic layer under vacuum. The product was purified by chromatography on 250 g of silica gel with 2% triethylamine in ethyl acetate as the eluent. Then, 50.76 mmol of the product was added to 56 mL of 1 M NaOH at 0 °C. The orange suspension was stirred for 3 h at room temperature, washed with benzene (200 mL), and neutralized with 56 mL of 1 M HCl. After stirring for 30 min, the solution was washed with 200 mL of methylene chloride, and the aqueous phase was evaporated under vacuum to dryness. The residue was slurried using absolute ethanol, sonicated, and filtered. The filtrate was evaporated to yield a yellow oil. (9.1 g, 63% overall yield).
m-Sulfonated 1,2-bis (diphenylphosphino) ethane (DPPETS) was synthesized using 1,2-bis (diphenylphosphino) ethane (DPPE) and oleum. The DPPE was slowly added to oleum (18−24% SO3) and stirred at 0 °C for 72 h. Then, 25% NaOH (pH 8.5) was added to the solution at 0°. The aqueous solution was evaporated to reduce the volume to 4 mL. A methanol was added to the solution to separate DPPETS from reaction residues and for easy evaporation. The mixture was refluxed for 1 h. After hot filtration, the solution was washed with 4MeOH/H2O to remove Na2SO4. The solution was filtered under dry conditions and a white crystalline solid was crystallized from 10 MeOH/H2O.
The Fe2+-MPMAA and Fe2+-(DPPETS)2 solutions were prepared by mixing 10 mM MPMAA and 20 mM DPPETS with 10 mM FeSO4∙7H2O, in N2-purged deionized water.

2.3. Characterizations

Materials characterizations: The morphology of electrodes was monitored using a FEI Inspect F field emission-scanning electron microscopy (FE-SEM) with an accelerating voltage of 15 kV. The elemental analysis was performed with an energy dispersive spectroscopy (EDS) accessory attached to the FE-SEM equipment. The X-ray diffraction (XRD) patterns of electrodes were obtained using a Panalytical Empyrean XRD with the fixed theta-two theta scan.
Fe2+ and Fe3+ concentrations in the Fe-complex solutions: Colorimetry analysis using 1,10-phenanthroline was used to determine the Fe2+ and Fe3+ ratios in the Fe-complex solutions. UV/Vis absorbance spectra of the 1,10-phenanthroline added Fe-complex solution after reaction were obtained by using an Agilent Cary 5000 UV-Vis-NIR spectrophotometer. The intensity of the characteristic absorbance of Fe2+ at 510 nm, which was determined from the as-prepared fresh Fe2+-complex solution, was used as the reference for 100% Fe2+. The fresh Fe3+-complex solution showed almost zero absorbance at 510 nm.
No absorption capacity and oxidation resistance of Fe-complex solutions: 1 mM NO gas was purged into the 5 mM Fe2+-complex solutions in the N2 purged air-tight vial. As each Fe-complex solution showed characteristic absorbance at wavelength between 400 and 600 nm due to NO absorption, NO purging was repeatedly performed until the characteristic absorbance intensity was saturated. The oxidation resistance was analyzed by exposing the as-prepared Fe2+-complex solutions to an air condition for 24 h. The concentration of remaining Fe2+ in the solution was determined by colorimetry analysis using 1,10-phenanthroline.

2.4. Electrochemical Measurement

Preparation of electrodes: The surface of the glassy carbon plate was polished with a polishing pad and alumina beads (10 μm and 0.05 μm) to remove native oxide layers. The surfaces of all metal foils and foams were also cleaned by sonication in a 0.5 M H2SO4 solution for 15 min. The foils and foams were subsequently washed with distilled water and dried with N2 blow.
Cyclic voltammetry (CV) measurements: CV measurements were conducted using a Biologic VSP potentiostat with a three-electrode system composed of a K2SO4 saturated Hg/Hg2SO4 reference electrode (E0 = 657 mV vs. NHE) and a Pt mesh counter electrode. The surface cleaned glassy carbon plate or metal foils were used for the working electrode. A geometric surface area of all the working electrodes exposed to the electrolyte was 1 cm × 1 cm. The electrolyte was prepared by dissolving 10 mM Fe2+-complexes in a N2 purged 0.1 M Na2SO4 aqueous solution. The pH of the as-prepared Fe2+-EDTA solution was 2.7, and the pH of other Fe2+-complexes was adjusted to 2.7 by adding 0.5 M H2SO4 or NaOH solution. All the CV curves were obtained at a scan rate of 10 mV s−1. Electrochemical active surface area (ECSA) of the electrodes was obtained by dividing the double layer capacitance by the intrinsic capacitance of silver (30 µF/cm2) or glassy carbon (33 µF/cm2). The double layer capacitances were determined by CV measurement with different scan rates (10–160 mV/s) in the region of non-Faradaic potential in a 0.1 M Na2SO4 solution (pH 2.7).
Fe-EDTA conversion using half-cell and full-cell systems: A two-electrode system based on a Micro Flow Cell purchased from ElectroCell was used for the continuous Fe-EDTA conversion test. The inner gaskets of the flow cell were modified to reduce the distance between the working and counter electrodes. The glassy carbon foam and Ag foam with a geometric area of 3.2 cm × 3.2 cm were used as working or counter electrodes for this Fe-EDTA conversion test. Nafion 117 was used as the ion-conducive membrane dividing the cathode and anode compartments. Two 80 mL Teflon reservoirs for 10 mM Fe2+- and Fe3+-EDTA dissolved in a 0.1 M Na2SO4 aqueous solution were connected to the flow cell with silicon tubing. The Fe-EDTA solutions were purged with N2 for 30 min before the flow was started. The flow rate of the Fe-EDTA solution was controlled at 4 mL min−1 using an EMS Tech EMP-600G2 peristaltic pump. Linear sweep voltammetry (LSV) and chronoamperometry measurements were performed using the glassy carbon or Ag foam working electrode to perform the reduction reaction of Fe3+-EDTA to Fe2+-EDTA. For the half-cell test, the anolyte and catholyte were individually circulated without mixing each other (Figure 3a). For the full-cell test, a mixed solution of Fe2+-EDTA and Fe3+-EDTA in a 1:1 ratio was filled into the reservoirs, and the electrolyte was cross-circulated from the reservoir to the cell compartment (Figure 4a). The Fe2+- and Fe3+-EDTA concentrations in the electrolyte after the reaction were determined by colorimetric analysis using 1,10-phenanthroline.
NO absorption and emission tests using the Fe2+-EDTA full-cell system: The NO-absorbed Fe2+-EDTA (Fe2+-EDTA-NO) solution was prepared by purging NO gas. The two-electrode full-cell reaction was performed using an Fe2+-EDTA-NO solution. The gas sampling bag was connected to the top of the anolyte reservoir to collect the desorbed NO by the oxidation of Fe2+-EDTA-NO. The NO concentration in the captured gas was monitored using a ThermoFisher Scientific NOx analyzer. The ammonia concentration in the Fe-EDTA solution was determined using the indophenol blue method. A 20% v/v sodium hypochlorite solution is dissolved in the citrate solution (20% w/v sodium citrate and 1% w/v sodium hydroxide in water). The Fe-EDTA electrolyte was added to the oxidized citrate solution mixed with the phenol solution (11.1% v/v phenol in ethanol) and the sodium nitroprusside solution (0.5% w/v sodium nitroprusside in water). The mixed solution was stabilized for 6 h. Subsequently, UV/Vis absorbance measurements were performed to determine the ammonia concentration.

3. Result and Discussions

3.1. Electrochemical Redox Property of Fe-EDTA Solution

The Fe-EDTA complex solution was prepared by dissolving 10 mM FeSO4 and 10 mM Na2EDTA in a 0.1 M Na2SO4 aqueous solution. Na2SO4 was used as a supporting electrolyte because the Na+ and SO42− ions did not show any electrochemical reactivity with the working and counter electrodes (Figure 1a) or any side reactions with the Fe-EDTA complex under the given conditions [27,28]. The pH of the 10 mM Fe2+-EDTA solution was 2.7. The electrochemical properties of Fe2+-EDTA were examined using a glassy carbon electrode (Figure 1a). The cyclic voltammetry (CV) curve before dissolving the Fe2+ and EDTA2− precursors did not show any redox wave in the potential range of −0.2–0.8 V vs. RHE. However, the Fe2+-EDTA solution clearly showed the reversible redox wave with the oxidation onset of Fe2+ to Fe3+ at 0.20 V vs. RHE and the reduction onset of Fe3+ to Fe2+ at 0.35 V vs. RHE. The diffusion-limited peak currents of the oxidation and reduction reactions were almost identical at approximately 0.3 mA/cm2. This reversible redox feature of the Fe2+/Fe3+ transition was stably maintained until 200 cycles of CV measurement (inset of Figure 1a), which demonstrates that the Fe-EDTA complex system in an aqueous condition can be applied to a sustainable NO capture and storage system. We note that the overall shape of the CV curve in Figure 1a was almost identical to the CV curve drawn using a glassy carbon working electrode and Fe2+-EDTA solution at pH 2.2 in the previous study [29].
Moreover, the reversible electrochemical redox property of Fe-EDTA was examined using a variety of metal foils (Ni, Ti, Ag, Cu, Fe, Pt, and W) to find an electrode with a higher reactivity than that of glassy carbon. Ni and Ti showed reversible redox waves in their CV curves; however, Ni was not stable at pH 2.7 and Ti showed a substantial overpotential and low current density for the Fe2+/Fe3+-EDTA redox reaction (Figure 1b). Ag, Cu, and Fe showed capacitive features for the reduction reaction of Fe3+-EDTA to Fe2+-EDTA, whereas the oxidation current corresponding to the Fe2+-EDTA to Fe3+-EDTA transition was linearly generated due to electrode dissolution in the oxidative environment (Figure 1c), which indicates that these electrodes were limited to the reduction reaction only. However, Cu and Fe were not available for the reduction reaction because Cu was gradually dissolved at a pH 2.7 condition and the Fe surface quickly corroded immediately after the redox reaction was initiated. Although Pt and W showed a clear redox wave with a lower overpotential and higher current density for the Fe2+/Fe3+-EDTA redox reaction than that of glassy carbon, several reaction peaks were observed in addition to the Fe2+/Fe3+-EDTA redox curve (Figure 1d). This is because Pt and W react with EDTA molecules directly, which results in the degradation of the Fe-EDTA complex structure. This indicates that Pt and W are not available for the sustainable Fe-EDTA redox reaction. Based on these examinations, we discovered that Ag was the only available option for the reduction reaction, in addition to glassy carbon.

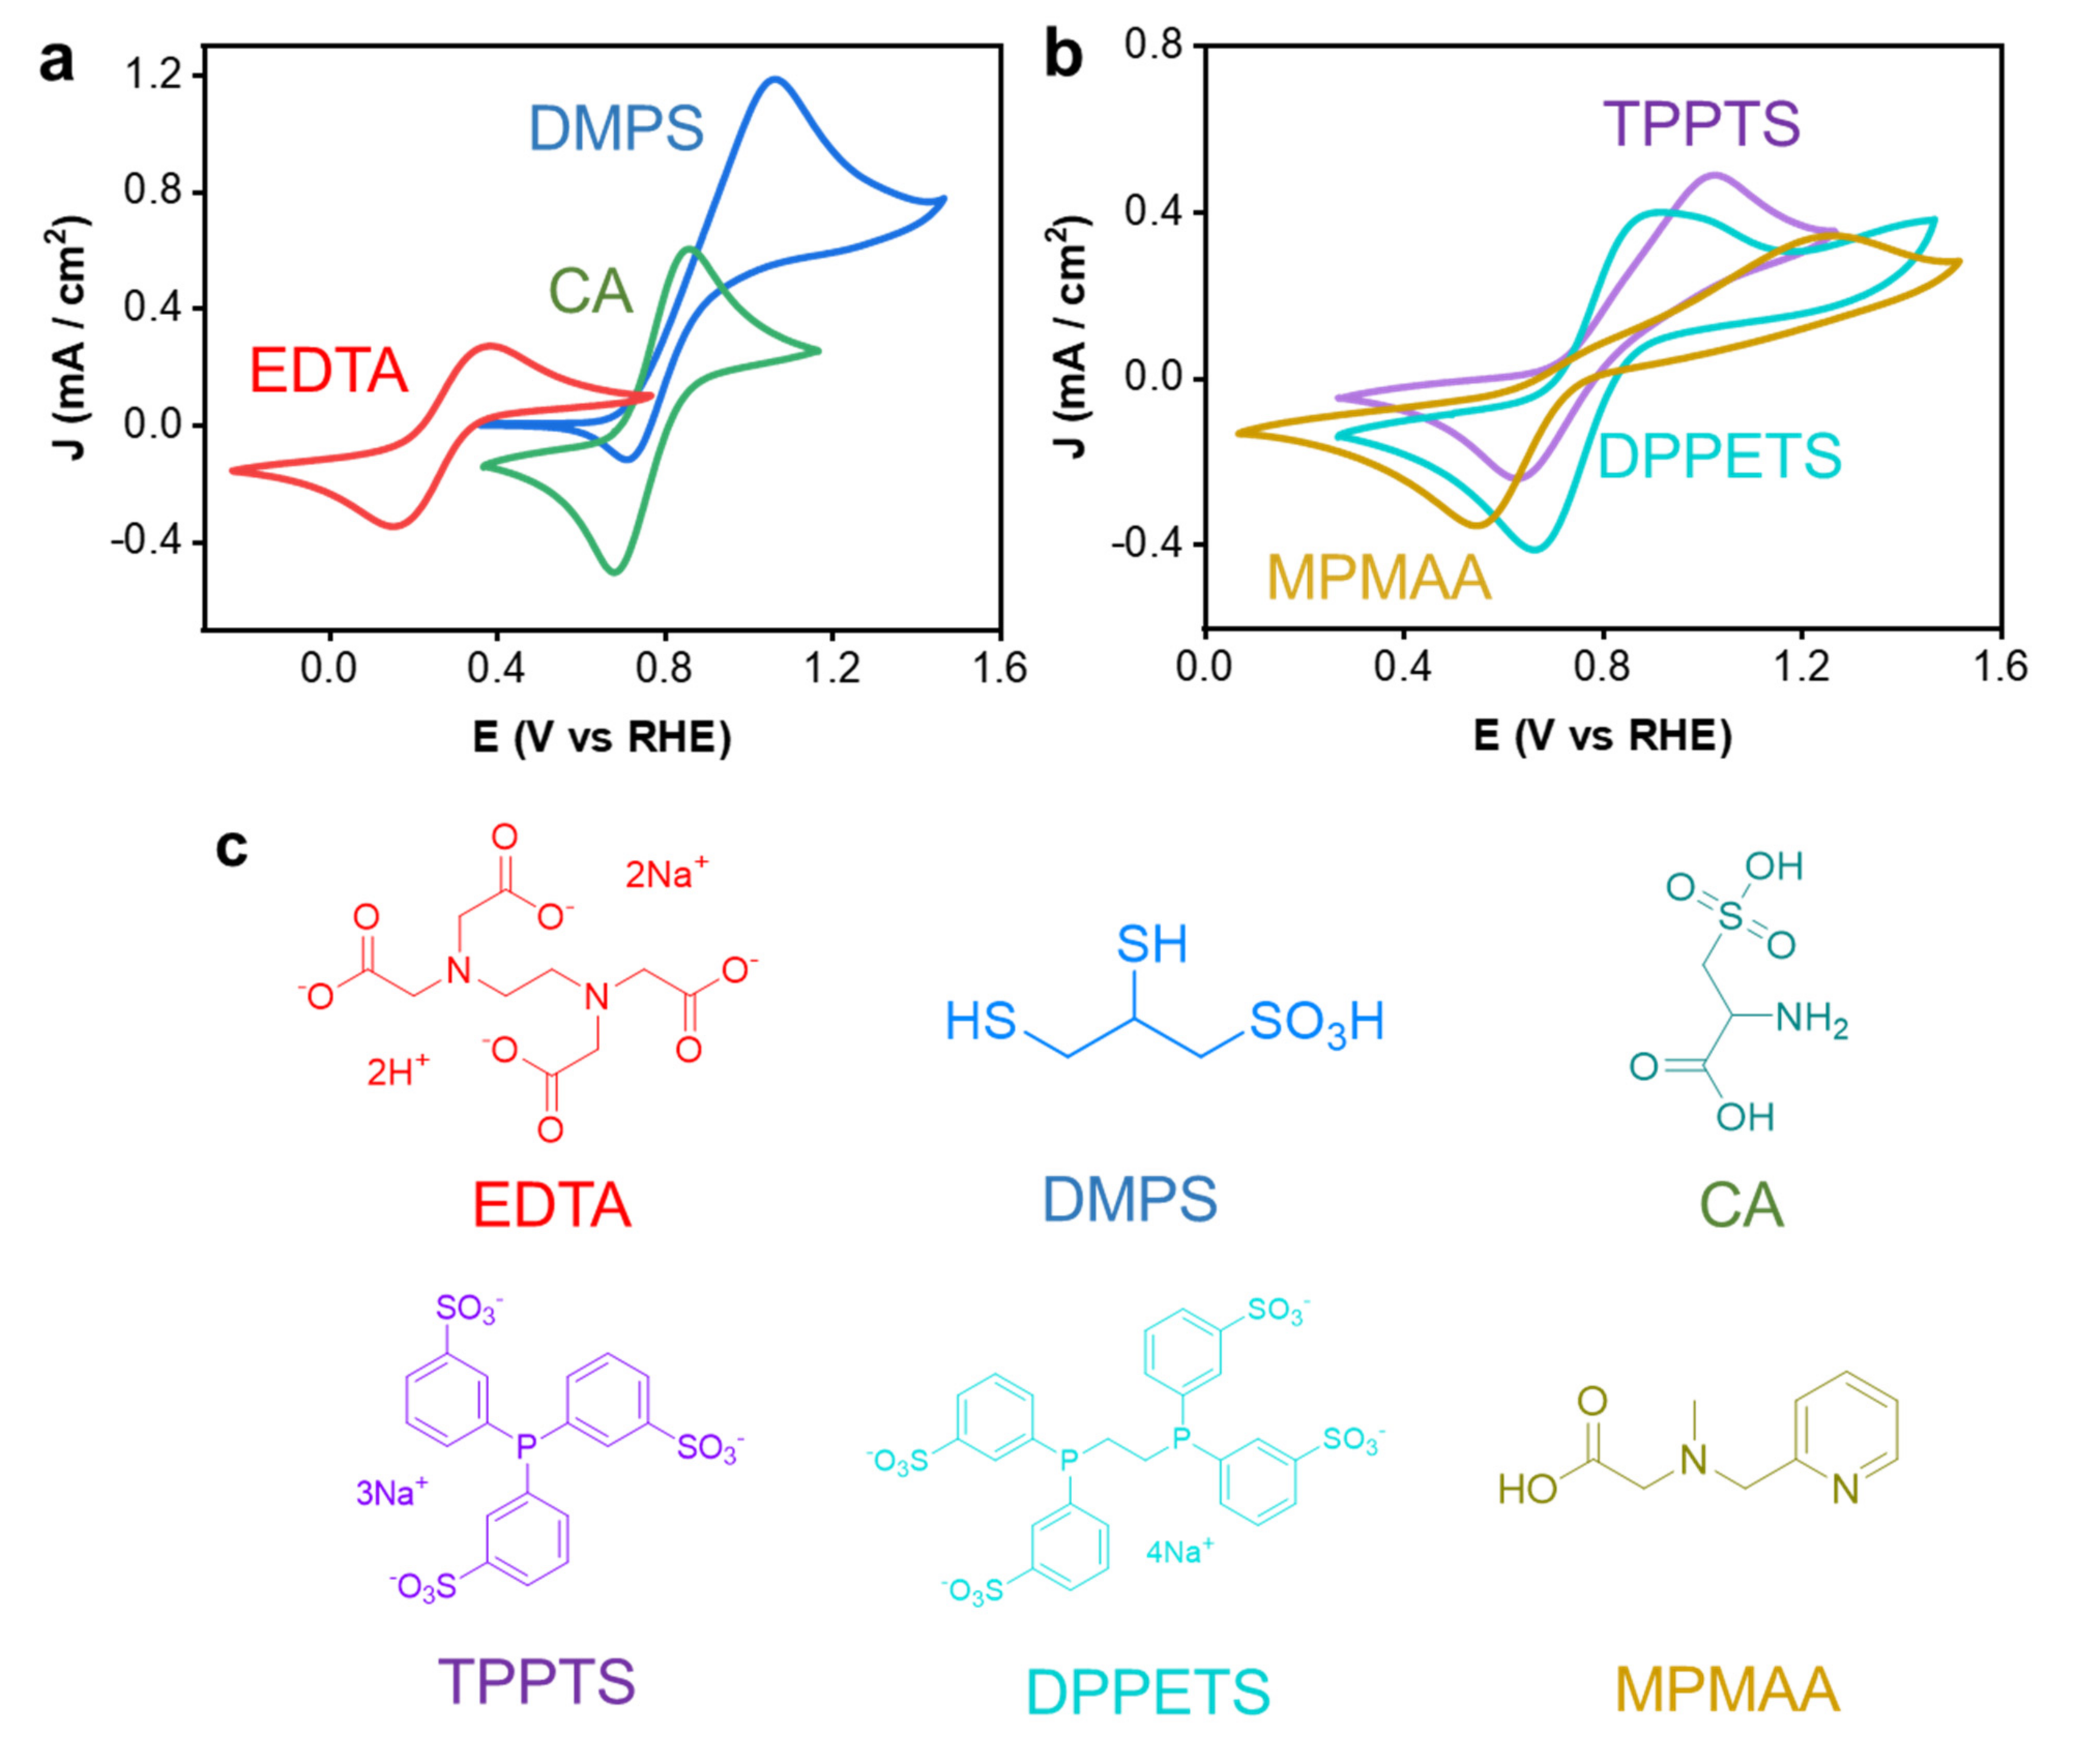
3.2. NO Absorption Capacity and Electrochemical Redox Property of Diverse Fe-Complexes

As the Fe2+-EDTA complex can be easily oxidized to Fe3+-EDTA in air, we prepared additional Fe complexes with five different ligand chemicals, namely sodium 2,3-dimercaptopropanesulfonate (DMPS), cysteic acid (CA), (methyl-pyridine-2-ylmethyl-amino)-acetic acid (MPMAA), triphenylphosphine-3,3′,3″-trisulfonic acid trisodium (TPPTS), and m-sulfonated 1,2-bis(diphenylphosphino)ethane (DPPETS) to find a replacement for EDTA. These chemicals can stabilize the Fe2+ state under aqueous conditions by forming a complex molecular structure. All the Fe complexes prepared with these chemicals showed excellent resistance to oxidation by air (Table 1). The NO absorption capacity of Fe-complexes can be determined through UV/Vis absorbance measurements as each Fe complex showed a characteristic absorbance wavelength due to NO absorption on the Fe2+ center. All the Fe-complexes, except Fe2+-(TPPTS)2, can absorb an equivalent amount of NO to the ligand chemical combined with Fe2+, which is comparable to the performance of the Fe-EDTA. Although Fe2+-(CA)2 showed the highest NO absorption among all Fe complexes, the precipitation of Fe ions spontaneously proceeded with NO absorption. This indicates that the NO-combined Fe2+-(CA)2 structure is not stable.
The electrochemical redox properties of the Fe complexes were examined with a glassy carbon electrode in a 0.1 M Na2SO4 aqueous solution. The Fe2+-DMPS and -(CA)2 showed a clear redox wave corresponding to the Fe2+/Fe3+ transition without any side reactions at the potential ranges between 0.5 to 1.0 V vs. RHE. This was anodically shifted compared to that of Fe2+-EDTA (Figure 2a). However, Fe2+-(CA)2 was not available because of the Fe precipitation. In addition, the Fe2+-DMPS showed an asymmetrically large oxidation wave for the oxidation reaction of Fe2+ to Fe3+, suggesting that an equilibrium corresponding to the ratio Fe2+:Fe3+ would be difficult to achieve in the continuous redox reaction system because the reactivity for oxidation is substantially higher than that for reduction. Fe2+-MPMAA, -(TPPTS)2, and -(DPPETS)2 showed additional reaction peaks in their redox wave curves as the ligands reacted with the electrode (Figure 2b). Fe2+-MPMAA and -TPPTS have a corresponding reaction peak near the onset of Fe2+ oxidation, and Fe2+-(DPPETS)2 showed a reaction peak after the peak current of the Fe2+ oxidation. Because these side reactions can eventually cause the decomposition of complex molecular structures, MPMAA, TPPTS, and DPPETS are not suitable for a sustainable redox reaction system. These results suggest that Fe-EDTA is the only available option for the proposed sustainable NO removal system.

3.3. Fe-EDTA Conversion Using a Half-Cell Reaction System

The continuous electrochemical Fe-EDTA conversion in a flow-type cell was examined using GC and Ag foam to increase the reactivity by maximizing the surface area without modifying the intrinsic catalytic property; therefore, the conversion time could be reduced. The Fe-EDTA conversion using the half-cell reaction, where the oxidation of Fe2+-EDTA to Fe3+-EDTA and the reduction of Fe3+-EDTA to Fe2+-EDTA were individually conducted without mixing the catholyte and anolyte in the flow cell (Figure 3a), was first conducted for a clear evaluation of the oxidative and reductive conversion performance of each electrode. The GC foam electrode showed a redox wave identical to that of the GC plate electrode (Figure 3b). The peak current density for the oxidation and reduction reaction was increased up to 6 mA cm−2 by using GC foam, which was approximately 20-fold higher than those by GC plate. The GC foam also showed 500 mV lower onset potentials for the oxidation (0.15 V vs. RHE) and reduction reaction (0.40 V vs. RHE) than those exhibited by the GC plate. The linear sweep voltammetry (LSV) curves for Fe3+-EDTA reduction using GC foam in the flow-type cell showed that the reduction reaction started from the cell voltage of −1.50 V and can be conducted without reducing the supporting electrolyte and water until −2.3 V (Figure 3c). The oxidation LSV curve also demonstrated that the Fe2+-EDTA oxidation could be safely conducted up to a cell voltage of 2.0 V without the oxidation of the electrolyte (Figure 3d). Based on these results, the half-cell test using GC foam electrodes was performed by applying a cell voltage of −2.0 V at the GC cathode (working electrode). The cell current density started from at −6 mA cm−1 and rapidly decreased to approximately 0 mA cm−1 in 30 min, which indicates that the reductive conversion of Fe3+-EDTA to Fe2+-EDTA was almost completed in that period (Figure 3e). A charge of 72.7 C was applied during this reaction for an hour. As Fe2+-EDTA has a characteristic absorbance peak at a wavelength of 525 nm, whereas Fe3+-EDTA does not show any absorbance in the range of 450 to 600 nm, the conversion ratio of Fe-EDTA can be evaluated by UV/Vis absorbance measurements. By comparing the intensity of the absorbance peak at 525 nm between the catholyte and the reference Fe2+ and Fe3+ peaks obtained from the as-prepared 100% Fe2+-EDTA and Fe3+-EDTA solutions, we confirmed that 90% of the Fe3+-EDTA in the catholyte was successfully converted into the Fe2+-EDTA (Figure 3f). A comparison of the characteristic absorbance peak of the anolyte with the reference peaks demonstrated that 95% of Fe2+-EDTA of 95% was oxidized to Fe3+-EDTA during the conversion reaction. Considering that the theoretical charge amount for the full conversion of Fe2+-EDTA to Fe3+-EDTA is 77 C, the Faraday efficiency of this half-cell reaction using GC foam cathode and anode was 95.3% for reductive conversion and 101.2% for the oxidative conversion of Fe-EDTA (the reason for the Faraday efficiency being higher than 100% is explained in the next paragraph).
Furthermore, the half-cell reaction was performed using an Ag foam electrode as a cathode because Ag is the only element that can be limited to the Fe-EDTA reduction reaction without any issues. The Ag cathode showed a 300 mV lower onset potential and 1 mA cm−1 lower current density at −2.0 V for the Fe3+-EDTA reduction compared to those of the GC cathode (Figure 3g). Although the LSV curve of the Ag cathode was slightly bumpy, no side reactions that could cause the degradation of the Fe-EDTA solution or Ag stability were observed. The LSV curve of Fe2+-EDTA oxidation using the GC anode in the Ag cathode-GC anode system also showed an almost identical shape to that of the GC anode in the GC cathode–anode system (Figure 3f). The constant potential half-cell reaction was performed by applying a cell potential of −1.5 V to the Ag cathode because the GC anode showed a 500 mV lower onset potential for the electrolyte oxidation (dotted line in Figure 3h) compared to that given by the LSV curve of the GC anode in the GC cathode–anode system. Thus, the starting current density was approximately −2.0 mA cm−1, which was −4.0 mA cm−1 lower than that of the GC cathode in the GC cathode–anode system. The current density was gradually decreased to −0.3 mA cm−1 for an hour, and the charge of 50.6 C was passed during this reaction. The conversion ratio determined by the UV/Vis measurement was 74% for the reduction of Fe3+-EDTA to Fe2+-EDTA and 92% for the oxidation of Fe2+-EDTA to Fe3+-EDTA (Figure 3j). The lower reduction conversion rate (74%) compared to that of GC cathode–anode system (90%) is possibly due to the low current density because the feasible applied potential was limited to less than −1.5 V. In addition, the electrochemical active surface area (ESCA) analysis demonstrated that the Ag foam had approximately 7-fold higher ESCA compared to that of the GC foam (Figure S1), which indicates that the GC has a higher intrinsic electrochemical catalytic reactivity for the Fe3+-EDTA to Fe2+-EDTA reduction than the Ag foam. We also note that the 18% difference between the reduction, oxidation, and conversion rates in this Ag cathode-GC anode system implies that the Fe3+-EDTA to Fe2+-EDTA conversion is more difficult than Fe2+-EDTA to Fe3+-EDTA conversion and/or Fe2+-EDTA can be spontaneously converted to Fe3+-EDTA without applying any electrochemical energy input. This feature was also observed in the GC cathode-GC anode system; the oxidative conversion ratio was 5% higher than the reductive conversion ratio, which resulted in a Faraday efficiency higher than 100% for the oxidative conversion.

3.4. NO Absorption and Emission Using Fe-EDTA Solution in a Full-Cell System

The Fe-EDTA conversion in the full-cell system performed by mixing the catholyte and anolyte was conducted using the GC-GC and Ag-GC electrode configurations (Figure 4a). Full-cell Fe-EDTA conversion without NO absorption and release was first performed to determine whether the equilibrium between Fe2+-EDTA and Fe3+-EDTA concentrations can be consistently maintained with the given electrode configuration and potential. Changes in the Fe2+-EDTA ratio in the reservoirs were monitored every 2 h for 10 h. The J-t curve of constant potential conversion with the GC cathode (as the working electrode)-GC anode system under −2.0 V showed the gradual decrease of the current density to approximately −1.1 mA cm−1 (Figure 4b). Furthermore, the Fe2+-EDTA ratio was gradually increased from 50% to 80% during the reaction. We assume that this continuous increase in the Fe2+-EDTA concentration is possibly because the GC electrode has a higher reactivity for the reduction reaction than the oxidation (Figure 3c,d); therefore, the equilibrium state would be difficult to sustain for a long period. The full-cell Fe-EDTA conversion using the Ag cathode (as the working electrode)-GC anode system was also performed by applying a cell potential of −1.5 V for 12 h. Although the starting current density was lower than that of the GC cathode–anode system, a steady current density of approximately −0.4 mA cm−1 was continuously maintained for 8 h. Moreover, the initial Fe2+-EDTA concentration of 50% was successfully maintained until the end of the reaction. These results demonstrate that Ag cathode-GC anode is a better combination for achieving a sustainable Fe-EDTA redox system because the reactivity between the reduction by Ag and oxidation by GC can be matched to an equivalent level in the given reaction system. The stability of electrodes was examined using SEM and XRD measurement. The microporous morphology of GC foam was fully maintained after the full-cell reaction, and the smooth surface of frame was not changed (Figure S2a,b). The Ag foam also showed identical microporous morphology before and after the reaction (Figure S2c,d); however, the smooth semicircular surface was slightly changed with the creation of small particles on the surface. Considering that the elemental ratio of oxygen on the Ag foam was increased after the full-cell reaction (Table S1), this morphological change in Ag surface is possibly due to the creation of silver hydroxides or oxides during the reaction. Nevertheless, the surface morphology change does not indicate that the Ag cathode is unstable in the given reaction conditions because the reduction reactivity of Ag cathode was stably maintained during the reaction (Figure 4c). Furthermore, the strong crystallinity of Ag foam was identically maintained before and after reaction (Figure S3a).
The NO removal performance was examined using a full-cell reaction system with Ag cathode-GC anode in a NO-saturated 30 mM Fe2+-EDTA solution (Fe2+-EDTA-NO). An identical applied potential of −1.5 V was applied to the Ag cathode for 24 h. The J-t curve slightly fluctuated between −2.5 to −1.5 mA cm−1 for the first 8 h and a steady current of approximately −1.8 mA cm−1 was stably generated for the last 16 h (Figure 4d). The NO emitted by the oxidation of Fe2+-EDTA-NO was captured in the gas sampling bag connected to the anolyte reservoir. The amount of NO was 2.28 mM, which was 7.6% of that absorbed onto the 30 mM Fe2+-EDTA. We discovered that a large amount of the absorbed NO was directly converted to NH4+ by the reduction of the Ag cathode. This is possibly because the reaction kinetics of NO reduction to NH4+ by the Ag cathode is much faster than that of the oxidation to emit NO by the GC anode. This results in a significant difference between the amount of emitted NO and produced NH4+. We note that since the NO absorption to Fe2+-EDTA is a thermodynamic reaction, and not an electrochemical reaction, the NO absorption reservoir can be operated separately from the electrochemical cell. This method would be advantageous to improve the energy efficiency of the electrochemical cell because if the NO absorption speed to the Fe2+-EDTA solution is not fast enough to instantaneously spread throughout the solution in the anodic compartment, the Fe2+-EDTA oxidation and the Fe3+-EDTA reduction reactions will be conducted without involving the NO capture and release.

4. Conclusions

In conclusion, we proposed and demonstrated a sustainable electrochemical NO removal system using a reversible Fe2+/Fe3+-EDTA redox reaction under aqueous conditions. We designed a flow-type reaction system in which the NO absorption and emission can be separately conducted in the individual reservoirs of the catholyte and anolyte with the continuous regeneration of the Fe2+-EDTA by the electrochemical reduction of Fe3+-EDTA. We discovered that although the reduction reactivity of Ag was lower than that of GC, the Ag cathode-GC anode electrode configuration stabilized the Fe2+- and Fe3+-EDTA ratio to 1:1 for a long period. NO was successfully captured by the Fe2+-EDTA solution by creating Fe2+-EDTA-NO in the liquid phase, and 7.6% of the adsorbed NO was emitted by the oxidation reaction of Fe2+-EDTA-NO in the flow-type reaction system. The low efficiency of NO emission is possibly due to the reaction kinetics of NO reduction to NH4+ by the Ag cathode, which is much faster than oxidation to emit NO by the GC anode. This imbalance between the anodic and cathodic reactions must be overcome for practical use. However, the proposed concept is innovative because the gas removal process can be conducted semi-permanently without the addition of any consumable compounds or harmful side reactions at ambient temperature and pressure, enabling energy-efficient and environmentally friendly NO capture and storage. Therefore, we expect that this gas treatment system using electrochemical metal-complex redox reactions will be applicable to diverse pollutant-gas treatments.

Supplementary Materials

The following are available online at https://www.mdpi.com/article/10.3390/catal12010079/s1, ESCA, SEM, EDS, and XRD analysis of Ag and GC foam electrodes are in the Supplementary Materials. Figure S1, Electrochemical active surface area (ECSA) analysis foam electrodes, Figure S2, SEM images of GC and Ag foam electrodes before and after reaction of full-cell system, Figure S3, XRD patterns of (a) Ag and (b) GC foam electrodes before and after reaction of full-cell, Table S1, Elemental analysis of GC and AG foam electrode before and after reaction of full-cell.

Author Contributions

Conceptualization, D.K.L. and H.L.; methodology, D.K.L., H.E., H.L., S.C., J.K., S.-J.H. and M.C.; validation, D.K.L., H.E., H.L., S.C., J.K., S.-J.H., M.C. and H.-S.L.; investigation, D.K.L., H.E., H.L., S.-J.H. and J.K.; data curation, D.K.L., H.E. and S.C.; writing—original draft preparation, D.K.L. and H.E.; writing—review and editing, D.K.L. and H.E.; visualization, D.K.L. and H.E.; supervision, D.K.L. and H.L.; project administration, H.L.; funding acquisition, D.K.L. and H.L. All authors have read and agreed to the published version of the manuscript.

Funding

This work was funded by the Korea Institute of Science and Technology (KIST) institutional programs, grant number 2E31360 and 2E31241.

Conflicts of Interest

The authors declare no competing financial interest.

References

  1. Sun, Y.; Zwolińska, E.; Chmielewski, A.G. Abatement technologies for high concentrations of NOx and SO2 removal from exhaust gases: A review. Crit. Rev. Environ. Sci. Technol. 2015, 46, 119–142. [Google Scholar] [CrossRef]
  2. Long, X.-L.; Xin, Z.-L.; Chen, M.-B.; Li, W.; Xiao, W.-D.; Yuan, W.-K. Kinetics for the simultaneous removal of NO and SO2 with cobalt ethylenediamine solution. Sep. Purif. Technol. 2008, 58, 328–334. [Google Scholar] [CrossRef]
  3. Chock, D.P.; Dunker, A.M.; Kumar, S.; Sloane, C.S. Effect of nitrogen oxides (NOx) emission rates on smog formation in the California South Coast Air Basin. Environ. Sci. Technol. 1981, 15, 933–939. [Google Scholar] [CrossRef] [PubMed]
  4. Solomon, S.; Portmann, R.W.; Garcia, R.R.; Thomason, L.W.; Poole, L.R.; McCormick, M.P. The role of aerosol variations in anthropogenic ozone depletion at northern midlatitudes. J. Geophys. Res. Atmos. 1996, 101, 6713–6727. [Google Scholar] [CrossRef]
  5. Su, I.H.; Wu, J.C.S. Photo selective catalytic reduction of nitric oxide with propane at room temperature. Catal. Commun. 2009, 10, 1534–1537. [Google Scholar] [CrossRef]
  6. Zeng, Z.; Lu, P.; Li, C.; Mai, L.; Li, Z.; Zhang, Y. Removal of NO by carbonaceous materials at room temperature: A review. Catal. Sci. Technol. 2012, 2, 2188–2199. [Google Scholar] [CrossRef]
  7. Guo, L.; Shu, Y.; Gao, J. Present and Future Development of Flue Gas Control Technology of DeNO_X in the World. Energy Procedia 2012, 17, 397–403. [Google Scholar] [CrossRef] [Green Version]
  8. Bae, S.W.; Roh, S.A.; Kim, S.D. NO removal by reducing agents and additives in the selective non-catalytic reduction (SNCR) process. Chemosphere 2006, 65, 170–175. [Google Scholar] [CrossRef]
  9. Yang, S.; Fu, Y.; Liao, Y.; Xiong, S.; Qu, Z.; Yan, N.; Li, J. Competition of selective catalytic reduction and non selective catalytic reduction over MnOx/TiO2 for NO removal: The relationship between gaseous NO concentration and N2O selectivity. Catal. Sci. Technol. 2014, 4, 224–232. [Google Scholar] [CrossRef]
  10. Choi, S.-W.; Choi, S.-K.; Bae, H.-K. Hybrid selective noncatalytic reduction (SNCR)/selective catalytic reduction (SCR) for NOx removal using low-temperature SCR with Mn-V2O5/TiO2 catalyst. J. Air Waste Manag. Assoc. 2015, 65, 485–491. [Google Scholar] [CrossRef]
  11. Pham, E.K.; Chang, S.-G. Removal of NO from flue gases by absorption to an iron(ii) thiochelate complex and subsequent reduction to ammonia. Nature 1994, 369, 139–141. [Google Scholar] [CrossRef]
  12. Juzeliúnas, E.; Jüttner, K. Electrochemical Study of NO Conversion from Fe(II)-EDTA-NO Complex on Pt Electrodes. J. Electrochem. Soc. 1998, 145, 53–58. [Google Scholar] [CrossRef]
  13. Demmink, J.F.; van Gils, I.C.F.; Beenackers, A.A.C.M. Absorption of Nitric Oxide into Aqueous Solutions of Ferrous Chelates Accompanied by Instantaneous Reaction. Ind. Eng. Chem. Res. 1997, 36, 4914–4927. [Google Scholar] [CrossRef]
  14. Mendelsohn, M.H.; Harkness, J.B.L. Enhanced flue-gas denitrification using ferrous.cntdot.EDTA and a polyphenolic compound in an aqueous scrubber system. Energy Fuels 1991, 5, 244–248. [Google Scholar] [CrossRef]
  15. Gambardella, F.; Sanchez, L.; Ganzeveld, K.; Winkelman, J.; Heeres, H. Reactive NO absorption in aqueous FeII(EDTA) solutions in the presence of denitrifying micro-organisms. Chem. Eng. J. 2006, 116, 67–75. [Google Scholar] [CrossRef] [Green Version]
  16. Jin, Y.; Veiga, M.a.C.; Kennes, C. Bioprocesses for the removal of nitrogen oxides from polluted air. J. Chem. Technol. Biotechnol. 2005, 80, 483–494. [Google Scholar] [CrossRef]
  17. Xia, Y.; Zhao, J.; Li, M.; Zhang, S.; Li, S.; Li, W. Bioelectrochemical Reduction of Fe(II)EDTA–NO in a Biofilm Electrode Reactor: Performance, Mechanism, and Kinetics. Environ. Sci. Technol. 2016, 50, 3846–3851. [Google Scholar] [CrossRef]
  18. Kim, D.-Y.; Han, J.-I. An innovative dual fuel cell to capture and collect pure NO X from flue gases. J. Appl. Electrochem. 2013, 43, 1011–1016. [Google Scholar] [CrossRef]
  19. Garedew, M.; Lin, F.; Song, B.; DeWinter, T.M.; Jackson, J.E.; Saffron, C.M.; Lam, C.H.; Anastas, P.T. Greener Routes to Biomass Waste Valorization: Lignin Transformation Through Electrocatalysis for Renewable Chemicals and Fuels Production. ChemSusChem 2020, 13, 4214–4237. [Google Scholar] [CrossRef]
  20. Seh, Z.W.; Kibsgaard, J.; Dickens, C.F.; Chorkendorff, I.; Nørskov, J.K.; Jaramillo, T.F. Combining theory and experiment in electrocatalysis: Insights into materials design. Science 2017, 355, eaad4998. [Google Scholar] [CrossRef] [Green Version]
  21. Zhu, K.; Zhu, H.; Feng, S.; Fu, J.; Guo, D.; Sun, Q.; Huang, L.; Hao, X. Electrochemical degradation of chemical wastewater by anodic oxidation process. IOP Conf. Ser. Earth Environ. Sci. 2019, 371, 032018. [Google Scholar] [CrossRef] [Green Version]
  22. Cai, J.; Zhou, M.; Pan, Y.; Du, X.; Lu, X. Extremely efficient electrochemical degradation of organic pollutants with co-generation of hydroxyl and sulfate radicals on Blue-TiO2 nanotubes anode. Appl. Catal. B Environ. 2019, 257, 117902. [Google Scholar] [CrossRef]
  23. Zhang, M.; Shi, Q.; Song, X.; Wang, H.; Bian, Z. Recent electrochemical methods in electrochemical degradation of halogenated organics: A review. Environ. Sci. Pollut. Res. 2019, 26, 10457–10486. [Google Scholar] [CrossRef]
  24. Lee, D.K.; Choi, K.-S. Enhancing long-term photostability of BiVO4 photoanodes for solar water splitting by tuning electrolyte composition. Nature Energy 2018, 3, 53–60. [Google Scholar] [CrossRef]
  25. Dinh, C.-T.; Burdyny, T.; Kibria, M.G.; Seifitokaldani, A.; Gabardo, C.M.; Arquer, F.P.G.d.; Kiani, A.; Edwards, J.P.; Luna, P.D.; Bushuyev, O.S.; et al. CO2 electroreduction to ethylene via hydroxide-mediated copper catalysis at an abrupt interface. Science 2018, 360, 783–787. [Google Scholar] [CrossRef] [Green Version]
  26. Verma, S.; Lu, S.; Kenis, P.J.A. Co-electrolysis of CO2 and glycerol as a pathway to carbon chemicals with improved technoeconomics due to low electricity consumption. Nature Energy 2019, 4, 466–474. [Google Scholar] [CrossRef]
  27. Allcorn, E.; Nagasubramanian, G.; Pratt, H.D.; Spoerke, E.; Ingersoll, D. Elimination of active species crossover in a room temperature, neutral pH, aqueous flow battery using a ceramic NaSICON membrane. J. Power Sources 2018, 378, 353–361. [Google Scholar] [CrossRef]
  28. Guo, Q.; Sun, T.; Wang, Y.; He, Y.; Jia, J. Spray absorption and electrochemical reduction of nitrogen oxides from flue gas. Environ. Sci Technol. 2013, 47, 9514–9522. [Google Scholar] [CrossRef]
  29. Shimizu, K.; Hutcheson, R.; Engelmann, M.D.; Francis Cheng, I. Cyclic voltammetric and aqueous equilibria model study of the pH dependant iron(II/III)ethylenediamminetetraacetate complex reduction potential. J. Electroanal. Chem. 2007, 603, 44–50. [Google Scholar] [CrossRef]
Scheme 1. (a) Schematic description of sustainable electrochemical NO capture and storage system based on the reversible Fe2+/Fe3+-EDTA redox reaction. (b) Reversible NO absorption and emission by using Fe2+/Fe3+-EDTA redox cycle.
Catalysts 12 00079 sch001
Figure 1. Electrochemical redox property of 10 mM Fe2+-EDTA complex in a 0.1 M Na2SO4 aqueous solution (pH 2.7). The cyclic voltammetry curves were obtained with (a) glassy carbon plate, (b) Ni and Ti foil, (c) Fe, Ag, and Cu foil, and (d) Pt and W foil electrodes with a scan rate of 10 mV s−1. The dotted line in (a) is the CV curve of Na2SO4 solution by using glassy carbon plate before mixing Fe2+-EDTA. The inset of (a) is the CV curve of Fe2+-EDTA solution with the glassy carbon plate for 200 cycles.
Catalysts 12 00079 g001
Figure 2. CV curves of 10 mM Fe-complex examined with glassy carbon plate in a 0.1 M Na2SO4 aqueous solution with a scan rate of 10 mV s−1. (a) Fe2+-EDTA, Fe2+-(DMPS)2, Fe2+-(CA)2, and (b) Fe2+MPMAA, Fe2+-(TPPTS)2, and Fe2+-(DPPETS)2. (c) Molecule structure of ligand chemicals.
Catalysts 12 00079 g002
Figure 3. (a) schematic description of half-cell system to examine the electrochemical Fe-EDTA conversion. (b) CV curves of glassy carbon (GC) and Ag foam electrodes in 10 mM Fe2+-EDTA dissolved 0.1 M Na2SO4 aqueous solution (pH 2.7) with a scan rate of 10 mV s−1. The linear sweep voltammetry (LSV) curves of (c) 10 mM Fe3+-EDTA reduction and (d) 10 mM Fe2+-EDTA oxidation using GC foam cathode and anodes in the half-cell system. (e) J-t and C-t curves of the constant potential half-cell reduction reaction at −2.0 V using GC foam as a working electrode in the half-cell system. (f) UV/Vis absorption spectra to determine of Fe2+ and Fe3+ ratio in the electrolyte after the constant potential half-cell reaction (solid lines). The dotted lines represent reference UV/Vis spectra corresponding to 100% of Fe2+ and Fe3+ ratio. The linear sweep voltammetry (LSV) curves of (g) 10 mM Fe3+-EDTA reduction using Ag foam cathode and (h) 10 mM Fe2+-EDTA oxidation using GC foam anode in the half-cell system. (i) J-t and C-t curves of the constant potential half-cell reduction reaction at −1.5 V using Ag foam as a working electrode in the half-cell system. (j) UV/Vis absorption spectra of electrolyte after the constant potential half-cell reaction. All the LSV curves were obtained with a scan rate of 10 mV s−1. The flow rate of electrolyte circulation was 4 mL min−1.
Catalysts 12 00079 g003
Figure 4. (a) Schematic description of full-cell system to examine sustainable NO removal property using electrochemical Fe2+/3+-EDTA redox reaction. J-t and Fe2+ ratio–time curves of the constant potential full-cell reaction using (b) GC cathode and anode at −2.0 V and (c) Ag cathode and GC anode at −1.5 V in a 10 mM Fe2+-EDTA dissolved 0.1 M Na2SO4 aqueous solution (pH 2.7). The flow rate of the electrolyte circulation was 4 mL min−1. (d) J-t curve of the constant potential full-cell reaction with the NO absorbed 30 mM Fe2+-EDTA (Fe2+-EDTA-NO) dissolved 0.1 M Na2SO4 solution (pH 2.5) at −1.5 V vs. RHE for 24 h. (e) The amount of NO emission and NH4+ production from the 30 mM NO by the full cell reaction.
Catalysts 12 00079 g004
Table 1. NO absorption capacity of Fe-complexes and their oxidation resistance to air.
Fe-ComplexesNO Absorption Capacity (Equivalent)Remained Fe2+ Ratio after Exposed in Air for 24 h (%)Note
Fe2+-EDTA10Poor oxidation resistance
Fe2+-(DMPS)2297Asymmetric reactivity between oxidation and reduction reaction
Fe2+-(CA)2>296Fe precipitation after NO absorption
Fe2+-MPMAA297Poor electrochemical reactivity, side reactions with electrode
Fe2+-(TPPTS)2098Poor NO absorption, side reactions with electrode
Fe2+-(DPPETS)2297Side reactions with electrode
Publisher’s Note: MDPI stays neutral with regard to jurisdictional claims in published maps and institutional affiliations.

